
 Submit a Paper
 Propose a Special lssue
 Open Access
ARTICLE

The Effect of Pore Solution on the Hysteretic Curve of Expansive Soil under Cyclic Loading
Hubei Provincial Ecological Road Engineering Technology Research Center, Hubei University of Technology, Wuhan, 430068, China
* Corresponding Author: Xinshan Zhuang. Email:
Fluid Dynamics & Materials Processing 2023, 19(7), 1963-1981. https://doi.org/10.32604/fdmp.2023.026348
Received 31 August 2022; Accepted 08 November 2022; Issue published 08 March 2023
 View Full Text
 Download PDF
Abstract
A dynamic triaxial instrument was used to study the effects of different concentrations of sodium chloride and stress amplitudes on the dynamic properties of an expansive soil under cyclic loading. In particular, four parameters were considered in such a parametric investigation, namely, hysteresis curve morphology characteristic non-closure degree εp, the ratio of the short and long axis α, the slope of the long axis k and the enclosed area S. The results show that with an increase in the sodium chloride concentration, the soil particle double electric layer becomes thinner, the distance between soil particles decreases, and the whole sample becomes denser. The εp-N, α-N and S–N relation curves all show a decreasing trend. The ratio of plastic deformation to total deformation grows with increasing the dynamic stress amplitude, and the curves show an upwards trend. The k-N relationship curve displays an increasing trend with the concentration and a general downwards trend as the dynamic stress amplitude is made higher. This also indicates that sodium chloride solutions can improve the engineering properties of expansive soil to a certain extent. With an increase in the vibration times N, the shape of the hysteretic curve becomes narrower, and the whole soil exhibits a cyclic strain hardening. With the help of an exponential function, a model is introduced to predict the relationship between the concentration and the hysteretic curve.Keywords
Expansive soil is a highly plastic clay. Its volume will change significantly with the change in water content, expanding with water absorption and contracting with water loss. Existing research shows that expansive soil is relatively sensitive to the soil pore solution because the number of charged ions in the pore solution is related to the concentration, and the interaction between clay particles and ions is affected by the electrical balance [1,2]. The effect is closely related to the microstructure of the pores in the soil and results in changes in the macrophysical and mechanical properties of the soil. If the effect of the pore solution is ignored, its properties in practical engineering are likely to be misjudged. Therefore, it is significant to study the influence of changes in the pore solution environment on expansive soil.
Li et al. [3] studied the swelling characteristics of expansive soil with distilled water, salt water and acidic water using a consolidation instrument and obtained various indices and expansive deformation rules of the soil in water, salt and acid solutions. Reddy et al. [4] studied the influence of sodium hydroxide and sulfuric acid solutions with different concentrations on the expansibility of expansive soil through a free expansion test and obtained the variation law of the expansion rate in alkaline and acidic environments. Mashifana et al. [5] mixed a paste of phosphogypsum-lime-fly ash-alkaline oxygen slag treated with citric acid into expansive soil and conducted geotechnical performance tests. X-ray Fluorescence Spectrometer (XRF), X-ray diffraction (XRD), scanning electron microscopy (SEM) and other methods were used to study the microstructure of the treated expansive soil. Studds et al. [6] studied the swelling behaviour and water conductivity of bentonite in distilled water and salt solutions of different concentrations and obtained the characteristics of bentonite in dilute and strong solutions and a model that can predict its components and permeability. Chang et al. [7] conducted a no-charge expansion rate test on expansive soil in an acid rain environment to study the deformation characteristics of the expansive soil in this environment and analysed the changes in the microstructure and mineral composition of the expansive soil after the drying and wetting cycle of acid rain by SEM as well as XRD.
According to these studies, the pore solution has a significant impact on expansive soil properties. In cold weather, the expressway sections with expansive soil will be frozen, and we generally adopt the methods of melting snow and ice. The pore solution environment of the expansive soil would inevitably change over the long term. Currently, many experts and scholars have studied the properties of expansive soil using sodium chloride solutions. Yu et al. [8–10] studied the swelling characteristics and strength of expansive soil in different concentrations of sodium chloride solutions. The results indicated that compared with distilled water, sodium chloride solutions can inhibit soil swelling. Liang et al. [11] used a one-dimensional compression test and mercury injection test to study the compression characteristics of expansive soil under different concentrations of sodium chloride solutions and concluded that the initial porosity ratio would change with the change in the sodium chloride solution concentration. Yao et al. [12] studied expansive soil mixed with different concentrations of sodium chloride and calcium chloride solutions by means of a free expansion rate test and direct shear test and found that the concentration of sodium chloride solutions reduced the shear strength of the soil. Lin et al. [13] used mercury injection tests and SEM tests to analyse the influence of the expansive soil microstructure under different concentrations of sodium chloride solutions and reported that micro and small pores decreased when the concentration of sodium chloride solutions increased. Yang et al. [2] studied the influence of salt solution concentration on expansive soil expansive force under different initial dry densities and concluded that the expansive force decreased with increasing salt solution concentration.
Thus, it is particularly important to study the physical, chemical and mechanical properties of expansive soil in sodium chloride solutions. However, at present scholars focus on static characteristics, and there is no report on the dynamic characteristics of expansive soil in sodium chloride solution environments. This study explores the influence of sodium chloride solution concentration and dynamic stress amplitude on the morphological characteristics of the hysteretic curve of expansive soil under dynamic cyclic loading and provides a reference for practical engineering and related research.
The dynamic triaxial apparatus of the British GDS company was used in this test, and the dynamic loading module of the equipment was selected in this study, as shown in Fig. 1. W is the natural moisture content, Wl is the liquid limit, Wp is the plastic limit, Gs is the relative density of soil particles and Fs is the free expansion rate. GDSLSAB software was used to apply axial stress, confining pressure and back pressure to the cylindrical sample with a height of 100 mm and a diameter of 50 mm. The maximum range of the equipment confining pressure was 2 MPa, and the maximum range of the axial force was 10 kN. The measurement system can accurately measure the pore water pressure, axial stress, confining pressure, volumetric strain and other data that change with time. The measurement accuracy of the displacement sensor is 0.0001 mm.
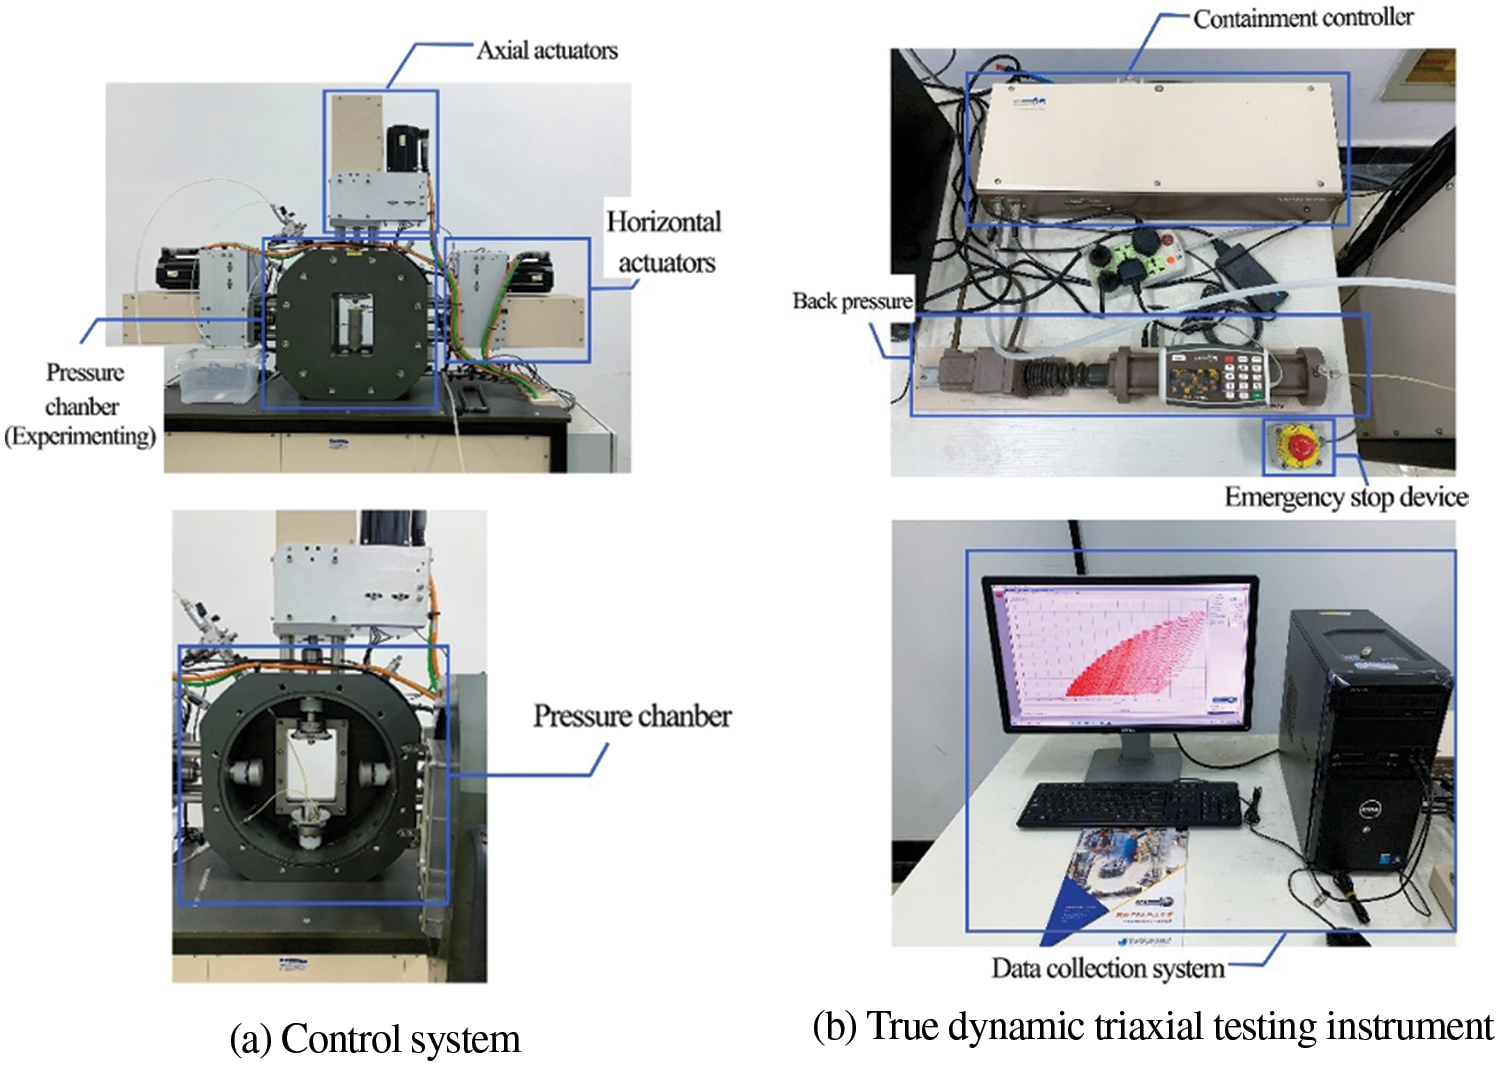
Figure 1: Dynamic triaxial test apparatus
The test soil sample was obtained from an expressway project in Nanyang, Henan Province and was grey yellow. Its physical and mechanical indices are shown in Table 1. According to the free expansion rate of expansive soil, the sample can be classified as weak expansive soil, and its main mineral components are illite and a small amount of kaolinite. Sodium chloride solutions of 0, 0.1, 0.2, 0.3 and 0.6 mol/L were prepared following the standard solution preparation procedure, and the crystal technical conditions met the relevant specifications.
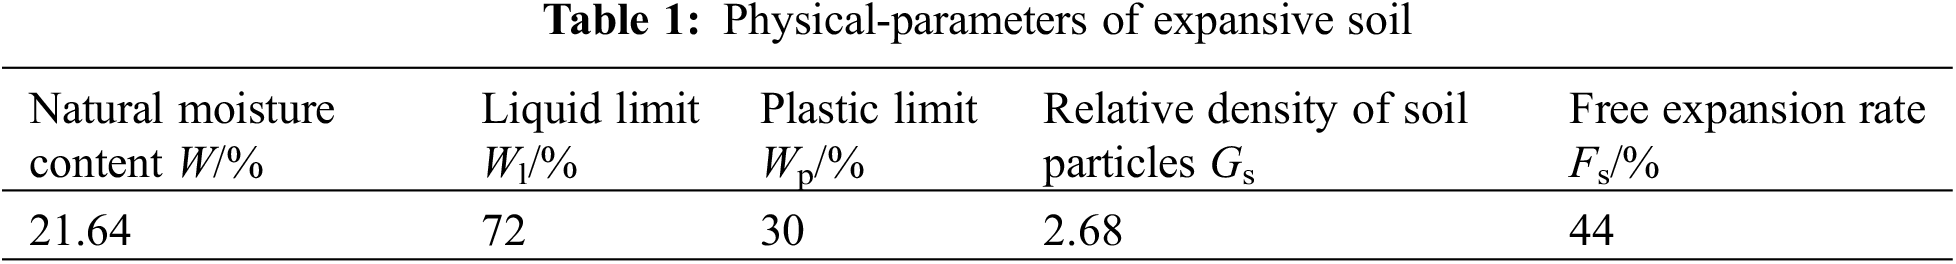
According to the compaction test, the optimal moisture content of the soil sample was 17.3%, and the maximum dry density was 1.7 g/cm³. The soil sample was mixed with sodium chloride solutions and stirred evenly, and a cylindrical sample with a diameter of 50 mm and a height of 100 mm was made according to the mass ratio. The sample preparation process is shown in Fig. 2.
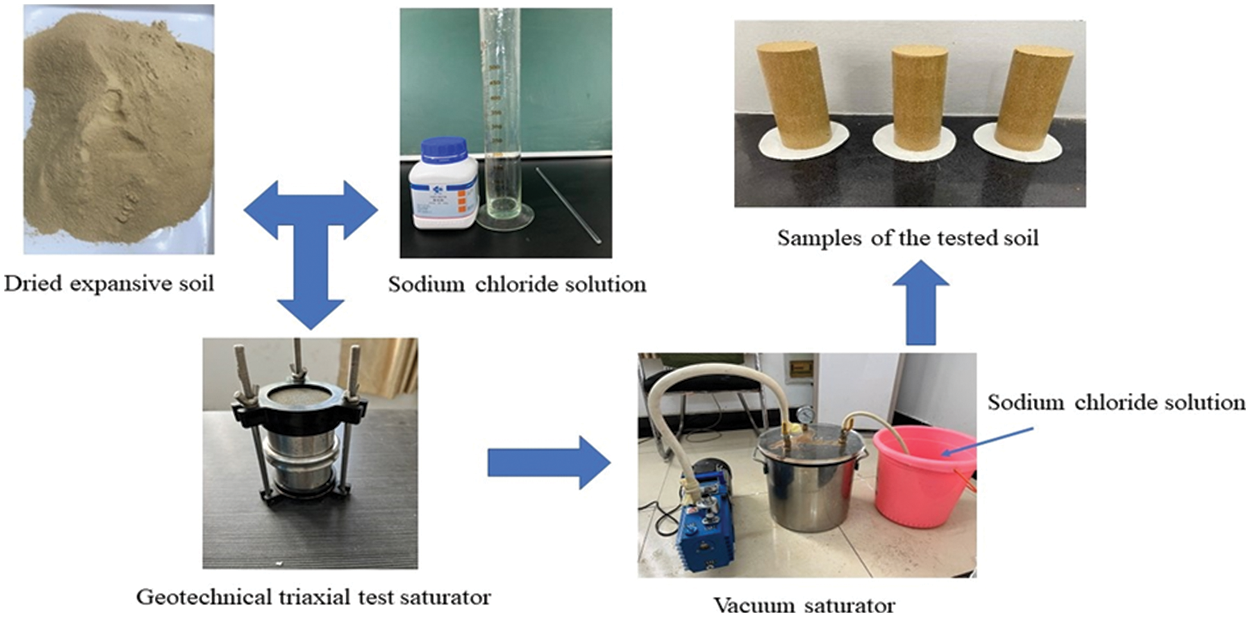
Figure 2: Samples of the tested soil
Before the test, the prepared test specimen is put into the vacuum saturator for pumping and saturation, and the concentration of the saturated solution used in the saturation process is the same as the concentration of sodium chloride solution used in the preparation of the specimen. GDSLSAB software was used to apply initial static stress and confining pressure on the soil samples in a linear loading mode to conduct a consolidated undrained shear test. In the dynamic load part of this test, the haversine wave loading mode with frequency f of 1 Hz is adopted [14], and its function expression is as follows:
where σd is the dynamic stress, σs is the initial static stress, σm is the dynamic stress amplitude, f is the loading frequency, and t is the loading time. Fig. 3 shows the dynamic loading process of the soil. The OB section is the experimental consolidation stage; the OA section is the confining pressure applied before consolidation; and the AB section is the isotropic consolidation stage by setting the corresponding confining pressure value. In the dynamic load phase, a smaller initial axial force σs = 10 kPa needs to be applied first, that is, the initial static stress, to prevent the specimen from decoupling from the applied force rod when the axial force is applied; this is the BC phase. The CD stage is expressed as the amplitude stage of dynamic stress applied to the dynamic load.
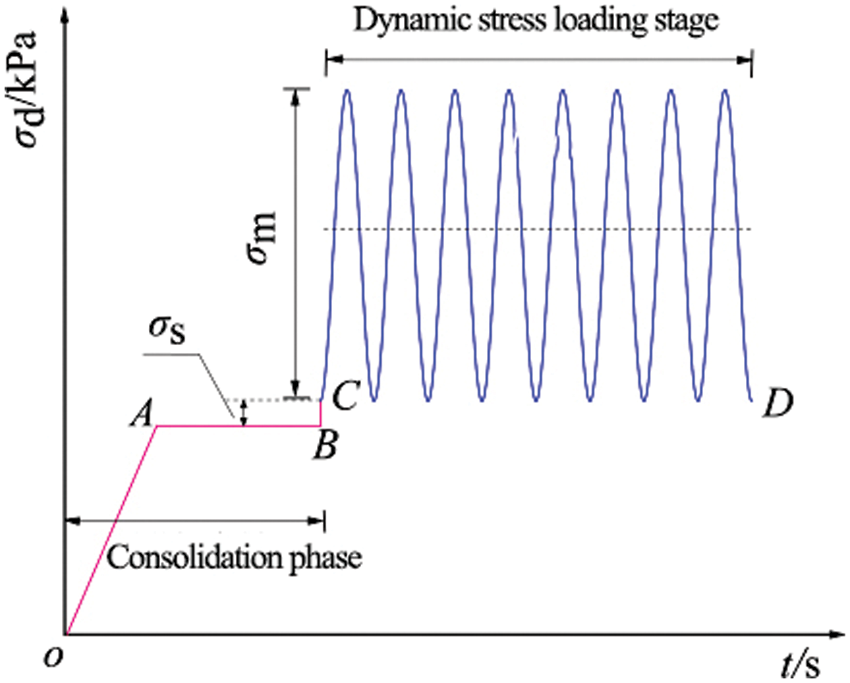
Figure 3: Consolidation phase and dynamic load loading process
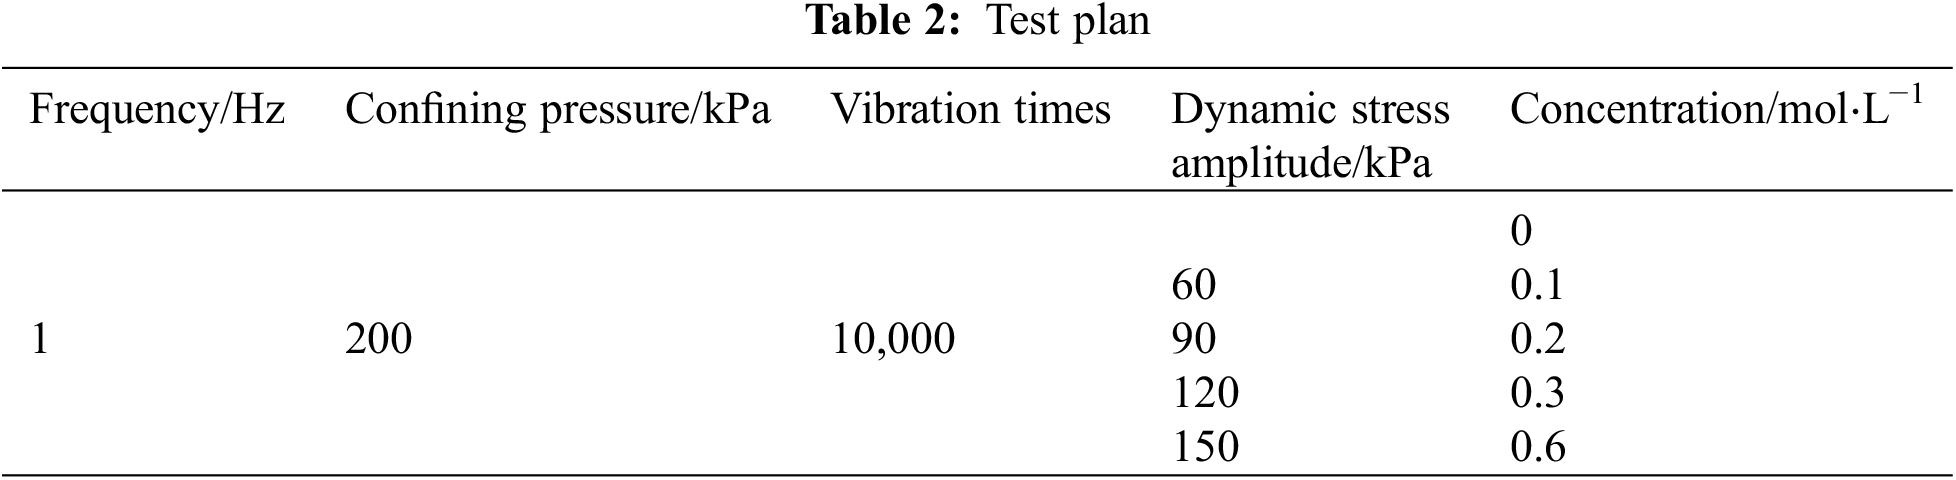
Considering that the subgrade soil under vertical load is divided into the upper static load and dynamic load caused by the traffic, the dynamic loads that can transfer to the soil depth are limited. In this limited soil layer, the vertical static stress caused by the overlying static load is relatively small, and a relatively small initial static stress is applied in the testing and adjusting the stiffness coefficient stage. Therefore, no additional initial static stress is set here, and only the vertical dynamic load is considered. The vertical static stress caused by the overlying static load is small, so only the vertical dynamic load is considered. Based on the existing literature and comprehensive consideration, we selected the dynamic stress amplitude σd in the range of 60∼150 kPa [15,16], the confining pressure σ3 = 200 kPa [17–19], the concentration n is 0, 0.1, 0.2, 0.3, 0.6 mol/L [8,11,12], and the number of vibrations N = 10,000. The test is terminated when the axial strain reaches 5% [8–10,16,20,21], as shown in Table 2.
The shape of the hysteretic curve reflects the dynamic characteristics of the soil, such as plastic deformation, viscosity, elastic properties and energy loss under a cyclic load. The hysteretic curve obtained in this test is shown in Fig. 4, where point A is the starting point of the dynamic load and point D is the end point of the dynamic load. The hysteretic curve is usually unclosed at the early stage of cyclic loading. The distance from point A to point D in the figure indicates the unclosed degree εp of the hysteretic curve, which reflects the degree of plastic deformation of the soil. The larger εp is, the greater the irrecoverable deformation of the soil under cyclic loading and the greater the residual strain and settlement of the soil under dynamic loading. The hysteretic curve of the test soil sample under cyclic loading is similar to an ellipse. Following the method provided by Zhuang et al. [16], the ellipse is fitted and calculated. Point C represents the maximum dynamic stress and strain under cyclic loading, and point B represents the minimum dynamic stress and strain under cyclic loading. Then, line BC is the major axis of the hysteretic curve, line EF is the minor axis of the hysteretic curve, and the ratio of the minor axis to the major axis is α, which reflects the degree of soil viscosity. The angle between the long axis BC and the dynamic strain axis is θ, and its tangent value is the slope k of the hysteresis curve. In general, the area S of the hysteretic curve is calculated according to the elliptic area. However, the shape of the hysteretic curve is not an ideal ellipse under a large dynamic stress amplitude, so it is calculated by polygon integration [22,23].
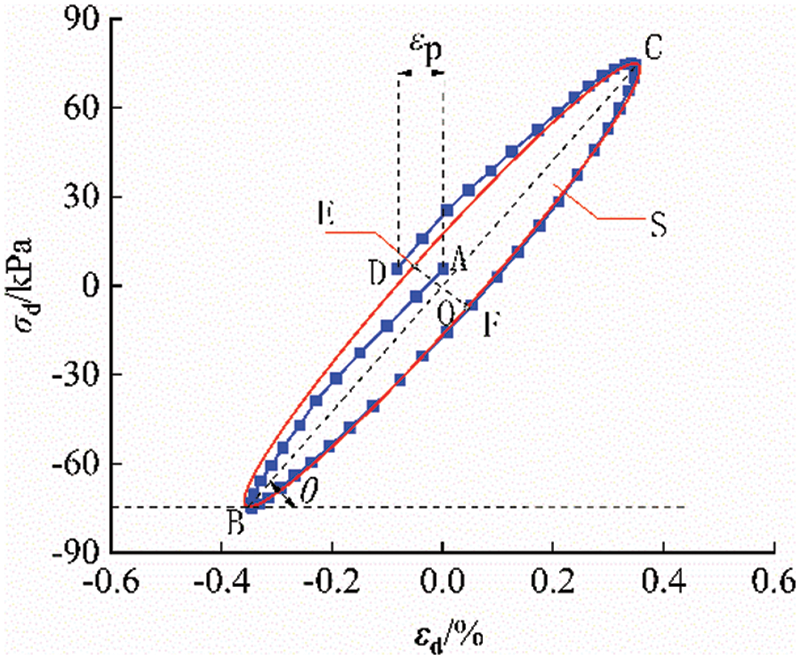
Figure 4: Schematic diagram of the morphological characteristics of the hysteresis curve
3.1 Nonclosure Degree of Hysteretic Curve εp
The degree of nonclosure of hysteretic curve εp reflects the residual strain of soil under cyclic loading, that is, the greater the degree of nonclosure, the greater the plastic deformation, residual strain and settlement generated when the soil is subjected to dynamic cyclic loading, and vice versa [24]. The value of εp can be expressed by the difference in the strain corresponding to the starting point and the ending point of loading in one cycle:
where εs is the starting point of loading in one cycle and εe is the ending point of loading in one cycle.
Under different concentrations and dynamic stress amplitudes, the variation law of the nonclosure degree εp of the hysteretic curve of the test soil sample after cyclic dynamic loading is shown in Figs. 5 and 6.
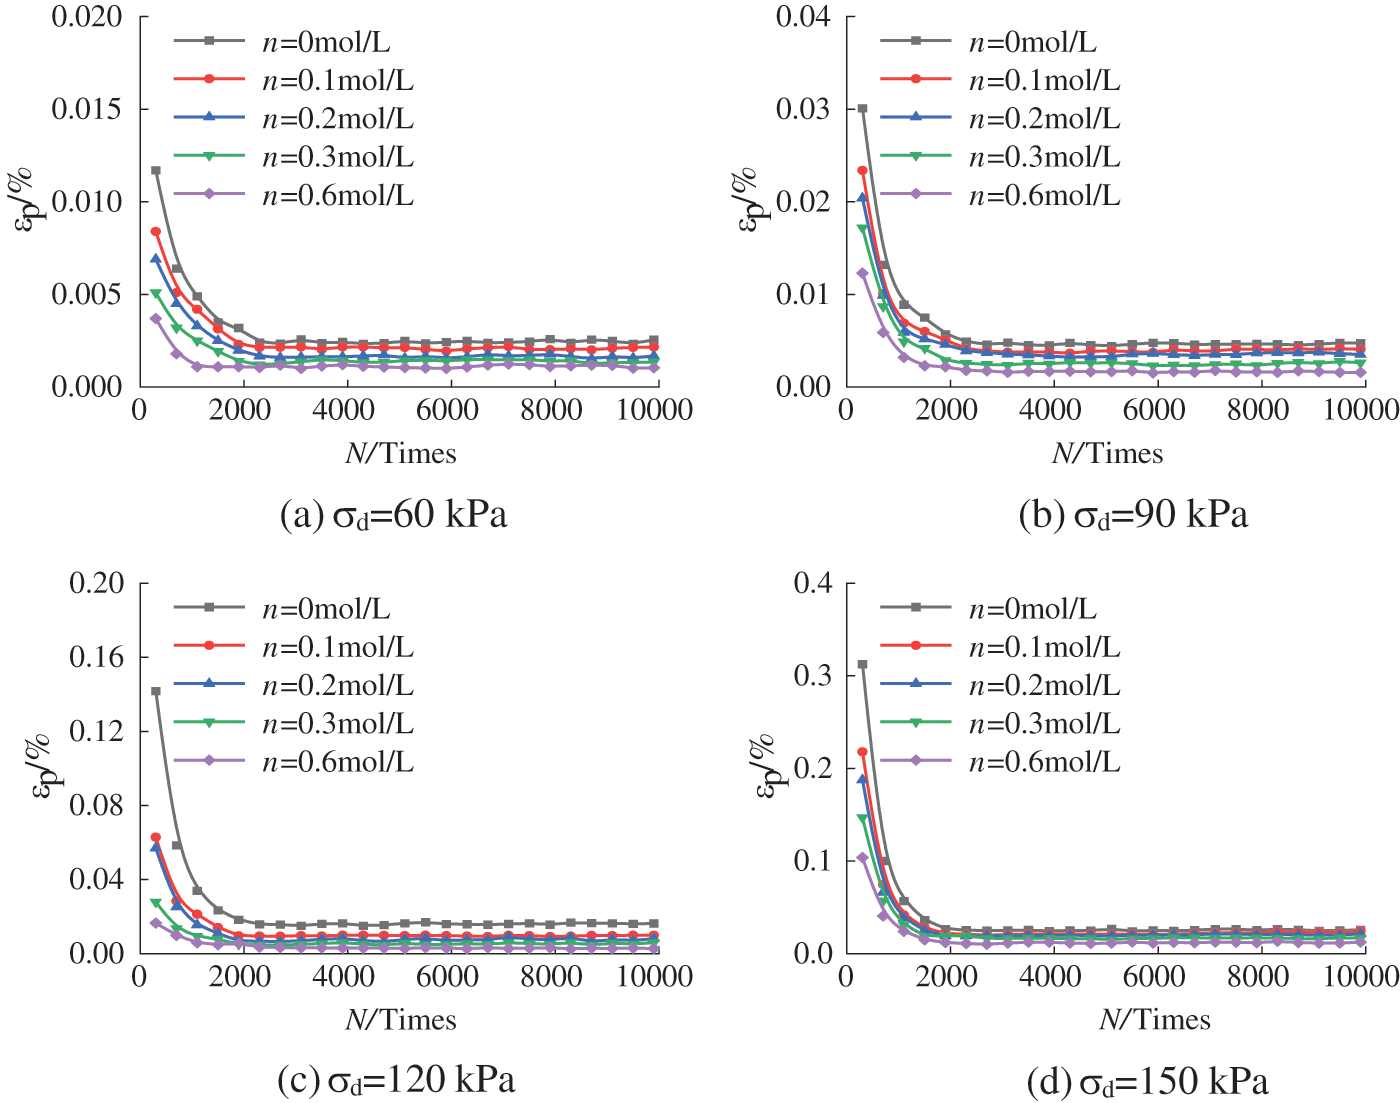
Figure 5: Relationship between the degree of nonocclusion εp and vibration N at different concentrations

Figure 6: The relationship between the degree of nonclosure εp and the vibration frequency N at different amplitudes
As shown in Fig. 5, at the initial stage of cyclic loading, the nonclosure degree of the hysteretic curve decreases sharply. When the number of cycles N reaches 2,000, the nonclosure degree decreases, and εp gradually stabilizes. As the concentration of sodium chloride solutions increased, the relation curve of εp-N showed an obvious downwards trend. The nonclosure degree of the hysteretic curve of the plain soil sample is greater than that of the soil sample mixed with sodium chloride solutions. Yao et al. [12] showed that salt solution concentrations were inversely proportional to the thickness of the double electric layer, as shown in Eq. (3):
where 1/K is the thickness of the double electric layer; ε0 is the dielectric constant; k0 is the Boltzmann constant; T is the absolute temperature; n0 is the ion concentration; e is the electron charge; and v is the number of ions.
Eq. (3) indicates that the increase in concentration can significantly reduce the thickness of the double electric layer of soil particles in expansive soil. Since the free Na+ ions in sodium chloride solutions are positively charged, they tend to be attracted by the negatively charged soil particles, achieving electrical equilibrium to a certain extent, and the polar water molecules adsorbed in the diffusion layer between soil particles are correspondingly reduced [25–28]. The subsequent accumulation of dynamic load is actually a process of compaction of soil, the water molecules between soil particles are extruded, and the spacing between particles is constantly reduced. For the sample mixed with sodium chloride solutions, especially the one with a higher concentration of sodium chloride solutions, the reaction is more obvious. At the microscale level, the distance between soil particles has been reduced, and in the process of subsequent cumulative load application, it naturally shows smaller plastic deformation at the macroscale level.
Fig. 6 shows that the soil hysteresis curve εp changes significantly under different dynamic stress amplitudes under the same concentration. For σd = 60 and 90 kPa, the soil hysteresis curve εp-N decreases sharply at first and then tends to be stable, showing a basically closed state. When it increases from σd = 90 to 120 and 150 kPa, the εp value of the soil hysteretic curve obviously increases at the initial stage, and the overall trend of the curve moves upwards with the increase in the dynamic stress amplitude. In the initial stage of cyclic loading, the larger dynamic stress amplitude will cause more serious damage to the test soil. According to the above phenomena, when the dynamic stress amplitude of the improved expansive soil foundation exceeds 90 kPa, the settlement of the foundation should be given close attention, and the monitoring of the section with the heavy traffic load should be appropriately increased.
3.2 Saturation α of the Hysteretic Curve
The hysteresis curve saturation α can be expressed by the ratio of the short and long axes of ellipses of similar morphological size, i.e., the width of the hysteresis curve, as shown in Eq. (4). The width of the hysteresis curve also reflects the cohesiveness of the soil. The wider the curve is, the greater the viscosity of the soil, and the slower the response to dynamic load changes in practical engineering [29–33].
where “a” is the short axis of the hysteretic curve and “b” is the long axis of the hysteretic curve.
Figs. 7 and 8 show the variation rule of the saturation α of the hysteretic curve of the test soil samples under different concentrations and dynamic stress amplitudes after cyclic loading.
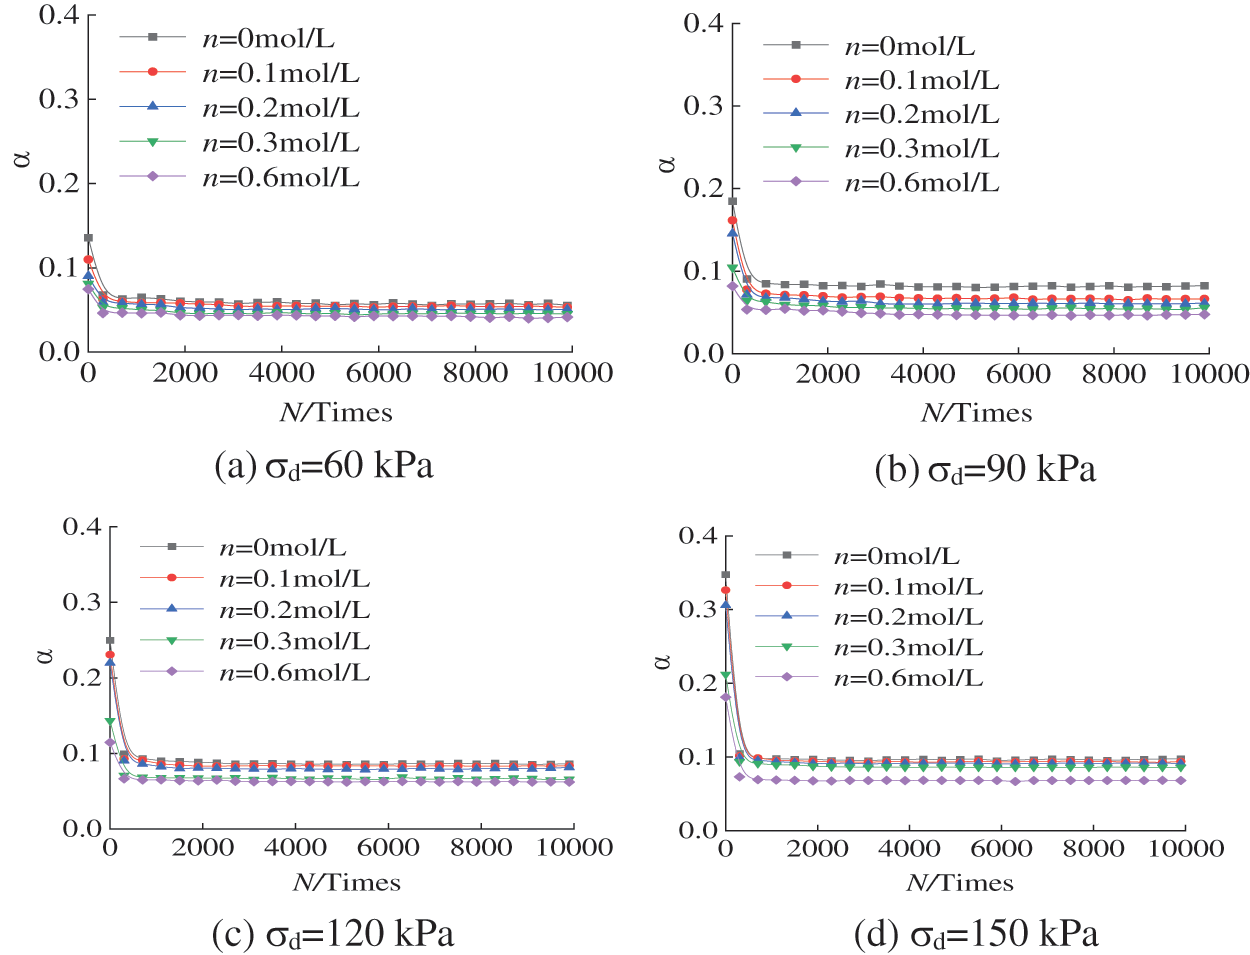
Figure 7: The relationship between the saturation α and vibration N at different concentrations
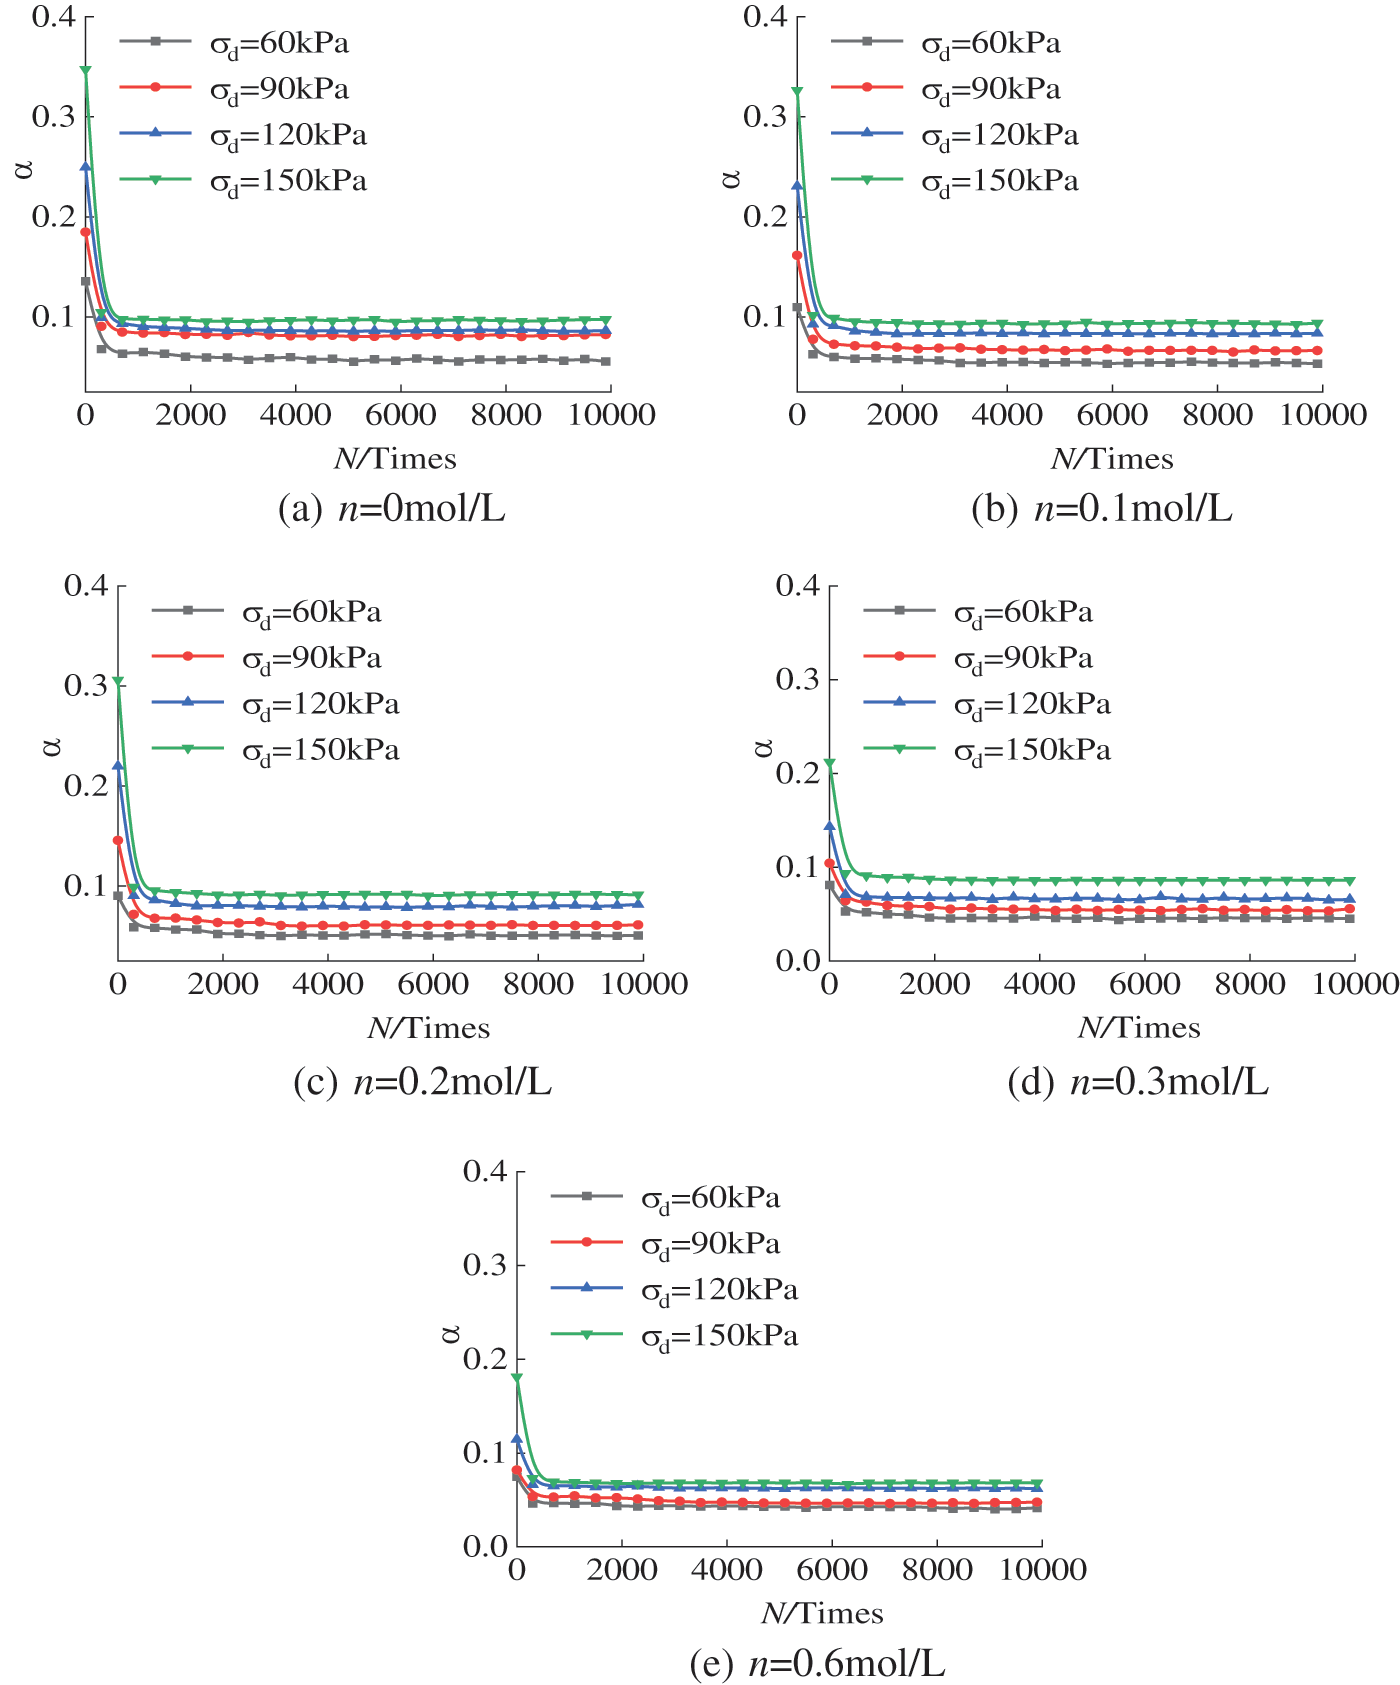
Figure 8: The relationship between the saturation α and vibration N at different amplitudes
From Fig. 7, it is clear that the α value decreased with increasing concentration because the pores in the soil were compressed under the confining pressure in the consolidation stage before the dynamic load test. The degree of pore compression is directly proportional to the concentration of the sodium chloride solutions. With increasing concentration, the double electric layer between soil particles becomes thinner, resulting in a decrease in the distance between particles and an increase in the van der Waals force between molecules and Coulomb force between charged particles. At the same time, embedding and friction between particles is more significant [25–27]. Macroscopically, the elastic deformation of the soil skeleton accounts for a larger proportion of the overall deformation when it is subjected to an external load, and the response to the load is more rapid; that is, the soil viscosity is reduced. At the same concentration, with the increase in N, α decreases until it stabilizes. When the number of cyclic vibrations is less than 300, the saturation of the hysteresis curve changes greatly; when the number of vibrations is more than 300, the curve’s variation amplitude decreases and gradually tends to be stable.
Fig. 8 shows that the amplitude has a significant influence on the saturation α of the hysteretic curve of the test soil sample, and the α-N relationship curve rises gradually with the increase in the amplitude of dynamic stress. As shown in Fig. 8b, when the dynamic stress amplitude σd increases from 60 to 150 kPa, the corresponding average variation in α increases from 0.05 to 0.1. In the whole process of cumulative cyclic loading, the internal pores of the soil are constantly compressed with the increase in the number of cyclic loadings, which makes the soil particles bond more closely, and the viscosity improves accordingly. The macroscopic performance results in the hysteresis curve α increasing with increasing amplitude of the dynamic stress.
3.3 Slope k of Hysteretic Curve
The slope of the hysteresis curve k reflects the elastic properties and stiffness of the soil. Its value can be expressed by the slope of the line connecting the two endpoints of the hysteresis curve, i.e., the ratio of stress difference to strain difference in the long axis BC, as in Eq. (5).
where σC, σB, εB and εC correspond to the maximum dynamic stress, the minimum dynamic stress, the maximum dynamic strain, and the minimum dynamic strain in a period, respectively. A larger difference indicates a greater elastic property and stiffness of the soil.
Under different concentrations and dynamic stress amplitudes, the slope k of the hysteretic curve of the test soil samples after cyclic dynamic loading changes, as shown in Figs. 9 and 10.
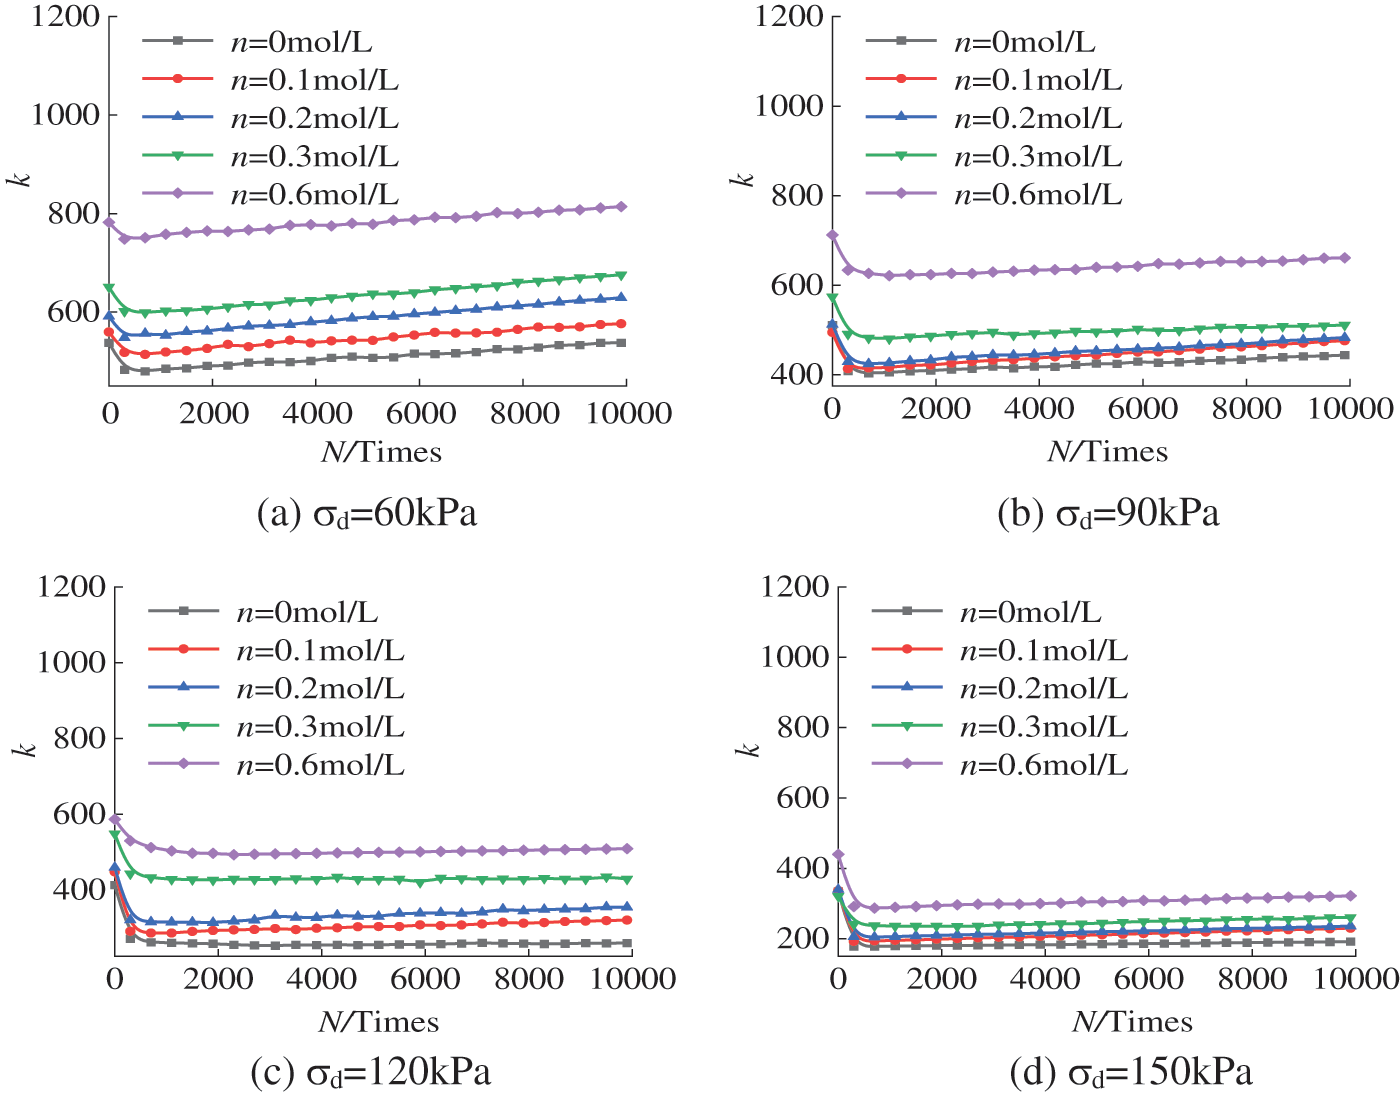
Figure 9: The relationship curve between slope k and vibration frequency N under different concentrations
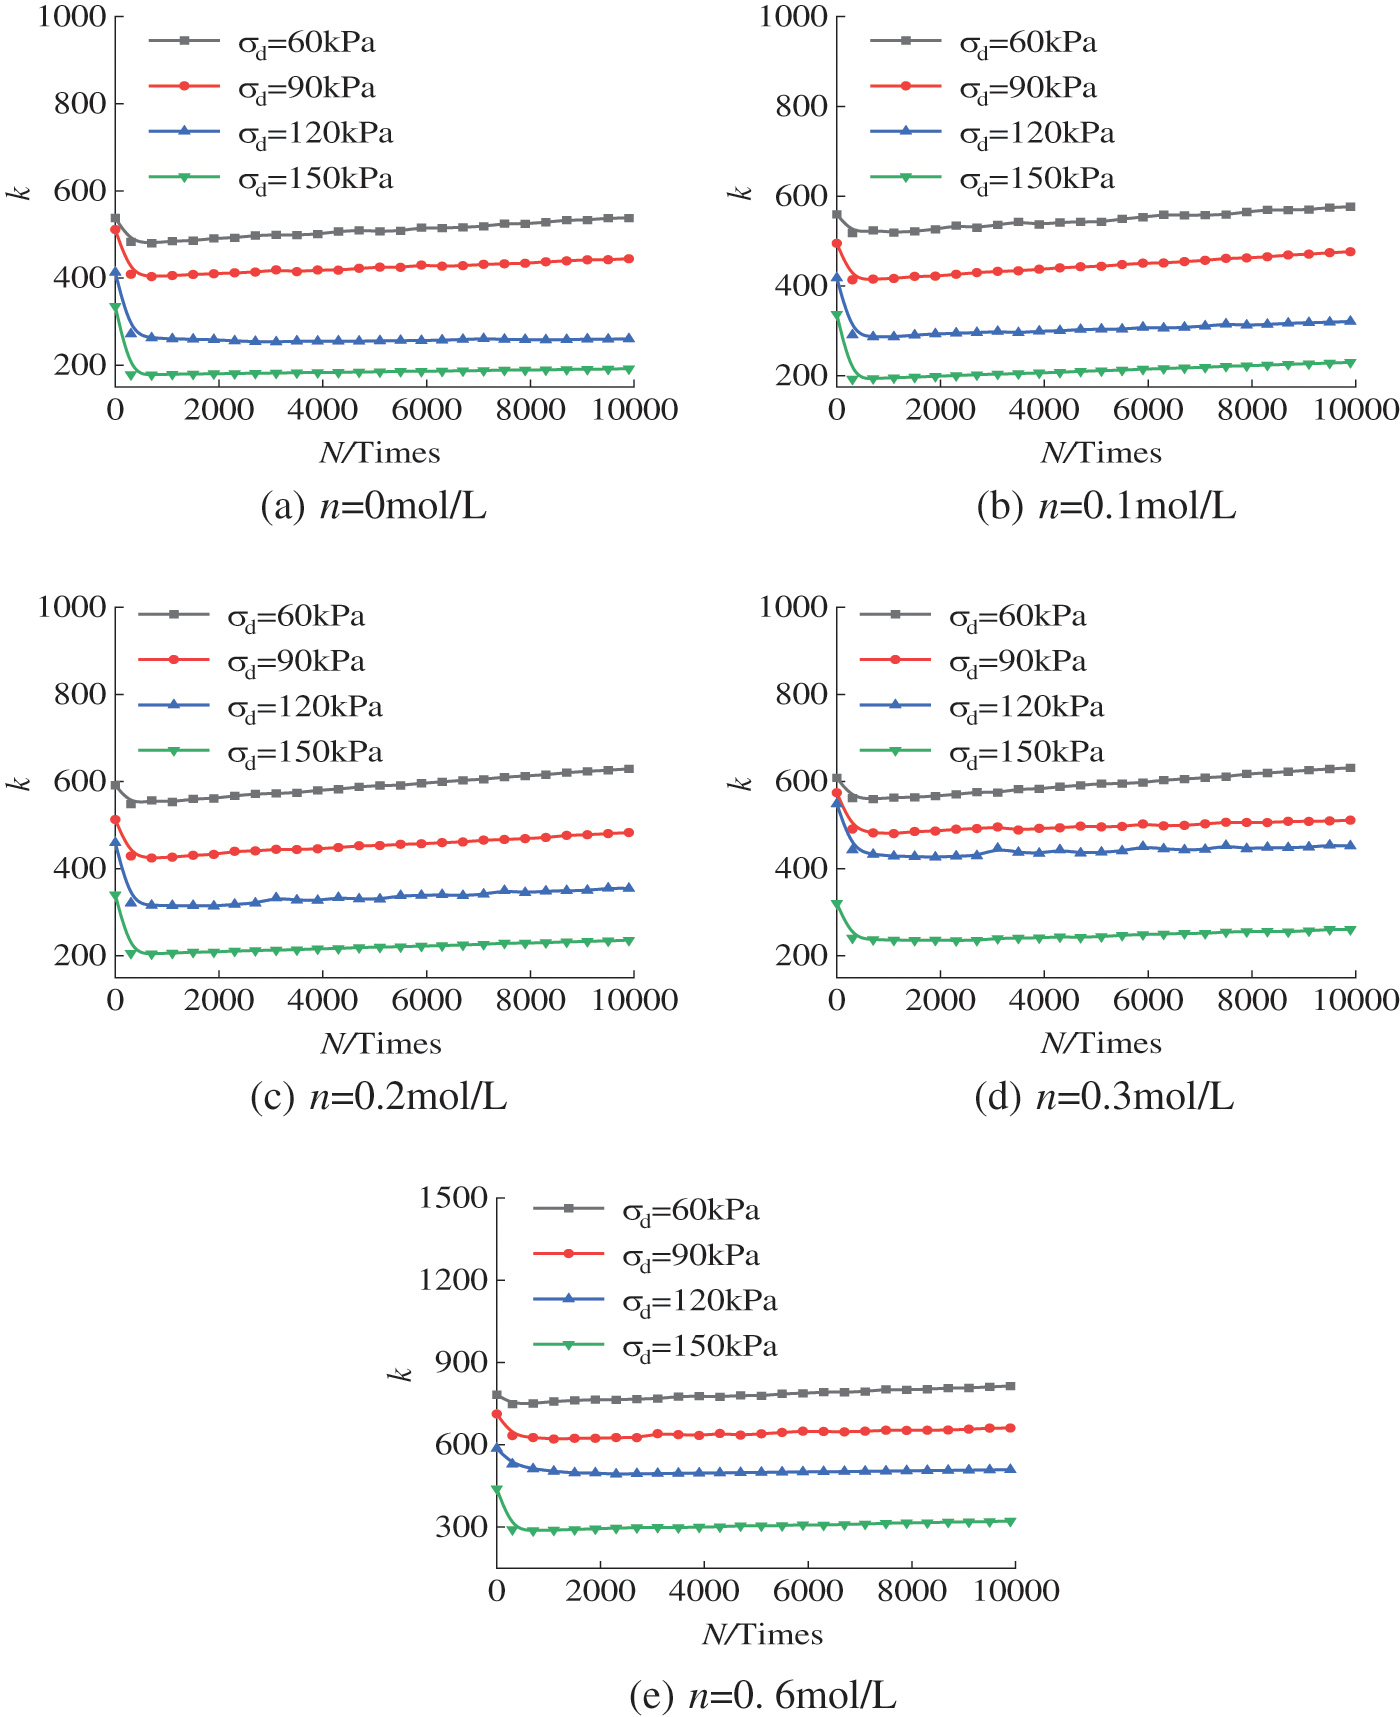
Figure 10: The relationship curve between slope k and vibration frequency N under different amplitudes
Fig. 9 shows the k-N relationship curves of the hysteresis curve for soil samples with the same dynamic stress amplitude and different concentrations under cyclic loading. The figure shows that the curve gradually shifts upwards as the concentration of sodium chloride solutions increases. For the first 300 times, k tends to decrease as the number of vibrations increases. However, when the number of vibrations exceeds 300, k tends to increase gradually. This indicates that strain hardening of the soil occurred at this stage. This is because there are still many pores in the soil in the early stage of loading, and under the premise that no structural failure occurs in the soil skeleton, there is more allowance for the plastic deformation. With the increase in the vibration times, the pores in the soil body are continuously compressed, the spacing between particles is reduced, and a denser load-bearing structure is formed. The overall strain gradually transitioned from mainly plastic deformation to mainly elastic deformation. Macroscopically, the curve of the single k-N relationship first decreases and then increases during the cyclic loading process [34,35].
Fig. 10 shows the k-N relationship curve of the soil samples at the same concentration and different dynamic stress amplitudes. The k-N curve moves downwards as the dynamic stress amplitudes increase. The above results indicate that in highway engineering, both the influence of the sodium chloride solution concentration on the soil in the pore environment and the influence of highway traffic load on the soil strength and stiffness should be considered to prevent subgrade settlement.
The hysteretic curve area S reflects the energy dissipation and seismic performance of soil due to the damping action. A larger S means that more energy is consumed by the soil. Due to the differences in the forms of the hysteretic curves of the test soil under different small and large dynamic stress amplitude conditions, two methods are adopted to calculate the area of the hysteretic curve, S1 and S2, respectively, as shown in formulas (6) and (7):
where a is the short axis of the hysteresis curve, b is the long axis of the hysteresis curve, εid is the dynamic strain, σid is the dynamic stress, and i is the 1-n point of the hysteresis curve.
Under different concentrations and dynamic stress amplitudes, the variation rule of the hysteretic curve area S of the test soil samples after cyclic dynamic loading is shown in Figs. 11 and 12.
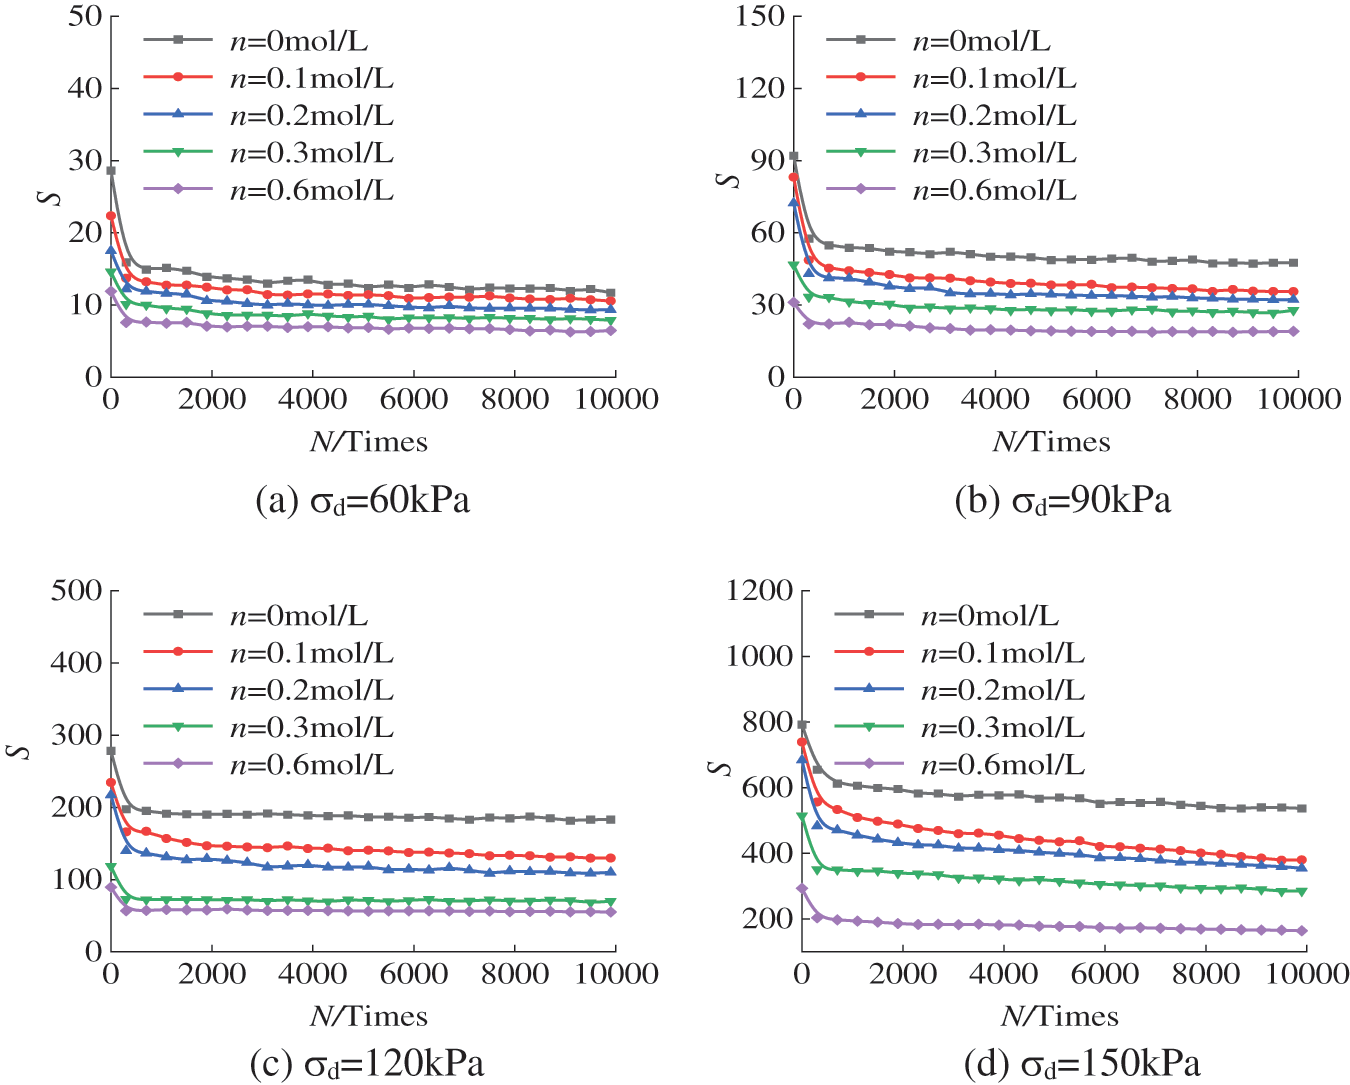
Figure 11: The relationship curve between area S and vibration frequency N under different concentrations
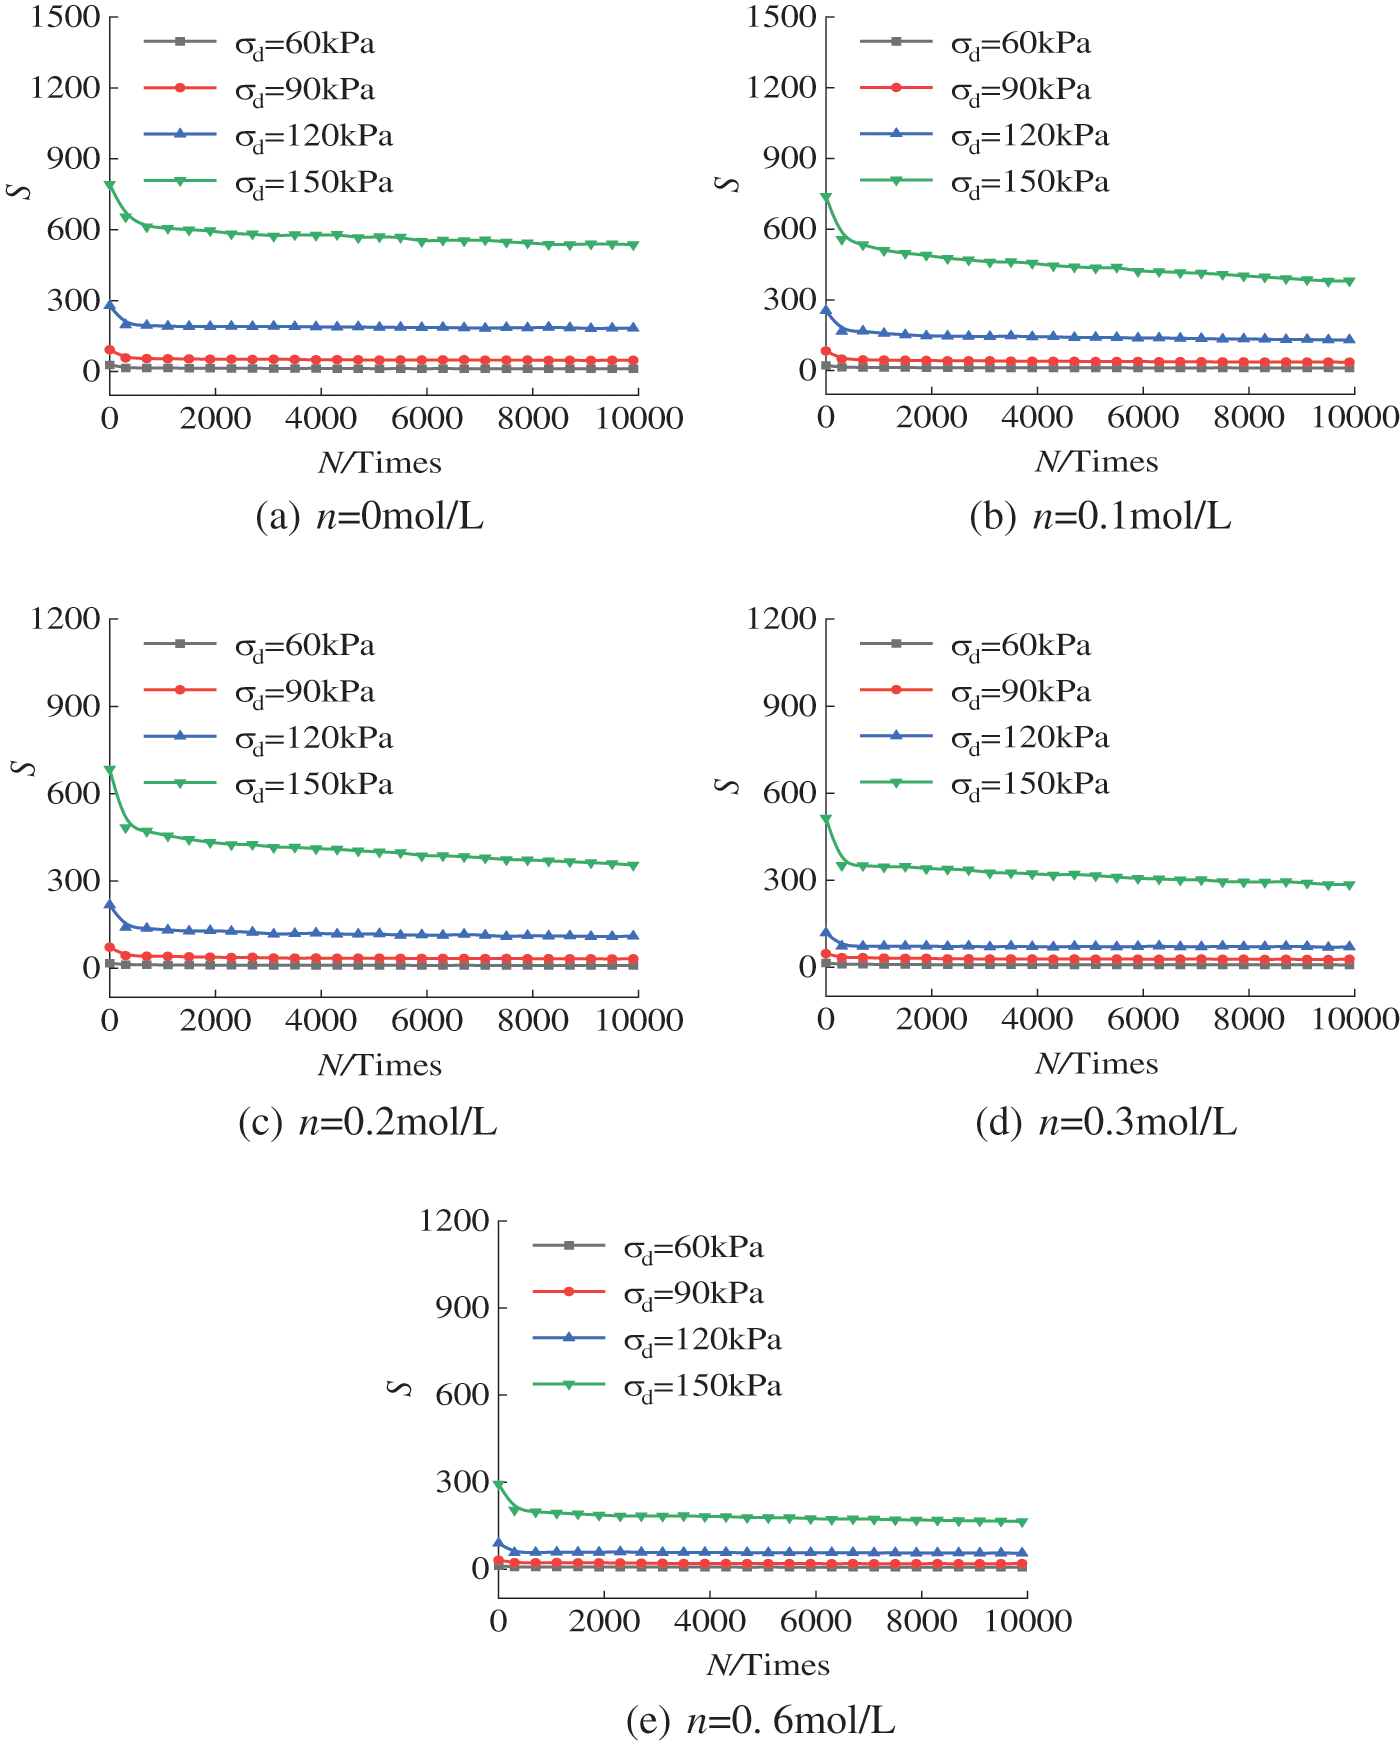
Figure 12: The relationship curve between area S and vibration frequency N under different amplitudes
As shown in Fig. 11, the S–N relationship curve presents an overall downwards trend with increasing concentration. When the dynamic stress amplitude is small, the S–N relation curve shows a converging state. When the dynamic stress amplitude is large, the S–N relation curve presents a discrete state. Fig. 12 shows the S–N relation curve of the hysteretic curve of the soil samples with the same concentration and different dynamic stress amplitudes under dynamic cyclic loading. With the increase in concentration, the S–N relation curve of the soil samples with different dynamic stress amplitudes gradually draws closer. As shown in Fig. 12c, the S–N relation decreases nonlinearly in the first 300 cycles of cyclic vibration, and when it exceeds 300 cycles, the hysteresis curve area S changes slowly, and the energy loss changes less.
Both concentration and dynamic stress amplitude have an effect on the hysteretic curve area S. The effect of concentration is significant at larger values; at smaller values, the effect of concentration on the soil is relatively weaker. This is because free Na+ ions in sodium chloride solutions weakened the expansive soil particles electronegativity and reduced the thickness of the electric double layer. In the consolidation stage, the pores with a high concentration of sodium chloride solutions, compared with those in the lower concentration solution, have been compressed to a greater extent, and the deformable margin has been reduced accordingly. The energy dissipated through deformation under primary cyclic loading can be reflected by the hysteretic curve area S. The reduction of the deformation allowance leads to the weakening of the ability of the soil sample to dissipate energy through deformation, and the load energy can be transmitted through the soil skeleton structure more effectively. From this point of view, under the same dynamic stress amplitude, the increase in sodium chloride solution concentration weakens the energy dissipation performance of the sample, which corresponds to a lower S–N relation curve and reduces the influence of amplitude on the energy dissipation capacity of the sample. With the increase in the dynamic stress amplitude, the total deformation of the sample under cyclic loading increases, and the influence of concentration on the energy dissipation capacity is more obvious, which corresponds to the more discrete S–N relationship curve under different concentrations of sodium chloride solutions.
4.1 Morphological Changes of Typical Hysteretic Curves
The stress–strain curve with N < 5,000 times dynamic cyclic loading, namely, the hysteresis curve, was selected. As the number of dynamic cyclic loadings increased, its shape changed from wide fat to narrow, as shown in Fig. 13. At the initial stage of dynamic cyclic loading, the hysteretic curve has a large opening, and it is not closed. With the increase in the number of dynamic cyclic loadings, the test sample becomes increasingly dense in the later loading stage, and the plastic deformation ratio decreases, indicating that cyclic strain hardening occurs on the whole sample.
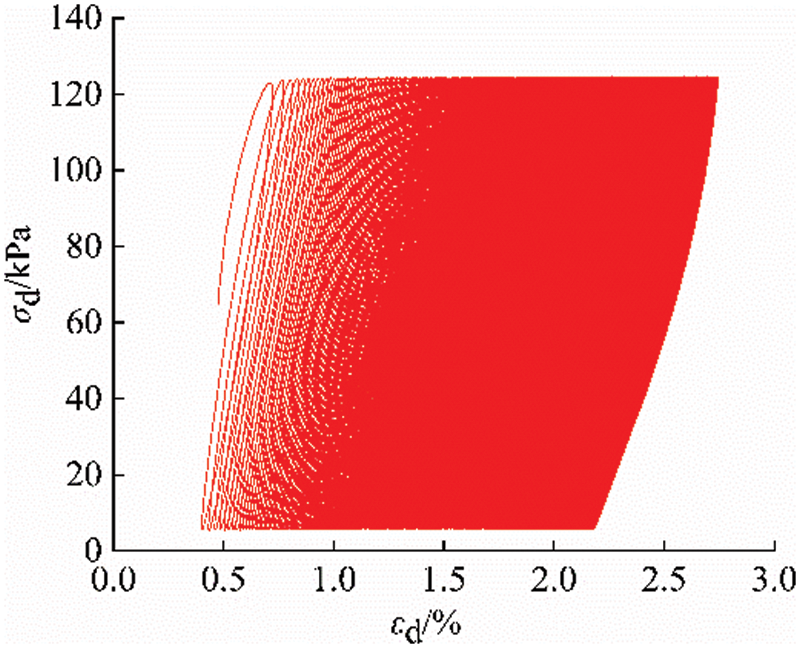
Figure 13: Schematic diagram of a typical hysteretic curve under a dynamic soil load
The above curve rulessuggest that concentration has a great influence on the four morphological characteristics of the hysteretic curve: the degree of nonclosure εp, saturation α, slope k and area S. Because all the characteristic parameters of the hysteretic curve meet the development trend of the exponential function, an exponential function is used for the curve fitting analysis of εp, α, k and S. To study the development law of the four morphological characteristics of the concentration and hysteresis curve with increasing vibration times, the data of the dynamic stress amplitude σd = 150 kPa are selected and processed accordingly, and the relationship curves εp-N, α-N, k-N and S–N can be obtained. It is fitted by exponential functions (8)–(11). The fitting curve is shown in Fig. 14, and the fitting parameters are shown in Table 3.
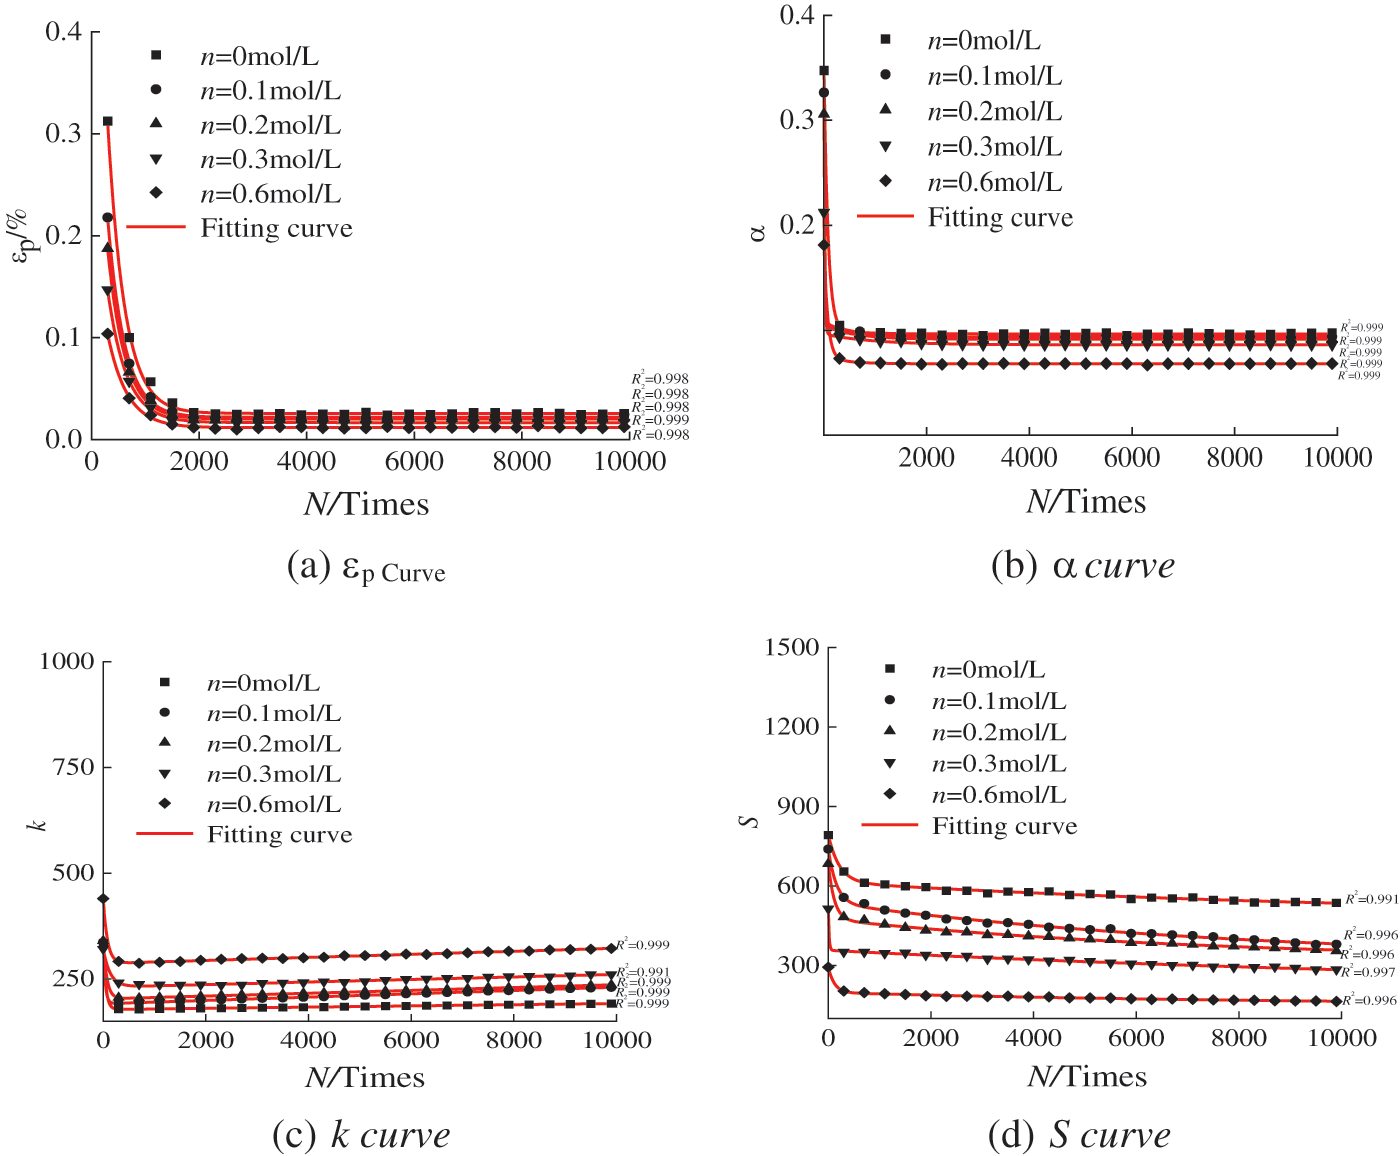
Figure 14: Fitting curve of the relationship between the morphological characteristics of the hysteresis curve and vibration frequency at different concentrations
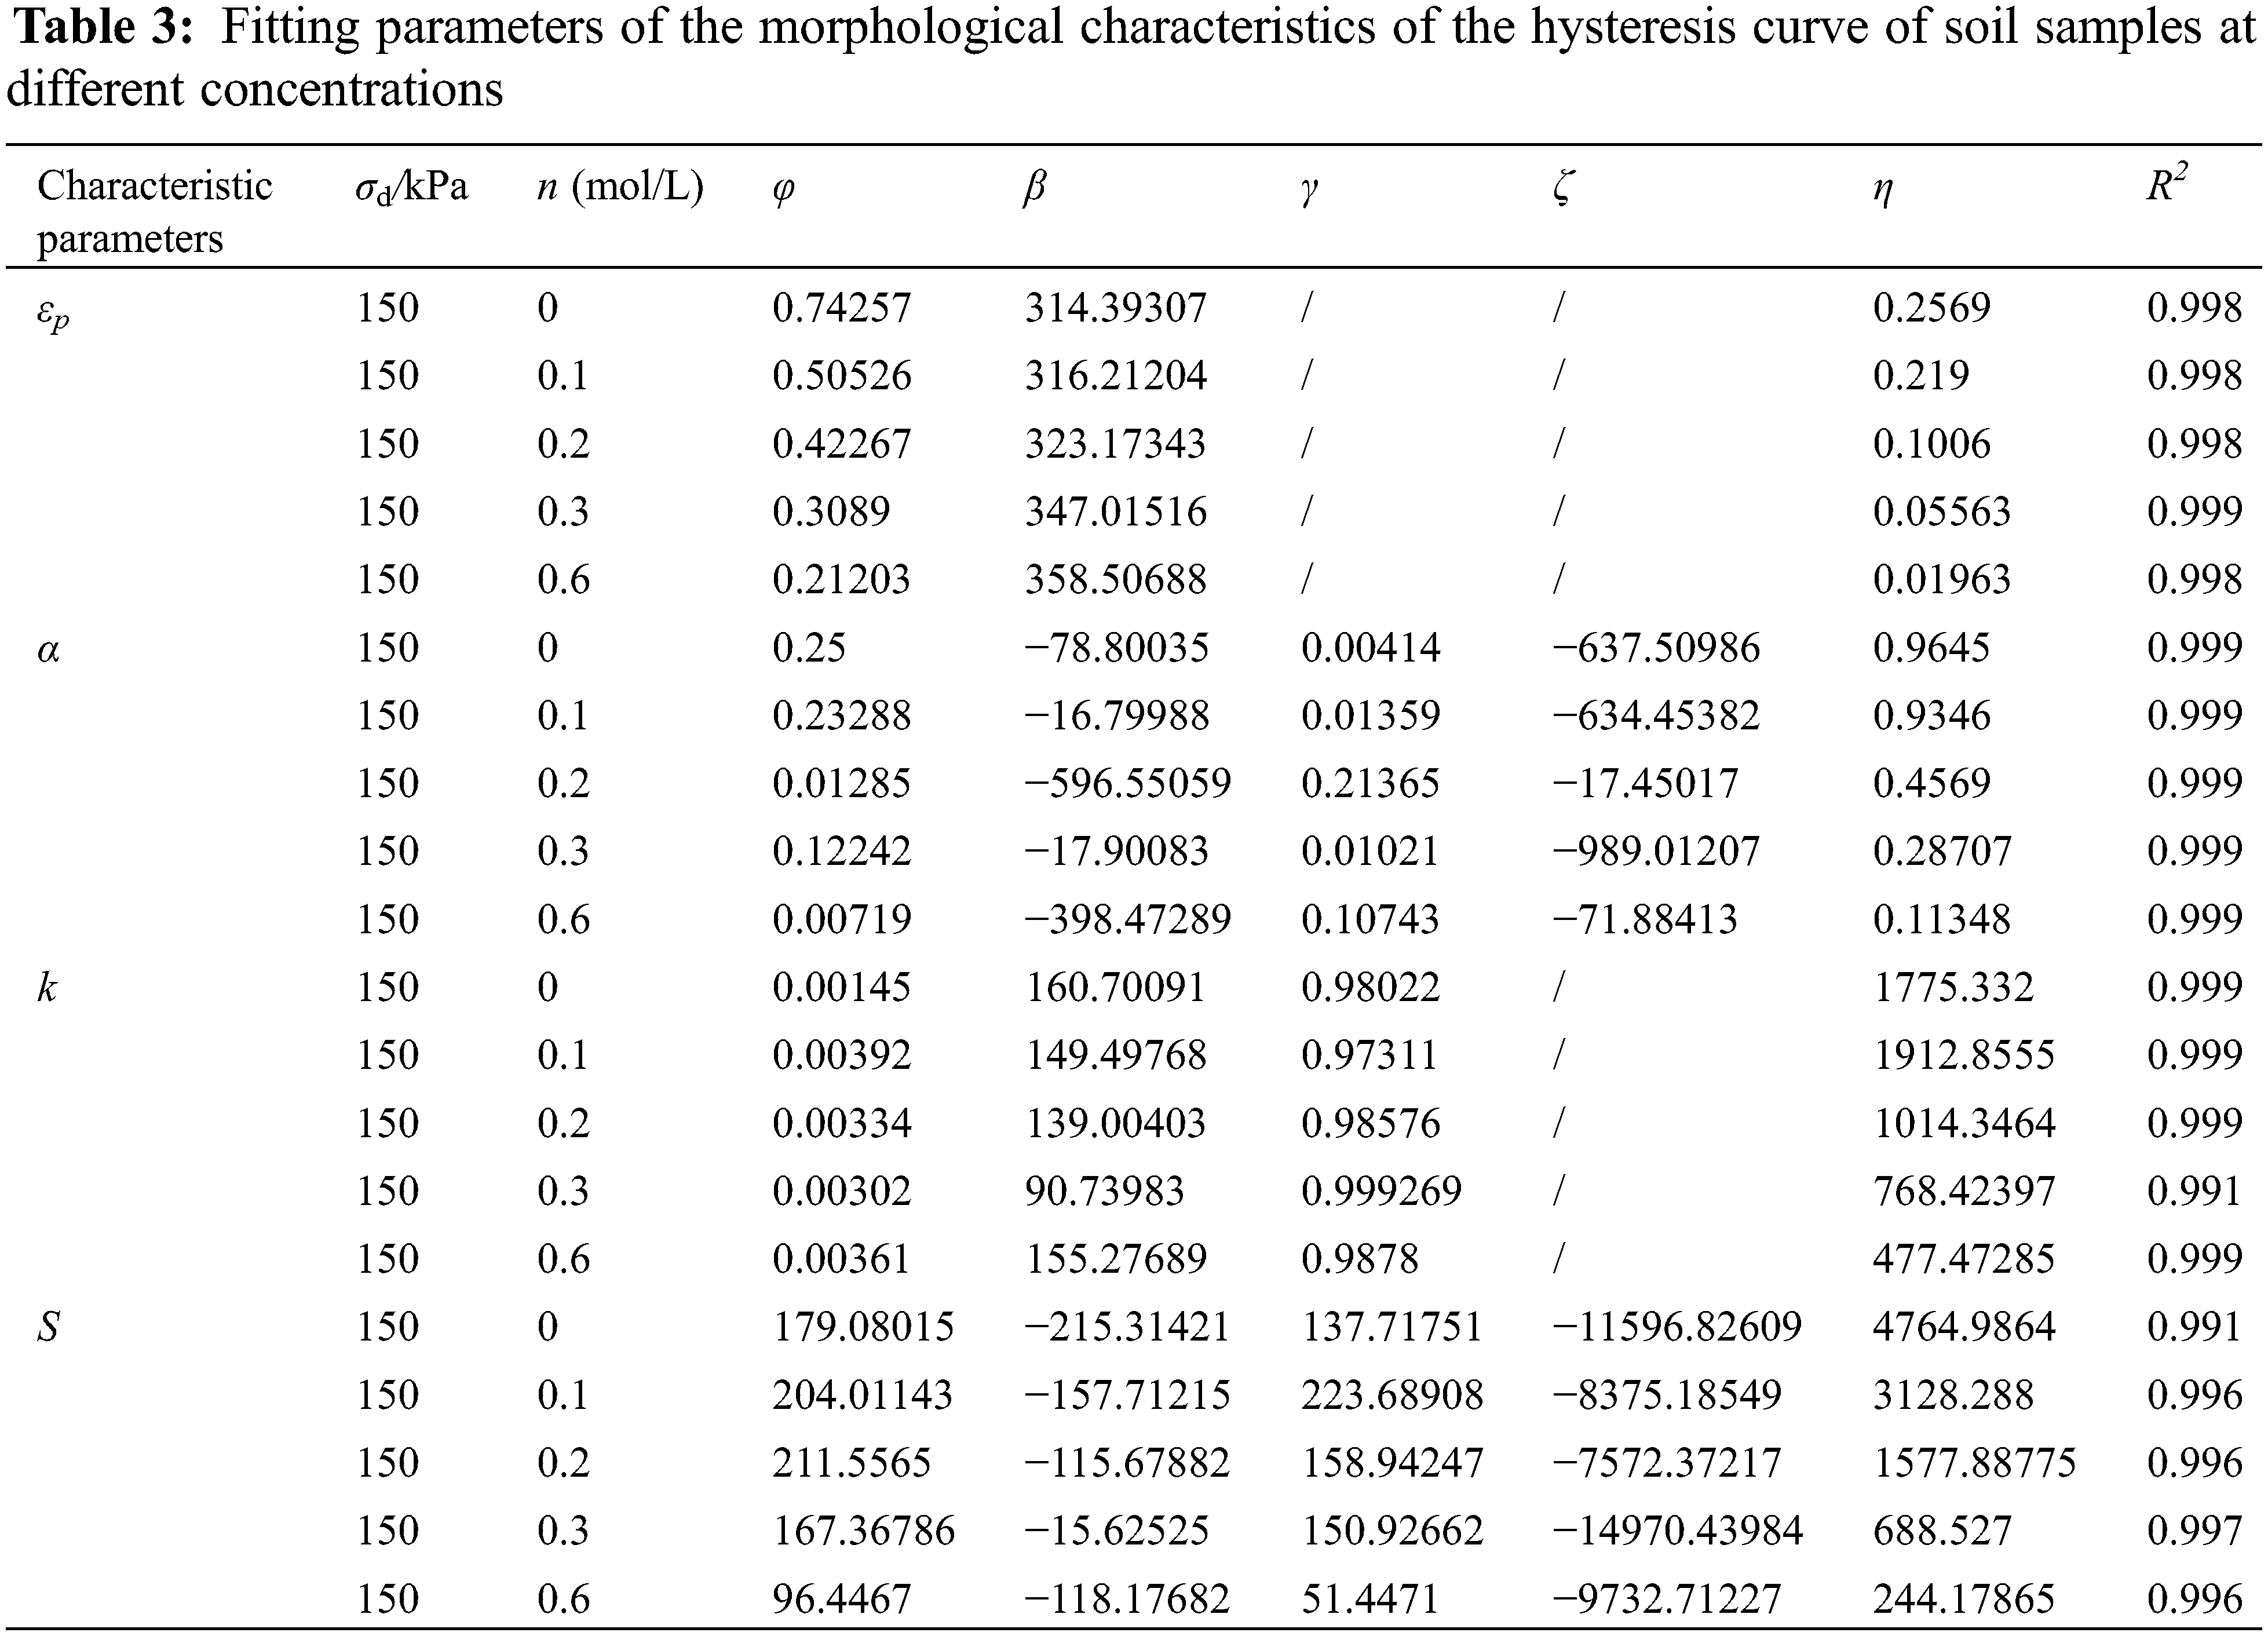
In the equations in Table 3, n is the concentration of salt solutions, φ, β, γ, ζ and η are the fitting parameters, and N is the number of vibrations [36–41].
The fitting prediction model shows that the unclosed degree εp of the sample changes gently during the cyclic loading process, and the three-parameter exponential prediction model can be used to predict and analyse it well. However, the saturation α and area S of the hysteretic curve are the coupling results of a variety of factors, and the curve changes more sharply during the whole cumulative cyclic loading process. Therefore, the five-parameter exponential prediction model is used to predict and analyse the curve. For the prediction of slope K, the curve shows a pair hook shape that falls first and then rises. Therefore, the shah function, which can describe the trend of the pair hook, should be used to perform the fit. Figs. 14a–14d show that the correlation index function can well reflect the relationship between the concentration and morphological characteristics εp, α, k and S of the hysteretic curve under cyclic dynamic loading. The fitting degree R2 is above 0.99. These results show that the prediction model and the related fitting parameters can provide a reference for practical engineering [42–45].
(1) The εp-N relationship curve shows a downwards trend with increasing concentration. When N < 2,000, the thickness of the double electric layer decreases with the increase of the concentration, and the εp decreases sharply with the increase of the cyclic dynamic load number N. When N > 2,000, the distance between particles decreases continuously under cyclic dynamic load, and the εp tends to be stable with the increase of vibration number N in the process of subsequent cumulative load. The εp-N relation curve shows an overall upwards trend with increasing dynamic stress amplitude.
(2) The α-N relationship curve shows an overall downwards trend with increasing concentration, while the curve of increasing amplitude of the follow-up stress shows an overall upwards trend. In the single α-N relation curve, α decreases nonlinearly with increasing vibration number N, and when N exceeds the critical value of 300, α changes slightly with increasing vibration number N and then tends to be flat.
(3) The k-N relationship curve shows an overall upwards trend with increasing concentration and an overall downwards trend with increasing dynamic stress amplitude. Sodium chloride solutions have a great influence on the dynamic characteristics of expansive soil, and their amplitude also has a significant influence on it. In practical engineering applications, not only the influence of the sodium chloride solution concentration on the pore environment but also the influence of the highway traffic load on the strength and stiffness of the soil should be considered.
(4) The S–N relationship curve shows an overall downwards trend with increasing concentration; when the dynamic stress amplitude is small, the curve converges. When the dynamic stress amplitude is large, the curve presents a discrete state. The S–N relation shows an overall upwards trend with increasing amplitude. For the first 300 cycles of cyclic vibration, the S–N relation curve decreases nonlinearly. When more than 300 cycles are used, the change in the hysteretic curve area S is slow, and the change in energy loss is small.
(5) The shape of the hysteretic curve changes from wide fat to narrow with increasing cyclic number N, and the whole soil sample shows cyclic strain hardening. With an exponential function, the prediction model of the concentration and hysteresis curve is established, which provides a reference for related research and engineering.
Funding Statement: The authors received no specific funding for this study.
Conflicts of Interest: The authors declare that they have no conflicts of interest to report regarding the present study.
References
1. Kong, L., Chen, Z. (2012). Advancement in the techniques for special soils and slopes. China Civil Engineering Journal, 45(5), 141–161. [Google Scholar]
2. Yang, Z., Yu, H., Tang, Q., Tian, H., Wei, C. (2019). Effects of sodium chloride solution on swelling pressure and pore distribution of expansive soils. Chinese Journal of Geotechnical Engineering, 41(S2), 77–80. [Google Scholar]
3. Li, Z., Tang, C., Hu, R. (2014). Experimental research on expansion characteristics of Mengzi expansive soil with water, salt and acid immersion. Environmental Earth Sciences, 71(2), 363–367. https://doi.org/10.1007/s12665-013-2957-z [Google Scholar] [CrossRef]
4. Reddy, P. H. P., Prasad, C. R. V., Pillai, R. J. (2017). Swelling of natural soil subjected to acidic and alkaline contamination. Periodica Polytechnica Civil Engineering, 61(3), 611–620. [Google Scholar]
5. Mashifana, T. P., Okonta, F. N., Ntuli, F. (2018). Geotechnical properties and microstructure of lime-fly Ash-phosphogypsum-stabilized soil. Advances in Civil Engineering, 2018, 1–9. https://doi.org/10.1155/2018/3640868 [Google Scholar] [CrossRef]
6. Studds, P. G., Stewart, D. I., Cousens, T. W. (1998). The effects of salt soultions on the properties of bentonite-sand mixtures. Clay Minerals, 33(4), 651–660. https://doi.org/10.1180/claymin.1998.033.4.12 [Google Scholar] [CrossRef]
7. Chang, J., Xiao, J., Jiang, J., Zhang, R., Kuang, X. (2021). Study on hygroscopic swelling and dehumidification cracking characteristics of expansive soil under acid rain and cyclic drying-wetting. Advances in Civil Engineering, 16(3), 883–891. [Google Scholar]
8. Yu, H., Wei, C., Yan, R., Fu, X., Ma, T. (2015). Effects of pore solution concentrations on shear strength of clay. Chinese Journal of Geotechnical Engineering, 37(3), 564–569. [Google Scholar]
9. Yu, H., Sun, D., Yu, M., Jiang, S. (2019). Deformation characteristics of kaolinite clay with different initial water contents in NaCl solution. China Civil Engineering Journal, 52(S2), 14–22. [Google Scholar]
10. Yu, H., Sun, D., Wei, C., Yan, R. (2019). Swelling characteristics of bentonite with different initial water contents saturated by NaCl solution. Chinese Journal of Geotechnical Engineering, 41(3), 595–600. [Google Scholar]
11. Liang, W., Wei, C., Yan, R., Yang, D. (2019). Microstructure and compression characteristics of NaCl solutions saturated expansive soil. Rock and Soil Mechanics, 40(12), 4759–4766. [Google Scholar]
12. Yao, C., Wei, C., Ma, T., Chen, H., Chen, H. (2017). Effects of pore solution on mechanical properties of expansive soil. Rock and Soil Mechanics, 38(S2), 116–122. [Google Scholar]
13. Lin, J., Ye, J., Zou, W. (2020). Effect of pore fluid on microstructure in expansive soil. Journal of Huazhong University of Science and Technology (Natural Science Edition), 48(4), 12–17. [Google Scholar]
14. Huang, B., Ding, H., Chen, Y. (2011). Simulation of high-speed train load by dynamic triaxial tests. Chinese Journal of Geotechnical Engineering, 33(2), 195–202. [Google Scholar]
15. Wen, C., Ren, H. (2021). Dynamic backbone curve model of bioenzyme-treated expansive soil under cyclic loading. Journal of Central South University (Science and Technology), 52, 1109–1117. [Google Scholar]
16. Zhuang, X., Zhao, H., Wang, J., Huang, Y., Hu, Z. (2020). Quantitative research on morphological characteristics of hysteretic curves of remold weak expansive soil under cyclic loading. Rock and Soil Mechanics, 41(6),1845–1854. [Google Scholar]
17. Qiu, M., Yu, Y. (2010). Analysis of influence depth for roads induced by vehicle load. Rock and Soil Mechanics, 31(6), 1822–1826. [Google Scholar]
18. Ding, Z., Zheng, Y., Wei, X., Zhang, M. (2020). Experimental study on the effect of different loading frequency and cyclic stress level for dynamic behaviour of artificial frozen-thawed soft soil. Journal of the China Railway Society, 42(3), 122–128. [Google Scholar]
19. Zhao, F., Chang, L., Zhang, W. (2019). Experimental study on dynamic strength parameters of subgrade saline soil under temperature variation. Chinese Journal of Geotechnical Engineering, 41(S1), 217–220. [Google Scholar]
20. Lu, Z., Wang, C., Fu, J., Zhan, Y. (2013). Research on influence depth of road subgrade induced by vehicle loads. Rock and Soil Mechanics, 34(2), 316–321 + 352. [Google Scholar]
21. China Machinery Industry Federation (2015). Code for measurement methods of dynamic properties of subsoil. China: China Planning Press. [Google Scholar]
22. Zhuang, X., Wang, J., Li, K., Wang, K., Hu, Z. (2019). Comparative study on characteristic of hysteretic curves of expansive soil improved by weathered sand. Chinese Journal of Rock Mechanics and Engineering, 38(S2), 3709–3716. [Google Scholar]
23. Chen, W., Kong, L., Zhu, J. (2007). A simple method to approximately determine the damping ratio of soil. Rock and Soil Mechanics, 28(S1), 789–791. [Google Scholar]
24. Rahardjo, H., Aung, K. K., Leong, E. C., Rezaur, R. B. (2004). Characteristics of residual soils in Singapore as formed by weathering. Engineering Geology, 73(1), 157–169. https://doi.org/10.1016/j.enggeo.2004.01.002 [Google Scholar] [CrossRef]
25. Xia, Z. (2020). Multi scale study on physical and mechanical properties of kaolin in salt environment (Master Thesis). Hunan University, China. [Google Scholar]
26. Butt, H. J., Cappella, B., Kappl, M. (2005). Force measurements with the atomic force microscope: Technique, interpretation and applications. Surface Science Reports, 59(1–6), 1–152. https://doi.org/10.1016/j.surfrep.2005.08.003 [Google Scholar] [CrossRef]
27. Li, S., Li, H., Xu, C., Huang, X., Xie, D. et al. (2013). Particle interaction forces induce soil particle transport during rainfall. Soil Science Society of America Journal, 77, 1563–1571. https://doi.org/10.2136/sssaj2013.01.0009 [Google Scholar] [CrossRef]
28. Vincent, N. A., Shivashankar, R., Lokesh, K. N., Nath, D. (2021). Shrinkage limit studies from moisture content: Electrical resistivity relationships of soils. Arabian Journal for Science and Engineering, 46, 923–4940. https://doi.org/10.1007/s13369-020-05325-5 [Google Scholar] [CrossRef]
29. Tollenaar, R. N., Paassen, L. A., Jommi, C. (2017). Observations on the desiccation and cracking of clay layers. Engineering Geology, 230. https://doi.org/10.1016/j.enggeo.2017.08.022 [Google Scholar] [CrossRef]
30. Puppala, A. J., Manosuthikij, T., Chittoori, B. C. (2013). Swell and shrinkage characterizations of unsaturated expansive clays from Texas. Engineering Geology, 164, 187–194. https://doi.org/10.1016/j.enggeo.2013.07.001 [Google Scholar] [CrossRef]
31. Karumanchi, S. R., Mandal, A. (2020). Mandal Anirban Moisture variations and its effect on shrinkage and swelling characteristics of unsaturated soil. European Journal of Environmental and Civil Engineering, 24, 1785–1801. [Google Scholar]
32. Issa, O. M., Défarge, C., Trichet, J., Valentin, C., Rajot, J. L. (2008). Microbiotic soil crusts in the Sahel of Western Niger and their influence on soil porosity and water dynamics. Catena, 77(1), 48–55. https://doi.org/10.1016/j.catena.2008.12.013 [Google Scholar] [CrossRef]
33. Alonso, E. E., Vaunat, J., Gens, A. (1999). Modelling the mechanical behaviour of expansive clays. Engineering Geology, 54(1), 173–183. https://doi.org/10.1016/S0013-7952(99)00079-4 [Google Scholar] [CrossRef]
34. Pardini, G., Guidi, V. G., Pini, R., Regüés, D., Gallart, F. (1996). Structure and porosity of smectitic mudrocks as affected by experimental wetting—drying cycles and freezing—thawing cycles. Catena, 27(3), 149–165. https://doi.org/10.1016/0341-8162(96)00024-0 [Google Scholar] [CrossRef]
35. Romero, E., Simms, P. H. (2008). Microstructure investigation in unsaturated soils: A review with special attention to contribution of mercury intrusion porosimetry and environmental scanning electron microscopy. Geotechnical and Geological Engineering, 26(6), 705–727. https://doi.org/10.1007/s10706-008-9204-5 [Google Scholar] [CrossRef]
36. Azizi, A., Jommi, C., Musso, G. (2017). A water retention model accounting for the hysteresis induced by hydraulic and mechanical wetting-drying cycles. Computers and Geotechnics, 87, 86–98. https://doi.org/10.1016/j.compgeo.2017.02.003 [Google Scholar] [CrossRef]
37. Morena, G. D., Asensio, L., Navarro, V. (2018). Intra-aggregate water content and void ratio model for MX-80 bentonites. Engineering Geology, 246, 131–138. https://doi.org/10.1016/j.enggeo.2018.09.028 [Google Scholar] [CrossRef]
38. Chaparro, M. C., Klose, T., Hirsch, A., Schilling, F., Butscher, C. et al. (2021). Modelling of wellbore cement alteration due to CO2-rich brine interaction in a large-scale autoclave experiment. International Journal of Greenhouse Gas Control, 110, 103428. https://doi.org/10.1016/j.ijggc.2021.103428 [Google Scholar] [CrossRef]
39. Fahimifar, A., Karami, M., Fahimifar, A. (2015). Modifications to an elasto-visco-plastic constitutive model for prediction of creep deformation of rock samples. Soils and Foundations, 55(6), 1364–1371. https://doi.org/10.1016/j.sandf.2015.10.003 [Google Scholar] [CrossRef]
40. Fredlund, D. G., Xing, A. (1994). Equations for the soil-water characteristic curve. Canadian Geotechnical Journal, 31(4), 521–532. https://doi.org/10.1139/t94-061 [Google Scholar] [CrossRef]
41. Wichtmann, T., Niemunis, A., Triantafyllidis, T. (2015). Improved simplified calibration procedure for a high-cycle accumulation model. Soil Dynamics and Earthquake Engineering, 70, 118–132. https://doi.org/10.1016/j.soildyn.2014.12.011 [Google Scholar] [CrossRef]
42. Navarro, V., Asensio, L., Morena, G. D., Pintado, X., Yustres, Á. (2015). Differentiated intra- and inter-aggregate water content models of MX-80 bentonite. Applied Clay Science, 2015(118), 325–336. https://doi.org/10.1016/j.clay.2015.10.015 [Google Scholar] [CrossRef]
43. Gallipoli, D., Wheeler, S. J., Karstunen, M. (2003). Modelling the variation of degree of saturation in a deformable unsaturated soil. Géotechnique, 53(1), 105–112. https://doi.org/10.1680/geot.2003.53.1.105 [Google Scholar] [CrossRef]
44. Peron, H., Delenne, J. Y., Laloui, L., Youssoufi, M. S. E. (2008). Discrete element modelling of drying shrinkage and cracking of soils. Computers and Geotechnics, 36(1), 61–69. [Google Scholar]
45. Iwan, W. D. (1967). On a class of models for the yielding behavior of continuous and composite systemsa. Journal of Applied Mechanics, 34(3), 612–617. https://doi.org/10.1115/1.3607751 [Google Scholar] [CrossRef]
Cite This Article
 Copyright © 2023 The Author(s). Published by Tech Science Press.
This work is licensed under a Creative Commons Attribution 4.0 International License , which permits unrestricted use, distribution, and reproduction in any medium, provided the original work is properly cited.
 Downloads
 Citation Tools