
 Submit a Paper
 Propose a Special lssue
 Open Access
ARTICLE

Experimental Study on the Resistance and Splash Performances of Water Collecting Devices for Mechanical Draft Cooling Towers
1 China Energy Engineering Group Guangdong Electric Power Design Institute Co., Ltd., Guangzhou, 510663, China
2 School of Energy and Power Engineering, Shandong University, Jinan, 250061, China
* Corresponding Author: Suoying He. Email:
Fluid Dynamics & Materials Processing 2023, 19(7), 1789-1801. https://doi.org/10.32604/fdmp.2023.026559
Received 14 September 2022; Accepted 24 November 2022; Issue published 08 March 2023
 View Full Text
 Download PDF
Abstract
In recent years, water collecting systems, with the associated advantages of energy saving and noise reduction, have become the foundation for the development of a scheme to optimize the structure of cooling towers. To explore the feasibility of this approach for mechanical draft cooling towers, a small-scale experimental device has been built to study the resistance and splash performances of three U-type water collecting devices (WCDs) for different water flow rates and wind speeds. The experimental results show that within the considered ranges of wind speed and water flow rate, the pressure drop of the different WCDs can vary significantly. The resistance and local splash performances can also be remarkably different. Some recommendations about the most suitable system are provided. Moreover, a regression analysis of the experimental data is conducted, and the resulting fitting formulas for resistance and splash performance of WCD are reported.Graphic Abstract
Keywords
Nomenclature
| d | Spacing of collecting slab, m |
| h | Vertical height of collecting slab, m |
| L | Length of collecting slab, m |
| Lps | Distance between nozzle and collecting tank, m |
| MAPE | Mean absolute percentage error |
| n | Number of measurement points |
| ΔP | Air-side pressure drop, Pa |
| qa | Air flow rate, m3/h |
| qw | Water flow rate, m3/h |
| Qsw | Local splash water, L |
| Re | Reynolds number |
| s | Standard deviation of experiment |
| S | Splash performance measurement area, m2 |
| u | Wind speed, m/s |
| WCD | Water collecting device |
| Xmean | Arithmetic mean |
| σmean | Standard deviation of mean |
| ρ | Air density, kg/m3 |
Energy saving and water-consumption reduction of a circulating cooling water system is an important way to achieve the goal of “emission peak, carbon neutrality”, as its cooling capacity has a great impact on the efficiency and carbon-emission reduction of served power units [1,2]. Wet cooling towers transfer waste heat from water to air through heat and mass transfer between the water and air, which usually have a more significant cooling effect than dry cooling towers. Extensive researches have been carried out to improve the cooling performance of such towers [3–6]. The water distribution zone, media zone, and rain zone are the main heat and mass transfer zones inside a wet cooling tower [7]. The use of a water collecting device (WCD) instead of the rain zone has the advantages of energy saving, noise reduction and uniform inlet air when compared to conventional towers [8–11]. In addition, a WCD will occupy part of draft area, which changes the draft and resistance performance of the tower to some extent [12,13].
Natural draft cooling towers with high-level WCDs were first proposed by Electricity France and Harmon Cooling Towers Belgium in the late 1970s. In China, a high-level water collecting cooling tower with a spray area of 4750 m2 was first independently designed in the early 1990s [14,15]. Li [16] compared the economics of conventional towers and high-level towers in terms of initial investment, operation and maintenance costs, and cost recovery, and concluded that high-level towers are superior to conventional towers. Wu [17] established a calculation model for a natural draft high-level water collecting. By investigating the influence of ambient crosswind on air flow field, temperature field, and pressure field of the cooling tower, the author found that the optimal height of the WCD was 9 m and the optimal inclined angle of the water collecting slab was 50°. Through a wind tunnel experiment, Lyu et al. [18] found that the flow resistance of a U-type WCD is lower than that of a rectangular WCD under the same working conditions. Zhao et al. [19] analyzed and compared the cooling performance of a high-level water collecting cooling tower and a conventional natural draft cooling tower. The results showed that the conventional tower’s media zone accounts for 70% of the cooling load, and the high-level tower’s media zone could contribute 85.92% of the cooling load under the same operating condition, indicating that the heat and mass transfer capacity of the high-level tower media zone was enhanced. Besides, the experimental test by Javadpour et al. [20] focused on potential application of nanofluid in cooling towers, and it was observed that nanofluid’s stagnation and agglomeration issues have a negative effect on the heat and mass transfer process. Essentially, the stagnation and agglomeration issues of nanofluid affect draft and resistance performances of the tower. Feng et al. [21] found that the resistance coefficient of a WCD was about 2.53 through numerical simulation. Gao et al. [22] conducted a field test on a high-level water collecting tower and found that the thermal performance of the high-level tower was better under low crosswind conditions. Lyu et al. [23] proposed a new WCD by investigating the effect of different inclined angles and aisle spacings on the internal flow field of the WCD, and a formula for calculating the resistance coefficient of the WCD was derived, which is of great significance to further research on WCD. Through wind tunnel experiment, He et al. [24] investigated the resistance characteristic of WCDs of U-, V-, and rectangular shapes with air speeds between 0.5∼3.0 m/s and proposed a correlation equation for predicting the airflow pressure drop in the presence of water under working conditions.
Previous studies mainly focus on exploring WCDs for natural draft cooling towers in terms of thermal and resistance performances by wind tunnel test or numerical simulation. However, mechanical draft cooling towers with the features of high turbulent air, small size and high-water spray density have been widely used in the fields of industrial process and house heating and cooling process (e.g., heating, ventilation and air conditioning, chillers, and heat pump) [25,26]. It is hard to estimate the flow situation when considering severe splash issues, especially for the mechanical draft cooling towers. To study the resistance and splash performances of WCDs for application in mechanical draft cooling towers, a test rig (i.e., a small-scale tower) was built taking a real cooling tower as the prototype based on the criteria of the same relative positions and equal air-water ratio.
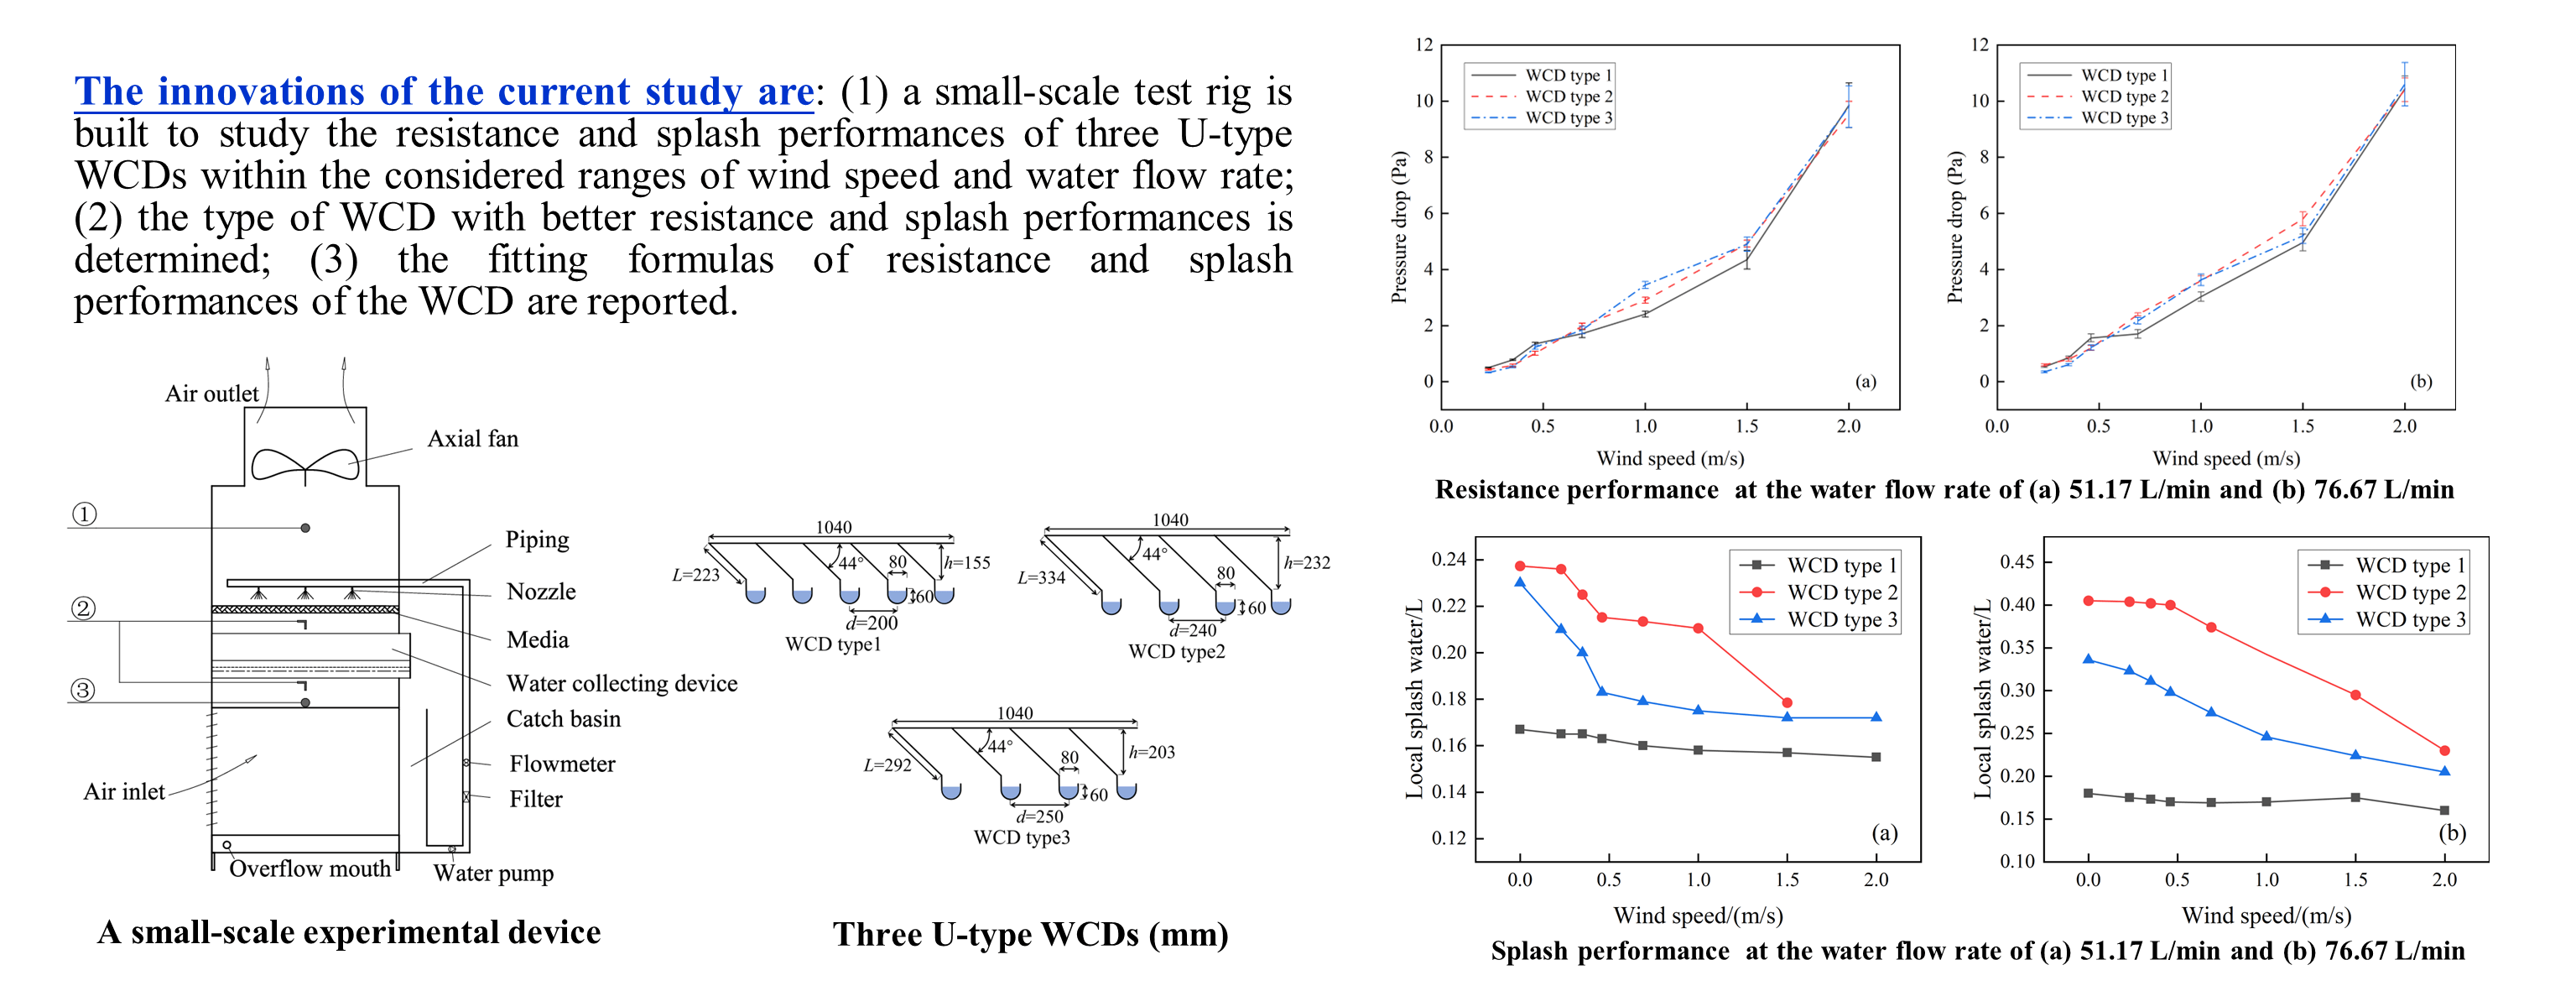
The current study investigates the feasibility of the application of high-level water collecting in a mechanical draft cooling tower, especially for the resistance and splash performances with respect to different WCDs, with the aim of providing guidance for the optimization of mechanical draft cooling towers using the WCDs. The innovations in the current study are: (1) a small-scale test rig is built to study the resistance and splash performances of three U-type WCDs within the considered ranges of wind speed and water flow rate; (2) the type of WCD with better resistance and splash performances is determined; (3) the fitting formulas of resistance and splash performances of the WCD are reported.
The aim of the current study is mainly to investigate the trend in the change of resistance and splash performances with respect to three different configurations of WCDs. It is difficult to conduct experimental design based on similarity criterion. Therefore, the model scale was designed as 1:10 based on the relative positions of the media, the WCD, the spray nozzle, the fan and other equipment of an original tower along the direction of the tower height.
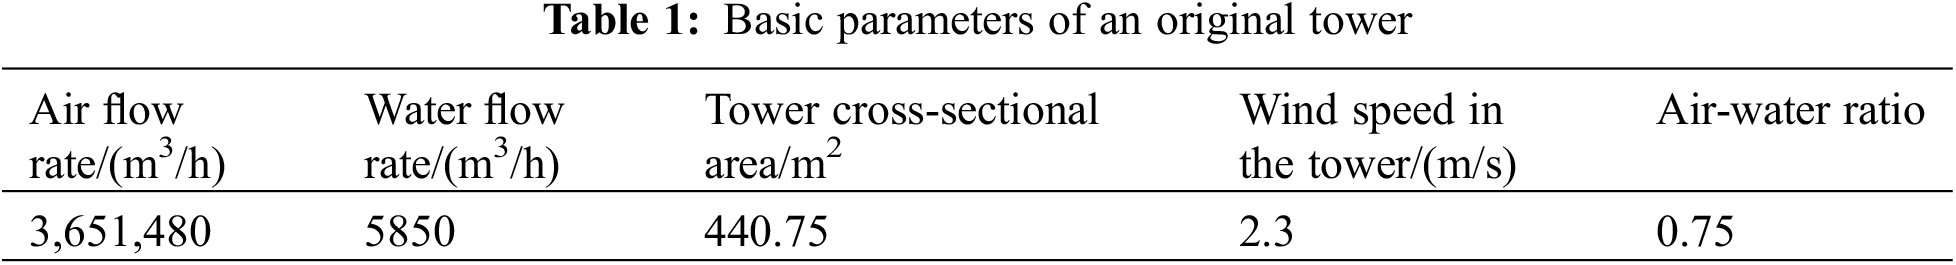
The experiments were conducted with an industrial mechanical draft cooling tower as the prototype, whose basic parameters are listed in Table 1. The dimension of scaled model of the mechanical draft cooling tower was 1.075 m × 1.075 m. The original tower had a water flow rate of 5850 ÷ 440.75 = 13.27 m3/(h⋅m2), where m2 meant the water flow rate was for unit spray area. Therefore, the water flow rate of the model tower was 13.27 × 1.075 × 1.075 = 15.34 m3/h. Since the WCD was scaled by a 1:10 ratio, the water flow rate of the model tower was reduced by 10 times. Therefore, the water flow of the model tower was 1.534 m3/h. The air flow of the model tower was 1.534 × 0.75 × 1000 ÷ 1.2 = 958.75 m3/h. Generally, the similarity criteria Re should be checked to keep similarity between the prototype and the test rig, which is difficult to abide by as the air speed of the model tower will be very high. Herein, the principle of equal air-water ratio was adopted as the criterion of similarity. It was noted that the air-water ratio referred to the ratio of air flow rate to water flow rate, which indicated the air mass required to cool every kilogram of water. The corresponding air speed was 2.3 ÷ 10 = 0.23 m/s when the model tower had the same air-water ratio as the original tower.
The water flow rate of the prototype tower was designed to match the cooling capability of a natural draft case. However, since the dimension of the mechanical draft cooling tower was much smaller than that of a natural draft cooling tower, it was necessary to increase water flow rate to make the water spray density match its cooling capability. To carry out study on the changing trend of resistance and splash performances of the WCDs within the considered ranges of wind speed and water flow rate, the water flow rates used in the experiments were set as 3.07 and 4.60 m3/h (i.e., 51.17 and 76.67 L/min), which were two and three times of the originally designed water flow rate (1.53 m3/h), respectively. The air speeds were set as 0.23, 0.35, 0.46, 0.69, 1.0, 1.5 and 2.0 m/s, among which the first four values of air speeds were equal to the air-water ratio of the original tower, and the last three values of air speeds were designed for large air-water ratio conditions to explore the changing trend of WCDs’ performance under large water spray densities.
The test rig mainly included an experimental box, a water circulation system, an air system, a circuit control system, and a measurement system. The cross-sectional dimension of the box was 1075 mm × 1075 mm and the total height was 2650 mm. To observe water distribution uniformity and measuring point arrangement, one sidewall of the box was encapsulated with an acrylic glass plate and the other three sidewalls were 304 steel plates. Media layer was replaced by a PVC material with triangular grids, and the thickness of the media layer was set as 0.5 cm. According to the dimension of the original WCD, U-shape WCD was designed based on the model scale of 1:10 with an inclined slab angle of 44°, a channel depth of 62 mm, and a channel width of 80 mm. The slab spacing of WCD type 1 was 200 mm, and the slab length was 223 mm. To ensure that the top point of the inclined plate of a WCD was in the same perpendicular line as the central point of the water collecting channel of the adjacent WCD, WCD type 2 and WCD type 3 were designed by reducing the row number of the water collector and adjusting the length of the inclined plate. The detailed dimensions are listed in Table 2, and the schematic diagram is shown in Fig. 1. It is noted that one end of the water collecting channel was blocked, and the other end was 65 mm beyond a catch basin, aiming to collect water.
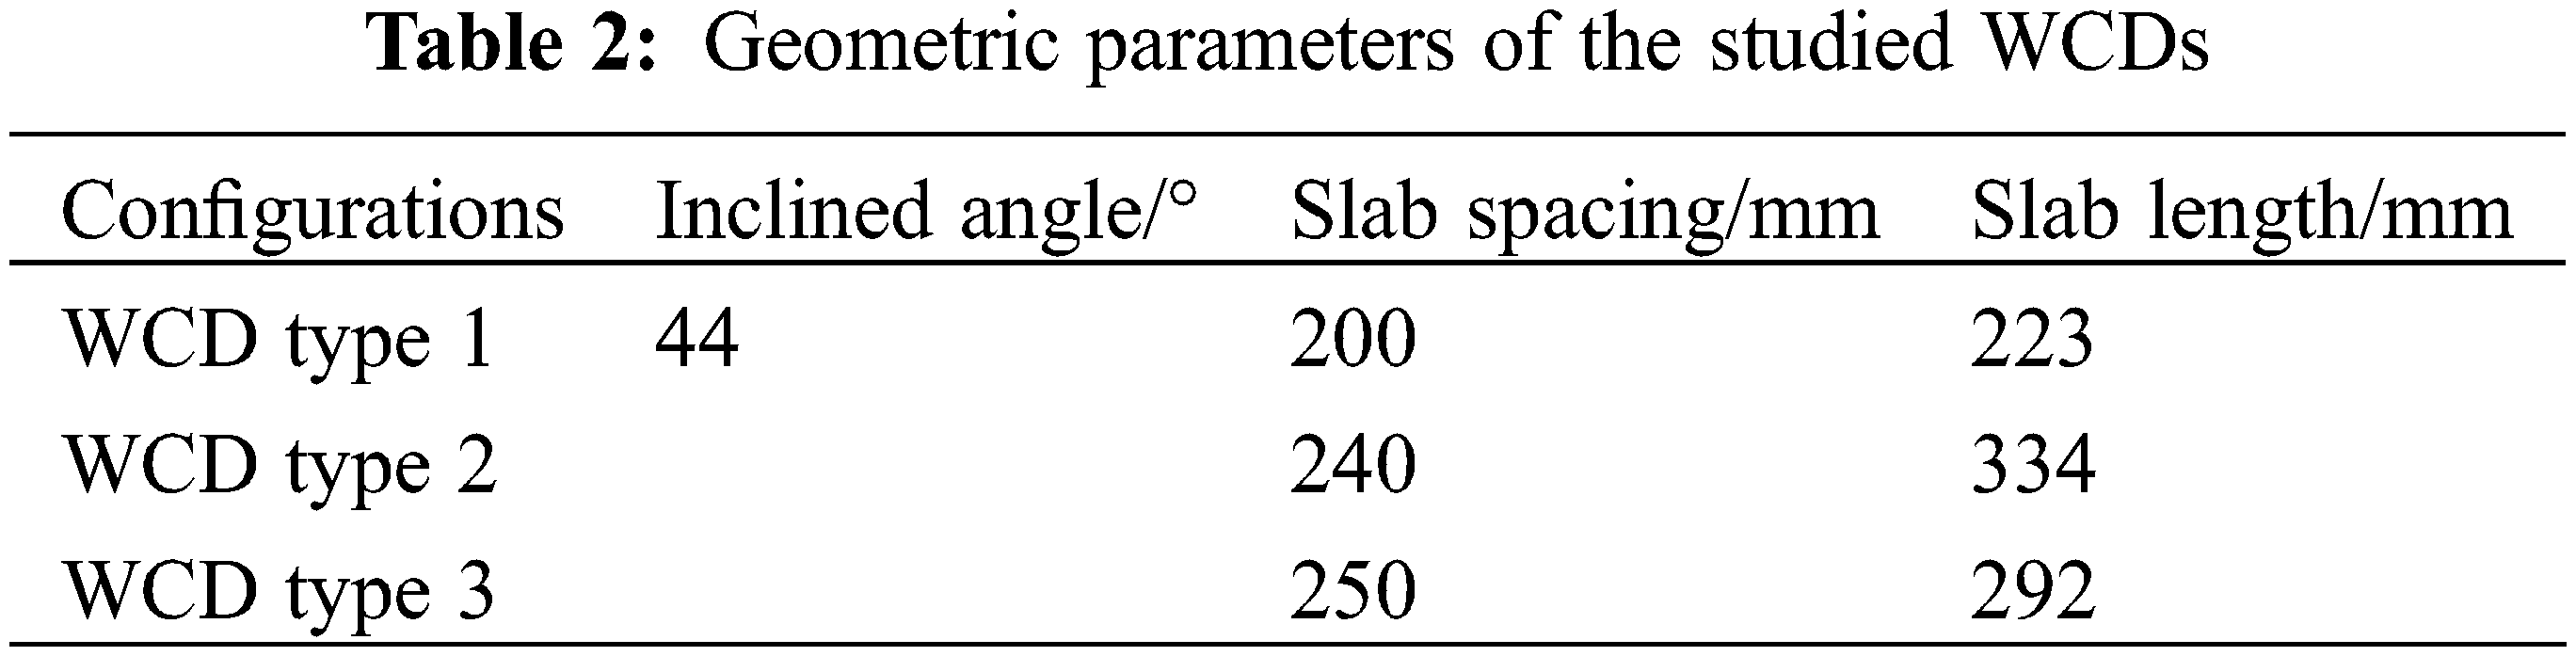
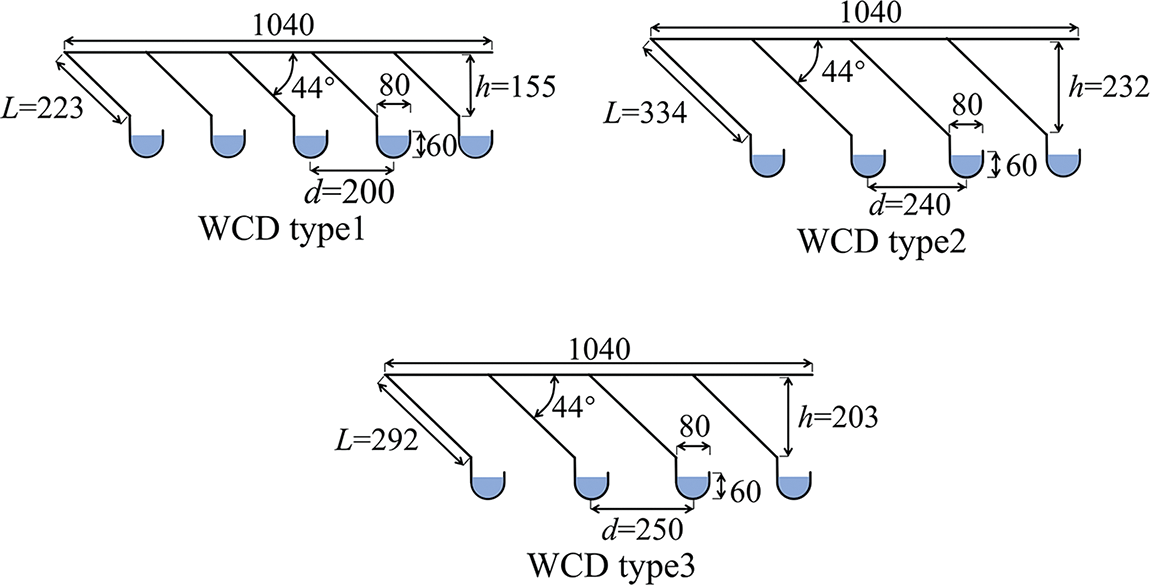
Figure 1: Three U-type WCDs (mm)
The circulating water system was mainly composed of a water pump, nozzle, pond and catch basin and other components, which were driven by a 100∼600 W (model: YL25WHBL2-20) pump and a 1500 W (model: DBZ15-50-1.5) pump as shown in Fig. 2. Water was transported from the water collecting tank to the nozzles by the pumps, then it was sprayed evenly to the surface of the media layer, and finally collected by the WCD and discharged into the water collecting tank. Part of the water droplet collided with the WCD and eventually splashed down to the pond at the bottom. The other part of water droplet was sprayed directly onto the wall of the box, and then flowed down the wall into the pond at the bottom of the box. In order to ensure homogenization of water spray density on the medium surface of the model tower, the number of nozzles was obtained by considering circulating water flow rate, nozzle flow, spray cone angle and installation height, and other factors, and the arrangement of nozzles was finally determined based on the above procedures. A 9-nozzle arrangement was set up for the need of homogenization under large water spray density conditions as shown in Fig. 3. In addition, the diameter of the distribution pipe was 25 mm.
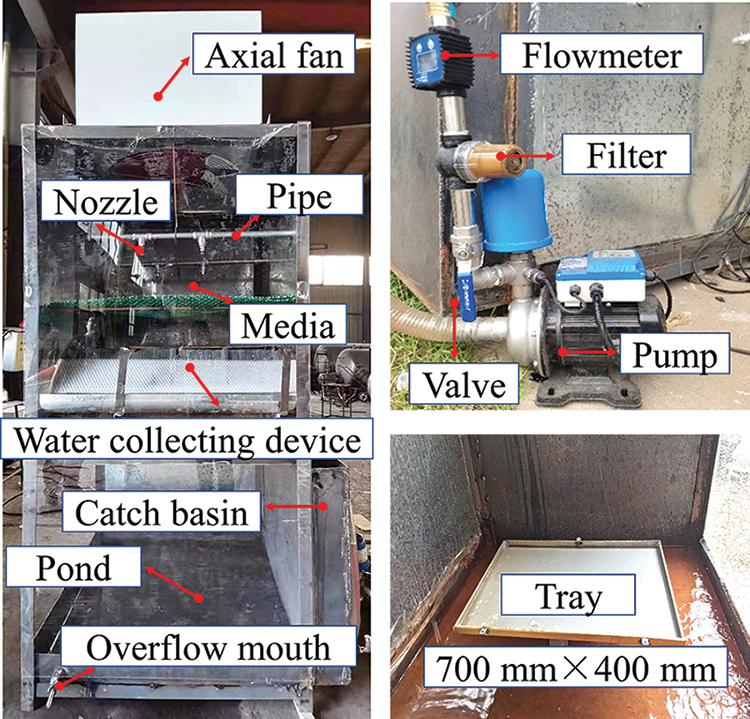
Figure 2: Experimental model
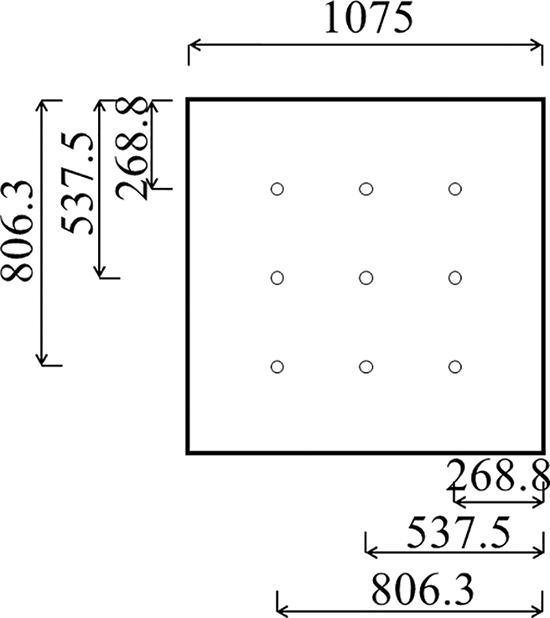
Figure 3: Nozzle arrangement (mm)
The air flow was mainly provided by an axial fan installed on the top of the experimental box. The maximum air speed was 5 m/s. The fan power was adjusted by using a variable frequency control box to achieve the required air speeds.
The measuring system included flow meters, measuring cylinders, pitot tubes, differential pressure sensors and hot wire anemometers, etc. Detailed information on experimental instruments is listed in Table 3. The measured parameters included water flow rate, air speed inside the tower, air-side pressure drop, and splash water volume. Calibration of the instrument was mainly carried out for the air speed by comparing data measured by the anemometer with the dynamic pressure measured by the differential pressure sensor. The relationship between the air speed and the dynamic pressure was u2 = 2ΔP/ρ. Twice readings were required for each measuring point to obtain averages for the recorded data.
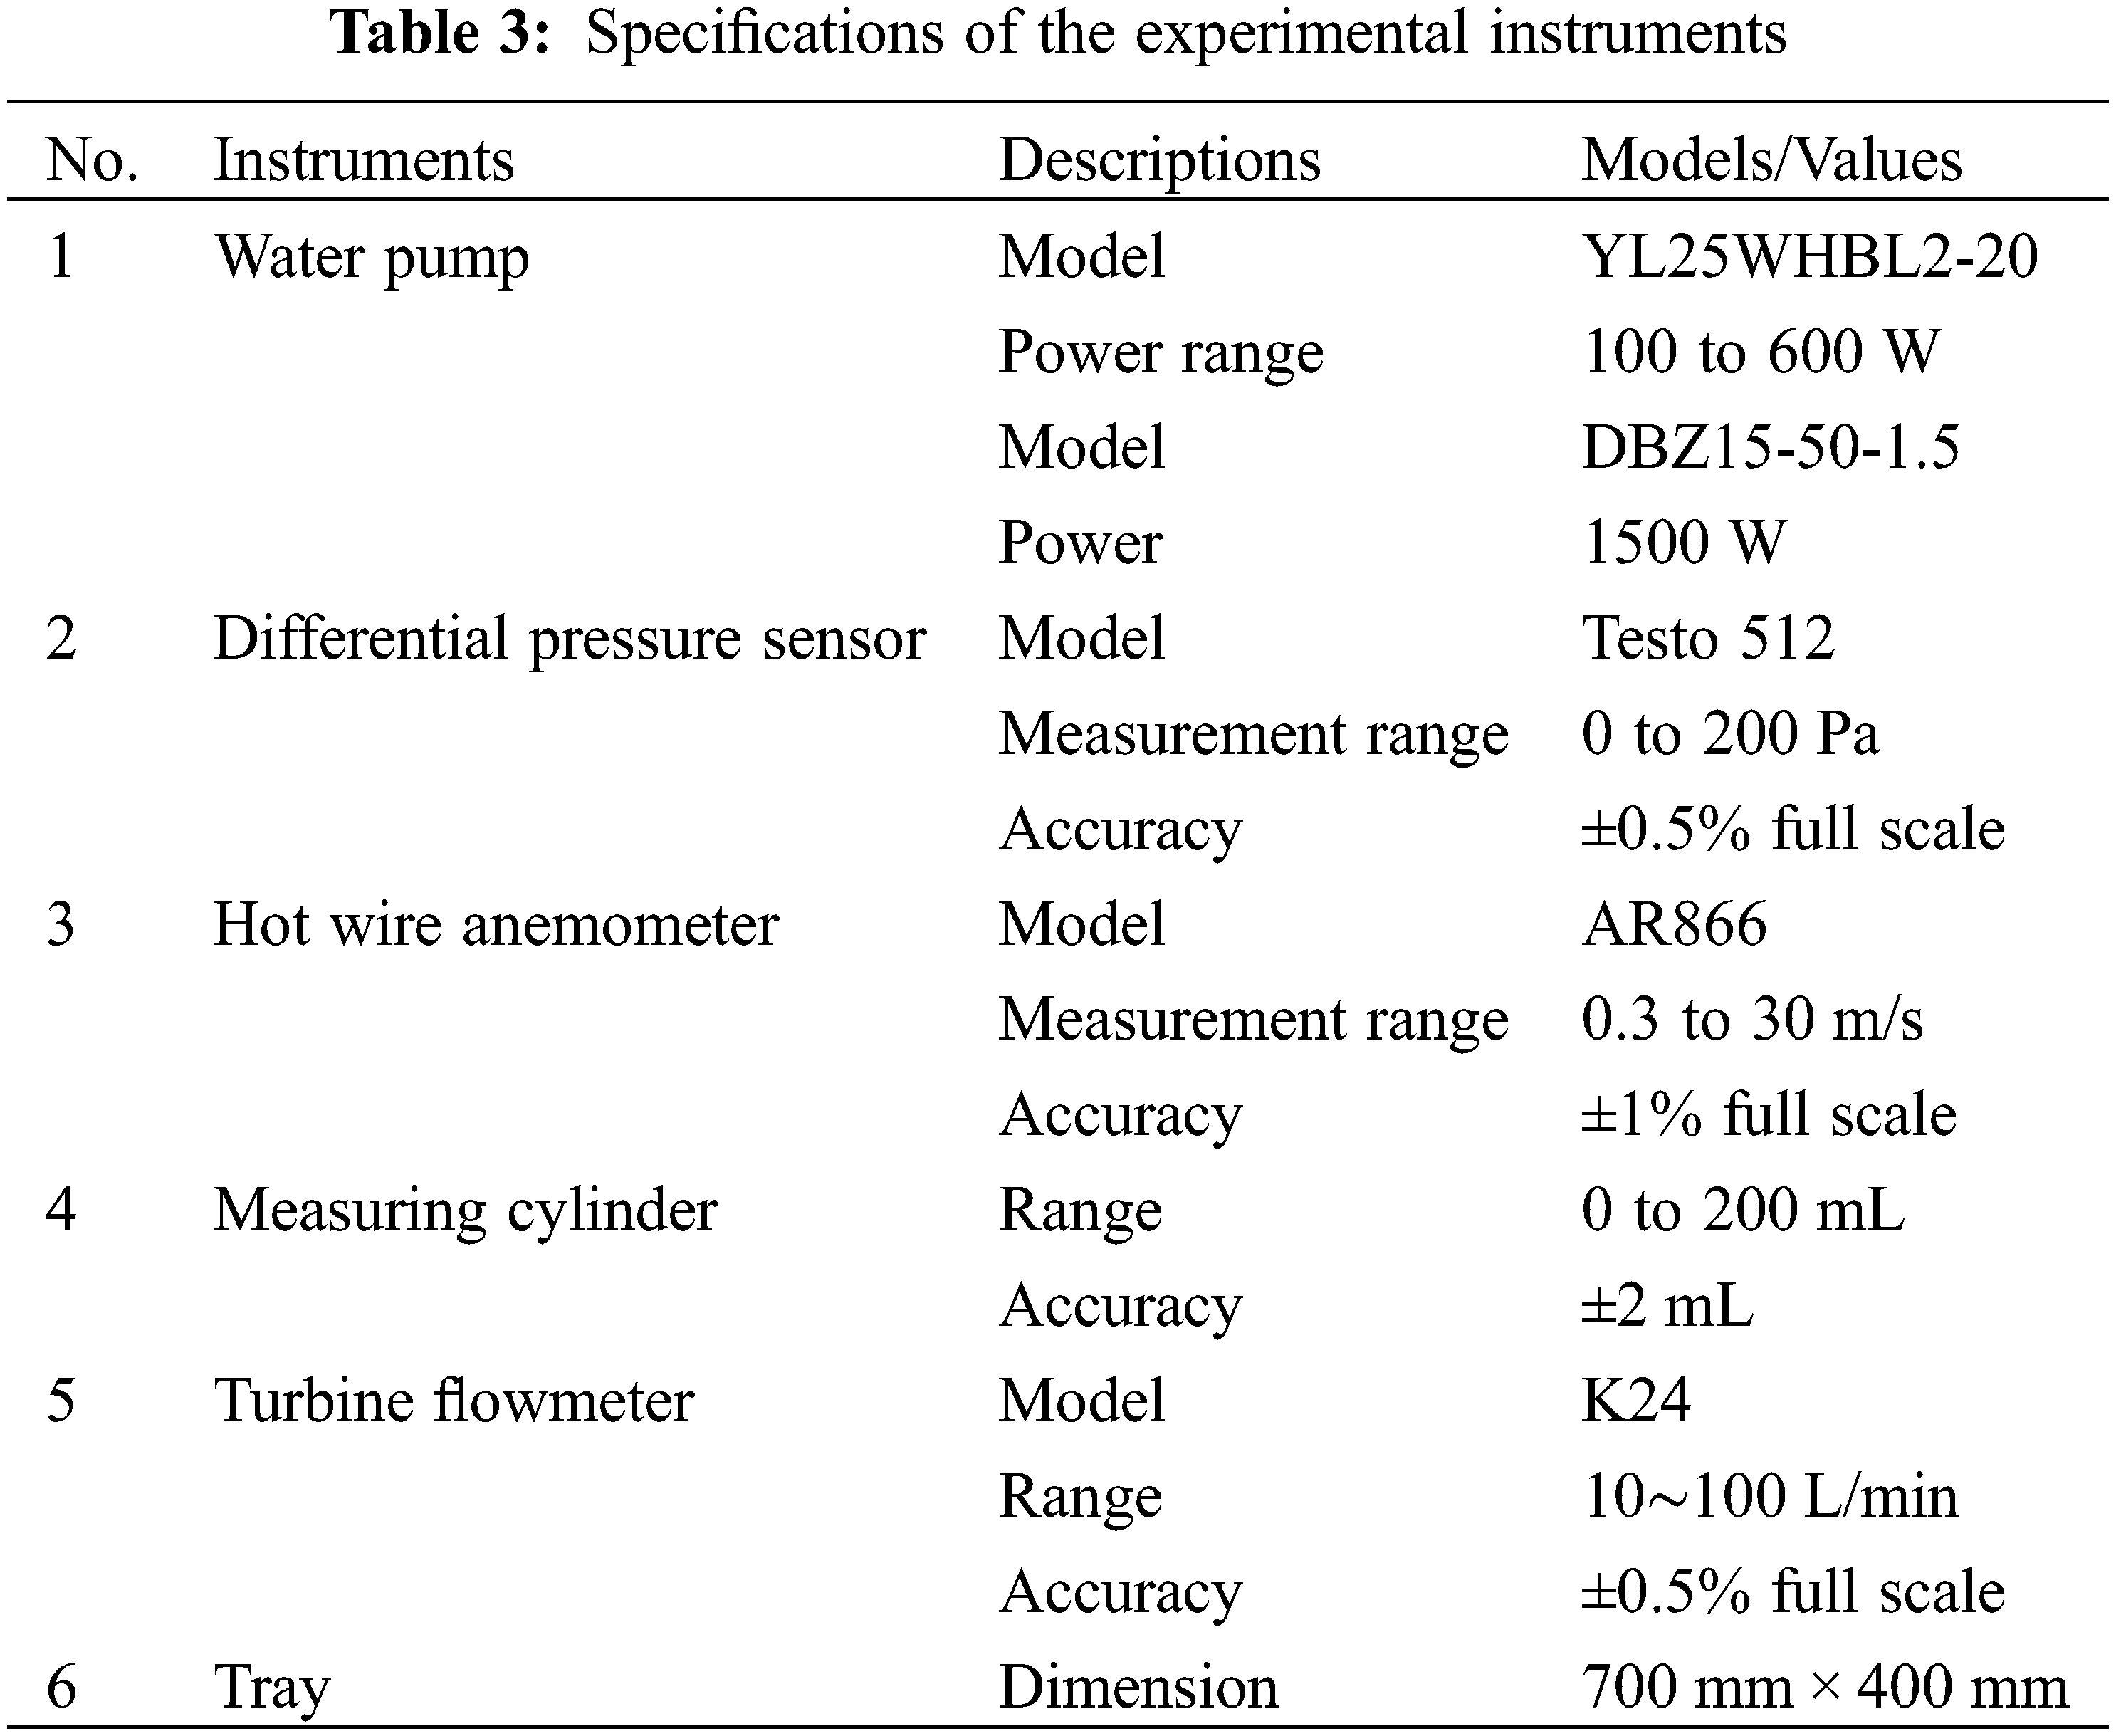
Fig. 4 shows the arrangement of measuring points. Among them, ① is the outlet wind speed measurement point. ② is the pressure measurement point. ③ is the inlet wind speed measurement point.
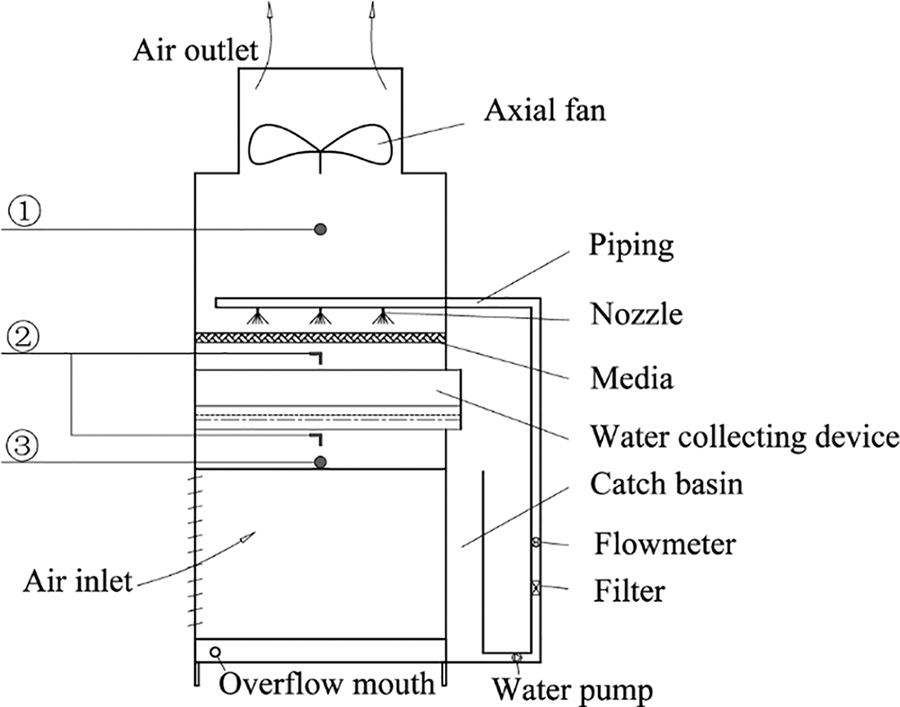
Figure 4: Arrangement of measuring points
The resistance performance of the WCD referred to the air-side pressure drop when air flowed through the WCD model. Twelve measuring points were arranged above the WCD, and twelve measuring points were arranged below the WCD. The measuring points below the WCD was 1100 mm high from the bottom of the model and the measuring points above the WCD was 1425 mm high from the bottom of the model. The average value of the twelve measuring points was taken as the final value for the air-side pressure drop. The measuring points of inlet air speed were located at the height of 940 mm from the bottom of the model, and the inlet air speed was calculated by the average value of six measuring points. The measuring points of outlet air speed were located at the height of 1960 mm from the bottom of the model, and the outlet air speed was calculated by the average value of six measuring points.
The splash performance of the WCD referred to the splash water volume of the WCD. To distinguish the splash water volume from the water volume flowing down from the wall, a rectangular tray was placed at the bottom center of the box as shown in Fig. 2. The splash water collected by the small tray was defined as local splash water. It was necessary to evenly soak the surface of the tray before its application. A continuous running of the setup for 10 min before test was required once the air speed or water flow rate was changed to ensure the measurement s carried out under stable working conditions. The tray was placed at the center of the pond for 5 min for each measurement. The water collected by the tray was poured into a measuring cylinder to measure its volume.
It was ensured that the box was sealed, water was sufficient, and the electrical connection was checked before test. The fan was started and adjusted using the fan frequency control box to control the air speed inside the box. The pump was started and the control valve was used to adjust the water flow rate to the required values. Ensuring that the experimental conditions were stable, the relevant measurements, including air-side pressure drop, local splash water and wind speed and other important experimental parameters were then taken.
3.1 Resistance Performance Analysis
The effect of air speed on resistance performance of the studied WCDs under two large water flow conditions (i.e., 51.17 and 76.67 L/min) is experimentally studied and reported in Fig. 5. The results show that the same changing trend occurs when the pressure drop of the three WCDs varies with air speed. In the same water flow rate case, the pressure drop of WCD increases with the increase in the air speed, which is similar to the results reported by He et al. [27]. Note that a natural draft wet cooling tower was studied in He et al. [27] research rather than a mechanical draft cooling tower.
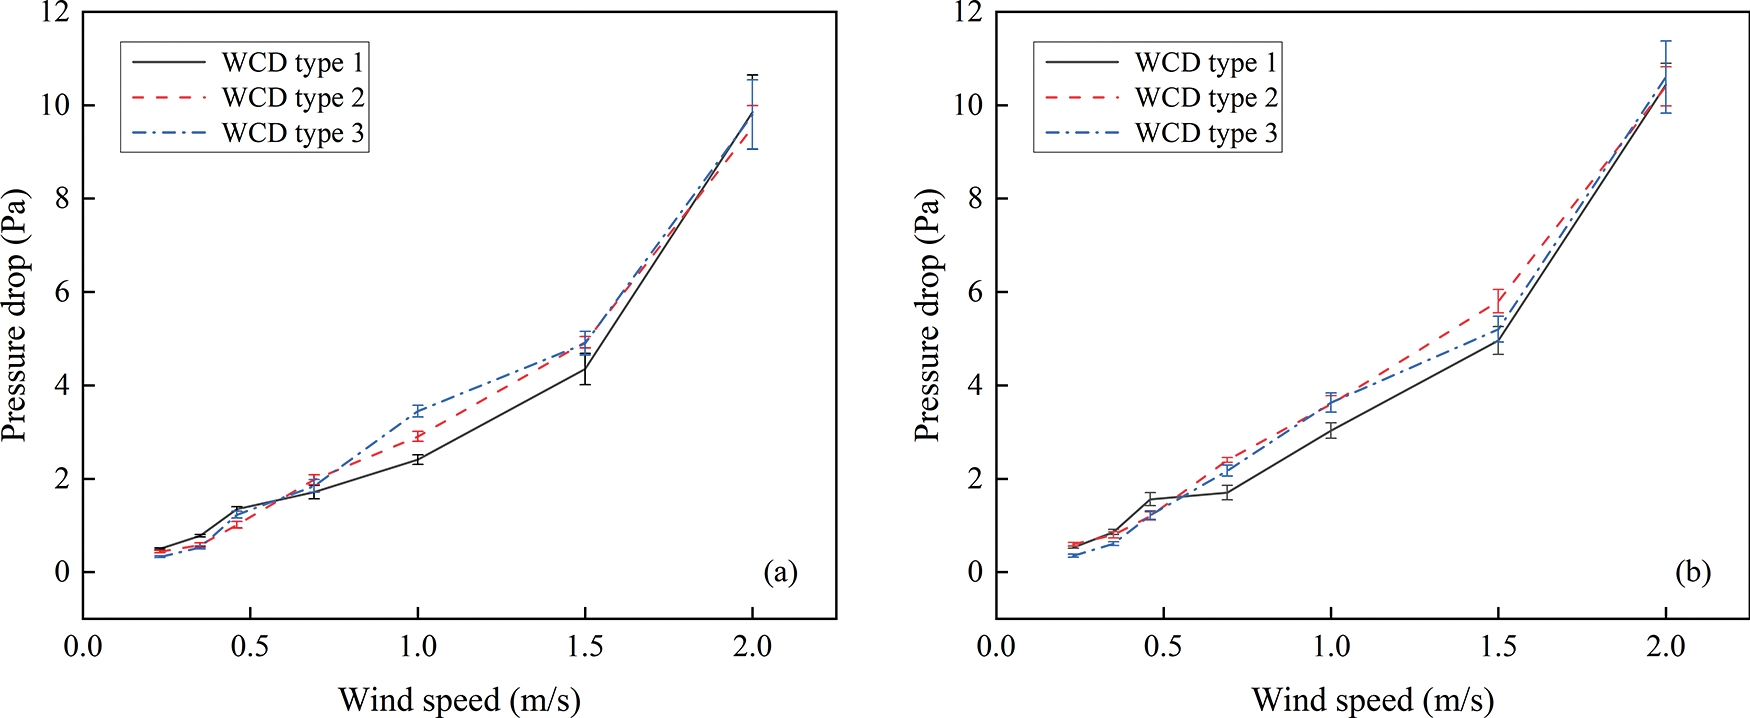
Figure 5: Variation of resistance at different air speeds (mean ± standard error), (a) water flow rate of 51.17 L/min, (b) water flow rate of 76.67 L/min
The resistance of the WCDs of type 2 and type 3 are similar at the same air speed, and they are both greater than that of the WCD type 1, especially within the air speed range of 1.0–1.5 m/s. The pressure drop values of the WCD types 1, 2 and 3 at the air speed of 1.0 m/s are 2.4, 2.9 and 3.6 Pa, respectively for a water flow rate of 51.17 L/min. The pressure drop values of the WCD types 1, 2 and 3 at the air speed of 1.5 m/s are 4.4, 4.9 and 4.9 Pa, respectively. The pressure drop values of the WCD types 1, 2 and 3 at the air speed of 1.0 m/s are 3.0, 3.6 and 3.6 Pa respectively for a water flow rate of 76.67 L/min. The pressure drop values of the WCD types 1, 2 and 3 at the air speed of 1.5 m/s are 4.9, 5.8 and 5.2 Pa, respectively. Considering the structural dimension of the WCD, the spacing of the water collecting slab of the WCD type 1 is 200 mm and the length of the water collecting slab is 223 mm. The water collecting slab of the WCD type 2 is 240 mm and the length of the water collecting slab is 334 mm. The water collecting slab of the WCD type 3 is 250 mm and the length of the water collecting slab is 292 mm. Although the spacing of the water collecting slab of the WCD type 1 is small, and results in a small airflow channel and relatively large flow resistance, the length of the collecting slab is also small, and the frictional resistance of the collecting slab is small, which finally leads to its smallest resistance among the studied WCDs. The resistance of the WCD types 2 and 3 is similar under the combined effect of the spacing and the length of the water collecting plate. Both the spacing and the length of the water collecting slab have effects on the resistance performance to some extent.
Comparing Figs. 5a and 5b, the pressure drop of the WCD increases slightly with the increase in water flow rate. In the case of air speed of 1.5 m/s, the pressure drop values of the three WCDs range from 4.4 to 4.9 Pa at a water flow rate of 51.17 L/min, and ranges from 5.0 to 5.8 Pa at a water flow rate of 76.67 L/min.
3.2 Splash Performance Analysis
As mentioned above, a small rectangular tray was placed at the bottom center of the experimental box to measure the local splash volume for a duration of 5 min. Fig. 6 shows the effect of air speed on the local splash volume of the three WCDs with respect to large water flow conditions at 51.17 and 76.67 L/min. The data indicate that the local splash volumes of the three WCDs decrease with the increase in air speed, which is due to the fact that the air speed changes the trajectory of small-size droplets and the airflow entraining small-size droplets moves upward, reducing the splash volume. At the same air speed and water flow rate, the WCD type 2 has the maximum splash water volume, followed by the type 3, and type 1 has the least. Within the studied air speed range and at a water flow rate of 51.17 L/min, the average local splash volume of the WCD type 1 is 0.16 L. The average local splash volume of the WCD type 2 is 0.22 L (which is 34% higher than that of the WCD type 1). The average local splash volume of the WCD type 3 is 0.19 L (which is 18% higher than that of the WCD type 1). Within the studied air speed range and at a water flow rate of 76.67 L/min, the average local splash volume of the WCD type 1 is 0.17 L. The average local splash volume of the WCD type 2 is 0.37 L (which is 118% higher than WCD type 1). The average local splash volume of the WCD type 3 is 0.28 L (which is 62% higher than WCD type 1). Comparing Figs. 6a and 6b, it can be seen that the local splash volumes of all three WCDs tend to increase as the water flow rate increases.
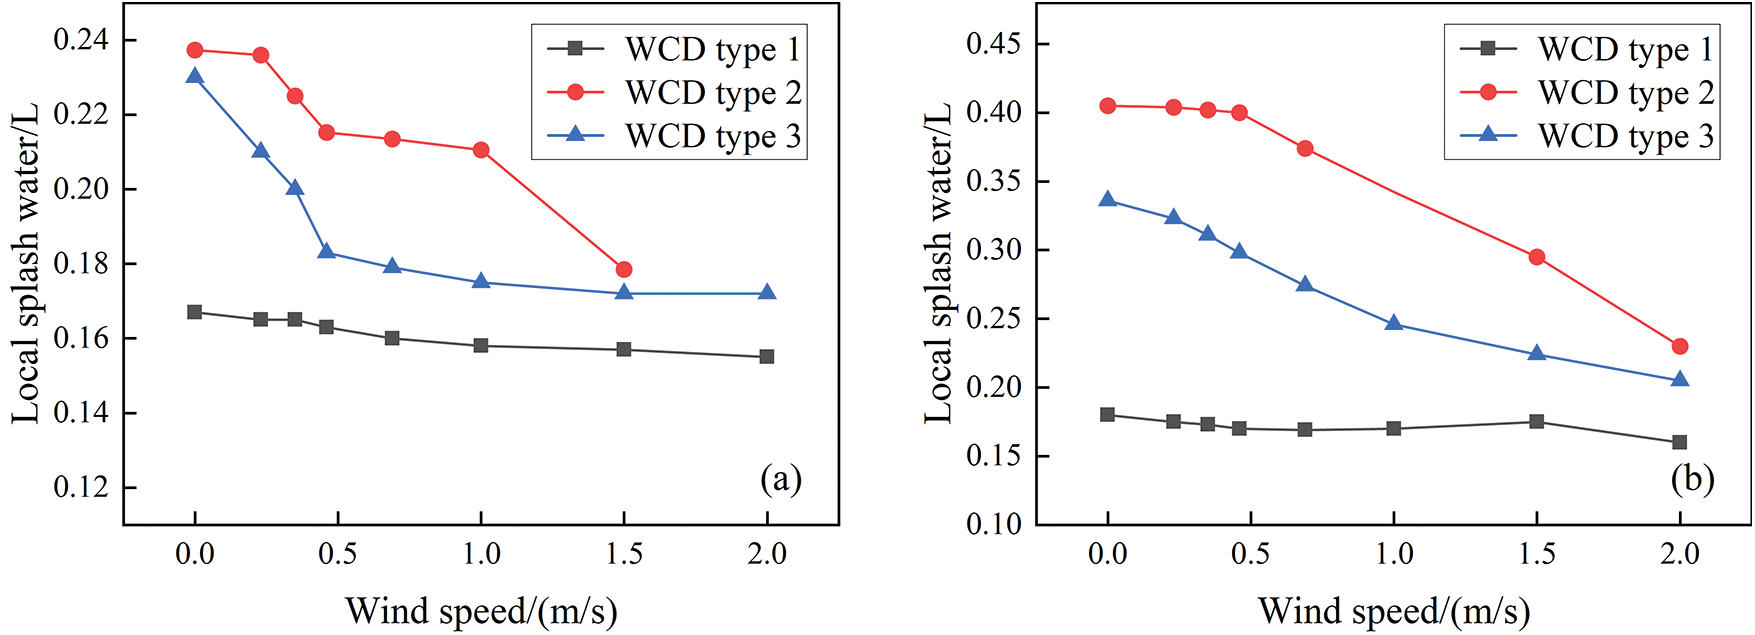
Figure 6: Variation of splash water at different air speeds, (a) water flow rate of 51.17 L/min, (b) water flow rate of 76.67 L/min
Based on comparative study of the resistance and splash performances of the three configurations of U-shape WCDs within the considered ranges of wind speed and water flow rate. It can be seen that the WCD type 1 is better than the WCD types 2 and 3 in terms of the resistance and local splash performances. Therefore, the configuration of the WCD type 1 is recommended when the mechanical draft cooling tower is using WCDs.
The experiment consisted of six measuring points of air speed and twelve measuring points of differential pressure. To reduce the measuring error, the arithmetic mean was taken as the experimental data, which had a smaller dispersion degree when compared with a single measurement [28]. The standard deviation of the mean value was used as the evaluation index of the dispersion degree, which was calculated by the following formula. The results are listed in Table 4.
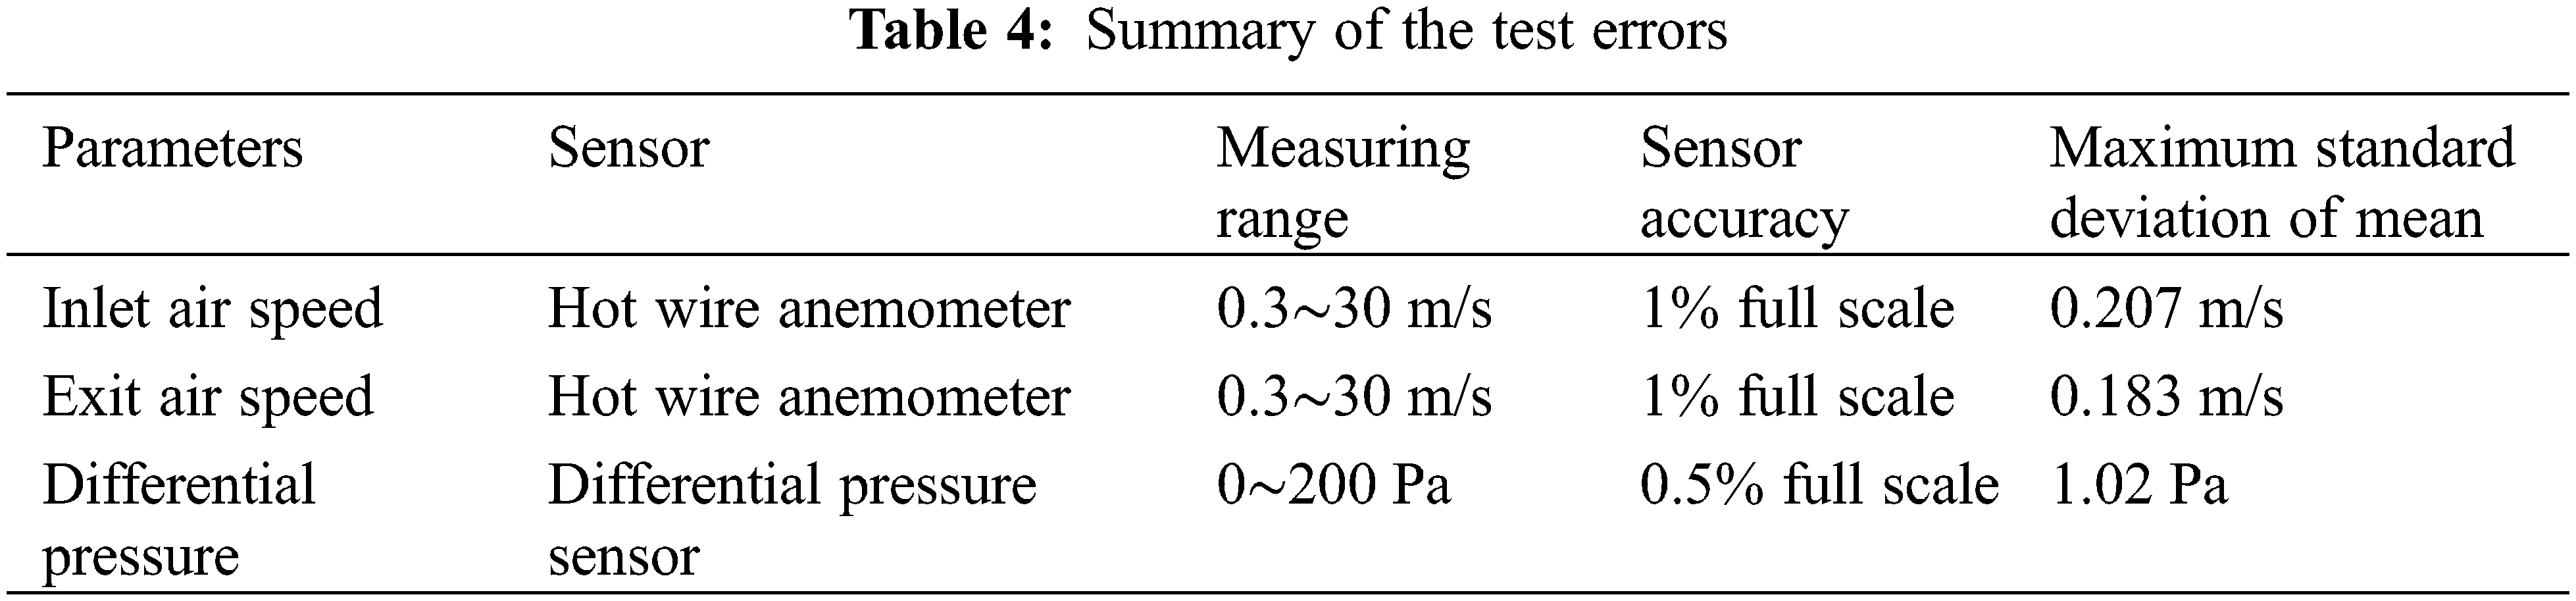
where σmean is the standard deviation of mean. s is the standard deviation. Xmean is the arithmetic mean corresponding to each group of measurements, Xmean = (X1 + X2 +…+ Xn)/n. n is the number of measuring points.
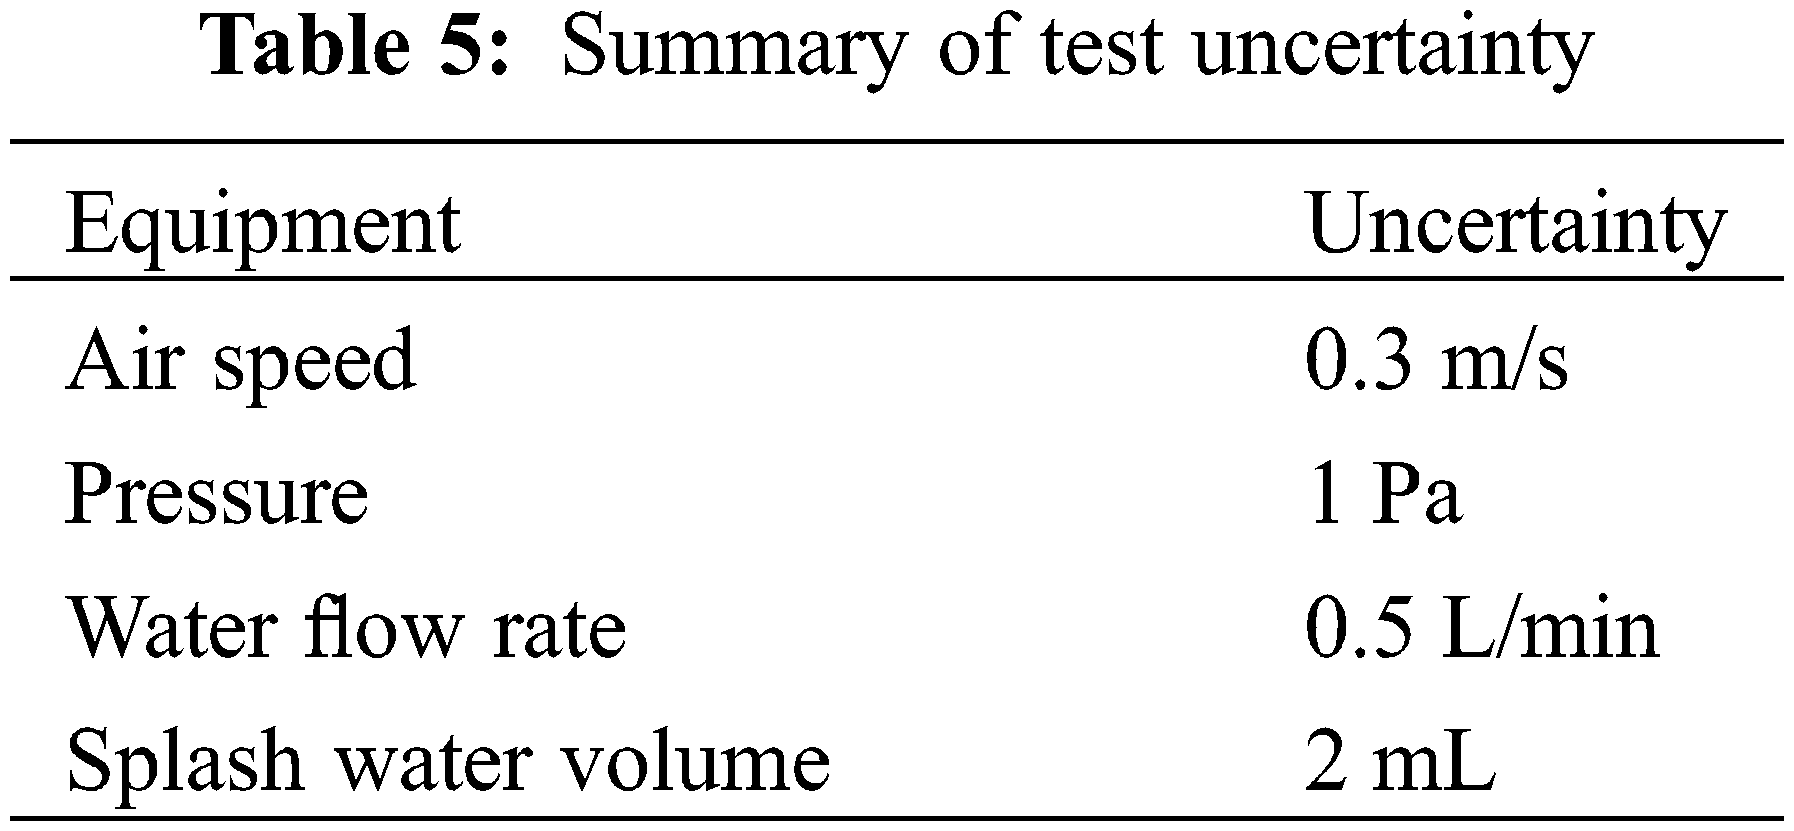
The measuring parameters include water flow rate, air speed inside the tower, air-side pressure drop and splash water volume. There is no propagation of uncertainty of a variable to another. According to Baloch et al. [29], the total uncertainty (U) of the test rig can be calculated based on Eq. (3) by integrating individual errors (w1) of each part. The summary of test uncertainty is reported in Table 5.
4 Correlations of Resistance and Splash Performance
4.1 Correlation of Resistance Performance
The air-side pressure drop ΔP (Pa) of the WCD was mainly subject to the geometric parameter of WCD, air speed and water flow rate. Besides, the air density was also considered for the dimensional analysis. Usually, the relationship between the resistance performance (i.e., air-side pressure drop ΔP) and the resistance coefficient (f) is ΔP = (f × ρu2)/2. ρ is air density, and u is air speed. Considering the fact that the WCD had the same operating condition as fills inside a wet cooling tower, the fill resistance coefficient used in the reference [30] was adopted for the current paper, i.e., Eq. (4).
where C1 and C2 are constants. Gw and Ga are water and air mass flow rate per m2, respectively, kg/(m2⋅s).
The pressure drop correlation of the WCD was obtained based on the dimensional analysis and regression analysis of the experimental data. The effect of water conditions on the resistance performance was also considered in Eq. (5).
where ΔP is the air-side pressure drop when the air flows through WCD, Pa. L is the length of collecting slab, m. d is the spacing of collecting slab, m. h is the vertical height of collecting slab, m. u is air speed, m/s. Lps is the vertical distance between nozzles and collecting tank, m, the value is 0.543 m in the current paper. qw is water flow rate, m3/s. qa is air flow rate, m3/s.
4.2 Correlation of Splash Performance
The local splash water Qsw (m3/s) of the WCDs was mainly subject to the geometric parameter of WCDs, air speed and water flow rate. Besides, the effect of Reynolds number was also considered for the dimensional analysis. The correlation equation of the local splash performance of the WCD was obtained based on the concept of air-water ratio commonly used in cooling tower analyses.
where Qsw is local splash water, m3/s. S is the measuring area of splash performance, m2, its value is 0.28 m2. Re is Reynolds number.
4.3 Validation of Correlations
The correlations of resistance and splash performances were validated by calculating the pressure drop (ΔP) and local splash water (Qsw) under the same operating conditions as mentioned in Sections 4.1 and 4.2. Fig. 7 reports the parity plot of measured and predicted values of pressure drop and local splash water. The deviations of most of the predicted ΔP are less than ±10%. In practice, the maximum errors occur under conditions with small flow resistance, which is close to the sensor accuracy, resulting in a relatively large mean absolute percentage error (MAPE). The MAPE is given in Fig. 7a with a value of 15.7%. As for the local splash water, most of the predicted Qsw have deviations under ±20%. The MAPE is given in Fig. 7b with a value of 11.0%.
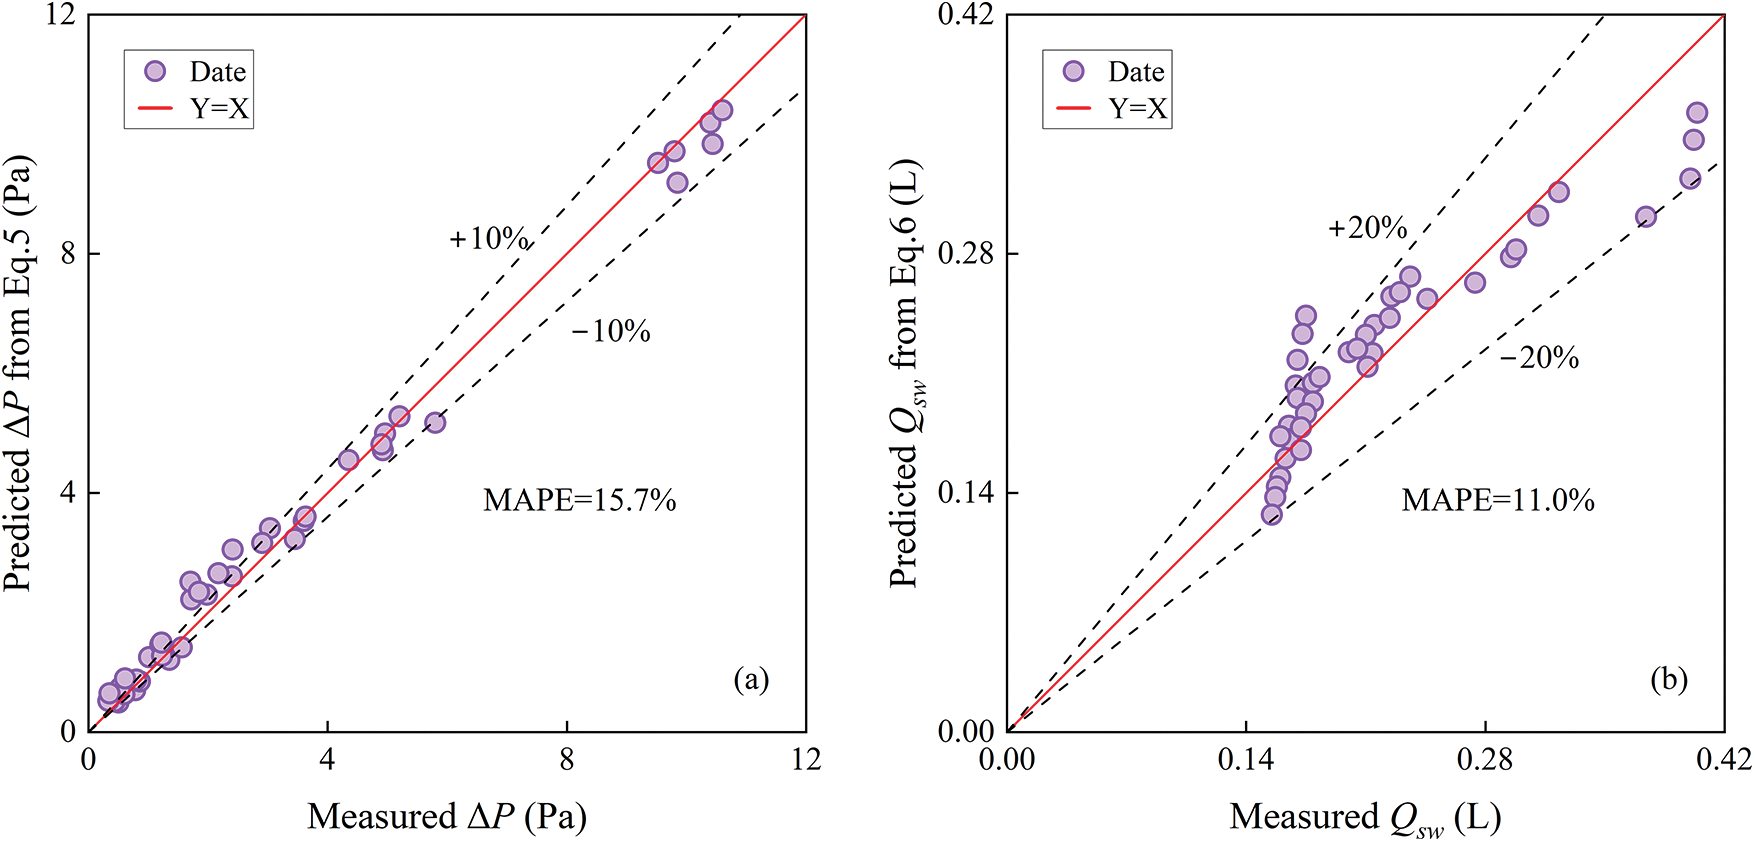
Figure 7: Validation of resistance and splash performance correlations, (a) pressure drop and (b) local splash water
A small-scale tower was built taking a real cooling tower as the prototype based on the criteria of relative positions of the main components along the tower height and the same air-water ratio. The resistance and splash performances of three U-type WCDs within the considered ranges of wind speed and water flow rate were experimentally studied. The correlations of resistance and splash performances were obtained. The following conclusions can be drawn:
(1) The pressure drop values of the WCDs of type 2 and type 3 are similar and both are greater than that of the type 1. Within the considered ranges of wind speed and water flow rate, the pressure drop of the WCD of type 2 can be up to 0.8 Pa higher than that of the type 1, and the pressure drop of type 3 can be up to 1.0 Pa higher than that of the type 1.
(2) The local splash volume of the WCD type 2 is the highest, followed by the type 3, and the type 1 is the lowest. Within the considered ranges of wind speed and water flow rate, the local splash volume of the WCD of type 2 can be up to 0.23 L higher than that of the type 1, and the local splash volume of the type 3 can be up to 0.16 L higher than that of the type 1.
(3) The WCD type 1 is superior to the WCD types 2 and 3 with the consideration of both resistance and local splash performances. Therefore, the WCD type 1 is recommended when the mechanical draft cooling tower is using WCDs.
(4) The fitting formulas of resistance and splash performances of WCD are reported based on the regression analysis of experimental data. The fitting formulas provide a guide for the optimal design of U-type WCDs applied in mechanical draft cooling towers.
Although the prediction correlations have been validated, the limitations of engineering applications are still unresolved. It is recommended to conduct future work on filed tests to validate or modify the correlations.
Acknowledgement: The authors would like to thank the reviewers and editors for their useful suggestions for the improvement in the quality of our manuscript.
Funding Statement: This work was supported by the Shandong Natural Science Foundation (Grant No. ZR2022ME008), the Shenzhen Science and Technology Program (KCXFZ20201221173409026), the Young Scholars Program of Shandong University (YSPSDU, No. 2018WLJH73), the Open Project of State Key Laboratory of Clean Energy Utilization, Zhejiang University (Program No. ZJUCEU2020011) and the Shandong Natural Science Foundation (Grant No. ZR2021ME118).
Conflicts of Interest: The authors declare that they have no conflicts of interest to report regarding the present study.
References
1. Li, X., Lin, W., Yan, J., Wen, H. (1997). To analyze energy-saving potential of cooling tower. Electric Power, 30(10), 34–36. [Google Scholar]
2. Hou, H. (2017). Discussion on energy-saving technology of cooling tower. Energy Research and Information, 33(1), 28–32. [Google Scholar]
3. Javadpour, R., Heris, S. Z., Mohammadfam, Y., Mousavi, S. B. (2022). Optimizing the heat transfer characteristics of MWCNTs and TiO2 water-based nanofluids through a novel designed pilot-scale setup. Scientific Reports, 12, 15154. https://doi.org/10.1038/s41598-022-19196-3 [Google Scholar] [PubMed] [CrossRef]
4. Javadpour, R., Heris, S. Z., Mohammadfam, Y. (2021). Optimizing the effect of concentration and flow rate of water/MWCNTs nanofluid on the performance of a forced draft cross-flow cooling tower. Energy, 217, 119420. https://doi.org/10.1016/j.energy.2020.119420 [Google Scholar] [CrossRef]
5. Imani-Mofrad, P., Heris, S. Z., Shanbedi, M. (2018). Experimental investigation of the effect of different nanofluids on the thermal performance of a wet cooling tower using a new method for equalization of ambient conditions. Energy Conversion and Management, 158, 23–35. https://doi.org/10.1016/j.enconman.2017.12.056 [Google Scholar] [CrossRef]
6. Imani-Mofrad, P., Heris, S. Z., Shanbedi, M. (2016). Experimental investigation of filled bed effect on the thermal performance of a wet cooling tower by using ZnO/water nanofluid. Energy Conversion and Management, 127, 199–207. https://doi.org/10.1016/j.enconman.2016.09.009 [Google Scholar] [CrossRef]
7. Bakhtiyar, N. K., Javadpour, R., Heris, S. Z., Mohammadpourfard, M. (2022). Improving the thermal characteristics of a cooling tower by replacing the operating fluid with functionalized and non-functionalized aqueous MWCNT nanofluids. Case Studies in Thermal Engineering, 39, 102422. https://doi.org/10.1016/j.csite.2022.102422 [Google Scholar] [CrossRef]
8. Wang, F. (2017). Application research on large counter-flow natural draft high-level water collecting cooling tower. Southern Energy Construction, 4, 109–112. [Google Scholar]
9. Yang, Y., Zhou, Z., Fan, C. (2017). Analysis on energy-saving of high-level water collecting cooling tower. Shanxi Electric Power, 2, 58–61. [Google Scholar]
10. Zhao, Y., Sun, F., Long, G., Huang, X., Huang, W. et al. (2016). Comparative study on the cooling characteristics of high level water collecting natural draft wet cooling tower and the usual cooling tower. Energy Conversion and Management, 116, 150–164. https://doi.org/10.1016/j.enconman.2016.02.071 [Google Scholar] [CrossRef]
11. Jiang, L., Dang, Z., Gao, M., Sun, F., Zhou, H. et al. (2019). Field test on water spray noise for high-level tower and conventional wet cooling tower. Acoustics Property, Test and Material, (10), 135–138. https://doi.org/10.3969/j.issn.1006-5377.2019.10.032 [Google Scholar] [CrossRef]
12. Qiao, R., He, H. (2016). Discussion of the super high-level water collecting cooling tower and the conventional tower about thermal performance research and optimization. Southern Energy Construction, 3(2), 141–145. [Google Scholar]
13. Gao, D., Guo, F., Song, X. (2017). Numerical study on the performance of a natural draught cooling tower with cooled water collectors. Journal of China Institute of Water Resources and Hydropower Research, 15(6),449–454. [Google Scholar]
14. Jin, X., Xie, H., Ni, J., Wang, Z. (1993). Design of the high-level water collecting cooling tower. Electric Power, (6), 39–43. [Google Scholar]
15. Fei, Q. (2014). Applications and challenges of cooling tower in China. Electric Power Survey & Design, (22), 29–33. https://doi.org/10.3969/j.issn.1671-9913.2014.02.015 [Google Scholar] [CrossRef]
16. Li, Y. (2015). Economic comparison between conventional tower and high tower. Huadian Technology, 37(7), 38–39. https://doi.org/10.3969/j.issn.1674-1951.2015.07.012 [Google Scholar] [CrossRef]
17. Wu, Y. (2015). Numerical simulation of 3D thermal characteristics of natural draft high water harvesting cooling tower and optimization study of water harvesting device. Shandong University, Jinan, China. [Google Scholar]
18. Lyu, D., Sun, F., Zhao, Y. (2016). Experimental study on the air flow field in the water collecting devices. Applied Thermal Engineering, 105, 961–970. https://doi.org/10.1016/j.applthermaleng.2016.01.124 [Google Scholar] [CrossRef]
19. Zhao, Y., Sun, F., Long, G., Huang, X., Huang, W. et al. (2016). Comparative study on the cooling characteristics of high-level water collecting natural draft wet cooling tower and the usual cooling tower. Energy Conversion and Management, 116, 150–164. https://doi.org/10.1016/j.enconman.2016.02.071 [Google Scholar] [CrossRef]
20. Javadpour, R., Heris, S. Z., Meyer, J. P. (2022). Experimental study of the effect of filled bed type on the performance of a cross-flow cooling tower with the approach of using nanofluids. Energy Reports, 8, 8346–8360. https://doi.org/10.1016/j.egyr.2022.06.027 [Google Scholar] [CrossRef]
21. Feng, J., An, Y., Guan, X., Song, K. (2017). A CFD study on water collecting devices’ resistance characteristics of the cooling tower with water collecting device. Electric Power Survey & Design, (S1), 288–291. https://doi.org/10.13500/j.cnki.11-4908/tk.2017.s1.061 [Google Scholar] [CrossRef]
22. Gao, M., Zou, J., He, S., Sun, F. (2018). Thermal performance analysis for high-level water collecting wet cooling tower under crosswind conditions. Applied Thermal Engineering, 136, 568–575. https://doi.org/10.1016/j.applthermaleng.2018.03.043 [Google Scholar] [CrossRef]
23. Lyu, D., Sun, F., Zhao, Y., Gao, M., Zhang, X. (2018). Research on the Air flow field inside the water collecting devices of the cooling tower with the WCDs. Proceedings of the Society for Electrical Engineering, 38(1), 212–222. [Google Scholar]
24. He, S., Zhang, Z., Gao, M., Sun, F., Lucas, M. et al. (2019). Experimental study on the air-side flow resistance of different water collecting devices for wet cooling tower applications. Journal of Wind Engineering and Industrial Aerodynamics, 190, 53–60. https://doi.org/10.1016/j.jweia.2019.04.012 [Google Scholar] [CrossRef]
25. Singh, K., Das, R. (2016). A feedback model to predict parameters for controlling the performance of a mechanical draft cooling tower. Applied Thermal Engineering, 105, 519–530. https://doi.org/10.1016/j.applthermaleng.2016.03.030 [Google Scholar] [CrossRef]
26. Singh, K., Das, R. (2017). Exergy optimization of cooling tower for HGSHP and HVAC applications. Energy Conversion and Management, 136, 418–430. https://doi.org/10.1016/j.enconman.2017.01.024 [Google Scholar] [CrossRef]
27. He, S., Zhang, G., Gao, M., Sun, F., Huang, X. (2019). Wind tunnel test on the flow resistance of U-type water collecting devices for natural draft wet cooling towers. Journal of Wind Engineering and Industrial Aerodynamics, 186, 234–240. https://doi.org/10.1016/j.jweia.2019.01.008 [Google Scholar] [CrossRef]
28. Li, Q., Yu, J., Liu, J. (2013). Discussion standard deviation and standard deviation of the mean value. Mental Materials and Metallurgy Engineering, 41(5), 45–48. [Google Scholar]
29. Baloch, A. A. B., Bahaidarah, H. M. S., Gandhidasan, P., Al-Sulaiman, F. A. (2015). Experimental and numerical performance analysis of a converging channel heat exchanger for PV cooling. Energy Conversion and Management, 103, 14–27. https://doi.org/10.1016/j.enconman.2015.06.018 [Google Scholar] [CrossRef]
30. Kloppers, J. C., Kröger, D. G. (2003). Loss coefficient correlation for wet-cooling tower fills. Applied Thermal Engineering, 23(17), 2201–2211. https://doi.org/10.1016/S1359-4311(03)00201-1 [Google Scholar] [CrossRef]
Cite This Article
 Copyright © 2023 The Author(s). Published by Tech Science Press.
This work is licensed under a Creative Commons Attribution 4.0 International License , which permits unrestricted use, distribution, and reproduction in any medium, provided the original work is properly cited.
 Downloads
 Citation Tools