
 Submit a Paper
 Propose a Special lssue
 Open Access
ARTICLE

An Auxiliary Monitoring Method for Well Killing Based on Statistical Data
1 CNPC Research Institute of Safety & Environment Technology, Beijing, China
2 Environmental Protection and Technical Supervision Research Institute, PetroChina Southwest Oil & Gas Field Company, Shanghai, China
3 West East Pipeline Company of PipeChina, Shanghai, China
* Corresponding Author: Shuang Liang. Email:
Fluid Dynamics & Materials Processing 2023, 19(8), 2109-2118. https://doi.org/10.32604/fdmp.2023.025342
Received 06 July 2022; Accepted 08 November 2022; Issue published 04 April 2023
 View Full Text
 Download PDF
Abstract
In the present study, a large set of data related to well killing is considered. Through a complete exploration of the whole process leading to well-killing, various factors affecting such a process are screened and sorted, and a correlation model is built accordingly in order to introduce an auxiliary method for well-killing monitoring based on statistical information. The available data show obvious differences due to the diverse control parameters related to different well-killing methods. Nevertheless, it is shown that a precise three-fold relationship exists between the reservoir parameters, the elapsed time and the effectiveness of the considered well-killing strategy. The proposed monitoring auxiliary method is intended to support risk assessment and optimization in the context of typical well-killing applications.Keywords
As a new concept that has attracted wide attention in recent years, Big Data refers to a technical system or framework that economically extracts its value through high-speed capture, discovery and analysis of a large number of data with complex types and sources. Therefore, Big Data not only refers to the data involved but also includes the theories, methods, and technologies for processing and analyzing these data. Big Data was mainly applied in the fields of business and finance in the beginning and expanded gradually to the fields of transportation, medicals, energy, and so on [1–4].
The petroleum and petrochemical industry has always been an industry with the rapid growth of data and continuous improvement of data processing demand [5,6]. In order to realize the intellectualization and integration of oil exploration and development, major oil companies have actively built large databases in the field. At present, most of the data in drilling engineering are acquired through intelligent decision-making technology, which collects the surface and downhole data for systematic analysis, and carries out real-time monitoring and early warning for the drilling process to ensure drilling safety. Baker Hughes’ intelligent interpretation based on multi-dimensional Big Data has been widely used [7]. BIM cooperated with a British oil company to introduce Big Data analysis technology to predict casing pipe sticking in drilling operations [8]. By analyzing the historical data, 230 characteristics related to the static friction event, which is the precursor of the pipe clamping state, are identified. The prediction accuracy of pipe clamping is improved to 85%. In drilling a group of 50 wells in Abu Dhabi, US $5.3 million was saved by minimizing the operation delay caused by pipe sticking.
At the same time, the well control system driven by Big Data recognizes the downhole working conditions based on wellbore data, drilling parameters, and other data automatically and realizes early warning and control of the pressure in the well intelligently. Driven by Big Data, the well control system solves downhole accidents such as kick and overflow during drilling by controlling and monitoring the pressure in the well, to ensure efficient and safe drilling. Among them, the intelligent well control systems of Schlumberger, Weatherford, Halliburto’s intelligent well control systems perform well in overflow monitoring and early warning during drilling [9,10]. Among them, Weatherford’s drilling database has collected thousands of wells worldwide and developed a Victus intelligent well control system, which can accurately predict downhole data changes in real-time and react in seconds.
Compared with the traditional pressure control system, the well control system based on Big Data has greatly improved the accuracy, safety, and timeliness of the intelligent well control system due to the universality and accuracy of its data.
2 Design of the Data Structure for Well Control
2.1 Platform for Big Data Storage and Processing
From the view of the relationship between storage and processing for Big Data, there are two types of modes, stream processing, and batch processing. The former is direct processing, which regards data as a stream. In this mode, data flow is vast, continuous, high-speed, etc. New data will be processed immediately when it arrives. Stream processing is suitable for businesses requiring high real-time performance. Storage before processing is a feature of batch processing whose core idea is to divide and conquer the problem. This mode is suitable for planning and other businesses that do not require high real-time performance but have an amount of data. As Big Data is a constantly developing systems engineering, it is impossible to guarantee its feasibility, reliability, and expansibility of data centralized, logically and controlled [11]. The cloud computing technology, which integrates the distributed file system, distributed data processing system, and distributed database, could serve as the basic platform and technical support for the storage and processing of Big Data, as well as serving for the application of Big Data in drilling.
Big Data analysis includes data analysis and interpretation. The former is the process of studying huge amounts of data in different types to discover hidden patterns, unknown interrelationships, and other useful information. Big Data interpretation, which is necessary for the results analyzed to be understood and applied, is the process of deep analysis and Multi-dimensional presentation of Big Data, and is the revivification of Big Data analysis results to specific industry problems [12]. Accompanied by the data analysis, Big Data interpretation can also be regarded as a special Big Data method.
Data mining is a process of extracting useful information from a large data set or data stream. Data fusion is a process of integrating multiple data or knowledge describing the same object into a consistent, accurate, and explainable expression [13]. The potential relationship among data can be explored by mining and fusing data from different sources, and a more accurate cognition can be obtained.
By mining and fusing panoramic data, the real-time, continuous, and macro-accurate grasp of the overall situation and the accurate perception of the local state from multiple angles, multi-levels, and multi-modes can be obtained using its redundancy and complementarity in time and space.
A large amount of data generated and accumulated during the drilling process, such as various state data, maintenance data of equipment, etc., could not continue to create value after the end of its utilization cycle. They can only be stored in a variety of storage media. Some seemingly outdated and useless data still has potential value, however.
3 Big Data Structure for Well Control
It refers to the classification of the features presented in the data by collecting a variety of data feature information so that the category of anything could be accurately judged in the later stage, which is convenient for the later data processing.
Input the relevant data of the well, such as inlet conductivity, outlet conductivity, outlet density, inlet density, pool volume variable, casing pressure, force pressure, and outlet flow, etc., into the Big Data analysis software, combine and classify.
The results are shown in Fig. 1. The Big Data system clusters the parameters of the wells when accidents occur. The figure reflects the clustering changes of the data parameters of the wells when accidents occur.
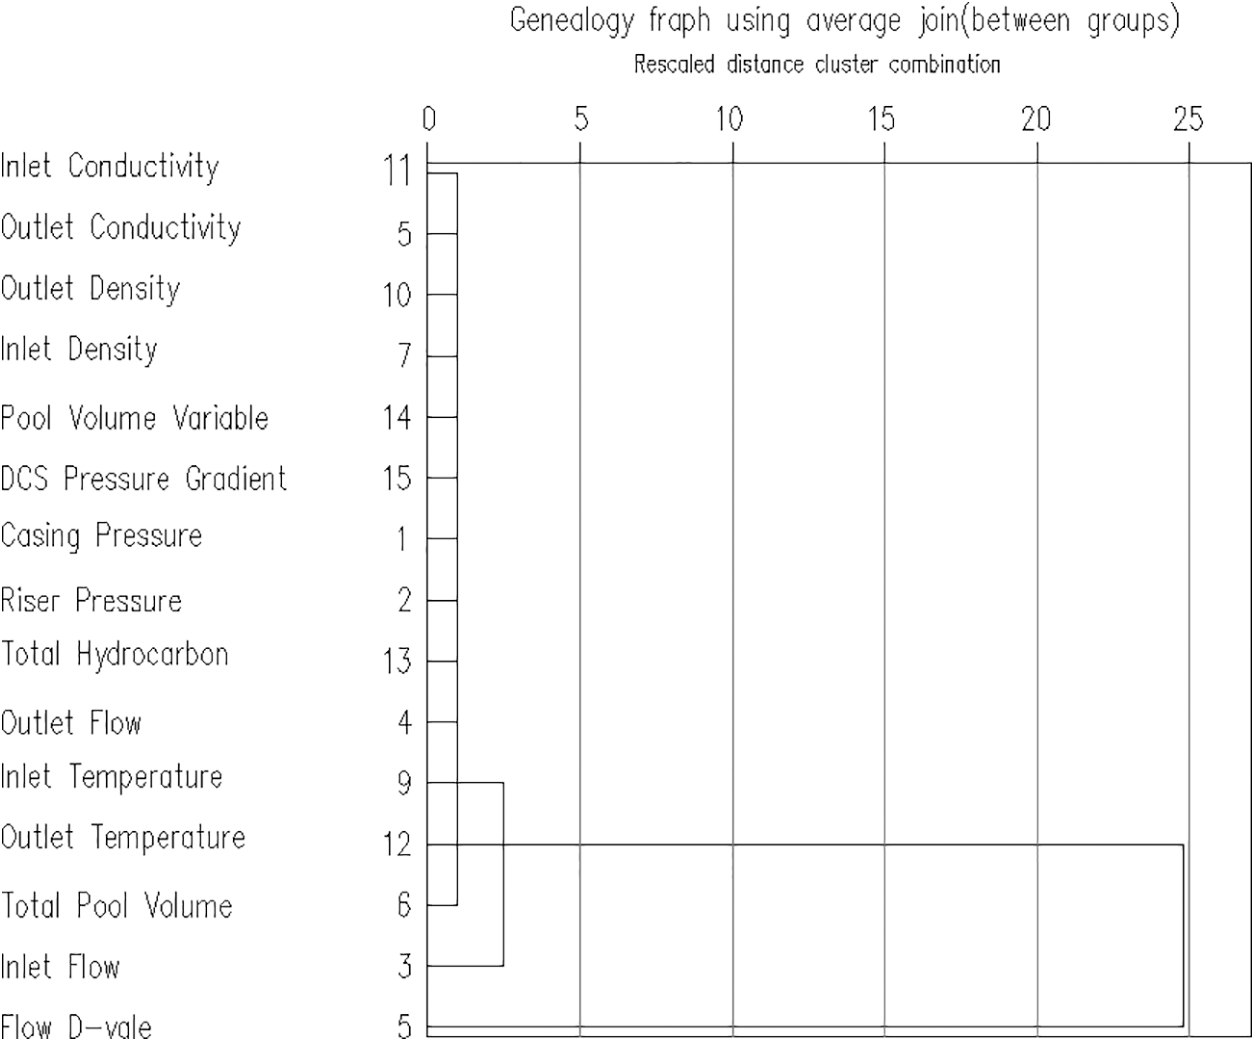
Figure 1: Tree diagram of clustering methodology for well control
As shown in Fig. 1, the data parameters of the well can be divided into different small sets according to their correlation when analyzing the data of the accident well by using the clustering method. Taking 15 groups of data in an accident well as an example, when the distance between the groups is 1, one set is classified from the inlet conductance to the total pool volume, and the inlet flow and flow difference are classified as the other set. When the distance between groups is 3, one set is classified from the inlet conductance to the inlet flow, and the flow difference is left as a class. When the distance between groups is 25, the inlet conductance and the flow differentials are grouped together. The results show the correlation of the parameters in the case of an accident in the well.
Factor analysis refers to some variables that are taken as factors in the inductive analysis of variables by showing the relationship between factors with other practical significance, and other information is reflected by using little factors.
Input the relevant data of the well, such as inlet conductivity, outlet conductivity, outlet density, inlet density, pool volume variable, casing pressure, force pressure, and outlet flow, etc. into the Big Data analysis software and conduct factor analysis. The analysis results are shown in Table 1. The Big Data system analyzes the input data of eight parameters from the accident well, and those parameters that fluctuate greatly during the accident could be seen.
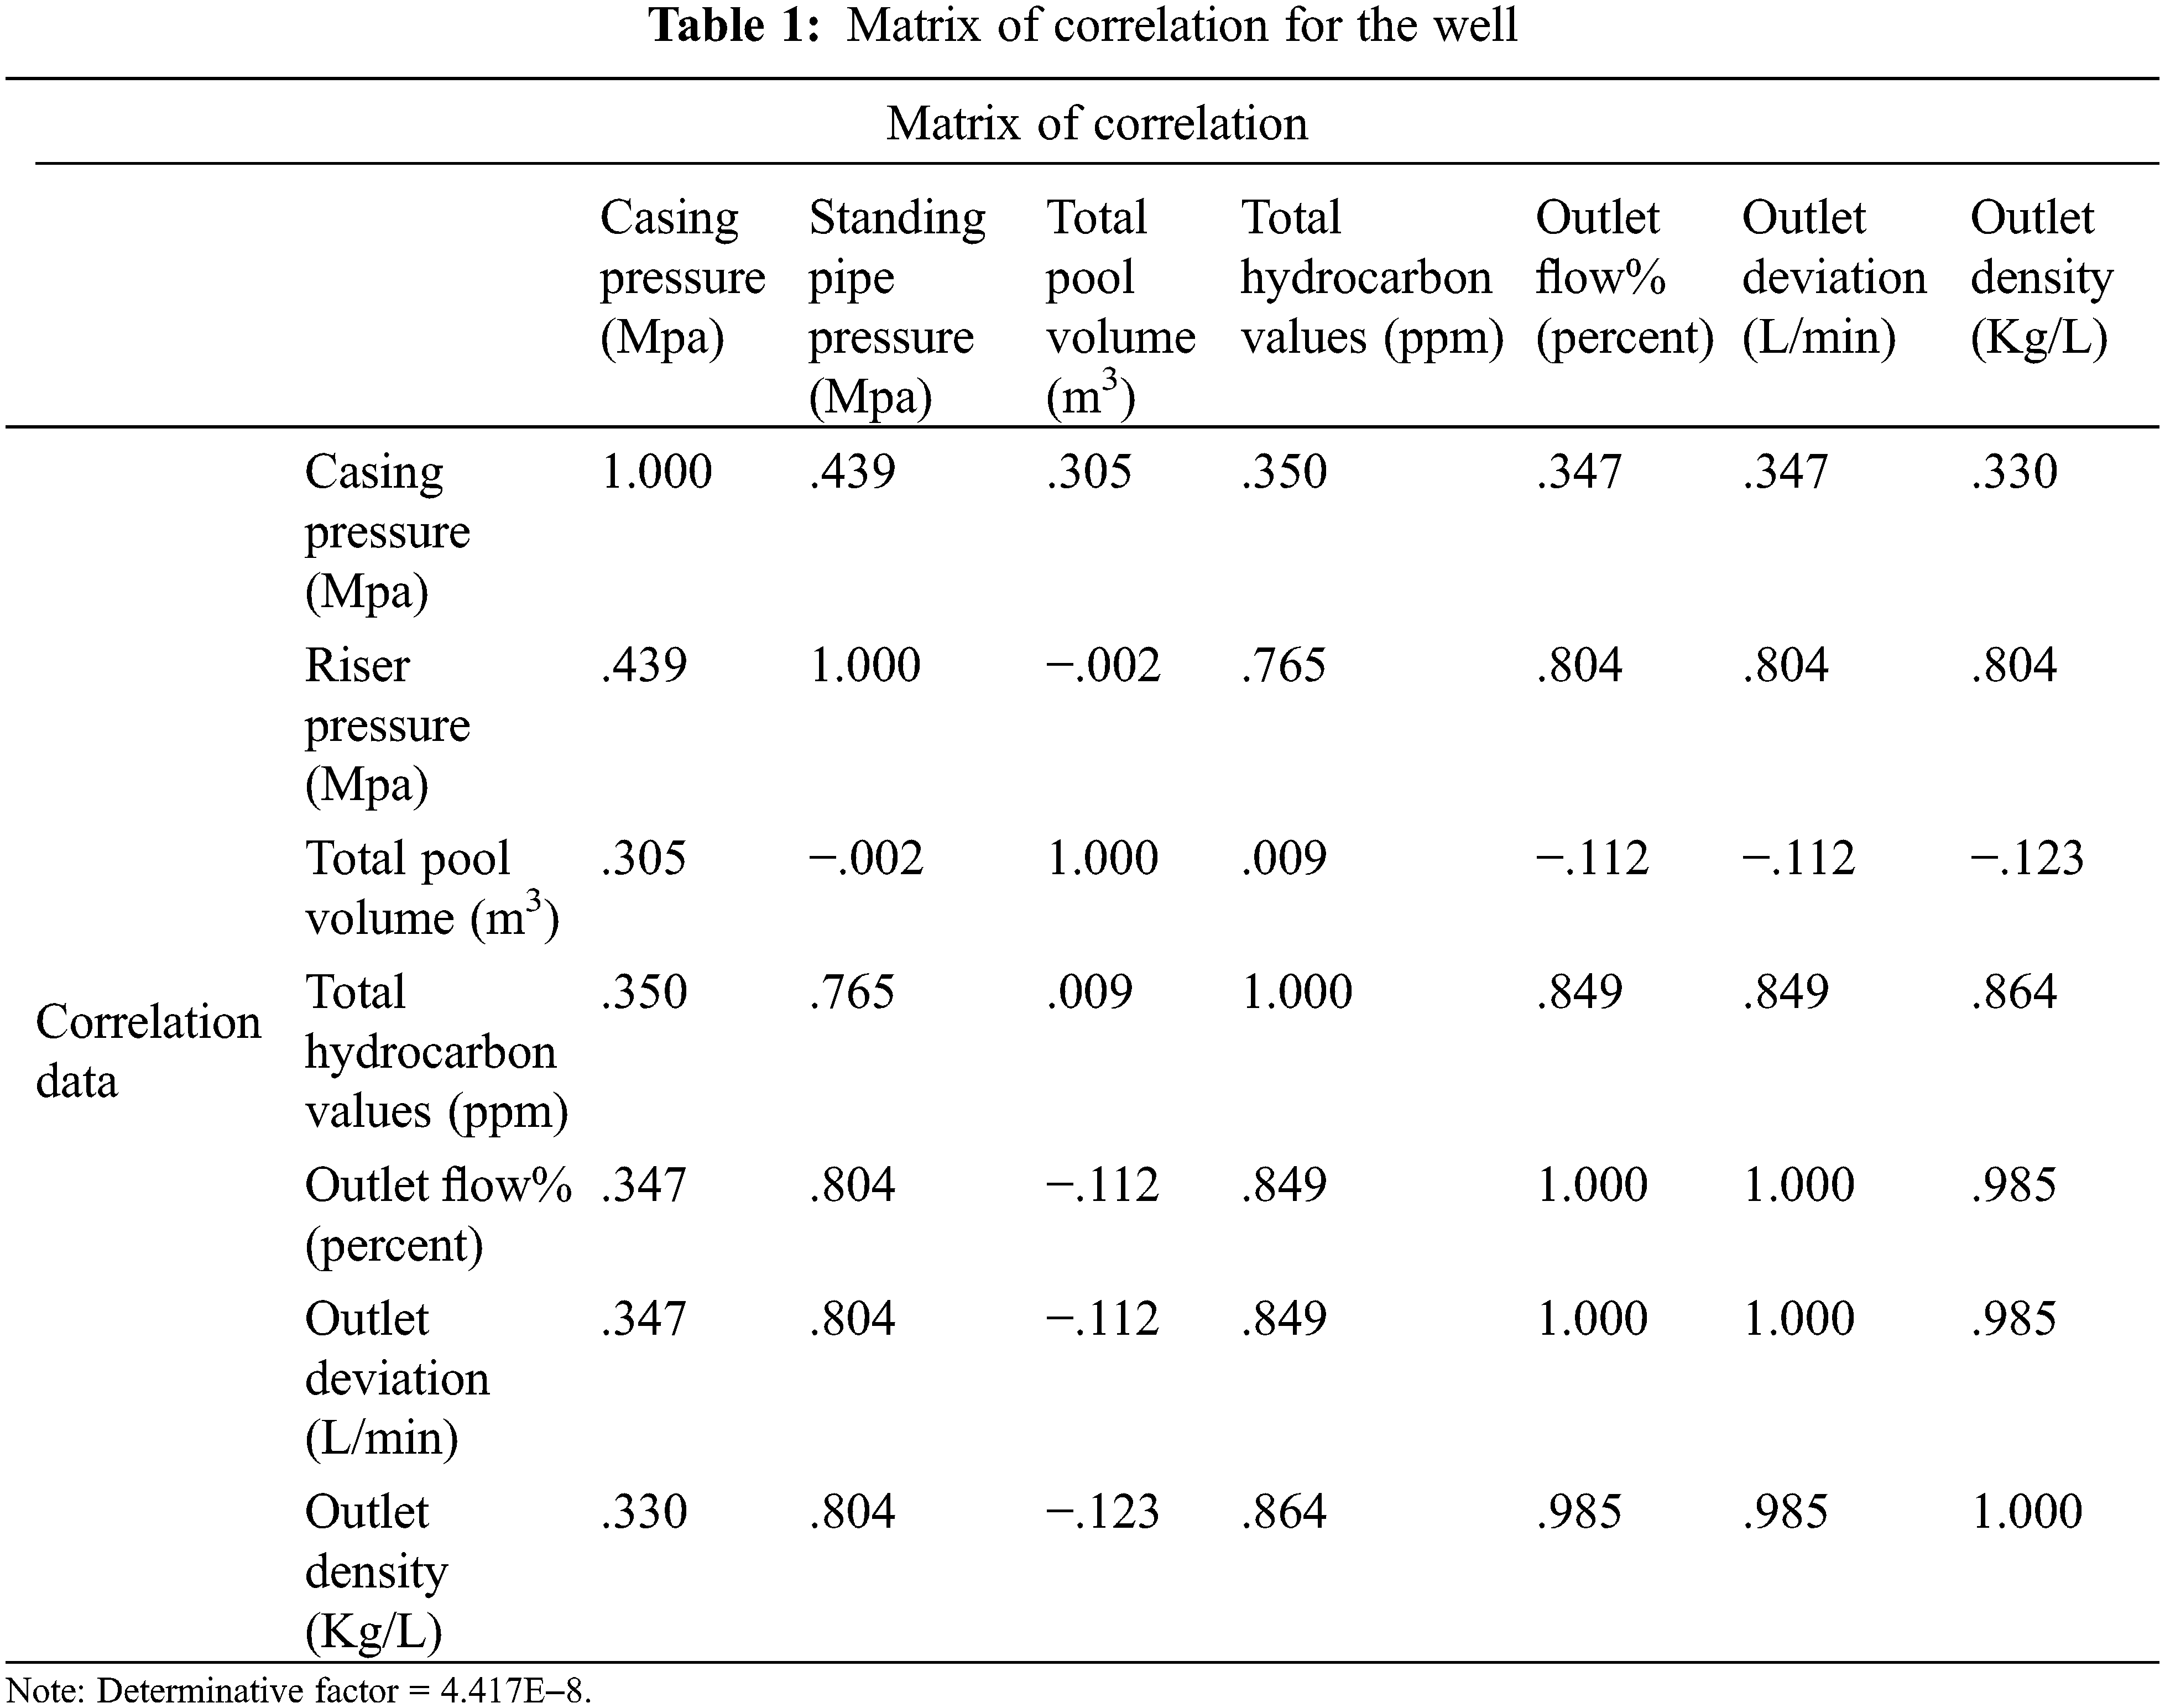
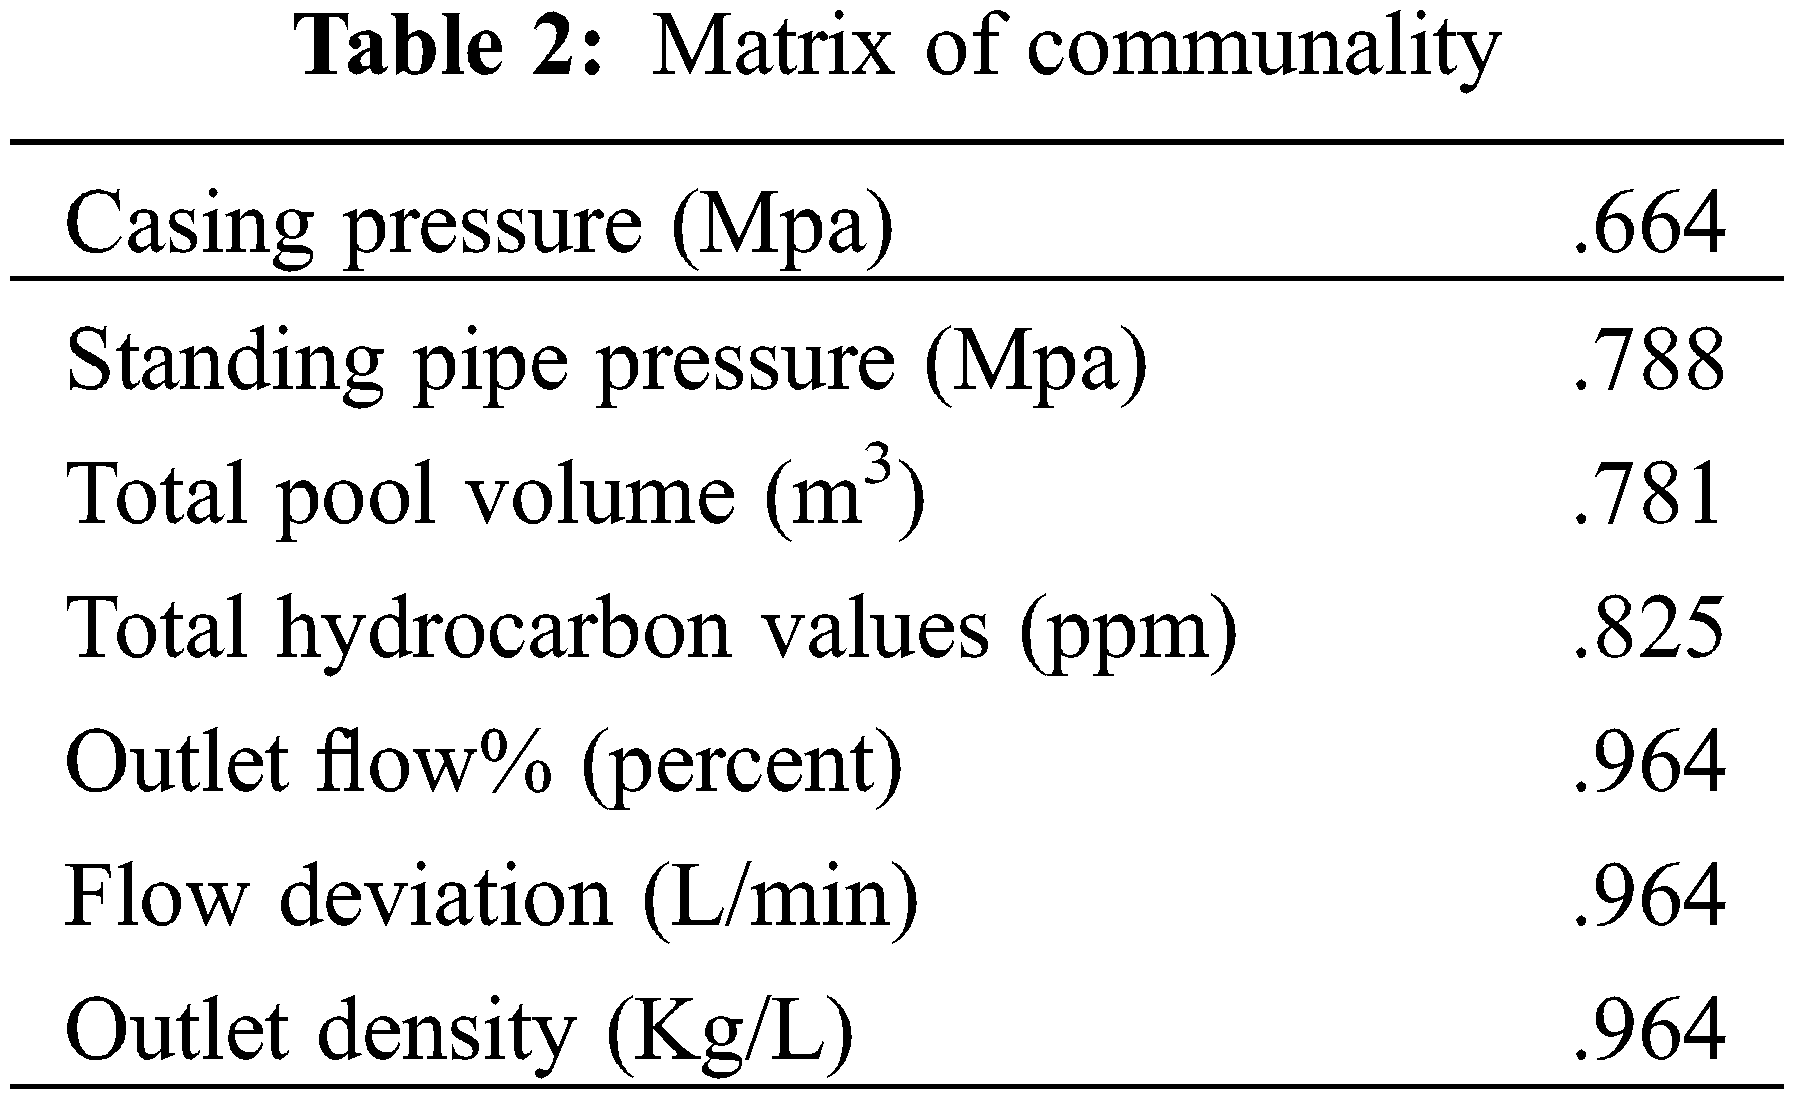
The correlation matrix shows the relationship among seven parameters of the accident well. It can be seen from the Table 2. That the parameters with the greatest correlation are outlet flow and outlet density, as well as flow deviation and outlet density, and their correlation coefficients are 0.985. It can be seen from matrix communality that the expression coefficients of outlet flow, flow deviation, and outlet density are 0.964, which indicates that these three parameters take a large proportion in the accident well parameters.
The parameters of well kill within a certain period of time were analyzed in time series. After data processing, the data were imported into the time series analysis model for data prediction in the following period. As can be seen from Fig. 2, the curve of the time data predicted by the system and the real data showed a downward trend.
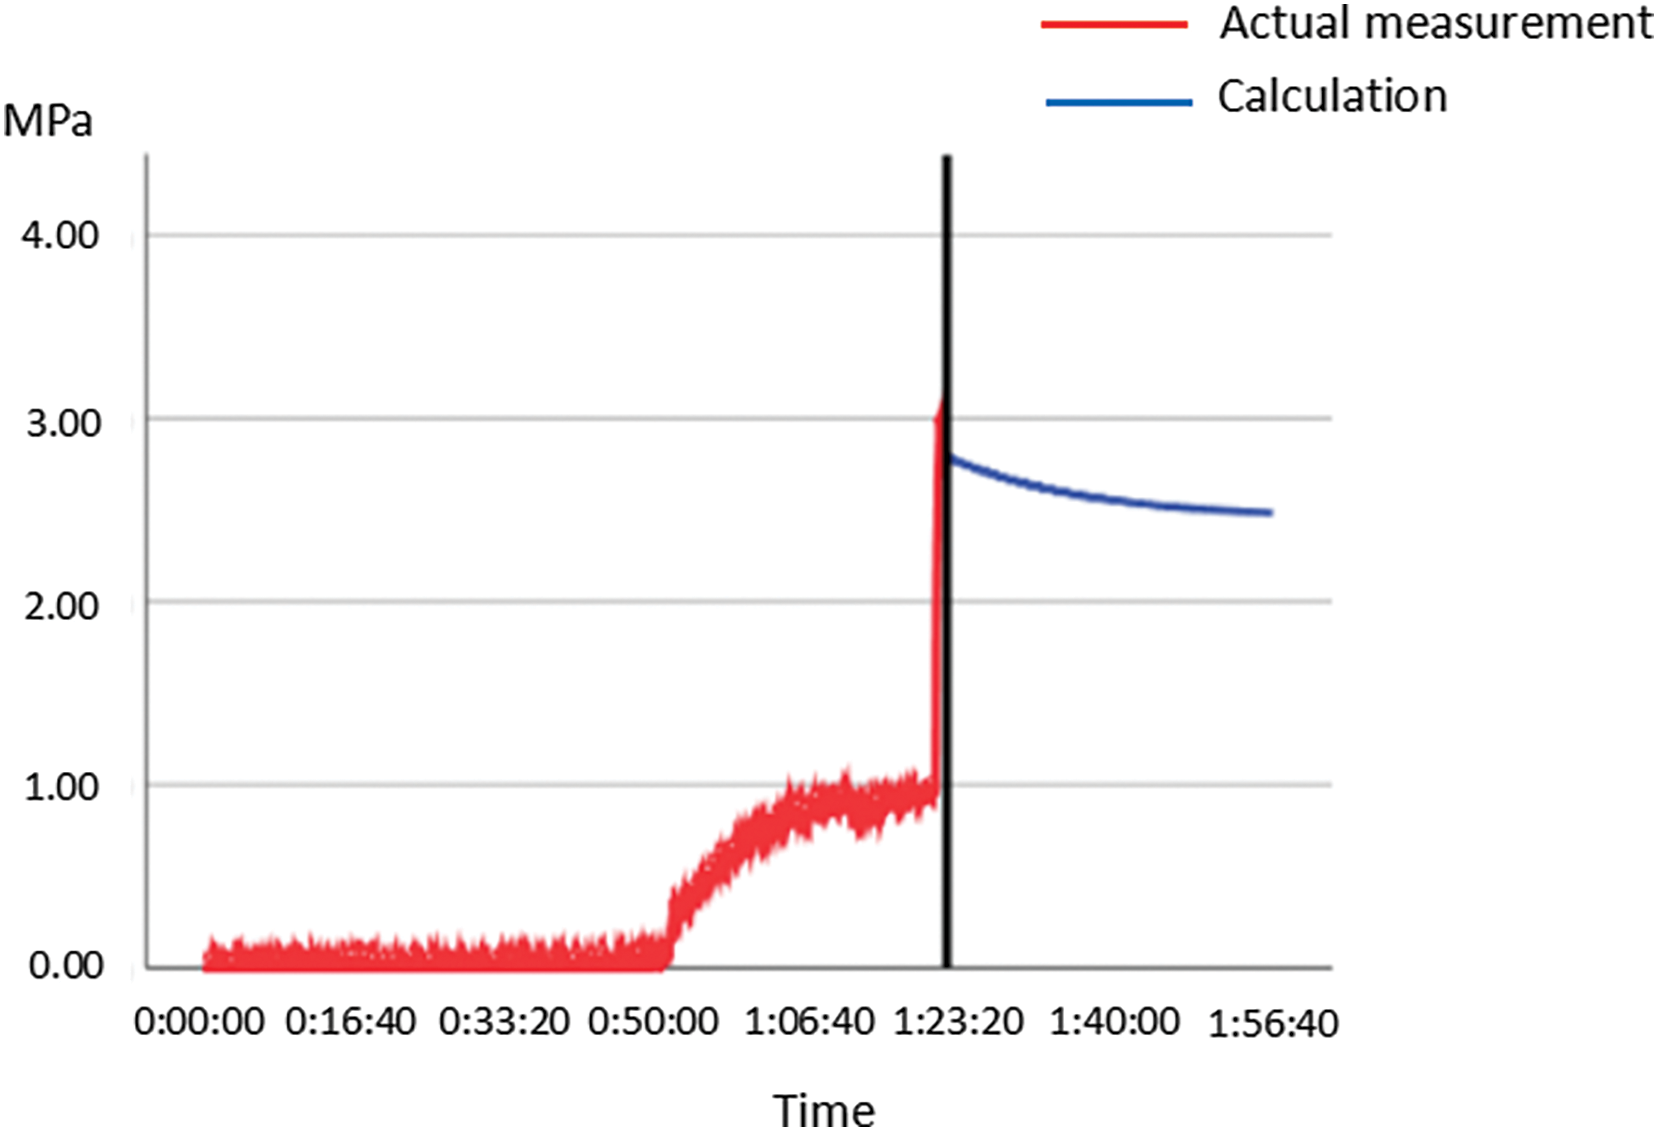
Figure 2: Prediction data in time series
It can be seen from the Fig. 3 that the predicted data of the time series shows a slow decline at 1:23:20. Compared with the overall fluctuation of the actual data after that time, it has the same downward trend.
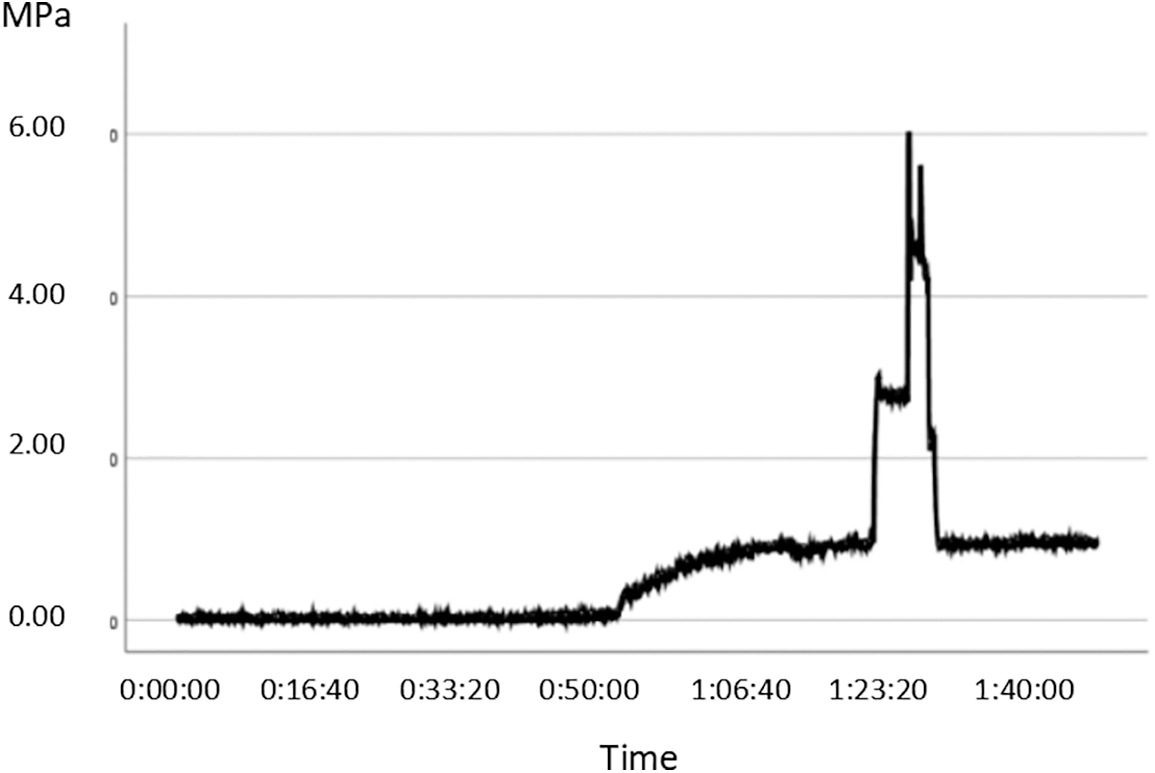
Figure 3: Real data in time series
3.4 Applicability of Big Data in Well Control
Various Big Data analysis methods have peculiar characteristics. Different analysis methods should be adopted according to the needs in each stage of well control. The cluster analysis method is characterized by classification according to the similarity of parameter sets, interpreting the correlation between kick and reservoir parameters. The principal component analysis is a dimension reduction method. The extraction of the most important influencing factors from many factors related to overflow is conducive to the designation of accident prevention measures. The factor analysis method focuses on prediction, which is conducive to designing well control parameters and formulating plans. The grey correlation analysis method uses correlation analysis on multiple objects to obtain the influence degree of each parameter on the final variable. See Table 3. For well control, the increment of the mud pool is the main parameter of the kick. Through correlation analysis, the pseudo-data components in the data can be removed to extract the most critical factors.

4 Application of Expert System with Big Data for Well Control
Based on the established expert system with Big Data, the basic parameters and the steps of killing are analyzed in real-time by combining practice with theoretical research, and the optimal strategy was provided in the first time of well killing by using the analysis ability and processing ability of the expert system with Big Data, and similar cases are given. See Fig. 4.
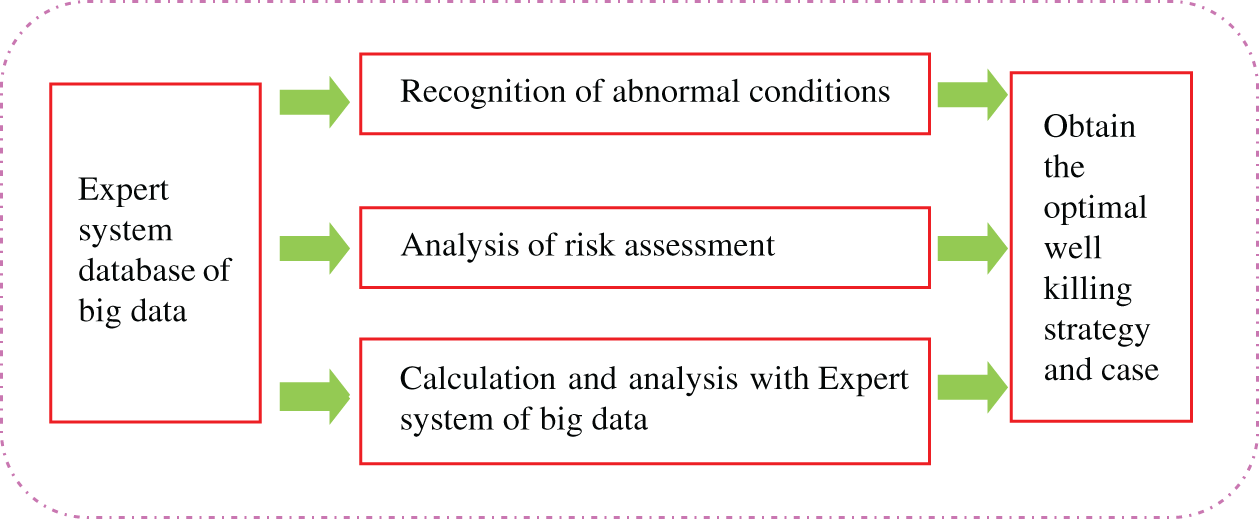
Figure 4: Application of expert system with Big Data for well control
4.1 Research on Risk Assessment Method of Well Killing Based on Big Data
In view of the risks that existed in the well-killing process, the collected geological reservoir characteristic data, well type, rheological property of inlet and outlet drilling fluid, tripping speed, excited pressure, and other data are used for adaptability analysis by using AHP (Analytic Hierarchy Process), FTA (fault tree analysis), FCE (fuzzy comprehensive evaluation), Neural network method and others. A comprehensive model for risk analysis of well-killing operation is established.
Combined with the historical data mining function of Big Data and the learning function of the neural network, the clustering analysis method in the system is used to predict the risk in well killing. Establish a relatively complete database of accident-inducing factors and accident-handling measures, which can provide a reference for accident handling at the first time when a blowout accident occurs.
After understanding all aspects of the accident well, a well-killing plan was developed and was input into the expert system with Big Data, which would combine the data of similar wells in history to calculate level-by-level processing. The software enumerates the possible consequences of this plan. It breaks them down for another round of calculation and analysis, along with a forecast of risk, as shown in Fig. 5.

Figure 5: Risk assessment procedures for well killing
4.2 Identification of Abnormal Working Conditions Based on Expert System with Big Data
The cases of abnormal conditions during well killing are recorded in the Big Data expert system base on two information modes. The objective information refers to some basic data of the well before and after the abnormal conditions of well killing, the description of the working conditions during the accident, and the description of the accident handling process, which are recorded into the Big Data system in chronological order. The other inductive information refers to the causes, consequences, and lessons learned from the accident summarized after the abnormal conditions of the well. See Fig. 6. The collected cases of other abnormal working conditions are divided into two information modes for input, which can be used by the system for later learning.

Figure 6: Database analysis of abnormal conditions
As Big Data analysis samples, kill failure data is divided into two categories. One is hardware parameters such as choke manifold, casing performance, and kill fluid material; the other is software factors such as kill parameters and method selection, and then analyze and extract reasons for different parameters.
Fig. 7 describes that a site’s real-time killing data information is input into the Big Data expert system. After the system analyzes the data, it compares all the killing abnormal conditions data in the database. It the abnormal conditions and points corresponding to similar data for detailed analysis to improve the success rate of killing and reduce the risk of killing.
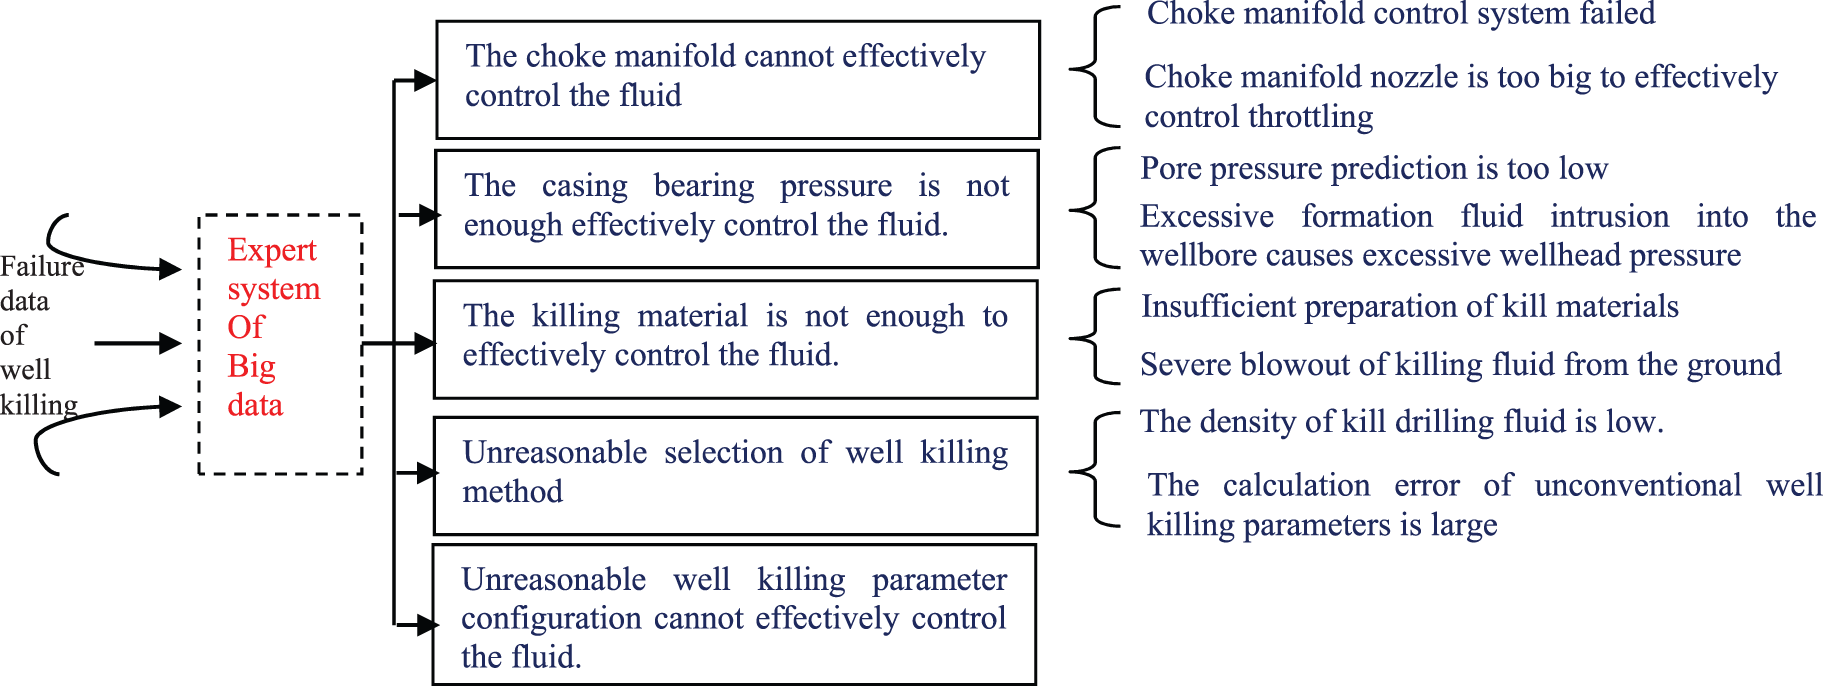
Figure 7: Case analysis of abnormal conditions
With the gradual development of oil and gas exploration and development towards unconventional, low permeability, deep water, and other complex oil and gas fields, drilling engineering is facing a series of problems and challenges in safety, economy, and efficiency. The petroleum industry widely recognizes the optimization of drilling operations based on cutting-edge technologies such as Big Data and artificial intelligence.
While applying Big Data analysis methods in well control, different analysis methods have different applicability. The cluster analysis method is suitable for the analysis of the correlation between reservoir parameters and kick. In contrast, the principal component analysis method and factor analysis method are suitable for the analysis of the key factors of overflow. In contrast, the grey correlation analysis method is suitable for discharging invalid data in the data.
The intelligent auxiliary technology system is established with the help of the Big Data analysis method. According to the accumulated historical data, the optimization strategy and risk early warning mode can be formed. According to the real-time monitoring data of the killing process, the dynamic risk assessment of the killing process was carried out to provide a comparison scheme and optimize the kill parameters. The method supported by an expert system with Big Data can improve the success rate of well killing and reduce the risk of well killing.
Funding Statement: This paper is supported by research on key equipment and supporting technology for Onshore Well Control Emergency, CNPC (2021ZZ03-2).
Conflicts of Interest: The authors declare that they have no conflicts of interest to report regarding the present study.
References
1. Nature. Big Data (2012). http://www.nature.com/news/specials/bigdata/index.html. [Google Scholar]
2. Sagiroglu, S., Sinanc, D. (2013). Big Data: A review. 2013 International Conference on Collaboration Technologies and Systems (CTS), New York, USA. [Google Scholar]
3. Jagadish, H. V., Gehrke, J., Labrinidis, A., Papakonstantinou, Y., Patel, J. M. et al. (2014). Big Data and its technical challenges. Communications of the ACM, 57(7), 86–94. https://doi.org/10.1145/2611567 [Google Scholar] [CrossRef]
4. Liu, Z., Zhang, Q. (2014). Research overview of Big Data technology. Journal of Zhejiang University--Science A, 48(6), 957–972. [Google Scholar]
5. Mohammadpoor, M., Torabi, F. (2020). Big Data analytics in oil and gas industry: An emerging trend. Petroleum, 6(4), 321–328. https://doi.org/10.1016/j.petlm.2018.11.001 [Google Scholar] [CrossRef]
6. Sumbal, M. S., Tsui, E., See-to, E. W. K. (2017). Interrelationship between Big Data and knowledge management: An exploratory study in the oil and gas sector. Journal of Knowledge Management, 21(1), 180–196. https://doi.org/10.1108/JKM-07-2016-0262 [Google Scholar] [CrossRef]
7. Geng, L. (2022). Study on characteristics and application scheme of Big Data in drilling and completion. Oil Drilling & Production Technology, 44(1), 89–96. [Google Scholar]
8. Geng, L. (2022). Application status and development suggestions of Big Data technology in petroleum engineering. Petroleum Drilling Techniques, 49(2), 72–78. [Google Scholar]
9. Li, Y., Lian, P., Xue, Z. (2020). Application status and prospect of Big Data and artificial intelligence in oil and gas field development. Journal of China University of Petroleum (Edition of Natural Science), 44(4), 1–11. [Google Scholar]
10. Song, H., Du, S., Zhou, Y. (2021). Big Data intelligent platform and application analysis for oil and gas resource development. Chinese Journal of Engineering, 43(2), 179–192. [Google Scholar]
11. Eickholt, J., Shrestha, S. (2017). Teaching Big Data and cloud computing with a physical cluster. Proceedings of the 2017 ACM SIGCSE Technical Symposium on Computer Science Education, pp. 177–181. New York, ACM Press. [Google Scholar]
12. Farid, D. M. (2013). An adaptive ensemble classifier for mining concept drifting data streams. Expert Systems with Applications, 40(15), 5895–5906. https://doi.org/10.1016/j.eswa.2013.05.001 [Google Scholar] [CrossRef]
13. Su, J., Liu, G. (2020). Challenge and development of Big Data application in petroleum engineering. Journal of China University of Petroleum (Edition of Social Science), 36(3), 1–6. [Google Scholar]
Cite This Article
 Copyright © 2023 The Author(s). Published by Tech Science Press.
This work is licensed under a Creative Commons Attribution 4.0 International License , which permits unrestricted use, distribution, and reproduction in any medium, provided the original work is properly cited.
 Downloads
 Citation Tools