
 Submit a Paper
 Propose a Special lssue
 Open Access
ARTICLE

Influence of Wellbore Trajectory on Pressure Drop and Fluid Discharge
1 Shanghai Branch of CNOOC (China) Co., Ltd., Shanghai, 200335
2 CNPC Key Laboratory of Oil and Gas Productions on Yangtze University, Jingzhou, 434023, China
3 Petrochina Multiphase Flow Laboratory of Gas Lift Innovation Center, Wuhan, 430100, China
4 Petroleum Engineering College of Yangtze University, Wuhan, 430100, China
* Corresponding Author: Guowei Wang. Email:
Fluid Dynamics & Materials Processing 2023, 19(8), 2053-2066. https://doi.org/10.32604/fdmp.2023.026301
Received 29 August 2022; Accepted 24 November 2022; Issue published 04 April 2023
 View Full Text
 Download PDF
Abstract
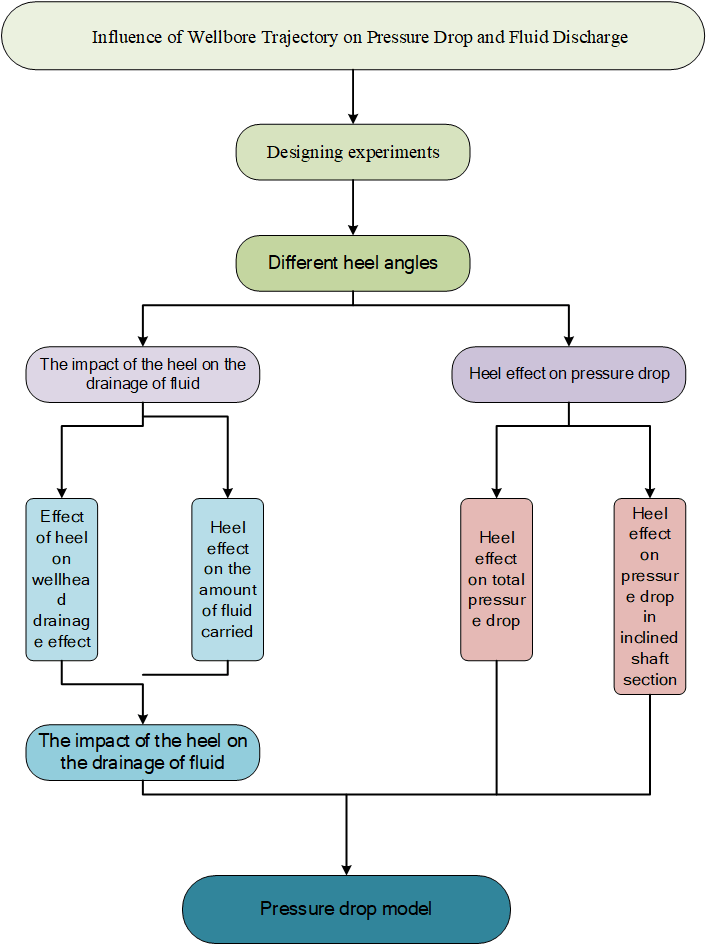
An experimental analysis has been conducted to study the process of fluid accumulation for different borehole trajectories. More specifically, five heel angles have been experimentally realized to simulate the borehole trajectory of the sloping section of the formation. The fluid-carrying capacity, pressure drop and fluid discharge volatility have been investigated for these conditions and, accordingly, the relationship between heel angle and wellbore pressure drop fluid-carrying capacity has been determined. The results show that while the reasonable roll angle can increase the pressure loss in the wellbore, it is beneficial to drainage. In terms of pressure loss and liquid-carrying capacity, when the heeling angle is 50°, the latter is increased while the former becomes very high, which indicates that when drilling and completing wells on site, a 50° roll angle should be avoided. It is found that the main reason for the increase of the total pressure drop in the wellbore is the increase of the local pressure loss in the inclined section. From the perspective of drainage stability, when there is heeling in the inclined section of the horizontal well, the fluctuation of the wellbore drainage tends to be enhanced. Through the comparison of the Beggs-Brill (B-B) and Mukherjee-Brill liquid holdup methods, it is found that B-B method better predicts liquid holdup. A new method for calculating the pressure drop in the inclined section in the presence of lateral inclination is obtained by taking into account the pressure drop in the curved section. Through comparison with experimental data, it is found that the error is within 20%, and the prediction accuracy is high.Graphic Abstract
Keywords
With horizontal wells becoming popular in oil and gas extraction, more scholars have started to conduct in-depth research on horizontal wells [1,2]. Wang et al. [3,4] conducted a flow experiment in a horizontal well with a full wellbore. They separately observed the fluid-carrying condition of the horizontal, straight, and inclined sections. Evaluating the fluid-carrying conditions of horizontal, straight and inclined sections of horizontal wells, he concluded that the inclined section is the most difficult part of horizontal wells to carry fluid. However, some scholars only study the inclined section of horizontal wells from the perspective of fluid-carrying capacity. In contrast, others do not consider the variations in pressure drop in the inclined section. Azzi et al. [5–7] investigated the pressure drop model for different angle bends by an analytical method and the finite element method (FEM). They could predict the pressure drop variation at different angles in the inclined section. Likewise, some scholars only analyzed a single well section, the inclined section. Many scholars have not considered the effect of the horizontal and straight sections of horizontal wells on fluid discharge and pressure drop in inclined sections of wells. Usui et al. [8,9] investigated the pressure drop and liquid-carrying capacity of gas-liquid two-phase flow in small-diameter pipes. They obtained the law of liquid-carrying capacity and the method of calculating pressure drop for different radii of curvature. However, the small pipe diameter (4.08 mm) pipe considered by scholars is mostly used in heat exchangers and flow transfer devices and are rarely used in gas field development. Cheng et al. [10,11] studied the pressure drop and fluid-carrying capacity for different borehole morphologies, such as up-dip and down-dip in the horizontal section. They obtained the proper up-dip angle to enhance the regularity of fluid carrying in the wellbore. Although scholars have studied the variation of pressure drop and fluid-carrying capacity considering upward-sloping and downward-sloping borehole trajectories, scholars have not studied the methods of calculation of pressure drop and fluid-carrying capacity for different borehole trajectories.
For formation stability, for the dense sandstone formation of horizontal wells in the East China Sea gas field, for example, formation stability is a key consideration [12,13]. Site construction to improve well wall stability the during drilling of horizontal sections is vitally important. Thus, when designing the main and branch borehole tracks, the borehole track design should follow the direction of the minimum horizontal principal stress as much as possible, which also aids in determining landing points. An angular heel is often formed in the inclined section during drilling and completion [14]. Inclined sections are the most difficult to carry fluid in horizontal wells, and inclined sections with heel angles are more likely to accumulate fluid, which will cause increased fluctuations in fluid discharge at the wellhead. The sloping section is more complex than the straight and horizontal sections, and disturbances can occur between different parts of the pipe section, a phenomenon that can lead to changes in flow patterns and pressure drop patterns. Considering the above problems, no research has been conducted at this stage. Therefore, this paper will take the East China Sea gas field as the research vehicle to study the influence of the borehole trajectory on the oblique well section where a certain angle heel exists. In this paper, we will study the fluctuation of fluid discharge at the wellhead, the change of pressure drop, the fluid carrying capacity at different heel angles, and the method of calculating pressure drop and fluid carrying capacity when fluid accumulates at the heel.
We studied the pressure drop fluid-carrying capacity in the presence of a heel in the inclined section of the well through indoor simulation experiments. We used clear Plexiglas tubes for horizontal and vertical sections and wireline hoses for inclined sections to simulate inclined borehole trajectories. We set the gas-to-liquid ratio based on the gas and liquid produced in the East China Sea gas field. The Beggs et al. [15,16] and Mukherjee et al. [17,18] methods were used to establish the calculation of pressure drop and fluid-carrying capacity for different heel angles in the slanting section of the well. The developed method can predict the amount of fluid carried by the pressure drop in the wellbore at a certain heel angle and provide theoretical guidance for predicting the prediction of fluid accumulation in horizontal wells.
2 Experimental Equipment and Experimental Design
This experiment was conducted in the multiphase flow experimental platform. The experiment stands angle of this platform is adjustable from −10° to +90°. The experimental platform comprises four parts: a power system, a metrology system, a measurement system, and a data acquisition system. As shown in Fig. 1. The power system comprises a screw rod air compressor and centrifugal pump. The screw rod air compressor simulates formation gas production, and the centrifugal pump simulates formation liquid production. The screw rod air compressor has a maximum displacement of 50,000 m3/d and a working pressure range of 0–0.8 Mpa. The maximum displacement of the centrifugal pump is 168 m3/d, and the working pressure range is 0–0.8 Mpa. The metering system consists of a gas-liquid flow meter, a pressure gauge, and a differential pressure gauge. The gas-liquid flow meter is used to measure the amount of gas and liquid produced by the formation, the pressure meter is used to measure the pressure change in the experimental pipe section, and the differential pressure meter is used to test the differential pressure in the experimental pipe section. Gas phase flowmeter flow range 0–50,000 m3/d, accuracy 0.1%. Liquid phase flowmeter range 0–168 m3/d, the accuracy of 0.5% and resolution of 0.01 psi. The manometer has an accuracy of 0.1%, and the differential pressure gauge has an accuracy of 0.025% with a resolution of 0.01 psi. The measuring system consists of straight, inclined and horizontal pipe sections. The straight section is used to simulate a straight section of a horizontal well. The straight section comprises 13 meters of 2–3/8 inch diameter Plexiglas tubing. The inclined pipe section is used to simulate an inclined section of a horizontal well. The inclined pipe section comprises 7 meters of 2–3/8 inch diameter wireline hose. The horizontal pipe section is used to simulate the horizontal section of a horizontal well. The horizontal pipe section comprises 5 meters of 2–3/8 inch diameter Plexiglas pipe. The data acquisition system is mainly composed of a computer, which can record data on parameters such as gas-liquid flow, pressure at each pressure measurement point, differential pressure in the pipe section, and the amount of liquid coming out of the pipe outlet per second. The main principle of the experimental platform is that the air compressor and centrifugal pump provide the gas and liquid of the set gas volume, respectively. The gas-liquid two-phase fluid reaches the test pipe section through the gas-liquid flow meter. Gas-liquid two-phase fluid flow in the test tubing section simulates gas-liquid two-phase fluid flow conditions in the wellbore. The metering system acquires data such as the pressure flow rate in the experiment. These data are synchronized and uploaded to the data collection computer.
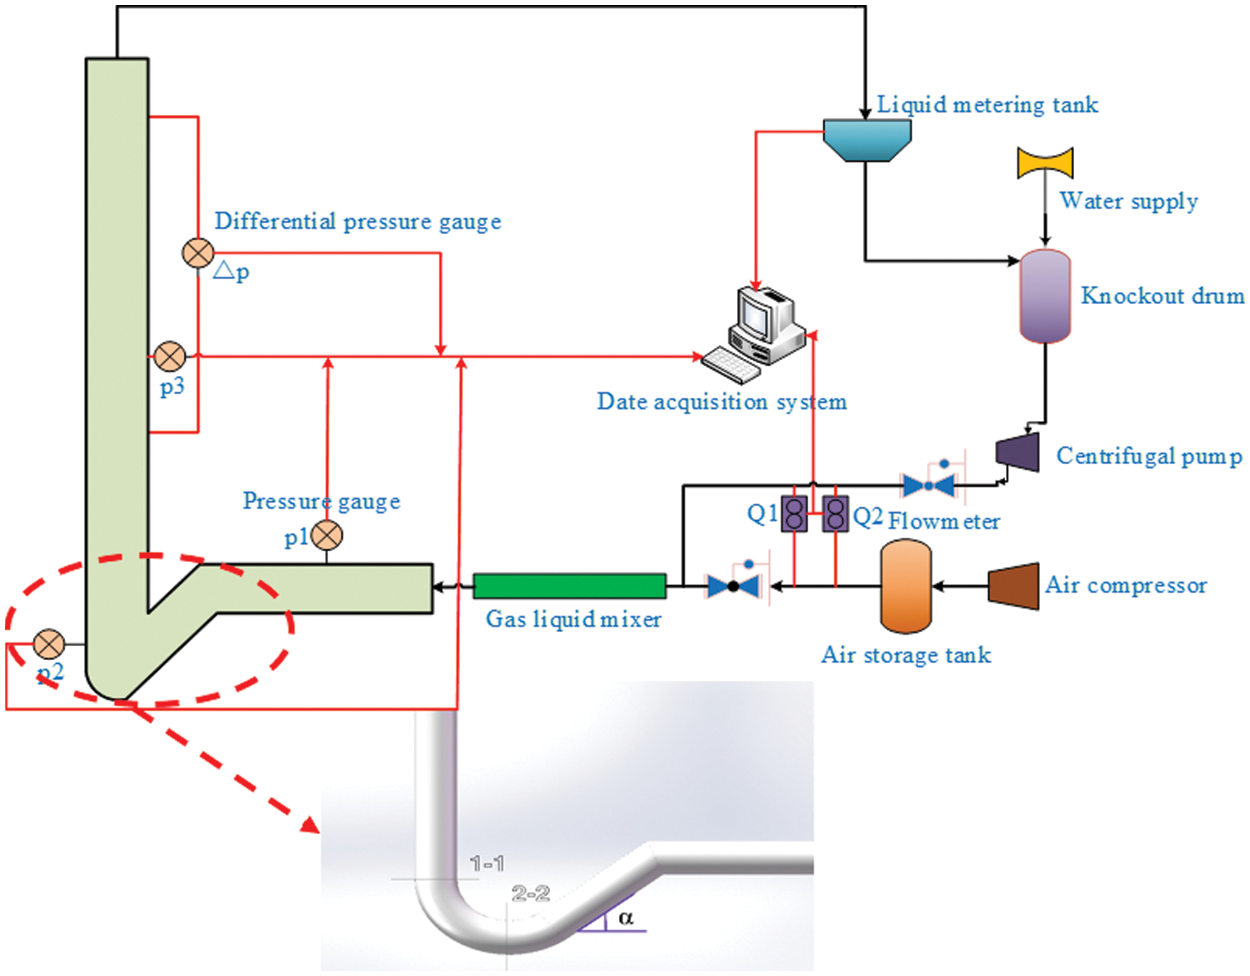
Figure 1: Experimental flow and heel structure diagram
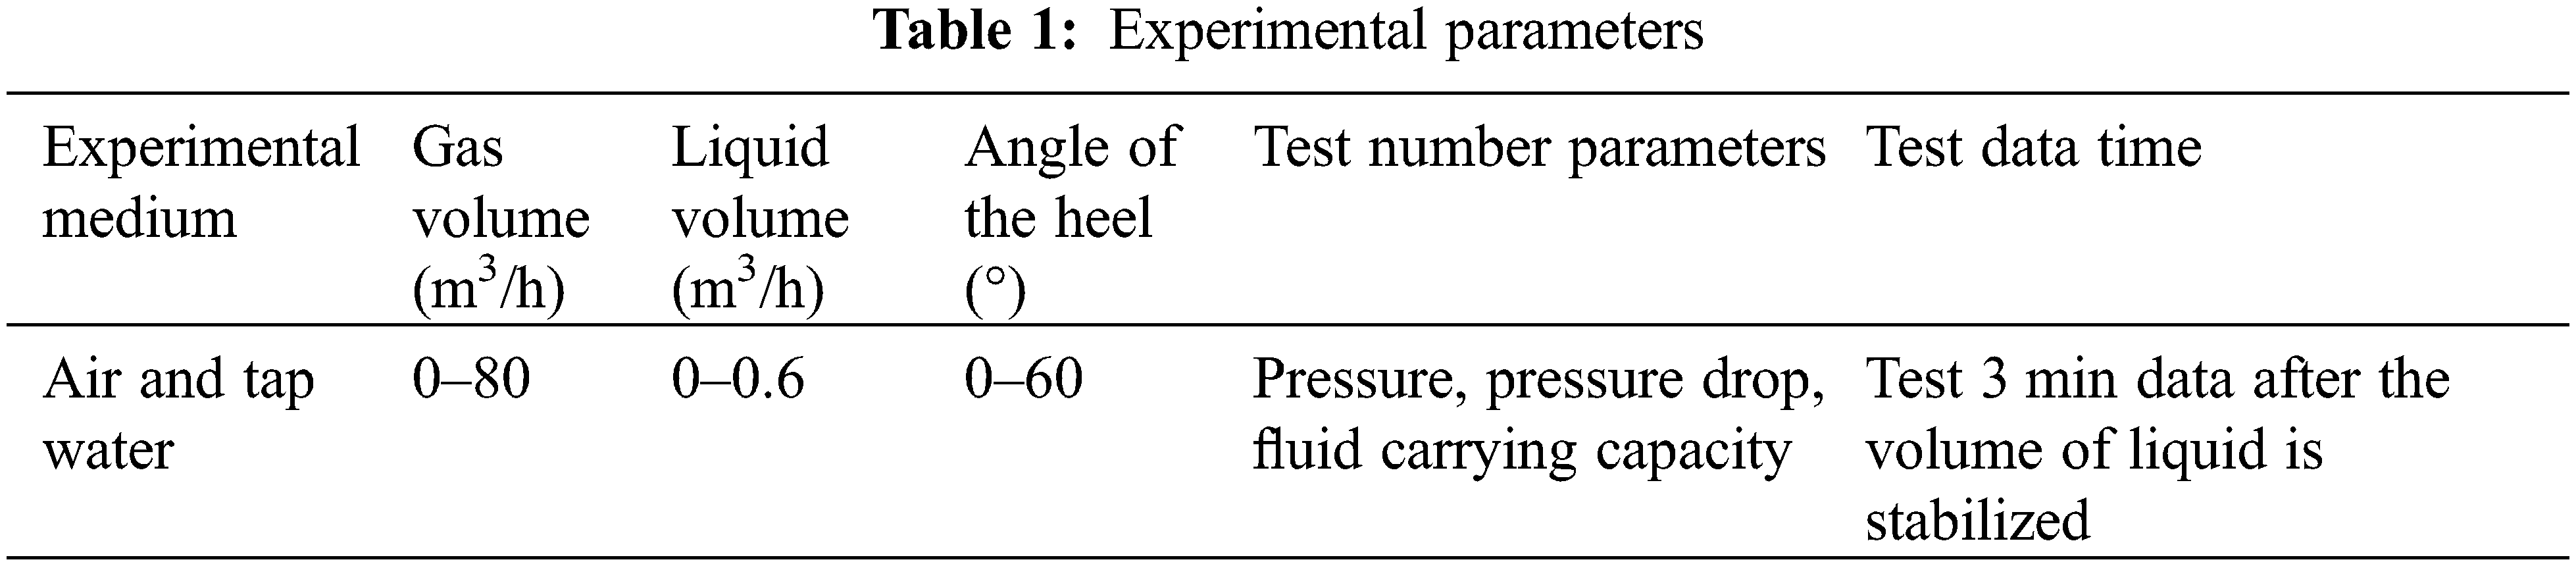
In this experiment, the multiphase flow experimental platform was modified, and we transformed the borehole trajectory of the inclined section of the test system into a borehole trajectory with the same shape as the inclined section of the East China Sea gas field. During the modification process, we used the plasticity of the wire hose and the angle (−10°∼+90°) adjustability of the experimental stand to adjust to different shapes of borehole trajectories and heel angles. According to the heel angle often formed in the East China Sea gas field, the heel angle range was set to 0–60° for this experiment. We connected the wireline hose to the plexiglass tubing in the horizontal section and the plexiglass tubing in the vertical section so that the whole line could simulate the borehole trajectory of the entire East China Sea gas field. The pipeline is 2–3/8 inches in diameter the same size as the East China Sea gas field pipeline. Air and tap water were used as the media for this experiment. The air is compressed through the air compressor to simulate the formation of gas production, and the air compressor is connected to the storage tank after the air compressor. We used a storage tank to eliminate the effect of air compressor pulses on test data and to stabilize pressure. Tap water was injected into the simulated stratigraphic fluid through a centrifugal pump. A large water storage tank was connected to in front of the centrifugal pump to ensure sufficient water supply. The gas in the storage tank was metered by a gas phase flow meter and reached the gas-liquid mixer. The tap water in the storage tank reaches the liquid phase meter through the pump and mixes thoroughly with the gas in the gas-liquid mixer. The fully mixed gas and liquid phases enter the test tube section. During the test, the differential pressure and fluid-carrying data were recorded once per second by the manometers, differential pressure gauges, and weight scales in the metering system. These data were synchronized and uploaded to the computer of the collection system. We used an averaging method when processing pressure data. During the experiment, we adjusted the gas volume adjustment valve opening and liquid volume adjustment valve opening to realize the gas volume and liquid volume change. This ensured experimental diversity and accuracy. This experiment’s gas and liquid volume were set according to the actual gas and liquid production volume of the East China Sea gas field. The gas volume ranges from 0–80 m3/h and the liquid volume ranges from 0–0.6 m3/h. This simulates the fluid-carrying gas flow condition in the East China Sea field. The experimental parameters are presented in Table 1.
3 Effect of Heel Angle on Fluid Drainage
3.1 Effect of Heel Angle on Wellhead Drainage
Wellhead discharge stability is mainly used to reflect the volatility of the gas-liquid two-phase fluid flowing in the wellbore. The volatility will cause the tubular column to vibrate when it reaches a certain range, which can cause safety problems. The analysis of wellhead discharge stability under different fluid flow rates was carried out with an inclined section heel inclined at 55°.
As shown in Fig. 2, when there is a certain heel angle in the inclined section, the formation gas production increases, and the effect on fluctuating fluid-carrying capacity at the wellhead is enhanced. As shown in Fig. 3, when the gas volume reaches a certain energy, the phenomenon of “piston gas topwater [10]” will occur at the heel, and the liquid will be carried out of the wellbore in one stream. This is because the air plugs formed in the inclined well section when the heel angle exists are less uniform than when there is no heel, which makes the fluid discharge more volatile when there is a heel.
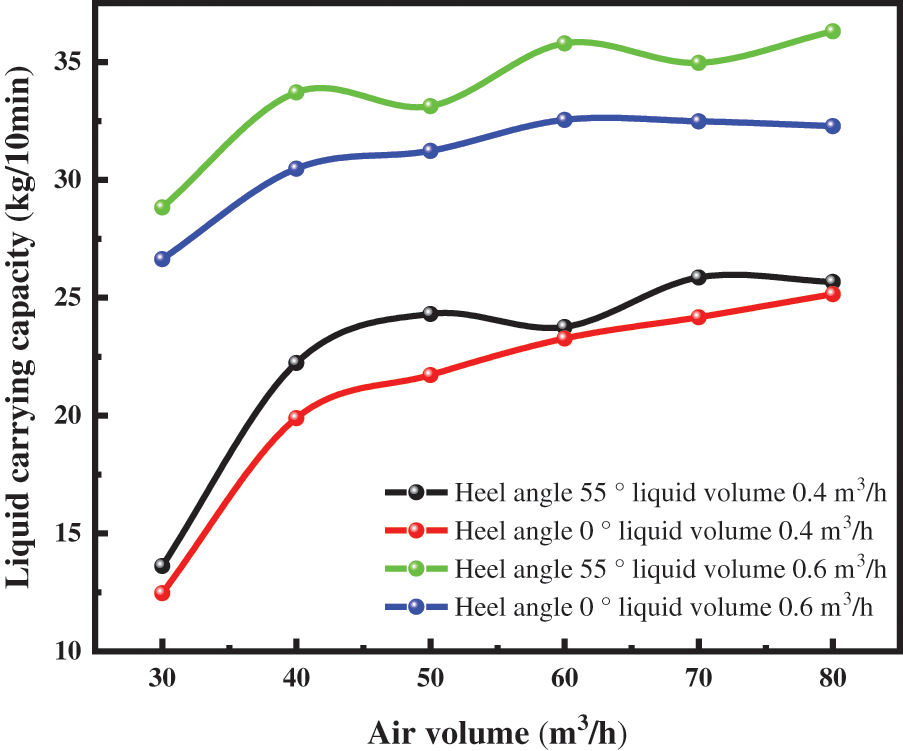
Figure 2: Wellhead drainage stability with different fluid volumes at heel of 55° in inclined section
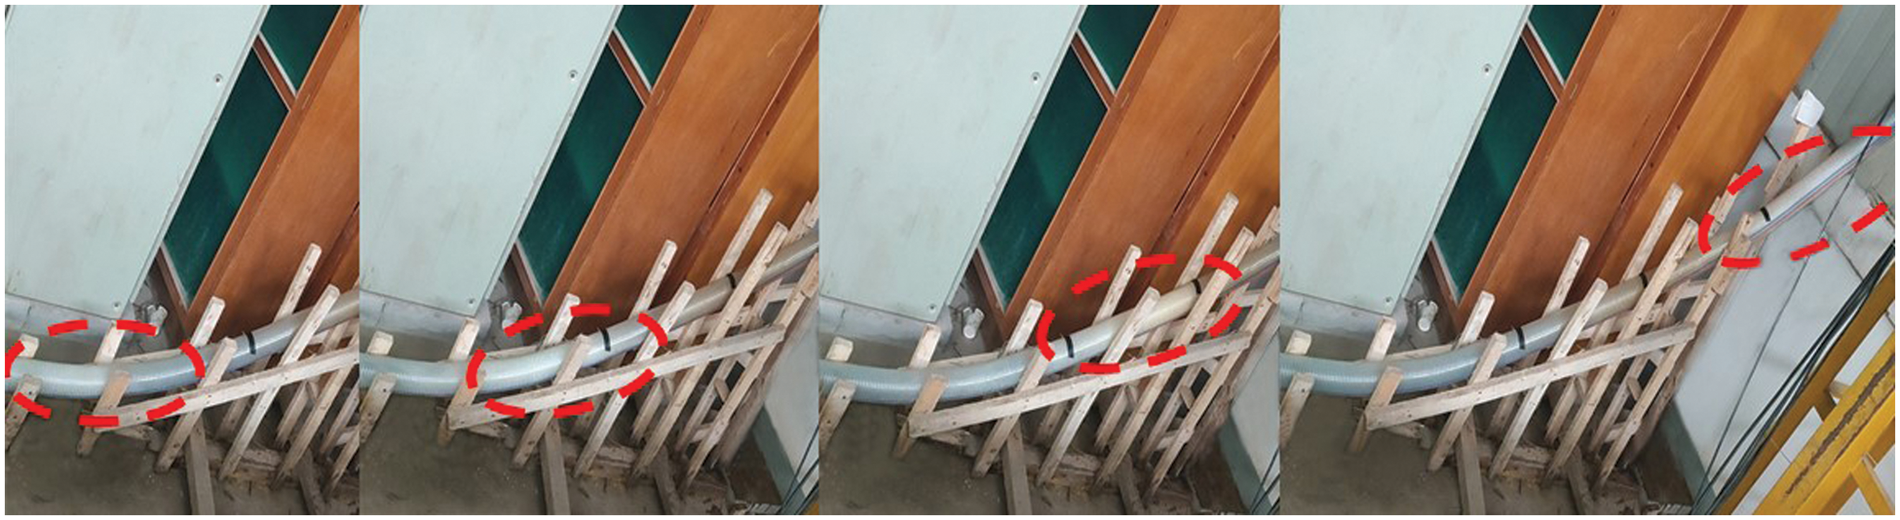
Figure 3: Experimental phenomenon graph
3.2 Effect of Different Heel Angles on the Variation of the Amount of Fluid Carried
The currently implemented models for calculating pressure drop involve calculating the liquid holding rate [12]. The liquid holding rate is the share of the liquid phase area in the total area of the overflow section when the gas-liquid two-phase fluid flows through the overflow section [13]. The wellbore fluid-carrying capacity is calculated based on the wellbore fluid-holding rate (fluid-carrying capacity = total fluid intake − fluid-holding rate). Therefore, obtaining an accurate model for calculating the pressure drop requires a study of the holding rate [14], for which the experimental results are shown in Figs. 4 and 5.
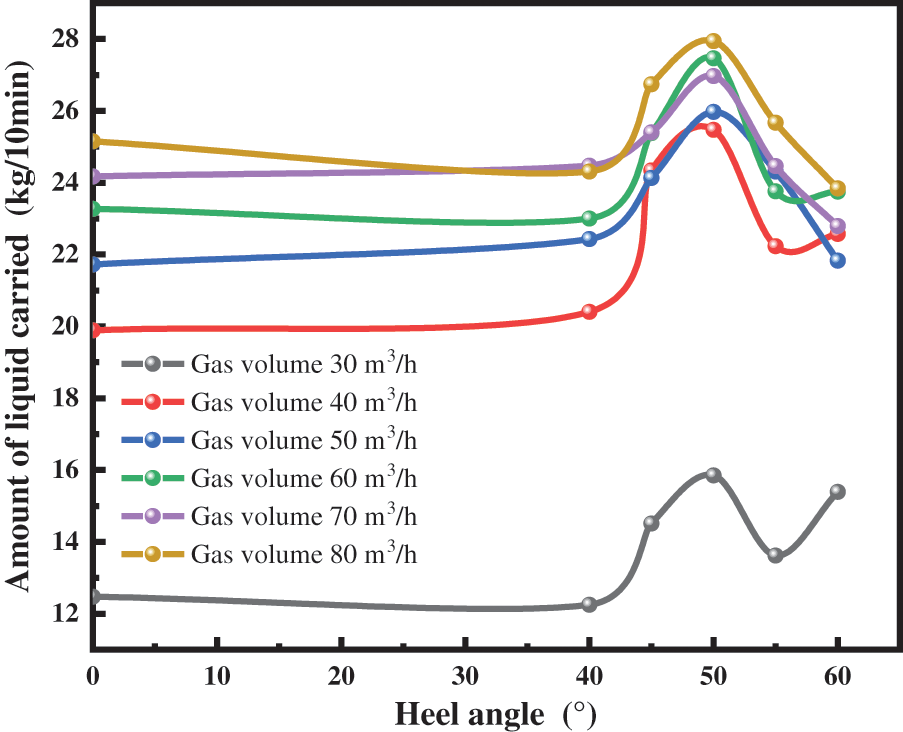
Figure 4: Variation of liquid carrying capacity when liquid volume was 0.4 m3/h
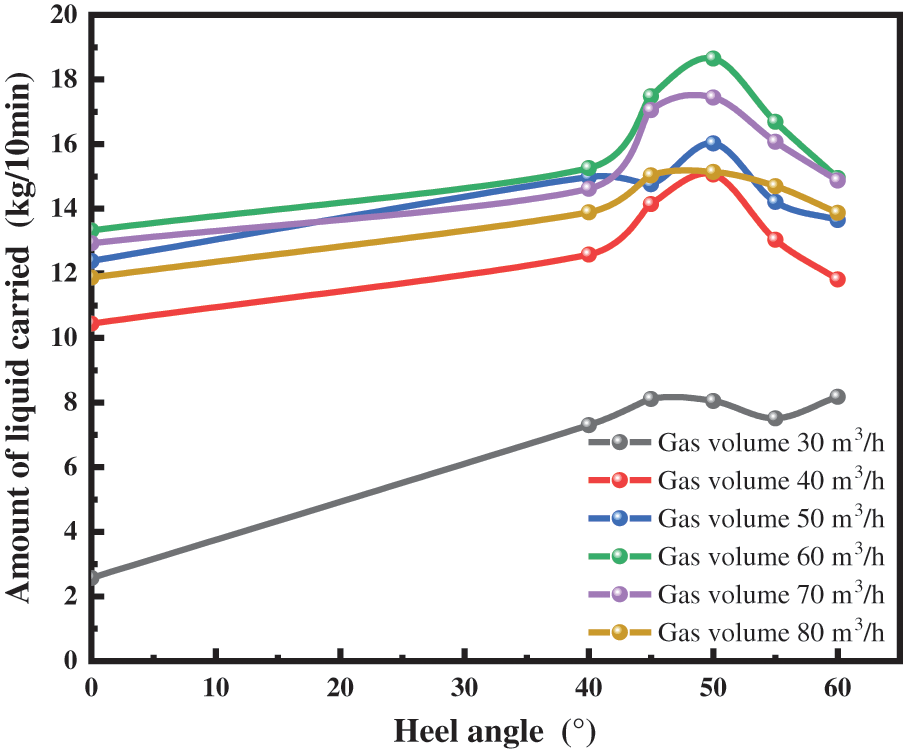
Figure 5: Variation of liquid carrying capacity when liquid volume was 0.6 m3/h
As shown in Figs. 4 and 5, the drainage volume increases with the heel angle and then decreases, and the drainage volume reaches the peak at 50°. This law is similar to the B-B liquid holding rate law. This is because the flow at the heel end of the horizontal section to the 2–2 section is a downslope flow. When the angle is small, the component of gravity is less than the viscous drag force preventing more fluid from being carried out of the wellhead. This is when the fluid collects at the bottom of the heel, which will results in less fluid-carrying capacity. As the heel angle increases, the component of gravity is greater than the viscous drag force. Most of the liquid phase can be carried out of the wellhead, showing a trend of increasing liquid carrying capacity. However, when the angle of the heel is greater than 50°, the curvature of the bottom of the heel increases, and the local loss of the two phases of gas and liquid at the heel increases. Therefore, the liquid phase is not easily carried out, resulting in reduced carrying capacity.
4 The Effect of Slanting Heel Angle on the Law of Pressure Drop
4.1 Effect of Different Heel Angles on Total Pressure Drop
The total pressure drop can reflect the total energy consumption of the wellbore when the fluid is carried by the airflow [11,12]. Pressure drop is the reduction in pressure due to energy loss as the fluid flows in the pipeline. The total pressure drop consists of three main components: repositioning pressure drop, frictional pressure drop, and acceleration pressure drop [15]. This paper will further analyze the effect of different heel angles on airflow fluid-carrying from the energy point of view by comparing the variation law of total pressure drop in the wellbore with different heel angles.
Figs. 6 and 7 show the total pressure drop in the wellbore peaks at a heel angle of 50° for different gas and liquid volumes. During the experiment, we observed this phenomenon through the Plexiglas tube. The airflow is disturbed, and the liquid plug intermittently through the heel of the well-slanting section, causing violent vibrations. Moreover, this phenomenon was most obvious when the heel angle was 50°. This was because there is a pressure loss every time the liquid plug crossed the heel end with the liquid process. The fluid plug frequency is faster at a heel angle of 50° than at other angles. The energy lost when the fluid-transporting air flow leaves the wellbore is high. Therefore the total pressure drop in the wellbore is highest at a heel angle of 50°.
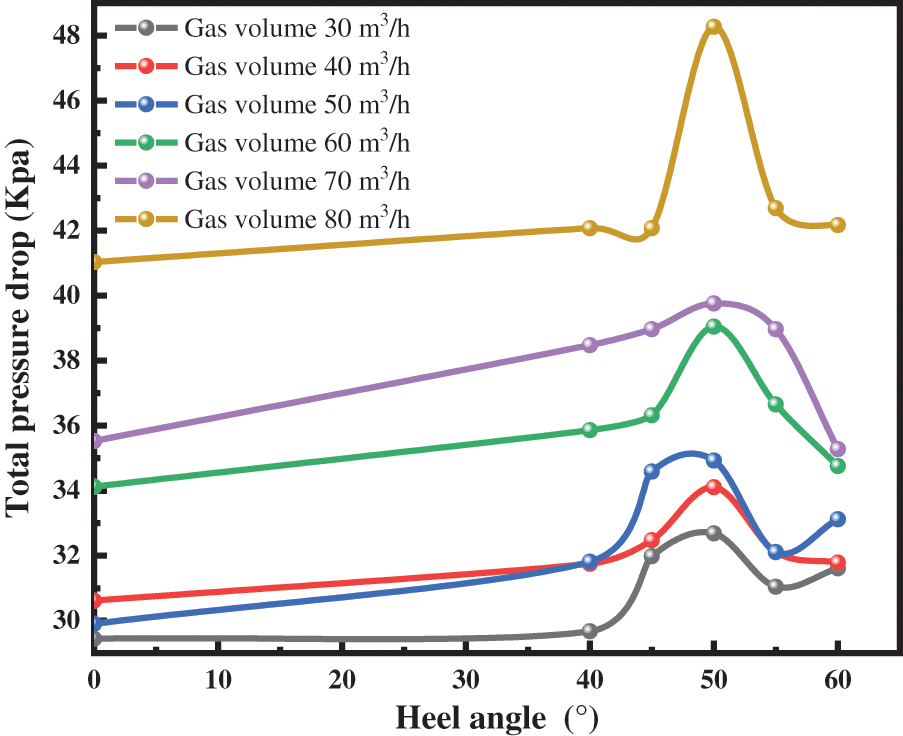
Figure 6: Variation of total pressure drop under different heel angles with liquid volume of 0.2 m3/h
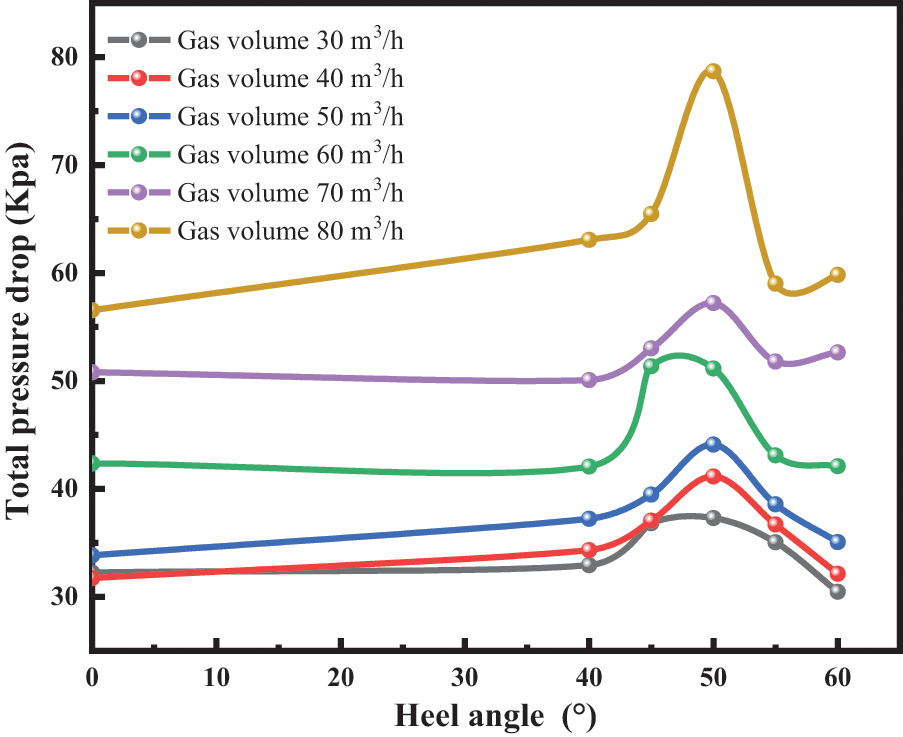
Figure 7: Variation of total pressure drop under different heel angles with liquid volume of 0.6 m3/h
From Figs. 6 and 7, we also see that the total wellbore pressure drop gradually increases as the gas volume increases. This is because when the liquid volume is certain, as the gas volume increases, the slip between the gas and liquid phases and between the gas and liquid and the wellbore occurs. This will lead to a gradual increase in frictional pressure drop. The frictional resistance gradually increases as the air volume increases.
4.2 Effect of Different Heel Angles on Pressure Drop in Inclined Shaft Section
From the total pressure drop variation law, the total pressure drop in the wellbore increases when the heel angle exists, and the increase of this part of the pressure drop may be caused by the increase of the local pressure loss in the inclined section, so it is necessary to study the local pressure loss when the heel exists in the inclined section.
It is known from the total pressure drop variation pattern that when the heel angle exists, the total pressure drop in the wellbore increases, which may be related to the increase in local pressure loss in the inclined section of the well. Therefore, it is necessary to study the local pressure loss in the presence of the heel in the inclined section, and the variation law of pressure drop in the inclined section is shown in Fig. 8.
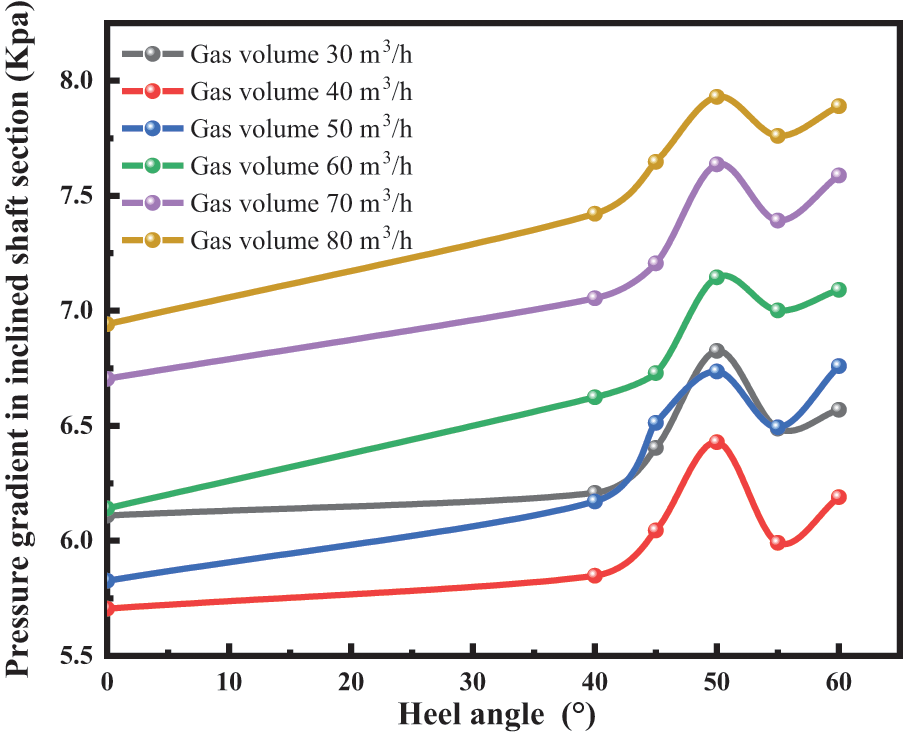
Figure 8: Pressure gradient change rule of inclined section when liquid volume was 0.4 m3/h
As evident from Fig. 8, the presence of a heel in the inclined section results in an overall larger pressure gradient in the inclined section. This is because of the downhill flow at the heel. When the gas volume is small, the liquid phase flows in the production direction under its gravity. The liquid phase forms a temporary column of liquid at the heel. When the gas energy reaches the energy required to break through the liquid column, this will result in the phenomenon of the “piston gas over water effect” (as shown in Fig. 3). This phenomenon will cause an increase in local energy loss at the heel, which will be reflected in an increase in pressure drop and a significant increase in pressure drop in the inclined section of the shaft. Therefore, with the increase of heel angle in the inclined section, the increase of local pressure loss in the inclined section occurs and is the main reason for the increase of total pressure drop in the whole wellbore.
5 Implementation of Calculation Method for Liquid Holding Rate and Pressure Drop in Inclined Section
5.1 Implementation of Calculation Method for Liquid Holding Rate of Inclined Well Section
To address the problem that the increase in local pressure loss in the inclined section is the main reason for the increase in total pressure drop in the whole wellbore. This paper establishes a method for calculating the pressure drop holding rate of the sloping section, which will provide a theoretical basis for subsequent analysis and calculation when a heel exists in the sloping section.
In horizontal wells without heels, we substitute the data to verify the accuracy of the B-B method and the M-B method of calculating the fluid holding rate, respectively. As shown in Fig. 9, the error of the B-B method is in the middle of the two diagonals, which indicates that the calculation error of the B-B method is within 20%, indicating an acceptable level of accuracy. However, as shown in Fig. 10, most points of the calculated values of the M-B method are on the upper side of the diagonal, which indicates that the calculated values of the M-B model are large. Therefore, the B-B method is used as the calculation method for the fluid holding rate in the presence of a heel in the sloping section of horizontal wells.
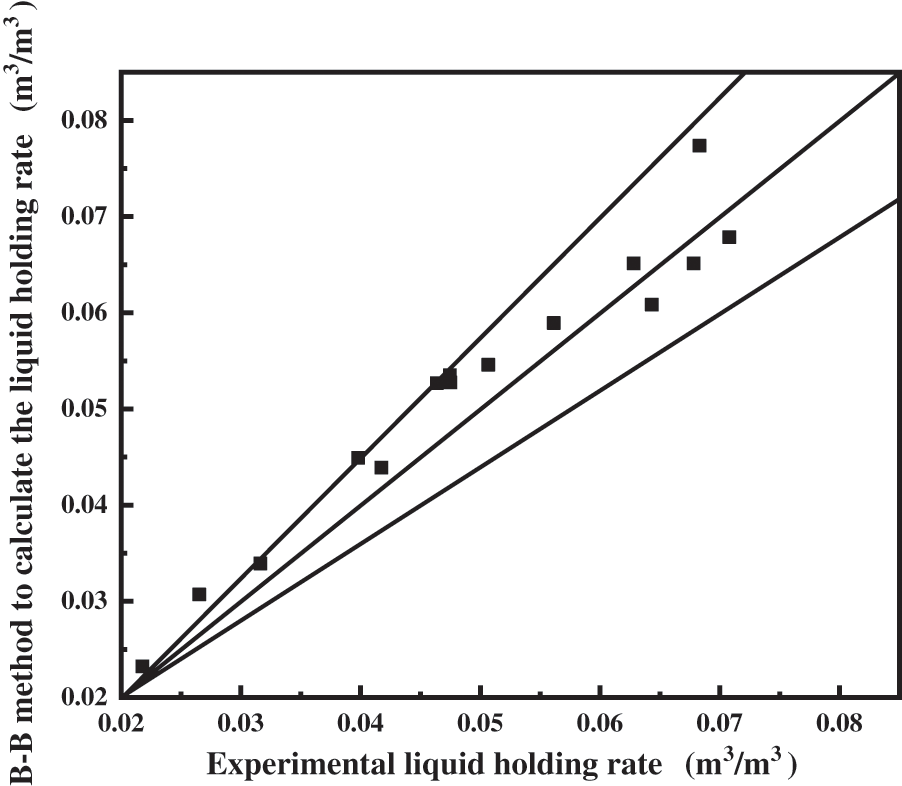
Figure 9: B-B method for predicting fluid carrying capacity in inclined section
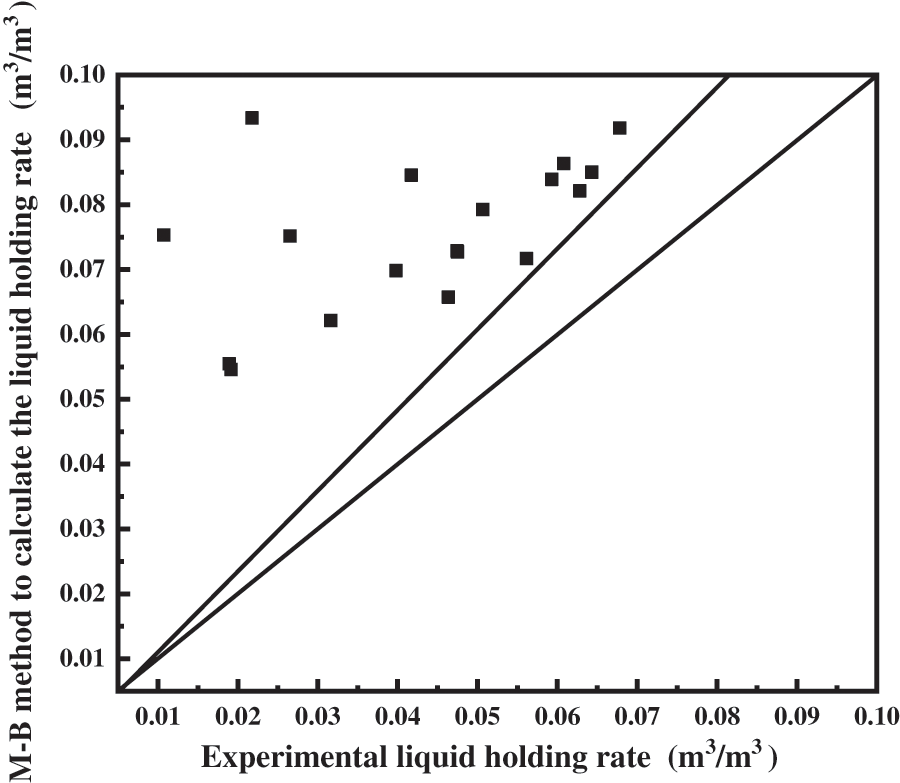
Figure 10: M-B method for predicting fluid carrying capacity in inclined section
Based on the holding rate model developed by B-B, the holding rate of gas-liquid two-phase inclined tube flow during separated flow is calculated by Eq. (1).
where
We brought the experimental data at heel angles of 40°, 45°, 50°, 55° and 60° into the B-B method for regression calculations. The calculated results are shown in Fig. 11, and the fitted correlation coefficient was obtained as 92.03%. The new tilt correction coefficient is shown in Eq. (3).
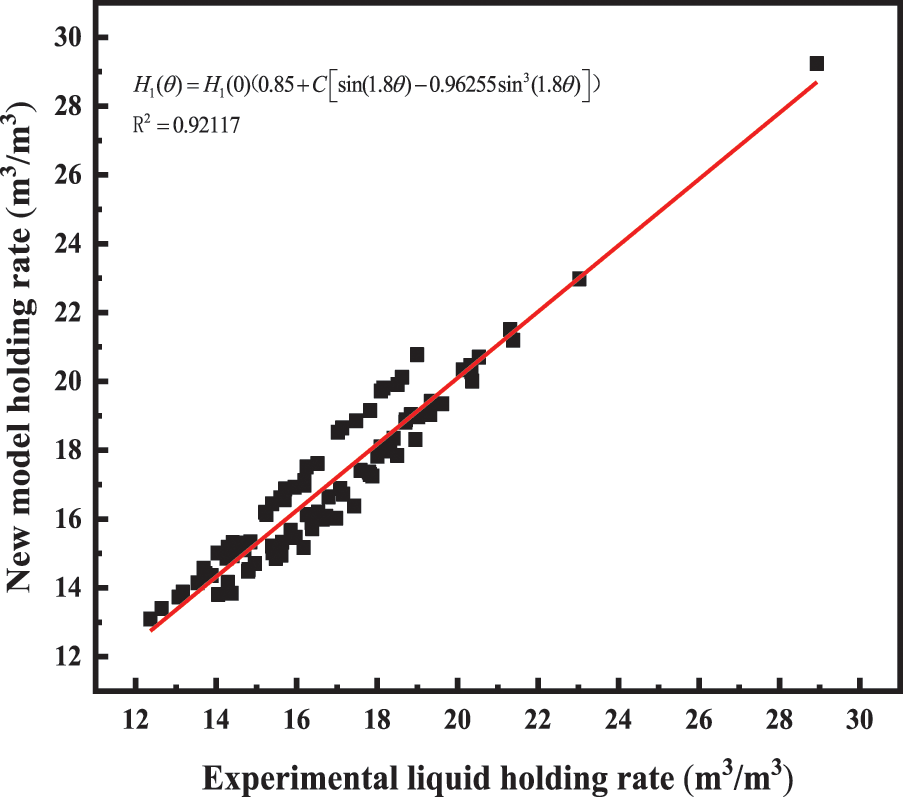
Figure 11: Liquid holdup model error diagram
Eq. (1) can predict the fluid holding rate of the wellbore under different heel angle conditions in the inclined section.
5.2 Implementation of Calculation Method for Pressure Drop in the Inclined Well Section
This paper establishes the pressure gradient relationship equation for different heel angles based on the B-B and M-B methods. The total pressure gradient consists of the sum of the frictional pressure gradient, the differential pressure gradient, and the acceleration pressure gradient [14,15].
We take a micro-element section at the heel of the inclined section of the wellbore as shown in Fig. 12. Based on the principle of conservation of momentum and mass, we establish the wellbore pressure gradient equation as Eq. (4).
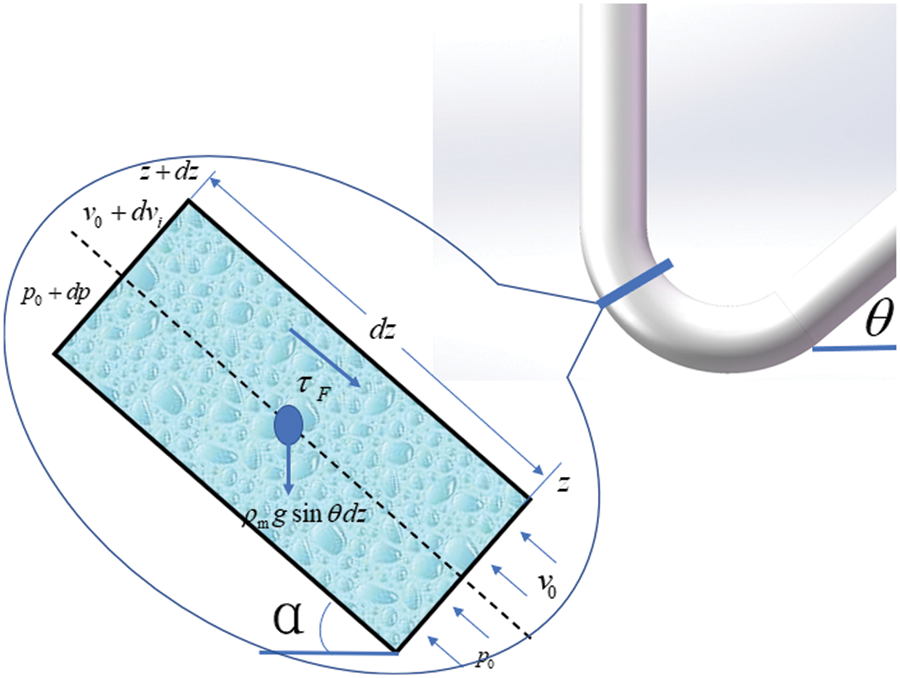
Figure 12: Stable 1D wellbore flow diagram in the presence of heel in the sloping section
The repositioning pressure gradient is mainly caused by the pressure gradient change caused by the height change, and the repositioning pressure gradient calculation formula is Eq. (5).
The acceleration pressure gradient is Eq. (6).
When the heel exists, the frictional pressure drop in the horizontal well-inclined section is divided into inclined pipe section and bent pipe section pressure drop. The calculation method of the inclined pipe section pressure drop, based on the B-B method, is obtained from the calculation formula given as Eq. (7).
The frictional pressure drop in the bend section with a radius of curvature of 1.25–5 m is calculated as (8).
The bend radius is influenced by the radius of curvature [6,7]. Therefore the friction coefficient is calculated as (9).
Our obtained total pressure gradient relationship equation is Eq. (10).
Bringing in the experimentally measured data to fit the frictional pressure drop, we obtain an error plot, as shown in Fig. 13, with a correlation coefficient of 91.115%. The new pressure gradient relationship equation for different curvatures is shown in Eq. (11).
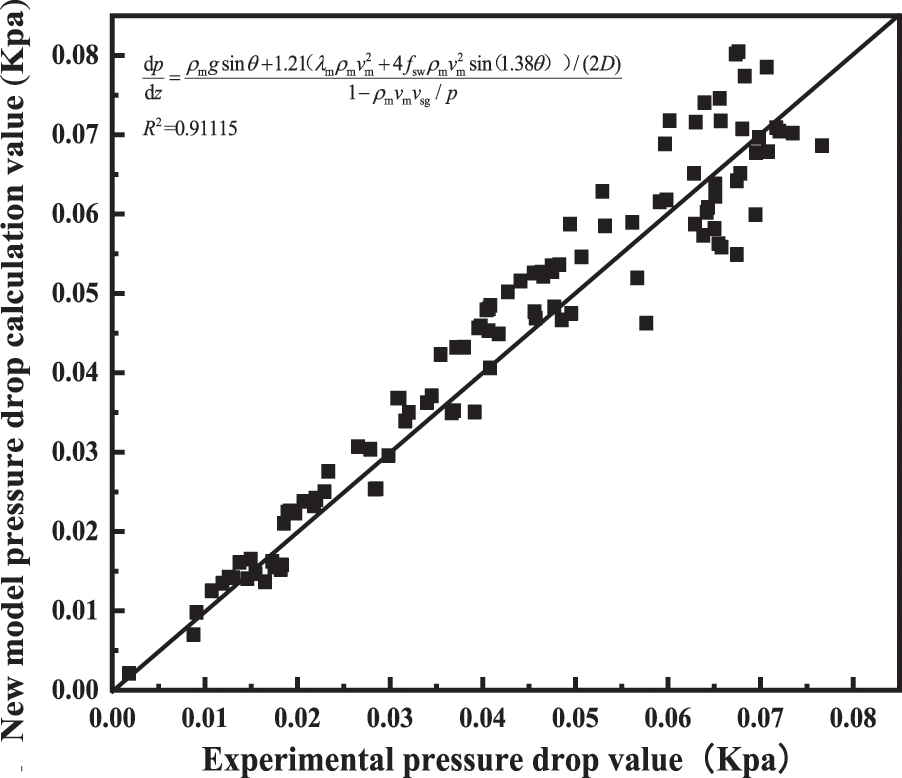
Figure 13: Error diagram of pressure gradient model
We obtain Eq. (11) to accurately predict the pressure drop in the presence of a heel in the sloping section of a horizontal well, where:
(1) By comparing the pressure drop at different heel angles, it was found that the total pressure drop would change abruptly when the heel angle was 50°, and the larger the gas volume, the greater the magnitude of the wellbore pressure drop loss would become. The analysis of the pressure drop in the inclined section shows that the increase in local pressure loss in the inclined section is the main reason for the increase in the total pressure drop in the wellbore.
(2) Based on the analysis of the stability of fluid-carrying capacity under different heel angles, it was found that the fluctuation of fluid-carrying capacity in the wellbore would be enhanced when a heel was present in the inclined section. We compared the existing methods of liquid-holding rate calculation (M-B method and B-B method) and found that the B-B method predicted the liquid-holding rate better. In this paper, by modifying the B-B method, we obtained a method for calculating the fluid-holding rate that can accurately predict the rate for when the heel is present in the slanting section.
(3) Based on the B-B pressure drop calculation method, a new calculation method was introduced to calculate the pressure drop of curvature bend pipe. The new pressure drop calculation method was obtained when the heel existed in the inclined section.
(4) The indoor simulation experimental test results found that a reasonable heel angle increases the pressure loss in the wellbore but helps drain the fluid, so it has some practical significance when there is a certain heel angle in the sloping section of the well.
Funding Statement: The authors would like to acknowledge the support provided by the National Natural Science Foundation of China (No. 62173049) and the Open Fund of the Key Laboratory of Exploration Technologies for Oil and Gas Resources (Yangtze University), Ministry of Education (Grant K2021-17).
Conflicts of Interest: The authors declare that they have no conflicts of interest to report regarding the present study.
References
1. Li, L. (2019). Evaluation of fracture conductivity of channel fracturing in Donghai gas field (Master Thesis). Southwest Petroleum University, China. [Google Scholar]
2. Bao, J. Y., Wang, M. B., Jiang, L. H., Li, H. Z. (2016). Experimental study on foaming agent for foaming drainage of small diameter dosing pipeline in Donghai gas field. Petrochemical Application, 35(8), 39–42. [Google Scholar]
3. Wang, Q., Li, Y. C., Wang, Z. B., Cheng, J. J. (2014). Experimental study and model evaluation on continuous liquid removalin horizontal gas well. Journal of Southwest Petroleum University (Science & Technology Edition), 36(3), 139–145. [Google Scholar]
4. Wang, X. W., Luo, W., Liu, J. (2018). Oil-gas-water multiphase flow prediction. Special Oil and Gas Reservoirs, 25(2), 6. [Google Scholar]
5. Azzi, A., Belaadi, S., Friedel, L. (2000). Two-phase gas/liquid flow pressure loss in bends. Forschung im Ingenieurwesen, 65(10), 309–318. https://doi.org/10.1007/s100100000030 [Google Scholar] [CrossRef]
6. Ding, Y., Lan, C. Y., Liu, J. B., Qiu, F., Yao, L. M. (2017). Calculation method and experimental test of coiled tubing pressure drop. China Petroleum Machinery, 45(2), 96–102. [Google Scholar]
7. Yao, L. M., He, J. C., Liu, J. B., Lan, C. Y., Liu, Y. X. (2016). Calculation methods for pressure drop along downhole bending section of coiled tubing. Oil Drilling & Production Technology, 38(5), 650–656. [Google Scholar]
8. Usui, K., Aoki, S., Inoue, A. (1980). Flow behavior and pressure drop of two-phase flow through C-shaped bend in vertical plane, (I) upward flow. Journal of Nuclear Science and Technology, 17(12), 875–887. https://doi.org/10.1080/18811248.1980.9732670 [Google Scholar] [CrossRef]
9. Sharma, A., Mallick, S. S. (2021). An investigation into pressure drop through bends in pneumatic conveying systems. Particulate Science and Technology, 39(2), 180–191. https://doi.org/10.1080/02726351.2019.1676348 [Google Scholar] [CrossRef]
10. Cheng, Y., Cheng, F. X., Li, L., Liu, R. Q., Liu, Z. (2021). Experiment study on the influence of the borehole shape on liquid accumulation in horizontal gas wells. Petroleum Geology & Oilfield Development in Daqing, 40(4), 80–86. [Google Scholar]
11. Brito, R. M. (2015). Effect of horizontal well trajectory on two-phase gas-liquid flow behavior (Ph.D. Thesis). The University of Tulsa, USA. [Google Scholar]
12. Muthu, P., Varunkumar, M. (2016). Flow in a channel with an overlapping constriction and permeability. International Journal of Fluid Mechanics Research, 43(2), 141–160. [Google Scholar]
13. Ajani, A., Kelkar, M., Sarica, C., Pereyra, E. (2016). Foam flow in vertical gas wells under liquid loading: Critical velocity and pressure drop prediction. International Journal of Multiphase Flow, 87, 124–135. [Google Scholar]
14. Eaton, B. A., Knowles, C. R., Silberbrg, I. H. (1967). The prediction of flow patterns, liquid holdup and pressure losses occurring during continuous two-phase flow in horizontal pipelines. Journal of Petroleum Technology, 19(6), 815–828. [Google Scholar]
15. Beggs, D. H., Brill, J. P. (1973). A study of two-phase flow in inclined pipes. Journal of Petroleum Technology, 25(5), 607–617. [Google Scholar]
16. Brill, J. P. (1987). Multiphase flow in wells. Journal of Petroleum Technology, 39(1), 15–21. [Google Scholar]
17. Mukherjee, H., Brill, J. P. (1983). Liquid holdup correlations for inclined two-phase flow. Journal of Petroleum Technology, 35(5), 1003–1008. [Google Scholar]
18. Mukherjee, H. (1979). An experimental study of inclined two-phase flow (Ph.D. Thesis). The University of Tulsa, USA. [Google Scholar]
Cite This Article
 Copyright © 2023 The Author(s). Published by Tech Science Press.
This work is licensed under a Creative Commons Attribution 4.0 International License , which permits unrestricted use, distribution, and reproduction in any medium, provided the original work is properly cited.
 Downloads
 Citation Tools