
 Submit a Paper
 Propose a Special lssue
 Open Access
ARTICLE

In Tube Condensation: Changing the Pressure Drop into a Temperature Difference for a Wire-on-Tube Heat Exchanger
Energy and Renewable Energies Technology Center, University of Technology-Iraq, Baghdad, 65035, Iraq
* Corresponding Author: Miqdam T. Chaichan. Email:
(This article belongs to the Special Issue: Recent advancements in thermal fluid flow applications)
Fluid Dynamics & Materials Processing 2023, 19(9), 2201-2214. https://doi.org/10.32604/fdmp.2023.027166
Received 17 October 2022; Accepted 19 January 2023; Issue published 16 May 2023
 View Full Text
 Download PDF
Abstract
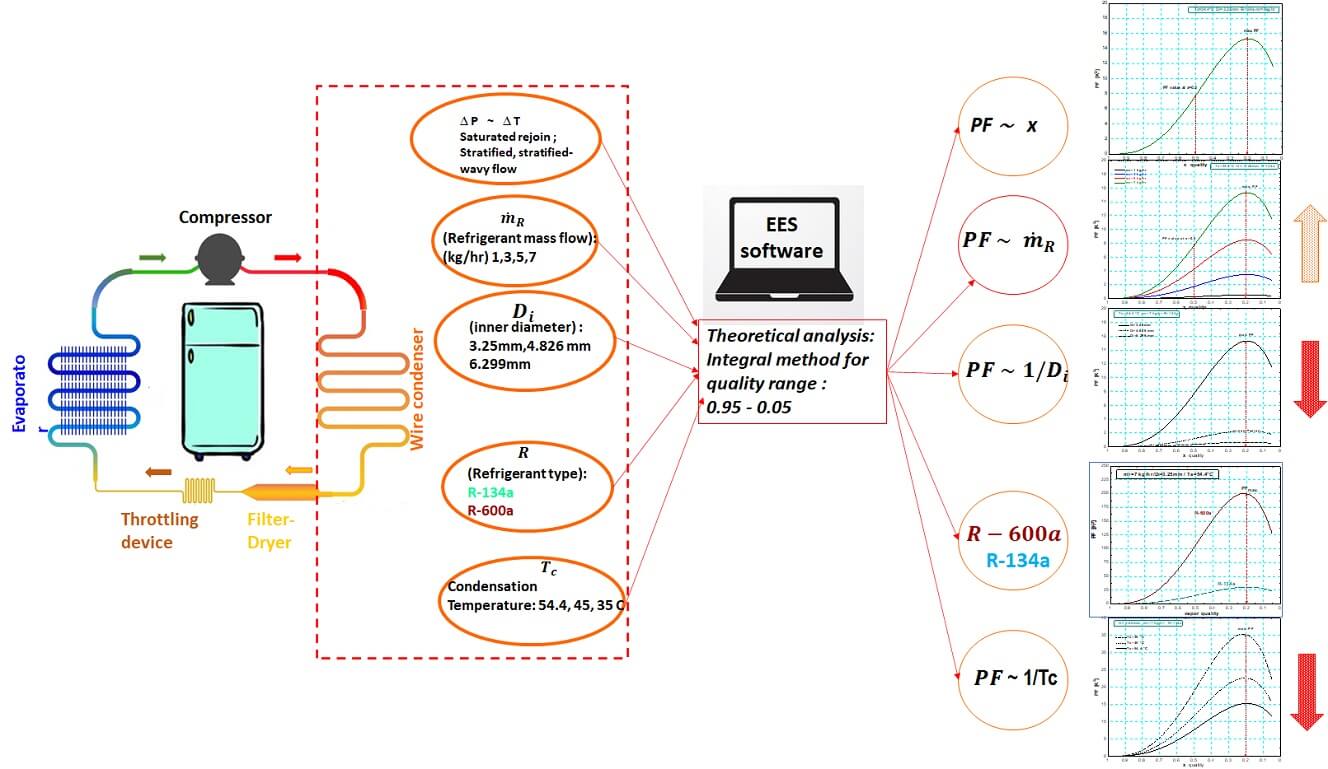
A theoretical study based on the Penalty factor (PF) method by Cavallini et al. is conducted to show that the pressure drop occurring in a wire-on-tube heat exchanger can be converted into a temperature difference for two types of refrigerants R-134a and R-600a typically used for charging refrigerators and freezers. The following conditions are considered: stratified or stratified-wavy flow condensation occurring inside the smooth tube of a wire-on-tube condenser with diameter 3.25, 4.83, and 6.299 mm, condensation temperatures 35°C, 45°C, and 54.4°C and cover refrigerant mass flow rate spanning the interval from 1 to 7 kg/hr. The results show that the PF variation is not linear with vapor quality and attains a maximum when the vapor quality is 0.2 and 0.18 for the R-134a and R-600a refrigerants, respectively. The PF increases with the refrigerant mass flow rate if the inner diameter and saturation temperature constant, and it decreases on increasing the inner diameter to 6.299 mm for constant refrigerant mass flow rate and saturation temperature. The PF for R-600a is higher than that for R-134a due to the lower saturation pressure in the first case. Furthermore, a stratified flow produces higher PF in comparison to the annular flow due to the effect of the surface tension.Graphic Abstract
Keywords
Nomenclature
| A | Area m2 |
| αtp | Two-phase heat transfer coefficient W/m2·K |
| Di | Inner diameter m |
| μ | Dynamic viscosity N.s/m2 |
| f | Friction factor |
| ρ | Density kg/m3 |
| G | Mass velocity kg/s·m2 |
| hlg | Specific enthalpy of evaporation kJ/kg |
| subscripts | |
| L | Length m |
| ci | Cross section inside ci |
| | Refrigerant flow rate kg/hr |
| g | Gas g |
| P | Pressure N/m2 |
| l | Liquid l |
| PF | Penalty factor K2 |
| f | Friction f |
| Q | Heat transfer W |
| sat | Saturation |
| Re | Reynold number |
| Max. | Maximum |
| T | Temperature K or °C |
| ΔTsr | Saturation refrigerant temperature difference between two sections K |
| ΔTdr | The temperature difference between the refrigerant and the surface K |
| ν | Specific volume m3/kg |
| x | Vapor quality |
| z | Axis with length |
Refrigerators and freezers work according to the vapor compression refrigeration system which use wire-on-tube condensers to transfer heat to the environment and because of their simple construction, ruggedness, and low cost. The wire-on-tube condenser consists of a low carbon steel tube of single passage serpentine shape that carries the fluid inside, and the tube diameters are usually 3.25, 4.83, or 6.3 mm. Solid steel wires are spot welded to the outer tube surface in a double array to increase the heat transfer over an extended area. Thermal analysis of the wire-on-the tube condenser is important for energy conservation as energy waste in any form will decrease the efficiency of the condenser. In-tube condensation analysis uses to give attention to the entropy generation due to the heat transfer and pressure drop. The Penalty factor (PF) like the entropy generation can be used to determine the quantitatively and quality of the thermal energy transformation.
The condensation in heat exchangers is a part of the vapor compression refrigeration system and has been discussed by many researchers in recent years. Berto et al. [1] measured the heat transfer inside a small vertical tube. Cavallini et al. [2–4] experimentally studied the heat transfer condensation in side tubes for many types of refrigerants. The studies investigated the effect of the mass flux, vapor quality, and different saturation temperatures on the value of the heat transfer coefficient when the flow is annular. The results were compared with many previous relations reported by other researchers. Del Col et al. [5] studied and analyzed the condensation of zeotropic refrigerants. The study suggested a new model to find the heat transfer coefficient depending on the flow regimes. Diani et al. [6] completed comparing the study for condensation inside a tube for new refrigerants which are the alternative for R-134a. Jajja et al. [7] experimentally studied the pressure drop and heat transfer condensation inside a tubes for new refrigerants R-545B and R-32 used in replacement for R-410A, which depended on the variables; mass flux, saturation temperature, and vapor quality. Khairul Bashar et al. [8] suggested a new correlation for the pressure drop inside smooth and micro-fin tubes. Longo et al. [9] studied the pressure drops during the condensation inside the horizontal tube of 4 mm diameter for a group of refrigerants. The results showed that the pressure drop is affected by the variables; mass flux, vapor quality, and saturation temperature, meanwhile the heat transfer is affected by mass flux and vapor quality only. Li et al. [10] used a coated tube of 4 mm diameter to experimentally study the convection condensation. The results recommended showed that the coated tube increase the heat transfer like the micro fin tube. Li et al. [11] theoretically studied the condensation inside horizontal micro-fin tubes de. The PF and the enhancement factor were used to compare between the working fluids’ heat transfer and pressure drop. The heat transfer and pressure drop for the wire-on-the tube condenser experimentally studied by Mahdi et al. [12]. The heat transfer for a group of refrigerants inside small-diameter tubes was experimentally studied in a previous work [13].
All the documentation about the condensation suggests theoretically, keeping the pressure constant in the condensation process results the condensation saturation temperature remaining constant too. In fact, there is a pressure drop during the condensation due to heat exchange and friction between the refrigerant and the tube’s inside the wall. The total pressure drops lead to a dropping of the saturation temperature of the refrigerant.
The important research that deals with the change of the pressure drops into temperature difference is reported by Cavallini et al. [14–16]. The author defined that, first, the heat transfer by the temperature difference between the fluid and the internal surface, and second, the pressure drop is represented by the difference between the refrigerant temperatures of inlet/outlet sections. The combination of these two-temperature differences is called the penalty factor. Cavallini presented the results, in the form a graph, for the relationship between the penalty factor and the heat transfer coefficient for many types of refrigerants at vapor quality 0.5 and condensing temperatures 45°C, 39°C for tube diameters 7.69 and 8 mm, and an annular flow pattern. Previous studies by Cavallini et al. [14–16] focused just on the annular flow pattern at limited conditions of saturation temperature, vapor quality, and tube diameter. Therefore, the main purpose of this study is to analyze the change in the values of PF within the range of vapor quality between 0.95 to 0.05. Furthermore, we study the effect of condenser working temperatures (35°C, 45°C, and 54.4°C) on PF values at the saturation region.
2 Modelling and Theoretical Analysis
The PF method depends on the temperature difference between the refrigerant and the outside environment, which represents the heat transfer and the change of the refrigerant temperature between the inlet and outlet which occurs due to the pressure drop as represented in Fig. 1.
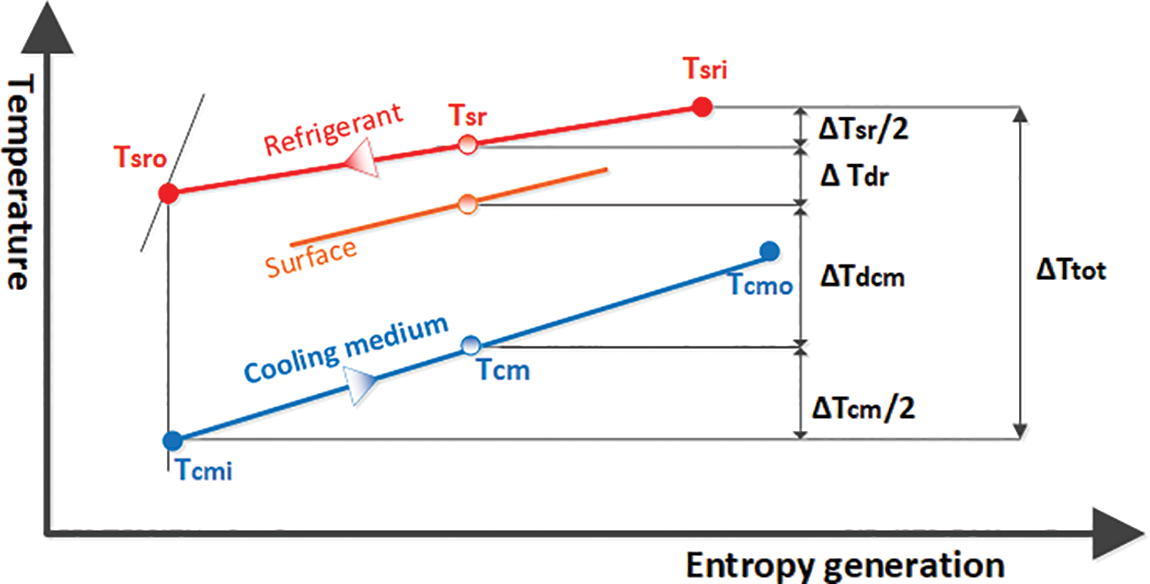
Figure 1: The temperature cases for entropy generation in condensation
The thermal analysis assumptions must be considered, including:
• The average heat flux is constant.
• The external heat transfer resistance is constant (cooling fluid convection + fins + tube wall).
• The cooling fluid temperatures (inlet/outlet) are constant.
• The cross-sectional area of the tube is constant along the heat transfer length.
• The properties of the refrigerant during the heat exchange are stable.
• The kinetic and potential energies are negligible.
• The selected conditions of the flow pattern for the two-phase regime are stratified, stratified-wavy, and intermittent flow types according to previous works [17–20].
• The effect of smooth surface inside tube diameter (3.25, 4.83, 6.3 mm) on the value of the PF. These values of tube diameter are the recommended sizes for manufacturing the wire-on tube condenser of the refrigerator and freezer.
• The values of refrigerant mass flow rate are 1, 3, 5, and 7 kg/hr which cover the household compressors’ capacities for the horsepower ranges from 1/12 to 1/3.
• The condenser working temperatures are (35°C, 45°C, and 54.4°C). The reason for depending on 54.4°C because it is suitable for the tropical environment where the ambient temperature is around 43°C according to ASHRAE standard 34 [21].
By using the Clausius-Clapeyron equation, the refrigerant saturation temperature gradient can be calculated from the frictional pressure gradient and fluid properties as following [14]:
The saturation temperature difference can be converted into an equation of pressure drop:
when z is the axis of the flow with the length:
The heat of the refrigerant can be represented by [22]:
where:
By substituting in Eq. (4):
The form of the equation with the length:
To find the friction pressure for the two-phase flow region according to the Muller–Steinhagen and Heck correlation, ASHRAE fundamental [23]:
where
According to Cavallini’s studies [14–16], the penalty factor is explained in the following equation:
The theoretical analysis above uses the integration method for examining the condensation inside tubes of the wire on tube condenser depending on the Equal Equations Solver software.
3.1 The Variation of PF with Vapor Quality
The variation of PF with vapor quality for working refrigerants R-134a and R-600a when the saturation temperature is 54.4°C, the inner diameter is 3.25 mm, and the mass flow rate 7 kg/hr is shown in Figs. 2a and 2b, respectively. The PF started low at the beginning regime of the condensation at vapor quality 0.95. The PF increases to a maximum value of 30.56 at vapor quality 0.2 for R-134a, while for R-600a the PF max is 200 at x = 0.18. The PF variation with vapor quality is not linear as shown in Fig. 2. The PF starts with a low value at 0.95 and increases slightly till x = 0.7 which the change is sharp as it increases to a maximum value. This increase can be considered linear in the range quality of (0.7–0.3), then the PF decreases. The behavior of the PF is low increasing at the start range for x = (0.95–0.7) due to the type of the flow pattern in the inertance where the gas enters the wire-on-tube condenser as superheat in superheat regime and when it enters the saturation regime the flow begins to change to stratified or stratified -wavy type between vapor quality (0.7–0.3) till the maximum value [20]. This type of flow pattern causes this behavior in this quality. The flow takes a short period after that and changes into the intermittent flow (containing the plug and slug flow) that causes the drop in the value of the PF and then completely changes to liquid at the end of condensation [17–19].
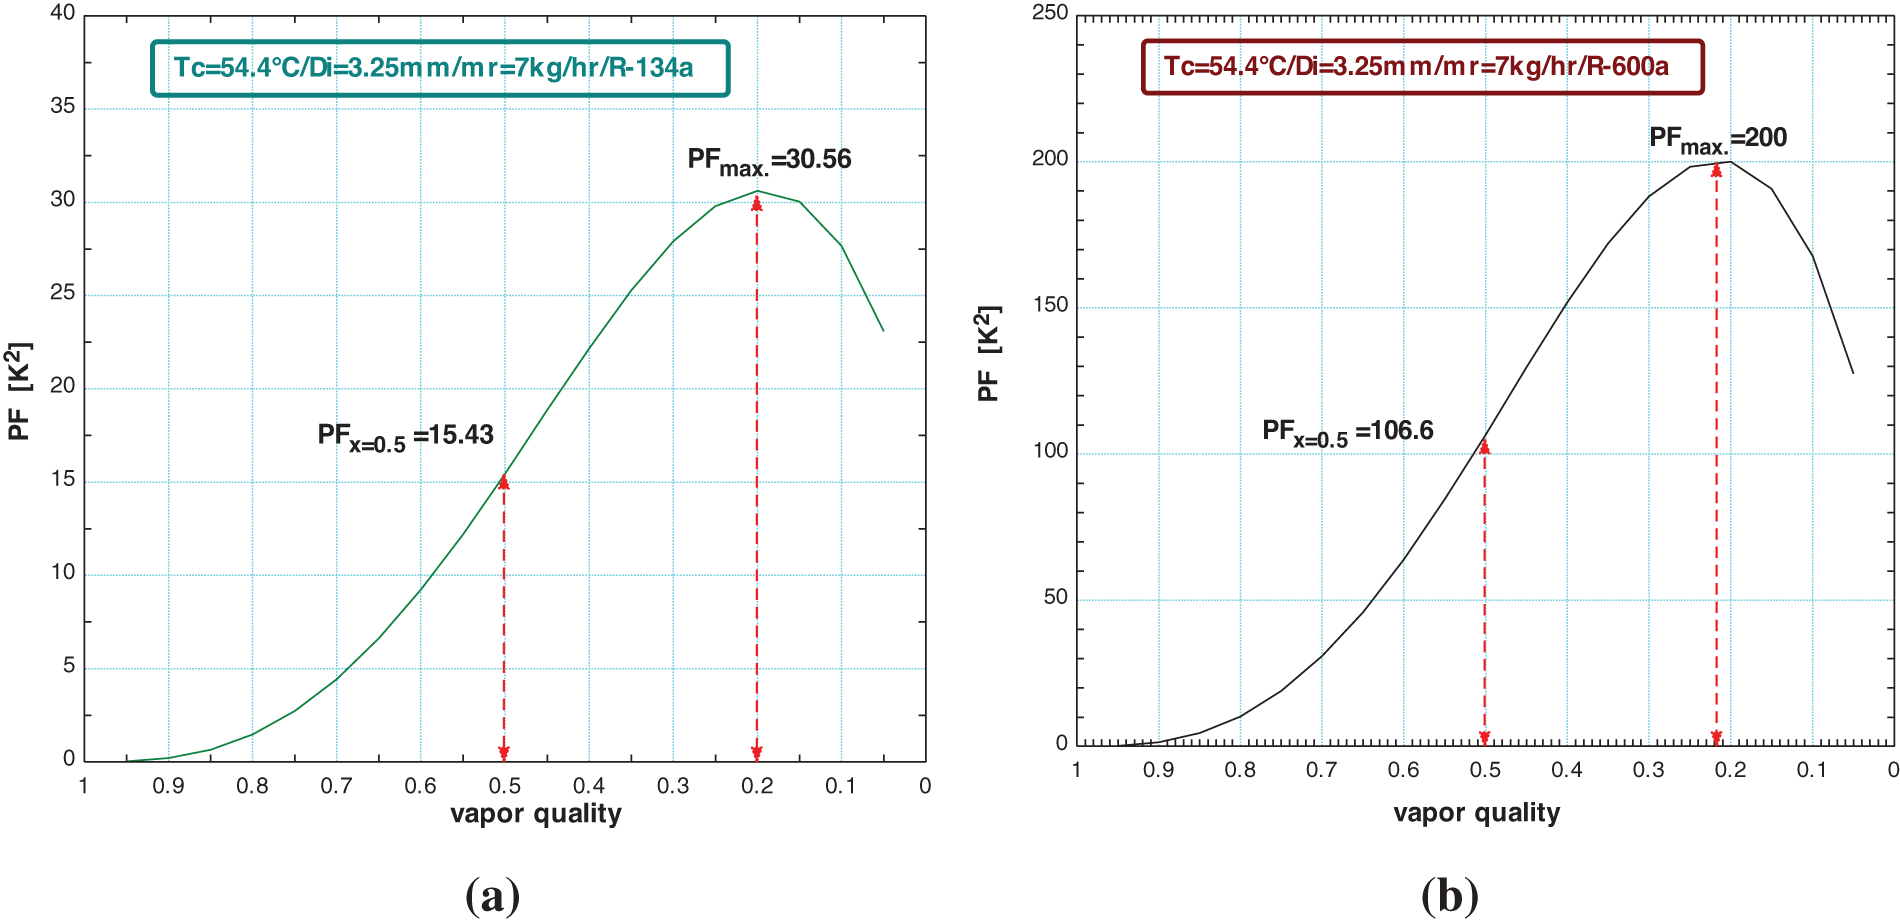
Figure 2: The variation of PF with vapor quality for a) R-134a b) R-600a
The value of the PF at vapor quality 0.5 is 15.43 for R-134a, that is the average value of the PF along the condensation process and PF = 106.6 at x = 0.5 for R-600a, also the maximum values for PFmax. The reason for that is that the refrigerant with low saturation pressure produces high PF for R-600a than R-134a according to previous studies [14–16].
3.2 The Variation of PF with Quality for Different Mass Flow Rates
Figs. 3a and 3b shows the PF and the vapor quality variation for a different mass flow rate for R-134a and R-600a when the inner diameter is 3.25 mm and the condensation saturation temperature is 54.4°C. The maximum value of PFmax is 1.02 when the refrigerant mass flow is 1 kg/hr. At a mass flow rate of 3 kg/hr, the PFmax increases to 6.95, and PFmax = 16.99 for mass refrigerant is 5 kg/hr. Finally, at a mass flow rate of 7 kg/hr, the PFmax is 30.56. The increase in the value of the PF is due to the increase in the entropy generation which occurs due to heat exchange and friction pressure drop when the refrigerant mass flux increase. Fig. 3b is clarifying the same behavior for R-600a where the maximum value of PFmax is 10 when the refrigerant mass flow is 1 kg/hr. At a mass flow rate equal to 3 kg/hr, the PFmax increases to 40, and PFmax = 110 for mass refrigerant is 5 kg/hr. Finally, at a mass flow rate of 7 kg/hr, the PFmax is 200. The percentage increase in the PF for the different mass flow rates of each refrigerant is given in Table 1.
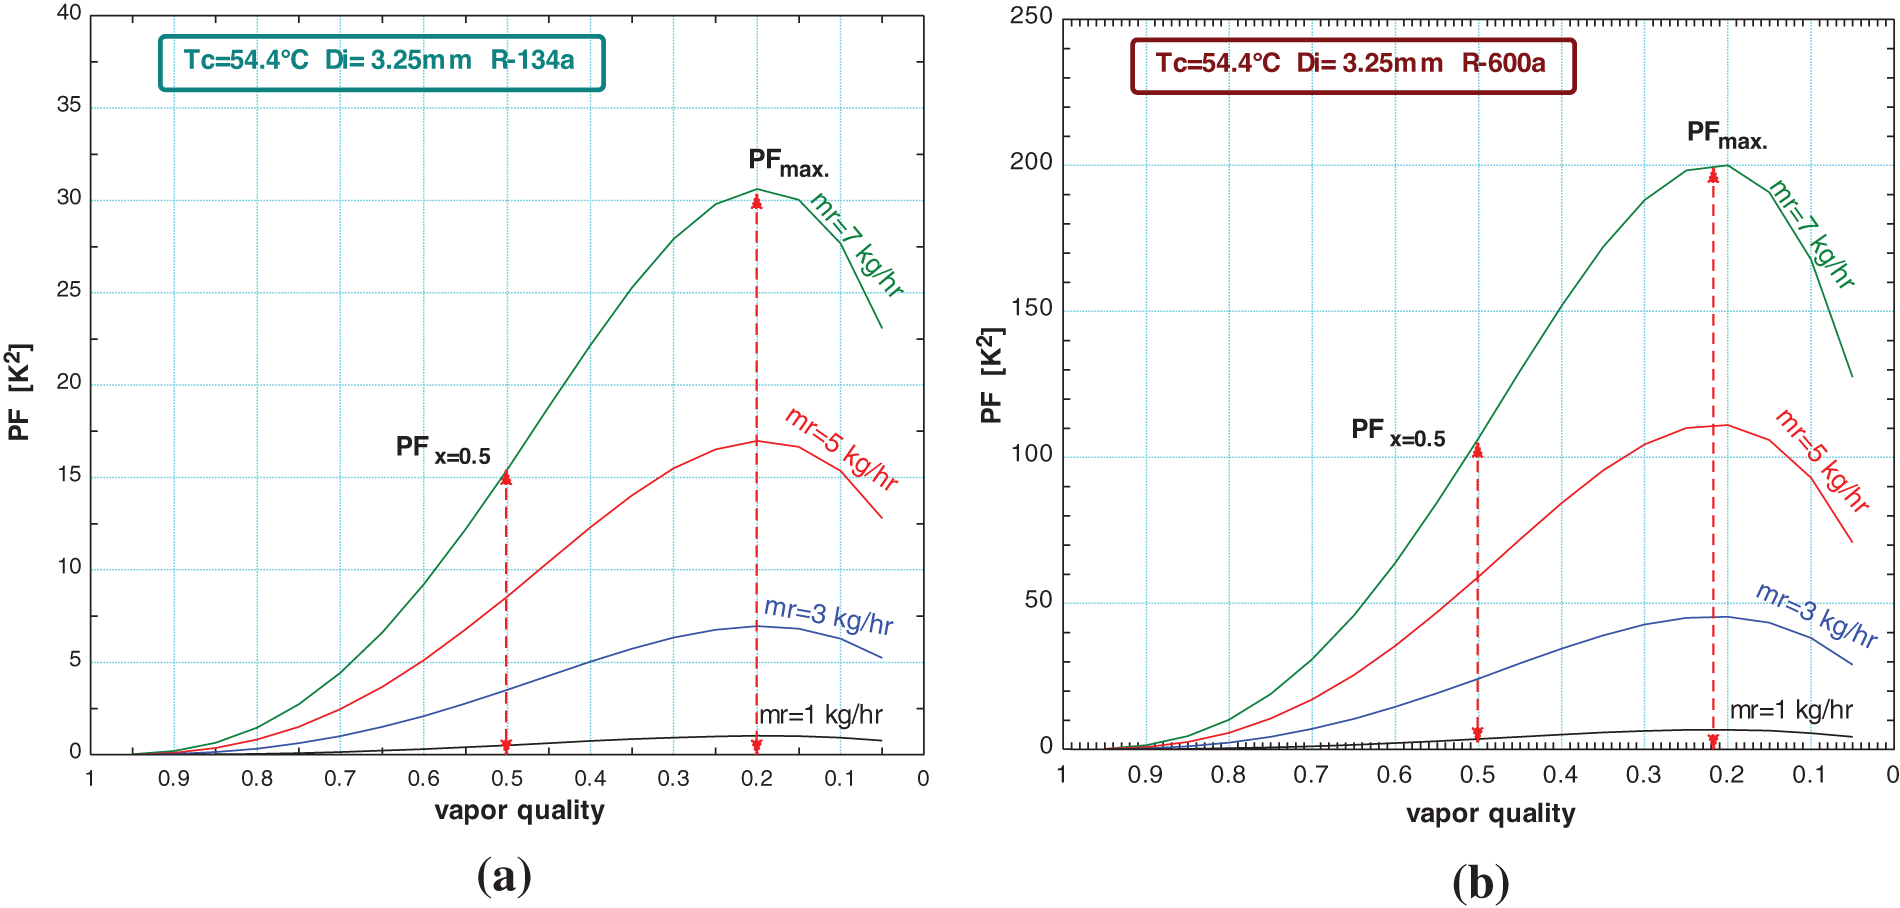
Figure 3: Effect of different refrigerant mass flow rates on PF and the vapor quality variation for a) R-134a b) R-600a
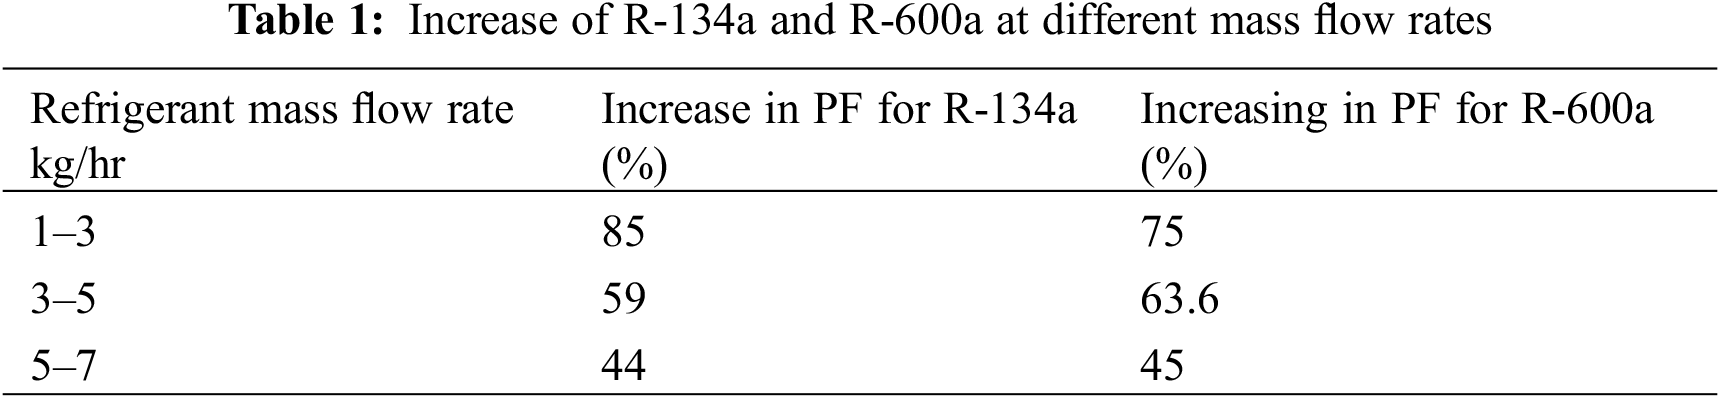
The average percentage increase between the two refrigerants is 85%.
3.3 The Inner Diameter Effect on PF
The effect of the inner diameter on the PF for the two types of refrigerants is shown in Figs. 4a and 4b. For the inner diameter of 3.25 mm, the saturation temperature of 54.4°C, and the mass flow rate of the refrigerant is 7 kg/hr, the PF value reaches the maximum. This is due to the increase in the turbulent flow in the narrow tube causing high entropy generation due to the heat transfer and the pressure drop. The PFmax is 30.56 at x = 0.2, while for the inner diameter of 4.82 mm, the value drops to 2, and with an inner diameter of 6.299 mm the PFmax is equal to 0.43 for R-134a. For R-600a as in Fig. 4b, The PFmax is 200 at x = 0.18 when the inner diameter is 3.25 mm, while for the inner diameter of 4.82 mm, the value drops to 30, and with the inner diameter of 6.299 mm, the PFmax is equal to 10. This means the entropy generation is reduced with an increase of the inner diameter. Previous research [20] has shown small tube diameter that for, the surface tension had an important effect on the heat transfer and the change between the types of flow pattern. The reduction in the PF can be related to the increases in the heat transfer area which improves the heat exchange and reduces the entropy generation. This good result (the reduction in the PF with the increasing of tube diameter) can be applied to improving household refrigerators and freezers by manufacturing the wire-on-tube condenser with a diameter of not less than 4.826 mm.
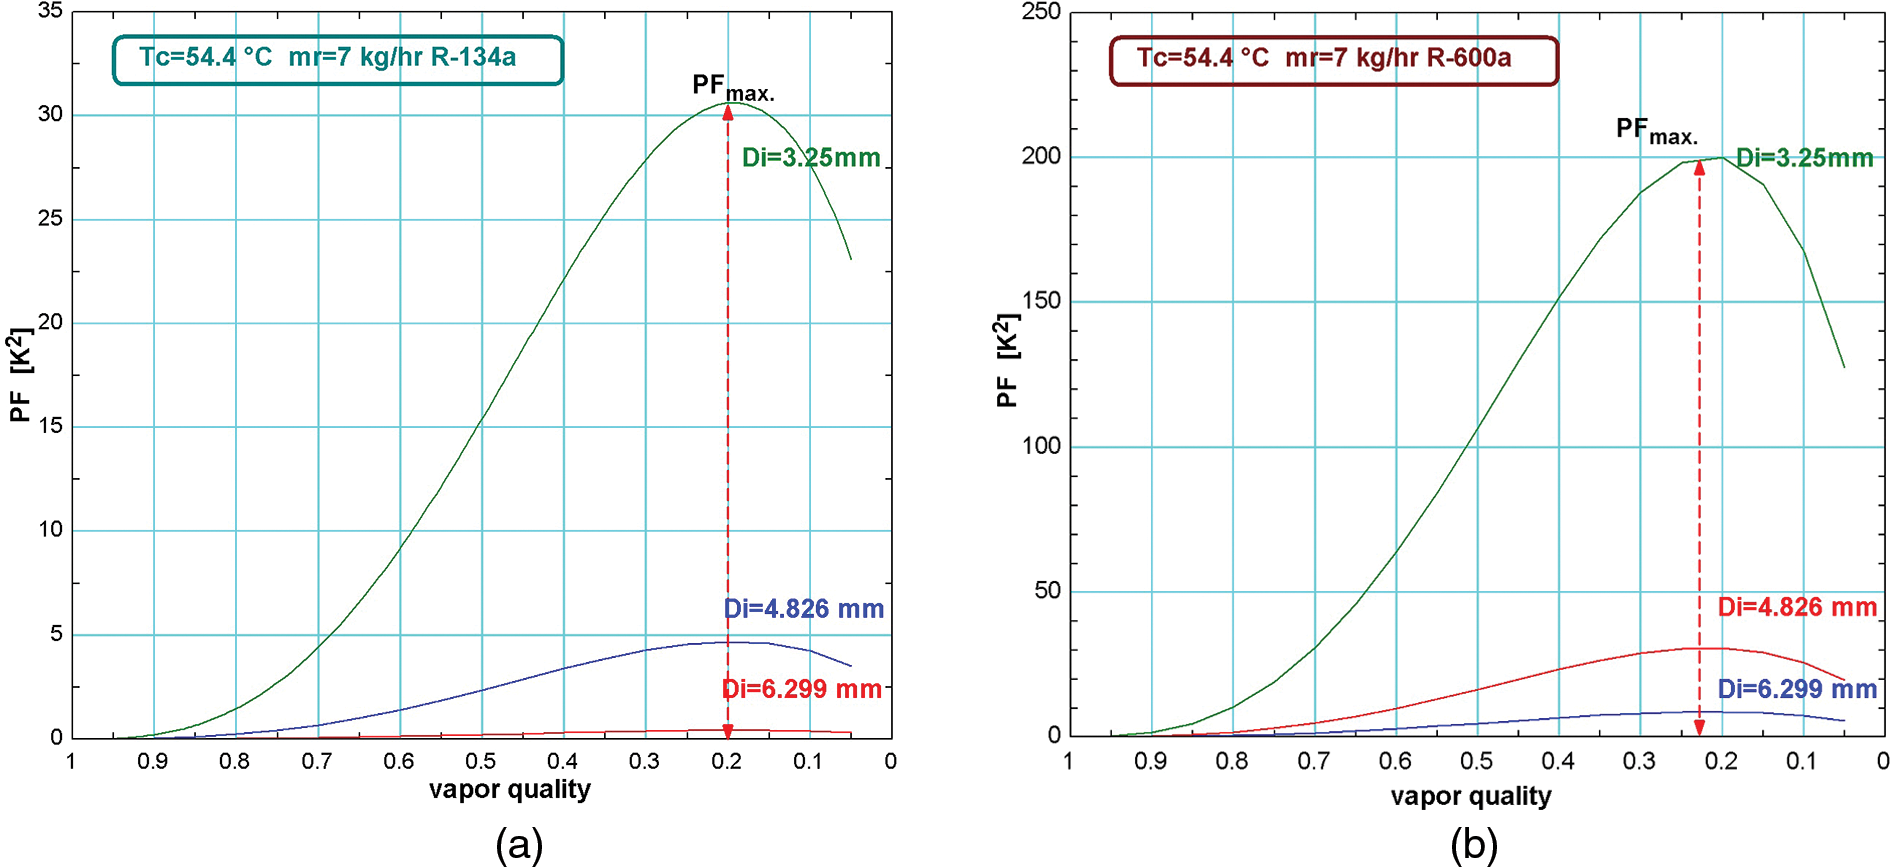
Figure 4: The effect of inner tube diameter on the PF for a) R-134a b) R-600a
3.4 The Condenser Saturation Temperature and PF
As shown in Figs. 5a and 5b, the PF value changes with the variation of the condensation saturation temperature for an inside tube diameter of 3.25 mm and refrigerant mass flow rate of 7 kg/hr. When the condensation saturation temperature is 35°C, the PFmax is higher than 70 at x = 0.2, and reduces the PFmax to 45 when the condenser saturation temperature is 45°C, and the PFmax = 30.56 at the condensation saturation temperature is 54.4°C for R-134a in Fig. 5a, while for R600a shown in Fig. 5b the PFmax is higher than 440 at x = 0.2, and reduces to 280 when the condenser saturation temperature is 45°C, while the PFmax = 200 at condensation saturation temperature of 54.4°C at refrigerant mass flow rate 7 kg/hr. The fact that the entropy generation is of a higher value with the lower condensation temperature agrees with previous reports [16] where the pressure is related to the temperature in the saturation regime. The main reason for that (the lower saturation pressure causes more entropy generation) is that the increase in the pressure drops with the increase in the density led to an increase of the PF.
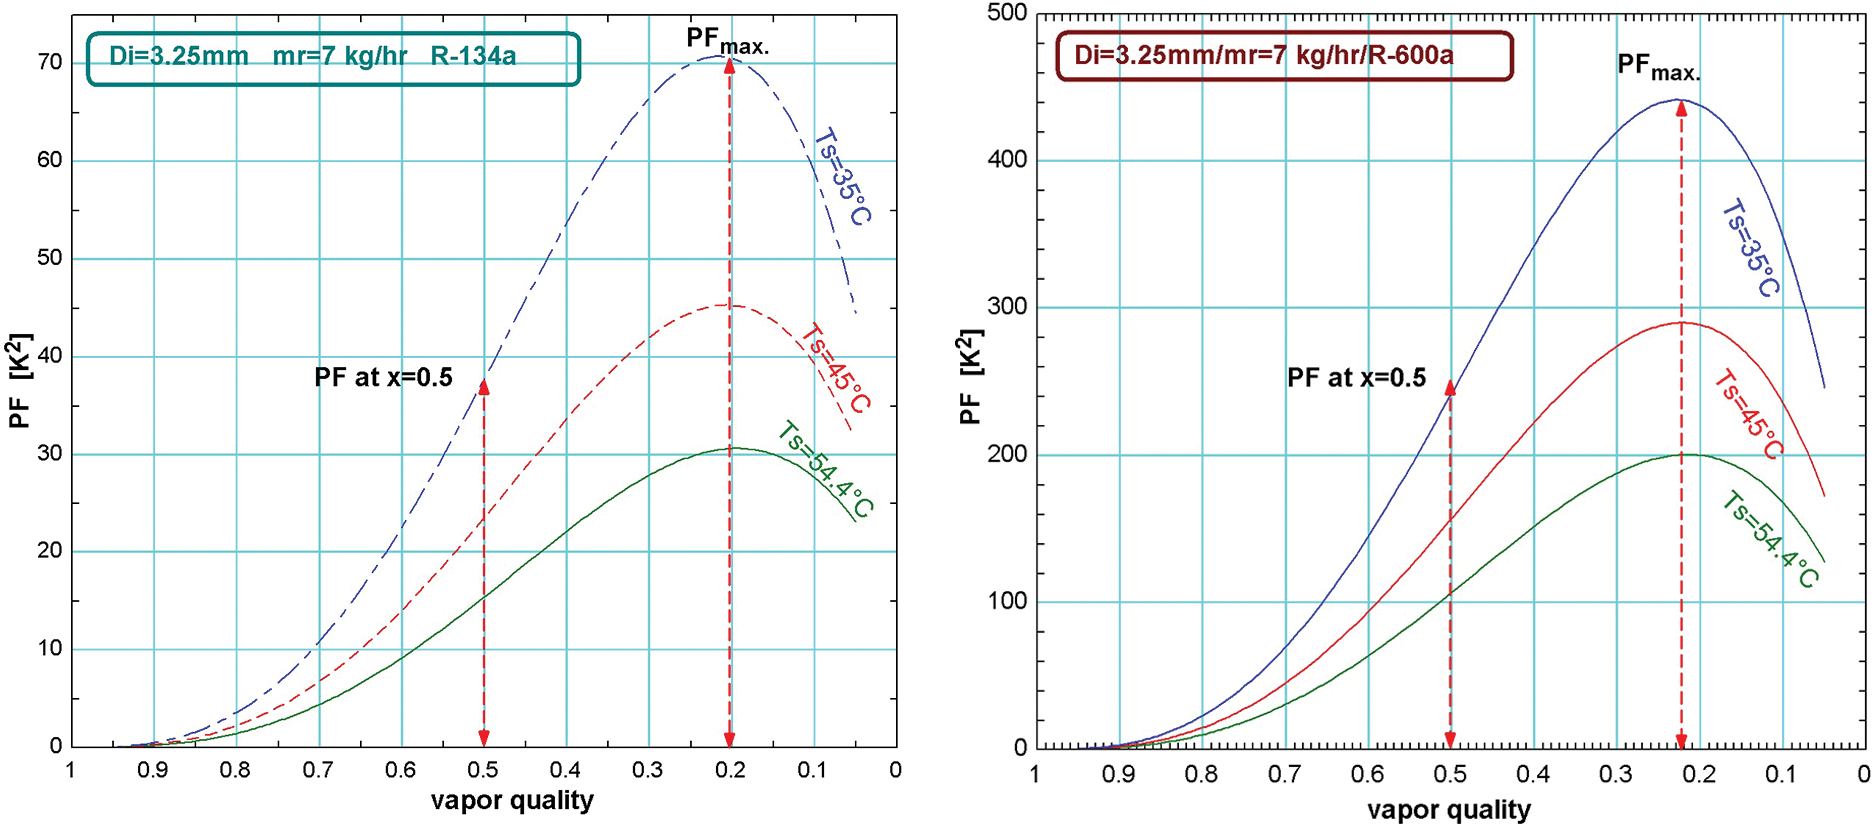
Figure 5: The condensation temperature effect on PF for a) R-134a b) R-600a
3.5 The Type of Refrigerant Effect on PF
Fig. 6 shows the different values of PF for the two types of refrigerants. The PF for R-600a is higher than that for R-134a for the same saturation temperature, mass flux, and inner tube diameter. For condensation saturation temperature of 54.4°C, the PFmax > 200 for R-600a and PFmax > 30 for R-134a. Cavallini et al. [14–16] indicated the same results at vapor quality x = 0.5 on the graph for the relation between the PF and the heat transfer coefficient. In those results, the PF for R-600a is higher than that for R-134a.
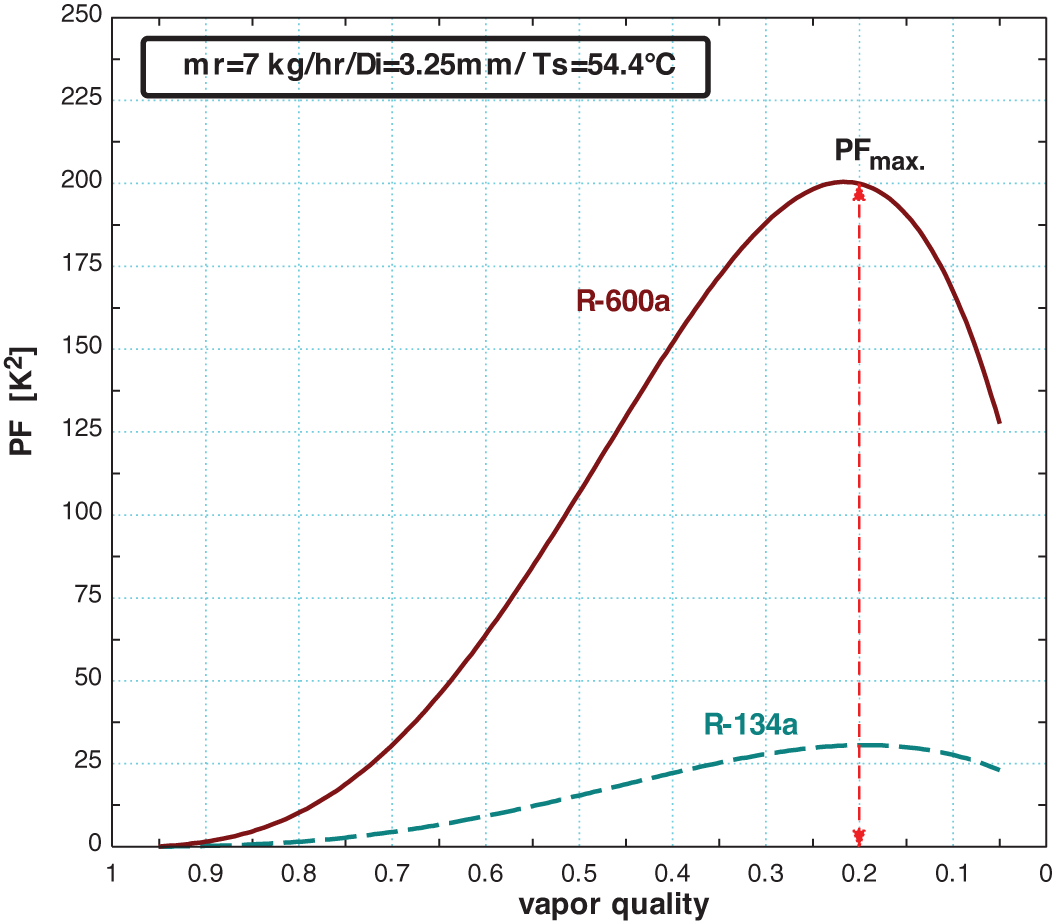
Figure 6: The variation of PF and vapor quality for the two types of refrigerants
The main reason for the high entropy generation at lower saturation pressure is the increase in the pressure drop due to the increase of density.
3.6 The Heat Transfer Coefficient and the Flow Pattern Type
The effect of the flow pattern in the condensation process on the PF value is shown in Fig. 7. The figure combines the Cavallini results for annular flow [14–16] equations at 39°C, and 45°C, and this study’s results for which the flow is stratified or stratified-wavy is done. As shown in the Figure, the annular flow data for Cavallini which show lower entropy generation led to a lower PF value at vapor quality 0.5 while the stratified or stratified-wavy flow generates for this study shows high entropy generation, that is higher PF for the same vapor quality, inside tube diameter, and condensation saturation temperature. The surface tension has a big effect in this study’s of refrigerant flow and where the liquid increase and the density increases while the gas decreases and the flow drops to laminar flow, which decreases the heat exchange and increases the pressure drop, in agreement with [20].
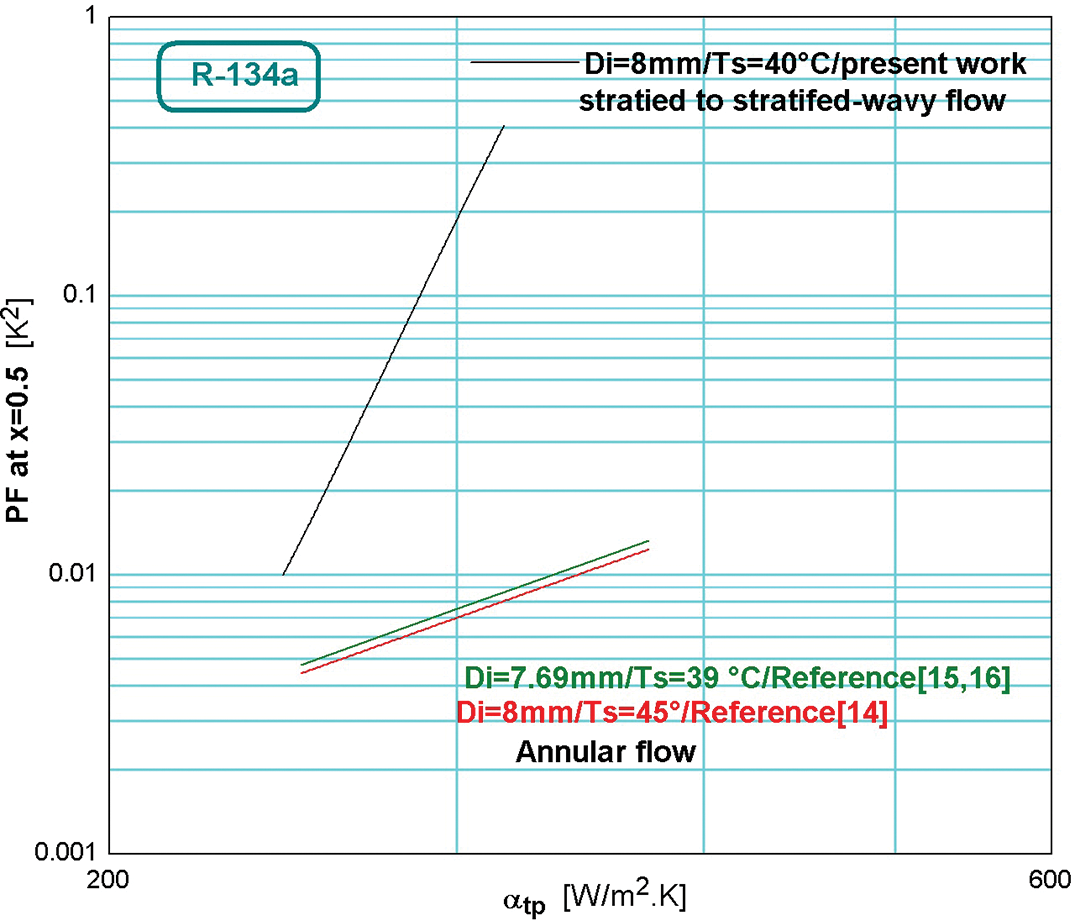
Figure 7: Comparisons of the PFx = 0.5 value and the heat transfer coefficient for annular and stratified flow
3.7 The Pressure Drops and the Mass Flow Rate
Fig. 8 shows the pressure drops for R-600a and R-134a for the same inner tube diameter and condensing saturation temperature with the different mass fluxes of the refrigerant. The pressure drop for R-600a is higher compared to the pressure drop for R-134a due to the saturation pressure for R-600a being lower than that for R-134a, which agrees with the Cavallini results [15] that a lower saturation pressure produces higher PF or entropy generation where the saturation pressure for R-134a is 1362 kPa while it is 660.7 kPa for R-600a at same condensation saturation temperature.
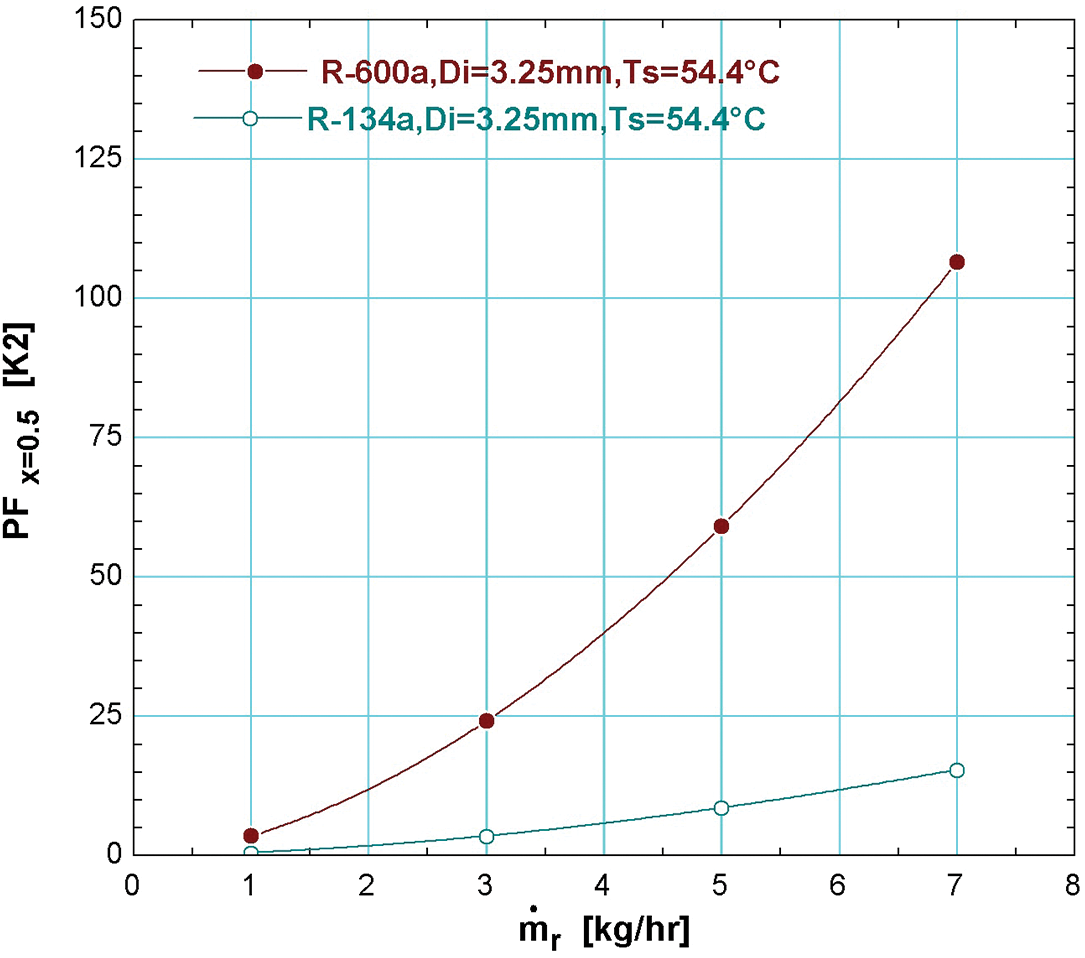
Figure 8: The pressure drops at different mass flow rates for refrigerants R-134a and R-600a
3.8 The Condenser Length and the Refrigerant Mass Flow Rate
The length of the tube to complete the condensation for R-600a is higher than that for R-134a as presented in Fig. 9a at condensing temperature of 54.4°C. The total condensation heat required for each refrigerant is the effect parameter on the length of the tube when the mass refrigerant flow is the same. The total condensation heat for R-600a and R-134a is 292.8 and 146.5 kJ/kg, respectively, and accordingly, the area required to transfer the heat for R-600a is larger than that for R-134a. For the same heat flux, the length required for R-134a is longer than that for R-600a as shown in Fig. 9b, and this is due to the average heat transfer coefficient for R-600a being higher than for R-134a as shown in Fig. 10. Thus, the manufactures use R-600a instead of R-134a for household refrigerators and freezers.
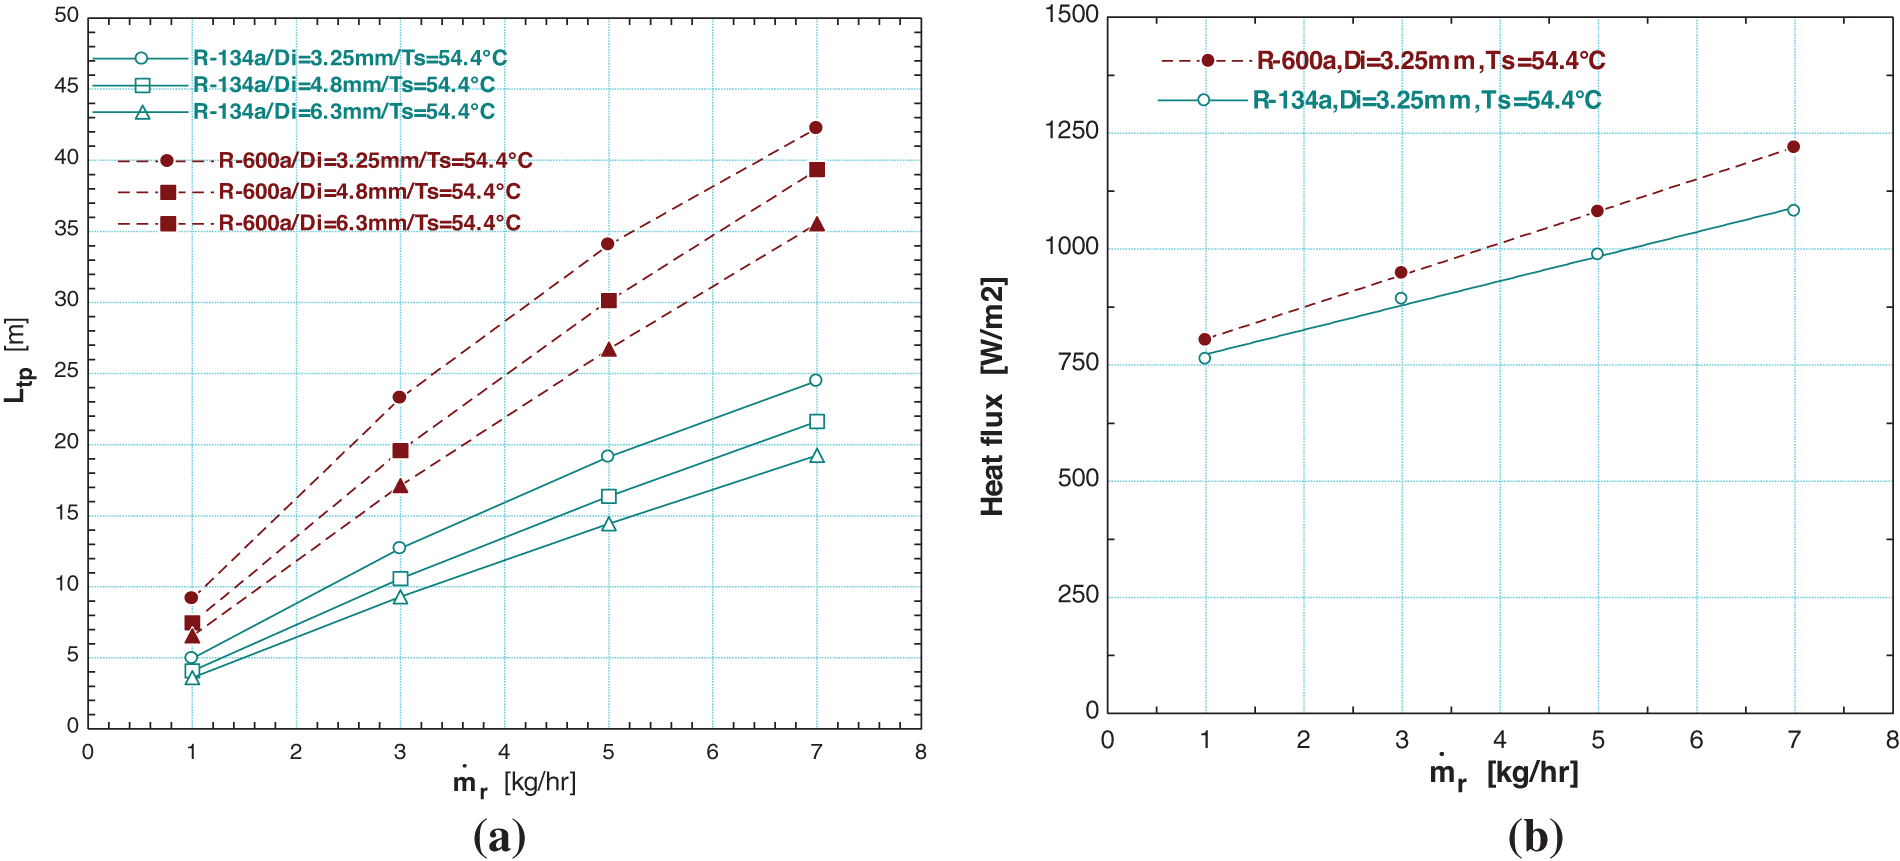
Figure 9: The length varies with the different mass flow rates for R-134a and R-600a
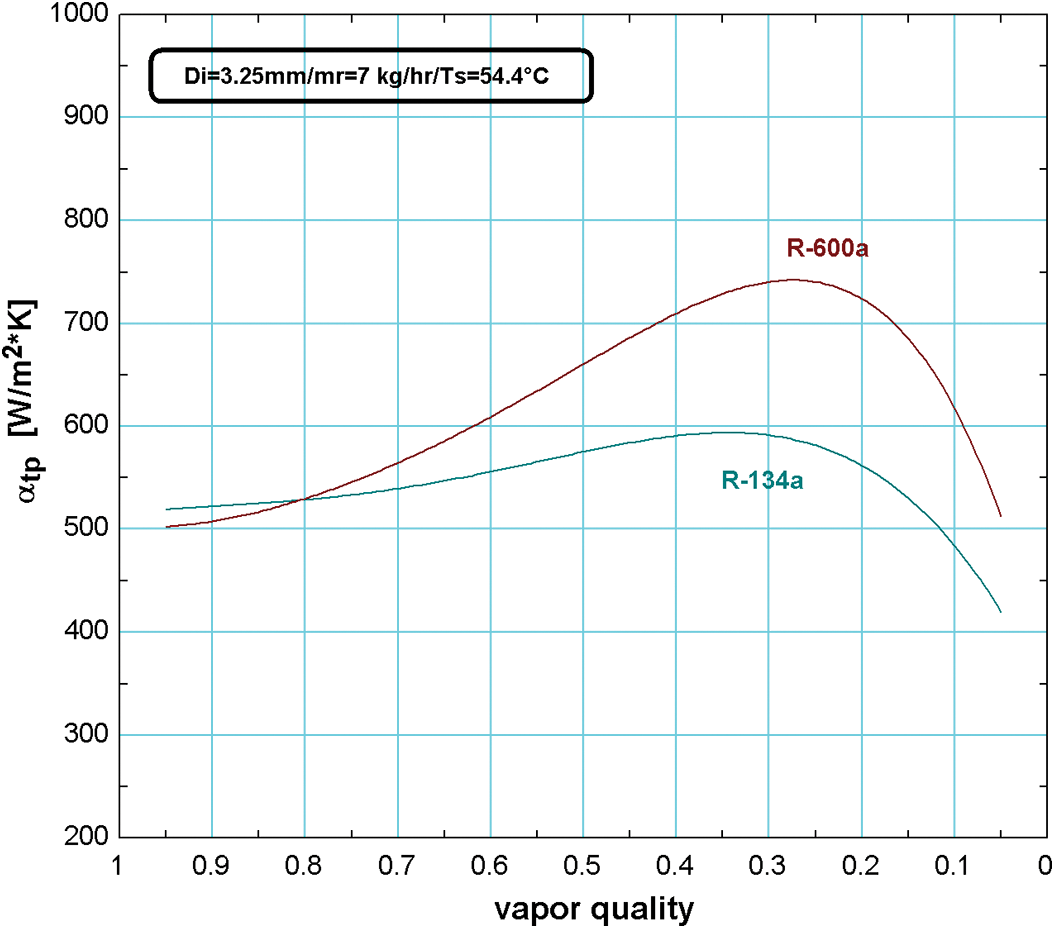
Figure 10: The variation of heat transfer coefficient with the vapor quality
3.9 The Variation of the ΔTsr and ΔTdr with the Quality
The temperature difference due to friction pressure drops ΔTsr and ΔTdr which represent the heat transfer, with vapor quality for two refrigerants R-134a and R-600a is shown in Figs. 11a and 11b. The value of ΔTsr max is done at x = 0.3 for R-134a and R-600a when the inner tube diameter of the condenser is 3.25 mm and the condensation saturation temperature is 54.4°C at a refrigerant mass flow rate of 7 kg/hr. The PF depends on ΔTsr more than on ΔTdr. The effect of ΔTdr with vapor quality is shown in Fig. 11b, where the max value of ΔTdr does not exceed 2 K and Cavallini’s results [14] are in agreement.
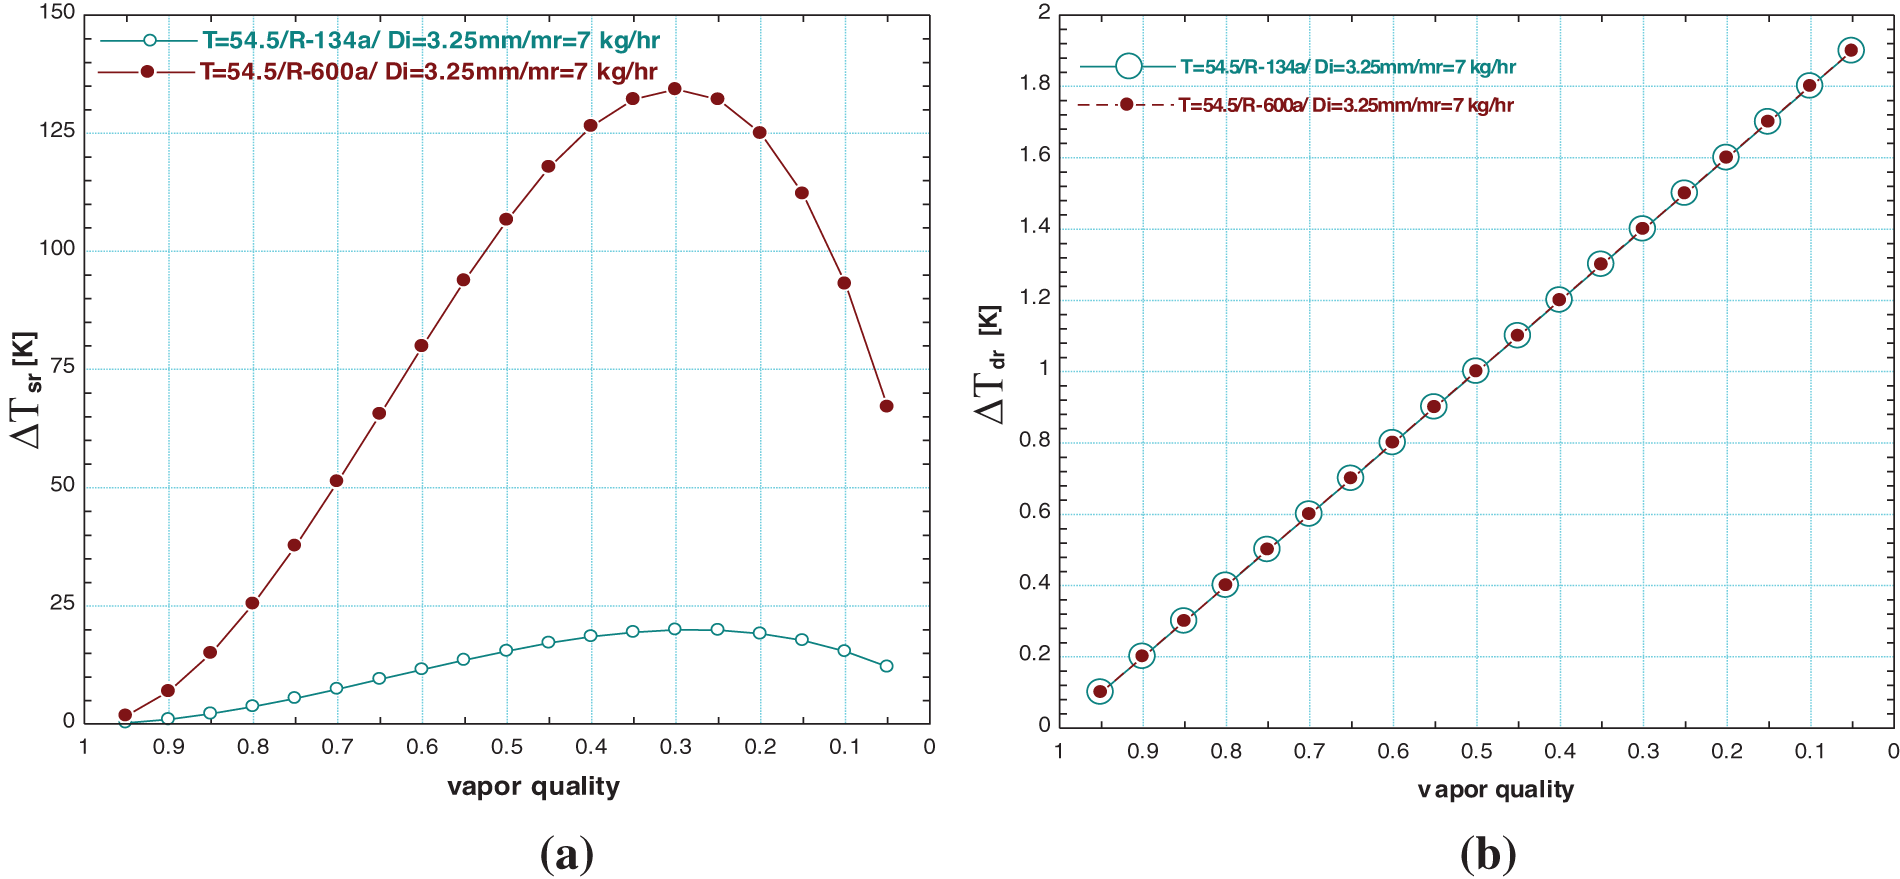
Figure 11: The variation of ΔTsr and ΔTdr with vapor quality for R-134a and R-600a
The study theoretically succeeds in determining the effect of the mass flow, inner tube diameter, and saturation temperature on the PF, and the main conclusions are summarized as follows:
The PF method can be used to make comparisons with the entropy generations method during the condensation when the important points of the type of flow pattern, inner tube diameter, saturation temperature, and mass flow rate are taken into consideration:
-The PF is a variation with the vapor quality and this variation is not linear, and reaches the maximum value when the vapor quality equal 0.2 for R-134a and 0.18 for R-600a. The shape of the variation depends on the type of the flow pattern which starts as stratified or stratified-wavy till the maximum then drops due to the change to intermittent flow till the end of the condensation.
-The mass flow rate significantly affects the PF value, where the PFmax = 30.56 is at a higher value when the refrigerant mass flow rate is 7 kg/hr for R-134a and PFmax = 200 for R-600a, and happens when the inside tube diameter is 3.25 mm and the condensing saturation temperature is 54.4°C. This condition causes a high turbulent flow and led to an increase of the PF.
-The PF decreases when the inner tube diameter increases and is at a lower value (PFmax = 2) with the inside tube diameter being 6.299 mm for the same mass flow rate of 7 kg/hr and condensation saturation temperature of 54.4°C for R-134a, and PFmax = 10 for R-600a. This happens due to the reduction in the pressure drop as a result of an increase in the cross-sectional area of the flow.
-The PF increases when the condensation saturation temperature decreases, which is proportional to the saturation pressure, and in agreement with the Cavallini results at the same mass flow rate and condensation saturation temperature. The PFmax = 70 for R-134a and 440 for R-600a when the inside diameter is 3.25 mm and refrigerant flow is 7 kg/hr.
-The value of the PF depends on the refrigerant type and the lower condensation saturation pressure produces higher PF. The results show that the PFmax = 200 for R-600a and PFmax = 30.56 for R-134a when the saturation temperature is 54.4°C and the inside tube diameter is 3.25 mm and the refrigerant mass flow rate is 7 kg/hr.
-The type of flow pattern in condensation has a major effect on the PF value. The results show that the stratified and the stratified wavy flow produce higher values for the PF while the annular flow shows a lower PF value and this is related to the effect of the surface tension with the gravity flow as in stratified flow and negligible effect with the shear flow like annular flow.
-The refrigerant R-600a with low saturation pressure needs a longer tube length to complete the condensation if the comparison depends on the mass flow rate, while a shorter length is needed for the refrigerant R-600a if the heat flux is the main consideration, due to the enthalpy of vaporization of R-600a being 292.8 kJ/kg while for R-134a it is 146.5 kJ/kg at the same condensing saturation temperature of 54.4°C.
-The temperature difference between the inlet and outlet of the refrigerant which represents the pressure drops has more effect than the temperature difference between the refrigerant and the inside wall which represents the heat transfer.
Funding Statement: The authors received no specific funding for this study.
Conflicts of Interest: The authors declare that they have no conflicts of interest to report regarding the present study.
References
1. Berto, A., Lavieille, P., Azzolin, M., Bortolin, S., Miscevic, M. et al. (2021). Liquid film thickness and heat transfer measurements during downflow condensation inside a small diameter tube. International Journal of Multiphase Flow, 140, 103649. https://doi.org/10.1016/j.ijmultiphaseflow.2021.103649 [Google Scholar] [CrossRef]
2. Cavallini, A., Censi, G., Col, D. D., Doretti, L., Longo, G. A. et al. (2001). Experimental investigation on condensation heat transfer and pressure drops of new HFC refrigerants (R134a, R125, R32, R410A, R236ea) in a horizontal smooth tube. International Journal of Refrigeration, 24(1), 73–87. https://doi.org/10.1016/S0140-7007(00)00070-0 [Google Scholar] [CrossRef]
3. Cavallini, A., Censi, G., Del Col, D., Doretti, L., Longo, G. A. et al. (2002). In-tube condensation of halogenated refrigerants. ASHRAE Transactions, 108, 146–161. [Google Scholar]
4. Cavallini, A., Censi, G., Del Col, D., Doretti, L., Longo, G. A. et al. (2002). Condensation of halogenated refrigerants inside smooth tubes. HVAC and R Research, 8(4), 429–451. https://doi.org/10.1080/10789669.2002.10391299 [Google Scholar] [CrossRef]
5. Del Col, D., Cavallini, A., Thome, J. R. (2005). Condensation of zeotropic mixtures in horizontal tubes: New simplified heat transfer model based on flow regimes. Journal of Heat Transfer, 127(3), 221–230. https://doi.org/10.1115/1.1857951 [Google Scholar] [CrossRef]
6. Diani, A., Brunello, P., Rossetto, L. (2020). R513A condensation heat transfer inside tubes: Microfin tube vs. smooth tube. International Journal of Heat and Mass Transfer, 152, 119472. https://doi.org/10.1016/j.ijheatmasstransfer.2020.119472 [Google Scholar] [CrossRef]
7. Jajja, S. A., Nawaz, K., Fricke, B. (2022). In tube condensation heat transfer and pressure drop for R454B and R32---Potential replacements for R410A. Data Set. Figshare. https://doi.org/10.1016/j.ijrefrig.2022.07.019 [Google Scholar] [CrossRef]
8. Khairul Bashar, M., Nakamura, K., Kariya, K., Miyara, A. (2020). Development of a correlation for a pressure drop of two-phase flow inside horizontal small diameter smooth and micro fin tubes. International Journal of Refrigeration, 119, 80–91. https://doi.org/10.1016/j.ijrefrig.2020.08.013 [Google Scholar] [CrossRef]
9. Longo, G. A., Mancin, S., Righetti, G., Zilio, C. (2019). Saturated vapor condensation of R134a inside a 4 mm ID horizontal smooth tube: Comparison with the low GWP substitutes R152a, R1234yf, and R1234ze(E). International Journal of Heat and Mass Transfer, 133, 461–473. https://doi.org/10.1016/j.ijheatmasstransfer.2018.12.115 [Google Scholar] [CrossRef]
10. Li, W., Chen, J., Fu, C., Xu, D. (2022). Experimental investigation on convective condensation heat transfer in horizontal 4 mm diameter coated tube. International Journal of Heat and Mass Transfer, 183, 122162. https://doi.org/10.1016/j.ijheatmasstransfer.2021.122162 [Google Scholar] [CrossRef]
11. Li, Q., Chen, G., Wang, Q., Tao, L., Xuan, Y. (2022). Theoretical and experimental analyses of two-phase flow condensation heat transfer inside the horizontal micro-fin tube. Applied Thermal Engineering, 216, 119066. https://doi.org/10.1016/j.applthermaleng.2022.119066 [Google Scholar] [CrossRef]
12. Mahdi, L. A., Lateif, A. Y. (2019). Prediction of heat transfer coefficient and pressure drop in wire heat exchanger working with R-134a and R-600a. Journal of Engineering, 25(11), 1–20. https://doi.org/10.31026/j.eng.2019.11.01 [Google Scholar] [CrossRef]
13. Son, C. H., Lee, H. S. (2009). Condensation heat transfer characteristics of R-22, R-134a, and R-410A in small diameter tubes. Heat and Mass Transfer, 45(9), 1153–1166. https://doi.org/10.1007/s00231-009-0489-6 [Google Scholar] [CrossRef]
14. Calvallini, A. (2002). Heat transfer and energy efficiency of working fluids in mechanical refrigeration. International Institute of Refrigeration, 2002(6), 4–21. [Google Scholar]
15. Cavallini, A. (2006). In-tube condensation performance of refrigerants. 11th International Refrigeration and Air Conditioning Conference, pp. 1–11. USA. [Google Scholar]
16. Cavallini, A., Brown, J. S., Del Col, D., Zilio, C. (2010). In-tube condensation performance of refrigerants considering penalization terms (exergy losses) for heat transfer and pressure drop. International Journal of Heat and Mass Transfer, 53(13–14), 2885–2896. https://doi.org/10.1016/j.ijheatmasstransfer.2010.02.007 [Google Scholar] [CrossRef]
17. Breber, G., Palen, J. W., Taborek, J. (1980). Prediction of horizontal tube side condensation of pure components using flow regime criteria. Journal of Heat Transfer, 102(3), 471–476. https://doi.org/10.1115/1.3244325 [Google Scholar] [CrossRef]
18. El Hajal, J., Thome, J. R., Cavallini, A. (2003). Condensation in horizontal tubes, part 1: Two-phase flow pattern map. International Journal of Heat and Mass Transfer, 46(18), 3349–3363. https://doi.org/10.1016/S0017-9310(03)00139-X [Google Scholar] [CrossRef]
19. Thome, J. R., El Hajal, J., Cavallini, A. (2003). Condensation in horizontal tubes, part 2: New heat transfer model based on flow regimes. International Journal of Heat and Mass Transfer, 46(18), 3365–3387. https://doi.org/10.1016/S0017-9310(03)00140-6 [Google Scholar] [CrossRef]
20. Coleman, J. W., Garimella, S. (2003). Two-phase flow regimes in round, square and rectangular tubes during condensation of refrigerant R134a. International Journal of Refrigeration, 26(1), 117–128. https://doi.org/10.1016/S0140-7007(02)00013-0 [Google Scholar] [CrossRef]
21. Cengel, Y. A. (2004). Heat transference a practical approach. McGraw-Hill, 4(9), 874. https://doi.org/10.1007/978-3-642-20279-7_5 [Google Scholar] [CrossRef]
22. Dincer, I., Kanoglu, M. (2010). Refrigeration systems and applications, 2nd edition. USA: John Wiley and Sons, Ltd. [Google Scholar]
23. ASHRAE Handbook-Fundamentals (SI) (2005). F04. Two phase flow. 4.12–4.13. [Google Scholar]
Cite This Article
 Copyright © 2023 The Author(s). Published by Tech Science Press.
This work is licensed under a Creative Commons Attribution 4.0 International License , which permits unrestricted use, distribution, and reproduction in any medium, provided the original work is properly cited.
 Downloads
 Citation Tools