
 Submit a Paper
 Propose a Special lssue
 Open Access
ARTICLE
Analysis of the Influence of Geometrical Parameters on the Performance of a Proton Exchange Membrane Fuel Cell
1
School of Energy and Power Engineering, Shandong University, Jinan, 250061, China
2
Sinotruk Jinan Special Purpose Vehicle Co., Ltd., Jinan, 250117, China
* Corresponding Authors: Guoxiang Li. Email: ; Ke Sun. Email:
(This article belongs to the Special Issue: Recent Advances in Fluid Mechanics and Thermal Sciences II)
Fluid Dynamics & Materials Processing 2024, 20(1), 219-237. https://doi.org/10.32604/fdmp.2023.025566
Received 21 July 2022; Accepted 11 April 2023; Issue published 08 November 2023
 View Full Text
 Download PDF
Abstract
A suitable channel structure can lead to efficient gas distribution and significantly improve the power density of fuel cells. In this study, the influence of two channel design parameters is investigated, namely, the ratio of the channel width to the bipolar plate ridge width (i.e., the channel ridge ratio) and the channel depth. The impact of these parameters is evaluated with respect to the flow pattern, the gas composition distribution, the temperature field and the fuel cell output capability. The results show that a decrease in the channel ridge ratio and an increase in the channel depth can effectively make the distributions of velocity, temperature and concentration more uniform in each channel and improve the output capability of the fuel cell. An increase in the channel ridge ratio and depth obviously reduces the flow resistance and improves the flow characteristics.Keywords
Proton Exchange Membrane Fuel Cell (PEMFC) is widely used in automotive power because it can yield pollution-free emissions, high energy efficiency, and fast start-up [1]. Compared to pure electric vehicles, fuel cell vehicles have the advantages of long range and short fuel refueling time [2], and is considered as one of the most promising automotive power solutions in the market. As one of the key components, bipolar plates (also known as flow field plates) mainly play the role of separating reaction gases, heat removal, and drainage [3,4], so a suitable plate and flow channel structure can achieve high flux gas distribution, which can significantly increase the power density of the fuel cells.
The effect of channel size on fuel cell performance has been extensively studied, including channel length, width, depth, and channel cross section shape. Marappan et al. [5] introduced many modified, hybrid, and new flow field designs of the PEMFC. Hasan et al. [6] experimented on three types of gas flow channels to optimize fuel cell performance. Zhang et al. [7] experimented on four types of single serpentine flow fields to study the effects of land width. Zhang et al. [8] experimented on trapezoid baffled flow fields to determine their effects on current density distribution. Chowdhury et al. [9] performed a numerical analysis of the optimization of fuel cell (FC) channel and ridgeback width in the COMSOL multiphysics module interface. They reported that the effect of channel width on voltage drop is greater than that of ridgeback width, and the voltage drop increases with decreasing runner width. But, they noted that while the effect of runner width on voltage drop is greater than that of ridge width, and the voltage drop increases with decreasing channel width, the effect of runner width and ridge width on cell current density is the same. Afshari et al. [10] simulated a fuel cell with parallel flow channels and metal foam as a flow distributor to improve the cell performace. Kim et al. [11] experimented porus metal foams as flow field to improve the PEMFC performance. Afshari [12] simulated a PEM fuel cell with metal foam as a flow field to increase current density and inprove current density distribution. Carton et al. [13] developed a Representative Unit Cell Structure (RUCS) model for Open Pore Cellular Foam (OPCF) material, based on a dodecahedron cell, to analyze the effect to fuel cell performance. Bagherighajari et al. [14] studied the fuel cell performance with an interdigitated flow channel. Carton et al. [15] simulated the PEMFC performance with a unique CFD model for open pore foam material as a flow plate. Afshari et al. [16] simulated the PEMFC performance with a dynamic model with pin-type flow field with bean-shaped pins. Wilberforce et al. [17] simulated performance of PEM fuel cell with different bipolar plates material. Ghadhban et al. [18] experimented and simulated PEMFC performance with bio-inspired flow fields.
Wu et al. [19] simulated the dynamic behavior of liquid water in the flow channel and used visualization experiments to attain the cathode air flow rate for the best performance and stability of the tested fuel cell.
In this paper, based on the actual application of the plate structure, the plate model with different flow channel structures is established, and the effects of channel ridge ratio and channel depth on the gas flow field, gas distribution uniformity, gas component distribution, temperature distribution, and output performance of the fuel cell are analyzed by 3D simulation software. The results of the comparison of these above aspects are integrated and the channel ridge ratio and depth are optimized by simulation. Although it is realistic to take condensation effects into account, these simulations always need unsteady computation or real geometric models of gas diffusion layer because of the complexity of the vapor condensation process. Therefore, we adopted a simplification that the water generated by the reaction is gaseous.
2 Model Development and Validation
The PEMFC model mainly contains: cathode and anode flow channels; cathode and anode gas diffusion layers; cathode and anode catalytic layers; and proton exchange membrane. The pole plate structure is shown in Fig. 1.
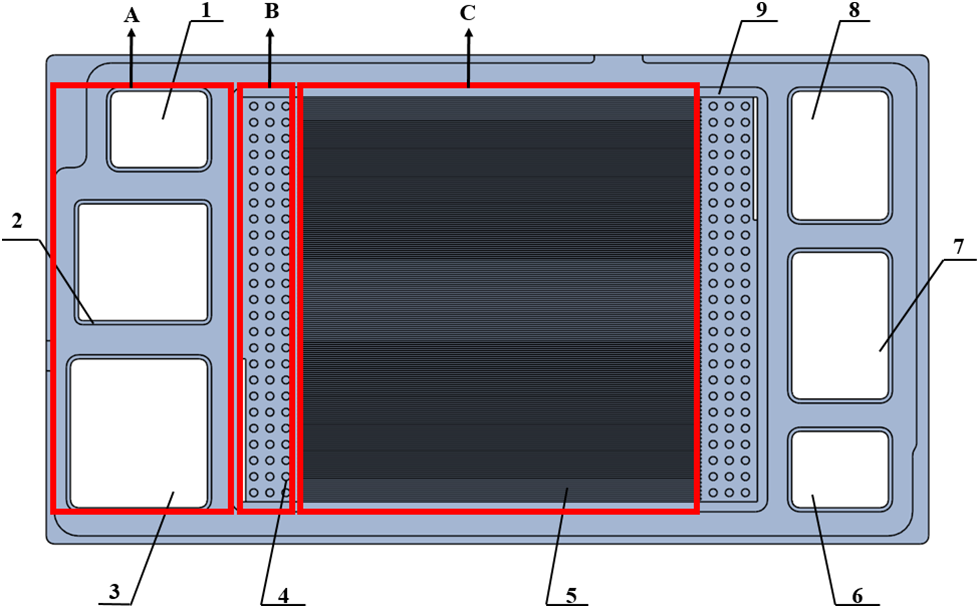
Figure 1: Geometric model of the plate
Among them, areas A, B, and C are the inlet and outlet areas of the reaction gas and cooling water, the transition area, and the reaction area, respectively. The numbers 1–9 are the fuel inlet, cooling water outlet, air outlet, inflow area, flow field area, hydrogen outlet, cooling water inlet, air inlet, and sealing area, respectively. The cell activation area is 100 mm2 × 100 mm2.
For the PEM cell model calculations, the following simplifications and assumptions are made:
(1) The PEMFC is operated at steady state;
(2) The reaction gas and the gas mixture are ideal gases [20];
(3) The fluid flow has a low Reynolds number and is considered to be of laminar flow [21];
(4) All components have isotropic and homogeneous material properties [22];
(5) The water generated by the reaction is gaseous.
The physical processes occurring in the PEMFC can generally be reduced to solutions of the underlying conservation equations for mass, momentum, energy, and components. In addition, the PEMFC model also includes an electrochemical reaction model.
The mass conservation equation that is valid for all processes in the complex physics and chemistry of a fuel cell is shown in Eq. (1).
As shown in Eq. (2), Stokes’ law for incompressible fluids yields the conservation of momentum equation applicable to fuel cells.
The equation of energy conservation in the cell can be expressed as Eq. (3).
The occurrence of electrochemical reactions in the cell is accompanied by the consumption and production of molecules, and the conservation of molecules of single-component substances can be expressed as follows.
The current transport contains the solid phase current transport and the ionic current transport in the electrolyte, and the charge conservation can be expressed respectively as Eqs. (4) and (5).
Within the anode CL,
2.3 Model Settings and Main Parameters
In this paper, the cathode and anode reaction gases are modeled to flow in opposite directions, and the specific inlet and outlet directions are set as shown in Fig. 2. The active area is between the inlet and outlet distribution area. There are many solid cylinders in three rows in the distribution area. The boundary conditions and operating conditions are given in Table 1.
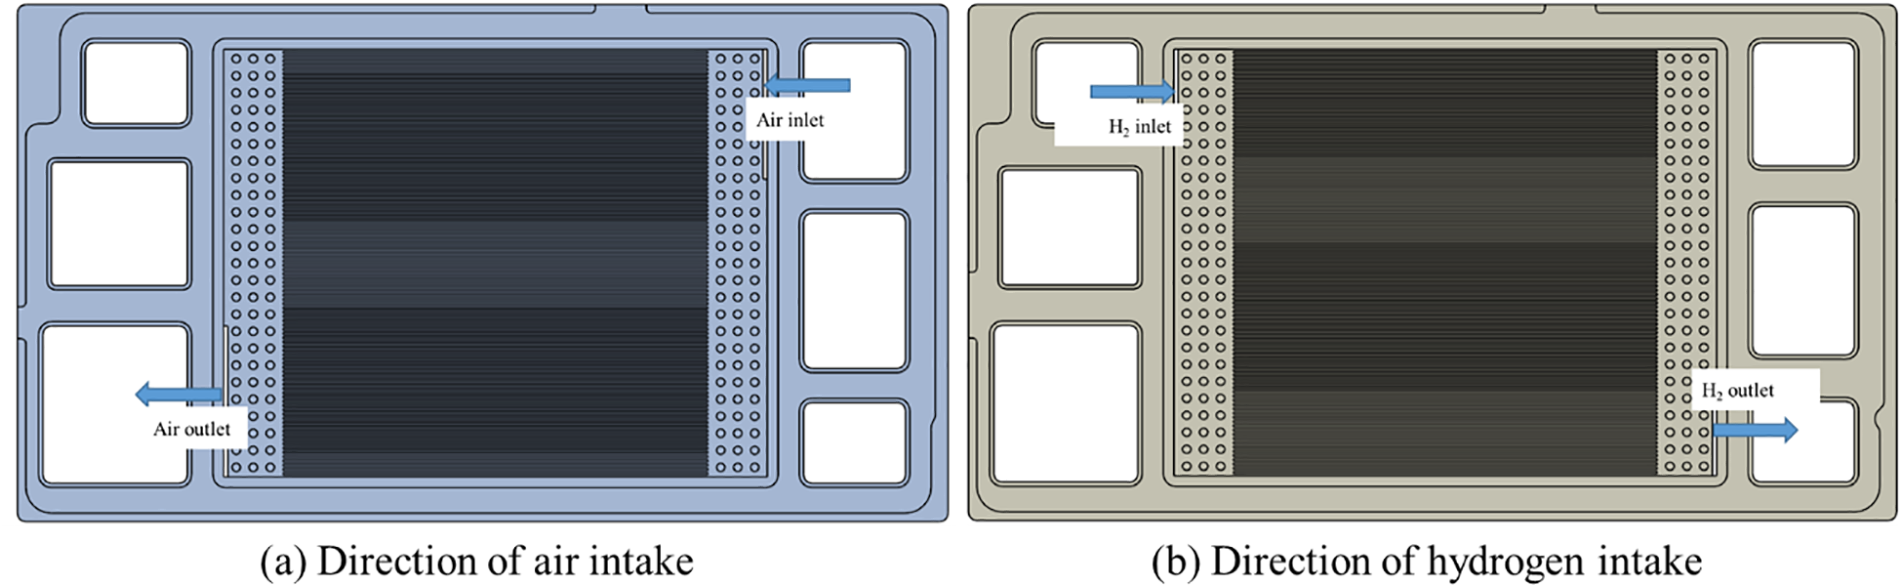
Figure 2: Reaction gas inlet and outlet directions

It is noteworthy that in practice, there is only slight loss in performance of the fuel cell with such a moisturizing regime as given in Table 1. But the reduction of cost of a humidification device is significant. In essence, this study analyzes the influence of flow field parameters on mass distribution and performance with this special moisturizing regime.
A pressure-based solver was used in the model. A finite volume technique was used to discretize the governing equations. The momentum, energy, and pressure were calculated with the second-order upwind scheme. The turbulence model of this model is the k-ε model with a first-order upwind scheme. The properties conservation equation was coupled with the Butler–Volmer equation [6], to calculate the consumption and transmission of properties and the electrochemical reaction of fuel cells.
A single fuel cell with a similar flow field has been tested by a fuel cell testing system made by Greenlight Innovation, as shown in Figs. 3 and 4. The membrane electrode assemblies of the single fuel cell are made by W. L. Gore & Associates, Inc., USA, and the thickness is 45 μm. The platinum loading capacity of the cathode is 0.4 mg⋅cm−2, and that of the anode is 0.1 mg⋅cm−2. The carbon paper is made by SGL Carbon in Germany, and the thickness is 285 μm. The graphite bipolar plate contains cylinder distribution area and straight-parallel flow field, and the reaction area is 200 cm2. In tests, the cell temperature is 80°C. The pressure of H2 and air is both 2 atm. The relative humidity of H2 and air is respectively 0% and 50%. The stoichiometric ratio of H2 and air is respectively 1.5 and 2.5.
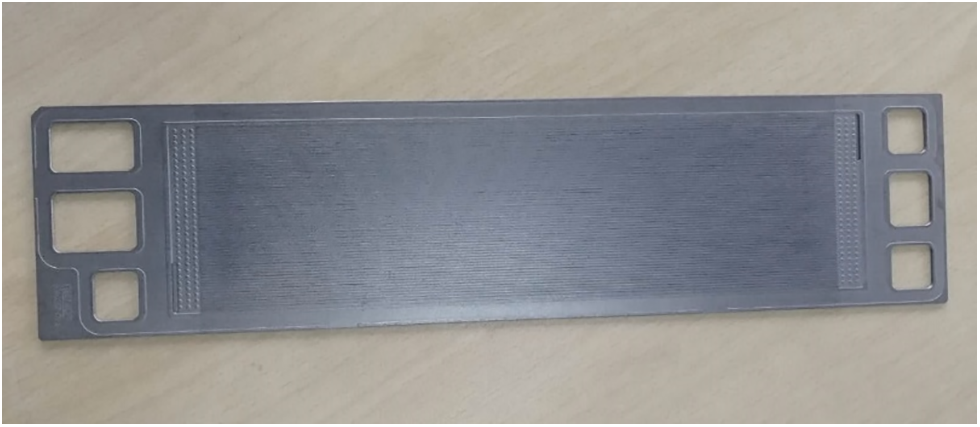
Figure 3: Graphite bipolar plate in test
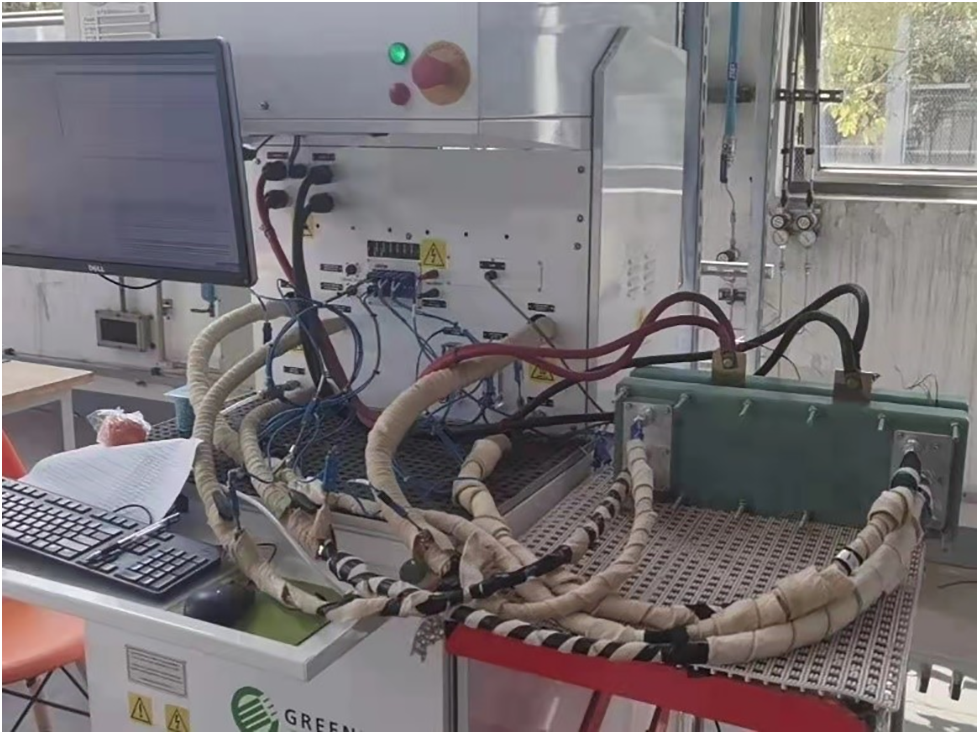
Figure 4: Fuel cell testing system
To save computing resources and time, the grid independence verification should be carried out to make the number of grids reasonable. The flow field with depth of 0.3 mm and channel-ridge ratio was chosen to verify the grid independence. And five CFD simulation models with the quantities of grids of 362800, 4522000, 5424000, 6386000, and 7203000 were established, respectively. The simulation calculation was carried out under the condition that the fuel cell output voltage was 0.6 V. The current density obtained is shown in Fig. 5.

Figure 5: Grid independence verification
As shown in Fig. 5, the increase in grid quantity will not change the simulation results obviously when the quantity is greater than 542400, and the accuracy is acceptable. Therefore, the size and quantity of grids in subsequent simulation is set close to the quantity.
Comparisons of the cell voltage-current density curves through simulation and testing are shown in Fig. 6. It is obvious that the simulated curve is essentially consistent with the test curve, and the largest relative error is about 4.7% at high current density, which indicates the reliability of this model.

Figure 6: Cell voltage-current density curves
The flow field configuration and the total cross-sectional area of the flow field established in this paper are kept constant, and the influence of the ridge ratio and the depth of the flow channel on the PEMFC performance is studied. The so-called ridge ratio is the ratio of the width of the channel to the width of the ridge of the plate. It is the ratio of value b to value a as shown in Fig. 7. And the c in Fig. 7 is the depth of the flow channel.

Figure 7: Flow channel ridge ratio and depth
The design of the plate structure should ensure adequate support for the membrane electrodes while improving the output performance of the fuel cell. Vielstich et al. [23] pointed out that the typical ridge width of the plate is 0.2–2.5 mm. In this paper, a rectangular cross-sectional flow channel is selected, and on the premise that the ridge width of the electrode plate is 0.5 mm and the depth is 0.3 mm remains unchanged. Five types of channel-ridge ratios of 0.5, 1.0, 1.5, 2.0, and 2.5 are established by constructing a structural model of the plate with different flow channel widths, as shown in Fig. 8. The optimal channel-ridge ratio structure is determined by analyzing factors such as cell flow field pressure difference, gas distribution uniformity, and output performance.
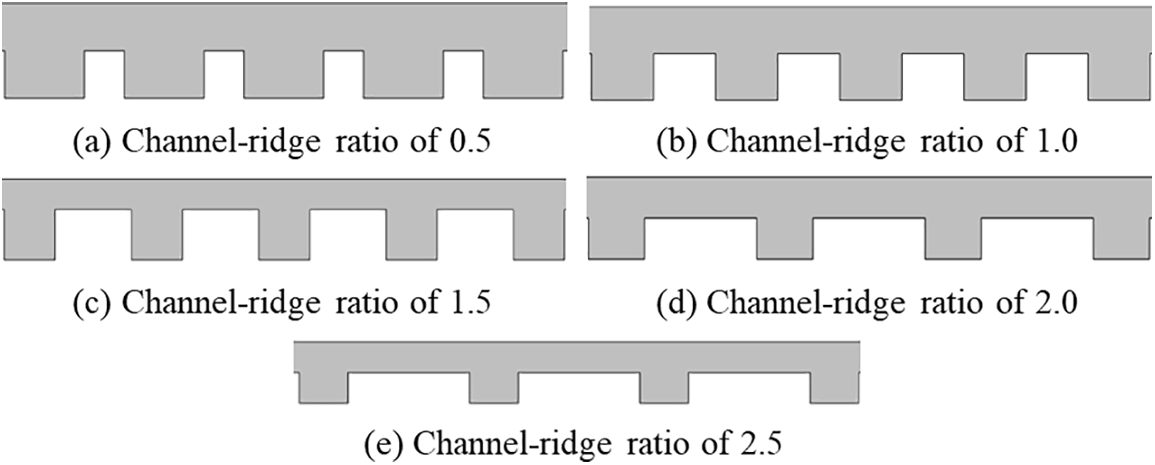
Figure 8: Five types of channel-ridge ratio structure
Based on the determination of the channel-ridge ratio that yields the best performance, the value of channel-ridge ratio is kept fixed, and the channel depth is changed to study its effect on cell performance. Vielstich et al. [23] proposed that a depth of 0.2–2.5 mm is more suitable, and combined with the current development trend of thin and high flux plates for fuel cells, this paper selects 0.3, 0.4, 0.5, 0.6, and 0.7 mm for the analysis. The five structures are shown in Fig. 9.

Figure 9: Five types of channel depth structures
3.2 Influence of Flow Channel-Ridge Ratio on Fuel Cell Performance
To realize the full flow of the reaction gas, the inlet and outlet positions of the flow field are appropriately lengthened in the calculation model. Fig. 10 shows the pressure distribution of the cathode flow field with different channel-ridge ratios of the flow channel at a constant voltage of 0.6 V. The pressure distribution of each flow field is basically similar, with the trend being that as the pressure gradually decreases with the flow of gas, the highest and lowest values appear in the inlet and outlet areas of the flow field. This is mainly because the fluid flow will undergo energy loss due to overcoming resistance, while the mechanical energy irreversibly decreases, resulting in a decrease in velocity, which in turn leads to the pressure decreases.

Figure 10: Pressure distribution of flow field with different channel-ridge ratios
Table 2 lists the pressure drop variations of the flow field under different channel-ridge ratio structures. The flow field pressure drop decreases gradually with the increase of the channel-ridge ratio. Among them, the channel structure with the channel-ridge ratio of 0.5 shows the largest pressure drop of the flow field, with the pressure drop reaching 4037 Pa, while the pressure drop of the flow field under the structure with the channel-ridge ratio of 2.5 decreases to 2882 Pa. Compared with the flow field with a ridge ratio of 2, it is only reduced by 28 Pa, a significantly lower reduction of the flow field pressure drop.

The pressure difference between the inlet and outlet of the flow field reflects the ease of fluid flow, and the pressure difference affects both the power loss and the occurrence of electrochemical reactions. A large differential pressure increases the burden on the system, while a small differential pressure affects gas diffusion. Therefore, a moderate differential pressure is more suitable for the flow field. For the five structures adopted in this paper, the flow channel structures with channel-ridge ratios of 1.0, 1.5, and 2.0 are relatively more suitable for application in fuel cells.
3.2.2 Gas Distribution Uniformity Analysis
Due to the large number of flow field manifolds in this paper, the uniformity of the gas flow distribution is determined by measuring the relative standard deviation, as given in Eq. (8).
For a more comprehensive analysis of the gas flow distribution, the ratio of maximum value to mean value and the ratio of minimum value to mean value were compared. The variation of the correlation ratio and the relative standard error is shown in Fig. 11. The smaller the ridge ratio of the flow field, the better the uniformity of the flow distribution, and among the five flow field structures in this paper, the flow field with a ridge ratio of 0.5 has a more uniform flow distribution.

Figure 11: Comparison of flow distribution uniformity
3.2.3 Gas Component Distribution Analysis
Fig. 12 shows the distribution of oxygen mass fraction at the interface between the cathode GDL and CL at a constant voltage of 0.6 V. The oxygen content is highest on the inlet side and decreases with the consumption of the gas by the electrochemical reaction. Due to the low gas flow in the middle region, oxygen is continuously consumed with the electrochemical reaction, resulting in the lowest content at the outlet side. The smaller the channel-ridge ratio of the channel, the more uniform the distribution of oxygen, which is mainly due to the difference in the distribution caused by the “supply” and “consumption” of oxygen on the catalyst surface. The different flow field structures will cause changes in the diffusive transport of the reactant gases and the degree of electrochemical reaction.
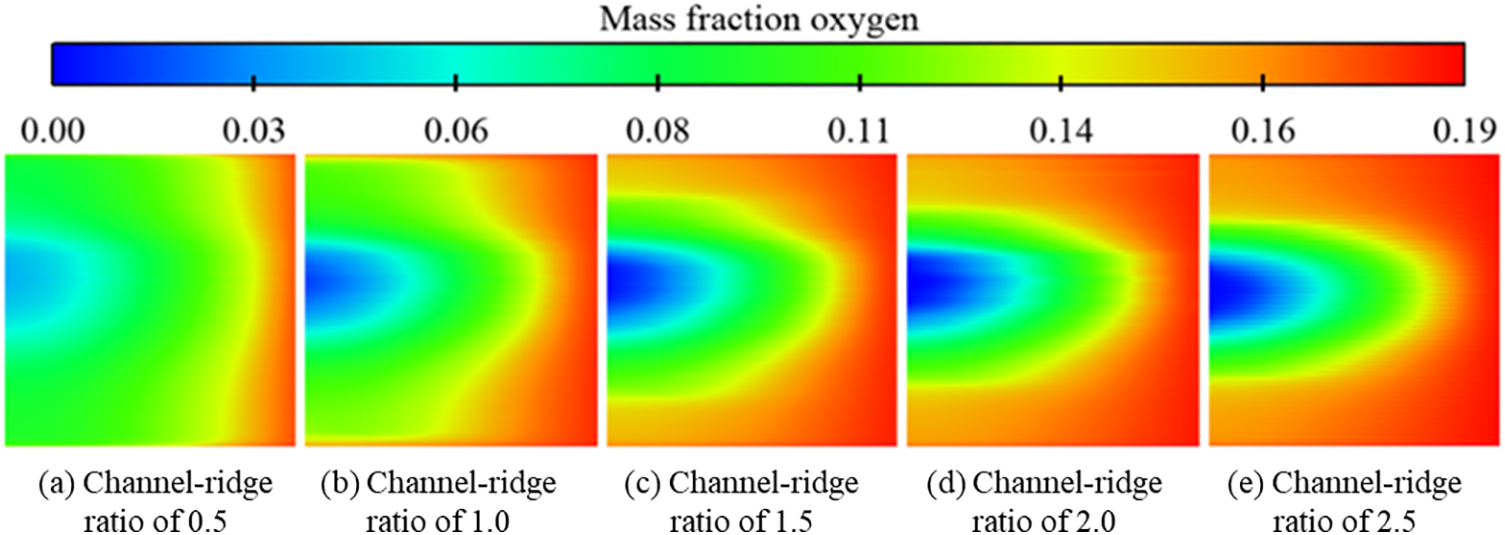
Figure 12: Oxygen mass fraction distribution at cathode CL surface
Fig. 13 reflects the changes in water vapor content under different flow channel structures at a constant voltage of 0.6 V. Due to the low relative humidity of the inlet gas, the water vapor content is the lowest on the inlet side. As the water generated by the electrochemical reaction continues to increase, the mass fraction of water vapor increases, and the water vapor content is the highest on the outlet side in the middle position, where the water may be difficult to discharge and easily cause flooding.

Figure 13: Water vapor mass fraction distribution at cathode CL surface
3.2.4 Temperature Distribution Analysis
Fig. 14 shows the temperature distribution of the cathode catalyst surface at a constant voltage of 0.6 V. The highest temperature appears in the middle region and the lowest temperature appears in the inlet side of the air. This is due to the fact that the reacting gases enter the channel in opposite directions, and the highest concentration of the two reacting gases is located in the middle region, where the reaction’s heat production is the highest and the temperature is the highest. The temperature on the inlet side of the reaction gas is relatively low, and gradually increases with the flow of the gas and the chemical reaction. In addition, the highest temperature and the lowest temperature both appear in Fig. 14e. The temperature distribution is the most uneven. At the same time, the streak-like distribution of temperature distribution in the longitudinal direction becomes more and more obvious with the increase of the channel-ridge ratio, which is mainly due to the fact that the larger the flow channel ridge ratio, the more pronounced the difference in diffusion of the reacting gas in the direction of GDL and CL.

Figure 14: Temperature distribution of the cathode catalyst surface
The variation of temperature on the cathode CL surface is shown in Fig. 15. The larger the channel-ridge ratio, the larger the maximum temperature and the smaller the minimum temperature, leading to a significant increase in the maximum temperature difference and poor uniformity of temperature distribution. The average temperature decreases as the channel-ridge ratio increases. Increasing the channel-ridge ratio makes the difference in gas diffusivity between the channel and the ridge of the plate bigger, and the more obvious the difference in electrochemical reaction, resulting in uneven temperature distribution.

Figure 15: Temperature variation of the surface of the cathode CL
3.2.5 Fuel Cell Output Performance Analysis
Fig. 16 shows the cell polarization curve and power density curve. The current density of the flow channel structures gradually increases with decreasing operating voltage, and the power density curves all show a trend of first increasing and then decreasing. In the low current density region, the voltage loss is dominated by the activation polarization, and the difference in the performance of fuel cells with different flow channel structures is not obvious. With the dominance of ohmic polarization and concentration polarization in the voltage loss, the performance difference starts to appear gradually, and the difference is most obvious in the concentration polarization region. Under the same operating conditions, the fuel cell output performance decreases with the increase of the channel-ridge ratio of the flow channel. Among the five runner structures, the cell with channel-ridge ratio of 0.5 has the best output performance. When the ratio increases from 0.5 to 2.5, the maximum value of power density decreases from 0.82 to 0.68 W/cm2, a decrease of 17%.
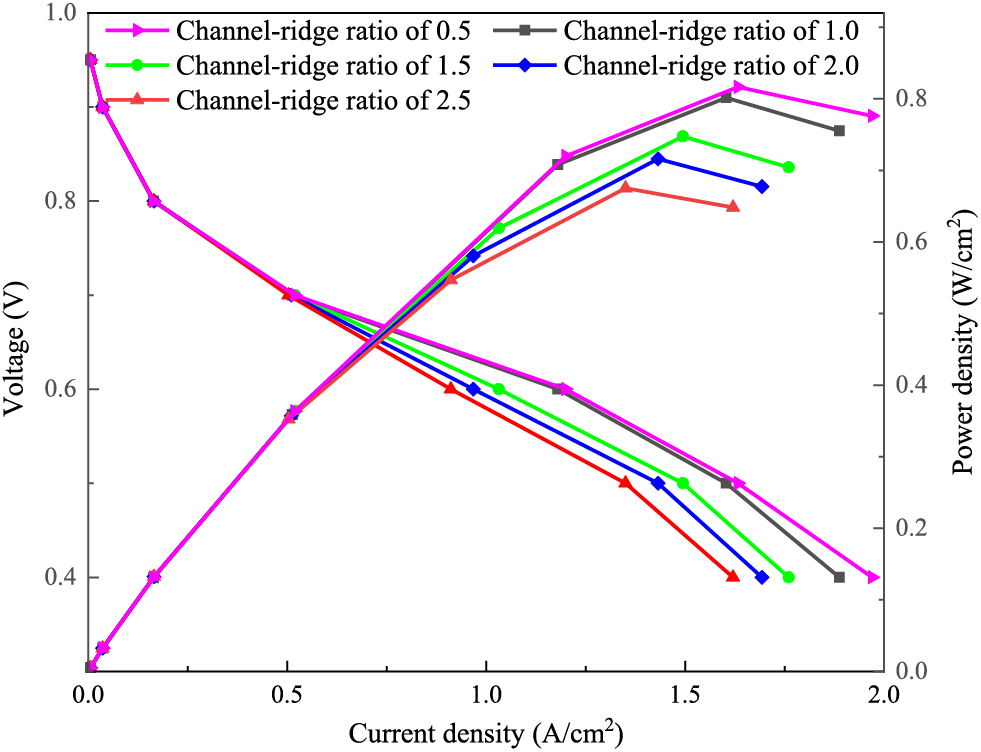
Figure 16: Polarization curve and power density curve of fuel cells
There are several possible reasons for this phenomenon. First, the change in mass transfer area. The mass transfer area is the area of the bipolar plate in contact with the membrane electrode [24]. Theoretically, the larger the mass transfer area of the cell, the easier it is for charged particles to pass through, which in turn leads to a larger current generation. The mass transfer area varies widely among the five flow channel structures, with the mass transfer area as a percentage of the cell cross-sectional area varying from 64.50% to 28.20%. This results in a large difference in the diffusion of the reacting gas into the GDL. Secondly, the larger the flow channel ridge ratio, the lower the differential pressure in and out of the flow field and the average velocity of the gas in the flow channel, which is not conducive to the diffusion of the gas to the GDL. The third reason is the effect of gas distribution uniformity, the larger the value of the flow channel-ridge ratio, the more uneven the gas flow distribution in the manifold.
Combined with previous studies on fuel cell performance and strength, the ridge width of the flow channel should not be larger than the width of the flow channel in order to improve the overall performance of the fuel cell [25]. In addition, constructions such as the open aperture rate of the plate is maintained at 45%–75% to basically ensure the structural strength of the fuel cell [26]. The results of the analysis of the flow field pressure drop, gas distribution uniformity, and cell output performance were integrated, and the pressure drop of the flow field structure with a channel-ridge ratio of 1.0 was moderate while the reaction gas distribution was more uniform. The difference in cell performance with a channel-ridge ratio of 0.5 is very small, and the reduction is only about 0.03–0.06 A/cm2 in the high current density region, so the flow channel with a channel-ridge ratio of 1 is considered more suitable for application in fuel cells.
3.3 Effect of Channel Depth on Fuel Cell Performance
Based on the structure of the optimal channel-ridge ratio of 1, this section determines the ratio to remain constant at 1 and varies the channel depth to analyze the changes in cell performance.
Fig. 17 shows the pressure distribution of the flow field at a constant voltage of 0.6 V. The pressure distribution of each flow field is basically similar, and the lowest pressure has a negative value, which may be due to a local reflux phenomenon in the flow field. The pressure decreases gradually with the flow of gas, and the highest and lowest values appear in the inlet and outlet areas of the flow field. The pressure difference is greater in the flow channel at the inlet and outlet positions of the flow field, while the pressure difference in the flow channel at the middle position is small. In addition, it decreases significantly with the increase of the flow channel depth.
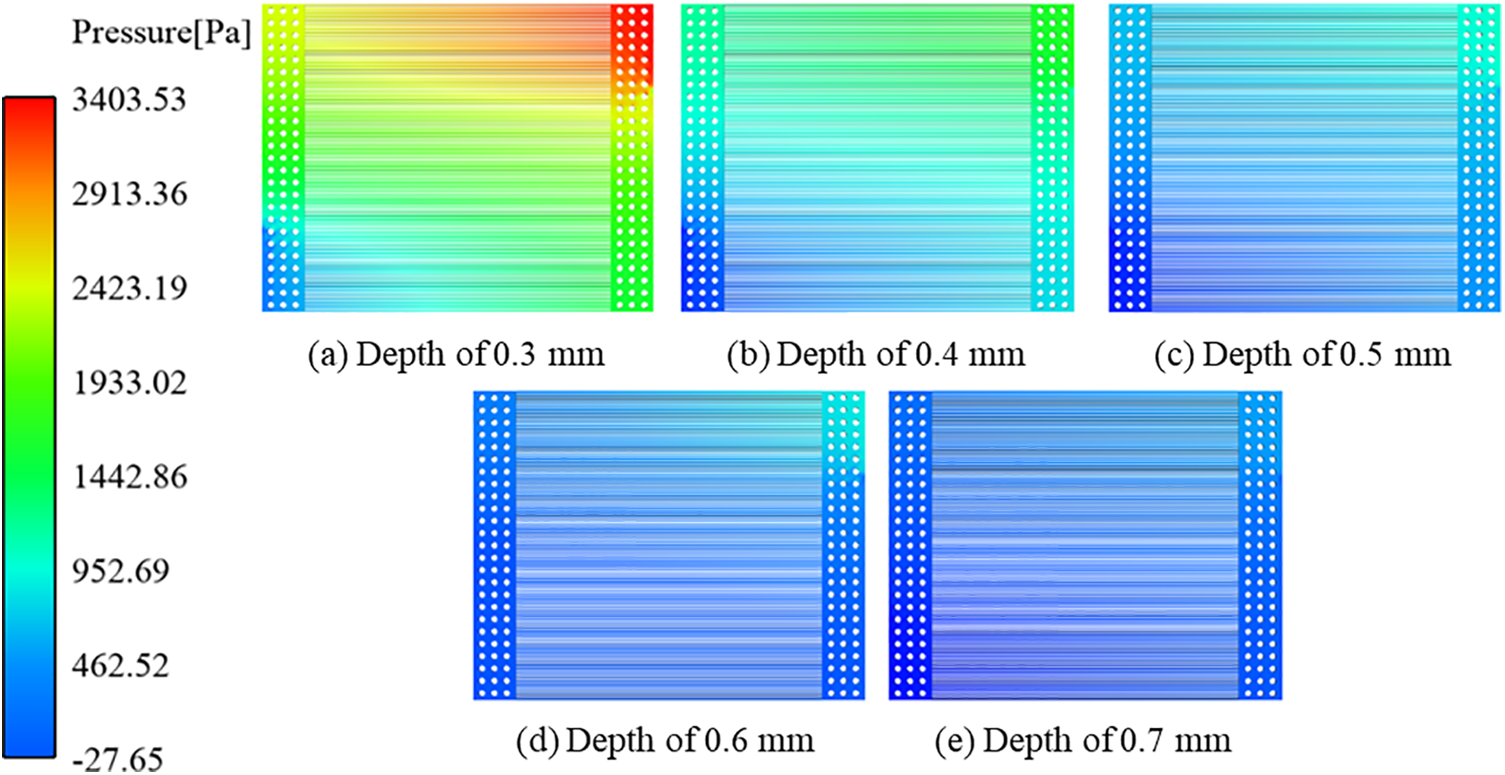
Figure 17: Flow field pressure distribution
Table 3 shows the variation of inlet and outlet pressure difference under each flow channel structure. The pressure difference decreases from 3257 to 578 Pa when the channel depth increases from 0.3 to 0.7 mm.

3.3.2 Analysis of Gas Distribution Uniformity
The variation of mass flow rate in each manifold under the different flow field structures at a constant voltage of 0.6 V is shown in Fig. 18. The flow channels are numbered sequentially from the inlet to the outlet (1–101). The flow rates of the cathode manifolds of the five flow field structures have the same trend, with the smallest flow rate in the manifold at the middle position, the largest flow rate at the outlet side, and the second largest flow rate in the manifold at the gas inlet side.

Figure 18: Mass flow rate variation in the channels
Table 4 shows the variation of the relative standard deviation values of the flow rate in the cathode flow channel for the five flow field structures, which can reflect the uniformity of the gas distribution. The smaller the value, the more uniform the gas distribution. The relative standard deviation decreases with the increase of the flow channel depth, and the flow field structure with the depth of 0.7 mm is most uniform for gas distribution than others.

Since the number of manifolds in the five flow field structures is the same, the mean split ratio of the flow field is used as the evaluation criterion. The mean split ratio is defined as the ratio of the mass flow rate of the manifold to the average mass flow rate. The closer to 1, the more uniform the flow distribution in the flow channel. Fig. 19 shows the variation of the flow field mean split ratio for different flow channels. In the five flow field structures, the mass flow rate has a “concave” distribution. The flow variation curve of the 0.7 mm depth flow channel is more “flat”. Under the same inlet flow rate, the greater the flow channel depth, the more uniform the gas flow distribution. For the five structures involved in this paper, the flow channel structure with a depth of 0.7 mm has the best performance in terms of gas distribution uniformity.
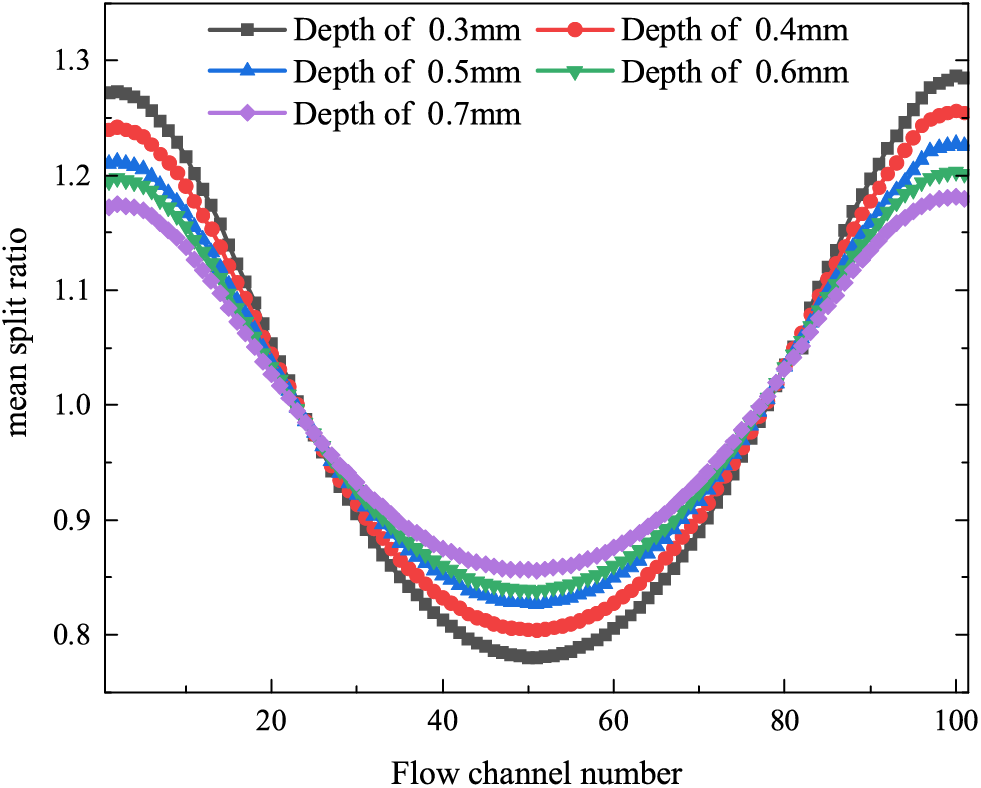
Figure 19: Mean split rate change curve
3.3.3 Gas Component Distribution Analysis
Fig. 20 shows the mass fraction distribution of oxygen on the surface of the cathode CL at a constant voltage of 0.6 V. The mass fraction distribution of oxygen is basically similar under the different flow field structures, and the effect of flow channel depth on gas distribution is not obvious. The oxygen content decreases gradually along the direction of flow of the gas, and the lowest value appears at the end of the manifold in the middle position, which is mainly because the flow rate in the middle position is the smallest, and the phenomenon of “insufficient gas supply” can easily occur at the end of the manifold in the middle position near the exit direction.

Figure 20: Mass fraction distribution of oxygen
The mass fraction distribution of water vapor on the surface of the cathode catalyst at a constant voltage of 0.6 V is shown in Fig. 21. The mass fraction distribution of water vapor is exactly inverse to the distribution of oxygen. As the water content of the reaction gas is low at the time of inlet, water is gradually generated with the occurrence of the reaction and the water content keeps increasing. Due to the small pressure difference in the flow channel in the middle position, it is difficult to discharge the water in the flow channel at this position, and the oxygen concentration in the flow channel in this region decreases rapidly, resulting in the maximum mass fraction of water.
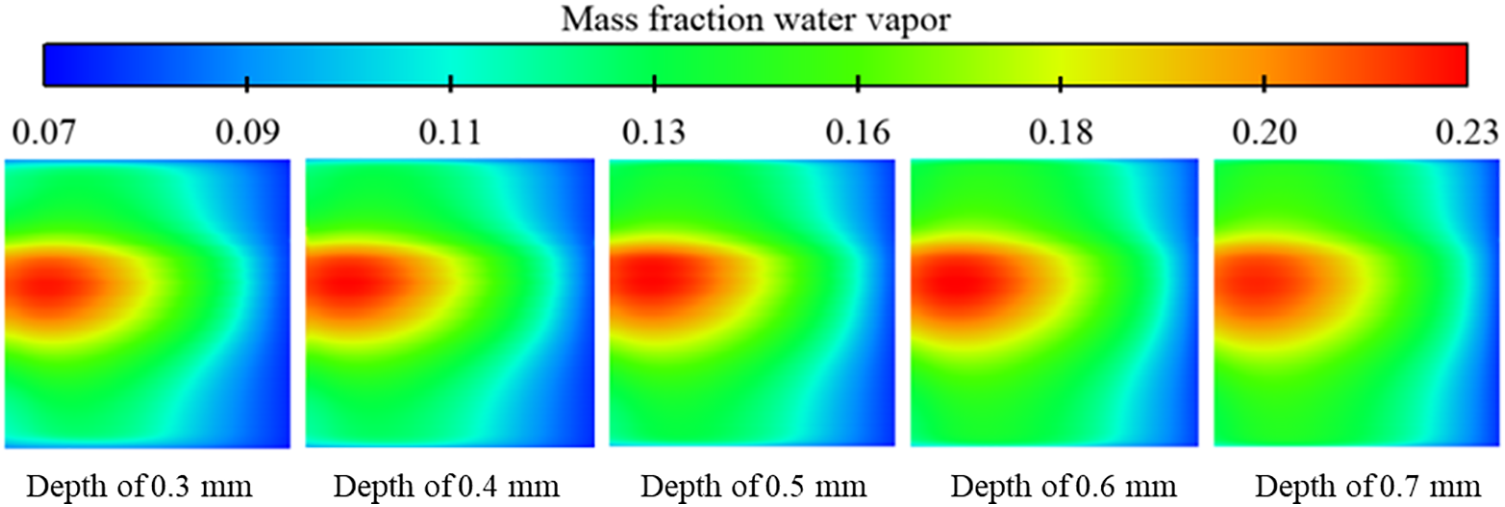
Figure 21: Mass fraction distribution of water vapor
3.3.4 Temperature Field Analysis
Fig. 22 shows the CL surface temperature distribution at a constant voltage of 0.6 V. All the temperatures show a trend of the highest temperature in the middle position, followed by the air outlet side and the lowest temperature in the inlet side. The range of the high temperature region gradually expands with the increase of depth, probably because the increase of depth leads to the decrease of gas flow rate in the flow channel at the inlet and outlet positions, resulting in more gas involved in the electrochemical reaction at the two ends and more heat generated, thus increasing the temperature here. In addition, the greater the depth of the flow channel, the more uniform the temperature distribution on the catalyst surface.

Figure 22: Temperature changes of the CL surface
The curves of the maximum, minimum, average, and maximum temperature difference on the catalyst surface are shown in Fig. 23. The overall effect of the flow channel depth on the temperature is not significant, and the effect on the maximum, minimum, and average temperatures on the catalyst surface is very small. The maximum temperature difference was the same for the three structures of 0.4, 0.5 and 0.6 mm, and the catalyst surface temperature difference was the lowest for the 0.7 mm structure, which resulted in a more uniform cell temperature distribution.
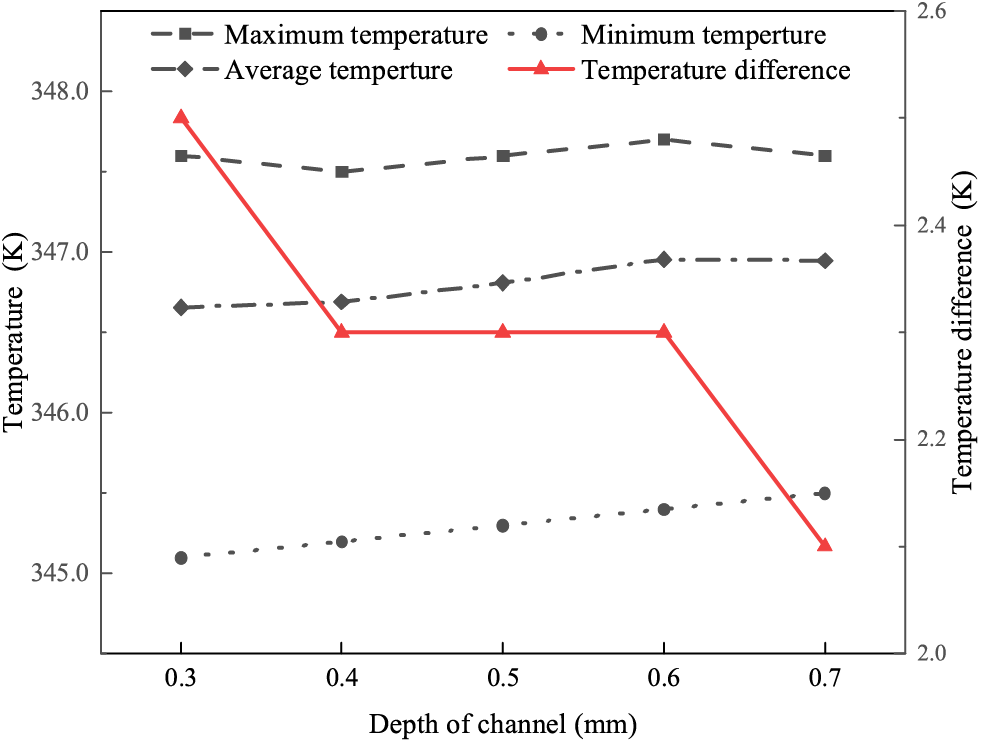
Figure 23: Temperature and temperature difference change curve
3.3.5 Output Performance Analysis
Fig. 24 shows the polarization curve and power density curve of the fuel cells. As the voltage decreases, the cell current density gradually increases, and the cell current density under the five flow field structures ranges from basically the same to significantly different. For the flow field structure combining cylindrical inflow and parallel flow channel as used in this paper, the output performance of the fuel cell is not sensitive to the change of flow channel depth under a low current density condition. And the output performance of the flow field structure with the depth of 0.7 mm is slightly better. The power density curve of the cell shows a trend of increasing and then decreasing with the decrease of the working voltage. The effect of the flow channel depth on the power density curve is small and only varies slightly in the high current density range, with the power density maximum only varying by 0.075 W/cm2, probably because of the variation in the gas flow rate which directly affects the diffusion of the reaction gas.
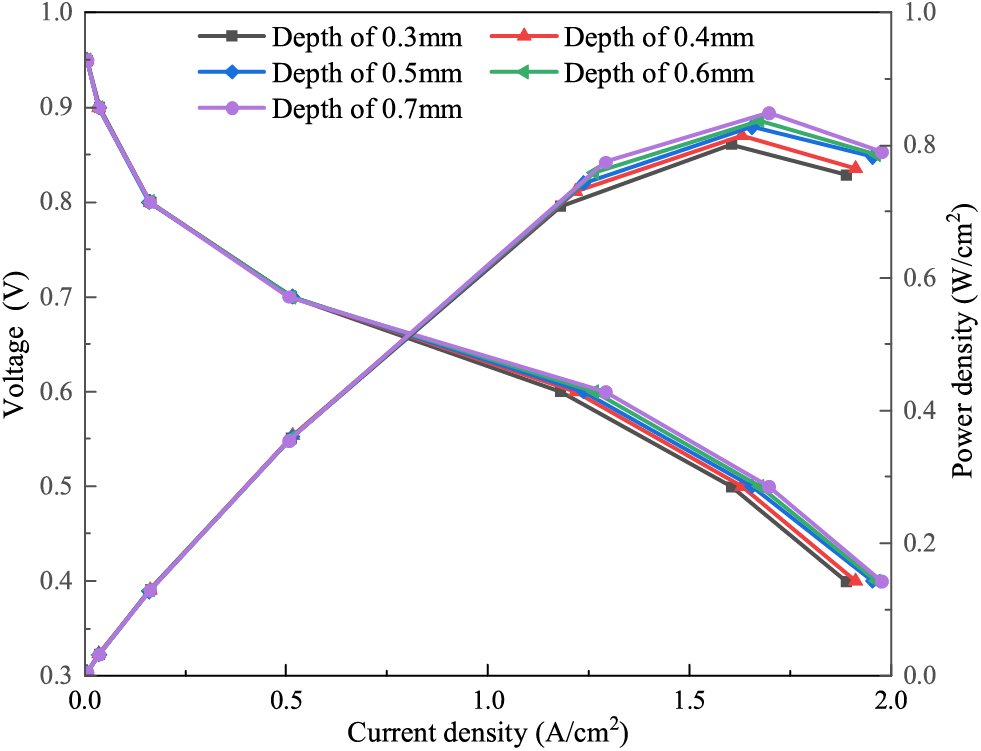
Figure 24: Polarization curve and power density curve of fuel cells
From the results of the analyses of flow field pressure drop, gas distribution uniformity, and output performance, the cell with flow channel depth of 0.7 mm has better overall performance. But its flow field pressure drop is lower, which is likely to cause the problem of difficult drainage, while the flow field pressure drop of the structure with flow channel depth of 0.5 mm is moderate. And the difference between the output performance of the cell with depth of 0.7 mm is very small, with a difference of only 0.05–0.10 A/cm2 in the high current density region, so the flow channel depth of 0.5 mm is considered more reasonable.
Based on the flow field structure of the cylindrical inflow region and parallel flow channel, numerical models with different flow field structures were established for two flow channel dimension factors, channel-ridge ratio and channel depth, respectively. The effects on the flow field, gas distribution uniformity, and cell output performance are investigated, and the following conclusions are obtained:
1. The flow field pressure decreases gradually with the flow of fluid. Increasing the flow channel depth and channel-ridge ratio will reduce the differential pressure between the inlet and outlet of the flow field with the decrease of flow resistance.
2. The trend of flow variation in the manifold is similar for the different structures. Increasing the flow channel depth and decreasing the flow channel ridge ratio are more conducive to the uniform distribution of gas flow in the flow field. This is because while the flow resistance of distribution changes little, the local resistance of flow channel decreases obviously. As the gas flows along the distribution area, it is more likely to flow into the flow channel.
3. The oxygen content on the cathode CL surface decreases in the direction of gas flow. Decreasing the channel-ridge ratio and increasing the depth leads to the decrease of the oxygen content. In contrast, the water vapor content distribution is inverse to the oxygen distribution. And decreasing the channel-ridge ratio and increasing the depth leads to the increase of water vapor content on the CL surface.
4. Compared with the channel depth, the channel-ridge ratio has a significant effect on the temperature. With the increase of channel-ridge ratio, the average temperature of the CL surface decreases. The high temperature region shrinks towards the central region with the increase of the channel-ridge ratio.
5. The output performance of the fuel cell increases with increasing channel depth and decreasing channel-ridge ratio.
Acknowledgement: The authors would like to thank all supporters and reviewers who provide constructive and detailed critique.
Funding Statement: This work was sponsored by the National Key R&D Program of China [Grant Number 2020YFB0106603], the Key R&D Program of Shandong Province [Grant Number 2020CXGC010404] and the Undergraduate School of Shandong University, China [Grant Number 2022Y155].
Author Contributions: The authors confirm contribution to the paper as follows: study conception and design: Guodong Zhang and Huifang Tao; data collection: Da Li and Ke Sun; analysis and interpretation of results: Guoxiang Li and Shuzhan Bai; draft manuscript preparation: Guodong Zhang, Huifang Tao, and Kewei Chen. All authors reviewed the results and approved the final version of the manuscript.
Availability of Data and Materials: The data that support the findings of this study are available from the corresponding author upon reasonable request.
Conflicts of Interest: The authors declare that they have no conflicts of interest to report regarding the present study.
References
1. Sharaf, O. Z., Orhan, M. F. (2014). An overview of fuel cell technology: Fundamentals and applications. Renewable and Sustainable Energy Reviews, 32, 810–853. [Google Scholar]
2. Zhao, H. X., Li, X., Pang, Z. F., Yu, H. T., Gao, R. Z. (2020). Analysis on current development of fuel cell vehicles. Transportation Energy Conservation & Environmental Protection, 16(4), 11–15. [Google Scholar]
3. Wang, Y. B. (2020). Simulation analysis of water management in proton exchange membrane fuel cells (Master Thesis). North China University of Water Resources and Hydropower, China. [Google Scholar]
4. Zhu, W. C. (2020). Numerical modeling and performance study of the radial flow field of a circular bipolar plate in a proton exchange membrane fuel cell (Master Thesis). Shandong University of Construction, China. [Google Scholar]
5. Marappan, M., Palaniswamy, K., Velumani, T., Chul, K. B., Velayutham, R. et al. (2021). Performance studies of proton exchange membrane fuel cells with different flow field designs–review. Chemical Record, 21(4), 663–714. [Google Scholar] [PubMed]
6. Hasan, A. B. M., Guo, S. M., Wahab, M. A. (2009). Fuel cell performance augmentation: Gas flow channel design for fuel optimization. Fluid Dynamics & Materials Processing, 5(4), 399–410. https://doi.org/10.3970/fdmp.2009.005.399 [Google Scholar] [CrossRef]
7. Zhang, X. Y., Higier, A., Zhang, X., Liu, H. (2019). Experimental studies of effect of land width in PEM fuel cells with serpentine flow field and carbon cloth. Energies, 12(3), 471. [Google Scholar]
8. Zhang, X., Yang, X. L., Gao, W. T., Wang, C. (2021). An experimental research on the net output power and current density distribution of PEM fuel cells with trapezoid baffled flow fields. International Journal of Energy Research, 45(15), 21464–21475. [Google Scholar]
9. Chowdhury, M. Z., Genc, O., Toros, S. (2018). Numerical optimization of channel to land width ratio for PEM fuel cell. International Journal of Hydrogen Energy, 43(23), 10798–10809. [Google Scholar]
10. Afshari, E., Mosharaf-Dehkordi, M., Rajabian, H. (2017). An investigation of the PEM fuel cells performance with partially restricted cathode flow channels and metal foam as a flow distributor. Energy, 118, 705–715. [Google Scholar]
11. Kim, M., Kim, C., Sohn, Y. (2018). Application of metal foam as a flow field for PEM fuel cell stack. Fuel Cells, 18(2), 123–128. [Google Scholar]
12. Afshari, E. (2020). Computational analysis of heat transfer in a PEM fuel cell with metal foam as a flow field. Journal of Thermal Analysis and Calorimetry, 139(4), 2423–2434. [Google Scholar]
13. Carton, J. G., Olabi, A. G. (2015). Representative model and flow characteristics of open pore cellular foam and potential use in proton exchange membrane fuel cells. International Journal of Hydrogen Energy, 40(16), 5726–5738. [Google Scholar]
14. Bagherighajari, F., Ramiar, A., Abdollahzadehsangroudi, M., Pascoa, J. C., Oliveira, P. J. (2022). Numerical simulation of the polymer electrolyte membrane fuel cells with intermediate blocked interdigitated flow fields. International Journal of Energy Research, 46(11), 15309–15331. [Google Scholar]
15. Carton, J. G., Olabi, A. G. (2017). Three-dimensional proton exchange membrane fuel cell model: Comparison of double channel and open pore cellular foam flow plates. Energy, 136, 185–195. [Google Scholar]
16. Afshari, E., Jahantigh, N., Khayyam, M. H., Adami, M. (2022). Unsteady 3D numerical modeling of polymer electrolyte membrane fuel cell with pin-type flow field with bean-shaped pins. International Journal of Energy and Environmental Engineering, 13(2), 671–682. [Google Scholar]
17. Wilberforce, T., Ijaodola, O., Emmanuel, O., Thompson, J., Olabi, A. G. et al. (2021). Optimization of fuel cell performance using computational fluid dynamics. Membranes, 11(2), 146. [Google Scholar] [PubMed]
18. Ghadhban, S. A., Alawee, W. H., Dhahad, H. A. (2021). Study effects of bio-inspired flow filed design on polymer electrolyte membrane fuel cell performance. Case Studies in Thermal Engineering, 24, 100841. [Google Scholar]
19. Wu, M. G., Wang, L., Wang, Y. X., Zhang, C., Qiu, C. (2019). Water flow characteristics and related effects in PEMFC. Fluid Dynamics & Materials Processing, 15(4), 431–444. https://doi.org/10.32604/fdmp.2019.08209 [Google Scholar] [CrossRef]
20. Zhang, G., Jiao, K. (2018). Three-dimensional multi-phase simulation of PEMFC at high current density utilizing Eulerian-Eulerian model and two-fluid model. Energy Conversion and Management, 176, 409–421. [Google Scholar]
21. Zhang, Z. Q., Liu, W., Wang, Y. L. (2019). Three dimensional two-phase and non-isothermal numerical simulation of multi-channels PEMFC. International Journal of Hydrogen Energy, 44(1), 379–388. [Google Scholar]
22. Ai, Y. J. (2015). Study on the effect of locking bolts on the thermal deformation of bipolar plates in PEMFC power stacks (Master Thesis). Wuhan University of Technology, China. [Google Scholar]
23. Vielstich, W., Lamm, A., Gasteiger, H. A. (2003). Handbook of fuel cells—Fundamentals technology and applications, vol. 3. England: John Wiley & Sons, Ltd. [Google Scholar]
24. Ji, Y. K., Ding, D. Z. (2018). Flow field analysis of bipolar plates in proton exchange membrane fuel cells. Journal of Jiamusi University (Natural Science Edition), 36(2), 236–240. [Google Scholar]
25. Xiong, J. S. (2006). Optimization of flow field structure and novel flow field for proton exchange membrane fuel cells (Master Thesis). Wuhan University of Technology, China. [Google Scholar]
26. Zhang, H. F., Yi, B. L., Hou, M., Zhang, H. M. (2004). Effect of dimension of flow field on performance of PEMFC. Chinese Journal of Power Sources, 28(8), 494–497. [Google Scholar]
Cite This Article
 Copyright © 2024 The Author(s). Published by Tech Science Press.
This work is licensed under a Creative Commons Attribution 4.0 International License , which permits unrestricted use, distribution, and reproduction in any medium, provided the original work is properly cited.
 Downloads
 Citation Tools