
 Submit a Paper
 Propose a Special lssue
 Open Access
ARTICLE
Analysis of Fluid-Structure Interaction during Fracturing with Supercritical CO2
1 Xi’an Key Laboratory of Wellbore Integrity Evaluation, Xi’an Shiyou University, Xi’an, 710065, China
2 CCDC Changqing Downhole Technology Company, China National Petroleum Corporation, Xi’an, 712042, China
* Corresponding Author: Jiarui Cheng. Email:
Fluid Dynamics & Materials Processing 2024, 20(12), 2887-2906. https://doi.org/10.32604/fdmp.2024.057056
Received 07 August 2024; Accepted 25 September 2024; Issue published 23 December 2024
 View Full Text
 Download PDF
Abstract
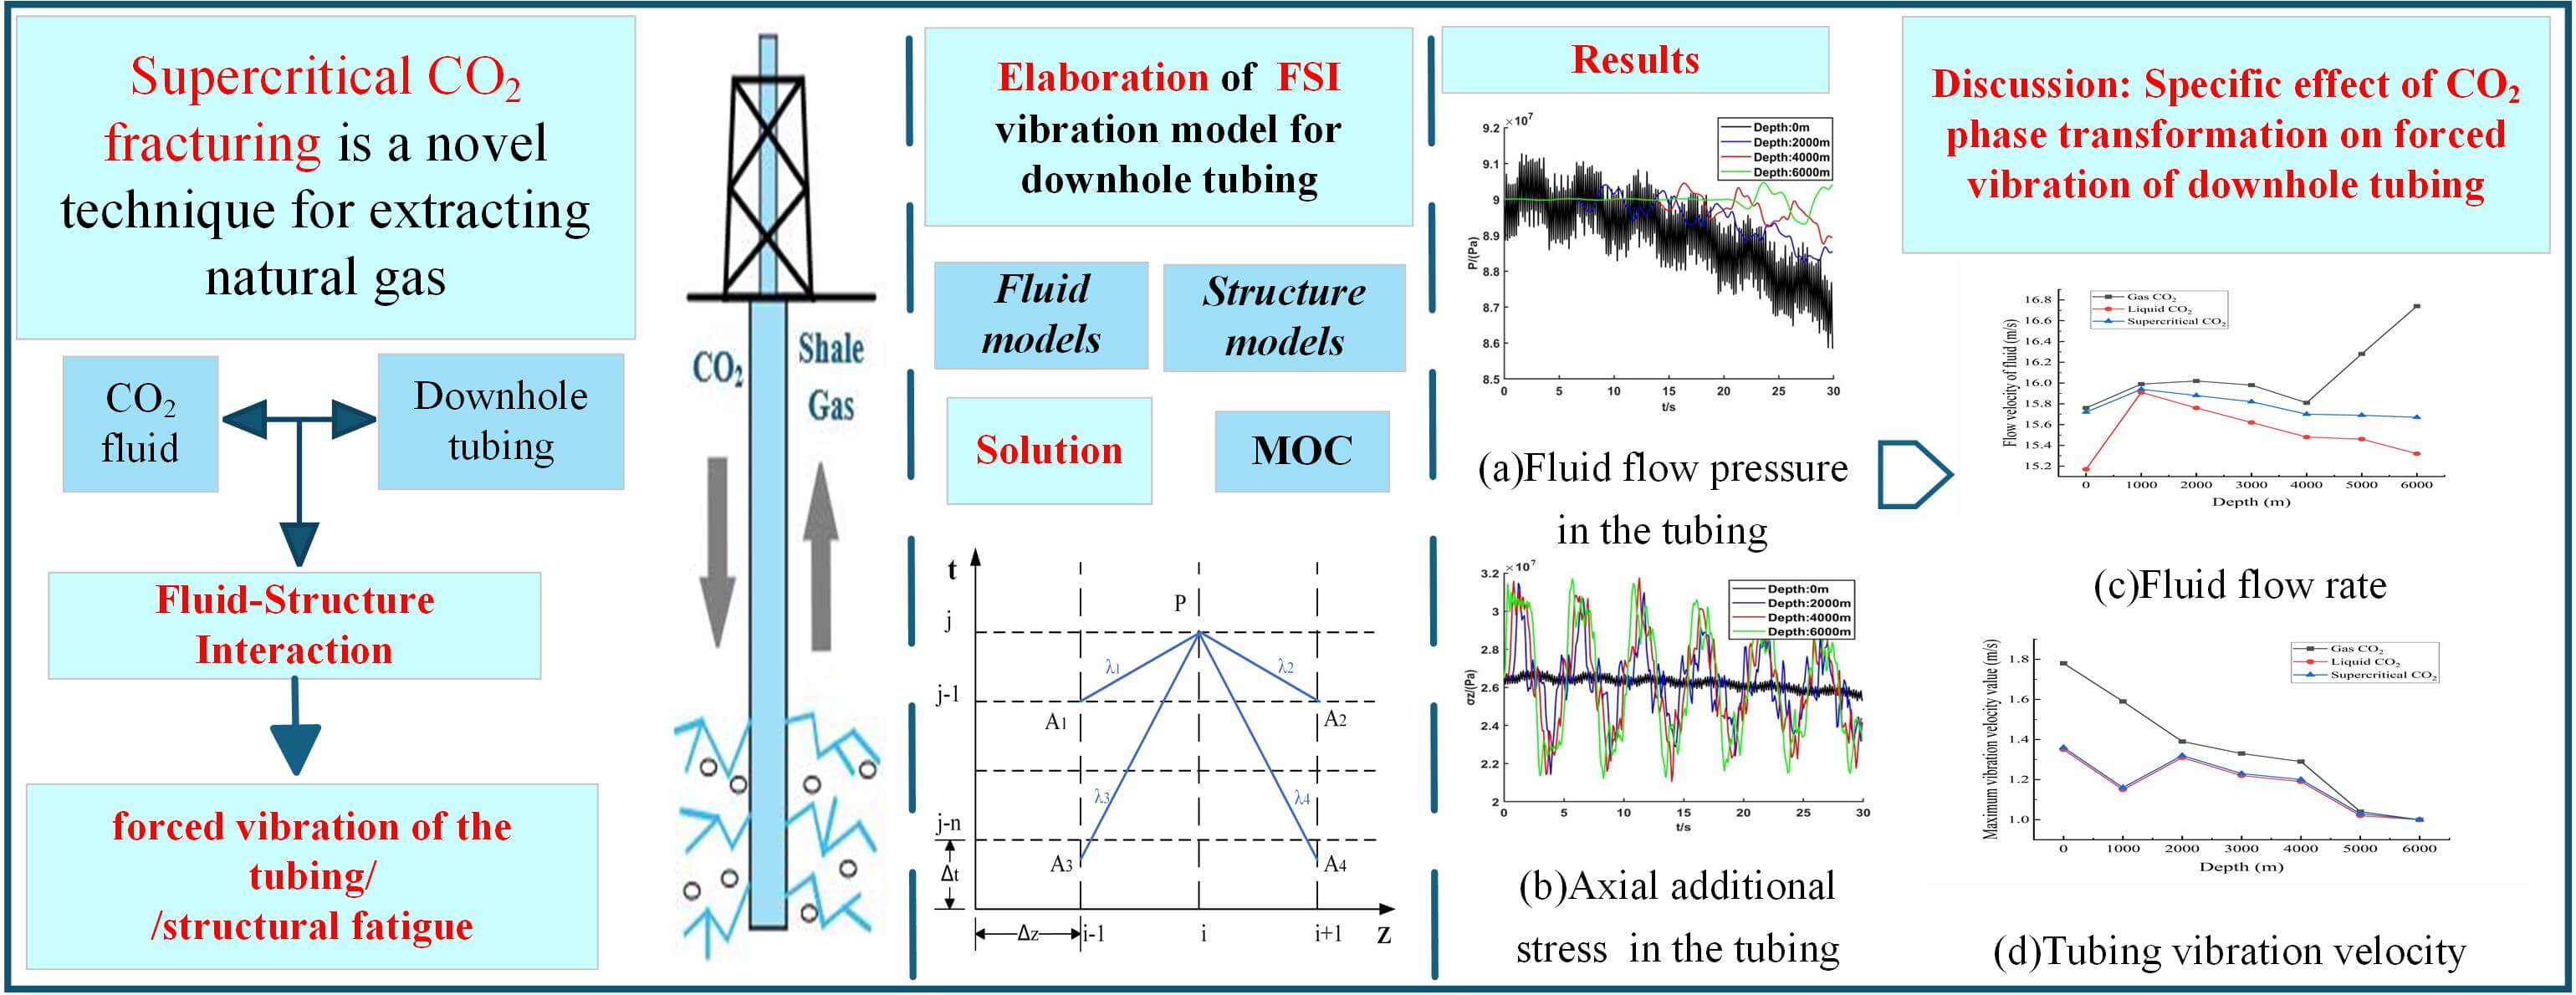
During the implementation of CO2 fracturing for oil and gas development, the force transfer effect caused by the unsteady flow of high-pressure CO2 fluid can lead to forced vibration of the tubing and ensuing structural fatigue. In this study, a forced vibration analysis of tubing under CO2 fracturing conditions is carried out by taking into account the fluid-structure coupling and related interaction forces by means of the method of characteristics (MOC). The results show that for every 1 m3/min increase in pumping displacement, the fluid flow rate increases up to 3.67 m/s. The flow pressure in the pipe tends to be consistent with the pumping pressure at the initial stage and then decreases with an increase in the pump starting time. When the pumping pressure increases by 10 MPa, the additional stress in the tubing increases by 11.8%, and the peak value of the additional stress at the bottom of the well is the largest. The temperature in the tubing grows with well depth, which causes a phase change in CO2 due to heat absorption. At this time the pressure in the tubing decreases, the fluid flow rate increases by about 1.12 m/s, and the additional stress grows by about 1.5 MPa.Graphic Abstract
Keywords
Nomenclature
| vf | Liquid flow rate |
| ρf | Fluid density |
| Kf | Bulk modulus of a fluid |
| P | Liquid pressure |
| E | Modulus of elasticity of tubing |
| | Kinematic viscosity |
| σz | Tubing axial stress |
| Vf | Mean relative velocity of the liquid |
| | Angle between the tubing and the horizontal plane |
| | Wall friction resistance |
| R | Tubing inner radius |
| | Helmholtz free energy |
| | Contrast temperature |
| | Contrast pressure |
| | Tubing density |
| | Tubing axial speed |
| | Tubing wall thickness |
Supercritical CO2 fracturing is a novel technique for extracting natural gas in which a sizable volume of CO2 is pumped through a high-pressure surface pipeline to the downhole tubing. Once inside the underground reservoirs, the CO2 creates fractures in the rock layers that allow oil and gas to seep through [1]. Because of its powerful adsorption ability, supercritical CO2 fluid can cause a displacement reaction with methane in the reservoirs, accelerating the recovery of oil and gas and reducing the greenhouse effect [2]. After injecting CO2 into the tubing during the supercritical CO2 fracturing process, external factors like temperature and pressure—which are closely related to physical parameters of CO2—change with the well depth, causing CO2’s physical parameters to change as well. This can lead to an unsteady flow of CO2 during the phase transition process. Forced vibration of the tubing may result from the force conduction effect, which is led by the complex unsteady state flow of high-pressure CO2 fluid. Downhole tubing leaks, fractures, and even safety incidents like explosions can be easily caused by the fluid-structure contact force coupling mechanism [3,4]. Consequently, during supercritical CO2 fracturing, it is important to examine the downhole tubing’s vibration characteristics.
Several methods exist to study the fluid-structure interaction of flow transmission pipelines, such as experiment and data analysis, theoretical analysis, and simulation. Theoretical research is still the mainstream research method owing to its low cost and high accuracy. Relevant scholars, based on the most classical 2-equation theoretical model of water hammer and considering the Poisson coupling effect, have established a 4-equation model applied to the solution of steady and unsteady flow in the pipe [5,6]. Sanin-Villa et al. [7] developed an 8-equation coupled model to calculate the pipe motion of two-phase flow by considering the axial and in-plane bending motion of the pipe for the phenomenon of air pockets in the liquid pipe. Soufiane et al. [8] constructed a 14-equation coupled model that can be used to calculate diverse structures such as branch pipes and right-angle pipes from a three-dimensional perspective of pipes. Fara et al. [9] proposed a numerical method to probe into the effects of wall viscoelasticity and Navier slip parameters on flow characteristics such as vorticity and pressure drop, aiming at fluid-structure interaction under three-dimensional Navier slip interface conditions. Rocha et al. [10] established a numerical model for physical phenomena related to fluid compressibility and flow velocity in two-phase flow, taking into account the disturbance caused by fluid-structure interaction, and verified its accuracy through experimental analysis. Wu et al. [11] studied the self-excited vibration of a pipeline under the coupling between the pipeline and internal fluid by adopting the transient fluid-structure interaction method. Li et al. [12] created a transient simulation model of flow fluctuation in supercritical/dense-phase CO2 pipelines with contaminants, and confirmed the calculation correctness of the model by contrasting and examining the simulation results of OLAG software. Recent years have seen a steady advancement and improvement in theoretical investigations of fluid-structure interaction in pipelines used for flow transmission. Though the aspects to be taken into account are more varied in the face of more complex actual working settings, it is still possible to explore the fluid-structure interaction theory of flow pipelines.
The transmission pipeline’s fluid-structure interaction vibration theory has also advanced studies on well completion and extraction in the petroleum sector. Guo et al. [13] investigated the response law of the production of oil and gas and the wellbore environment to tubing vibration and developed a nonlinear vibration model of tubing by taking into account variables such borehole trajectory change and tubing dead weight. Zhang et al. [14] established a pressure fluctuation model suitable for multiphase flow in gas wells during the whole production process and simulated the pressure fluctuation in the tubing. Wang et al. [15] designed the lateral fluid-structure interaction vibration model of oil injection and production pipe by combining the energy method and variational method, and analyzed the influence of different gas production on the lateral displacement and vibration frequency of tubing. Cui et al. [16] analyzed the effects of variables including pressure, pump start and shutdown times, and vibration characteristics of tubing resulted in the resonance construction parameters of tubing with various diameters. Cao et al. [17] used simulation software to analyze the effects of different coaxial forces, wall thickness, and other variables on the tubing’s natural frequency and deformation during the injection of the CO2 drive. Under the comprehensive analysis of existing literature, for the extraction process of oil and gas wells, there are more studies on the mechanism of force coupling between tubing and oil and gas, while research on the fluid-structure interaction vibration characteristics of tubing during the supercritical CO2 fracturing process is yet to be explored in depth.
Previous studies consider the fixed tubing barrier and treat the fracture fluid as an incompressible, phase-change-free state. The coupled vibration of fluid-structure interaction in CO2 fracture, which is significantly altered by fracturing and may undergo a phase transition, has received less research attention. This article re-established and theoretically solved the coupled dynamic model of CO2 fracturing tubing, taking into account the unique physical features of CO2 fluid that are readily influenced by the surroundings. The matching program was created based on the solution results in order to examine how various construction parameters, such as pumping pressure and fracturing fluid displacement, affect the vibration characteristics of tubing during CO2 fracturing.
2 Establishment of Fluid-Structure Interaction Vibration Model for Downhole Tubing
The following presumptions form the foundation of this paper: Hooke’s law [18] describes the relationship between the bending forces and displacements of the tubing, which is linear in nature. The fluid is a one-dimensional flow, with identical properties are the same in the same cross-section, and the tubing’s cross-sections are equal and isotropic. The fluid compressibility and viscous interaction with the tubing are taken into account, and the acoustic wave velocity is greater than the fluid flow velocity.
The continuity equation and fluid momentum equation, together with the axial force equilibrium equation and geometrical physics equation of the tubing, are typically included in the axial fluid-structure interaction vibration model. Given that the fluid’s compressibility depends on unknown variables such as flow velocity Vf, pressure P, temperature T, and mass density [19], the energy equation for the fluid should be contained in the primary set of control equations in order to achieve the closure of the entire system.
The law of conservation of mass states that the mass of a micro-element rate of change is equal to the difference between its inflow and outflow mass per unit of time. In column coordinates, the continuity equation for a compressible fluid is expressed as follows:
where, vf is the liquid flow rate, m/s; ρf denotes the fluid density, kg/m3.
Introducing the classical equation of state for compressible fluids and taking a partial derivation of it in time yields:
where, Kf is the bulk modulus of a fluid, Pa; P refers to the liquid pressure, Pa.
The equation is simplified by substituting Eq. (2) into Eq. (1) and neglecting the nonlinear migration acceleration term. Combining the generalized Hooke’s law with the geometric equations [20], the continuity equation is obtained as follows:
where, E indicates the modulus of elasticity of tubing, Pa;
Considering the Poisson effect and neglecting the radial stresses in the tubing, the final simplified continuity equation is expressed as follows:
According to Newton’s second law, the sum of the external forces acting on the fluid micro-element is equal to the product of the mass and acceleration of the micro-element. The axial equation of motion for a compressible fluid in column coordinates is:
By invoking Stokes’ assumption, the volume viscosity coefficient is taken as 0. fz represents the component of the fluid volume force in the axial direction, Pa. Considering the friction effect between the fluid and the tubing wall [20], and neglecting the nonlinear migratory acceleration term and the second-order derivative term, the simplified momentum equation can be obtained as follows:
where, Vf is the mean relative velocity of liquid, m/s;
According to the first law of thermodynamics, the rate of change of the total energy of a flowing system is equal to the sum of the power of external forces to the system and the heat transfer power of external forces to the system. The energy equation in differential form is expressed as follows:
The left side of the above formula represents the change rate of the total energy (internal energy and kinetic energy) of the fluid micro-element system. The first term on the right is the work power of the surface force, the second term is the work power of the mass force, and the third term is the heat transfer power of the outside world to the fluid.
The surface force of the fluid in this model encompasses the fluid pressure and the friction between the fluid and the tubing wall. Considering these factors and introducing the internal energy equation and the heat transfer equation, the final expression of the energy equation is obtained as follows:
where, T is the temperature, K; cv represents the specific heat capacity at constant volume, J/(/kg·k); cp is the specific heat capacity at constant pressure, J/(/kg·k).
The compressible fluid involves a total of four unknown parameters, and the existing continuity, momentum, and energy equations are not yet able to realize the closure of the system. Therefore, it is also necessary to introduce the equation of state. For the CO2 fracturing process, where the fluid flow rate is high and the well environment is gradually complex with a wide range of temperature and pressure, the Span-Wagner equation of state with higher accuracy and applicability is used, which is expressed as follows [21,22]:
where,
The density of CO2 can be determined by the following equation:
where, b means the gas constant (b = 0.1889 kJ/kg·k);
By time deflecting the above formula and ignoring the second deflecting term, the following equation can be acquired:
According to Tijsseling and Morgan’s theory [23], the following equations for the axial force balance of the tubing can be obtained:
where,
Considering the friction effect between the tubing wall and the fluid, and ignoring the nonlinear migration acceleration term, the equation can be simplified. By dividing both sides by the density of the tubing at the same time, the final axial force balance equation of the downhole tubing is obtained as follows:
where,
The coupling between fluid and tubing involves the interface. Introducing interface contact conditions at r = R (fluid-solid contact surface) and r = R +
Combining the generalized Hooke’s law and the geometric equation, the stress-strain and strain-displacement equations of the tubing can be known, and the axial stress expression of the downhole tubing is further obtained as follows:
After partial derivation of the above equation with respect to time and corresponding treatment of
This paper presented a dynamic model of tubing fluid-structure interaction, which considers that the density varies with the temperature and pressure in the wellbore during CO2 fracturing.
Eqs. (5), (7), (14) and (17) are the main equations of the tubing fluid-structure interaction model. The equations are converted into matrix form, with the coefficient matrices represented by A and B, respectively, and F indicates the external excitation vector. The hyperbolic partial differential equations are converted to ordinary differential equations by MOC and then decoupled.
In vector F,
For the solution of the feature root, let the
By substituting the coefficients into the Eq. (20), the feature roots are as follows:
where,
When the eigenvalue takes a positive value, it reflects the forward motion law of the coupled pressure wave along the displacement. When the eigenvalue takes a negative value, it reflects the reverse motion law of the coupled pressure wave along the displacement [24].
According to the eigenvalue theory, the eigenline is the constraint of the characteristic equation, and the characteristic equation can be established only on the eigenline. By solving the characteristic equation, the solution of the original partial differential equation can be achieved. The system of hyperbolic partial differential equations is converted into compatible equations as follows:
where
Fig. 1 displays the characteristic lines of the Z-t plane. The characteristic equations for the different conditions are integrated and expanded along the direction of the characteristic lines as follows (

Figure 1: Schematic diagram of the characteristic lines of the Z-t plane
The above system of equations can be processed to obtain the expressions for each unknown parameter, as shown below:
Based on the previous solution, it is obtained from
From
The related program, which can be utilized for the forced vibration analysis of downhole tubing under the CO2 fracturing condition in this research, has been compiled based on the previously mentioned model solution results. The effects of pumping pressure, displacement, and other pumping parameters related to the fracturing fluid on the vibration characteristics of the fluid-structure interaction in tubing during CO2 fracturing were studied in this article. The construction parameters of CO2 fracturing are summarized in Table 1 [25].

In this research, four parts of the wellhead, 2000 m downhole, 4000 m downhole, and 6000 m downhole were selected to explore the time-dependent vibration characteristics of downhole tubing at different locations during the fracturing process. In order to investigate the effects of various construction parameters on the forced vibration of the tubing during the fracturing process, the control variable method was used. Specifically, variation curves of the vibration characteristics of the tubing with the pumping displacement were attained. The pumping pressure was set at 90 MPa, and the pumping displacement was set at 2, 4, 6, and 8 m3/min when the pumping time was 30 s. The variation curves of the vibration characteristics of the tubing with the pumping pressure were obtained when the fracturing fluid injection displacement was assumed to be 5 m3/min. The pumping pressure was then 80, 90, 100, and 110 MPa, respectively.
Fig. 2 displays the change curves of the tubing’s fracturing fluid flow pressure at various pumping displacements. It was evident that the fluid pressure fluctuation at the wellhead became more violent when the pump was started. However as the well depth deepened, the in-tube fluid pressure fluctuation period slowed down and the fluctuation peak value gradually rose. The pumping displacement had less of an impact on the in-tube flow pressure by comparing the change curves of the in-tube flow pressure under the pumping displacements of 2 and 8 m3/min, respectively.

Figure 2: Variation curves for fluid flow pressure in the tubing at different pumping displacements. (a) 2 m3/min; (b) 8 m3/min
Fig. 3 displays the flow pressure change curves in the tubing at various pumping pressures. As observed, there was a positive correlation between the pumping pressure and the flow pressure in the tubing. Initially, the average flow pressure values at various well depths remained nearly identical to the pumping pressure. The peak value of in-tube flow pressure decreased with the increase of fracturing fluid injection time, and the fluctuation of flow pressure at the wellhead became violent, but along with larger decrease.

Figure 3: Variation curves for fluid flow pressure in the tubing at different pumping pressures. (a) 80 MPa; (b) 90 MPa; (c) 100 MPa; (d) 110 MPa
According to Fig. 4, the fluid flow rate at the wellhead was higher and the fluctuation period was shorter throughout the fracturing process. The fluid flow rate was directly related to the pump displacement. The peak flow rate fell and fluctuation period lengthened with increasing well depth. This was because, during the fracturing fluid injection process, some friction appeared between the fluid and the tubing wall, affecting the flow rate. For pumping displacements of 2, 4, 6, and 8 m3/min, the initial flow rates at the wellhead were 8.23, 15.72, 23.08, and 30.27 m/s, respectively. Up to 3.67 m/s more fluid flow rate was achieved for every 1 m3/min increase in pumping displacement.


Figure 4: Variation curves of fluid flow rate at different pumping displacements. (a) 2 m3/min; (b) 4 m3/min; (c) 6 m3/min; (d) 8 m3/min.
As can be seen from Fig. 5, the fluid flow rate increased with the increase of fracturing fluid injection time. In the initial stage, when the pumping pressure was 80 MPa, the flow rate at the wellhead was 19.29 m/s, and when the pumping pressure rose to 110 MPa, the flow rate at the wellhead was 19.33 m/s, an increase of 0.04 m/s. Obviously, the pumping pressure caused very little effect on the fluid flow rate.

Figure 5: Variation curves of fluid flow rate at different pumping pressures. (a) 80 MPa; (b) 110 MPa
Fig. 6 describes the effect of pumping displacement on the axial additional stress of tubing. At the wellhead, the average axial additional stress of tubing was approximately 26.5 MPa, and the peak value of additional stress rose as well depth increased. The stress fluctuation amplitude at 6000 m downhole reached 10.5 MPa when the pump was started for 6 s, and the fluctuation period is only lasted for 2.6 s. The greatest rise in axial additional stress of tubing during the process of increasing the pumping displacement from 2 to 8 m3/min was just 0.012 MPa, indicating a negligible effect of the pumping displacement on tubing axial additional stress.

Figure 6: Axial additional stress variation curves in tubing at different pumping displacements. (a) 2 m3/min; (b) 8 m3/min
Fig. 7 exhibits the characteristic curve of the downhole tubing’s axial additional stress change under various pumping pressures. It was evident that when pumping pressure rose, the axial additional stress of downhole tubing also increased. The axial additional stress in the tubing increased by approximately 11% for every 10 MPa increase in pumping pressure. At the wellhead, the axial additional stress fluctuated more dramatically, while the amplitude of the fluctuation remained small. The peak additional stress of tubing increased with increasing well depth, with 31.7 MPa reached at 6000 m downhole under 90 MPa pumping pressure.

Figure 7: Axial additional stress variation curves in tubing at different pumping pressures. (a) 80 MPa; (b) 90 MPa; (c) 100 MPa; (d) 110 MPa
Fig. 8 depicts how the downhole tubing vibration speed is affected by the pumping displacement. At the wellhead, the amplitude of the violent fluctuations in tubing vibration speed reached 2.83 m/s. The fluctuation period of tubing vibration speed decreased with increasing pumping time, whereas the fluctuation amplitude exhibited a declining tendency. The peak value of tubing vibration speed at the wellhead reached 1.49 m/s, whereas the greatest value at 6000 m downhole was 1 m/s. As the well depth increased, the amplitude of tubing vibration speed decreased. The peak value of tubing vibration speed at the wellhead increased by 0.003 m/s when the pumping displacement was increased from 2 m3/min to 8 m3/min. These results suggested that pumping displacement exerted a lessening influence on the vibration speed of the tubing.

Figure 8: Vibration velocity variation curves in tubing at different pumping displacements. (a) 2 m3/min; (b) 8 m3/min
Pumping pressure had less of an impact on the tubing vibration velocity, as Fig. 9 illustrates. The peak tubing vibration speed at the wellhead changed from 1.458 to 1.467 m/s, with an increase of only 0.009 m/s, when the pumping pressure was raised from 80 to 110 MPa.

Figure 9: Vibration velocity variation curves in tubing at different pumping pressures. (a) 80 MPa; (b) 110 MPa
Based on the above, it could be concluded that the fluid-structure interaction vibration characteristics of the tubing during supercritical CO2 fracturing were directly correlated with the pumping pressure and displacement. The fracturing fluid flow rate was mostly determined by the pumping displacement, whereas the axial additional stress and fluid flow pressure in the tubing were largely influenced by the pumping pressure. At the wellhead, an increase in pumping displacement and pressure could result in a modest rise in tubing vibration velocity. However, the tubing vibration velocity fell with increasing well depth due to the increased prominence of friction effect and energy dissipation. The tubing’s axial additional stress peak and fluctuation amplitude were the maximum at the bottom of the well, and the wellhead achieved the highest fluid flow rate. Overall, by selecting the proper pumping displacement and pumping pressure during the actual fracturing construction, it is possible to control the fracturing fluid flow rate and tubing vibration rate in future research, thereby lowering the danger of tubing failure from forced vibration and enhancing production safety.
The phase distribution of CO2 is shown in Fig. 10. Clearly, the environment imposed an impact on physical properties of CO2, causing phase changes when temperature and pressure rose above a specific threshold. Normally, CO2 exists in three phase states: gas, liquid, and solid. However, when both temperature and pressure hit their critical values (31.1°C and 7.38 MPa), CO2 will be in the gas-liquid equilibrium at the state’s edge. At this point, the mass fraction of the liquid equals the mass fraction of saturated vapour, and the CO2 fluid—known as supercritical CO2 fluid—becomes a viscous material that seems to be both a liquid and a gas [26].

Figure 10: CO2 phase distribution diagram
The wellbore environment tend to be more complicated during the real supercritical CO2 fracturing process, and the CO2 fluid is easily impacted by it, changing its phase state [27]. This paper employed the control variable method to compare and analyze the vibration characteristics of the fluid-structure interaction of tubing under different phase states of CO2 and different physical parameters at the same well depth and further study the influence of the change of fluid physical parameters on the coupling dynamic behavior of tubing. The physical characteristics of CO2 varied with temperature and pressure, as shown in Table 2.

Fig. 11 displays the highest values of vibration characteristic parameters of CO2 fluid in different phases at different well depths within 30 s after starting the pump, with the pump pressure set as 90 MPa and the pumping displacement as 4 m3/min. It was evident from Fig. 11a that the peak flow pressure in the tubing under gaseous CO2 fluid varied very little between well depths and increased slightly at 5000 m downhole. For both liquid and supercritical CO2 fluid, the in-tube flow pressure trends with well depth during fracturing remained essentially the same, with a significant drop at 1000 m downhole and a very near peak flow pressure.

Figure 11: Vibration characteristics of tubing under fracturing with different phases of CO2. (a) Fluid flow pressure in the tubing; (b) fluid flow rate; (c) tubing vibration velocity; (d) tubing axial additional stress
As observed in Fig. 11b, at varying well depths, the peak flow velocity of the gaseous CO2 fluid in the tubing was higher than that of the liquid and supercritical CO2. An inflection point appeared in the fluid’s peak flow velocity trend as it descended from 5000 m downhole to 6000 m downhole. The gaseous CO2 peak flow rate was 16.78 m/s at 6000 m downhole, and liquid CO2 achieved the lowest flow rate. The pumping pressure’s influence during the flow from the wellhead to 1000 m downhole caused the peak flow rate to increase by approximately 0.7 m/s. The peak flow rate then gradually decreased as the well descended, with the decrease in liquid CO2 being greater than that of gaseous and supercritical CO2. This was due to the fact that liquid CO2 presented the highest viscosity, leading to greater friction between the liquid CO2 and the well wall.
The peak vibration velocity of tubing under CO2 fluid fracturing with varying physical parameters all decreased with increasing well depth, as shown in Fig. 11c. The wellhead tubing’s highest vibration velocity reached 1.79 m/s when gaseous CO2 fluid fractured. Under the fracturing of liquid and supercritical CO2 fluid, the peak axial vibration velocity of tubing at the wellhead was 1.37 m/s. The peak vibration velocity showed a highly consistent trend with well depth, which first increased before rapidly decreasing at the tubing section at 2000 m downhole.
From Fig. 11d, it was evident that the trend of the axial additional stress of the tubing with the change in well depth was not significantly affected by changes in physical property parameters of CO2. The axial additional stress of the tubing increased with well depth under variable phase CO2 fracturing. While the highest axial additional stress of the tubing during gaseous CO2 fluid fracturing remained small at 26.48 MPa at the wellhead, with 33.4 MPa reached at 6000 m downhole. The maximal axial extra stress of the tubing under liquid and supercritical CO2 fracturing at 6000 m downhole was 31.9 MPa, which was 1.5 MPa less than that under gaseous CO2 fluid fracturing.
In conjunction with the analysis presented in this paper, it could be concluded that CO2 fluid parameters and phase state were altered, all of which had an effect on the vibration characteristics of the tubing fluid-structure interaction. The fluid flow rate, tubing vibration velocity, and tubing axial additional stress all decreased when CO2 was changed from gas to liquid, although the flow pressure inside the tubing increased slightly. The fluid flow velocity greatly increased as CO2 was transformed from a liquid to a supercritical state. Consequently, controlling the phase state of the fracturing fluid through pressurizing equipment and ground heating could facilitate efficient development of supercritical CO2 fracturing construction.
Aiming at the forced vibration of tubing caused by unsteady flow of fracturing fluid under fracturing conditions, the fluid-structure interaction vibration model of tubing was established and solved in this research considering that physical properties of the fluid change with temperature and pressure. The tubing vibration characteristic curves under various fracturing construction conditions were studied using programming software, and the following primary results were obtained:
1. In CO2 fracturing, the fluid flow rate of the fracturing fluid in the tubing was greatly influenced by the pumping displacement. The fluid flow rate rose by 3.67 m/s for every 1 m3/min increase in pumping displacement. There existed a positive correlation between the pumping pressure and the fluid flow pressure in the tubing. The average flow pressure in the tubing during the initial stage of pump starting was consistent with the pumping pressure. The flow pressure fluctuation at the wellhead became extremely intense with the largest fluctuation peak value. The flow pressure fluctuation time extended and the fluctuation amplitude somewhat increased as well depth climbed.
2. The primary causes of tubing failure are variations in the load on the tubing and variations in the vibration velocity of the tubing. The tubing’s largest vibration velocity at the wellhead occurred during the pumping stage, with 1.49 m/s reached when the pump was started in roughly 12 s. The peak vibration velocity of the tubing dropped as well as the vibration velocity swung sharply with increasing well depth. As the pumping pressure increased, the tubing’s axial additional stress also increased, with the maximal value of 37.1 MPa reached at 6000 m downhole under 110 MPa pumping pressure. When the pumping pressure increased by 10 MPa, the axial additional stress in the tubing increased by over 11.8%.
3. The effects on the coupling mechanism of the force that interacts with the fluid after the phase change that takes place during the unsteady flow of high-pressure CO2 fluid in downhole tubing during supercritical CO2 fracturing were predicted by theoretical calculations. The peak fluid flow rate rose by 0.4 m/s when the CO2 fluid’s physical properties changed and the phase state moved from a liquid to a supercritical state in response to changes in temperature, pressure, and other variables. The peak fluid flow rate increased dramatically, reaching a maximum rise of 1.12 m/s, as the CO2 fluid transformed from the supercritical state to the gas state. At the same time, the tubing’s peak vibration velocity and peak axial additional stress both increased, which added the risk of tubing damage.
Acknowledgement: Thanks to the National Natural Science Foundation of China and National Engineering Research Centre for Oil and Gas Drilling and Completion Technology for providing funding for this research.
Funding Statement: This research was funded by National Natural Science Foundation of China (Grant No. 52105209). The research was also funded by the National Engineering Research Centre for Oil and Gas Drilling and Completion Technology (Grant No. F2023199).
Author Contributions: The authors confirm contribution to the paper as follows: study conception and design: Jiarui Cheng; data collection: Yirong Yang; programming: Sai Ye, Yucheng Luo; analysis and interpretation of results: Jiarui Cheng, Yirong Yang, Bilian Peng; draft manuscript preparation: Jiarui Cheng. All authors reviewed the results and approved the final version of the manuscript.
Availability of Data and Materials: The authors confirm that the date supporting the findings of this study are available within the article.
Ethics Approval: Not applicable.
Conflicts of Interest: The authors declare no conflicts of interest to report regarding the present study.
References
1. Hu XQ, Lu SF, Zhai L, Wu YQ, Yang WX. Research progress of CO2 fracking technology in unconventional reservoir under the double carbon background. Modern Chem Res. 2022;22(18):183–5. [Google Scholar]
2. Yang P, Cui YH, Wang J, Wang GL, Shi HL. Application prospects of high-pressure pumping technology for liquid CO2 in coal seam gas wells. J New Indus. 2022;12(3):165–8. [Google Scholar]
3. Shu HW. Key engineering technologies of one-million-ton CCUS transportation-injection-extraction in Shenli Oilfield. Petrol Reser Eval Develop. 2024;14(1):10–7. [Google Scholar]
4. Sang Y, Liu PK, Wang XD, Sun WQ, Zhao JL. Fluid-structure interaction analysis of the return pipeline in the high-pressure and large-flow-rate hydraulic power system. Progress Comput Fluid Dyn. 2021;21(1):38–51. doi:10.1504/PCFD.2021.112618. [Google Scholar] [CrossRef]
5. Tubaldi E, Amabili M, Paidoussis MP. Fluid-structure interaction for nonlinear response of shells converying pulsatile flow. J Sound Vib. 2016;371:252–76. doi:10.1016/j.jsv.2016.01.024. [Google Scholar] [CrossRef]
6. Zhou H, Ling MX, Yin YH, Hu H, Wu SL. Unified free vibration solution for three versions of timoshenko beam theory based on dynamic stiffness matrix method. SSRN Electron J. 2023. doi:10.2139/ssrn.4342314. [Google Scholar] [CrossRef]
7. Sanin-Villa D, Serrano Florez D, Del Rio JS. Numerical simulation of water hammer and cavitation phenomena including the convective term in pipeline problems. San Jose de Cucuta, Colombia: IOP Publishing Ltd.; 2020. [Google Scholar]
8. Soufiane M, Hassane M, Ahmed E. Numerical modeling of a 3D elliptical crack in gas metallic pipeline by coupling X-FEM and Volumetric approach. Meknes, Morocco: Institute of Electrical and Electronics Engineers Inc.; 2022. [Google Scholar]
9. Fara J, Hron J, Malek J, Rajagopal KP, Tuma K. Fluid-structure numerical solver for axi-symmetric flows with Navie’s slip interface condition between the viscoelastic solid and the Navier-Stokes fluid: effects of deformable solids on the flow characteristics. Int J Eng Sci. 2024;201:104088. doi:10.1016/j.ijengsci.2024.104088. [Google Scholar] [CrossRef]
10. do Nascimento Rocha PH, de Campos JAA, Camargo MR, da Silva Rocha M. Numerical model for calculation of hydraulic transients with two-phase flow and fluid-structure interaction. J Braz Soc Mech Sci Eng. 2024;46:206. doi:10.1007/s40430-024-04818-w. [Google Scholar] [CrossRef]
11. Wu J, Zheng SY, Wang C, Yu ZP. Study on pipeline self-excited vibration using transient fluid-structure coupling method. Int J Adv Manuf Technol. 2020;107(2):4055–68. [Google Scholar]
12. Li YX, Lu JX, Liu X, Chai C, Jia QY, Wang WC, et al. Transient simulation calculation model for flow fluctuation in supercritical/dense phase CO2 pipelines. Oil Gas Storage Trans. 2024;138(3):1–9. [Google Scholar]
13. Guo XQ, Liu J, Wang GR, Dai LM, Fang DK, Huang L, et al. Nonlinear flow-induced vibration response characteristics of a tubing string in HPHT oil & gas well. Appl Ocean Res. 2020;106(5):102486. [Google Scholar]
14. Zhang Z, Wang JW, Li YJ, Liu HX, Meng WB, Li L. Research on the influence of production fluctuation of high-production gas well on service security of tubing string. Oil Gas Sci Technol. 2021;76:54. doi:10.2516/ogst/2021035. [Google Scholar] [CrossRef]
15. Wang H, Ding LL, Li YF, Tang G, Lu LF, Zhang L. Dynamic mechanism of lateral vibration of injection/production string in underground gas storage. China Petrol Mach. 2020;48(9):128–32 (In Chinese). [Google Scholar]
16. Cui L, Qiao FF, Cheng JR, Li M. Study on the effect of fracturing pump start and stop on tubing fluid-structure interaction vibration in HPHT wells via MOC. Energies. 2022;15(24):9291. doi:10.3390/en15249291. [Google Scholar] [CrossRef]
17. Cao YP, Wang LY, Dou YH, Sun XX. Analyses of fluid-structure interaction vibration modal of tubular column with CO2 flooding injection. Technol Supervis Petrol Indus. 2023;39(4):9–12. [Google Scholar]
18. Kang ZL, Guo P, Wen XY, Yao L, Zhang PX, Wang HJ. Vibration characteristics and safety analysis of completion string in high pressure and high gas rate well. China Petrol Mach. 2022;50(1):41–6 (In Chinese). [Google Scholar]
19. Zhu XH, Zeng YY, Chen B, Tao HR. Vibration characteristics of double-elbow fracturing manifold considering fluid-solid interaction. Nat Gas Industry. 2018;38(1):95–101. [Google Scholar]
20. Sui SH, Meng H, Peng DH, Ma GF. Numerical simulation of fluid structure coupling vibration in a pipeline with intermediate constraints. J Wenzhou Univ (Nat Sci Ed). 2022;43(1):1–7 (In Chinese). [Google Scholar]
21. Shen Z, Shen G, Standifird W. Numerical estimation of upper bound of injection pressure window with casing integrity under hydraulic fracturing. In: The 50th U.S. Rock Mechanics/Geomechanics Symposium, 2016; Houston, TX, USA: American Rock Mechanics Association; p. 1–10. [Google Scholar]
22. Peng SY, Jia QY, Li QF, Lu JX, Xie NY, Wang WC, et al. Hydraulic and thermal calculation model of supercritical CO2 steady-state transportation. Nat Gas Oil. 2024;42(2):1–7. [Google Scholar]
23. Liu T, Liu W, Zheng HA, Dai DJ, Dong J, Zou XF, et al. Comparative study for adaptation to CO2 equation state equation. Unconvent Oil Gas. 2024;11(1):85–93. [Google Scholar]
24. Moradi H, Rahbar Ranji A, Haddadpour H, Moghadas H. A hybrid model for simulation of fluid-structure interaction in water entry problems. Physics of Fluids; 2021;33(1):017102. [Google Scholar]
25. Wang JW, Zhang Z, He XH, Yang Q, Chen X. Effect of fracturing on transient pressure fluctuation of tubing in ultra-deep well. J Hydrodynam. 2022;37(1):132–5. [Google Scholar]
26. Jia JY, Chen F, Liu J, Yang FY, Cao YY, Zhang XM, et al. Study on the calculating method of CO2 physical properties. Standard Metrol Instr Met. 2024;40(3):20–3. [Google Scholar]
27. Li XZ, Sun C, Liu XF, Zou WJ, Jiang XY, Guo LH, et al. Prediction of change laws of temperature, pressure and phase state in supercritical CO2 pipeline shutdown process. Low-Carbon Chem Chem Eng. 2024;49(1):5–14. [Google Scholar]
Cite This Article
 Copyright © 2024 The Author(s). Published by Tech Science Press.
This work is licensed under a Creative Commons Attribution 4.0 International License , which permits unrestricted use, distribution, and reproduction in any medium, provided the original work is properly cited.
 Downloads
 Citation Tools