
 Submit a Paper
 Propose a Special lssue
 Open Access
ARTICLE

Numerical Analysis of the Influence of the Impinging Distance on the Scouring Efficiency of Submerged Jets
1 School of Naval Architecture and Maritime, Zhejiang Ocean University, Zhoushan, 316022, China
2 School of Marine Engineering, Guangzhou Maritime University, Guangzhou, 510725, China
* Corresponding Author: Xianbin Teng. Email:
Fluid Dynamics & Materials Processing 2024, 20(2), 429-445. https://doi.org/10.32604/fdmp.2023.030585
Received 13 April 2023; Accepted 15 August 2023; Issue published 14 December 2023
 View Full Text
 Download PDF
Abstract
Water jet technology is widely used in submerged buried pipes as a non-traditional trenching process, often involving a complex sediment response. An important adjustable and influential engineering variable in this technology is represented by the impinging distance. In this study, the FLOW-3D software was used to simulate the jet scouring of sand beds in a submerged environment. In particular, four sets of experimental conditions were considered to discern the relationship between the maximum scour depth and mass and the impinging distance. As shown by the results, a critical impinging distance exists by which the static scour depth can be maximized; the scour mass ratio between dynamic and static conditions decreases as the impinging distance increases. Moreover, the profile contours are similar when the erosion parameter is in the range 0.35 < < 2. Empirical equations applicable for predicting the jet trenching contour under both dynamic and static scour modes are also provided in this study.Graphic Abstract
Keywords
Submarine pipelines are a crucial means of connecting land and ocean resources. Cables and pipelines need to be laid in trenches on the seafloor to prevent mechanical damage resulting from ships anchoring or other artificial operations, as well as to reduce the impact of tides, currents, and seabed geological migration on the pipelines. Due to its advantages of high efficiency, energy saving, and ability to work in deep water environments, water jet excavation has gradually replaced traditional mechanical excavation methods. The success of such operations depends on the ability to predict the response of seabed sediments to a given characteristic jet.
To predict the ability of seabed sediments to respond to a given characteristic jet flow, it is necessary to classify dynamic scour and static scour, as shown in Fig. 1. Dynamic scouring refers to scouring that occurs during the scouring process, during which the suspended particles cannot settle completely due to the influence of the turbulent flow; static scouring parameters refer to the scour hole parameters measured after the water has stopped and the sediment has settled completely. There is a significant difference between dynamic scour and static scour, and under certain conditions, the depth of dynamic scour can be approximately three times that of static scour depth [1].
Figure 1: Schematic diagram of dynamic and static scouring
Many scholars have studied the phenomenon of submerged water jet scouring of sand beds. O’Donoghue et al. [2] conducted experiments on the response of sand beds to submerged circular vertical water jets in non-cohesive sediments. They found that the difference between the static and dynamic scouring profiles was much larger than in previous experiments. Aderibigbe et al. [3] studied the variations in dynamic and static scour depths with impinging distance using physical experiments of submerged circular vertical turbulent jets on loose layers and classified the jets into strong deflected jets and weak deflected jets based on the asymptotic state of the scour hole shape and jet flow form. Chakravarti et al. [4] conducted a scouring of the non-cohesive sediment in a submerged environment using circular vertical jets, and measured the dynamic and static scour depths for different working conditions by changing variables such as nozzle diameter, outlet velocity, and impinging distance. The results showed that the difference between the two depths was related to the scouring parameters
Previous studies were mainly conducted through laboratory experiments, where the acquisition of static scouring parameters was relatively easy by measuring the profile after scouring and allowing it to settle. However, this method is prone to damaging of the profile during drainage. Dynamic scouring parameters are measured when the scouring reaches its asymptotic state, but the addition of instruments during scouring inevitably disturbs the dynamic equilibrium, and the results may vary due to the characteristics of turbulent flow fields and environmental interference, which makes the experimental efficiency low.
In recent years, the use of computational fluid dynamics (CFD) software to study hydraulic engineering has become more widespread. Compared with traditional laboratory experiments, numerical simulations have low cost and high efficiency, and various working conditions can be studied by changing parameters. Because there are no sensors involved, data can be obtained without affecting the experiment itself. The FLOW-3D software is suitable for simulating non-cohesive soils. Liu et al. [5] used the software to simulate the horizontal jet scouring of a downstream sediment with a fixed bottom plate, and compared the numerical simulation with the original experiment. The results showed a high degree of agreement, proving that the sediment model in the software can be used for the analysis of variables in non-cohesive sediment physical experiments.
Starting from the practical application of burying pipelines in the seabed, experiments have been conducted on the submerged water jet scouring of sand beds, and focused on studying the influence of variable impinging distance on dynamic and static scouring, different scour pit profiles were categorized, and the factors contributing to their formation were analyzed. The similarity of profile contours at the asymptotic state was examined, and corresponding empirical equations were derived. This study focused on a common circular jet, to provide theoretical guidance for relevant operations.
2 Basic Assumptions and Mathematical Models
The FLOW-3D software utilizes the finite volume method for numerical simulation calculations, representing the fluid domain through numerous small control volumes. Each control volume interacts with its surrounding volumes, and the discrete equations guarantee integral conservation for each volume. This method is well-suited for solving transient problems, particularly those involving high-speed and unsteady phenomena. The numerical model employed in this study was closely related to the work of Zhang et al. [6,7], which considered the interaction between the liquid and solid phases. The following assumptions were made in this paper:
I The fluid is continuous and incompressible.
II Flow is considered as two-phase flow.
III Two-phase flow assumed is steady and characterized by turbulent flow.
In the Cartesian coordinate system, the incompressible water model’s control equations include the continuity equation and N-S equation, given as follows:
The
The sediment model’s control equations include the transport rate equation and diffusion equation [8], given as follows.
In the equation,
3 Simulation Model Optimization and Validation
3.1 Optimization of Simulation Model
In the problem of a jet impinging on a sand bed, a two-dimensional model can be derived by projecting a three-dimensional model onto a plane [9,10]. Due to the inherent symmetry of jet impingement, using a two-dimensional model in research can effectively reduce computation time and enhance simulation efficiency. Based on previous two-dimensional models [11,12] (Fig. 2 left), the model was optimized (Fig. 2 right).
Figure 2: Schematic diagram of geometry model and mesh division
The original model size was 1300 mm × 1000 mm, with a circular nozzle diameter of 2.5 mm located in the center of the model, a sand layer thickness of 400 mm, and a single grid partition. However, this setup has several issues: 1) It cannot accurately represent complex boundaries and necessitates additional solid structures for confinement. The original model added a top baffle to ensure that only the water jet from the nozzle enters the computational domain, but this additional component may not align with the actual situation. 2) The presence of the overflow baffle and air layer impedes the motion of suspended sediment and the jet. 3) The nozzle component passes through the liquid layer and air layer, requiring additional fluid domains to define their initial states. 4) Compared to the main model, the nozzle model has a smaller size, and to ensure computational and geometric accuracy near the nozzle, local refinement is necessary. Although the software allows for cutting with different grid sizes in different directions, high aspect ratios can easily cause calculation divergence and numerical errors. When using single grid refinement to achieve pressure convergence without affecting the aspect ratio of the grid, it inevitably increases the number of grids and calculation time.
The optimized model size was 1300 mm × 900 mm, eliminated the top baffle and air layer, and reduced the height of the overflow baffle to match that of the sand bed. A nested grid used, a new grid block was added near the nozzle and encrypted separately. A mass source model was introduced at the nozzle entrance in the direction of gravity. The mass source model can introduce a jet with a specified flow velocity at any position in the computational domain and placing it inside the nozzle eliminated the need for the top baffle or air layer used for boundary constraints, thereby reducing computational resources while also making boundary expressions more reasonable. The overflow baffle’s height was reduced and was only used to constrain the sand bed and eliminate wall effects on the jets and suspended sand. The new model not only reduced redundant computational domains and eliminated wall effects, but also made boundary expressions more reasonable. By changing the length of the nozzle, variable impinging distance control was achieved, and adjusting the boundary pressure can match any depth of seabed conditions. The nested grid ensured both geometrical and flow field resolution accuracy near the nozzle and did not affect the aspect ratio of the main grid in the main region.
The boundary conditions of the new model are presented in Table 1. The default boundaries were automatically changed to linked boundaries [13] during pre-processing. Sediment particle size was set according to data obtained from the literature as 1.8 mm [14,15], with a density of 2650 kg/m3, applicable slope effect, jet impinging distance h0 = 150 mm, and mass source model inlet velocity U0 = −5 m/s. The dynamic scouring lasted for 15 s (reaching an asymptotic state at 10 s).
To continue the simulation of static scouring, the RESTART model of the software was used based on the result of dynamic scouring. The static scouring process lasted for 15 s (the sediment concentration reached 0 after 5 s). Removed the mass source model and nozzle components to avoid influencing sand sedimentation. Other settings remained the same as those used for dynamic scouring.
For incompressible fluids, the pressure term is usually handled implicitly to maintain incompressibility and solution stability. The GMRES algorithm was chosen as the iterative method, which exhibits good convergence, symmetry, and speed characteristics suitable for various flow problems, usually, the GMRES solver does not require any over or under relaxation to achieve good convergence [16–19]. On the other hand, the viscosity stress solver, free surface pressure solver, and convection solver were solved explicitly. Explicit solving methods do not require iteration, occupy less computational space, provide more stable results, and offer higher computational accuracy.
Compared to the entire computational domain, the nozzle region occupied a small proportion. Set the nozzle grid size to be 1.25 mm, with approximately 3000 grids. This grid density was sufficient to satisfy the simulation accuracy of the nozzle region. The grid density of the main region was the primary factor affecting simulation results. Conducted a grid sensitivity analysis, and the grid settings for the main region are presented in Table 2.
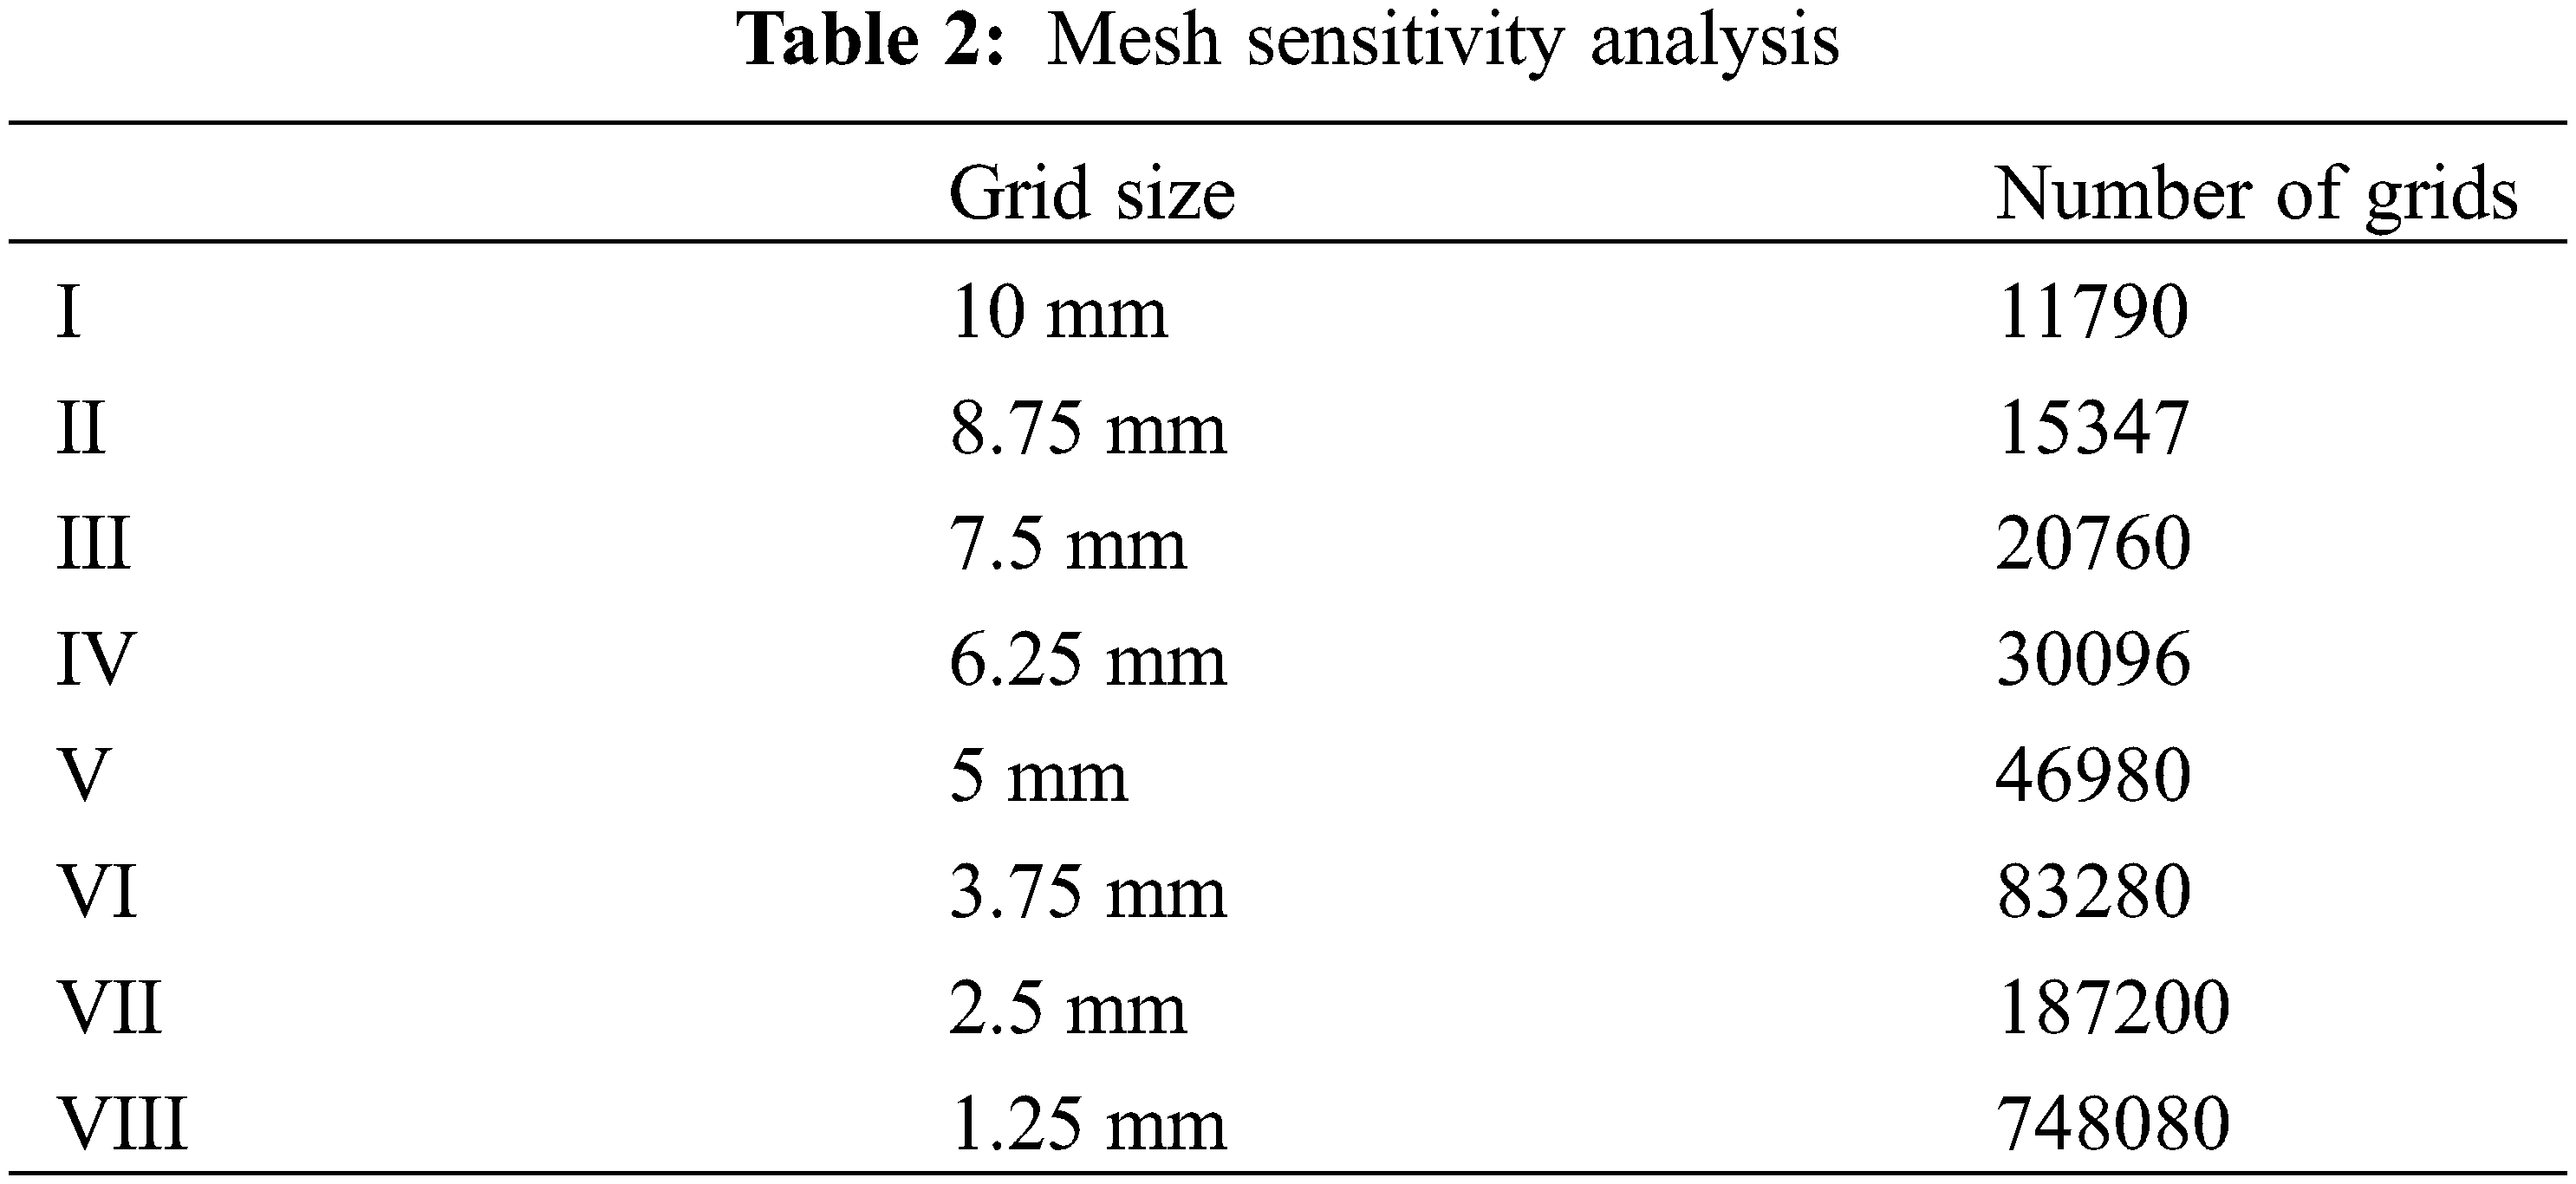
The grid independence verification of the main region is shown in Fig. 3. When the number of grids was larger than 30,000, the simulation results did not change significantly. Considering the model’s computational accuracy and time cost, selected 3.75 mm as the grid size for the main region. Ensured the coincidence of the interface between the two grid blocks by adding grid nodes in the X and Z directions.
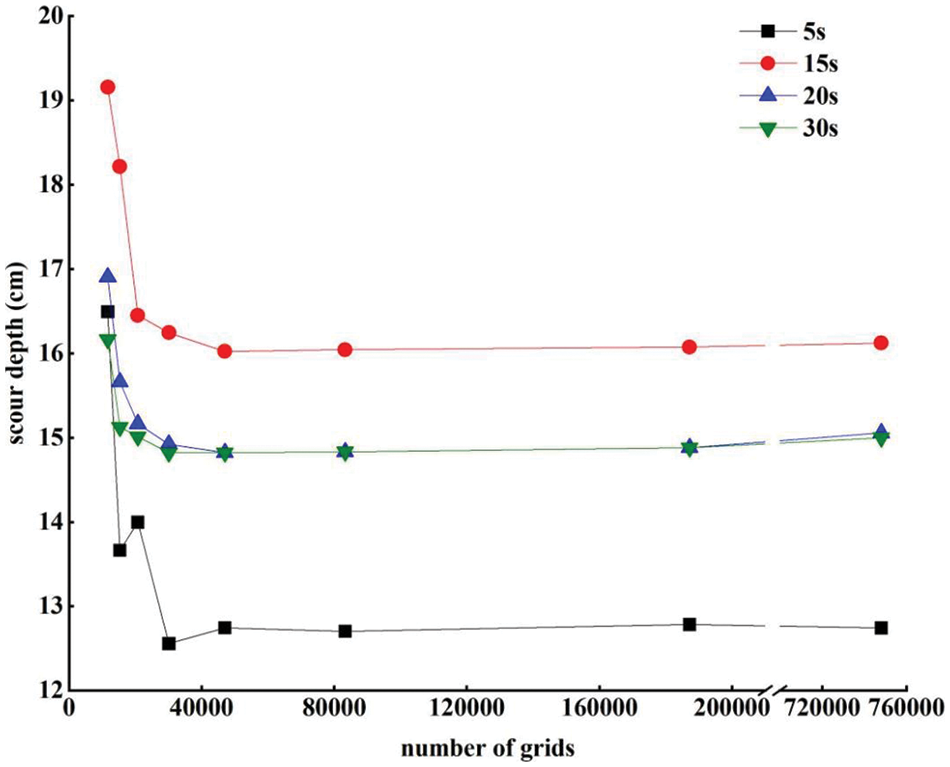
Figure 3: Mesh sensitivity analysis
According to the CFL condition, the time step during the simulation needs to be lower than the stability threshold. If the fluid velocity through the grid is too fast, it may lead to unexpected flow or even splashing. Therefore, with the grid size and nozzle jet velocity determined, the individual simulation time step is essentially determined. After comprehensive consideration, chose the minimum time step to be 1e-6s [8].
3.2 Physical Experiment Platform Design and Experimental Steps
The submerged jet scouring experimental platform is shown in Fig. 4, with an experimental water tank size of 150 cm × 150 cm × 120 cm (excluding the glass baffle), which was sufficient for validating the simulation model. There was a fixed guide rail above the water tank, and by adjusting the handle and slider, the height of the nozzle could be changed. The required experimental water was pumped into the water tank and jet pipe by a variable frequency motor-driven centrifugal pump, and the jet speed was changed by adjusting the motor frequency to change the pump speed. The experimental parameters were set the same as the simulation, with a nozzle gap of 2.5 mm and the sand source used in the experiment was specialized sand of particle size between 10 mesh (2.00 mm) and 12 mesh (1.70 mm) obtained through screening analysis.
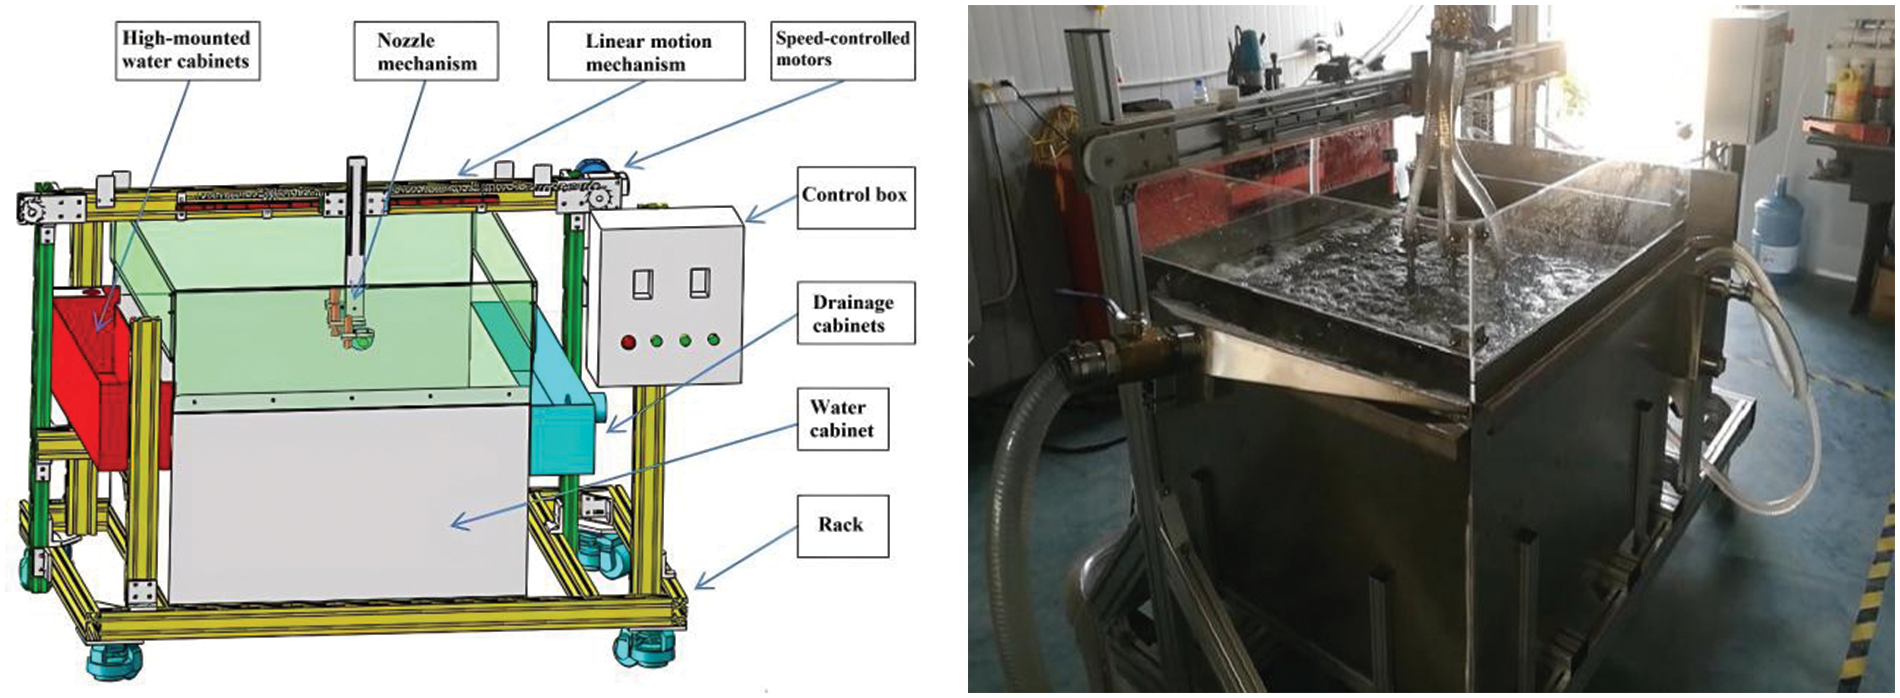
Figure 4: Scour experiment platform
Before starting the experiment, the sand was leveled and compacted, the motor was turned on, and water was slowly added to the water tank. After the water was added, the water surface was allowed to settle until it became clear. The jet device was moved to the center of the platform, the slider was adjusted to the specified height, and the nozzle was blocked. After establishing a constant head, the nozzle was opened to start the experiment. To measure the scouring depth, a fine rod gauge was inserted into the scour pit until it touched the surface. To ensure measurement accuracy and reliability, this step was standardized by repeating the experiment five times and averaging the results. This approach effectively reduced human errors, improving the precision and credibility of the measurements.
After the scouring ceased, the turbulence of the water flow rapidly diminished, and the suspended sediments settled due to their own weight and friction, resulting in a reduction in scour depth. Fig. 5 illustrates the concentration of suspended sediments at different time intervals during the scouring process, providing a comprehensive view of the scour evolution from the perspective of suspended sediments. The white arrow in the Fig. 5 indicates the velocity vector of the water flow. It can be observed that after a certain period of scouring, the main body of the jet tilts [13], which has been confirmed in existing literature and experiments.
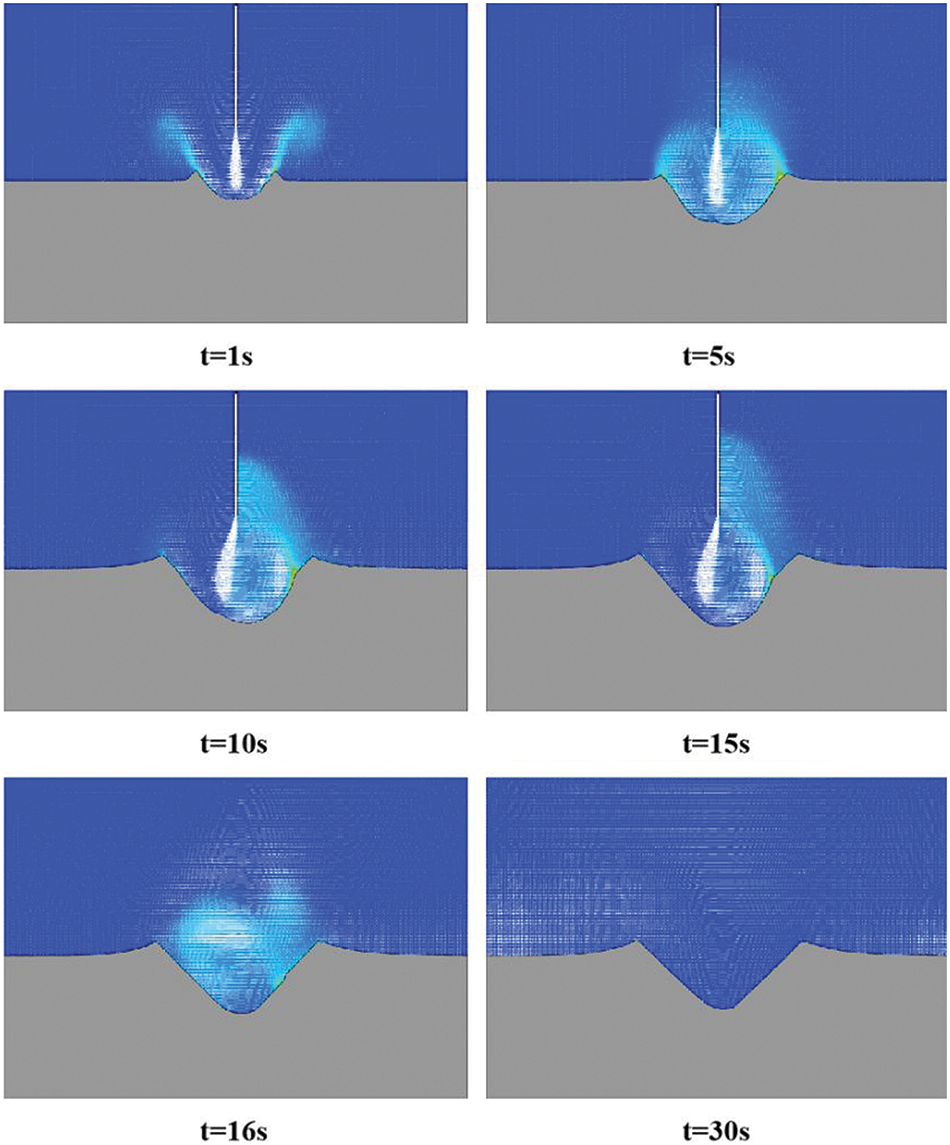
Figure 5: Suspended sediment concentration at each moment
Both simulations and experiments were conducted for a duration of 30 s, with dynamic scouring and static scouring each lasting for 15 s. Scour depth serves as a critical parameter for assessing scouring effects, and the temporal evolution of the maximum scour depth is presented in Fig. 6.
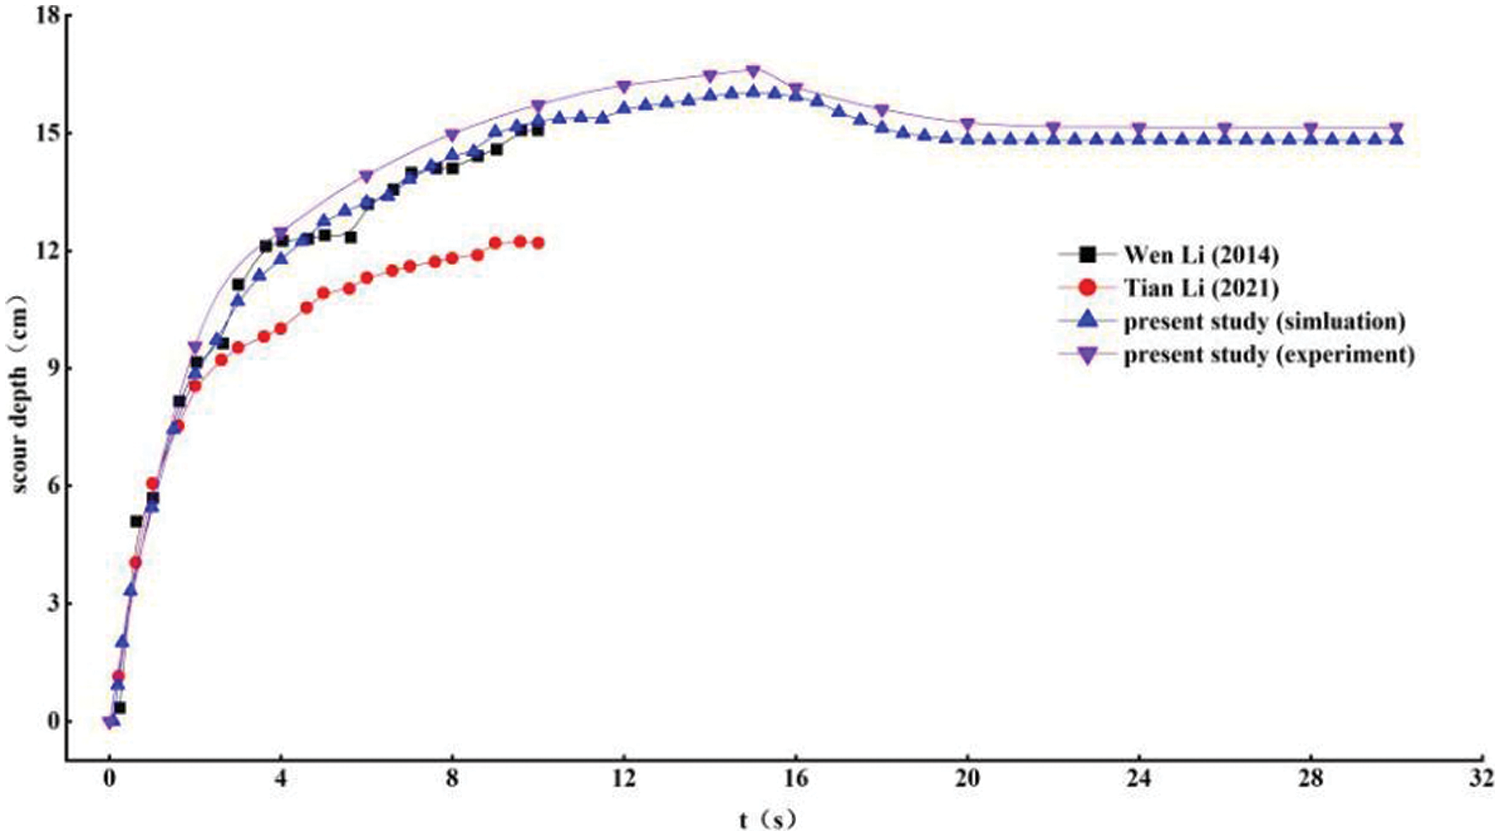
Figure 6: Variation trend of scour depth over time
Regarding dynamic scouring, the experimental results in this study exhibited a slight increase compared to Li Wen’s findings after 4 s of scouring. All simulation results accurately replicated the experimental process within the initial 0–3 s. However, the growth rate of the original model decreased beyond this point, ultimately reaching an asymptotic state after 5 s. This result significantly differed from the experimental findings. In contrast, the optimized simulation model achieved a high level of consistency with the experimental data, with an error of less than 5%. After 15 s of dynamic scouring, the static scouring phase commenced with the cessation of water supply. As a result of the settlement of suspended sediment, the maximum scour depth decreased. Furthermore, it was observed that static scouring reached equilibrium more rapidly than dynamic scouring. The simulated maximum scour depth was slightly lower than the experimental results, which could be attributed to the non-uniform porosity of the sand bed in the physical experiment, with slightly higher porosity near the sand-water interface [12]. Additionally, some details and small nonlinear phenomena in the experiment may have been overlooked or simplified.
Fig. 7 illustrates the trend of suspended sediment mass during static scouring. Following the initiation of static scouring, the suspended sediment mass rapidly decreased, while the packed sediment mass correspondingly increased. An asymptotic state was reached at approximately 20 s, with the total sediment mass remaining nearly constant, indicating that most of the suspended sediment settlement occurred during this stage. The minimal mass loss (<0.1%) further validated the accuracy and validity of this model.
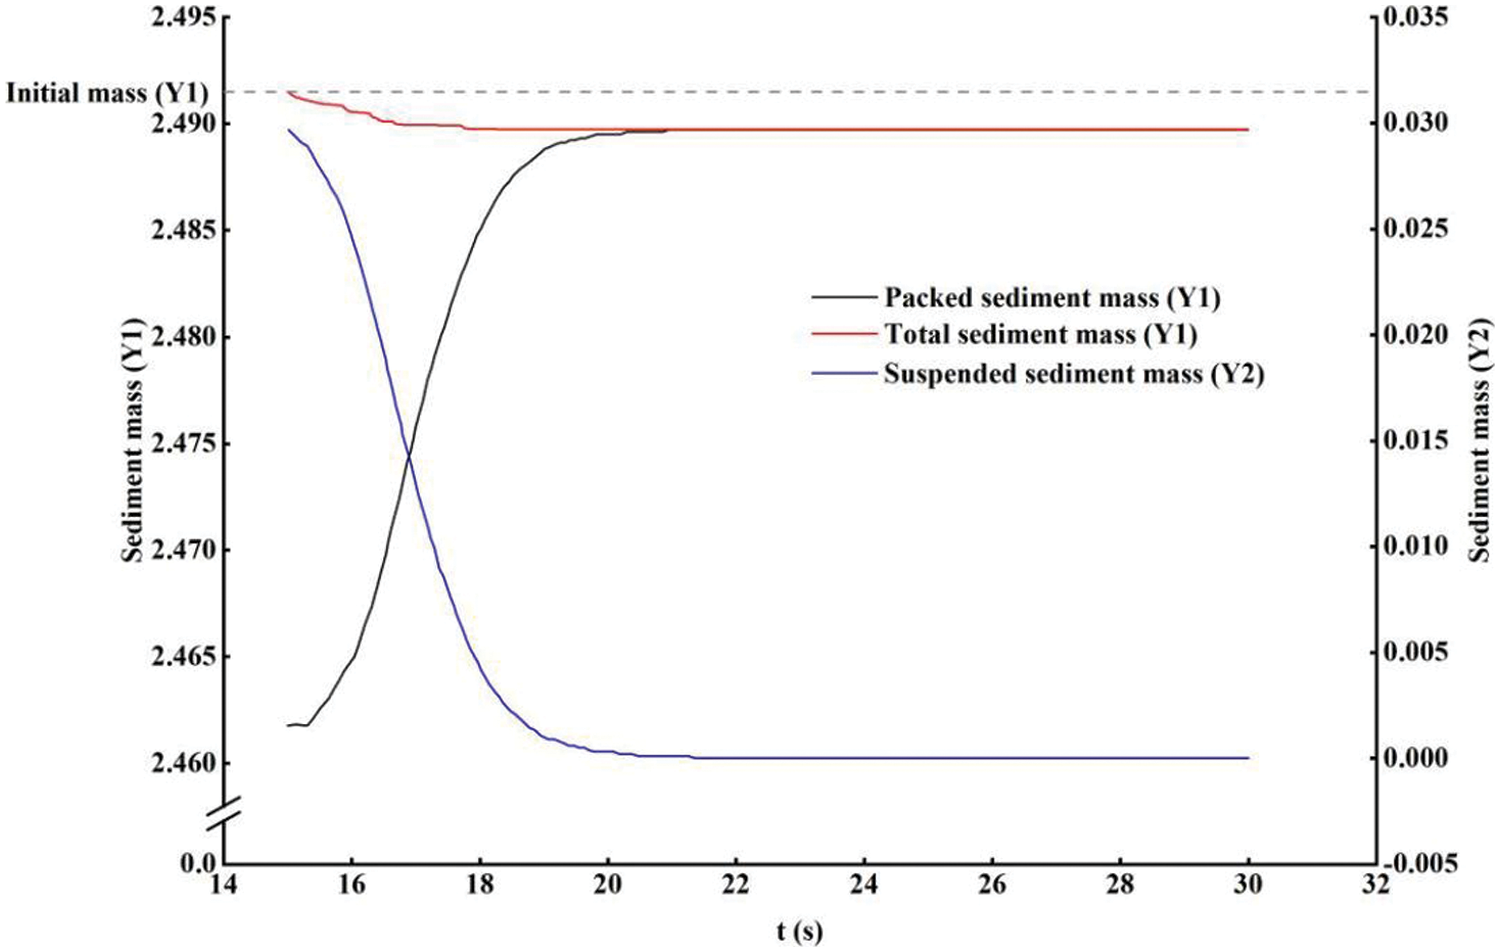
Figure 7: Variation trend of suspended sediment mass in static scouring
In conclusion, this study’s numerical method and optimized model have demonstrated feasibility and reliability in accurately reproducing the jet scouring process, closely aligning with the experimental trends. This model can provide valuable insights into the scouring process and facilitate relevant engineering design considerations.
4 Influence of Impinging Distance on Scouring
The erosion parameter
where,
4.1 Influence of Impinging Distance on Dynamic and Static Scouring Depth
Four experimental groups were designed to explore the overall trend of the impinging distance’s influence on scouring effects. The working conditions for each group are shown in Table 3, with the fourth group serving as a control group for data reliability validation, based on Rajaratnam’s physical experiments. Both dynamic and static scouring were conducted for 15 s each, and the scouring parameters at t = 15 s and t = 30 s were analyzed, corresponding to the end time of dynamic and static scouring, respectively. Fig. 8 illustrates the relationship between scouring depth and impinging distance for the four different working conditions.
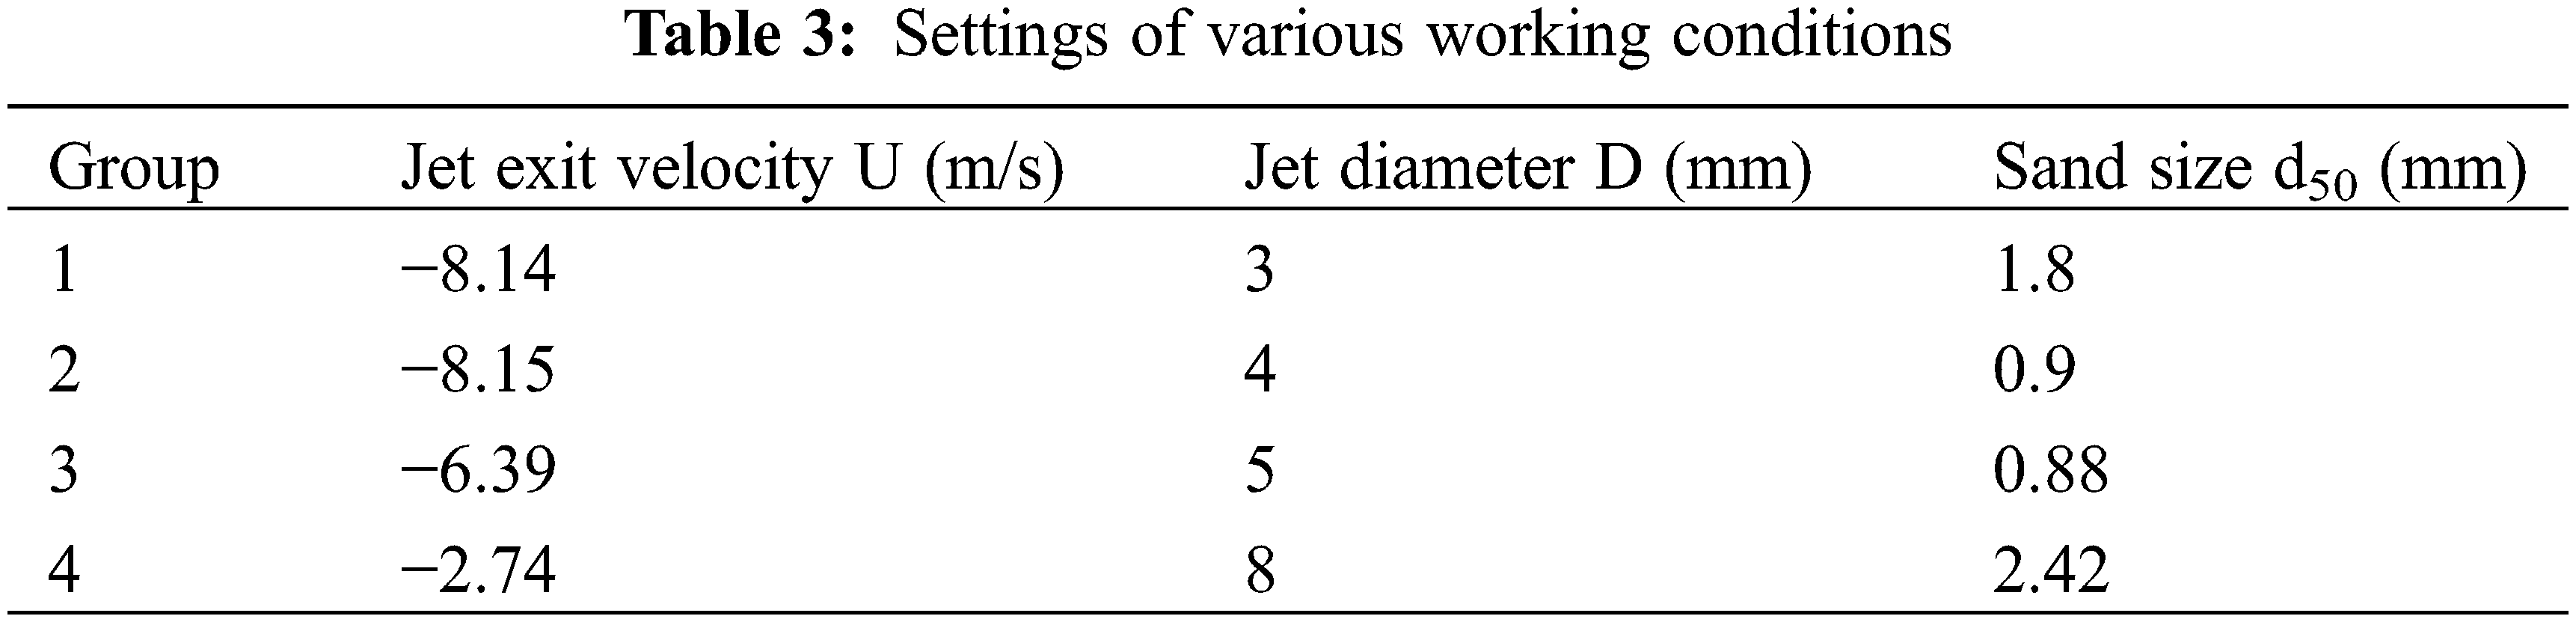
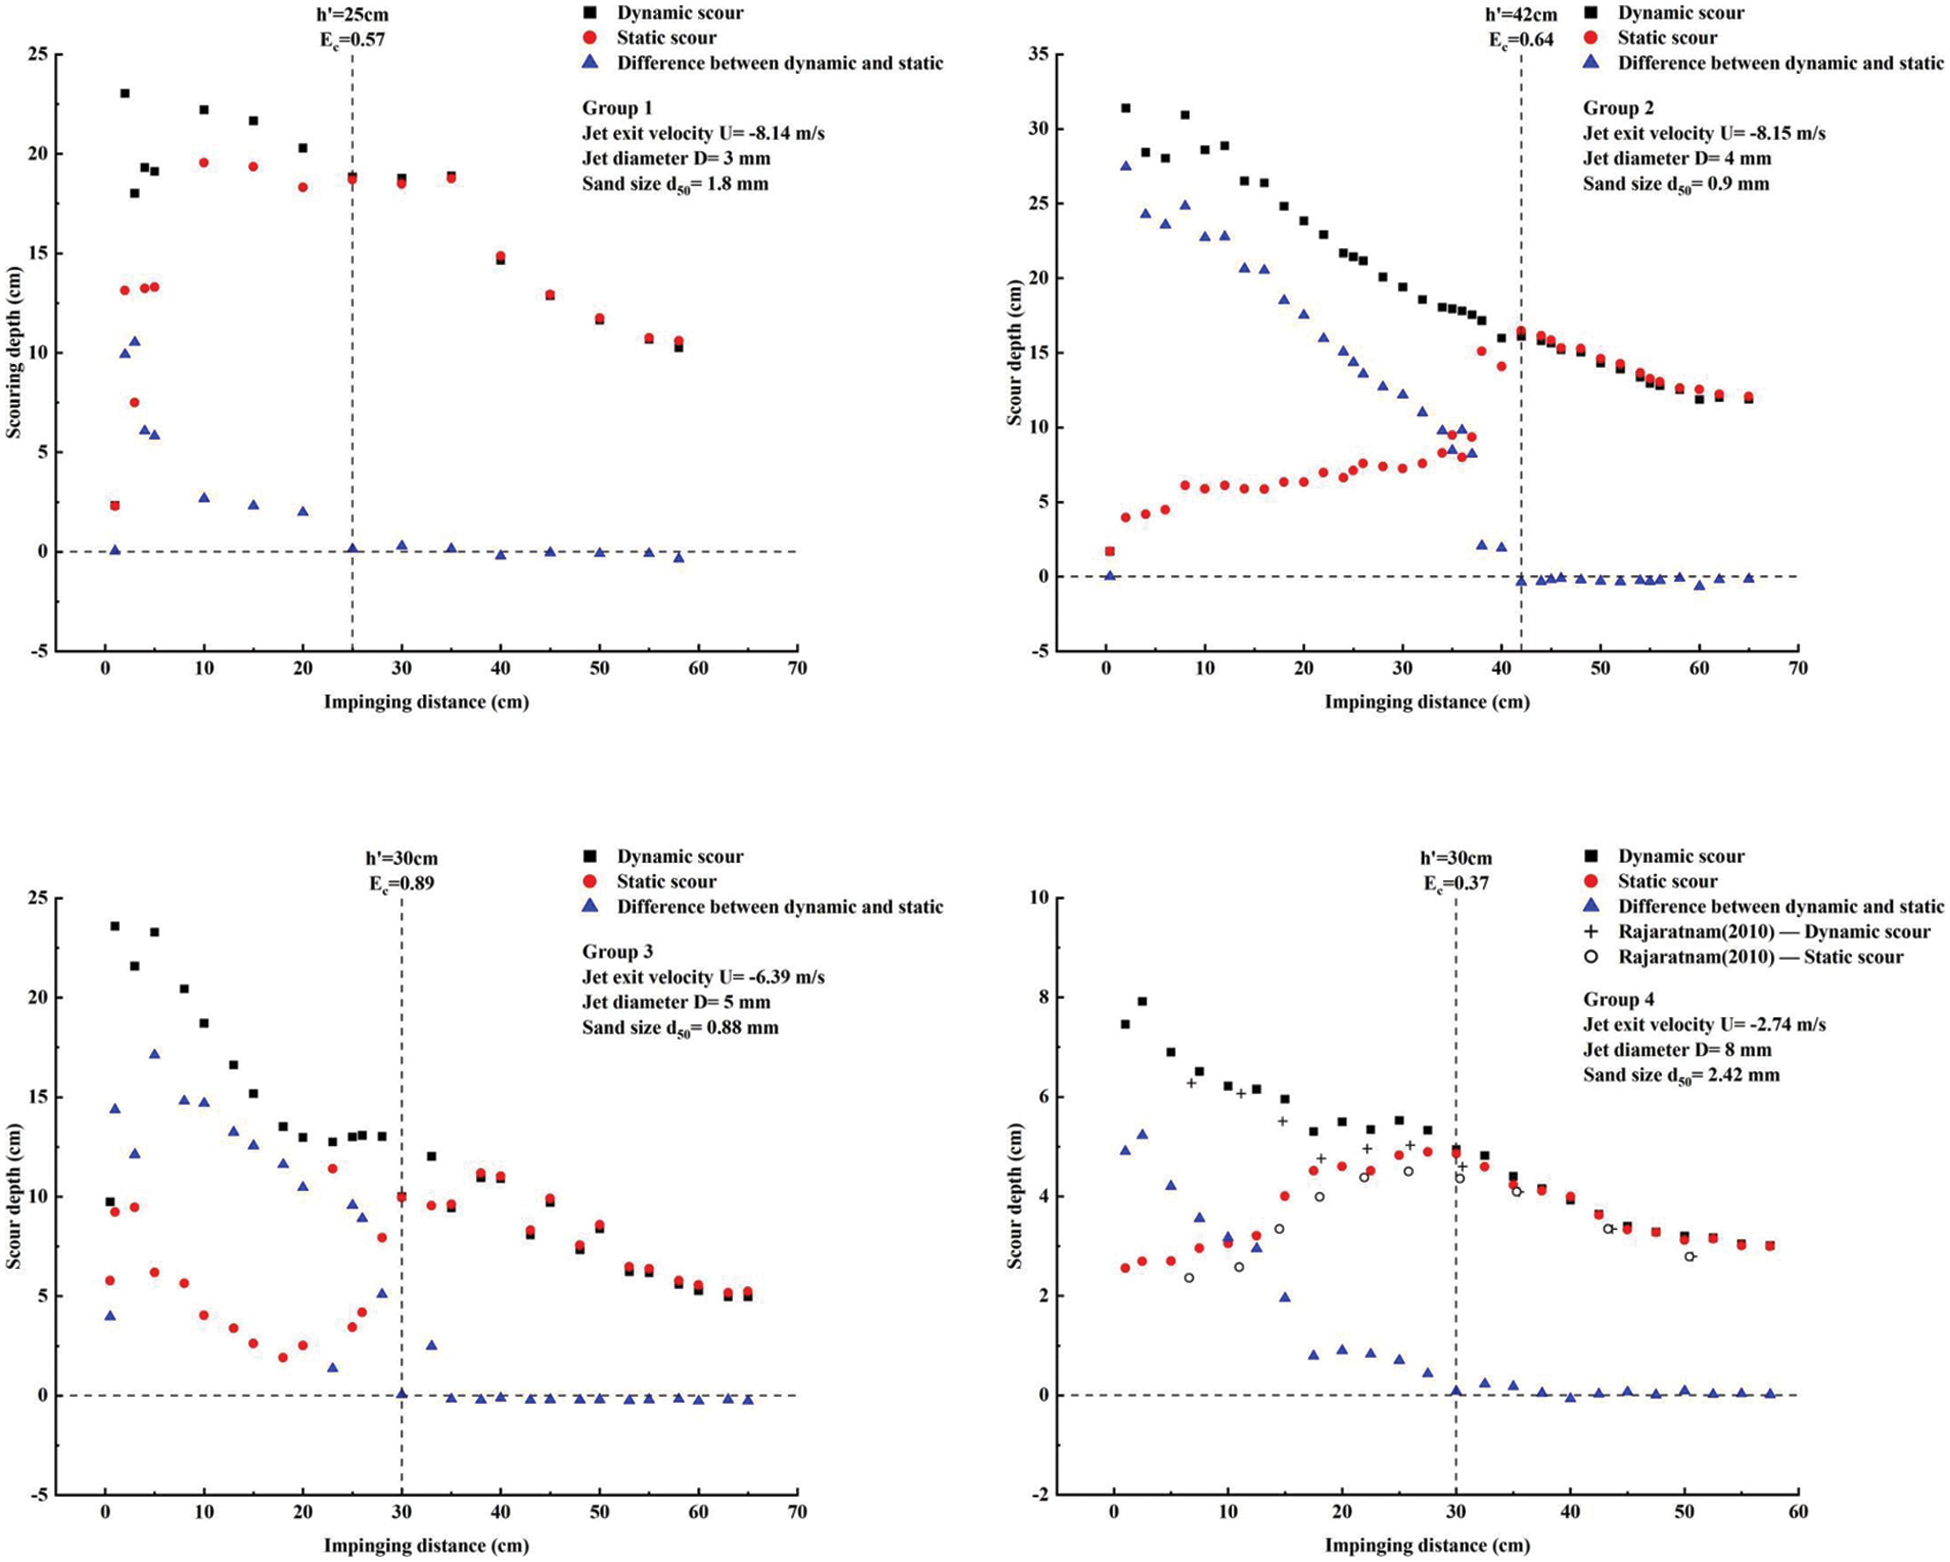
Figure 8: Variation trend of scour depth with impinging distance
Through analyzing the experimental data from the four groups, certain patterns were identified regarding scouring under different conditions. In both dynamic and static scouring modes, when the impinging distance was relatively small, there was an interval of fluctuation where the scour depth varied within a certain range, indicating an unstable scouring effect. This phenomenon was more prominent during static scouring. As the impinging distance gradually increased, the variation trend of scour depth became more regular, and the disparity between the dynamic and static scouring depths decreased. Each group had a critical impinging distance
4.2 Influence of Impinging Distance on Dynamic and Static Scouring Mass
The scour caused by the jet was an important parameter for quantifying scouring effects. In this study, the scour was evaluated by measuring the scour area. The scour profiles for each working condition were plotted using Origin software and the corresponding areas were integrated to determine the scour area, as shown in Fig. 9. The collected data from different working conditions were processed dimensionlessly to generate Fig. 10. On the horizontal axis, the non-dimensional impinging distance
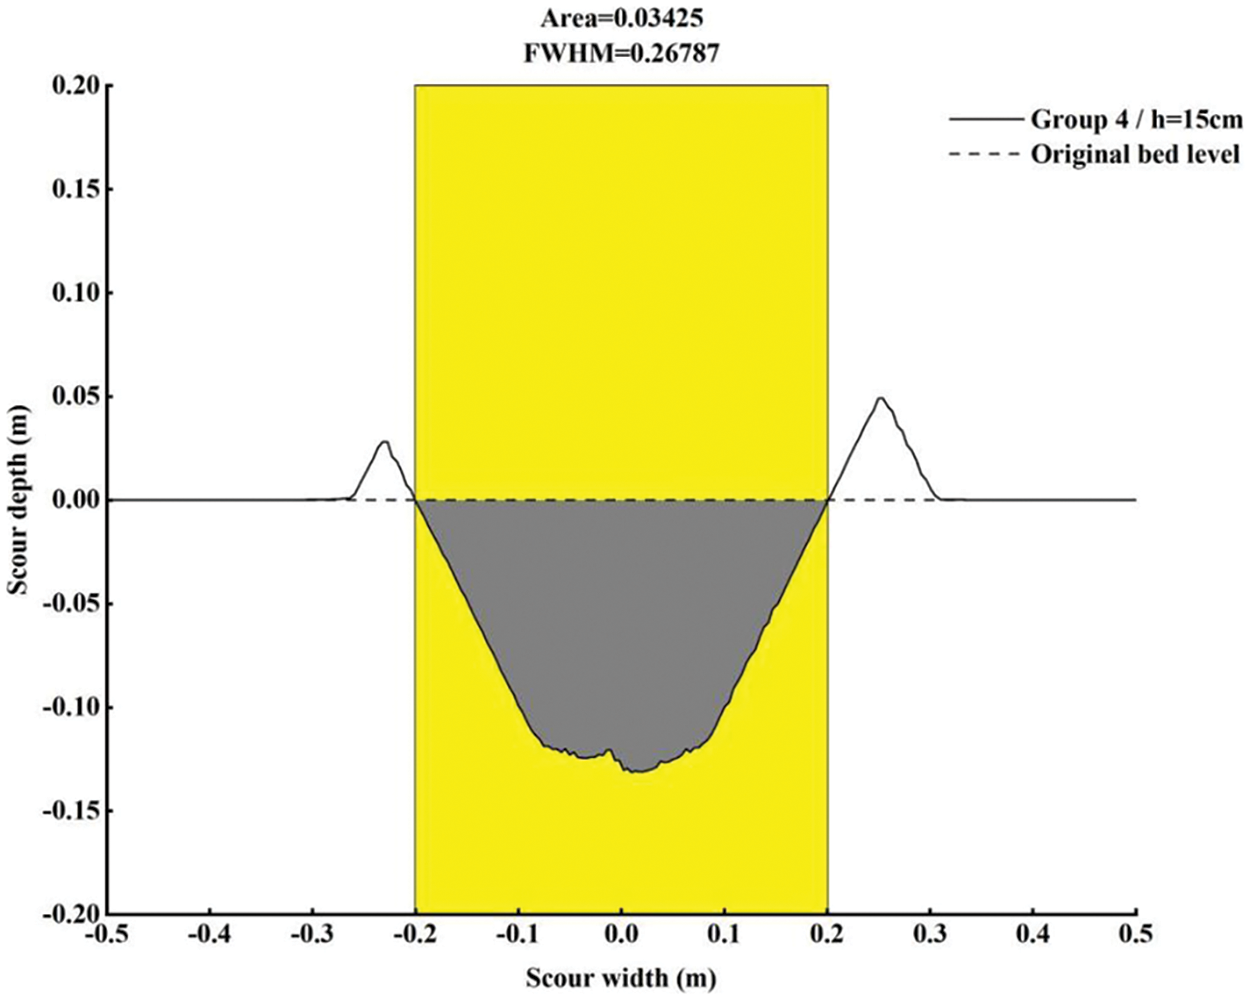
Figure 9: Calculation method of scouring area
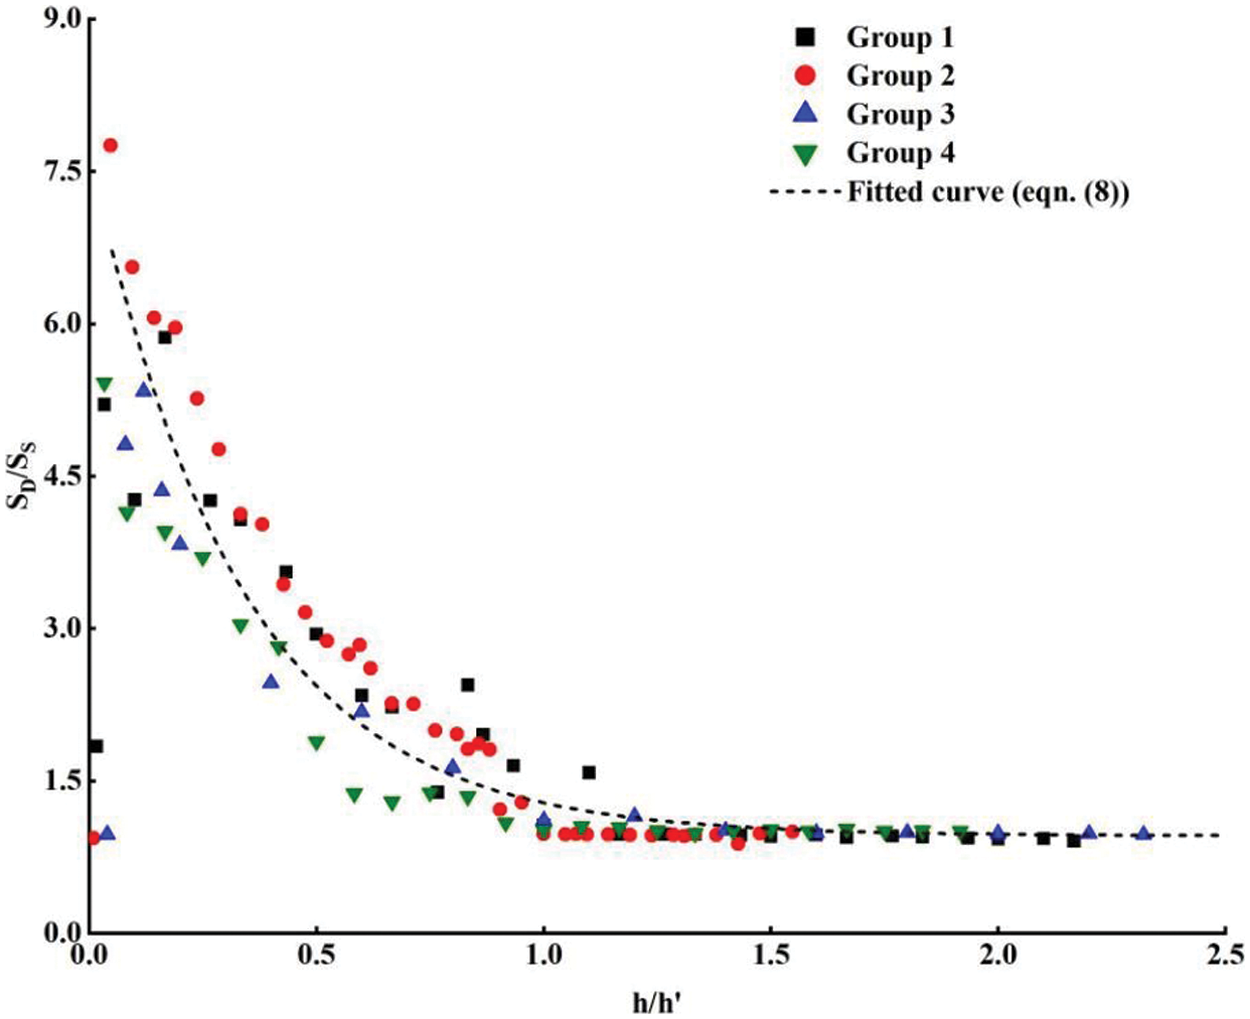
Figure 10: Variation trend of scouring area with impinging distance
Analysis of the experimental data revealed that, except for a few points with noticeable fluctuations (primarily at smaller impinging distances), most data points clustered around a curve that could be well described by Eq. (8). The ratio of scour area was negatively correlated with the impinging distance, which aligned with the difference between dynamic and static scour depth. As the impinging distance decreased, the disparity between dynamic and static scour became more significant, leading to an increased area ratio. Conversely, as the impinging distance increased, the differences diminished, and when
In practical engineering, the pre-excavation trench method [20] is commonly employed for pipeline installation. This method involves excavating a trench along the designated route or location before placing the pipeline into the pre-excavated trench. However, during the pipeline installation process, sediment suspended above the scour pit will settle due to gravity, resulting in a shallower trench depth than the intended design. Consequently, adjusting the impinging distance appropriately can help prevent unnecessary scouring. Additionally, timely removal of suspended sediment during channel excavation can significantly enhance scouring efficiency. This holds great importance in improving engineering quality and resource conservation.
4.3 Characteristics and Formation Analysis of Scour Profiles
In accordance with the
1. Scour with Smaller Impinging Distance
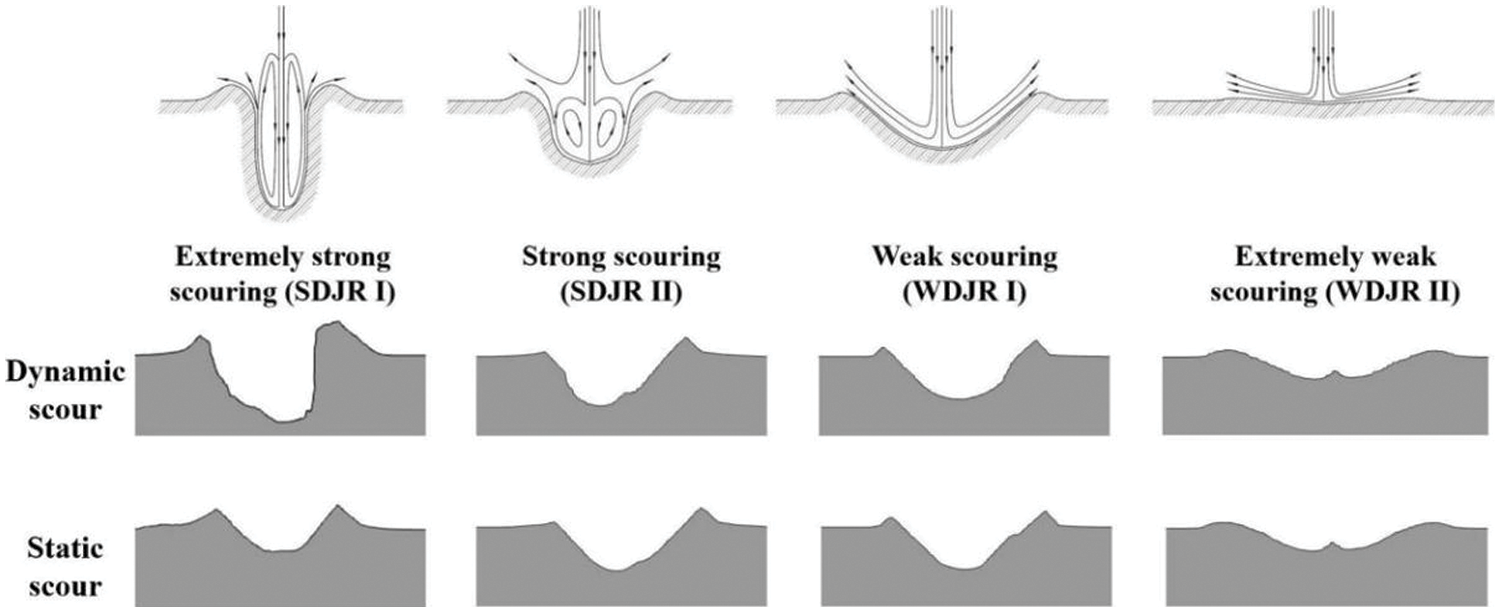
Figure 11: Classification of scour pit
Corresponding to extremely strong scour (SDJRI), when the impinging distance is small, the energy dissipated by the vertical jet before reaching the initial sand bed is minimal, resulting in a large velocity and a large starting stress on the sediment. This leads to a high rate of sediment removal, and rapid increase in scour depth. However, the excessive increase in depth leaves insufficient space for suspended sand to move to both sides, leading to vortex-induced turbulence that entrains a large amount of suspended sand onto the wall. The vertical jet is obstructed by the wall and vortices, causing it to tilt towards one side, resulting in an irregular and asymmetric pit wall, with a high degree of randomness. After scouring, the suspended sand affected by the vortices accumulated above the scour pit and sedimentation occurred due to gravity. The steep wall lost the confinement of the jet and began to collapse, resulting in a static scour depth that was much smaller than the dynamic scour depth.
2. Scour with Moderate Impinging Distance
Corresponding to strong scour (SDJRII) and weak scour (WDJRI), when the impinging distance is moderate, the branching effect of the jet can match the change in scour depth, and the large width of the scour pit allows sufficient space for suspended sand along the wall to move to both sides, forming a smooth and regular wall despite the presence of vortices, which are relatively weak. In this case, the dynamic scour depth was moderate, with a wide and relatively symmetrical pit wall that exhibited similarity in variation over time. The static scour profile also followed this pattern, with the scour depth depending on the concentration of suspended sand in the watershed at the end of dynamic scouring.
3. Scour with Larger Impinging Distance
Corresponding to extremely weak scour (WDJRII), when the impinging distance is larger than the critical impinging distance, causing the energy dissipation of the jet before reaching the sand bed to be large, resulting in a smaller depth of the pit form and less sediment being induced by the jet. Suspended sand settles quickly due to the lower concentration throughout the process. This explains why the dynamic and static scour depths were almost equal in this group. Scouring mainly caused the sand bed to become rugged in both directions instead of developing in the longitudinal direction. A stagnation point appeared in the center of the scour pit of this group.
4.4 Dimensionless Fitting of Scour Pit Profiles
By collecting the scour profile data of asymptotic state under different impinging distance conditions, and processing it dimensionless, it was found that the profile curve had a certain regularity. Taking the first group as an example (as shown in Fig. 12), the horizontal axis represents scour width (
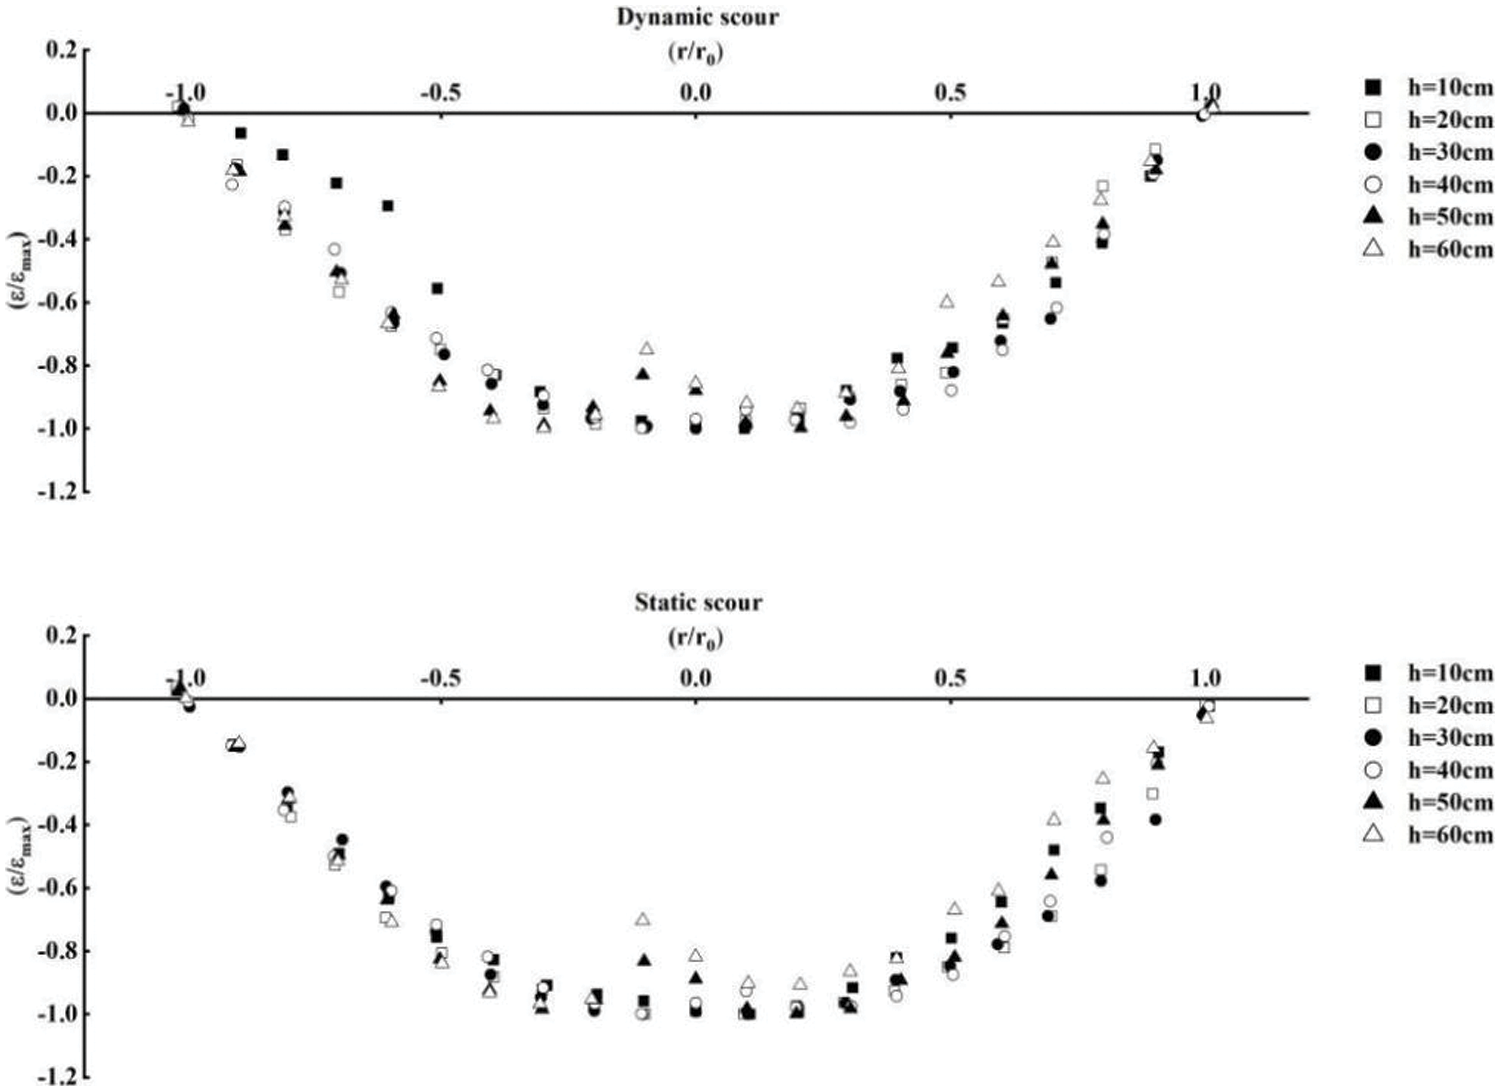
Figure 12: Non-dimensional curves of scour profile
For dynamic scouring, apart from some data, the non-dimensional curves of the scouring profile were mainly concentrated on one curve. It was observed that when the impinging distance was relatively small, the curve exhibited slight fluctuations on both sides, reflecting greater randomness and irregularity of the walls. With the increase of the impinging distance, the non-dimensional curves of each group almost coincided. At this point, the scouring was between strong scouring and weak scouring, and the walls were relatively flat and symmetrical. Although, it must be noted that the scouring profiles under various working conditions exhibited similarity. When the impinging distance was too large, stagnation points appeared in the scouring, and the curves on both sides also began to fluctuate.
Due to the influence of eddies, the suspended sand in the scour basin was not uniformly distributed above the scouring after the scouring ended, resulting in a certain randomness during sedimentation. Under the dual effect of the asymmetric scouring formed by the inclined jet and the randomness of the sand deposition, static scouring profiles exhibited greater fluctuations. This phenomenon was particularly evident when the impinging distance was relatively small. However, with the increase of the impinging distance, the non-dimensional curves of the static scouring profiles were still mainly concentrated on one curve. When the impinging distance was relatively large, the static and dynamic scouring profiles basically coincided, and the stagnation point at the center of the scouring remained after the static scouring ended.
In engineering project scouring operations, extremely strong or weak scouring is generally not present, and corresponding scouring profiles exhibit greater randomness, making quantitative calculations difficult. Therefore, only the non-dimensional data within the interval of
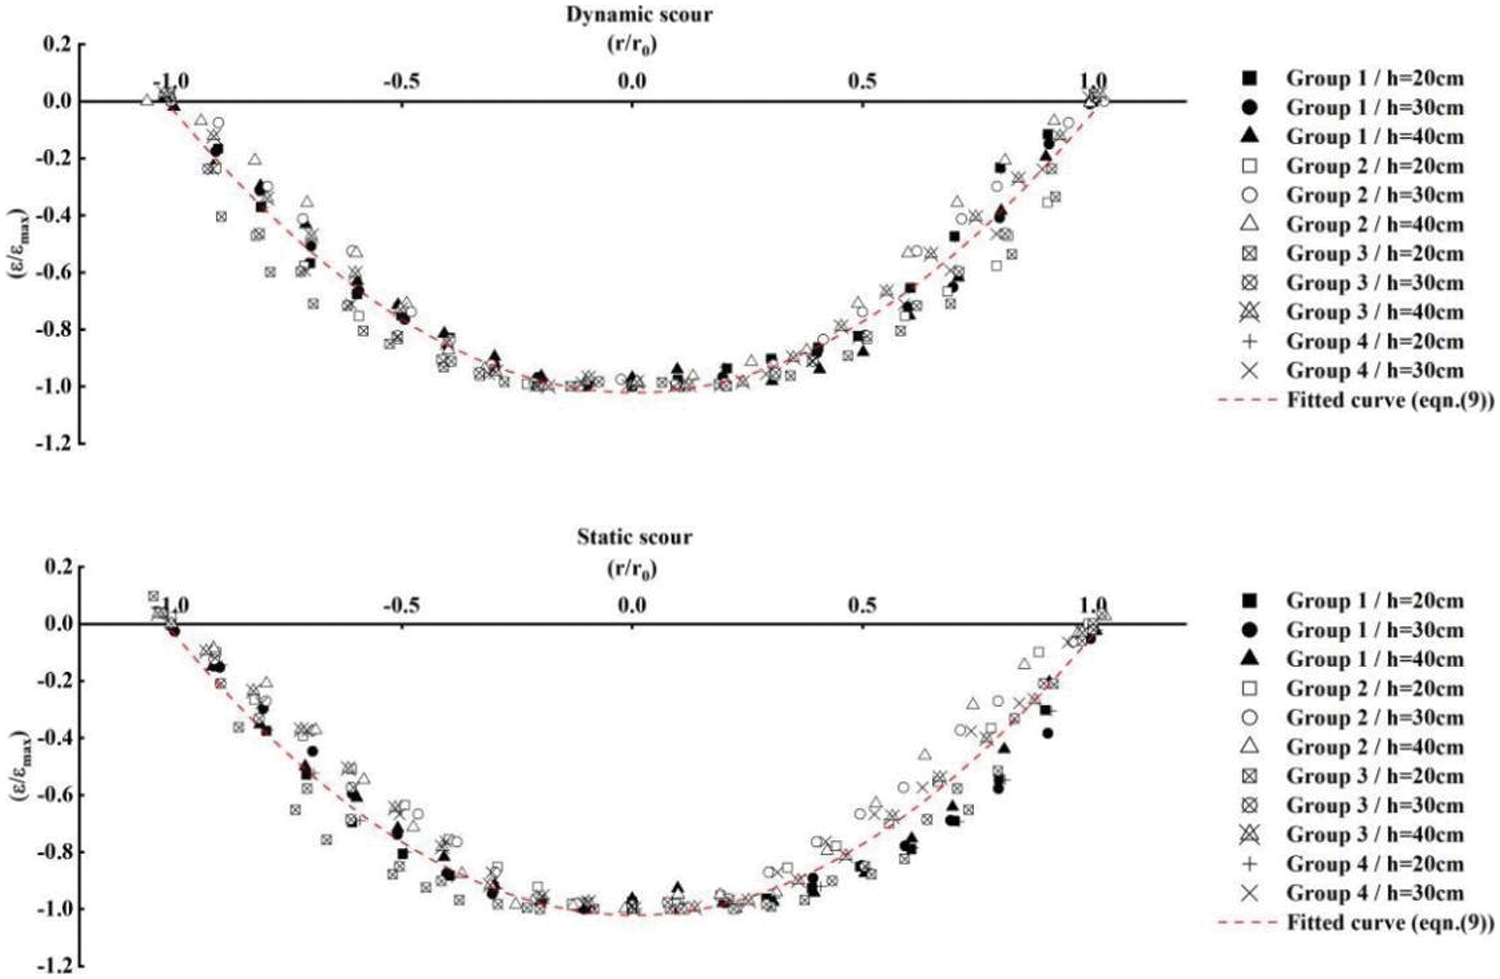
Figure 13: Non-dimensional curves and fitting results of moderate impinging distance scouring
It was observed that for operating conditions within the interval of
In this paper, investigated the effects of impinging distance on dynamic and static scour using FLOW-3D software. The simulation model was optimized and validated through physical experiments. By analyzing the simulation results from four sets of operating conditions, identified general trends in scour depth. Furthermore, examined variations in scour area to enhance our understanding of the scouring process. Combining experimental data with Rajaratnam’s classification of jet flows (the Strong Deflected and the Weakly Deflected Jet Regimes), categorized the scour phenomenon into three types and analyzed their formation mechanisms. Lastly, established an empirical formula to describe the overall profile of scour pits. These findings contribute to the field of water-jet scour research and offer valuable insights for submerged dredging operations.
(1) Water-jet scour in submerged conditions can be classified into dynamic and static scour. When the impinging distance is relatively small, notable differences in scour depth between these two types of scour are observed, predominantly due to particulate matter. In practical underwater dredging projects, timely sediment suction or the utilization of inclined jets and ocean currents can significantly enhance the scour effectiveness.
(2) The impinging distance exerts a significant influence on water-jet scour. The depth of dynamic scour decreases as the impinging distance increases, while the depth of static scour initially increases and then decreases. There exists a critical impinging distance, denoted as
(3) Water-jet scour with a moderate impinging distance exhibits a relatively flat profile surface and demonstrates high scour effectiveness. Eq. (9) accurately describes the dimensionless profile for various operating conditions during moderate impinging distance scouring, regardless of whether it is dynamic or static scour. This equation serves as a valuable reference for predicting the shape profile of pits in related engineering projects.
Acknowledgement: None.
Funding Statement: The paper was supported by the Research on the Prediction Mechanism of Corrosion for High Strength Steel in Deep Sea Service Driven by Multi-Scale, High-Dimension and Small-Sample Data (C2301002635), Research on the Influence of Nozzle Structure on the Scouring Effect of Submerged Water Jet (2023R411045), the Zhejiang Ocean University Outstanding Master’s Thesis Cultivation Project (ZJOUYJS20230018) and the Scientific Research Project of Zhejiang Graduate Education Society in 2022 (2022-021) which was gained by Chen.
Author Contributions: The authors confirm contribution to the paper as follows: study conception and design: Hao Chen, Xianbin Teng; data collection: Zhaohao Zhang; analysis and interpretation of results: Hao Chen, Zhibin Zhang, Faxin Zhu; draft manuscript preparation: Hao Chen. All authors reviewed the results and approved the final version of the manuscript.
Availability of Data and Materials: The simulation data used in this study were generated through specific software and algorithms to produce simulated results. As it was generated based on specific models and parameters, if there are any further inquiries regarding the data and materials, please contact us directly. We will make every effort to provide reasonable support and clarification. Thank you.
Conflicts of Interest: The authors declare that they have no conflicts of interest to report regarding the present study.
References
1. Rajaratnam, N., Mazurek, K. A. (2003). Erosion of sand by circular impinging water jets with small tailwater. Journal of Hydraulic Engineering, 129, 225–229. [Google Scholar]
2. O’Donoghue, T., Trajkovic, B., Piggins, J. (2001). Sand bed response to submerged water jet. The Eleventh International Offshore and Polar Engineering Conference, Stavanger, Norway. [Google Scholar]
3. Aderibigbe, O. O., Rajaratnam, N. (1996). Erosion of loose beds by submerged circular impinging vertical turbulent jets. Journal of Hydraulic Research, 34(1), 19–33. [Google Scholar]
4. Chakravarti, A., Jain, R. K., Kothyari, U. C. (2014). Scour under submerged circular vertical jets in cohesionless sediments. ISH Journal of Hydraulic Engineering, 20(1) 32–37. [Google Scholar]
5. Liu, C., Chen, Y. (2016). Numerical simulation of horizontal jet erosion of sediment based on flow-3D. Yangtze River, 47(6), 87–91. https://doi.org/10.16232/j.cnki.1001-4179.2016.06.019 [Google Scholar] [CrossRef]
6. Zhang, Z., Gong, Y., Zhang, L., Xv, M., Shang, G. (2022). Experimental study on the effect of the inclination angle on the scouring efficiency of submerged water jets. Fluid Dynamics & Materials Processing, 18(5), 1363–1371. https://doi.org/10.32604/fdmp.2022.019746 [Google Scholar] [CrossRef]
7. Zhang, Z., Gong, Y., Zhang, L., Xv, M., Shang, G. (2023). Simulation of seabed erosion produced by an inclined jet. Fluid Dynamics & Materials Processing, 19(3), 651–662. https://doi.org/10.32604/fdmp.2022.020936 [Google Scholar] [CrossRef]
8. Dai, B. L. (2016). Study on jet-assisted trenching arm and its erosion process for ROV type. Zhejiang University, China. [Google Scholar]
9. Mercier, F., Golay, F., Bonelli, S., Anselmet, F., Borghi, R. et al. (2014). 2D axisymmetrical numerical modelling of the erosion of a cohesive soil by a submerged turbulent impinging jet. European Journal of Mechanics-B/Fluids, 45, 36–50. [Google Scholar]
10. Yue, Z., Liu, Q., Huang, W., Hu, P., Cao, Z. (2020). A 2D well-balanced, coupled model of water flow, sediment transport, and bed evolution based on unstructured grids with efficient variable storage strategy. International Journal of Sediment Research, 36(1), 151–160. [Google Scholar]
11. Li, W., Ni, F., Wang, J. (2014). Numerical simulation of the effect of target distance on submerged jet scour of sand bed. Science Technology and Engineering, 14(29), 290–294. [Google Scholar]
12. Li, T. (2021). Numerical simulation study on the characteristics of underwater mixed flow nozzle jet erosion (Ph.D. Thesis). Xi’an University of Technology, China. [Google Scholar]
13. Meng, R. (2012). Experimental study and numerical simulation of submarine pipeline backfilling trench technique (Ph.D. Thesis). Tianjin University, China. [Google Scholar]
14. Mastbergen, D. R., van Den Berg, J. H. (2003). Breaching in fine sands and the generation of sustained turbidity currents in submarine canyons. Sedimentology, 50(4), 625–637. [Google Scholar]
15. Li, W., Xing, E., Li, S., Shen, X., Dong, D. et al. (2022). Numerical simulation technology research of vertical jet scouring based on flow-3D. Waterway and Harbor, 43(1), 29–34. [Google Scholar]
16. Ooterelee, C. W. (1997). A GMRES-based plane smoother in multigrid to solve 3D anisotropic fluid flow problems. Journal of Computational Physics, 130(1), 41–53. https://doi.org/10.1006/jcph.1996.5442 [Google Scholar] [CrossRef]
17. Wang, Y., Bao, Z., Wang, B. (2012). Numerical simulation of 3D water flow in an energy dissipation basin based on flow-3D software. Journal of Wuhan University (Engineering Edition), 45(4), 454–476. [Google Scholar]
18. Ji, R. (2017). Study on hydrodynamic oscillations between closely spaced floating structures with side-by-side arrangement (Master’s Thesis). Jiangsu University of Science and Technology, China. [Google Scholar]
19. Wang, Y., Bao, Z., Wang, B. (2018). Three-dimensional numerical simulation of flow in stilling basin based on flow-3D. Frontiers of Agricultural Science and Engineering, 5(2), 168–176. [Google Scholar]
20. Lin, R. (2019). Research and simulation analysis of jet trenching machine for submarine pipeline (Master’s Thesis). Harbin Engineering University, China. [Google Scholar]
Cite This Article
 Copyright © 2024 The Author(s). Published by Tech Science Press.
This work is licensed under a Creative Commons Attribution 4.0 International License , which permits unrestricted use, distribution, and reproduction in any medium, provided the original work is properly cited.
 Downloads
 Citation Tools