
 Submit a Paper
 Propose a Special lssue
 Open Access
ARTICLE

Simulation of Two-Phase Flowback Phenomena in Shale Gas Wells
Oil Gas Engineering Research Institute, PetroChina Jilin Oilfield, Songyuan, 138000, China
* Corresponding Author: Hui He. Email:
(This article belongs to the Special Issue: Solid, Fluid, and Thermal Dynamics in the Development of Unconventional Resources )
Fluid Dynamics & Materials Processing 2024, 20(2), 349-364. https://doi.org/10.32604/fdmp.2023.042659
Received 07 June 2023; Accepted 16 August 2023; Issue published 14 December 2023
 View Full Text
 Download PDF
Abstract
The gas-water two-phase flow occurring as a result of fracturing fluid flowback phenomena is known to impact significantly the productivity of shale gas well. In this work, this two-phase flow has been simulated in the framework of a hybrid approach partially relying on the embedded discrete fracture model (EDFM). This model assumes the region outside the stimulated reservoir volume (SRV) as a single-medium while the SRV region itself is described using a double-medium strategy which can account for the fluid exchange between the matrix and the micro-fractures. The shale gas adsorption, desorption, diffusion, gas slippage effect, fracture stress sensitivity, and capillary imbibition have been considered. The shale gas production, pore pressure distribution and water saturation distribution in the reservoir have been simulated. The influences of hydraulic fracture geometry and nonorthogonal hydraulic fractures on gas production have been determined and discussed accordingly. The simulation results show that the daily gas production has an upward and downward trend due to the presence of a large amount of fracturing fluid in the reservoir around the hydraulic fracture. The smaller the angle between the hydraulic fracture and the wellbore, the faster the daily production of shale gas wells decreases, and the lower the cumulative production. Nonplanar fractures can increase the control volume of hydraulic fractures and improve the production of shale gas wells.Keywords
Multi-stage hydraulic fracturing in horizontal well is a key technology for the effective stimulation of shale reservoirs [1,2]. Numerous scholars have established many simulation models to describe the fluid migration mechanism of shale gas and analyze the gas production and flowback of shale gas well after hydraulic fracturing [3,4]. However, most of the models only considered the single-phase flow of shale gas and ignored the impact of multi-phase fluid flow on flowback performance. The calculation results of these models have serious errors because the fracturing fluid invaded in the formation deeply impacts the gas flow in reservoirs. Most shale gas wells have a long water production period, and the simulation model considering gas water two-phase seepage can more accurately describe the flowback performance [5,6]. The SRV area formed by hydraulic fracturing has high water saturation and can influence the flowback performance in shale gas wells [7]. Therefore, the impact of fracturing fluid invasion and high-water saturation of SRV area on gas-water two-phase flow should be considered in the shale gas flowback model.
Current research mainly simulated gas-liquid two-phase flow of shale gas through software or numerical simulation methods to describe flowback and production period [8]. The impact of geological and engineering factors on flowback was analyzed [9,10]. The important influence of geomechanics on hydraulic fracture propagation has been confirmed [11], and geomechanics also impacts the flowback process of shale gas wells. Williams-Kovacs et al. [12] proposed a method for simulating gas-liquid two-phase backflow based on the analytical model presented by Clarkson et al. [13] and modified by Williams-Kovacs et al. [14]. And the research of Ezulike et al. showed that the changes in fracture water saturation can impact the flowback performance [15]. Guo et al. [16] developed a model that fully coupled reservoir fluid flow and geomechanics to analyze production performance. The hydraulic fracture is a key factor impacting flowback performance [17]. Fracture geometries can deeply impact the backflow behavior of unconventional gas reservoirs. The influence of various fracture geometries on the backflow profiles was discussed in the research of Liu et al. [18]. Shale has a high clay content, which is considered one of the reasons for the low flowback rate [19]. Xie et al. [20] established the mathematical model of gas water two-phase flow in multi-stage fracturing horizontal wells of shale gas and analyzed shale gas well flowback. The Boltzmann method and embedded discrete fracture model (EDFM) were employed to simulate the coupled imbibition-flowback behavior [21]. The wettability, flowback pressure difference, and pore structure significantly influence the flowback behavior, while the fracturing fluid viscosity has a smaller effect on the flowback process. Zou et al. [22] indicated that the final flowback efficiency of fracturing fluid is positively related to the fracturing fluid concentration and gas drive differential pressure. The backflow pressure gradient influences the retention of fracturing fluid in shale reservoirs and impacts the flowback performance.
Shut-in period of the shale gas well makes the fracturing fluid invades into the SRV obviously, which creates a larger high-water saturation zone than the fracturing period [23,24]. Because the shut-in time often lasts for several days, which is significantly longer than the fracturing construction time. Ghanbari et al. [25] showed that an extended shut-in period increases early-time gas production by interpreting on-field data and numerical simulations. Makhanov et al. [26] discussed the impact of shut-in on fluid flow and production of shale gas well. Wijaya et al. [23] illustrated that shut-in can obviously change the water saturation in the shale reservoir. The impact of shut-in on shale gas well production has been confirmed by many studies, and the invasion of fracturing fluid during shut-in is the key factor [27]. Therefore, the characteristics of high-water saturation in SRV should be considered in the study of shale gas well flowback. Otherwise, there will be significant errors in the simulation results.
Stalgorova et al. [28] believed that shale reservoirs can be divided into three zones after fracturing: unstimulated zones, SRV zones, and artificial main fractures. Adefidipe et al. [29] established a gas-water two-phase flow model for horizontal wells in shale reservoirs, believing that water is only distributed in artificial main fractures. However, in the hydraulic fracturing process, there is an intrusion zone around the artificial fractures due to the leak-off. Alkouh et al. [30] analyzed the relationship between flowback performance of shale gas wells and SRV based on flowback and production data. Cao et al. [31] considered the invasion zone of fracturing fluid around the fracture in the model and obtained the reservoir pressure distribution and water saturation distribution in the reservoir. Yu et al. [32] established a gas-water two-phase seepage model and analyzed the production and flowback performance under complex fracture morphology. However, the impact of capillary pressure and the SRV formed by fracturing on gas and water production were not considered. Yan et al. [33] developed a fully coupled flow model considering the impact of reservoir pressure drops and matrix deformation on production and flowback process. The above research considered the high-water saturation characteristics in the SRV area and improved the research on gas-liquid two-phase flowback behavior of shale gas wells. However, the gas-liquid two-phase flow in shale gas wells is complex and impacted by various mechanisms. The above research is not comprehensive yet.
In this paper, the productivity model of gas water two-phase shale gas wells is established based on EDFM and the hybrid model. The high-water saturation in the SRV was considered to adapt to the actual situation. The shale gas adsorption, desorption, diffusion, gas slippage effect, fracture stress sensitivity, and capillary imbibition were considered in the model. The impact of fracturing fluid invasion on production capacity in the SRV area was considered. The influences of hydraulic fracture geometry and nonorthogonal hydraulic fractures on gas production were discussed.
2.1 Fluid Flow Model in Hydraulic Fractures
The flow in hydraulic fractures is one-dimensional in a two-dimensional reservoir model. The capillary pressure in hydraulic fractures is ignored because of the large aperture and high permeability of hydraulic fractures. Therefore, the mass conservation equation of phase i for hydraulic fracture can be described by
where
In this work, the double-medium model was used to describe the flow of matrix and micro-fracture in SRV. There is a fluid exchange between micro-fracture and hydraulic fracture. The capillary pressure of micro-fracture cannot be ignored due to the small aperture of micro-fracture. And the mass conservation equation for hydraulic fracture can be described by
where
2.3 Fluid Flow Model in Matrix
Micro-nanopores are the main path for shale gas flow in matrix. These types of pores often have extremely high capillary pressure. And the flow of the water phase in the matrix can be described by
where
where
2.4 Embedded Discrete Fracture Model (EDFM)
The EDFM is a widely used method for describing the flow of fractures in reservoir numerical simulation, which can embed fractures without changing the reservoir grid. The advantage of this method is its speed and efficiency. In this work, the fluid flow in the hydraulic fracture and the fluid exchange between hydraulic fracture and micro-fracture are described by EDFM. Hydraulic fracture is composed of fracture segments cut by the reservoir grid [34]. The fluid exchange term between hydraulic fractures and natural fractures can be described using EDFM as
where
where V is the volume of micro-fracture grid which is intersected by the hydraulic fracture segment, m3; x is the distance from any point within the micro-fracture cell to the hydraulic fracture plane, m.
2.5 Gas Slippage and Diffusion Effect
The pore diameter of the shale reservoir matrix is at the nanoscale, and the flow mechanism of gas in the nanoscale pores is mainly characterized by gas detachment and Knudsen diffusion. Therefore, the Darcy’s law applicable to conventional reservoirs is no longer applicable to shale reservoirs, and its permeability must be corrected. In this paper, the apparent permeability model of ideal gas suitable for various flow states established by Beskok et al. [35] is used.
where Kmg is the permeability of the gas phase in matrix, mD; Km0 is the absolute permeability of the shale matrix, mD; Pmg is the pressure of the gas phase in the matrix, MPa; a is dilution coefficient, dimensionless; b is the slip coefficient, dimensionless; Dk is Knudsen diffusion coefficient, m2/s; The Knudsen diffusion is mainly related to the pore radius of shale matrix, and Civan defined the Knudsen diffusion coefficient as [36]
where rm is the pore radius of the shale matrix, m; Z is the gas compressibility factor, dimensionless; R is gas universal constant, J/(kmol·K); T is the temperature of the reservoir, K; Mg is the gas molar mass, kg/mol.
In high-pressure environments, a portion of the gas will adsorb on the pores of the shale matrix, indicating that this is called adsorbed gas. Under reservoir conditions, the pore surface of the shale matrix stores 20% to 80% of the total reserves of adsorbed gas. Experiments have shown that the distribution of adsorbed gas meets Langmuir’s isothermal adsorption law, and desorption occurs when the pressure decreases. Therefore, the gas volume of desorption during the production period can be described as
where
In the original formation, the pore pressure is balanced with the overlying rock pressure, and the pore structure is also in a stable state. The pressure balance of the reservoir is destroyed with shale gas production and fracturing fluid flowback, and pore pressure drops, and pore and fracture structures change. Therefore, an exponential stress sensitivity formula is introduced to describe the permeability of fracture systems.
where
In this paper, capillary pressure in hydraulic fractures can be ignored due to the high permeability of hydraulic fractures. However, the pore size of micro-fractures and matrix systems is small, and they often have strong capillary pressure, so the capillary pressure in micro-fractures and matrix cannot be ignored. For situations where the aperture is relatively stable, capillary pressure is a function of water saturation. In the numerical simulation, capillary pressure at different times is obtained by interpolating the capillary pressure curve with water saturation. The relationship between gas phase pressure and water phase pressure in matrix and micro-fracture systems can be described as
where Pfc is the capillary pressure of micro-fractures, MPa; Pfg is the pressure of gas phase in micro-fractures, MPa; Pfw is the pressure of water phase in micro-fractures, MPa; Sfw is the water saturation in micro-fracture system; Pmc is the capillary pressure of matrix, MPa; Pmg is the pressure of gas phase in matrix, MPa; Pmw is the pressure of water phase in matrix, MPa; Smw is the water saturation in the matrix.
In this paper, a hybrid model is used to distinguish between fractured and unmodified areas in shale reservoirs. The model size of the shale reservoir is 200 m × 350 m. The model size of SRV area is 150 m × 250 m. The horizontal wellbore passes horizontally through the middle of the model. Hydraulic fracturing has formed four hydraulic fractures perpendicular to the wellbore. The half-length of hydraulic fractures is set to 120 m. The parameters in Table 1 are all from shale gas in Sichuan Province, China.
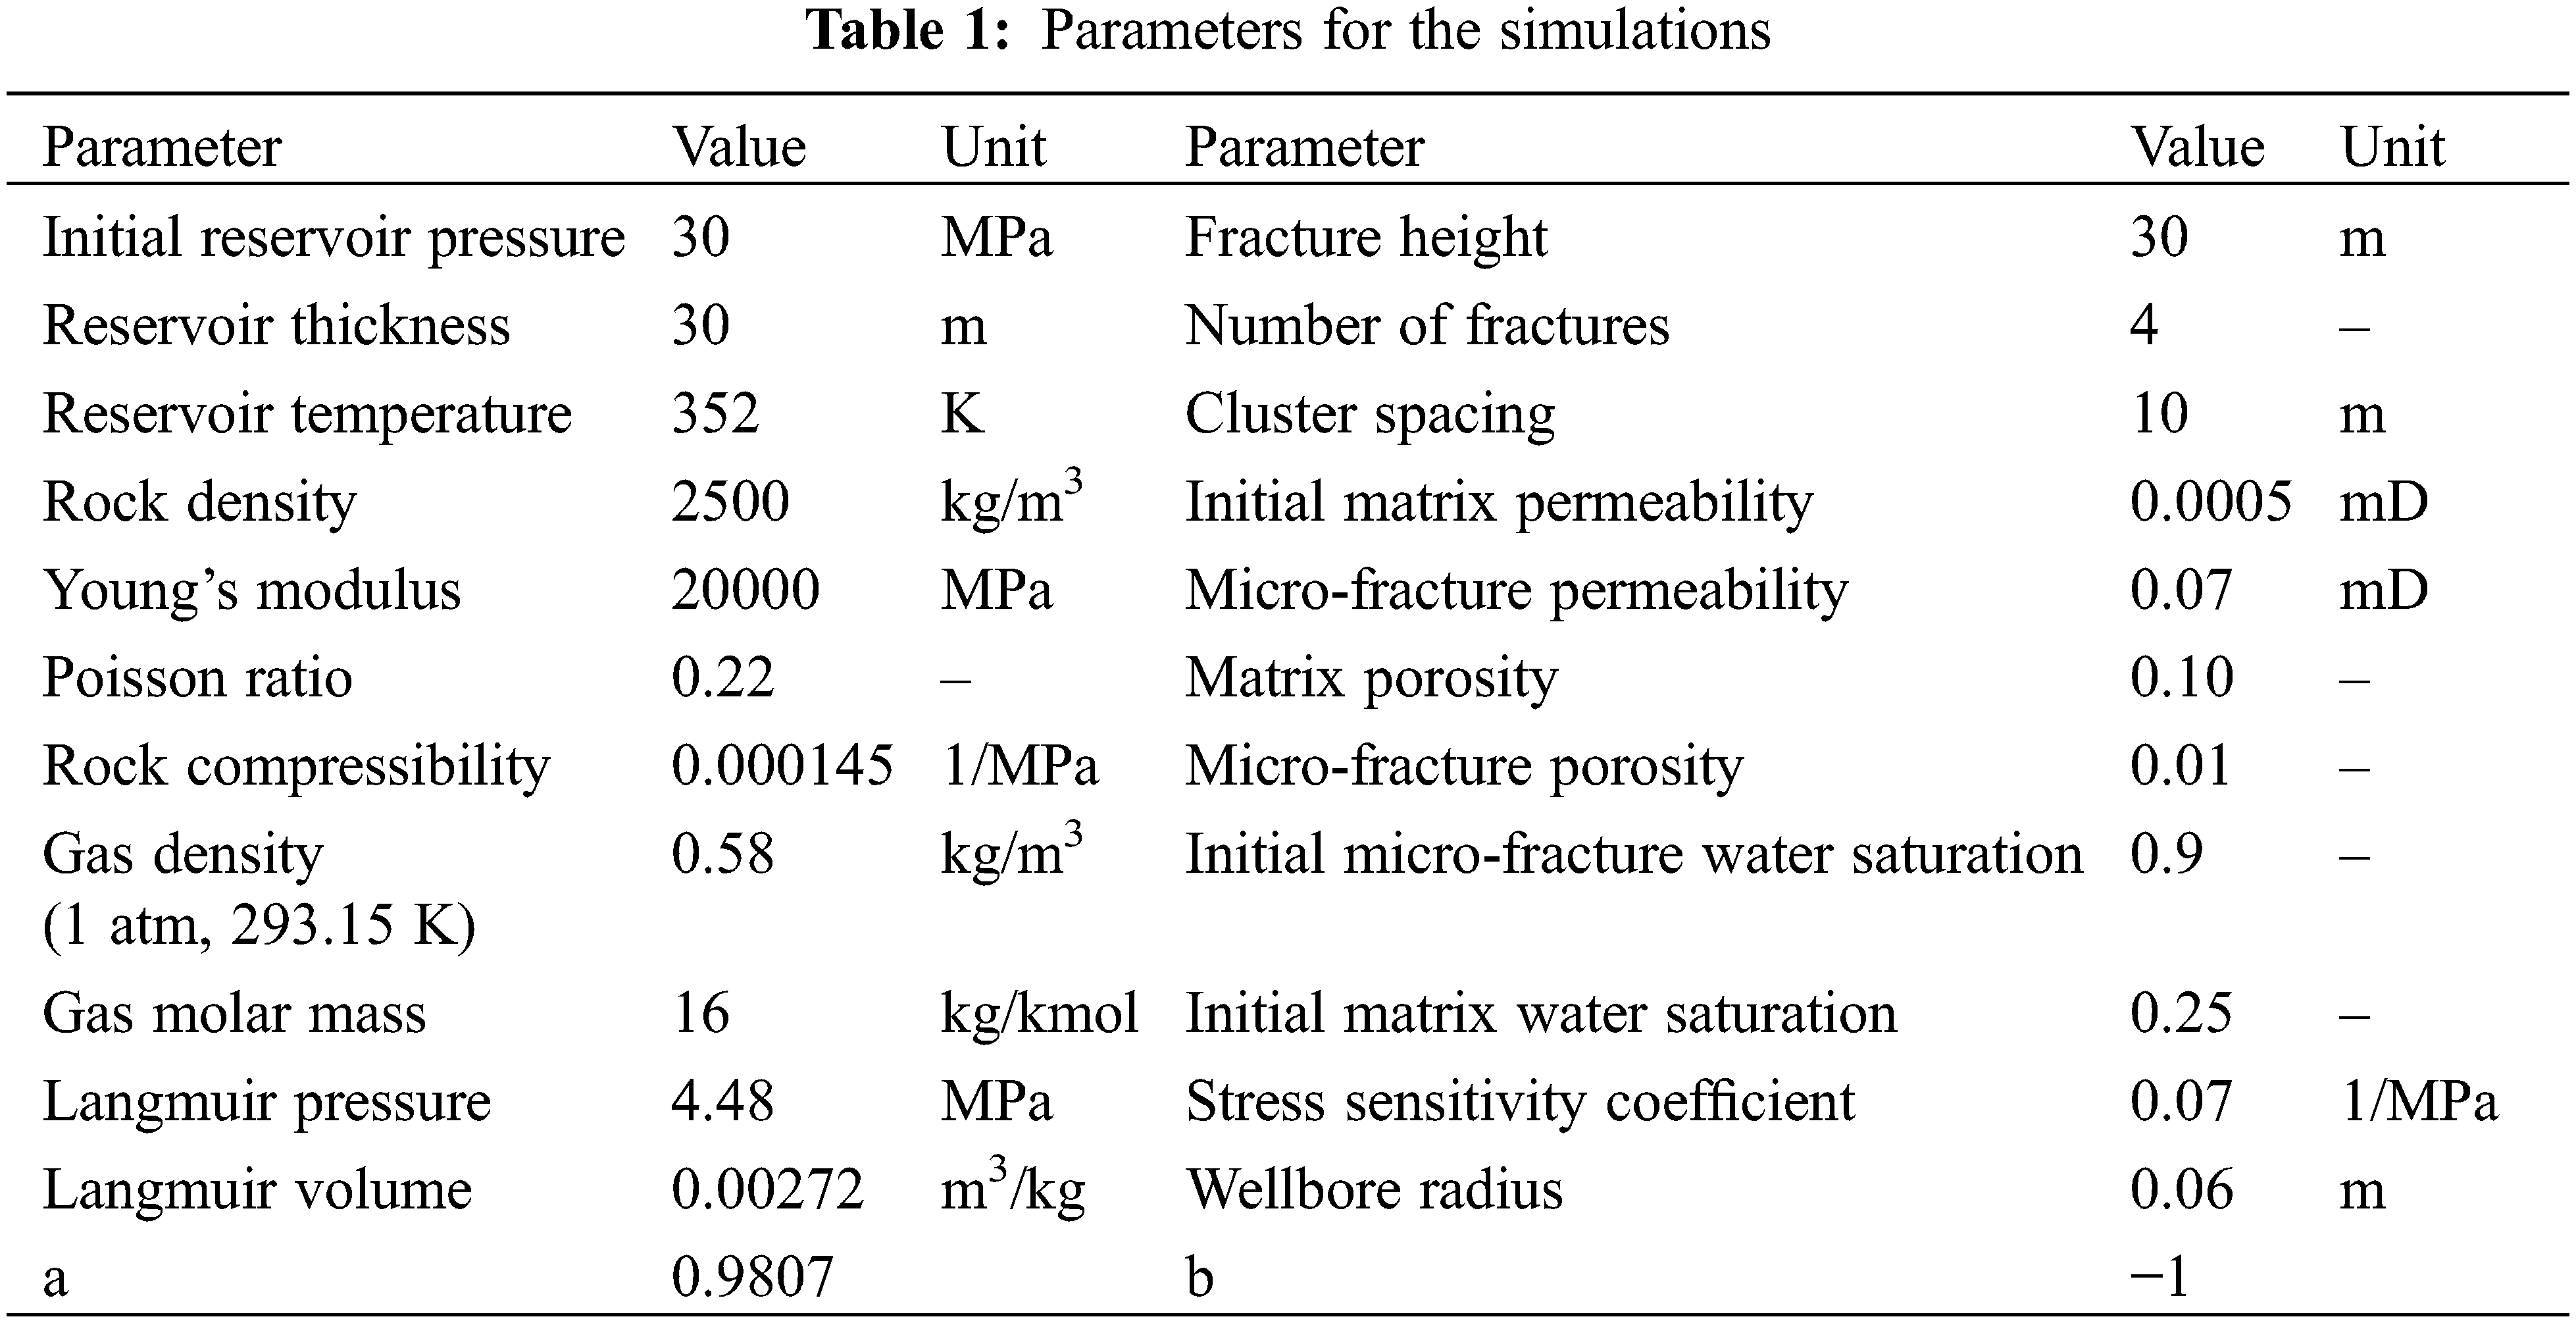
The relative permeability of matrix, micro-fracture system, and hydraulic fracture are shown in Fig. 1. The relative permeability of the hydraulic fracture system changes linearly. The capillary pressure corresponding to different water saturation in the shale matrix is shown in Fig. 2. The capillary pressure corresponding to different water saturation of the microfracture system in the fracturing renovation area is shown in Fig. 3. The capillary pressure gradually decreases with the increase of water saturation. And the decrease rate of capillary pressure is low when the water saturation is greater than 0.4. The capillary pressure in the matrix is obviously higher than that in micro-fracture because the pores in the matrix are generally at the micro-nano scale.
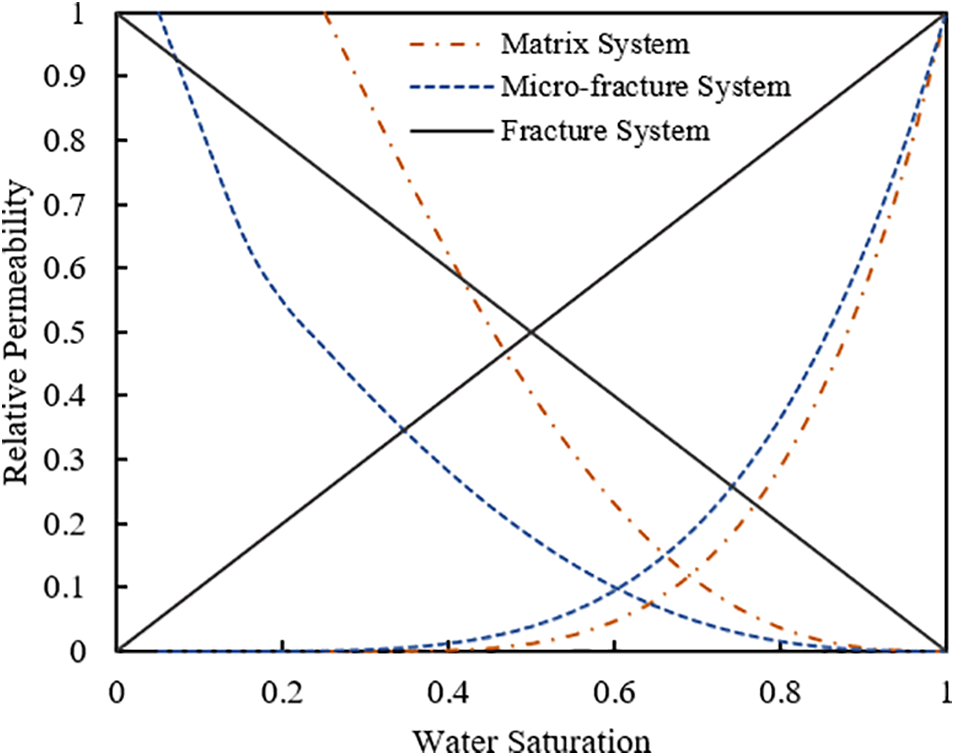
Figure 1: Relative permeability curves
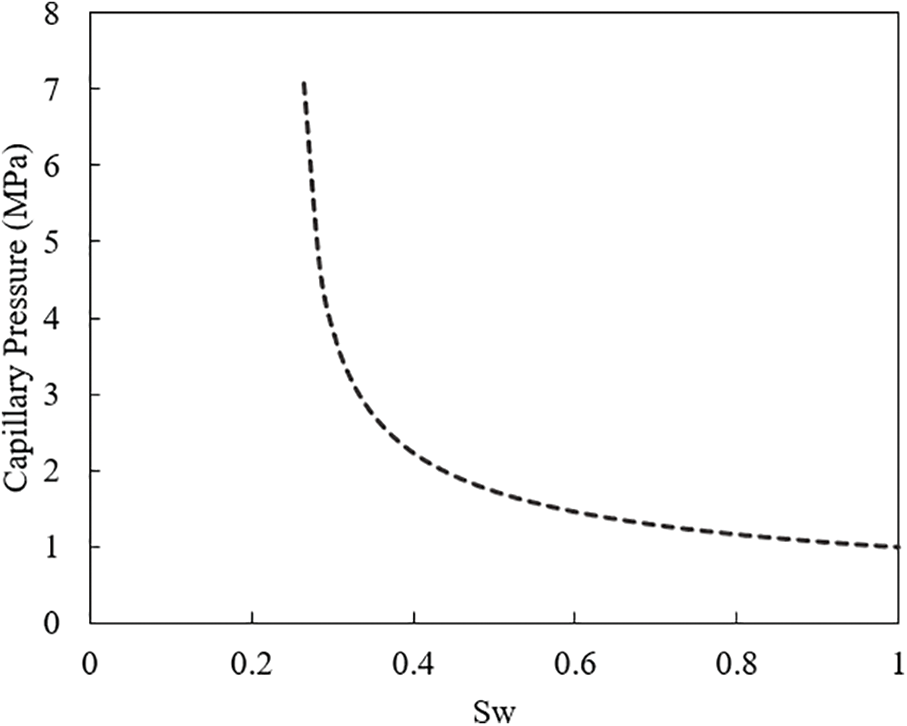
Figure 2: Capillary pressure in matrix
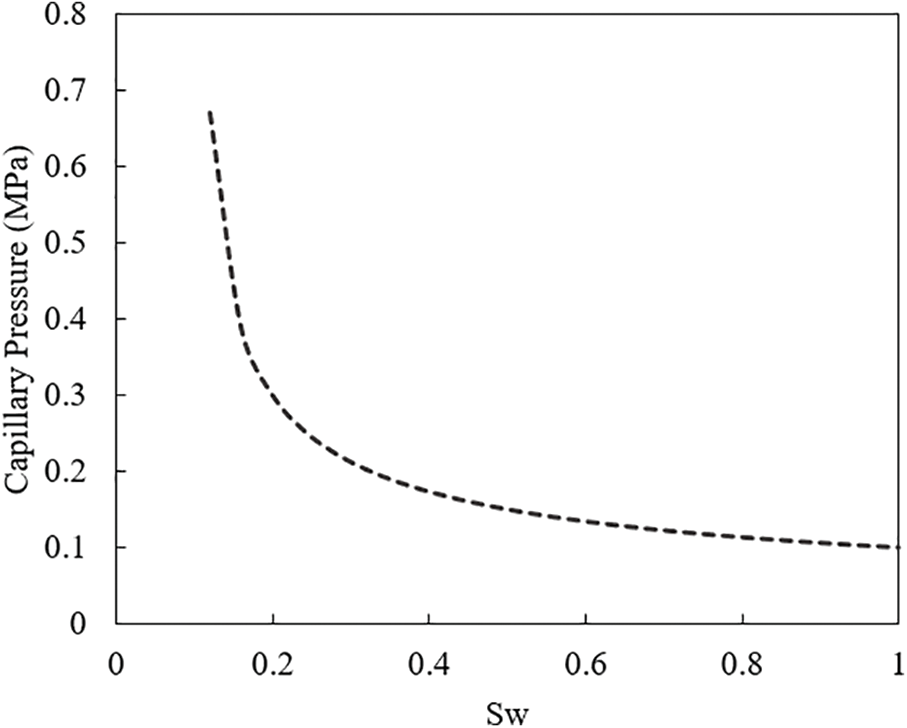
Figure 3: Capillary pressure in the micro-fracture system
According to the parameters in Table 1, the cumulative gas production of shale gas wells can be simulated. Fig. 4 shows the actual cumulative gas production and simulation results of shale gas wells. By comparing the simulation results with actual production data, it can be seen that the simulation results of the model in this paper can fit well with the actual production data. The comparison results verify the accuracy of the model in this paper.
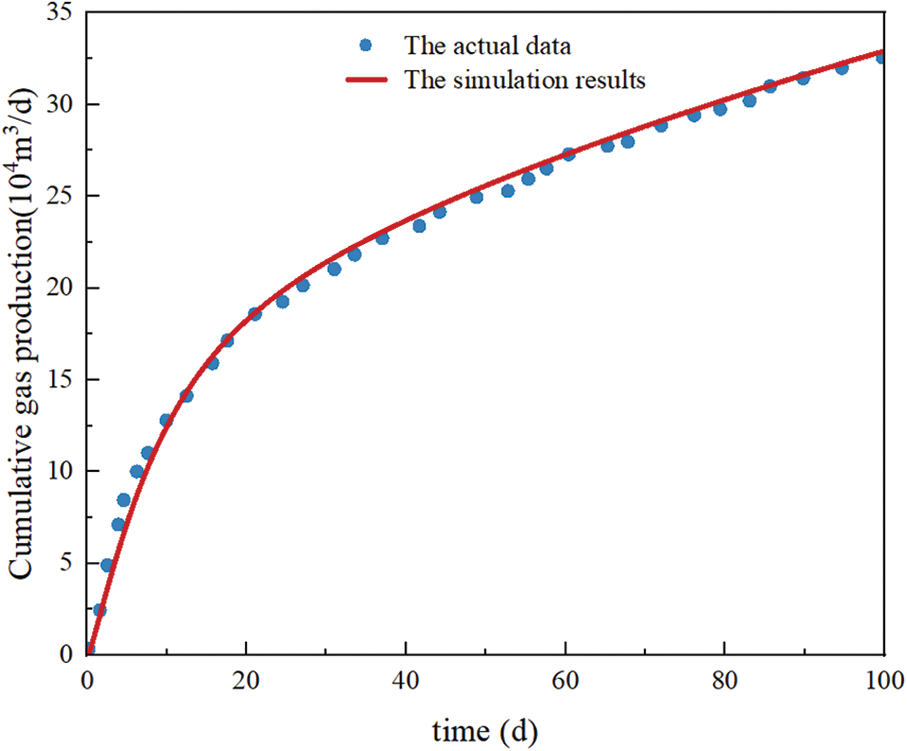
Figure 4: Comparison between production data and the simulation results in production
4.1 The Discussion of Two-Phase Flowback Performance
Fig. 5 shows the distribution of pressure and water saturation in micro-fracture and matrix after 100 days production. As gas and water are produced in the reservoir, the reservoir pressure around the fracture rapidly decreases, forming a pressure funnel. After 100 days of production, the pressure wave reached the boundary of the micro-fracture system (the SRV). The water saturation in the micro-fracture system significantly decreases compared to the initial situation, because the micro-fracture system has a higher permeability. Under the action of capillary pressure, the liquid in the micro-fracture system enters the shale matrix, which increases the water saturation of the matrix in the SRV.
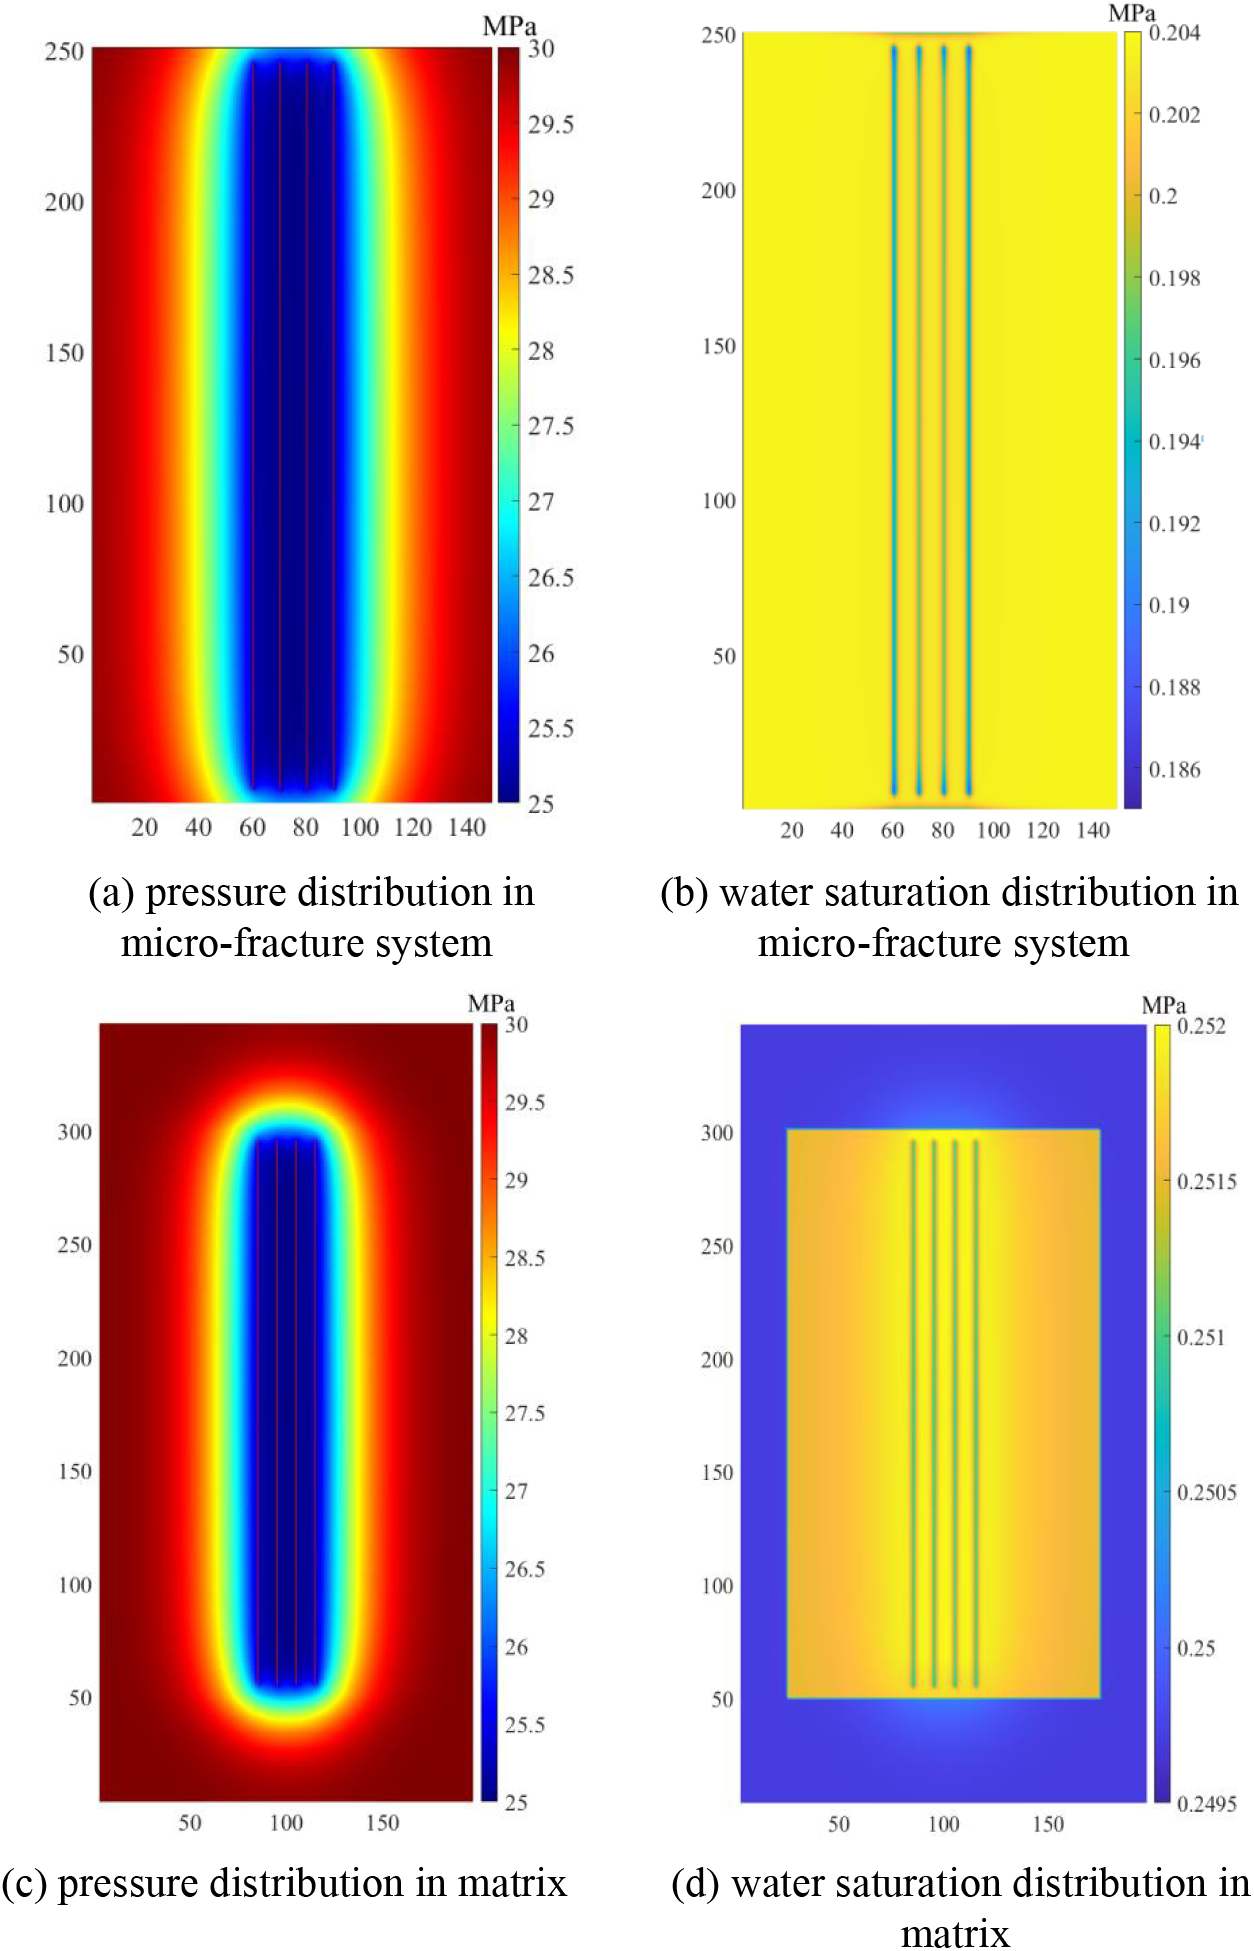
Figure 5: The distribution of pressure and water saturation with biwing fractures after 100 days production
Fig. 6 shows the daily gas production and cumulative gas production of shale gas wells. It is obvious that in the early stage of production, due to the presence of a large amount of fracturing fluid around the artificial main fracture, the fluid flow in the formation is a process of gas-driven water. The water saturation in the fracture gradually decreases, and the daily gas production shows an upward trend, gradually reaching its peak. When the water saturation in the artificial main fracture decreases to a certain value, as the pressure near the wellbore decreases, the daily gas production gradually decreases.
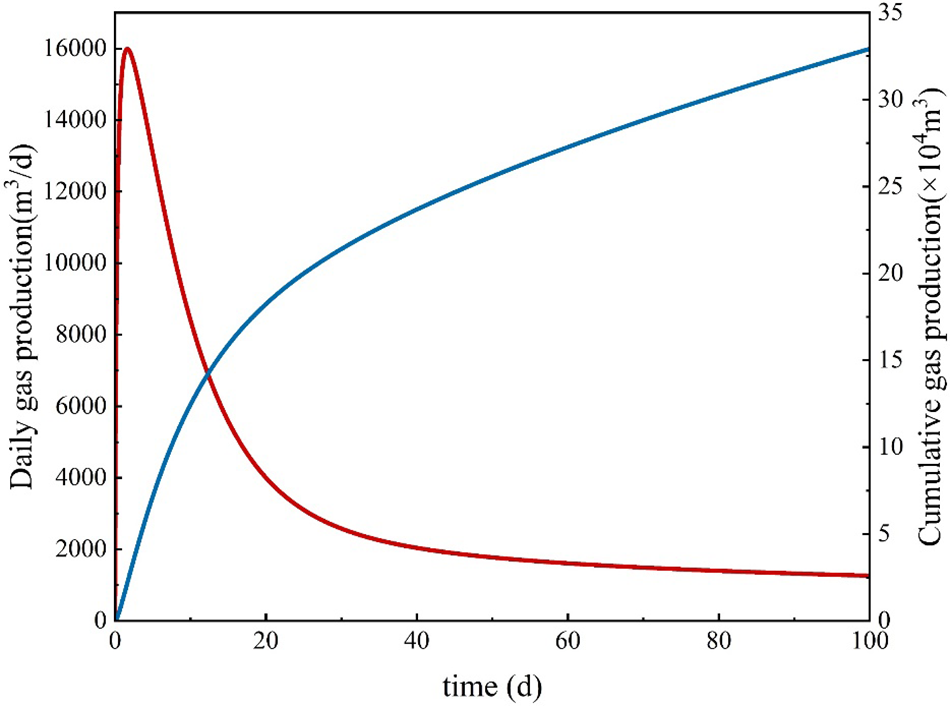
Figure 6: Production of shale gas well considering two-phase flowback
Fig. 7 shows the flowback rate of shale gas well with biwing fractures. It is obvious that flowback rate is less than 30% and the increasing rate of flowback rate significantly decreases after 20 days of production. Imbibition induced by capillary pressure is the main factor leading to a low flowback rate. Water in micro-fracture system can flow into matrix under capillary pressure.
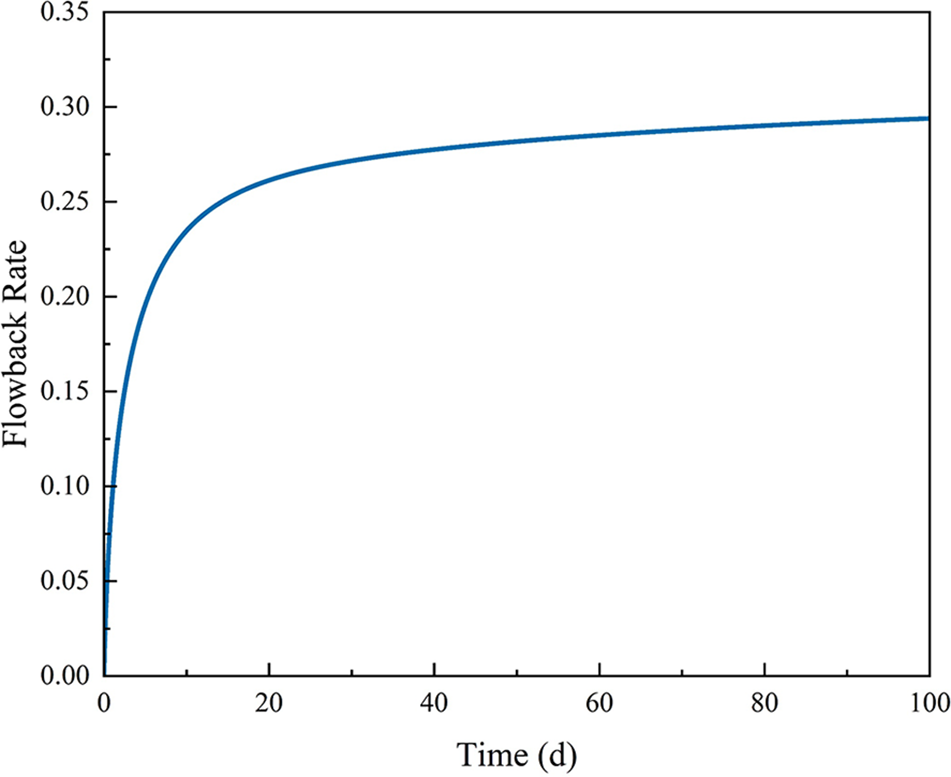
Figure 7: Flowback rate with biwing fractures
4.2 The Influence of Nonorthogonal Fractures on Two-Phase Flowback Performance
The distributions of pressure and water saturation in micro-fracture and matrix are shown in Figs. 8 and 9. Compared to the situation of biwing fractures, the decreasing law of reservoir pressure is similar, and pressure funnels are also formed around the fractures. The water saturation in the overlapping area with SRV in the matrix is increased by the action of capillary pressure, which is one of the reasons for the low flowback rate of shale gas wells.
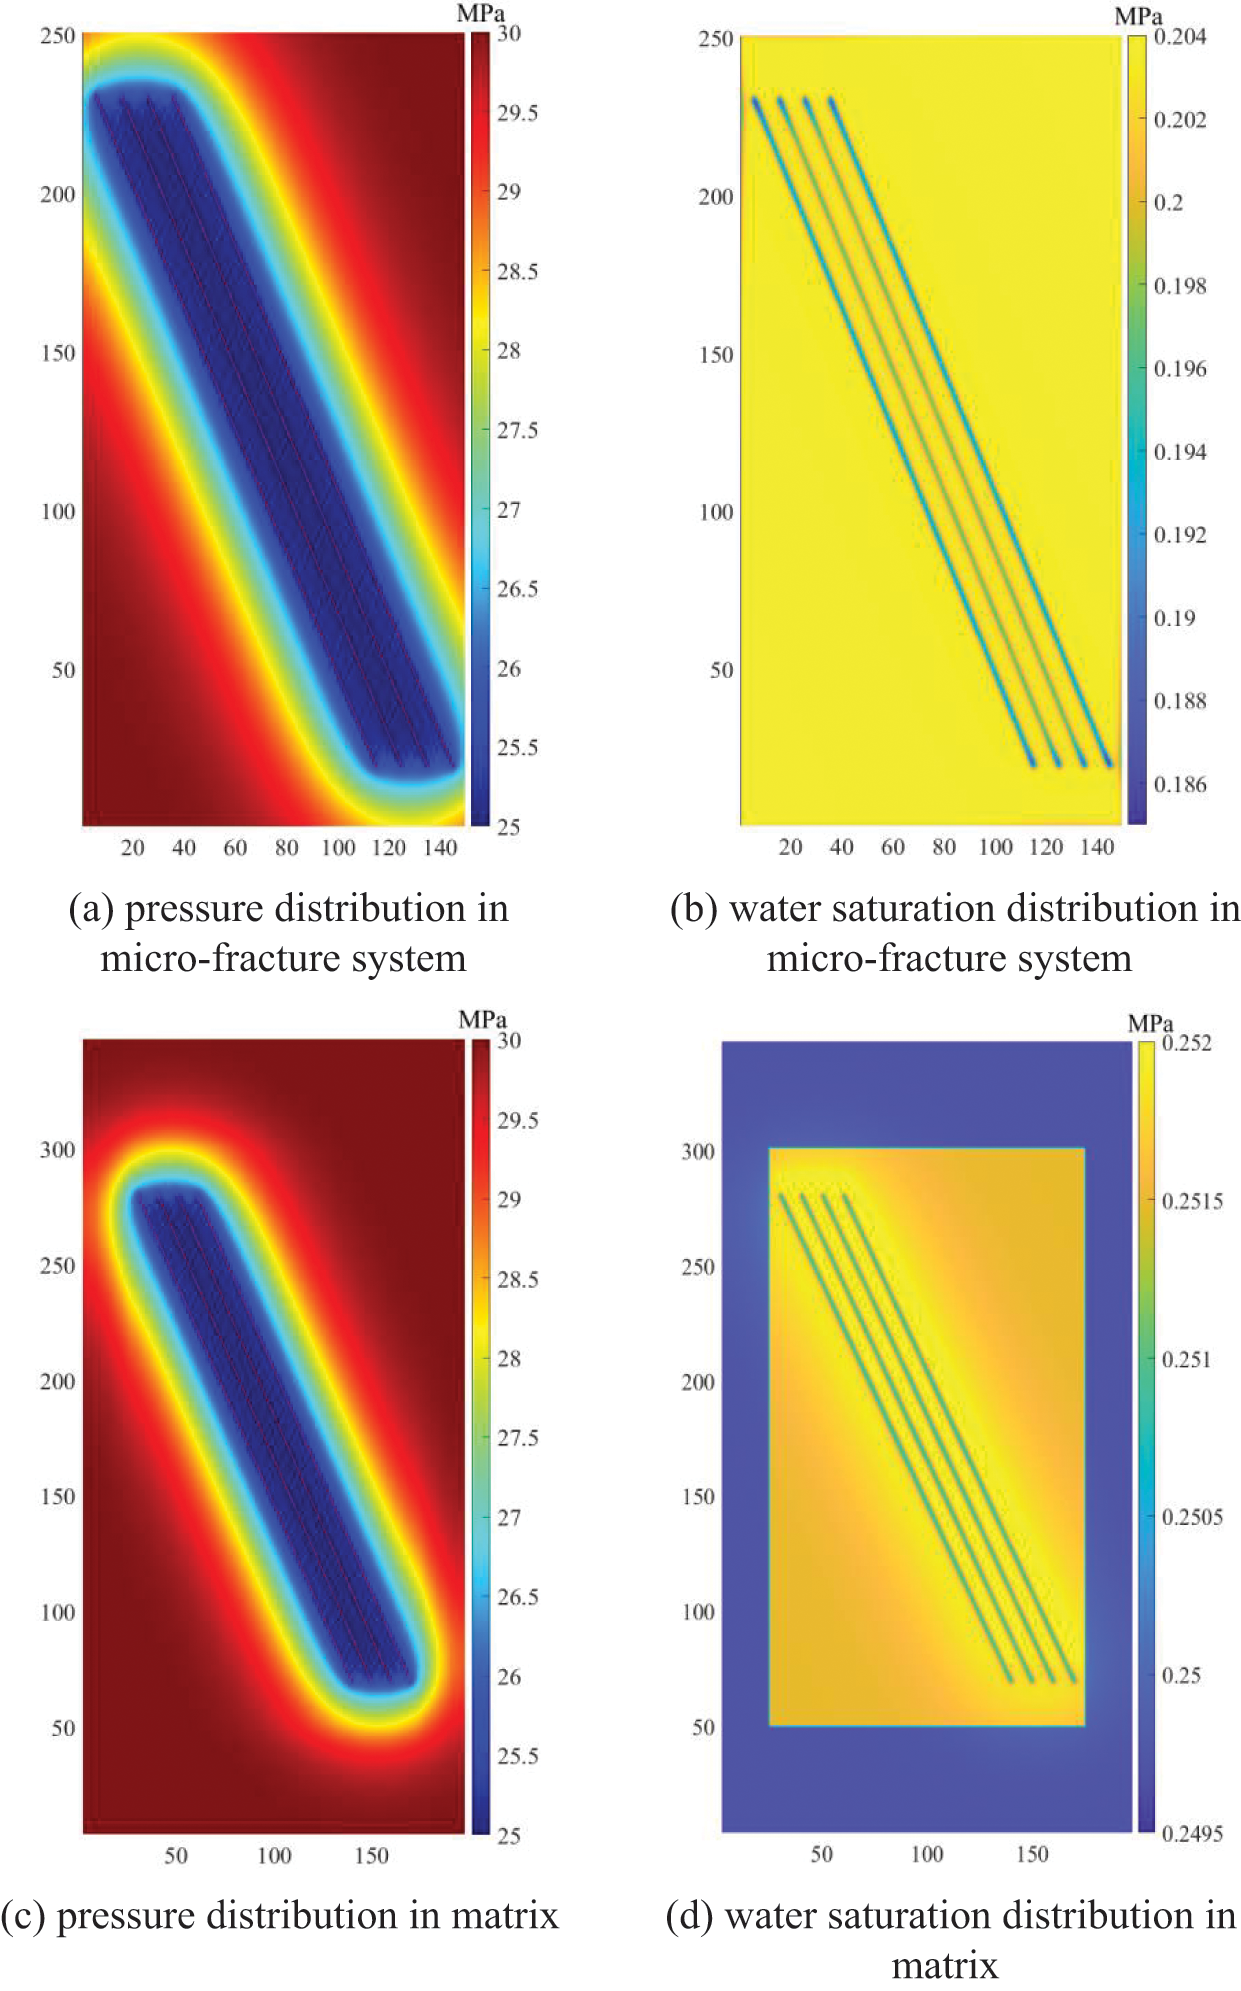
Figure 8: The distribution of pressure and water saturation with nonorthogonal fractures (60°) after 100 days production
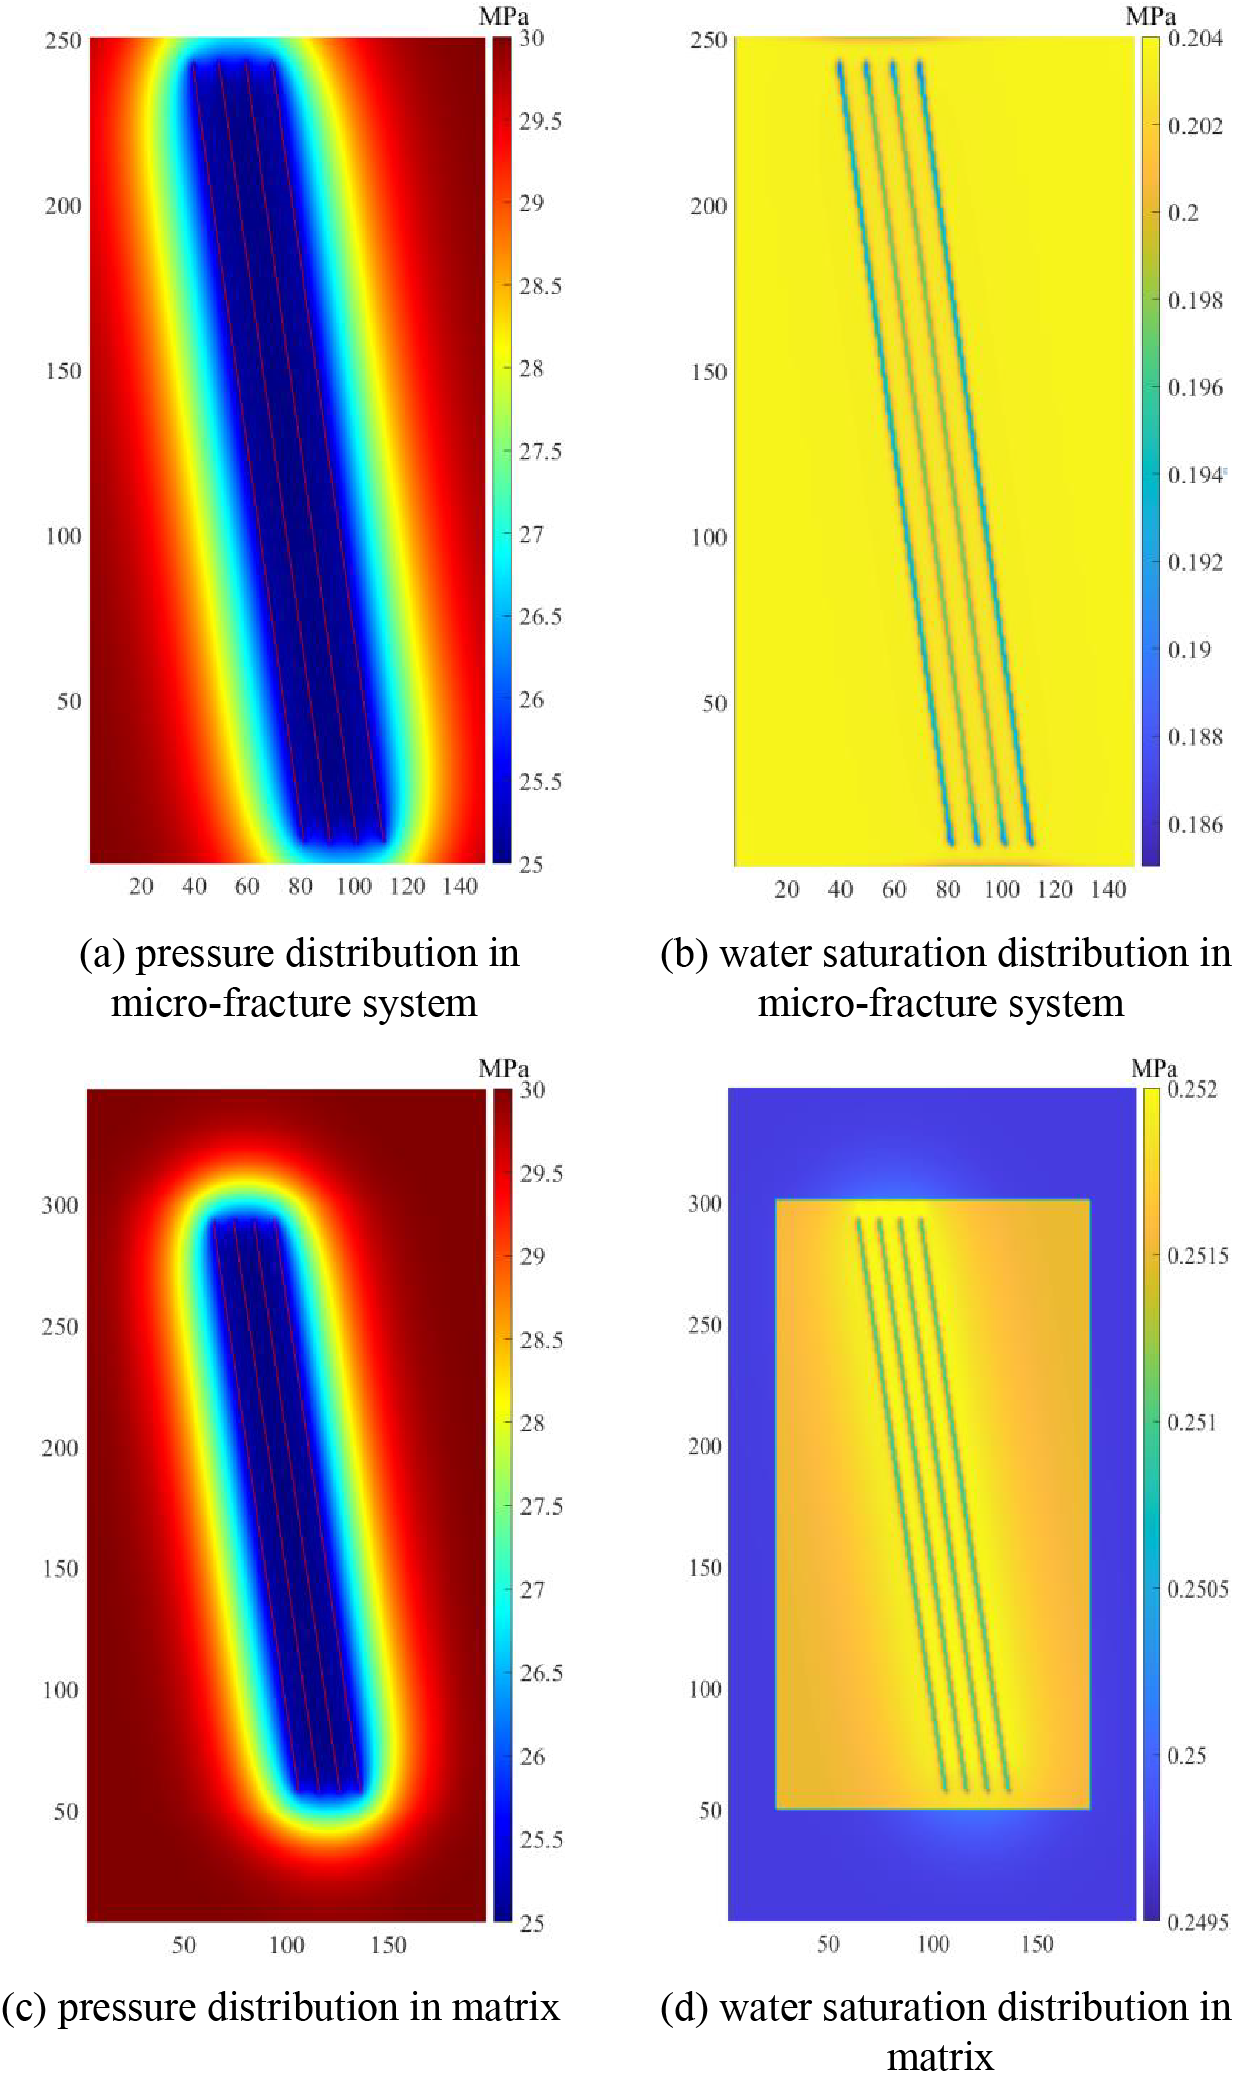
Figure 9: The distribution of pressure and water saturation with nonorthogonal fractures (80°) after 100 days production
Fig. 10 shows the comparison of shale gas well production with nonorthogonal fractures and biwing fractures. The comparison results show that the cumulative production with biwing fractures is the highest. This illustrates that the wellbore along the direction of the maximum principal stress is most conducive to the development of shale gas. The smaller the angle between the hydraulic fracture and the wellbore, the faster the daily production of shale gas wells decreases, and the lower the cumulative production.
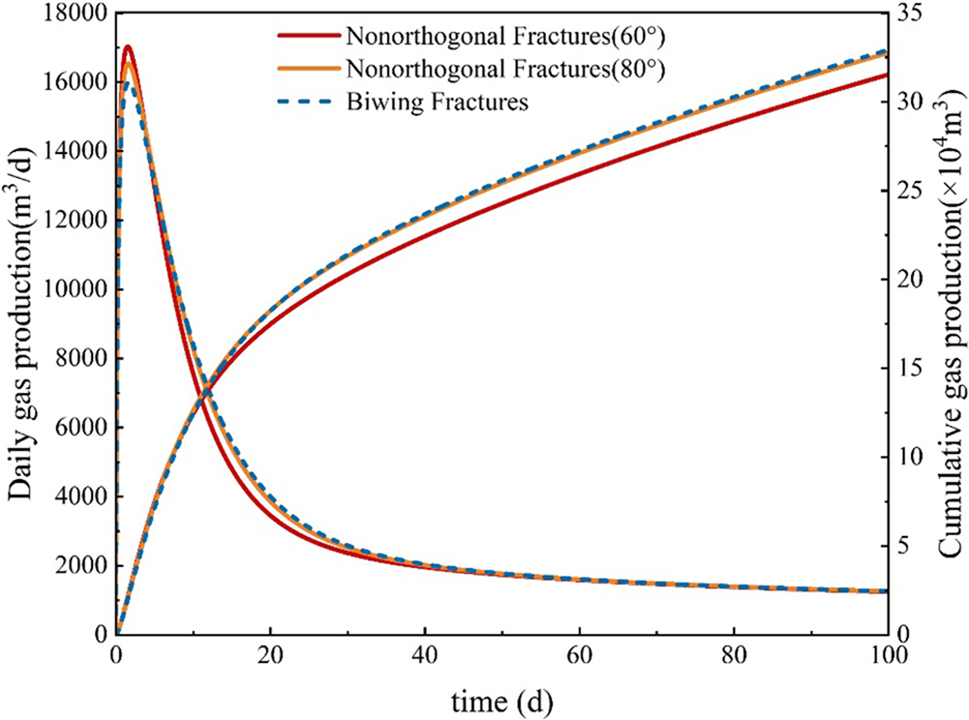
Figure 10: Production of shale gas well considering nonorthogonal fractures
4.3 The Influence of Nonplanar Fractures on Two-Phase Flowback Performance
In multi-cluster fracturing, the path of hydraulic fractures is not straight under the influence of stress shadows. The influence of nonplanar fractures on two-phase flowback performance is discussed in this paper. Fig. 11 shows the distribution of pressure and water saturation with nonplanar fractures after 100 days production. It is obvious that the nonplanar fractures have a wider control volume in reservoirs. The pressure drop area is significantly larger than that in the case of straight fractures. Fig. 11d shows that in the matrix with flow exchange with micro-fracture systems, the water saturation shows a trend of decreasing, increasing, and then decreasing as the distance from hydraulic fractures increases. This is because, water flows towards hydraulic fractures under the action of pressure, increasing the water saturation around the fractures. And the reservoir fluid closest to the hydraulic fracture is exploited from the reservoir under extremely high-pressure differences.

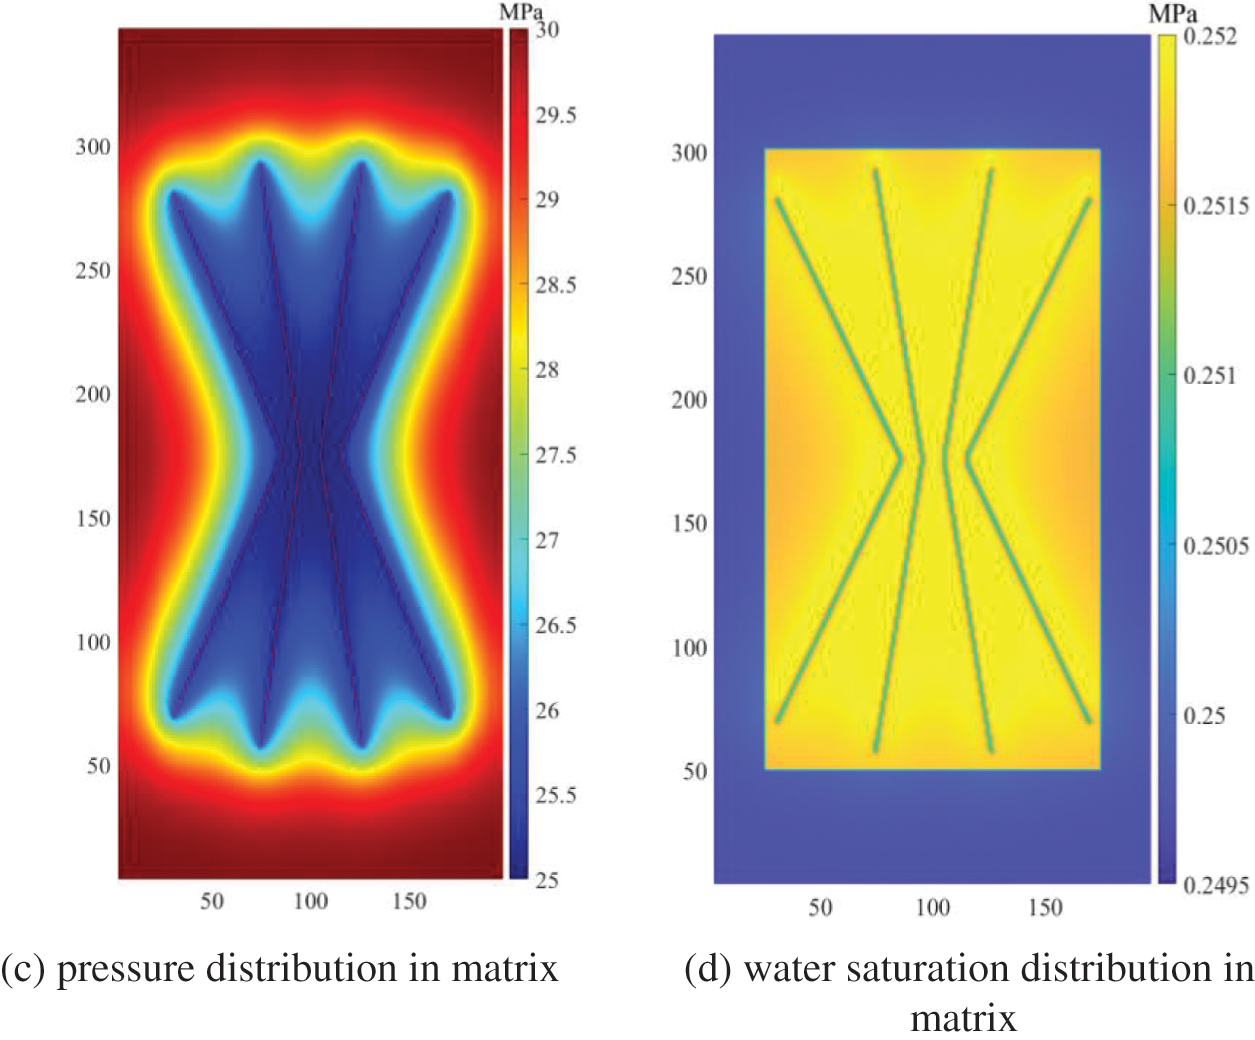
Figure 11: The distribution of pressure and water saturation with nonplanar fractures after 100 days production
The production of the shale gas well with biwing fractures and nonplanar fractures, as is shown in Fig. 12. The daily gas production and cumulative gas production with nonplanar fractures are obviously higher than that in biwing fractures. Because the nonplanar fracture impacts a wider range of reservoir fluid flow, which is consistent with the pressure distribution after 100 days of production. Therefore, the fracture path deviation caused by stress shadow can partly increase the hydraulic fracture control volume and improve the production of shale gas wells.
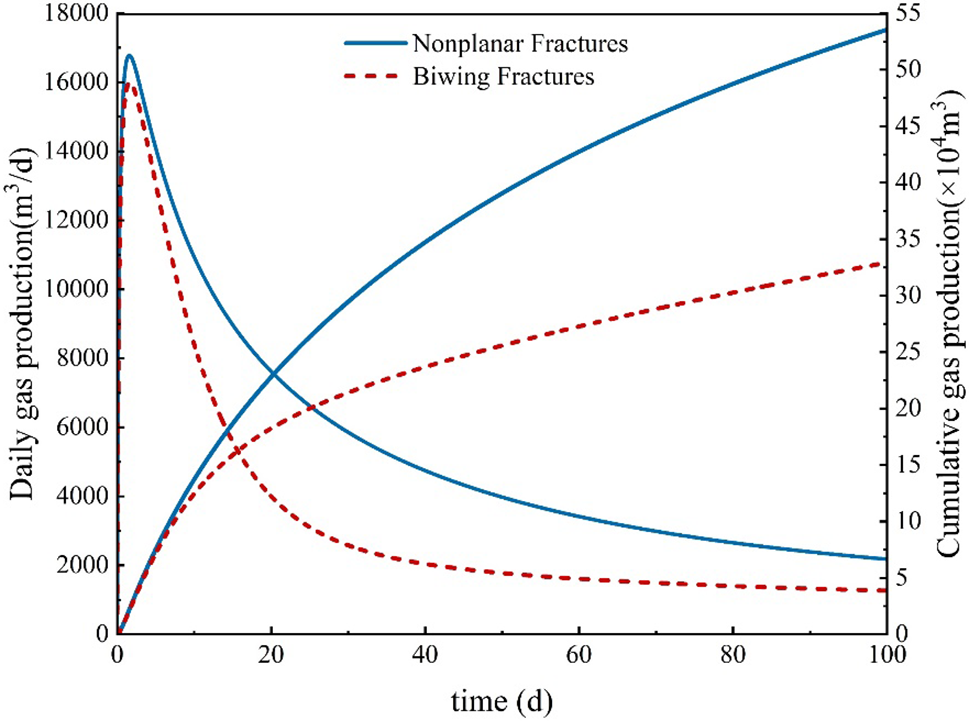
Figure 12: Production of shale gas well considering nonplanar fractures
Fig. 13 shows that the flowback rate with nonplanar fractures is obviously higher than that with biwing fractures. It is because nonplanar fractures control a wider range of reservoirs than biwing fractures.
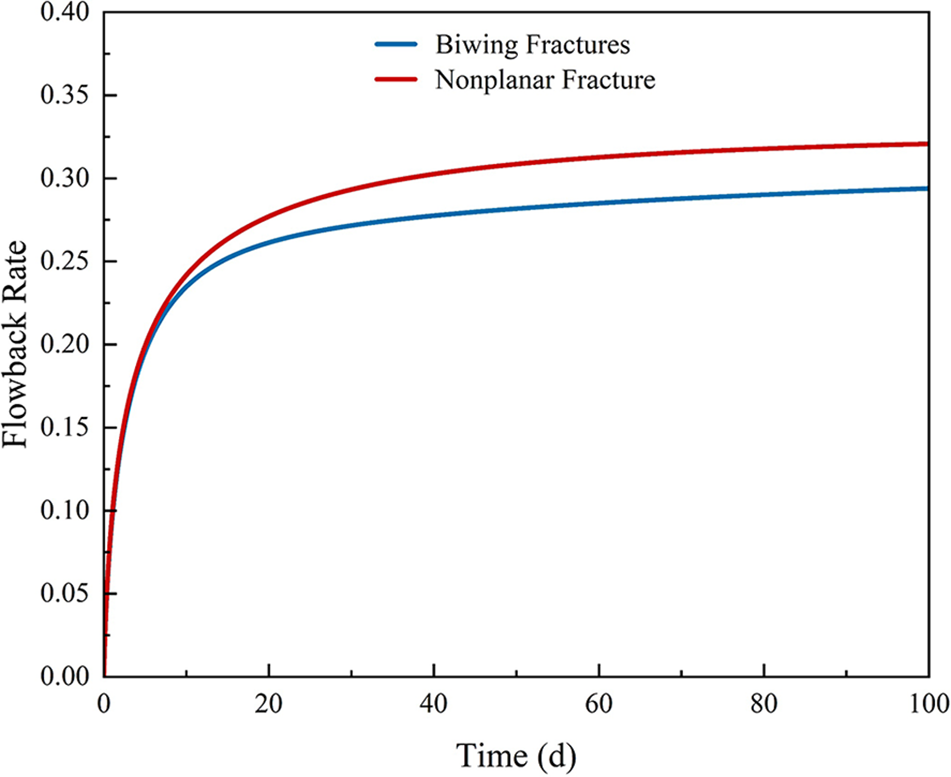
Figure 13: Flowback rate with biwing fractures and nonplanar fractures
In this work, we developed a two-phase flowback model of a shale gas well based on the EDFM and dual-medium method. This model considered the high-water saturation in the reservoir stimulation volume by describing the area as a micro-fracture system. And the shale gas adsorption, desorption, diffusion, gas slippage effect, fracture stress sensitivity, and capillary imbibition were considered in this model. It makes flowback model comprehensive. The influences of hydraulic fracture geometry and nonorthogonal hydraulic fractures on flowback performance and gas production were discussed in our work.
(1) The invasion of fracturing fluid has a significant impact on production. Due to the presence of a large amount of fracturing fluid around the hydraulic fracture, the fluid flow in the formation is a process of gas-driven water in the early stage of production. The water saturation in the fracture gradually decreases, and the dailay gas production shows an upward trend, gradually reaching its peak. When the water saturation in the hydraulic fracture decreases to a certain value, as the pressure near the wellbore decreases, the daily gas production gradually decreases.
(2) The cumulative production with biwing fractures is the highest. The smaller the angle between the hydraulic fracture and the wellbore, the faster the daily production of shale gas wells decreases, and the lower the cumulative production. The wellbore along the direction of the maximum principal stress is most beneficial to the development of shale gas.
(3) The shale gas well production with nonplanar fractures is obviously higher than that in biwing fractures. In multi-cluster fracturing, the fracture path offset to the outsideis caused by stress shadow, which can increase the control volume of hydraulic fractures and improve the production of shale gas wells.
Acknowledgement: None.
Funding Statement: This study was supported by the National Natural Science Foundation of China (Grant Nos. U19A2043 and 52174033), Natural Science Foundation of Sichuan Province (NSFSC) (No. 2022NSFSC0971), and the Science and Technology Cooperation Project of the CNPC-SWPU Innovation Alliance.
Author Contributions: The authors confirm contribution to the paper as follows: study conception and design: Y.D., Z.Z.; data collection: H.H.; analysis and interpretation of results: G.X.; draft manuscript preparation: X.Y. All authors reviewed the results and approved the final version of the manuscript.
Availability of Data and Materials: The authors confirm that the data supporting the findings of this study are available within the article.
Conflicts of Interest: The authors declare that they have no conflicts of interest to report regarding the present study.
References
1. Luo, A., Li, Y., Wu, L., Peng, Y., Tang, W. (2021). Fractured horizontal well productivity model for shale gas considering stress sensitivity, hydraulic fracture azimuth, and interference between fractures. Natural Gas Industry B, 8(3), 278–286. [Google Scholar]
2. Peng, Y., Zhao, J., Sepehrnoori, K., Li, Z., Xu, F. (2019). Study of delayed creep fracture initiation and propagation based on semi-analytical fractional model. Applied Mathematical Modelling, 72, 700–715. [Google Scholar]
3. Benson, A. L. L., Clarkson, C. R. (2022). Flowback rate-transient analysis with spontaneous imbibition effects. Journal of Natural Gas Science and Engineering, 108, 104830. [Google Scholar]
4. Boronin, S. A., Tolmacheva, K. I., Garagash, I. A., Abdrakhmanov, I. R., Fisher, G. Y. et al. (2022). Integrated modeling of fracturing-flowback-production dynamics and calibration on field data: Optimum well startup scenarios. Petroleum Science, 20(4), 2202–2231. [Google Scholar]
5. Eltahan, E., Rego, F. B., Yu, W., Sepehrnoori, K. (2020). Impact of well shut-in after hydraulic-fracture treatments on productivity and recovery in shale oil reservoirs. The SPE Improved Oil Recovery ConferenceTulsa, Oklahoma, USA. [Google Scholar]
6. Tomson, M., Zhang, Z., Dai, Z., Bolanos, V., Kan, A. et al. (2015). Shale gas and oil flowback and produced water modeling and treatment. Abstracts of Papers of the American Chemical Society, 249. [Google Scholar]
7. Liu, N., Liu, M., Zhang, S. (2015). Flowback patterns of fractured shale gas wells. Natural Gas Industry B, 2, 247–251. [Google Scholar]
8. Fakcharoenphol, P., Torcuk, M., Kazemi, H., Wu, Y. (2016). Effect of shut-in time on gas flow rate in hydraulic fractured shale reservoirs. Journal of Natural Gas Science and Engineering, 32, 109–121. [Google Scholar]
9. Williams-Kovacs, J. D., Clarkson, C. R. (2016). A modified approach for modeling two-phase flowback from multi-fractured horizontal shale gas wells. Journal of Natural Gas Science and Engineering, 30, 127–147. [Google Scholar]
10. Wang, F., Pan, Z., Lin, H., Zhang, S. (2016). A chemical potential dominated model for fracturing-fluid flowback simulation in hydraulically fractured gas shale. SPE Annual Technical Conference and ExhibitionDubai, UAE. [Google Scholar]
11. Kim, J., Moridis, G. J. (2013). Development of the T+M coupled flow-geomechanical simulator to describe fracture propagation and coupled flow-thermal–geomechanical processes in tight/shale gas systems. Computers & Geosciences, 60, 184–198. [Google Scholar]
12. Williams-Kovacs, J. D., Clarkson, C. R. (2015). A modified approach for modelling 2-phase flowback from multi-fractured horizontal shale gas wells. The Unconventional Resources Technology ConferenceSan Antonio, Texas, USA. [Google Scholar]
13. Clarkson, C. R., Williams-Kovacs, J. D. (2013). Modeling 2-phase flowback of multi-fractured horizontal wells completed in shale. SPE Journal, 18(4), 795–812. [Google Scholar]
14. Williams-Kovacs, J. D., Clarkson, C. R. (2013). Stochastic modeling of two-phase flowback of multi-fractured horizontal wells to estimate hydraulic fracture properties and forecast production. The SPE Unconventional Resource ConferenceThe Woodlands, Texas, USA. [Google Scholar]
15. Ezulike, O. D., Dehghanpour, H. (2014). Modelling flowback as a transient two-phase depletion process. Journal of Natural Gas Science and Engineering, 19, 258–278. [Google Scholar]
16. Guo, X., Song, H., Wu, K., Killough, J. (2018). Pressure characteristics and performance of multi-stage fractured horizontal well in shale gas reservoirs with coupled flow and geomechanics. Journal of Petroleum Science and Engineering, 163, 1–15. [Google Scholar]
17. Yang, R., Huang, Z., Li, G., Yu, W., Sepehrnoori, K. et al. (2017). A semianalytical approach to model two-phase flowback of shale-gas wells with complex-fracture-network geometries. SPE Journal, 6(22), 1808–1813. [Google Scholar]
18. Liu, Y., Liu, L., Leung, J. Y., Wu, K., Moridis, G. J. (2020). Numerical investigation of water flowback characteristics for unconventional gas reservoirs with complex fracture geometries. SPE/AAPG/SEG Unconventional Resources Technology ConferenceVirtual. [Google Scholar]
19. Lin, H., Zhou, X., Chen, Y., Yang, B., Song, X. et al. (2021). Investigation of the factors influencing the flowback ratio in shale gas reservoirs: A study based on experimental observations and numerical simulations. Journal of Energy Resources Technology, 11(143), 113201. [Google Scholar]
20. Xie, W., Wu, J., Yang, X., Chang, C., Zhang, J. (2022). Gas-water two-phase flow characteristics and flowback evaluation for shale gas wells. Water, 14(10), 1642. [Google Scholar]
21. AlTwaijri, M., Xia, Z., Yu, W., Qu, L., Hu, Y. et al. (2018). Numerical study of complex fracture geometry effect on two-phase performance of shale-gas wells using the fast EDFM method. Journal of Petroleum Science and Engineering, 164, 603–622. [Google Scholar]
22. Zou, G., Pan, B., Zhu, W., Liu, Y., Ma, S. et al. (2023). Investigation of fracturing fluid flowback in hydraulically fractured formations based on microscopic visualization experiments. Polymers, 15(6), 1560. [Google Scholar] [PubMed]
23. Wijaya, N., Sheng, J. J. (2018). Shut-in effect in removing water blockage in shale-oil reservoirs with stress-dependent permeability considered. SPE Journal, 23(1), 81–94. [Google Scholar]
24. Li, Y., Luo, A., Chen, X., Cheng, L., Chang, C. et al. (2022). A novel model for simulating the integration process of hydraulic fracturing, shut-in period, and well production. Frontiers in Energy Research, 10, 979526. [Google Scholar]
25. Ghanbari, E., Dehghanpour, H. (2016). The fate of fracturing water: A field and simulation study. Fuel, 163, 282–294. [Google Scholar]
26. Makhanov, K., Habibi, A., Dehghanpour, H., Kuru, E. (2014). Liquid uptake of gas shales: A workflow to estimate water loss during shut-in periods after fracturing operations. Journal of Unconventional Oil and Gas Resources, 7, 22–32. [Google Scholar]
27. Jing, G., Chen, Z., Zhang, K. (2023). Studying factors to optimize flowback and productivity of Mfhws in shale gas formations. SPE Western Regional MeetingAnchorage, Alaska, USA. [Google Scholar]
28. Stalgorova, E., Mattar, L. (2013). Analytical model for unconventional multifractured composite systems. SPE Reservoir Evaluation & Engineering, 3(16), 246–256. [Google Scholar]
29. Adefidipe, O. A., Dehghanpour, H., Virues, C. J. (2014). Immediate gas production from shale gas wells: A two-phase flowback model. SPE USA Unconventional Resources ConferenceThe Woodlands, Texas, USA. [Google Scholar]
30. Alkouh, A., McKetta, S., Wattenbarger, R. (2014). Estimation of efective-fracture volume using water-fowback and production data for shale-gas wells. Journal of Canadian Petroleum Technology, 53(5), 290–303. [Google Scholar]
31. Cao, P., Liu, J., Leong, Y. (2017). A multiscale-multiphase simulation model for the evaluation of shale gas recovery coupled the effect of water flowback. Fuel, 199, 191–205. [Google Scholar]
32. Yu, W., Xu, Y., Liu, M., Wu, K., Sepehrnoori, K. (2018). Simulation of shale gas transport and production with complex fractures using embedded discrete fracture model. Aiche Journal, 64(6), 2251–2264. [Google Scholar]
33. Yan, X., Huang, Z., Yao, J., Li, Y., Fan, D. et al. (2018). An Efficient numerical hybrid model for multiphase flow in deformable fractured-shale reservoirs. SPE Journal, 4(23), 1412–1437. [Google Scholar]
34. Xu, Y., Cavalcante Filho, J. S. A., Yu, W., Sepehrnoori, K. (2017). Discrete-fracture modeling of complex hydraulic-fracture geometries in reservoir simulators. SPE Reservoir Evaluation & Engineering, 20(2), 403–422. [Google Scholar]
35. Beskok, A., Karniadakis, G. E. (1999). Report: A model for flows in channels, pipes, and ducts at micro and nanoscale. Microscale Therm Engineering, 3(1), 43–77. [Google Scholar]
36. Ziarani, S. A., Aguilera, R. (2012). Knudsen’s permeability correction for tight porous media. Transport in Porous Media, 91(1), 239–260. [Google Scholar]
Cite This Article
 Copyright © 2024 The Author(s). Published by Tech Science Press.
This work is licensed under a Creative Commons Attribution 4.0 International License , which permits unrestricted use, distribution, and reproduction in any medium, provided the original work is properly cited.
 Downloads
 Citation Tools