
 Submit a Paper
 Propose a Special lssue
 Open Access
ARTICLE

Efficiency of a Modular Cleanroom for Space Applications
1 Faculty of Engineering and Physical Sciences, University of Southampton, Southampton, SO17 1BJ, UK
2 Plastron UK Ltd., Westcott Venture Park, Westcott, HP18 0XB, UK
3 Renewable Energy Group, University of Exeter, Exeter, TR10 9FE, UK
* Corresponding Author: Zheng-Tong Xie. Email:
(This article belongs to the Special Issue: The Progress in Building Indoor Air Quality: Indoor Airflow and Pollutant Control)
Fluid Dynamics & Materials Processing 2024, 20(3), 547-562. https://doi.org/10.32604/fdmp.2023.028601
Received 28 December 2022; Accepted 01 August 2023; Issue published 12 January 2024
 View Full Text
 Download PDF
Abstract
A prototype cleanroom for hazardous testing and handling of satellites prior to launcher encapsulation, satisfying the ISO8 standard has been designed and analyzed in terms of performances. Unsteady Reynolds Averaged Navier-Stokes (URANS) models have been used to study the related flow field and particulate matter (PM) dispersion. The outcomes of the URANS models have been validated through comparison with equivalent large-eddy simulations. Special attention has been paid to the location and shape of the air intakes and their orientation in space, in order to balance the PM convection and diffusion inside the cleanroom. Forming a cyclone-type flow pattern inside the cleanroom is a key to maintaining a high ventilation efficiency.Keywords
Indoor and cleanroom flows driven by mechanical [1,2] and natural ventilation [3], and usually disturbed by equipment and human motion [4], are highly unsteady with laminar, transient (intermittent) and turbulent regimes co-existing, and usually do not have a prevailing flow direction. These flows are highly three-dimensional across a wide range of time scales from the residual time (or eddy turn-over time) to the smallest turbulent eddy scale. Besides the high complexity of flow dynamics, the dispersion of scalar and Particulate Matter (PM) is extremely complex [1,3], for which accurate simulations and measurements are challenging. In the recent years, these have attracted even greater attention for various applications [2, 5–15]. Assessing cleanroom efficiency and effectiveness is one vital application.
A cleanroom is a closed space designed for a certain cleanliness level of pollutants in a short ventilation time, usually by using intensive mechanical ventilation. Cleanrooms are used for pharmaceutical products, medical equipment, and space applications, such as space hardware transportation facility cleanrooms. Compared to office rooms, cleanrooms have a much higher requirement [16–23], while the strictest standards have been achieved only for space applications. This paper is focused on the design of a Plastron portable cleanroom for satellite handling during launch campaigns, and the assessment of its ventilation efficiency.
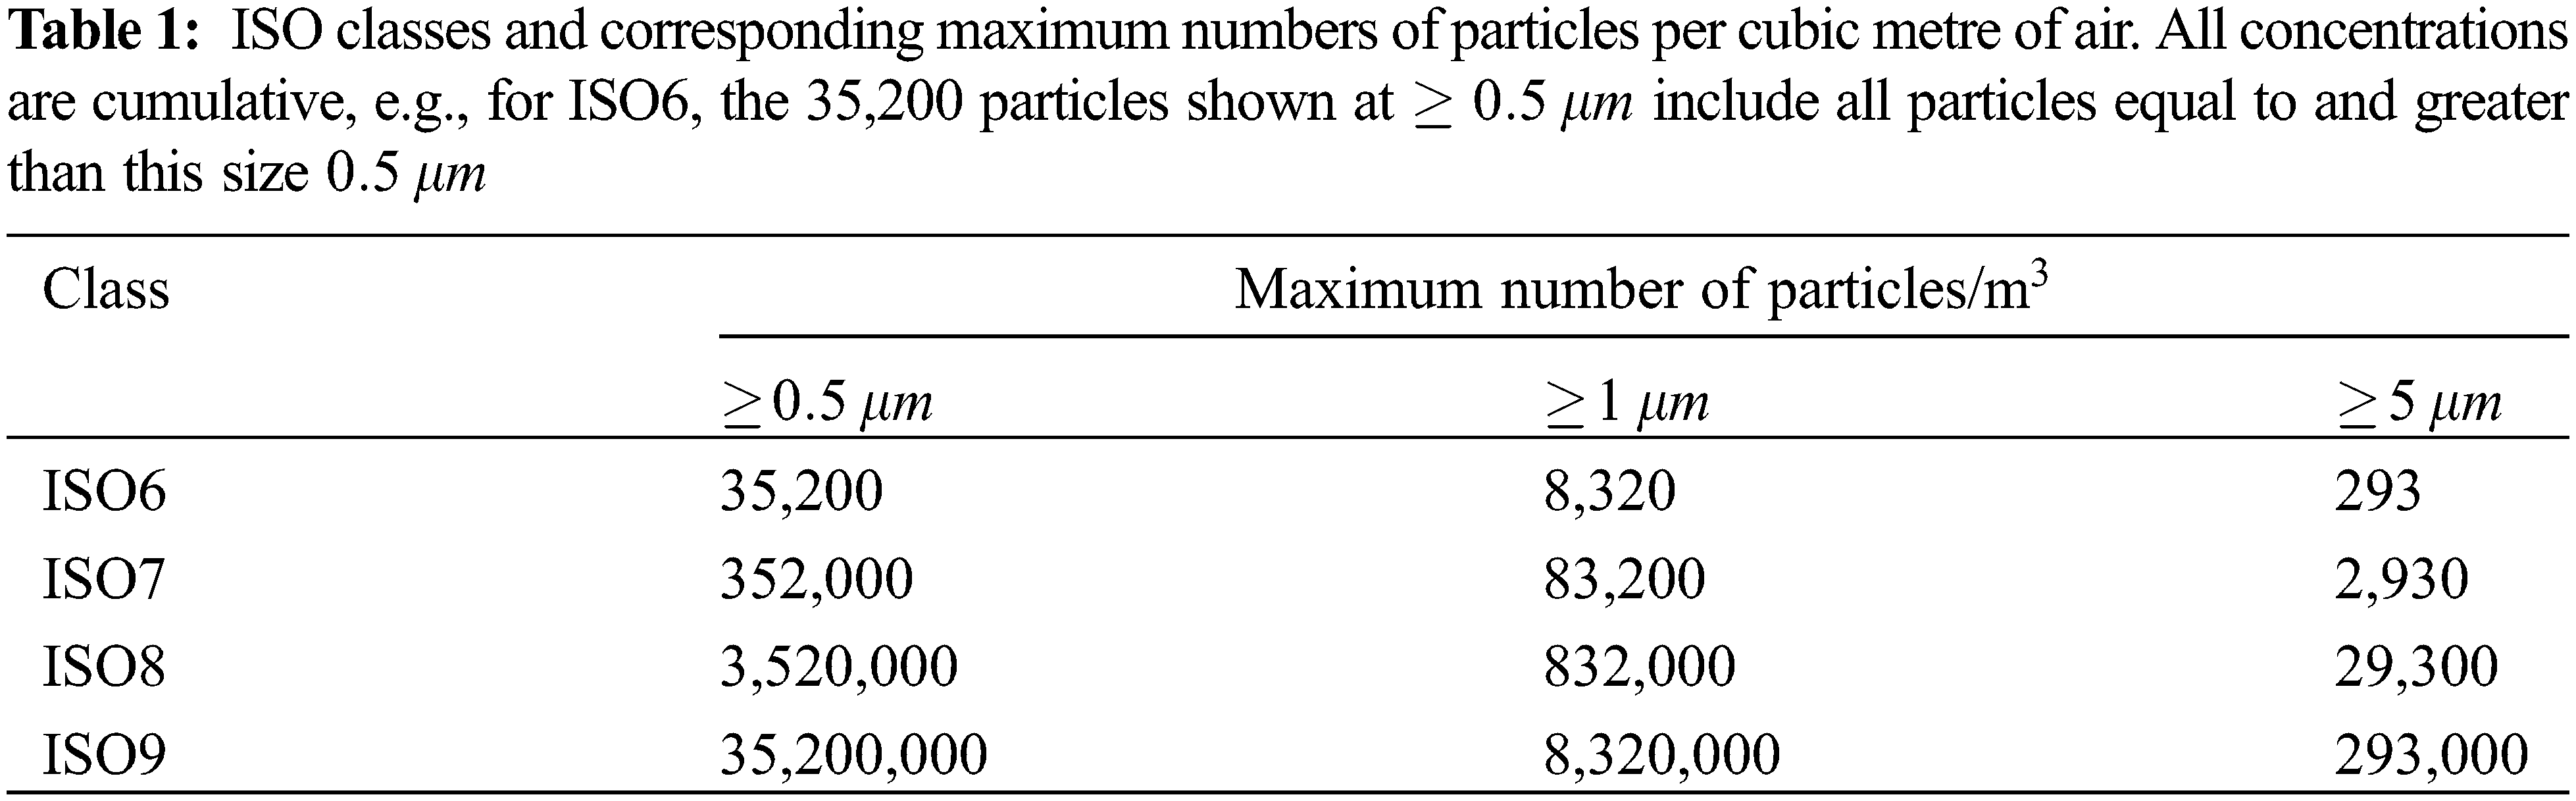
Table 1 shows the ISO class numbers and the corresponding maximum numbers of particles per cubic metre of air [24], where the maximum number of particles is ten times the corresponding number of the class just one level lower. For example, the maximum number of particles (
The peak concentration [25,26] has attracted increasing attention in recent years, such as for an estimation of exposure in a short duration for specific applications. An ‘accurate’ estimation of the peak concentration is difficult, and is usually out of the range of numerical resolution or sensor sensitivity, as the concentration is more intermittent than the flow. The temporal and spatial resolutions can significantly affect the accuracy in numerical simulations and experiments, and statistical or theoretical approaches are usually used instead. One approach is the so-called eddy diffusion model [27] assuming a constant diffusivity, based on an analytic solution for an instantaneous point source in an infinite volume [28] and symmetric (mirror) boundary conditions representing room walls. These models are not suitable for the assessment of cleanroom efficiency. To compromise computational cost and accuracy, this paper is focused on simulations of unsteady Reynolds average Navier-Stokes (URANS) equations, and a small number of large-eddy simulations (LES) for cross comparison.
1.1 Background to the Plastron Payload Processing Facility Cleanroom
The underlying requirements for the Plastron Payload Processing Facility (PPF) were identified in late 2019 but validated in 2020 as facility requirements for the Newquay Spaceport were being publicised. Plastron quickly identified that the types of affordable and fit-for-purpose facilities required for the SpacePort operations market did not exist. They also recognised that many new entrants into the NewSpace industry lacked hands-on, commercial spaceflight safety experience, which the facility designers foresaw as a considerable safety risk to the UK Launch industry. Using early market engagement, including insights from dialogues with Newquay Spaceport, the design template was determined—fundamentally, a modular facility capable of handling the propellant and pressurisation requirements for a 1,000 kg smallSat, and which could pack down to fit into shipping containers. In terms of the operational envelope for a horizontal launch operator, such as Virgin Orbit, this would ensure the facility could be transported to any spaceport used by their Boeing 747 Cosmic Girl and LauncherOne.
ISO8 cleanliness is vital to all customer segments in assuring flight hardware integrity throughout the Manufacture, Assembly, Integration and Test (MAIT) cycles up to launch. From our market research, it was clear the majority of commercial cleanroom system providers employ fairly rudimentary approaches, if any, for validating air quality and airflow. It was often no more complex than calculating the ratio of the total operational volume exchanged at the required frequency (e.g., 287 cubic metres every two minutes) to the volumetric flowrate of a standard fan unit, thus estimating the total number of fan units required. Plastron felt it was important to validate the air quality computationally, and so approached the SPRINT funding programme for the support required to achieve this. It was felt the research could also help discover ways to reduce operating costs and power consumption requirements, contributing to a business principle for minimising our carbon footprint. As an output of this research, the Plastron Air Control System (Fig. 1) is now a key part of the PPF.
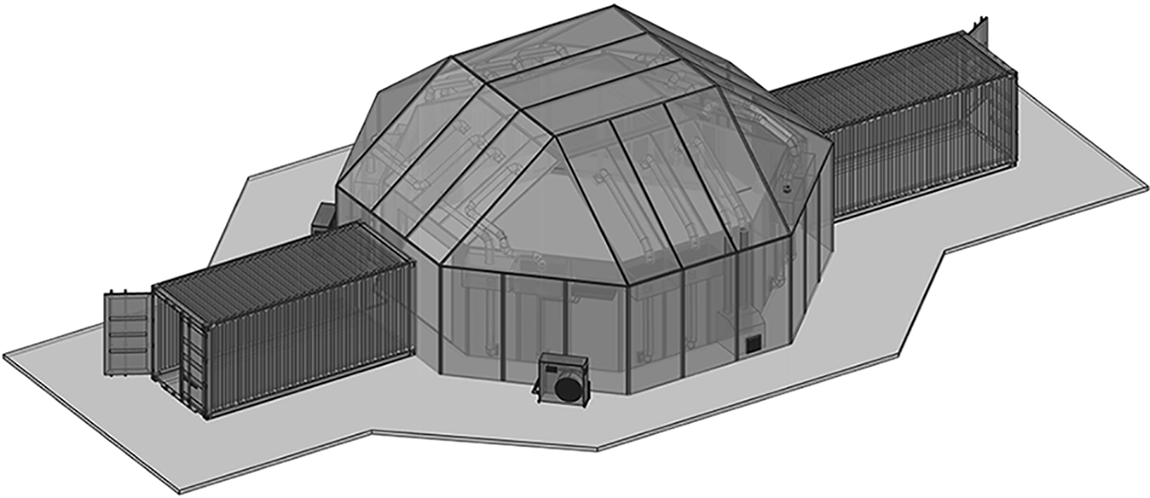
Figure 1: The plastron air control system is incorporated into a fully functional satellite processing facility. The facility comprises three elements: the main cleanroom environment, an adjacent hazardous processing environment and a garment changing room
Satellite components, assemblies and systems have to be manufactured and assembled in extremely clean environments to ensure contamination does not compromise the function of the hardware before launch or once in orbit. Plastron developed their state-of-the-art facility to meet the NewSpace space sector requirement for rapidly and more cheaply producing flight hardware without compromising on hazardous safety or product quality standards. Central to what makes a cleanroom viable for satellite assembly is the air quality, where the concentration of microscopic particles suspended in the air needs to be below a required threshold.
The standard for air quality in space hardware cleanrooms is ECSS Basic Specification 24,900, which includes requirements for the maximum suspended air particulate concentration levels. The research focus was to prove the air quality throughout the operational volume met the ISO8 standard at a minimum. Advanced computational fluid dynamics (CFD) modelling was used to assess how well the air management system design of the product achieved the ISO8 standard.
Two research stages were identified. Phase 1: the baseline study helped validate the ISO8 requirement. Phase 2: investigating how system redundancy can support climate control zones in the facility as well as reduce overall power consumption. To complete this research and assure the quality of the Plastron facility, the baseline Air Control System was modelled, tested and incrementally evolved between tests. A brief summary of the project is shown below:
I. Completing dynamic simulations of the effect of equipment and human motion, and evaluating the designed cleanroom against the ISO8 standard.
II. Repeating simulations with the inclusion of air inlet diffusers and evaluating the cleanroom against the ISO8 standard.
III. Extending operational volume to cover an additional 30
IV. Evaluating cleanroom-within-a-cleanroom against the ISO8 standard, and supporting the ability for ISO6 optical payloads to be handled in a Plastron.
During the project, more than one hundred cases were numerically tested, for identifying an optimum design of the inlet shape and location and testing various industrial requests. To form a concise scientific paper being of interest of researchers in academia and industry, only a small part of data and their analysis from tasks I and II are reported here. The main purpose of this paper was to highlight the novel concept of cleanroom design, rather than to give most details of the various designs.
The incompressibe unsteady Reynolds average Navier-Stokes (URANS) equations [7,8,14,15] and the incompressibe large-eddy simulation (LES) Navier-Stokes equations [2,8,25] can be shown in the same form:
where ‘
and is modelled based on the Boussinesq approximation,
where the Kronecker delta
The
The transport equation for a passive scalar is
where C is the URANS averaged, or the LES filtered scalar (PMs) concentration. For simplicity, C is a dimensionless quantity, which is the concentration normalized by the concentration in normal room air (Table 1). K is the molecular diffusivity and
where
2.2 Geometry of the Baseline Cleanroom and the Accommodated Satellite Model
Fig. 2 shows the dimensions of the baseline cleanroom (see a 3D view in Fig. 3). The total volume of the cleanroom is approximately 287 m3. The dimensions of the satellite and human models (Fig. 3b) are as follows. The satellite and wheel base had a total height of mm, including a ground clearance of mm. The base had dimensions of mm
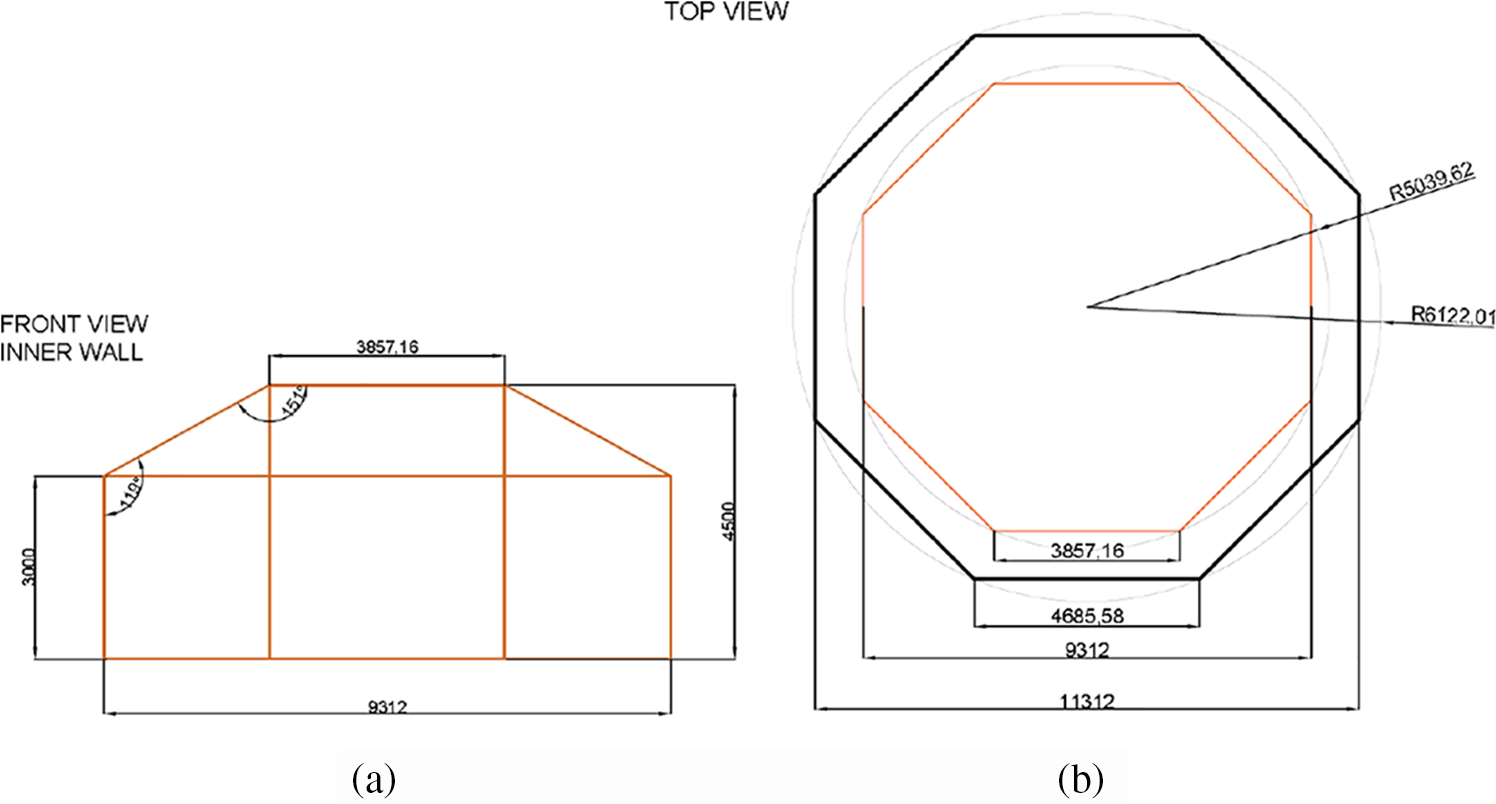
Figure 2: Dimensions of the cleanroom. Units are in
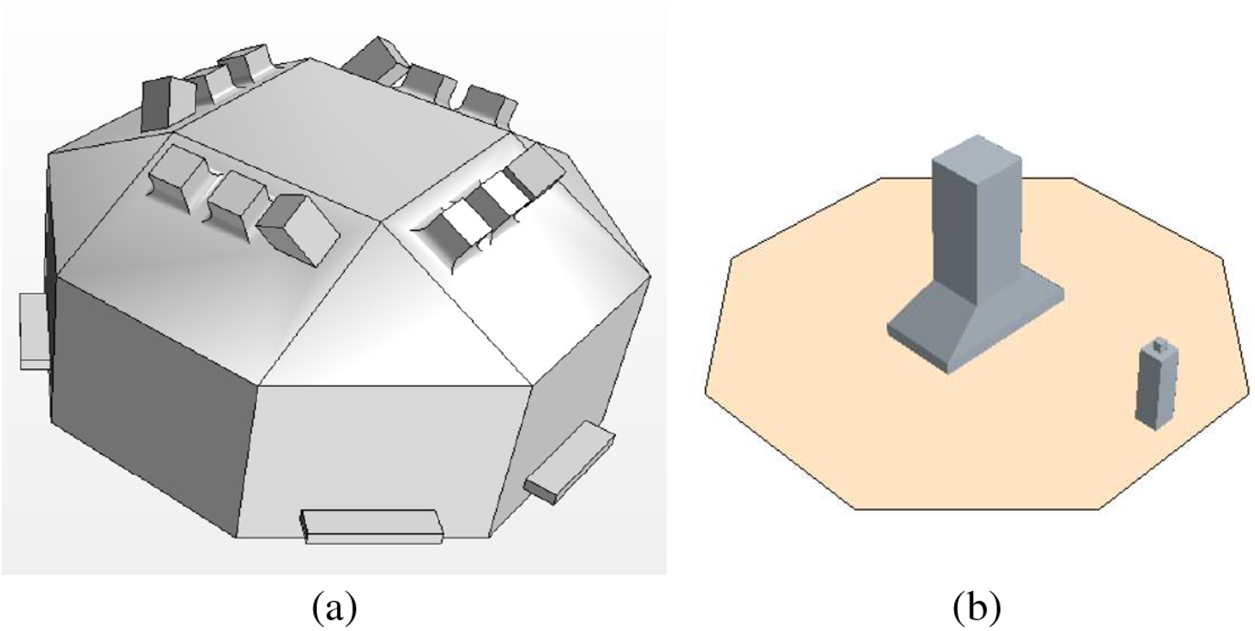
Figure 3: 3D geometry of the CFD domain of the baseline room. (a) An isometric view of the 3D CFD domain. (b) An isometric view of the satellite model (the larger object) placed on the clean ground and a human standing (the smaller object) walking around the satellite model along a circle at a speed of 0.75 m/s
The baseline total mass flow rate through the 12 inlets was 3.4 kg/s, resulting in an air change rate (ACR) approximately of 40. It is crucial to define the turn-over time T,
where
2.3 Adopted Numerical Settings
LES was only used for evaluating URANS simulations in Section 3, while URANS was used in all other simulations. The 2nd order accuracy implicit scheme was used for the temporal discretisation. The 2nd order accuracy upwind and bounded-central schemes were used for the discretisation of the convection term in the URANS and LES N-S equations, respectively. The 2nd order accuracy central scheme was used for the diffusion term in both URANS and LES. The 1st order upwind scheme was used for the convection terms for
To ensure fully developed flows, the flow initialisation periods for URANS and LES were and s, respectively, when the concentration of particles (C in Eq. (8)) was set equal to a constant dimensionless concentration of 1.0 in the cleanroom, and as the inlet boundary condition. After the flow initialisation was complete, the ‘filtering system’ was switched on by setting the concentration
Because the URANS and LES were much more computationally expensive than the steady RANS, and more than one hundred cases were to be simulated, we decided to design a low cost baseline mesh with the viscous sublayer resolved, by following the early work [2]. Foat et al. [2] used LES to simulate the cuboid-shape room designed by [1], of which the volume was about one third of the current cleanroom (Fig. 3a). The structured mesh used in [2] had 5.4 million cells, with the near-wall grids resolving the viscous sublayer. By using a prism layer (PL) mesh with the viscous-sublayer resolved (Fig. 4 and Table 2), and a unstructured Cartesian mesh in the current study, we estimated 5 million cells were sufficient to generate data meeting the requirements. It is to be noted the [1] room had an ACR = 10
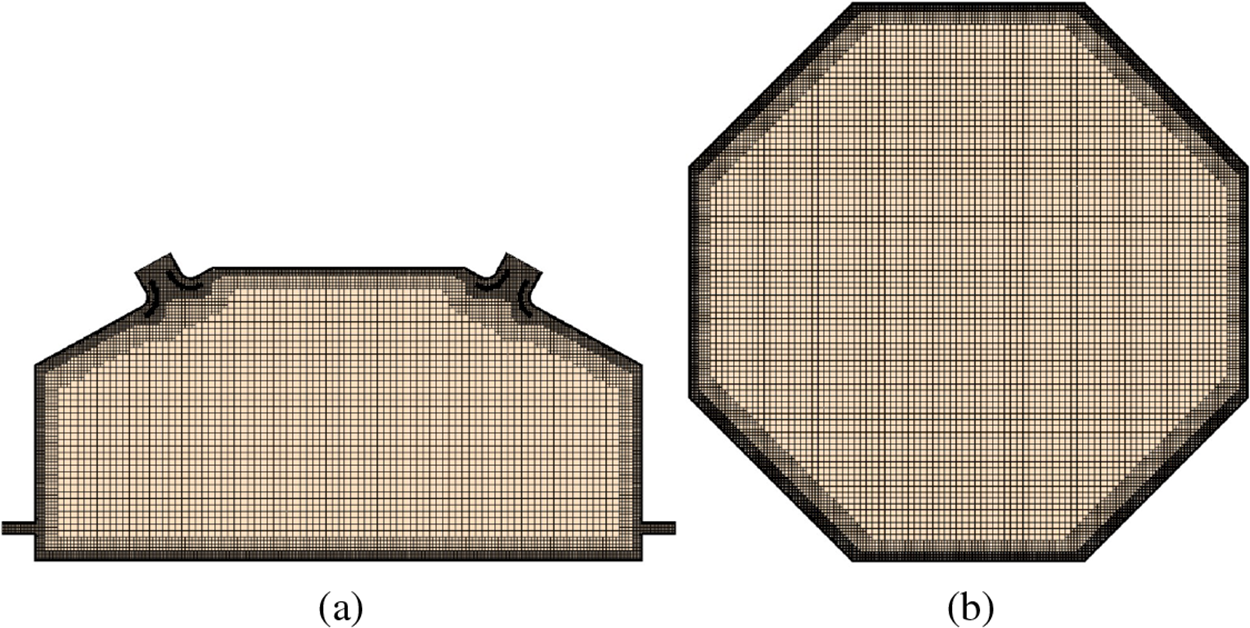
Figure 4: Mesh of the ‘empty’ CFD domain including the inlets (diffusers) and outlets, with 3 levels of refinement and a boundary layer mesh resolving the viscous sublayer. (a) Front view of a vertical
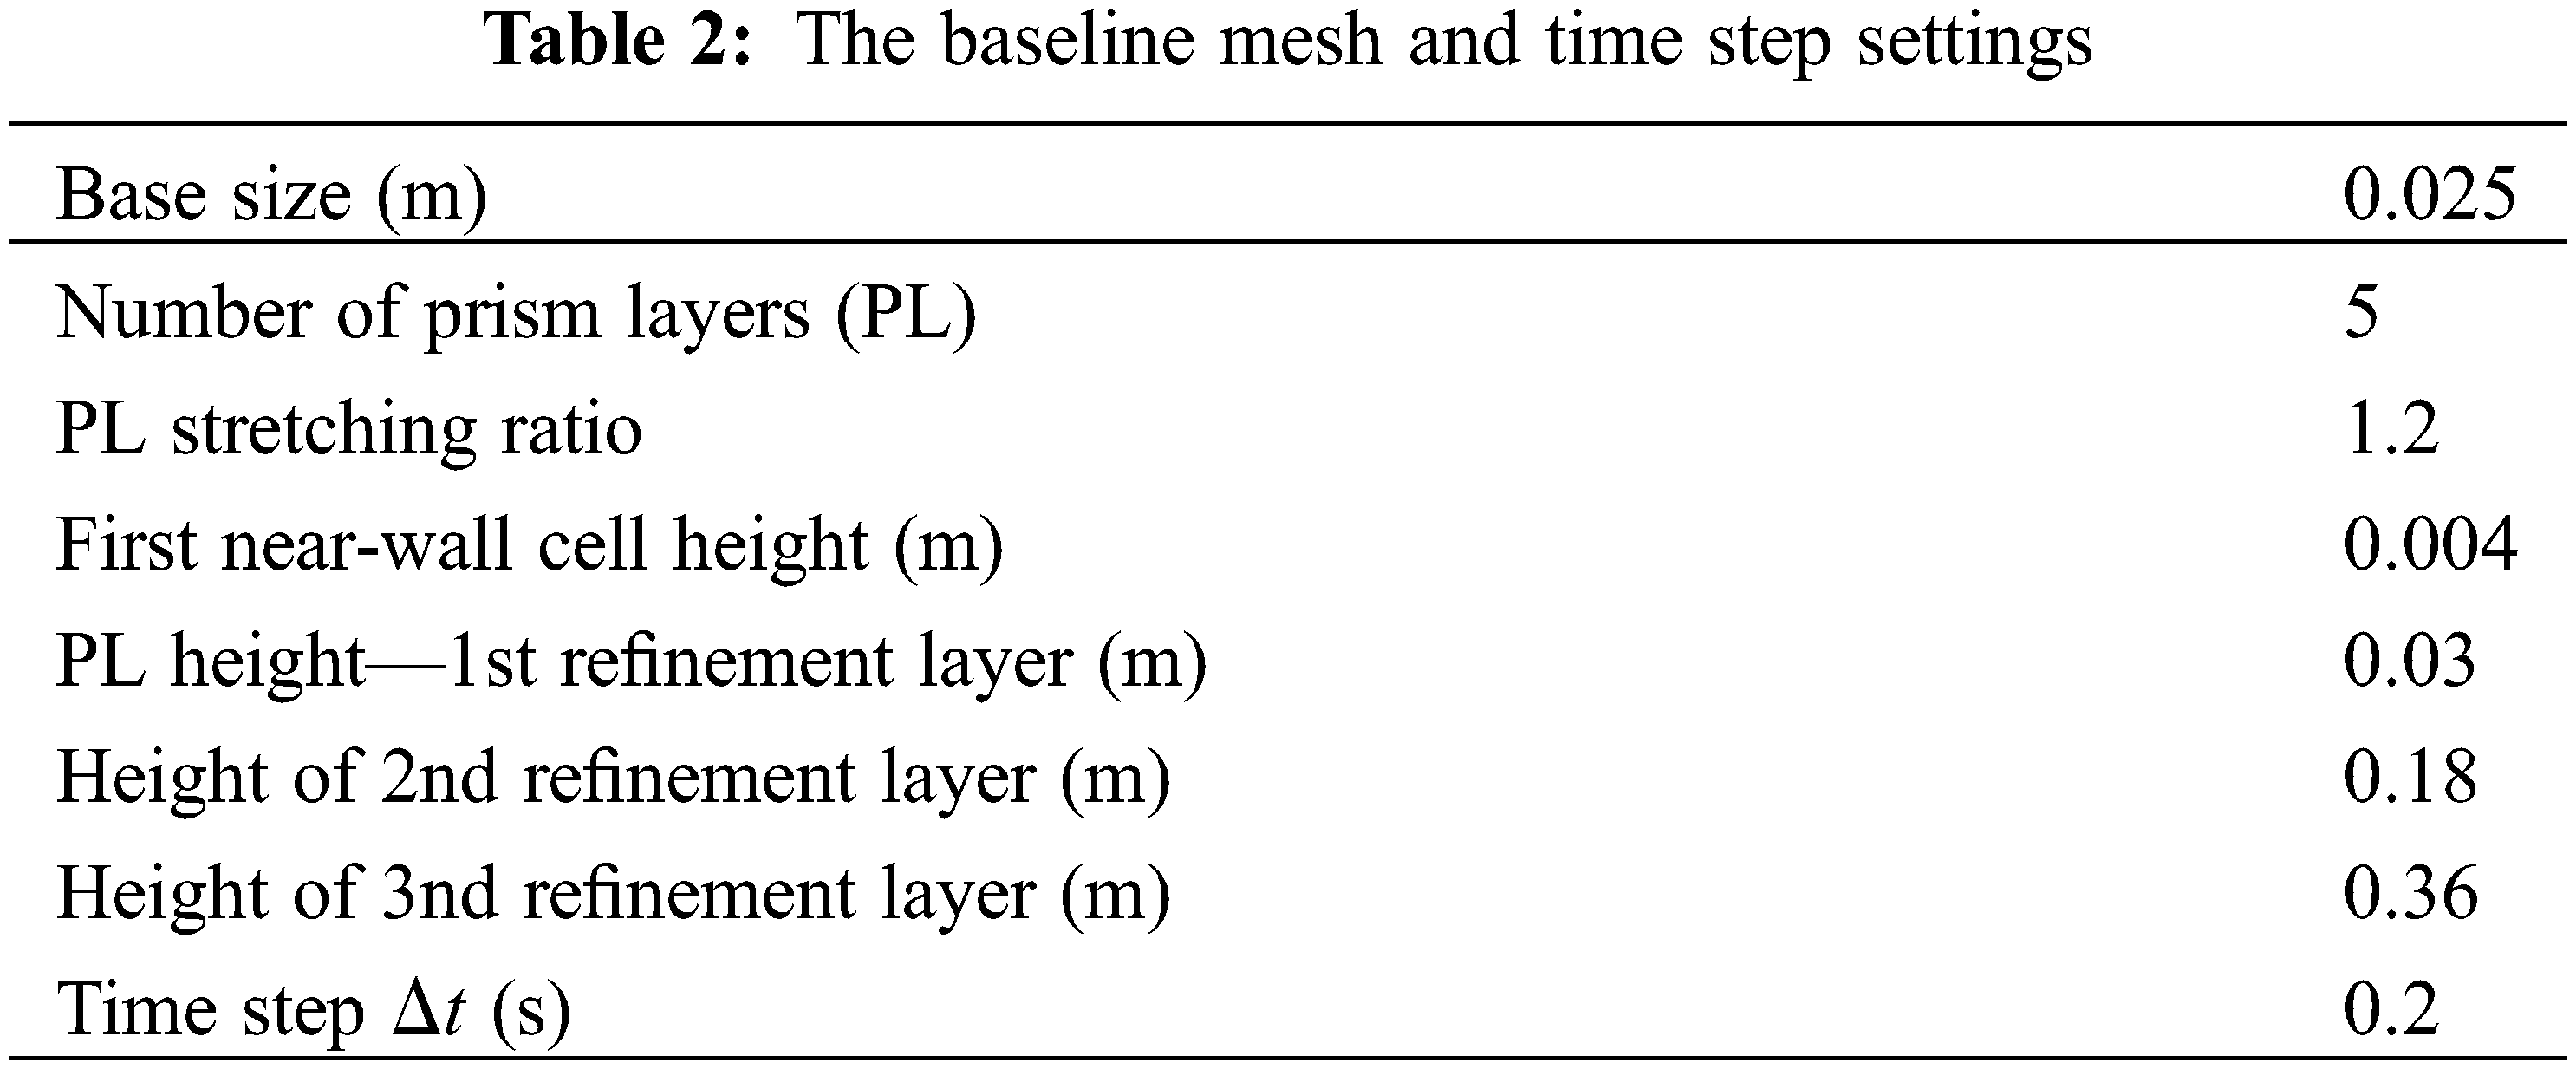
Table 2 shows the baseline mesh settings, with three levels of refinement in the near wall regions. The time step was set to meet the condition of CFL
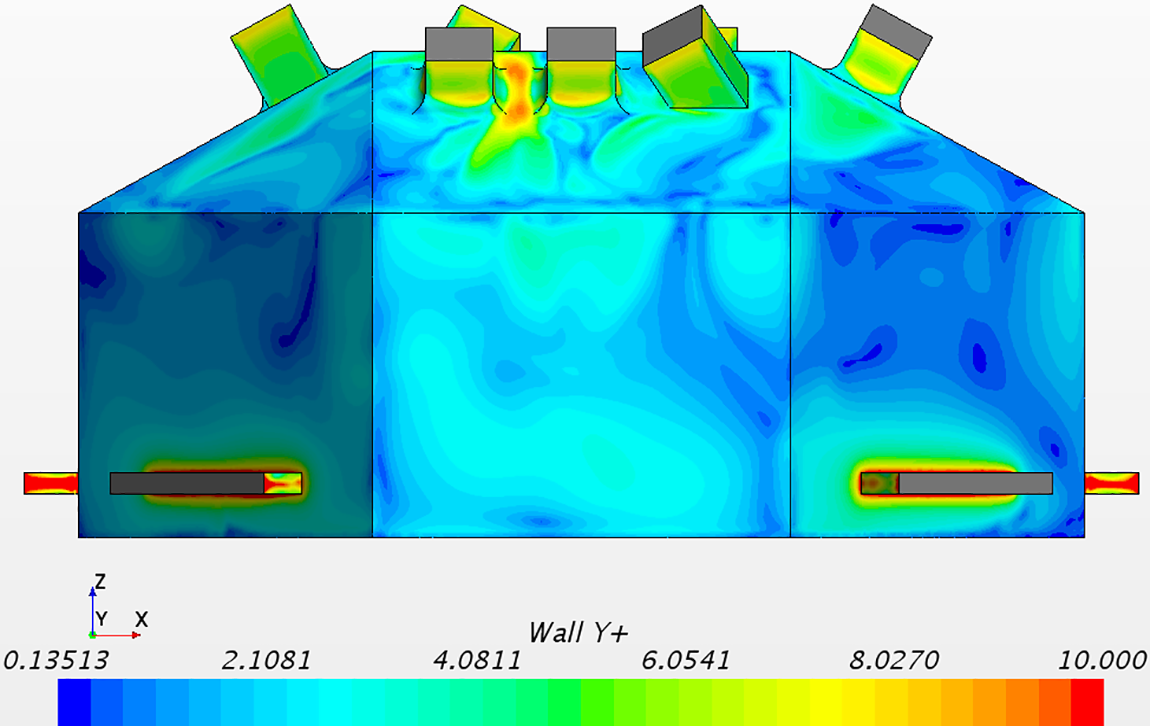
Figure 5: Dimensionless wall-normal resolution ‘
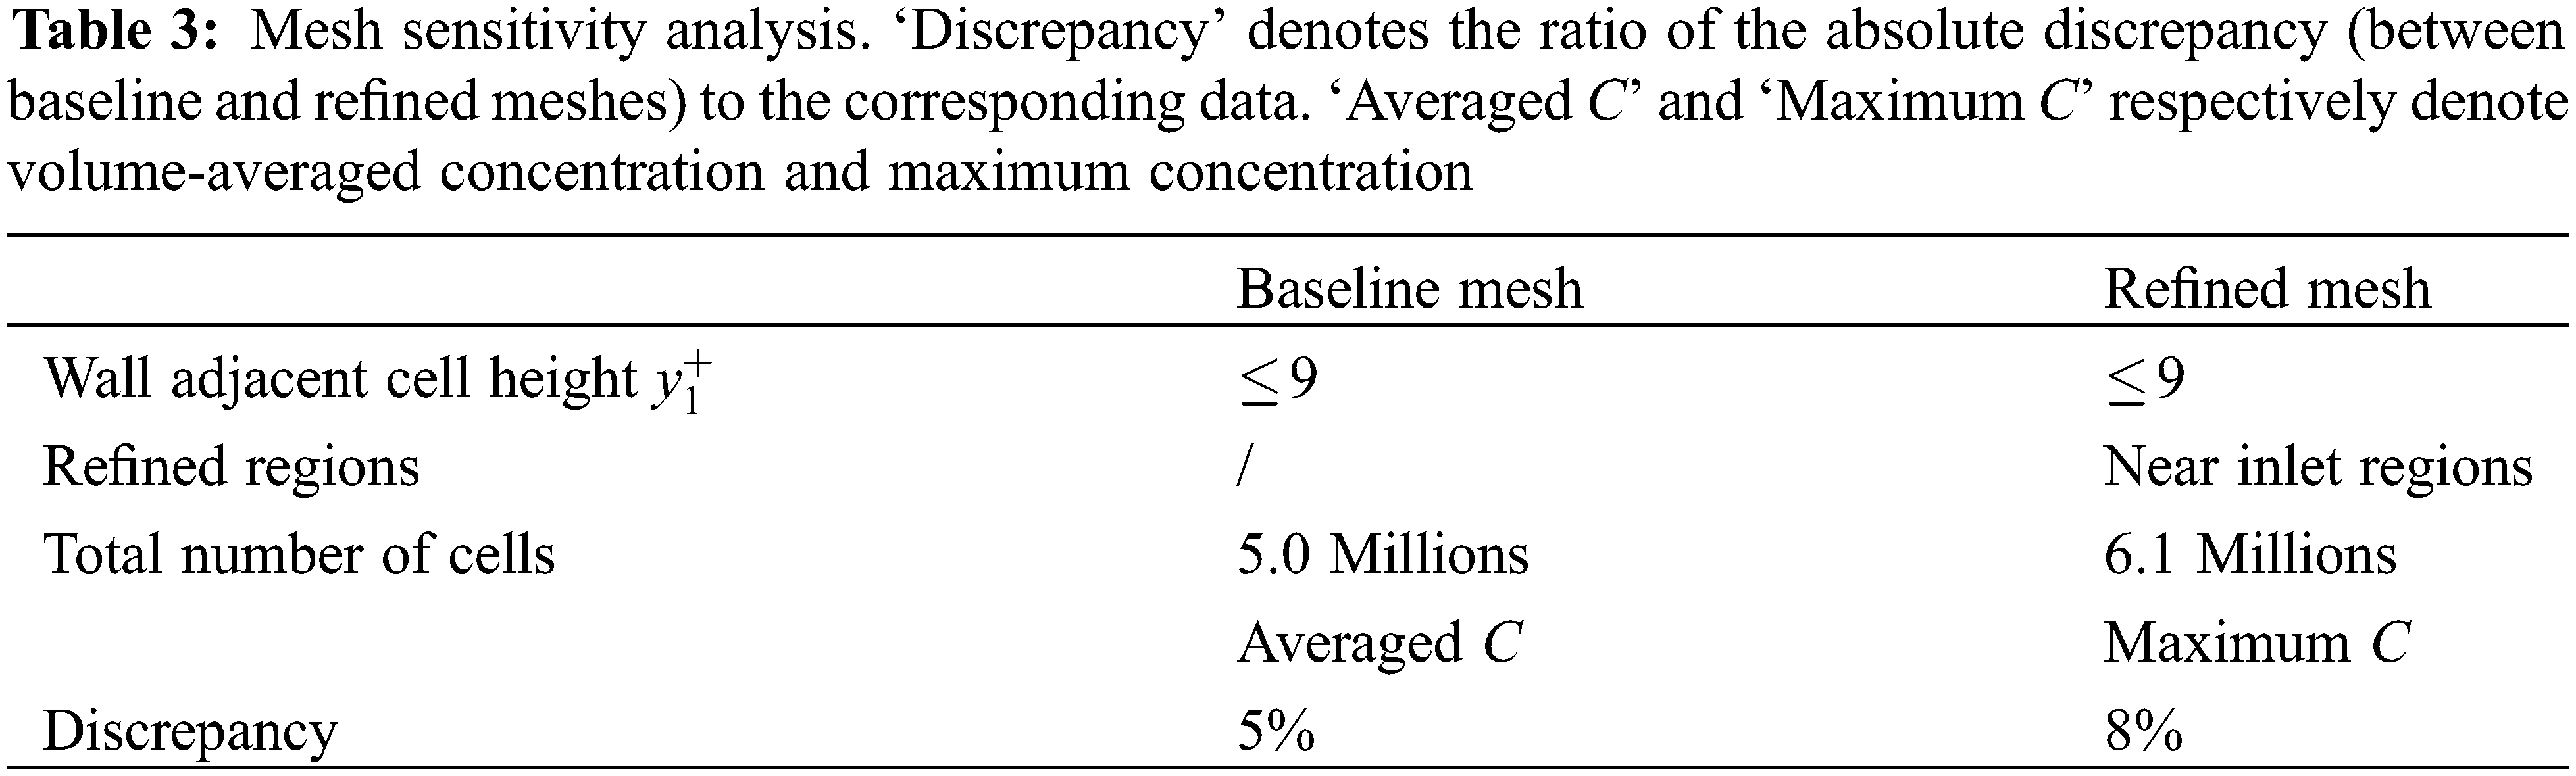
Besides the rigorous mesh sensitivity tests carried out in [2], we tested two mesh resolutions for one design configuration. Table 3 shows a mesh sensitivity analysis with a focus on the volume averaged concentration and the maximum concentration. After 6 min ventilation, the ratios of the absolute discrepancies in the room-volume averaged concentration and the maximum concentration to the corresponding data were 5% and 8%, respectively. Hereafter, the refined mesh was used for testing all designs.
We assessed the uncertainty due to the turbulent model. Given the resolution was close to the LES resolution in [2], an LES test based on the same mesh as the URANS was carried out to assess the discrepancy between the URANS and LES data (see details in Section 3.1). The effect on the cleanroom ventilation efficiency due to human motion disturbance was assessed (Section 4.1) by using the moving mesh approach, i.e., overset mesh. The uncertainties due to mesh resolution (Section 2.4), turbulent model (Section 3.1), thermal stratification, small objects in the cleanroom, and effectiveness of the filtering system, must be considered in the final design and the operation.
3 Baseline Room Simulations and Evaluation
The first part of this section is the assessment of URANS models for the portable cleanroom with a high ACR value, comparing with a well-established LES. The second part of this section is on the design of the inlet diffuser geometry and the location of the inlet, in order to optimise the ventilation efficiency.
3.1 Comparison between LES and URANS
To evaluate the URANS model, an LES was carried out based on the same mesh (i.e., the refined mesh). The refined mesh had a similar resolution to the early published work [2], e.g., with the viscous sublayer resolved. The flow and concentration fields were carefully examined, to ensure a cyclone-type flow being formed, and the pollutant being well mixed. Fig. 6 shows a comparison of flow field on a horizontal plane at
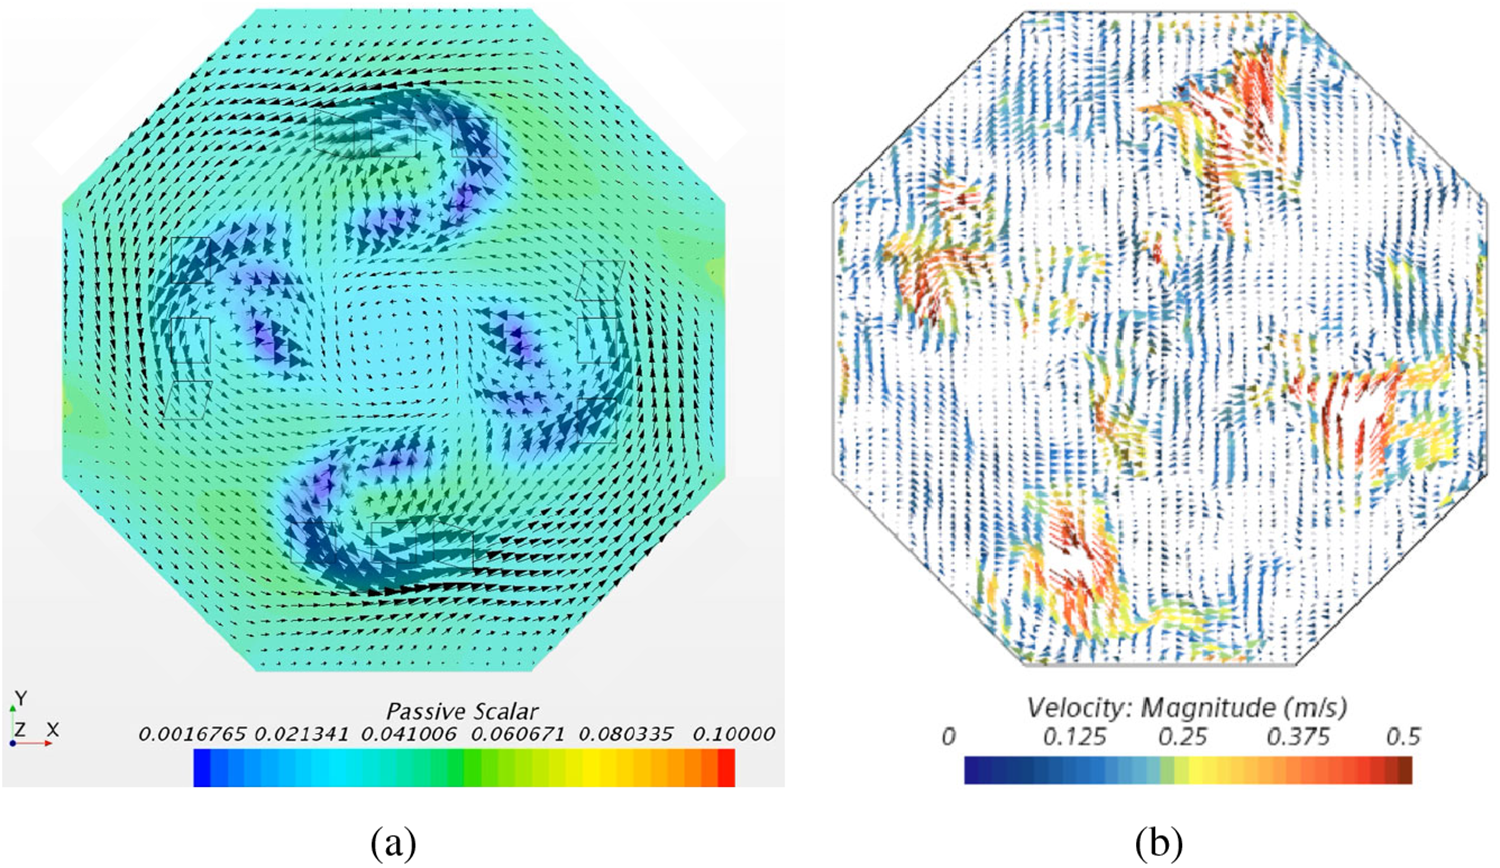
Figure 6: (a) URANS velocity vectors and scalar concentration at a horizontal plane at
The Q criterion was studied to check the flow field, defined as
Positive Q values identify rotation-dominated regions of the flow, while negative Q values identify shear-dominated regions of the flow. Fig. 7 shows a comparison of Q-criteria on a vertical
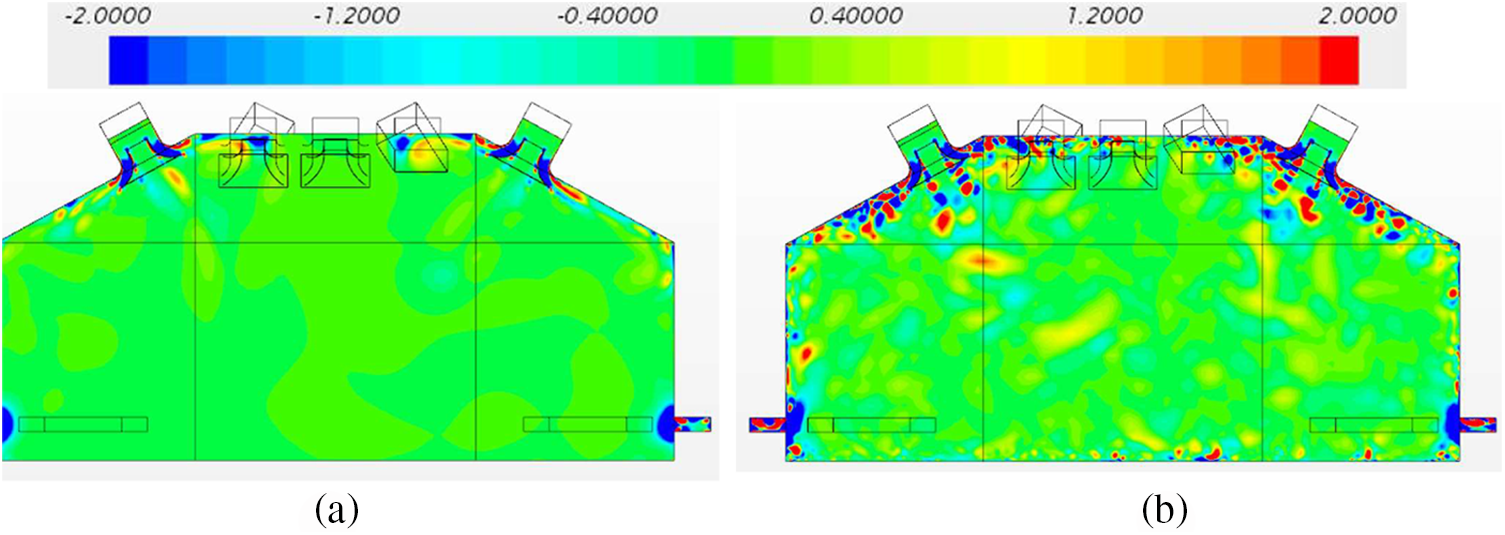
Figure 7: A comparison of Q-criteria on a vertical
Fig. 8 shows contours of instantaneous concentration on a vertical plane across the centre of the room after 6 mins ventilation. Both the LES and URANS data show evident effectiveness of the implemented diffusers. The LES data shows more isolated instantaneous pollutant clouds, while the RANS data shows more evenly distributed pollutant contours. Nevertheless, a consistency of the overall picture is evidently shown in Fig. 8. Quantitative comparison between URANS and LES was also carried out. Fig. 9 shows an excellent agreement of volume averaged concentration between the “Baseline room, LES” and the URANS “Baseline room, with diffuser”. The maximum (peak) concentration was also carefully examined. Fig. 10 shows a consistency of peak concentration between the “Baseline room, LES” and the URANS “Baseline room, with diffuser”. Both Figs. 9 and 10 suggest that URANS is a reliable tool for such applications. Given its higher efficiency compared to LES, the URANS was chosen in the rest of the study.
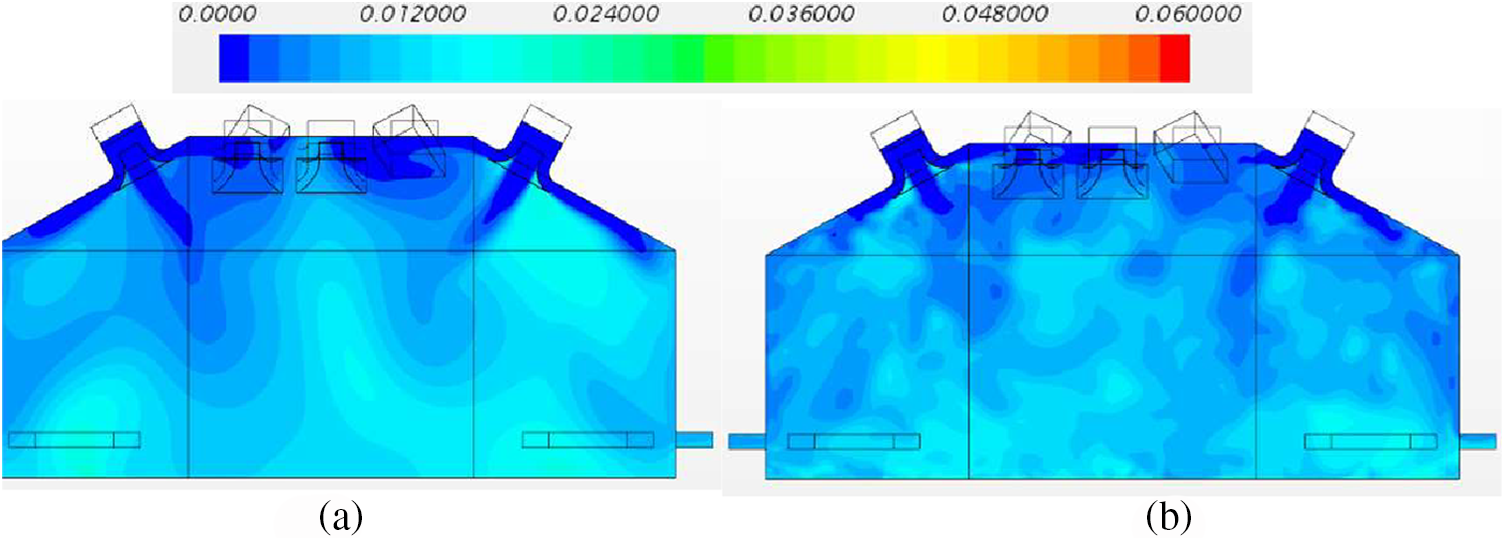
Figure 8: Instantaneous concentration on a vertical
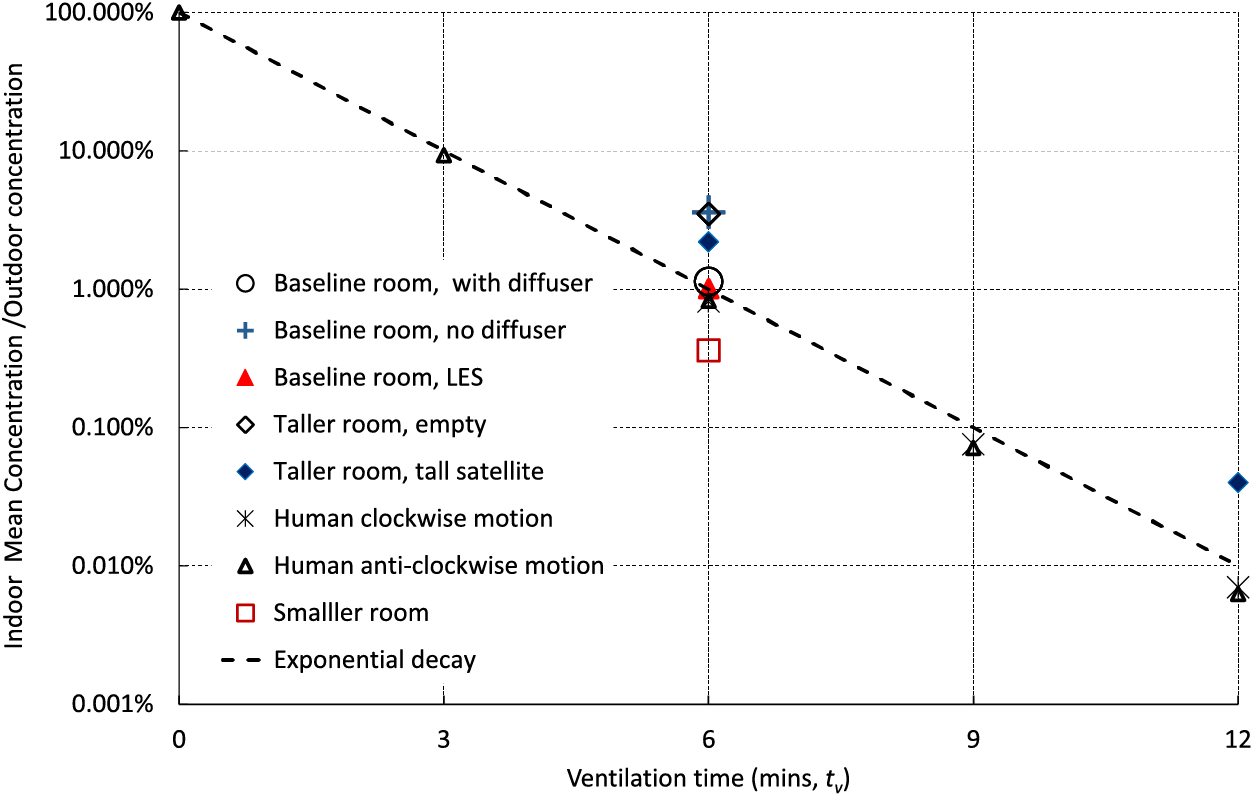
Figure 9: The ratio of cleanroom-volume averaged concentration to normal room concentration against the ventilation time
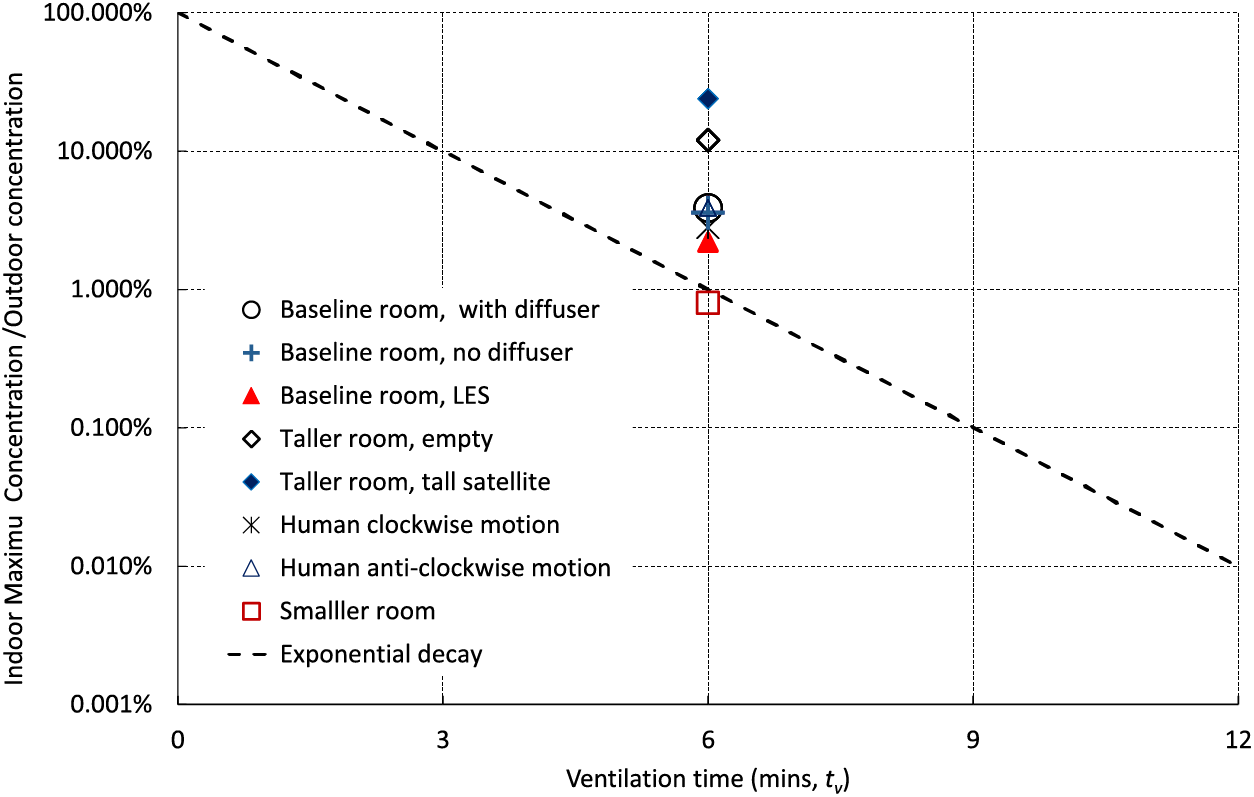
Figure 10: The ratio of cleanroom maximum concentration to the outdoor concentration at ventilation time
3.2 Identifying Optimum Location, Angle and Shape of the Inlets
A number of configurations of 12 inlet locations, and their various pitching angles were tested. The configuration shown in Fig. 3a was the most effective one to form a cyclone type flow. In particular we carried out tests to determine how inlet airflow could be distributed more effectively, leading to a more efficient air cycling. The baseline inlet design was adapted from the square design outlined in [32]. The central section was changed to allow the flow to have more momentum to reach deep into the room. Subsequent changes were made to help the flow spread across the ceiling panels. No diffuser was used on the pitched inlets (Fig. 3). This was to maintain the strength of the large scale rotation of the flow around the cleanroom. Fig. 9 presents a comparison of ventilation efficiency between “Baseline room, empty, no diffuser” and “Baseline room, empty, diffuser”, showing that the inclusion of diffusers increases efficiency by more than 3 times. Therefore, these diffusers were included in the rest of the tests.
4 Advanced Modelling Cleanroom
4.1 Disturbance of the Satellite and Human Motion
The disturbance of the satellite and human motion was assessed extensively. The ratio of the volume of the satellite model to the cleanroom was less than 1.5% (Figs. 3b and 11). However, the accommodation of the satellite model visibly improved the ventilation efficiency. This was likely because placing the satellite model at the centre of the room enhanced the airflow circulation around the room.
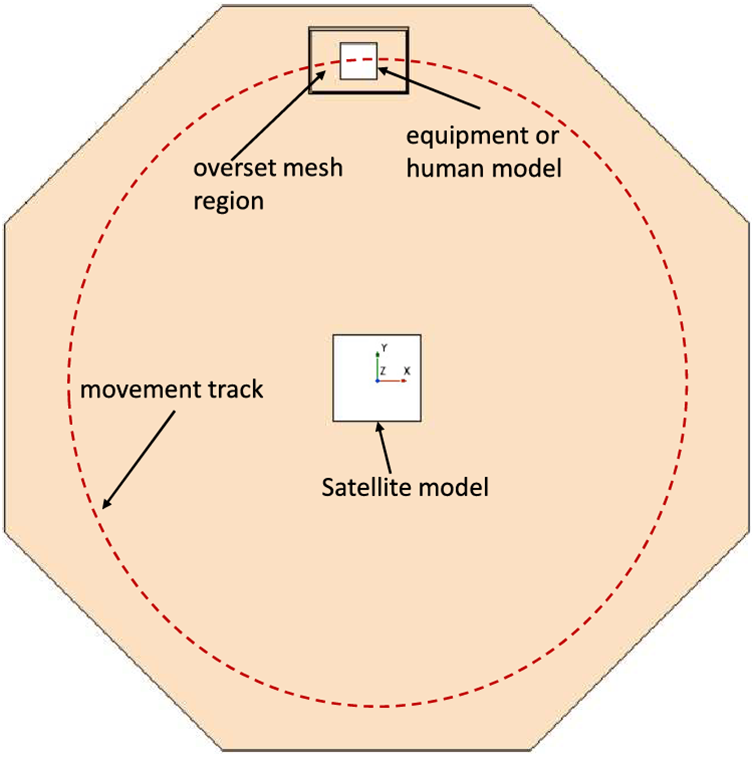
Figure 11: A sketch top view of the cleanroom ground with the overset mesh region (i.e., the human body region), the satellite model, and the moving equipment or human model (see Fig. 3b). The dashed line denotes the movement track
Fig. 11 shows a sketch top view of the cleanroom ground with the overset mesh region (i.e., the near human model region), the satellite model, and the moving human model (see Fig. 3b). The dashed line denotes the human motion track. The speed of the human motion is 0.75 m/s. The overset mesh [33] was used to simulate human motion either in clockwise or in anti-clockwise directions.
Fig. 9 shows that the impact of human motion on the effectiveness of ventilation at the ventilation time
These tests were to convert the cleanroom volume to include only three quadrants (i.e., the case “Smaller room, empty” shown in Figs. 9 and 12), while the same total flow rate was kept the same to achieve a high cleanliness level of ISO6 quicker than the baseline room. Fig. 9 shows that the volume-averaged concentration at
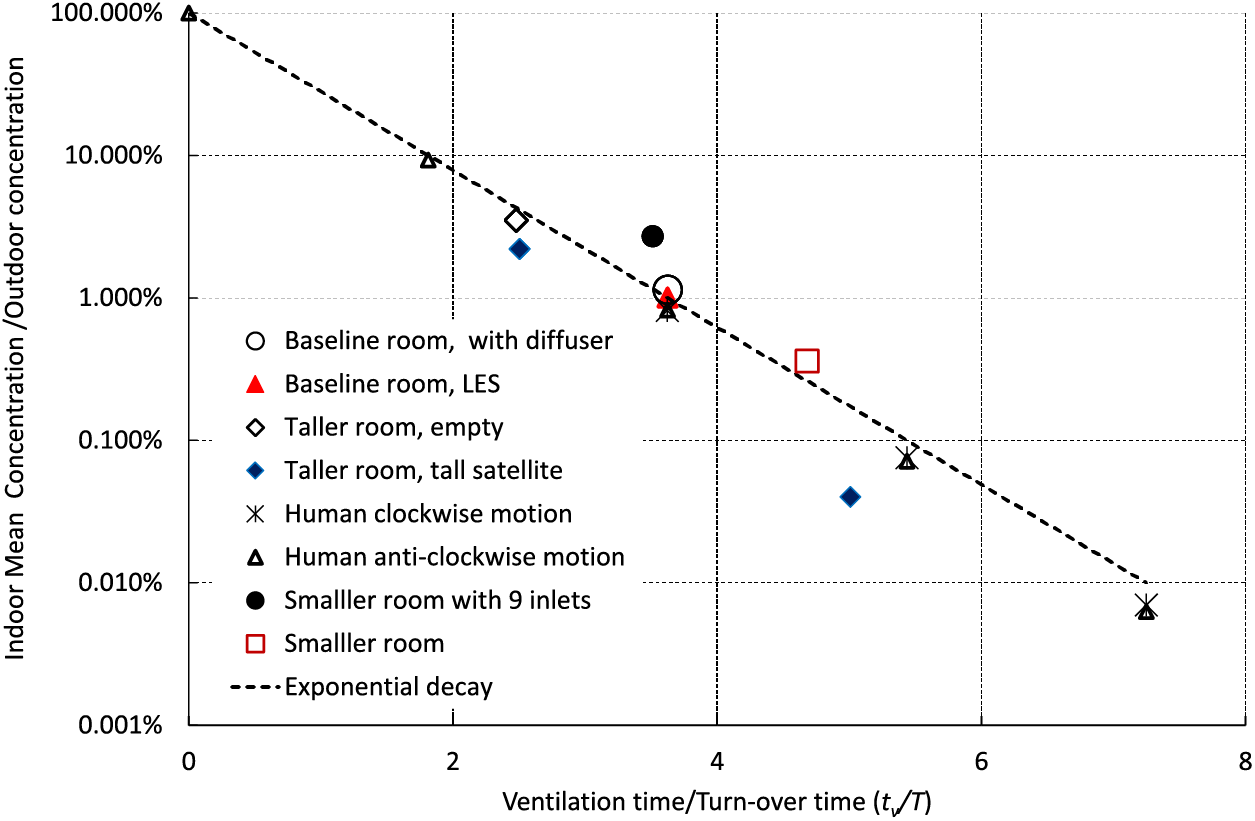
Figure 12: The ratio of cleanroom-volume averaged concentration to normal room concentration against dimensionless ventilation time
To produce more data for future designs, such as for different sizes of cleanroom and different inlet flow rates, a smaller flow rate was tested. The case “Smaller room with 9 inlets” shown in Fig. 12 had three quarters of the flow rate for the case ‘Smaller room, empty’, showing that different flow rates for the same cleanroom yield a consistent trend of cleanness level against dimensionless ventilation time.
4.3 Summary of the Tested Designs
This section summarises the tested designs with a focus on room volume averaged concentration and maximum concentration against dimensional ventilation time
The maximum concentration can be considered as another criterion for measuring the air quality and ventilation efficiency, albeit it is difficult to estimate accurately and should be used cautiously. Fig. 10 shows the ratio of cleanroom maximum concentration to the outdoor average concentration at ventilation time
Fig. 12 shows the ratio of cleanroom concentration to normal room concentration against dimensionless ventilation time
The vital concept is the design of the three-dimensional operational cleanroom with the specific inlet configuration. The entirety of the key design aspects consisting of the quasi-axisymmetric room, as well as the chamferred ceiling is critical to the product’s efficiency. Based on the constant exponential decay shown in Fig. 12, the ventilation rate can be estimated for a given cleanroom size, a required ISO level of cleanliness at a required ventilation time. A new cleanroom must have the similar configuration as the baseline cleanroom, including the configuration of the inlets. A change of the plan shape, the roof shape, or the height-width ratio of a cleanroom, deserves more cautious adjustment of the ventilation efficiency prediction. Nevertheless, Fig. 12 provides a baseline prediction.
The first test cleanroom in the study was the Plastron UK Standard Cleanroom Product, known as the Plastron PPF and which provided 75 square metres of operational floor space in an ISO8 environment with a 4.5 m ceiling limit. This operational environment equated to 287 cubic metres, which had to be filtered 10–25 times per hour in order to maintain constant ISO8 air cleanliness. The product was designed for hazardous testing and handling of spacecraft prior to launcher encapsulation. By using CFD on the Southampton local supercomputer IRIDIS5 to carry out a number of simulations of flow and PM dispersion, we have designed a prototype cleanroom, which meets the ISO8 standard. One special design with a smaller child section inside the parent cleanroom was able to meet the ISO6 standard.
The following concluding remarks have been drawn from the research: (1) it is critical to optimise the location and shape of the air intakes and their orientation angles, to balance pollutant convection and diffusion. (2) the URANS model is a cost-effective approach for assessing the efficiency of cleanroom with intensive mechanical ventilation. (3) the equipment or human motion inside the cleanroom can slightly improve ventilation efficiency, assuming they only occupy a small area of the cleanroom. (4) slightly increasing or reducing the cleanroom size, or changing the ventilation flow rate, does not significant affect the exponential decay rate of the pollutant concentration. (5) the ratio of volume-averaged concentration to outdoor concentration against the dimensionless ventilation time are in an exponential decay curve for all the tested cases, suggesting this curve can be used as an baseline for future new cleanroom designs. Based on this documented constant exponential decay of dimensionless concentration, the ventilation rate can be estimated for a given cleanroom size, a required ISO level of cleanliness at a required ventilation time. Nevertheless, if a change is to be made for the plan shape, the roof shape, or the height-width ratio of a cleanroom, a cautious adjustment is recommended for a prediction of the ventilation efficiency.
Acknowledgement: Computational work has been undertaken on Southampton University’s Iridis systems.
Funding Statement: The research was funded by Space Research and Innovation Network (www.sprint.ac.uk) for Technology Grants (OW131743P4V4M, OW131797P4V2B, ZX and CY). ZX is also grateful to NERC (www.nerc.ac.uk) for the Grant (NE/W002841/1, ZX) to complete the writing of the paper.
Author Contributions: The authors confirm contribution to the paper as follows: study conception: ZX, CY; cleanroom design: CY, CS, GS, MR; air management system design: CY, CS GS, MR; CFD simulations: MC, ZX; project management: ZX, CY, CS; data collection: MC, MR; analysis and interpretation of results: ZX, CY, MC, MR, CS, GS; draft manuscript preparation: ZX, MC, CY. All authors reviewed the results and approved the final version of the manuscript.
Availability of Data and Materials: Readers can access the data used in the study on request to the corresponding author ZX.
Conflicts of Interest: The authors declare that they have no conflicts of interest to report regarding the present study.
References
1. Nielsen, P. V. (1990). Specification of a two-dimensional test case: (IEA). Aalborg: Institut for Bygningsteknik, Aalborg Universitet. [Google Scholar]
2. Foat, T. G., Parker, S. T., Castro, I. P., Xie, Z. T. (2018). Numerical investigation into the structure of scalar plumes in a simple room. Journal of Wind Engineering and Industrial Aerodynamics, 175, 252–263. [Google Scholar]
3. Linden, P. F. (1999). The fluid mechanics of natural ventilation. Annual Review of Fluid Mechanics, 31(1), 201–238. [Google Scholar]
4. Papakonstantis, I. G., Hathway, E. A., Brevis, W. (2018). An experimental study of the flow induced by the motion of a hinged door separating two rooms. Building and Environment, 131, 220–230. [Google Scholar]
5. Khan, M. A. I., Delbosc, N., Noakes, C. J., Summers, J. (2015). Real-time flow simulation of indoor environments using lattice boltzmann method. Building Simulation, 8, 405–414. [Google Scholar]
6. Durrani, F., Cook, M. J., McGuirk, J. J. (2015). Evaluation of LES and RANS CFD modelling of multiple steady states in natural ventilation. Building and Environment, 92(3), 167–181. [Google Scholar]
7. Nielsen, P. V. (2015). Fifty years of CFD for room air distribution. Building and Environment, 91(3), 78–90. [Google Scholar]
8. van Hooff, T., Blocken, B., Tominaga, Y. (2017). On the accuracy of CFD simulations of cross-ventilation flows for a generic isolated building: Comparison of RANS, LES and experiments. Building and Environment, 114(4), 148–165. [Google Scholar]
9. Manolesos, M., Gao, Z., Bouris, D. (2018). Experimental investigation of the atmospheric boundary layer flow past a building model with openings. Building and Environment, 141(6458), 166–181. [Google Scholar]
10. Gough, H., Sato, T., Halios, C., Grimmond, C., Luo, Z. et al. (2018). Effects of variability of local winds on cross ventilation for a simplified building within a full-scale asymmetric array: Overview of the silsoe field campaign. Journal of Wind Engineering and Industrial Aerodynamics, 175, 408–418. [Google Scholar]
11. Higton, T. D., Burridge, H. C., Hughes, G. O. (2021). Natural ventilation flows established by a localised heat source in a room with a doorway and a high-level vent. Building and Environment, 203, 108093. [Google Scholar]
12. Kosutova, K., van Hooff, T., Vanderwel, C., Blocken, B., Hensen, J. (2019). Cross-ventilation in a generic isolated building equipped with louvers: Wind-tunnel experiments and CFD simulations. Building and Environment, 154(9), 263–280. [Google Scholar]
13. Parker, D., Burridge, H., Partridge, J., Hacker, J., Linden, P. (2021). Vertically distributed wall sources of buoyancy. Part 2. Unventilated and ventilated confined spaces. Journal of Fluid Mechanics, 907, A16. [Google Scholar]
14. Liu, F., Qian, H., Luo, Z., Zheng, X. (2021). The impact of indoor thermal stratification on the dispersion of human speech droplets. Indoor Air, 31(2), 369–382 [Google Scholar] [PubMed]
15. Li, Q., Liang, J., Wang, Q., Chen, Y., Yang, H. et al. (2022). Numerical investigations of urban pollutant dispersion and building intake fraction with various 3D building configurations and tree plantings. International Journal of Environmental Research and Public Health, 19(6), 3524 [Google Scholar] [PubMed]
16. Hu, S., Wu, Y., Liu, C. (1996). Measurements of air flow characteristics in a full-scale clean room. Building and Environment, 31(2), 119–128. https://doi.org/10.1016/0360-1323(95)00039-9 [Google Scholar] [CrossRef]
17. Tung, Y. C., Hu, S. C., Xu, T., Wang, R. H. (2010). Influence of ventilation arrangements on particle removal in industrial cleanrooms with various tool coverage. Building Simulation, 3, 3–13. [Google Scholar]
18. Sadrizadeh, S., Holmberg, S. (2015). Effect of a portable ultra-clean exponential airflow unit on the particle distribution in an operating room. Particuology, 18(9), 170–178. [Google Scholar]
19. Wagner, J. A., Greeley, D. G., Gormley, T. C., Markel, T. A. (2019). Comparison of operating room air distribution systems using the environmental quality indicator method of dynamic simulated surgical procedures. American Journal of Infection Control, 47(1), e1–e6 [Google Scholar] [PubMed]
20. Tan, H., Wong, K. Y., Othman, M. H. D., Kek, H. Y., Tey, W. Y. et al. (2022). Controlling infectious airborne particle dispersion during surgical procedures: Why mobile air supply units matter? Building and Environment, 223(6), 109489. [Google Scholar]
21. Sadeghian, P., Duwig, C., Sköldenberg, O., Tammelin, A., Hosseini, A. R. et al. (2022). Numerical investigation of the impact of warming blankets on the performance of ventilation systems in the operating room. Advances in Building Energy Research, 16(5), 589–611. [Google Scholar]
22. Tan, H., Wong, K. Y., Othman, M. H. D., Kek, H. Y., Nyakuma, B. B. et al. (2023). Why do ventilation strategies matter in controlling infectious airborne particles? A comprehensive numerical analysis in isolation ward. Building and Environment, 231(13), 110048. [Google Scholar]
23. Tan, H., Wong, K. Y., Othman, M. H. D., Nyakuma, B. B., Sheng, D. D. C. V. et al. (2023). Does human movement-induced airflow elevate infection risk in burn patient’s isolation ward? a validated dynamics numerical simulation approach. Energy and Buildings, 283(1), 112810. [Google Scholar]
24. ISO (2015). ISO 14644-1: 2015. Cleanrooms and associated controlled environments—Part 1: Classification of air cleanliness by particle concentration. ISO Geneva. [Google Scholar]
25. Xie, Z. T., Hayden, P., Robins, A. G., Voke, P. R. (2007). Modelling extreme concentrations from a source in a turbulent flow over a rough wall. Atmospheric Environment, 41(16), 3395–3406. [Google Scholar]
26. Santos, J. M., Reis, N., Castro, I., Goulart, E. V., Xie, Z. T. (2019). Using large-eddy simulation and wind-tunnel data to investigate peak-to-mean concentration ratios in an urban environment. Boundary-Layer Meteorology, 172(3), 333–350. [Google Scholar]
27. Foat, T. (2021). Modelling vapour transport in indoor environments for improved detection of explosives using dogs (Ph.D. Thesis). University of Southampton. [Google Scholar]
28. Crank, J. (1979). The mathematics of diffusion. USA: Oxford University Press. [Google Scholar]
29. Shih, T. H., Liou, W. W., Shabbir, A., Yang, Z., Zhu, J. (1995). A new k-ε viscosity model for high reynolds number turbulent flows. Computers & Fluids, 24(3), 227–238. [Google Scholar]
30. Nicoud, F., Ducros, F. (1999). Subgrid-scale stress modelling based on the square of the velocity gradient tensor. Flow, Turbulence and Combustion, 62(3), 183–200. [Google Scholar]
31. Xie, Z. T., Castro, I. P. (2006). LES and RANS for turbulent flow over arrays of wall-mounted obstacles. Flow, Turbulence and Combustion, 76(3), 291–312. [Google Scholar]
32. Mohammed, R. H. (2013). A simplified method for modeling of round and square ceiling diffusers. Energy and Buildings, 64(1), 473–482. [Google Scholar]
33. Oxyzoglou, I., Xie, Z. T. (2020). Effects of heaving motion on the aerodynamic performance of a double element wing in ground effect. Fluid Dynamics & Material Processing, 16(6), 1093–1114. [Google Scholar]
Cite This Article
 Copyright © 2024 The Author(s). Published by Tech Science Press.
This work is licensed under a Creative Commons Attribution 4.0 International License , which permits unrestricted use, distribution, and reproduction in any medium, provided the original work is properly cited.
 Downloads
 Citation Tools