
 Submit a Paper
 Propose a Special lssue
 Open Access
ARTICLE

Numerical Investigation of Combined Production of Natural Gas Hydrate and Conventional Gas
1 School of Petroleum Engineering, China University of Petroleum (East China), Qingdao, 266580, China
2 CPOE Research Institute of Engineering Technology, Tianjin, 300451, China
3 CNPC Offshore Engineering Company Limited, Beijing, 100028, China
* Corresponding Author: Shuxia Li. Email:
(This article belongs to the Special Issue: Solid, Fluid, and Thermal Dynamics in the Development of Unconventional Resources )
Fluid Dynamics & Materials Processing 2024, 20(3), 505-523. https://doi.org/10.32604/fdmp.2023.030604
Received 14 April 2023; Accepted 27 June 2023; Issue published 12 January 2024
 View Full Text
 Download PDF
Abstract
Natural gas hydrate (NGH) is generally produced and accumulated together with the underlying conventional gas. Therefore, optimizing the production technology of these two gases should be seen as a relevant way to effectively reduce the exploitation cost of the gas hydrate. In this study, three types of models accounting for the coexistence of these gases are considered. Type A considers the upper hydrate-bearing layer (HBL) adjacent to the lower conventional gas layer (CGL); with the Type B a permeable interlayer exists between the upper HBL and the lower CGL; with the type C there is an impermeable interlayer between the upper HBL and the lower CGL. The production performances associated with the above three models are calculated under different conditions, including only a depressurized HBL (only HBL DP); only a depressurized CGL (only CGL DP); and both the HBL and the CGL being depressurized (HBL + CGL DP). The results show that for Type A and Type B coexistence accumulation models, when only HBL or CGL is depressurized, the gas from the other layer will flow into the production layer due to the pressure difference between the two layers. In the coexistence accumulation model of type C, the cumulative gas production is much lower than that of Type A and Type B, regardless of whether only HBL DP, only CGL DP, or HBL + CGL DP are considered. This indicates that the impermeable interlayer restricts the cross-flow of gas between HBL and CGL. For three different coexistence accumulation models, CGL DP has the largest gas-to-water ratio.Keywords
Nomenclature
| | Density of water, kg/m3 |
| | Density of gas, kg/m3 |
| | Density of hydrate, kg/m3 |
| | Density of rock, kg/m3 |
| | Absolute permeability, μm2 |
| | Relative permeability of water phase |
| | Relative permeability of gas phase |
| | Viscosity of water, mPa⋅s |
| μg | Viscosity of gas, mPa⋅s |
| | Pressure of water, Mpa |
| | Pressure of gas, MPa |
| | Amounts of water injected or produced, kg/(m3⋅s) |
| | Amounts of gas injected or produced, kg/(m3⋅s) |
| | Saturation of water |
| | Saturation of gas |
| | Saturation of hydrate |
| | Mass of dissociated water, kg/(m3⋅s) |
| | Mass of dissociated gas, kg/(m3⋅s) |
| | Mass of hydrate decomposition, kg/(m3⋅s) |
| | Porosity |
| | Specific heat of rock, J/(kg⋅K) |
| | Specific heat of water, J/(kg⋅K) |
| | Specific heat of methane, J/(kg⋅K) |
| | Specific heat of hydrate, J/(kg⋅K) |
| | Thermal conductivity of sediment, W/(m⋅K) |
| | Thermal conductivity of water, W/(m⋅K) |
| | Thermal conductivity of methane, W/(m⋅K) |
| | Thermal conductivity of hydrate, W/(m⋅K) |
| | Heat absorbed per mole of hydrate decomposition, J/mol |
| | Temperature, K |
| | Amount of hydrate at time t, mol |
| | Apparent rate factor of hydrate decomposition, mol/(m2 Pa⋅s) |
| | Surface area of spherical hydrate particles, m2 |
| | Hydrate phase equilibrium pressure, Pa |
| | Decomposition activation energy, 78300 J/mol |
| | Ideal gas constant, 8.3144 J/(mol⋅K) |
| | Latent heat of phase transition, J/mol |
| | The maximum relative permeability of gas |
| | The maximum relative permeability of water |
| | Residual gas saturation |
| | Residual water saturation |
| | The index fitting parameter of gas phase |
| | The index fitting parameter of water phase |
| | Bottom boundary temperature of hydrate-bearing layer, K |
| | Geothermal gradient, K/m |
| | Bottom boundary pressure of hydrate-bearing layer, MPa |
| | Gravitational acceleration, m/s2 |
Natural gas hydrate (NGH) is a mixture of natural gas and water formed under conditions of low temperature and high pressure that is widely distributed in the global ocean and permafrost. It is considered the preferred alternative energy in the 21st century due to its abundant resources [1]. Therefore, the exploitation of NGHs has become a hot topic around the world.
Several trial productions of NGH have been conducted using different methods in the last two decades. These include using depressurization and thermal stimulation methods in Mallik [2,3], using depressurization and CO2 exchange methods in Alaska [4], using depressurization in Nankai Trough [5,6], and depressurization in Shenhu [7,8]. With the successful implementation of hydrate production trials, there has been a great breakthrough in cumulative gas production and duration of production tests. However, it is still far from being considered commercial exploitation [9]. The only practical produced gas hydrate reservoirs in the world are in Messoyakha, which have been exploited with the underlying conventional gas and have attracted considerable attention [10,11].
In recent years, many researchers have found that the large amount of natural gas leaking from conventional gas reservoirs provides the gas source for shallow NGH accumulations. There is a spatial coexistence accumulation relationship between the shallow NGH and conventional gas reservoirs [12,13]. Collett et al. [14] proposed the concept of a gas-hydrate petroleum system and explained the formation of gas hydrate accumulation from the perspective of a petroleum system. The NGH in Green Canyon of the Gulf of Mexico is closely related to the large-scale gas seepage from the lower conventional gas reservoir, where leaking gas accumulates to form gas hydrates under suitable pressure and temperature conditions, creating a capping effect on the lower reservoir and preventing further gas leakage [15–17]. The gas source of gas hydrate and gas reservoir in the Ulleung Basin of South Korea are both biogenic [18]. The Beaufort-Mackenzie Delta Basin in Canada is different as it is thermogenic hydrocarbon gas [19,20]. Deepwater oil and gas reservoirs and gas hydrates in the Northern South China Sea have a longitudinal symbiotic combination, and there are a large number of gas chimneys, active fractures, deep water channels, and submarine landslides in the basin, which have caused a large amount of gas leakage from the lower gas reservoir and provided a rich gas source for the upper gas hydrate accumulation [21–23]. Gas hydrates and conventional gas in the Qiongdongnan basin of the South China Sea are also characterized by a symbiotic system [24–26]. The shallow NGH accumulations and conventional gas reservoirs coexist geologically [27].
Therefore, the combined production of the NGH and conventional gas, which are closely connected in space and time, can not only fully utilize resources but also produce various gases [28]. Some experiments have confirmed that the presence of underlying gas can enhance the exploitation potential and gas recovery of hydrate reservoirs [29,30]. And the dual gas co-production has higher gas production efficiency and lower temperature drop to maintain the driving force of hydrate decomposition [31]. Moreover, numerical simulations have revealed that reservoir permeability has a significant effect on combined production [32]. However, only preliminary research has been conducted for the geological model with the coexistence of hydrate and conventional gas layers, while the production performance under different geological models of coexisting accumulation has been little investigated.
In this paper, three geological models of the coexistent accumulation of the upper hydrate-bearing layer (HBL) and the lower conventional gas layer (CGL) were established using the CMG-STARS simulator. The gas production performances of different depressurization cases were compared, including only depressurized in the hydrate-bearing layer (only HBL DP), only depressurized in the conventional gas layer (only CGL DP), and both depressurized in the hydrate-bearing layer and the conventional gas layer (HBL + CGL DP). The production performance of different geological models with different depressurization cases was analyzed, and then the production capacity contribution of different layers was discussed. This study can provide reference and guidance for the combined production of NGH and conventional gas and promote the industrialization of NGH.
Numerical simulation is an effective method to accurately predict the dynamics of gas production from hydrate reservoirs. Some numerical simulators, such as TOUGH+HYDRATE [33], HydrateResSim [34,35], STOMP-HYD [36,37], MH-21 HYDRAS [38], CMG-STARS [39,40], have been successfully verified for accuracy by international code comparison [41]. Among them, CMG-STARS is a relatively mature simulator. It contains the kinetic parameters of the Kim-Bishnoi equation that can establish the dissociation of heat and thermodynamics of the hydrate, and has been confirmed for its accuracy and suitability by many researchers [42–44].
Three components were considered in the model, respectively, hydrate, gas, and water. The model’s assumptions were that (1) NGH was an immobile solid phase that was dissociated into gas and water by depressurization and (2) the flow of gas and water conformed to Darcy’s law. As the decomposition of hydrate is an endothermic process, this model considered the non-isothermal reaction of the reservoir, the change of hydrate phase equilibrium, and heat transfer mechanisms such as heat conduction and heat convection. The kinetic equations of the hydrate formation and decomposition reactions were modified in CMG-STARS to calculate the dissociation of the natural gas hydrate.
The mass conservation equations of each component are as follows:
The energy conservation equation is as follows:
where Ceff and λeff are as follows:
The phase equilibrium of NGH is determined by pressure and temperature. In the model, the K value was used to determine the hydrate phase equilibrium. And the relationship between the K value and phase equilibrium was experimentally established by Liu et al. [45], as given in Eq. (7).
where k1, k2, k3 are three phase equilibrium constants, which can be obtained by fitting the phase equilibrium curve of NGH.
The classical Kim-Bishnoi kinetics model was used to calculate the dissociation rate of NGH, and the apparent decomposition rate constant factor and decomposition activation energy were introduced. Assuming that the hydrate exists as spherical particles in the porous medium, the dissociation rate of NGH is as follows [43]:
The latent heat equation for the phase change of hydrate is as follows:
When
The saturation equation and the relative permeability model are as follows:
3 Numerical Simulation of Combined Production of NGH and Conventional Gas Reservoir
3.1 Geological Models of Different Coexistence Accumulation
According to the coexistent accumulation relationship between NGH and conventional gas reservoirs, three different geological models were established from the perspective of production, as shown in Fig. 1. Type A is a hydrate-bearing layer (HBL) directly adjacent to the conventional gas layer (CGL); Type B is a permeable interlayer that exists between the HBL and the CGL; and the interlayer of Type C is an impermeable layer.
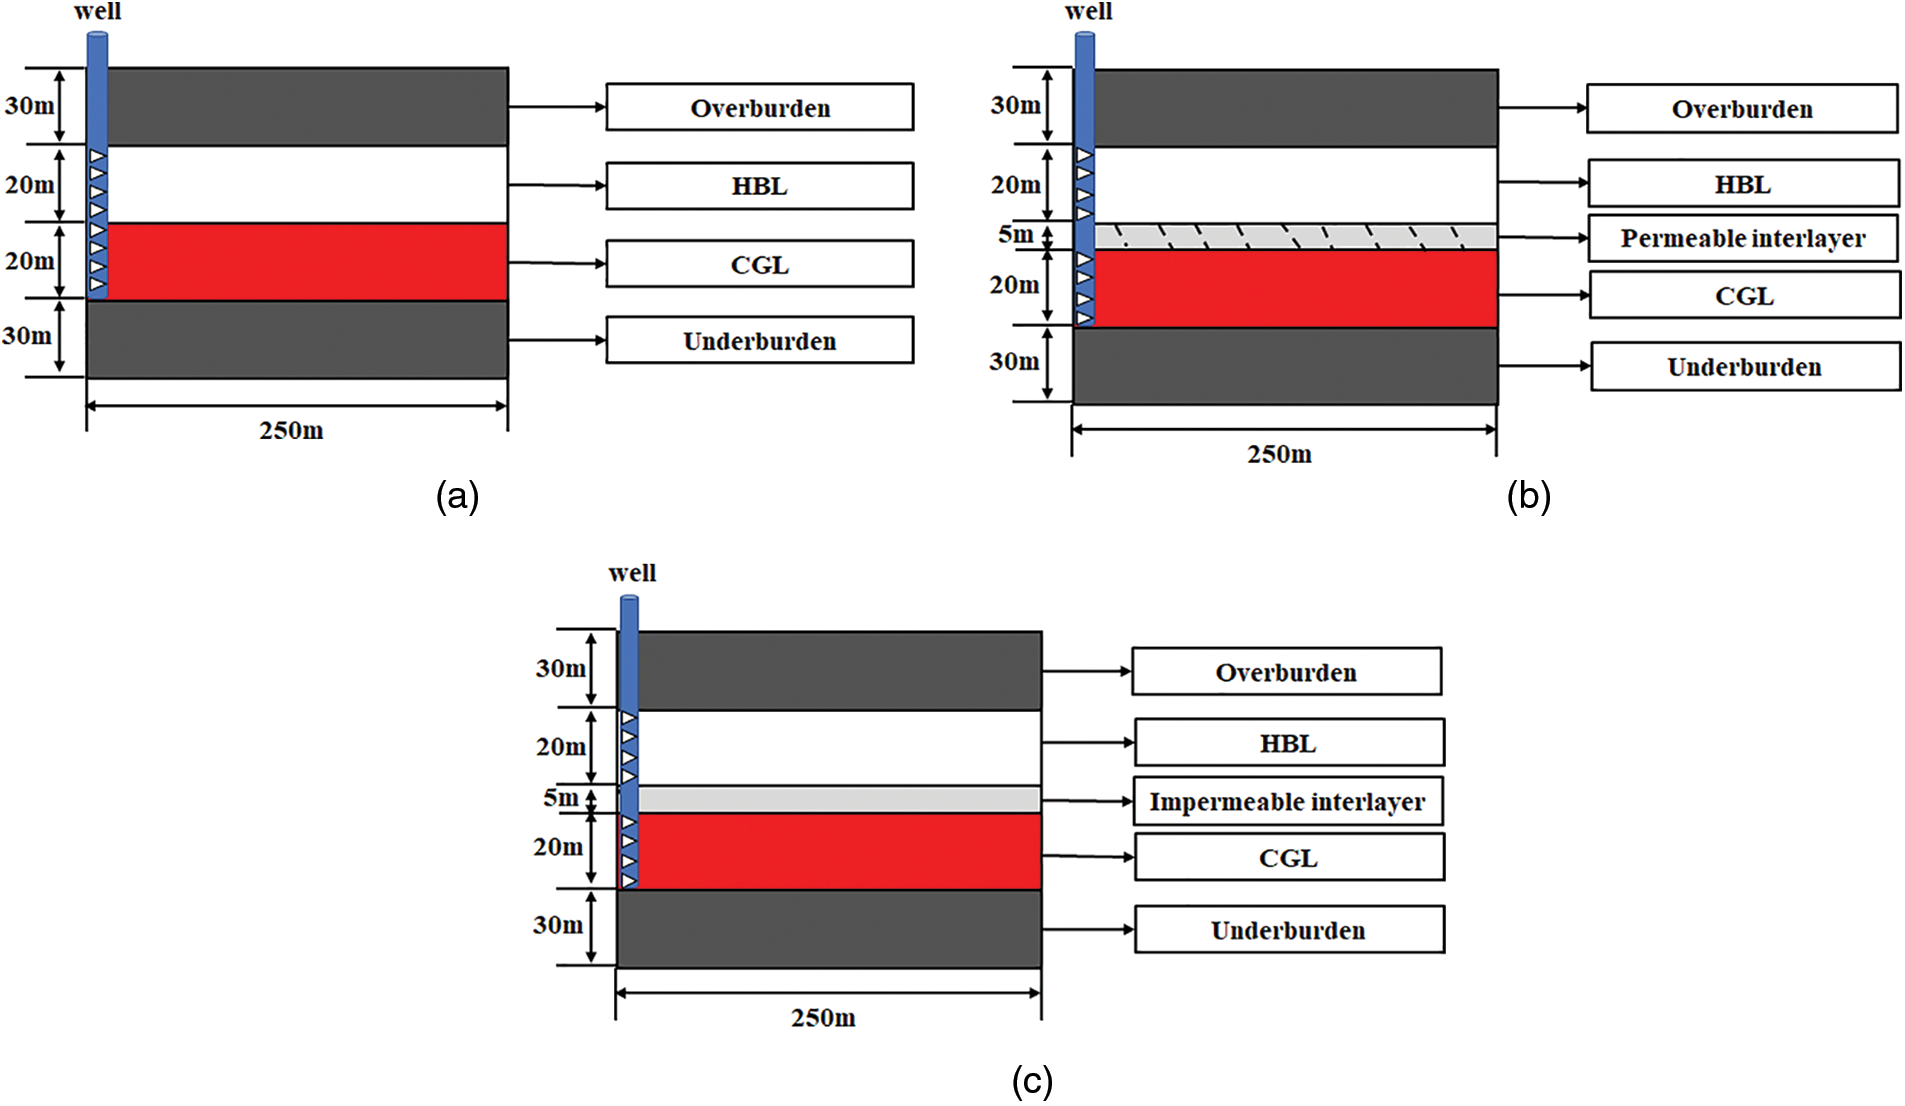
Figure 1: Schematic diagram of three geological models: (a) Type A, (b) Type B, and (c) Type C
Based on the geological models, a numerical simulation model for the combined production of NGH and conventional gas was established. It was assumed that the entire model plane was homogeneous, so the production performance was axisymmetric with the production well at the center. A vertical production well was placed in one corner of the model to simulate 1/4 production performance. Taking Type A as an example, the grid division is shown in Fig. 2. It was assumed that the depth at the top of the model was 1400 m, and the size of the model was 250 m × 250 m × 100 m, including the overburden, hydrate-bearing layer, conventional gas layer, and the underburden. In the x and y directions, it has been divided into 33 grids and the grid size has increased gradually away from the well, specifically being divided into 4 m × 1 m, 4 m × 4 m, 5 m × 6 m, and 20 m × 10 m. In the z direction, it has been divided into 40 grids. Among them, the thickness of both overburden and underburden was 30 m, uniformly divided into five grids. The thickness of the hydrate-bearing layer was 20 m, uniformly divided into 20 grids. The thickness of the gas layer was 20 m, uniformly divided into ten grids.
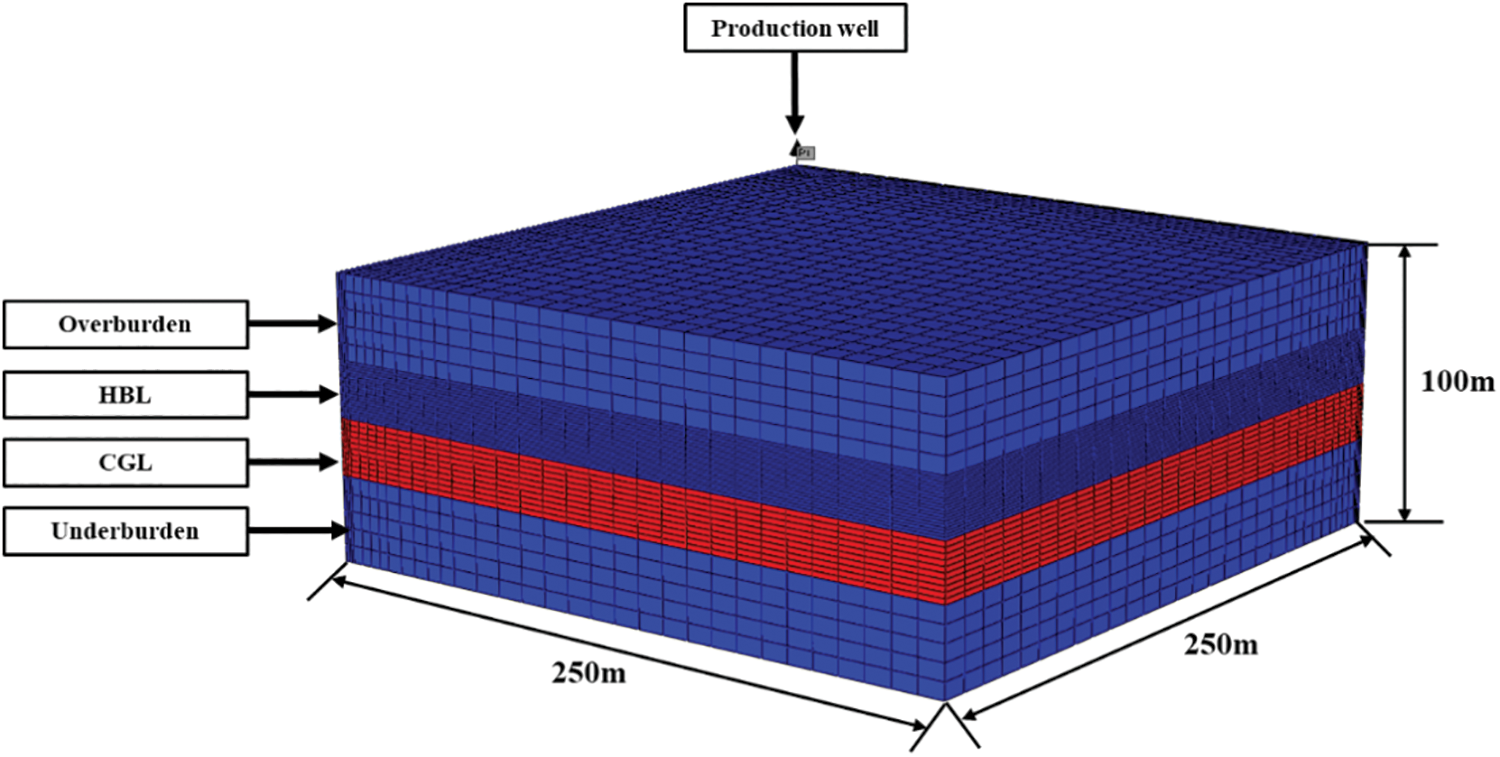
Figure 2: Geological system and grid discretization of the numerical simulation model for Type A
The model adopted a closed boundary, and the initial temperature distribution of the reservoir was calculated by the geothermal gradient equation:
The initial pressure distribution in the reservoir is hydrostatic pressure, which was calculated as follows:
Compared with the Type A geological model, the Types B and C models had a 5 m interlayer between HBL and CGL with porosity of 0.4, gas saturation of 0.2, and water saturation of 0.8. Assuming that the interlayer of Type B was a permeable layer, the permeability was selected as the middle value of 7.5 × 10⁻³ μm2 between the hydrate layer and gas layer. The interlayer of Type C was set to 0 for the impermeable interlayer.
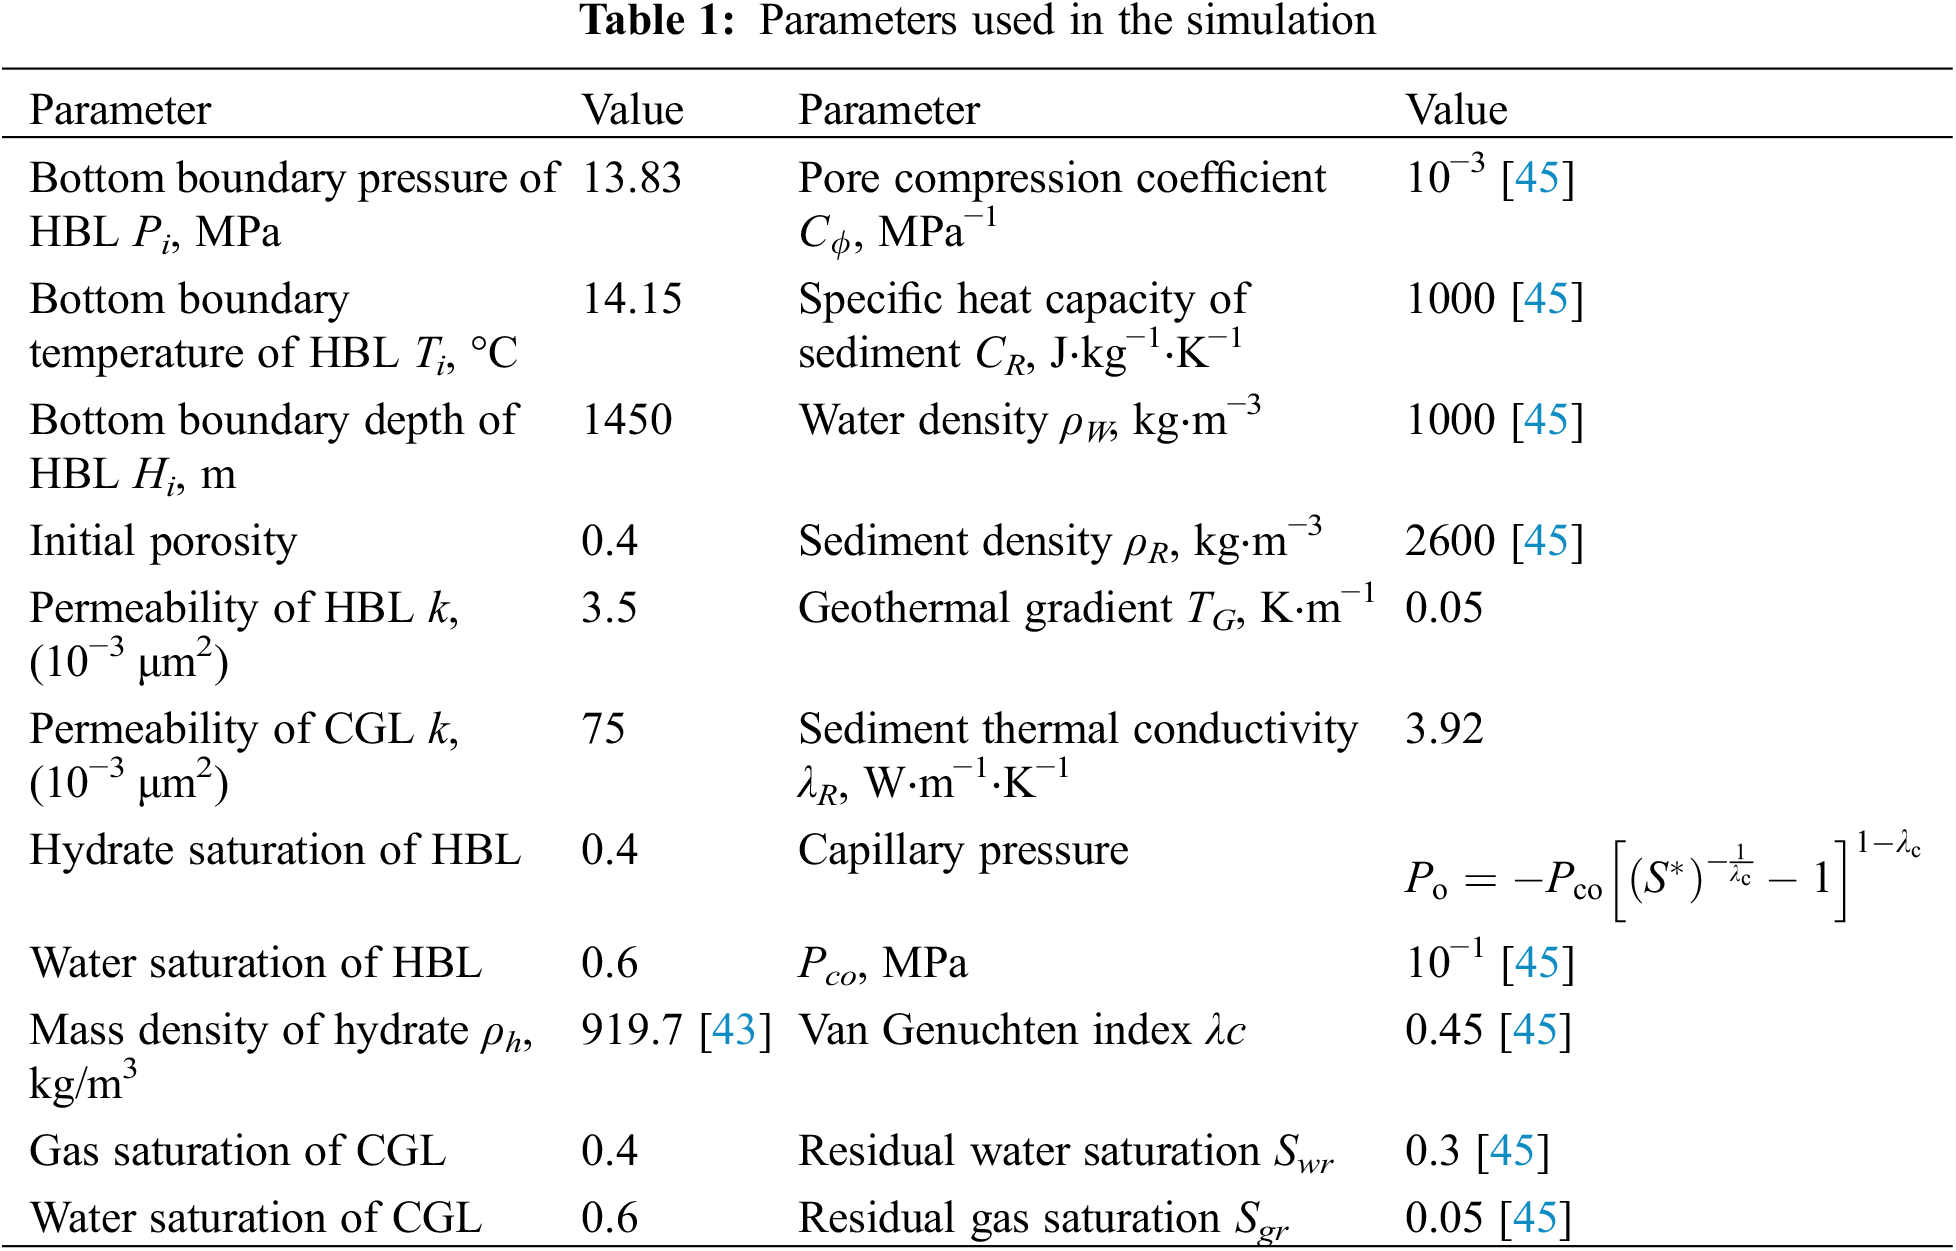
Using the depressurization method, the design production pressure was 4 MPa, and the simulated production time was 3 years. The main parameters of the reservoir used in the simulation are shown in Table 1.
3.2 Production Performance of Depressurization under Different Coexistence Accumulation Models
3.2.1 Production Performance of Type A
To compare the evolutionary characteristics of production from the different layers, three different production cases were simulated, including only depressurization in the HBL (only HBL DP), only depressurization in the CGL (only CGL DP), and both HBL and CGL depressurization (HBL + CGL DP).
For the different production layers, the evolution of the average reservoir pressure is shown in Fig. 3. The average reservoir pressure was the average of the whole model’s pressure. It was observed that the average reservoir pressure decreases much faster in the case of only CGL DP and HBL + CGL DP than only HBL DP. This was due to the higher permeability of the CGL, which made the gas phase flow faster. After a pressure reduction, CGL was produced more quickly, which further decreased the average reservoir pressure and therefore affected the pressure in the surrounding HBL. However, in the case of only HBL DP, the average reservoir pressure dropped slowly due to the lower permeability.
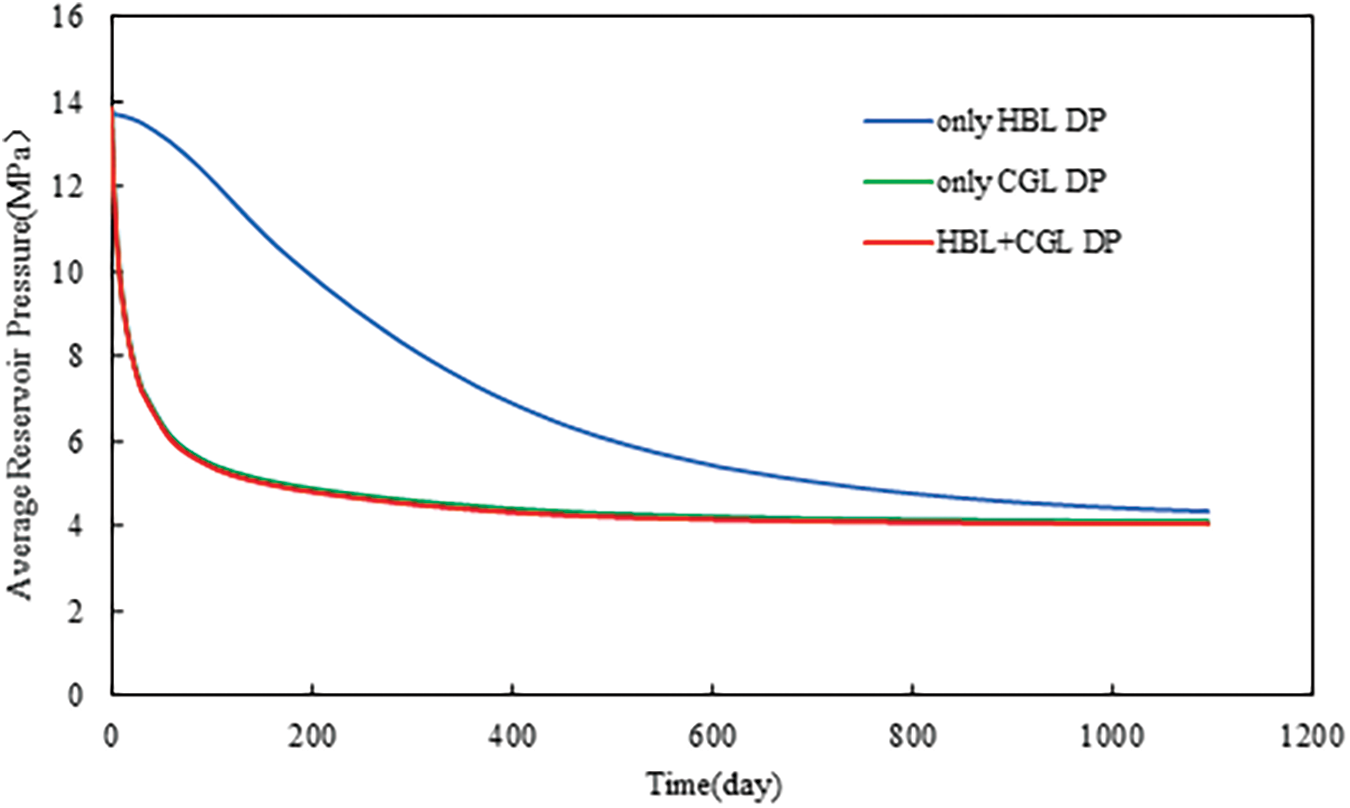
Figure 3: Evolution of average reservoir pressure at different production layers under Type A
Fig. 4 shows the evolution of hydrate saturation at different production layers under Type A. The hydrate close to the well decomposed first with a smaller area, when it was the only HBL DP. However, in the other two cases, the bottom of the HBL decomposed first and to a greater area. This was due to the low permeability of the HBL, which has limited pressure propagation, while the pressure drop of the more permeable CGL propagated faster, causing a large area of decomposition at the bottom of the HBL with which it was in contact.
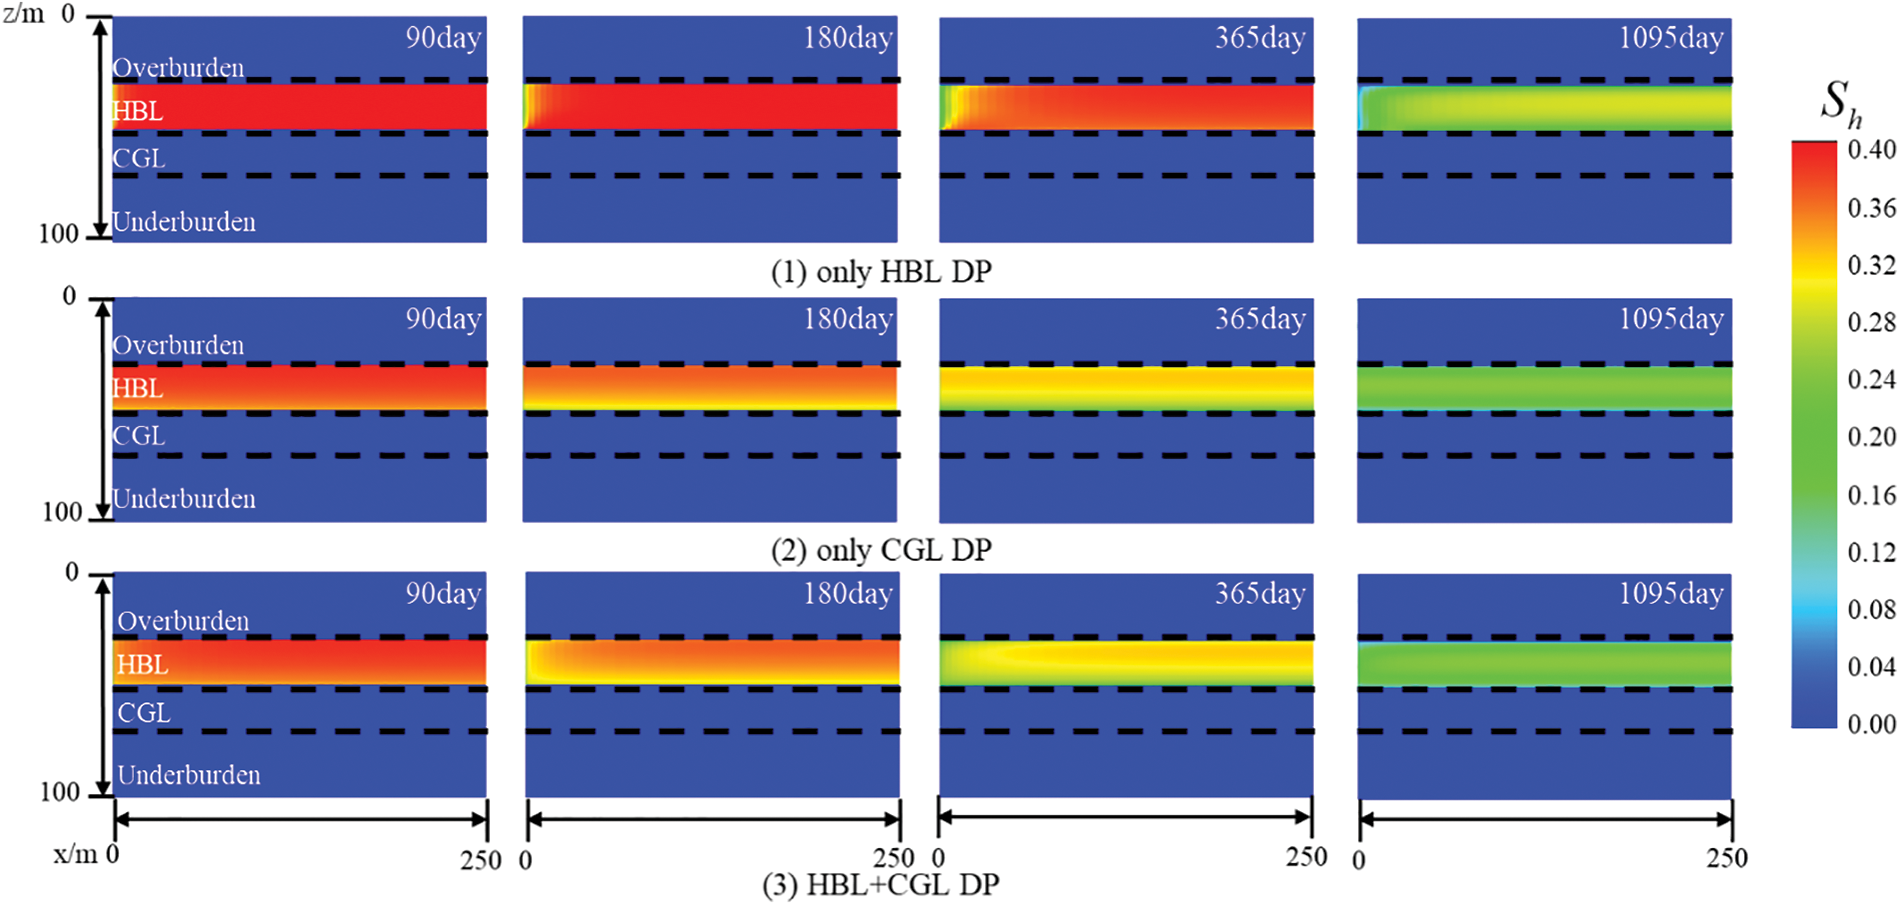
Figure 4: Evolution of hydrate saturation at different production layers under Type A
Fig. 5 shows the comparison of gas production rate and cumulative gas production at different production layers. In the case of only HBL DP, the reservoir pressure decreased slowly due to the low permeability of HBL. When the pressure of HBL was lower than the phase equilibrium pressure of the hydrate, the hydrate began to gradually dissociate and the gas production rate was generally low during the whole production process. However, in the case of only CGL DP and HBL + CGL DP, the gas production rate rapidly reached its peak because the gas in the CGL was produced immediately after depressurization. According to the previous pressure change analyzed, the reservoir pressure also rapidly decreased. Therefore, with the decrease in reservoir pressure, the production pressure difference was reduced, and the gas production rate decreased significantly and remained stable. At the same time, there were two noteworthy phenomena: (1) The cumulative gas production was relatively high in the case of only HBL DP and only CGL DP, and the sum of the two was much higher than that of HBL + CGL DP. This indicated that since HBL and CGL were adjacent to each other, whenever one of the layers was depressurized separately, gas from the other layer also flowed to the production layer through the depressurization. Therefore, gas produced from the separate depressurization of HBL or CGL was not the only gas contribution of that layer. (2) The gas production rate in the case of only CGL DP was very similar to that of HBL + CGL DP, which indicated that the HBL had little contribution to the total gas production of HBL + CGL DP.
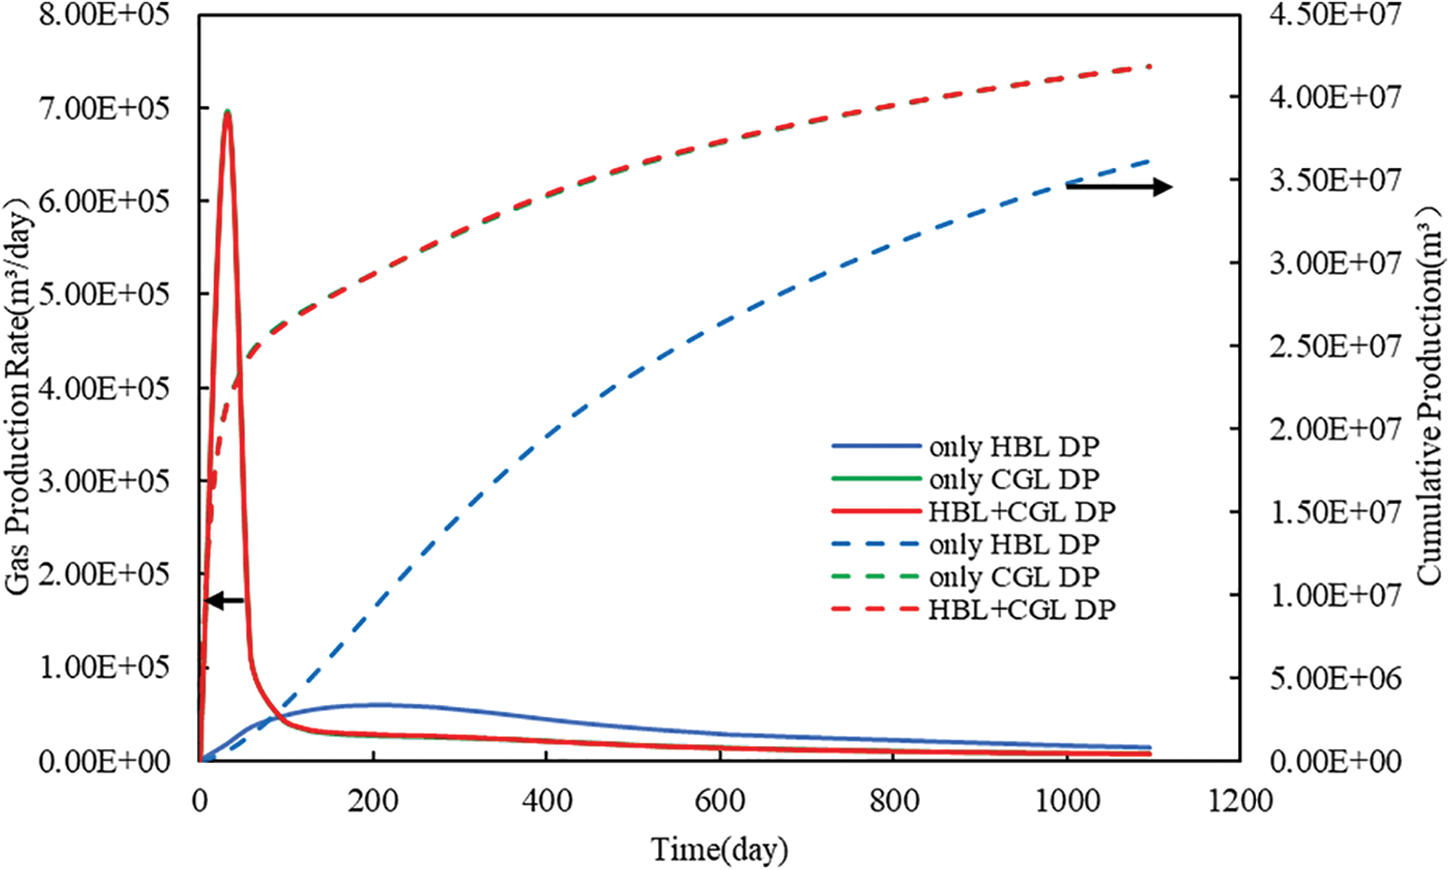
Figure 5: Evolution of gas production rate and cumulative gas production at different production layers under Type A
Fig. 6 shows the comparison of water production rate and cumulative water production at different production layers. In the early stage of depressurization, the water production rate was the highest in the case of HBL + CGL DP, and the lowest in the only HBL DP. This was because both CGL and HBL have certain initial water saturations, and the original water was produced quickly after depressurization. The CGL had a fast pressure drop and high-water production. As the CGL pressure gradually decreased, the production pressure differential decreased and the CGL water production gradually decreased. The hydrate tended to decompose into water when the HBL pressure gradually dropped below the phase equilibrium pressure. As a result, after 60 days, the water production rate evolved to be the highest in the case of only HBL DP and lowest in the only CGL DP. The water production rate of the three cases all decreased to a lower value after 1000 days.
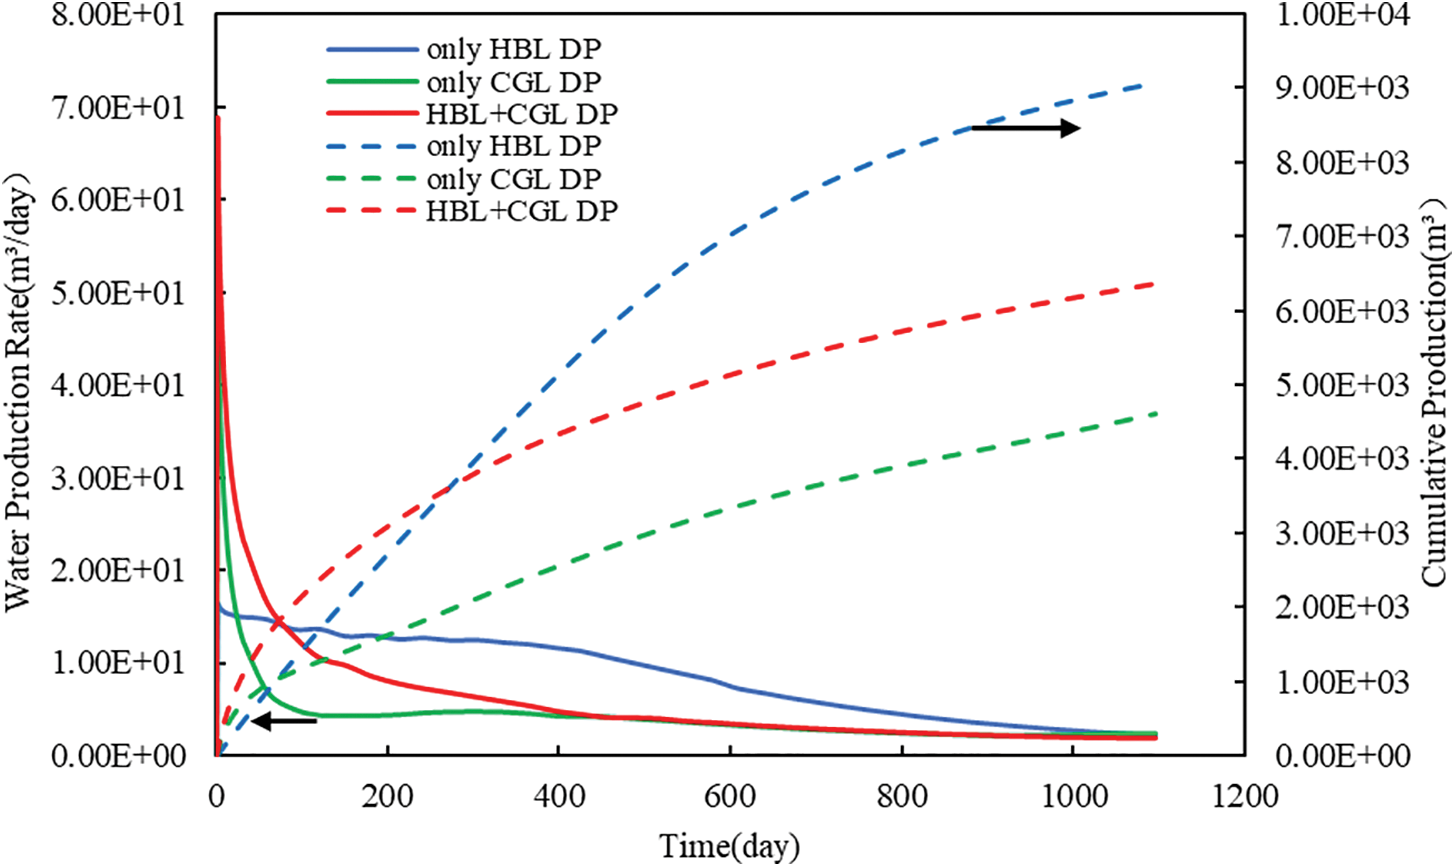
Figure 6: Evolution of water production rate and cumulative water production at different production layers under Type A
3.2.2 Production Performance of Type B
In Type B, there was a permeable interlayer between HBL and CGL. The total number of grids in the z-direction changed from 40 in Type A to 41 in Type B when the interlayer was included. Other simulation parameters and production well settings were the same as in the Type A model.
Under different production layers, the evolution of average reservoir pressure during depressurization is shown in Fig. 7. In the case of only CGL DP and HBL + CGL DP, the average reservoir pressure dropped much faster than that in the only HBL DP, which was consistent with the previous pressure evolution of Type A (as shown in Fig. 3). This showed that the presence of the permeable interlayer has little effect on pressure propagation.
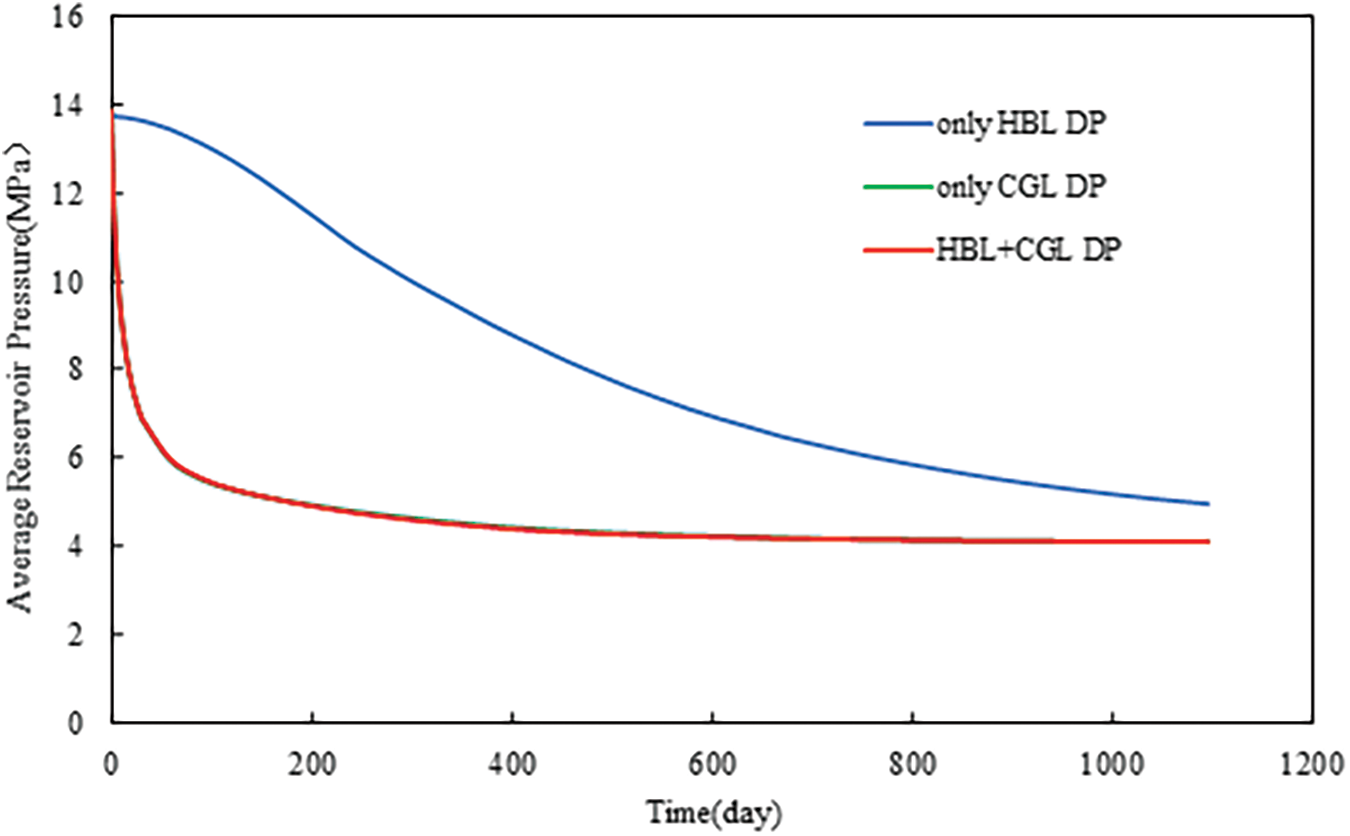
Figure 7: Evolution of average reservoir pressure at different production layers under Type B
Fig. 8 shows the evolution of hydrate saturation at different production layers under Type B. With the addition of a permeable interlayer, the hydrate saturation distribution under the three cases was not significantly different from that of Type A. This was due to the relatively high permeability and small thickness of the permeable interlayer, which had little effect on the interlayer fluid seepage and pressure propagation at longer production periods, and therefore the permeable interlayer had little effect on the hydrate saturation distribution.
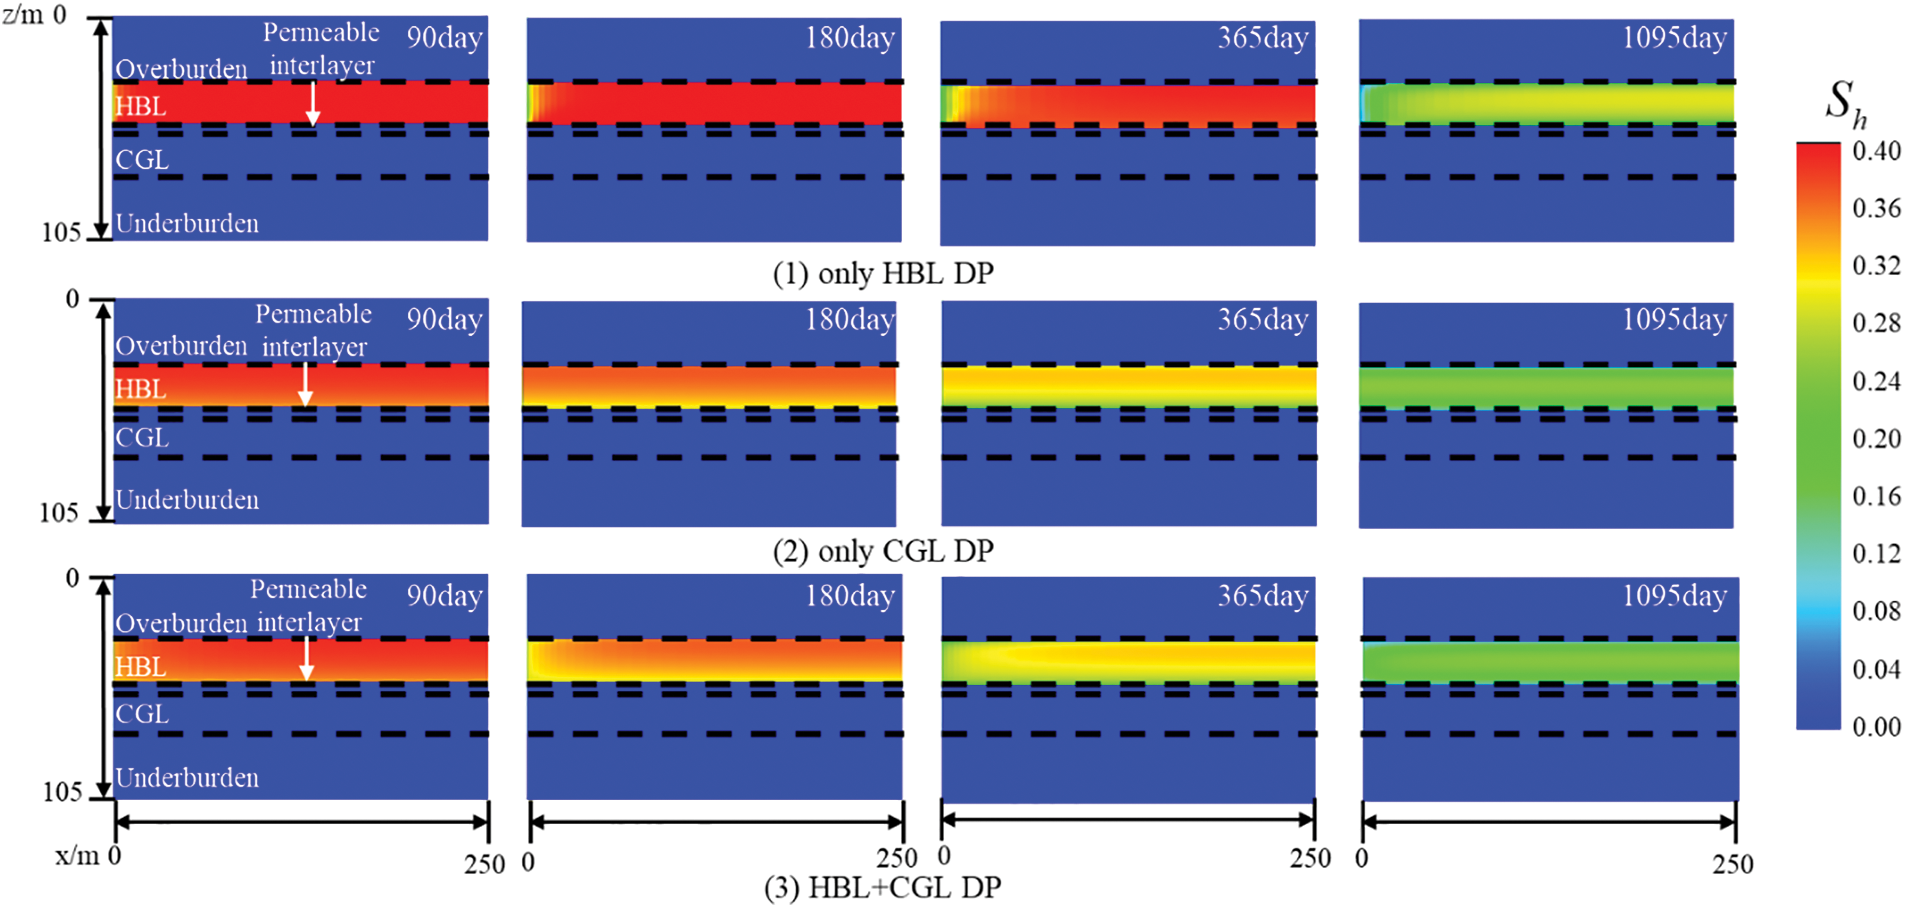
Figure 8: Evolution of hydrate saturation at different production layers under Type B
Fig. 9 shows the comparison of gas production rate and cumulative gas production at different production layers. In the case of only CGL DP and HBL + CGL DP, the gas production rate rapidly increased to the peak after initial depressurization, and then rapidly decreased, which was the same as under Type A. However, compared with Type A, there were two differences in the case of only HBL DP. First, the peak gas production was slightly increased due to the existence of a small amount of gas in the interlayer. Second, the peak gas production was slightly later due to the interlayer permeability being smaller than that of the CGL, which reduced the rate of gas transport from the CGL to the HBL. In general, due to a certain amount of gas contained in the interlayer, the cumulative gas production in all three cases was approximately 6.7%–7.7% higher than that of Type A. At the same time, since the interlayer connected the HBL and CGL, the gas production in the case of only HBL DP or only CGL DP was not only the gas contribution from that layer, which was the same as under Type A.
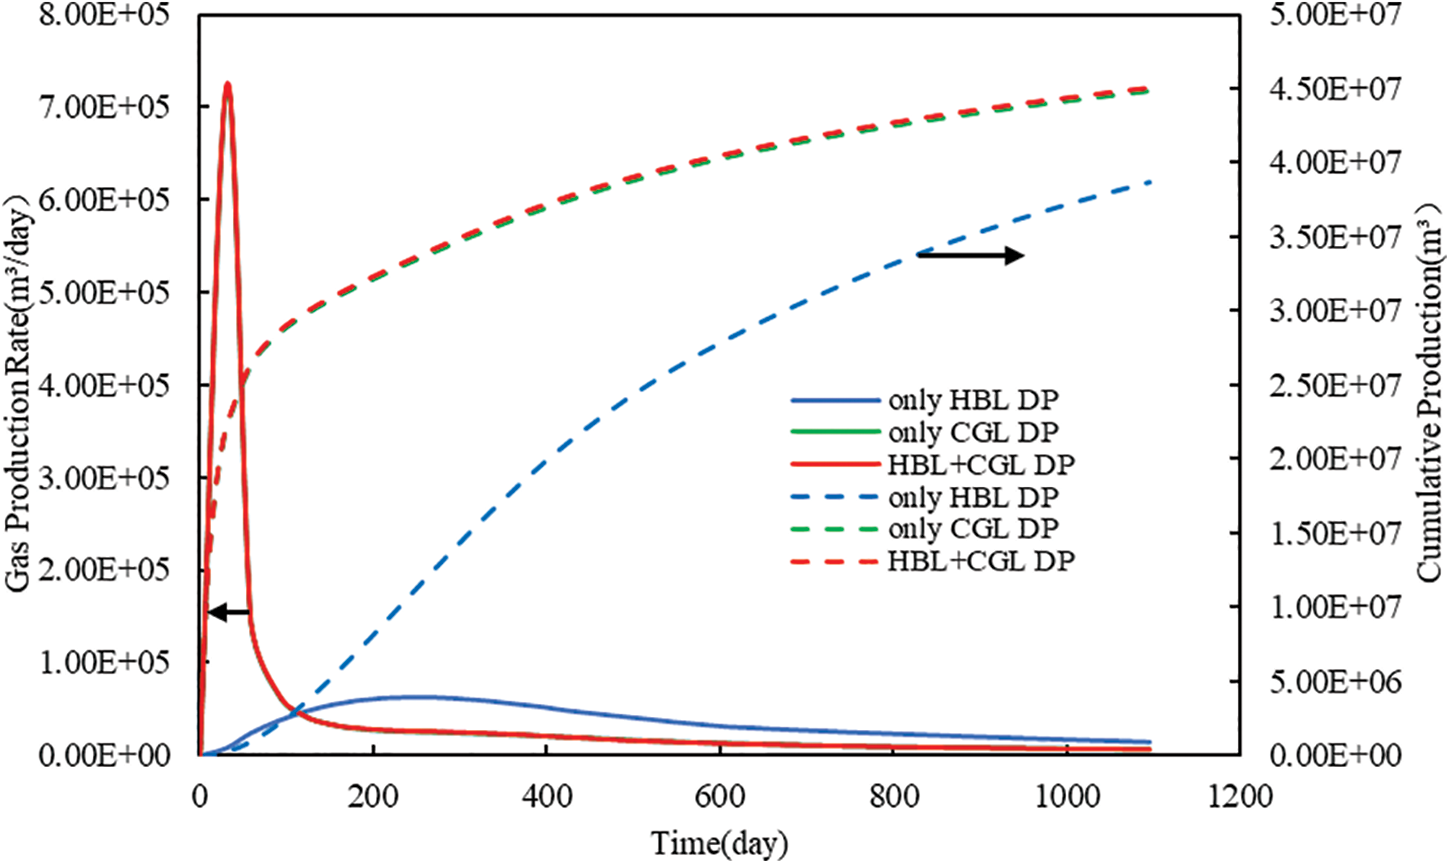
Figure 9: Evolution of gas production rate and cumulative gas production at different production layers under Type B
Fig. 10 shows the comparison of water production rate and cumulative water production at different production layers. In the initial stage of depressurization, compared with Type A, the water production rate increased slightly in both cases of only CGL DP and HBL + CGL DP while it remained almost the same in the case of only HBL DP due to the permeable interlayer. The primary reason was that the permeable interlayer was extremely saturated with water. In the case of only CGL DP and HBL + CGL DP, the interlayer water permeated the CGL due to the fast pressure drop of the CGL and the water gravity effect, thus increasing the water production. However, in the case of only HBL DP, the pressure of the reservoir decreased slowly due to the low permeability of the hydrate layer. Besides, the interlayer was located below HBL, so the existence of the interlayer had little influence on the initial water production rate of only HBL DP. After 90 days, the water production rate of only HBL DP was higher than that of only CGL DP and HBL + CGL DP. On the one hand, the water production of CGL rapidly decreased due to the reducing production pressure difference; on the other hand, the water production rate of HBL gradually increased due to the dissociation of hydrate. As a result, after 60 days, the water production rate evolved to be highest in the case of only HBL DP and lowest in the only CGL DP. The water production rate of the three cases all decreased to a lower value after 1000 days. In general, only HBL DP had the highest cumulative water production and only CGL DP had the lowest over the 3-year production period.
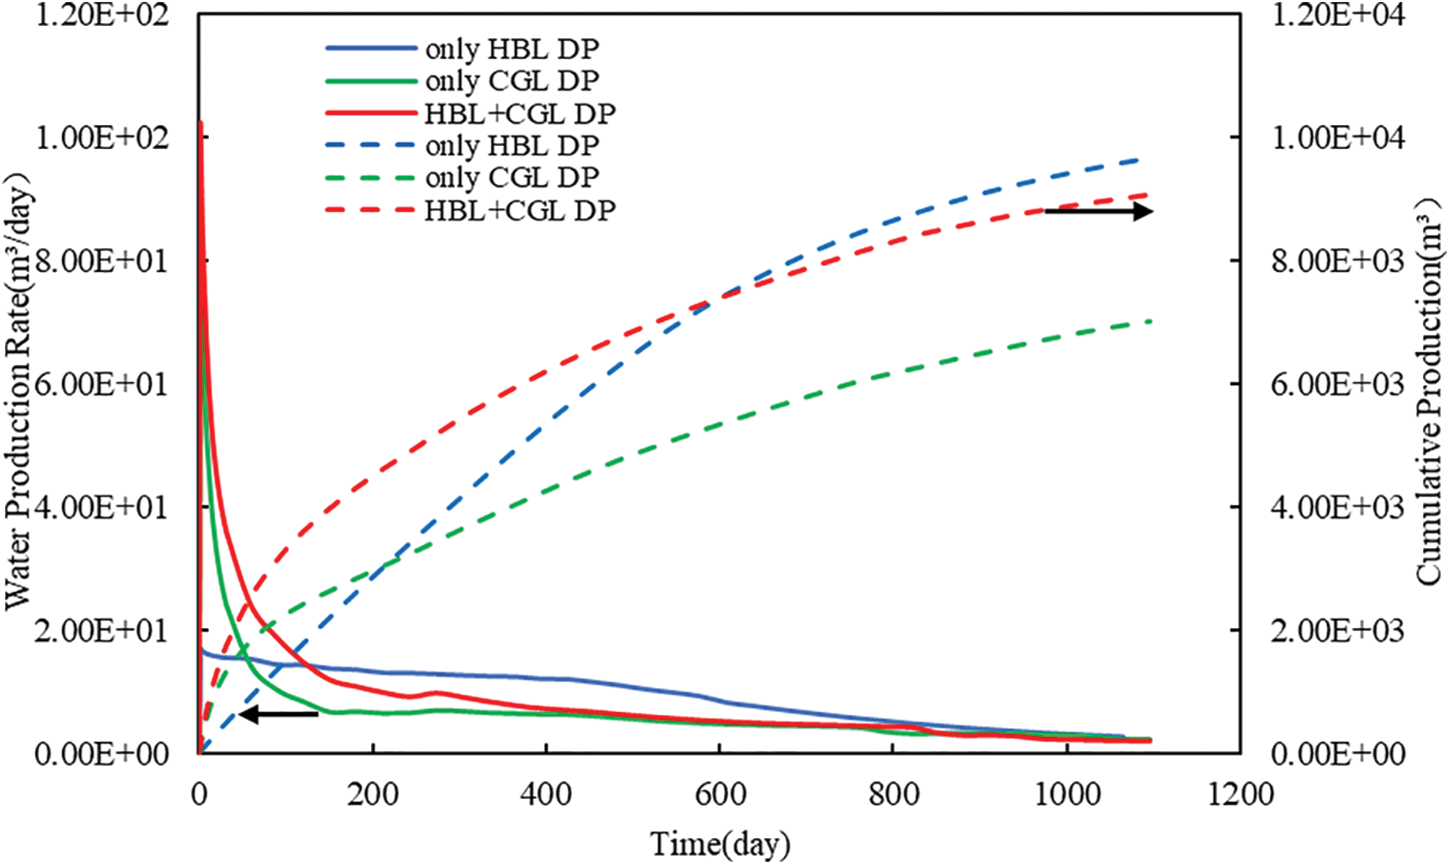
Figure 10: Evolution of water production rate and cumulative water production at different production layers under Type B
3.2.3 Production Performance of Type C
In Type C, there was an impermeable interlayer between BHL and CGL. Same as Type B, the total number of grids in the z direction was 41. Other simulation parameters and production well settings were the same as for Type A.
The evolution of average reservoir pressure under different production layers is shown in Fig. 11. In both the only HBL DP and only CGL DP cases, the average reservoir pressure drop was significantly smaller in Type C due to the impermeable barrier impeding the connection between the HBL and CGL, which differed significantly from Types A and B (as shown in Figs. 3 and 7). This was especially in the case of only HBL DP due to the low permeability of HBL. In the case of HBL + CGL DP, the average pressure reduction of the whole reservoir was the largest due to the simultaneous reduction of the upper HBL and lower CGL pressures, but the average pressure reduction of Type C was significantly smaller than that of Types A and B.
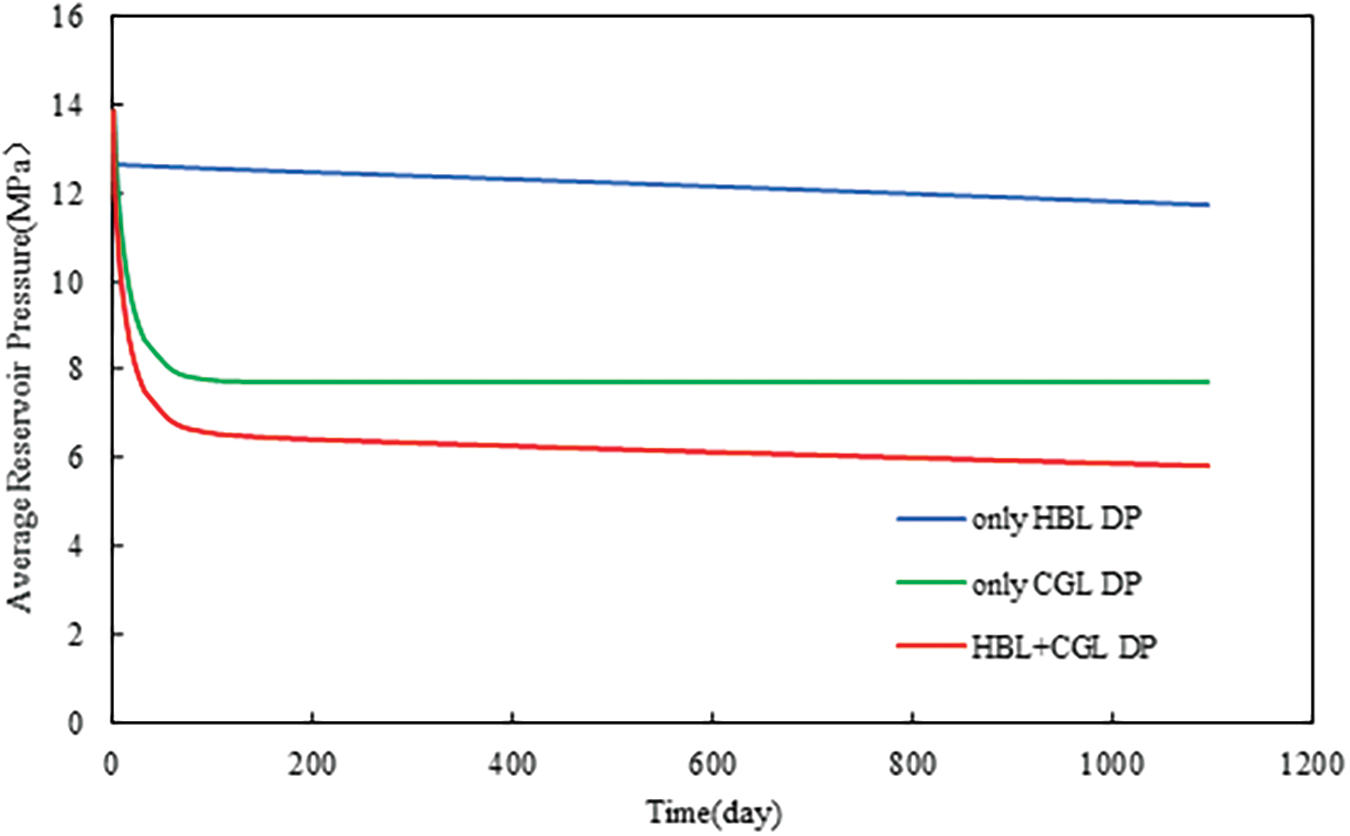
Figure 11: Evolution of average reservoir pressure at different production layers under Type C
Fig. 12 shows the evolution of hydrate saturation at different production layers under Type C. Hydrate decomposed slowly in all three production cases. The distribution of hydrate saturation was similar for only HBL DP and HBL + CGL DP. The top and bottom of the HBL decomposed faster due to the heat transfer of the burden. However, the hydrate layer hardly decomposed in the case of only CGL DP. The primary reason was that the presence of impermeable interlayers impeded fluid flow and pressure propagation between HBL and CGL, resulting in little reservoir pressure drop and a hydrate decomposition rate of almost 0.
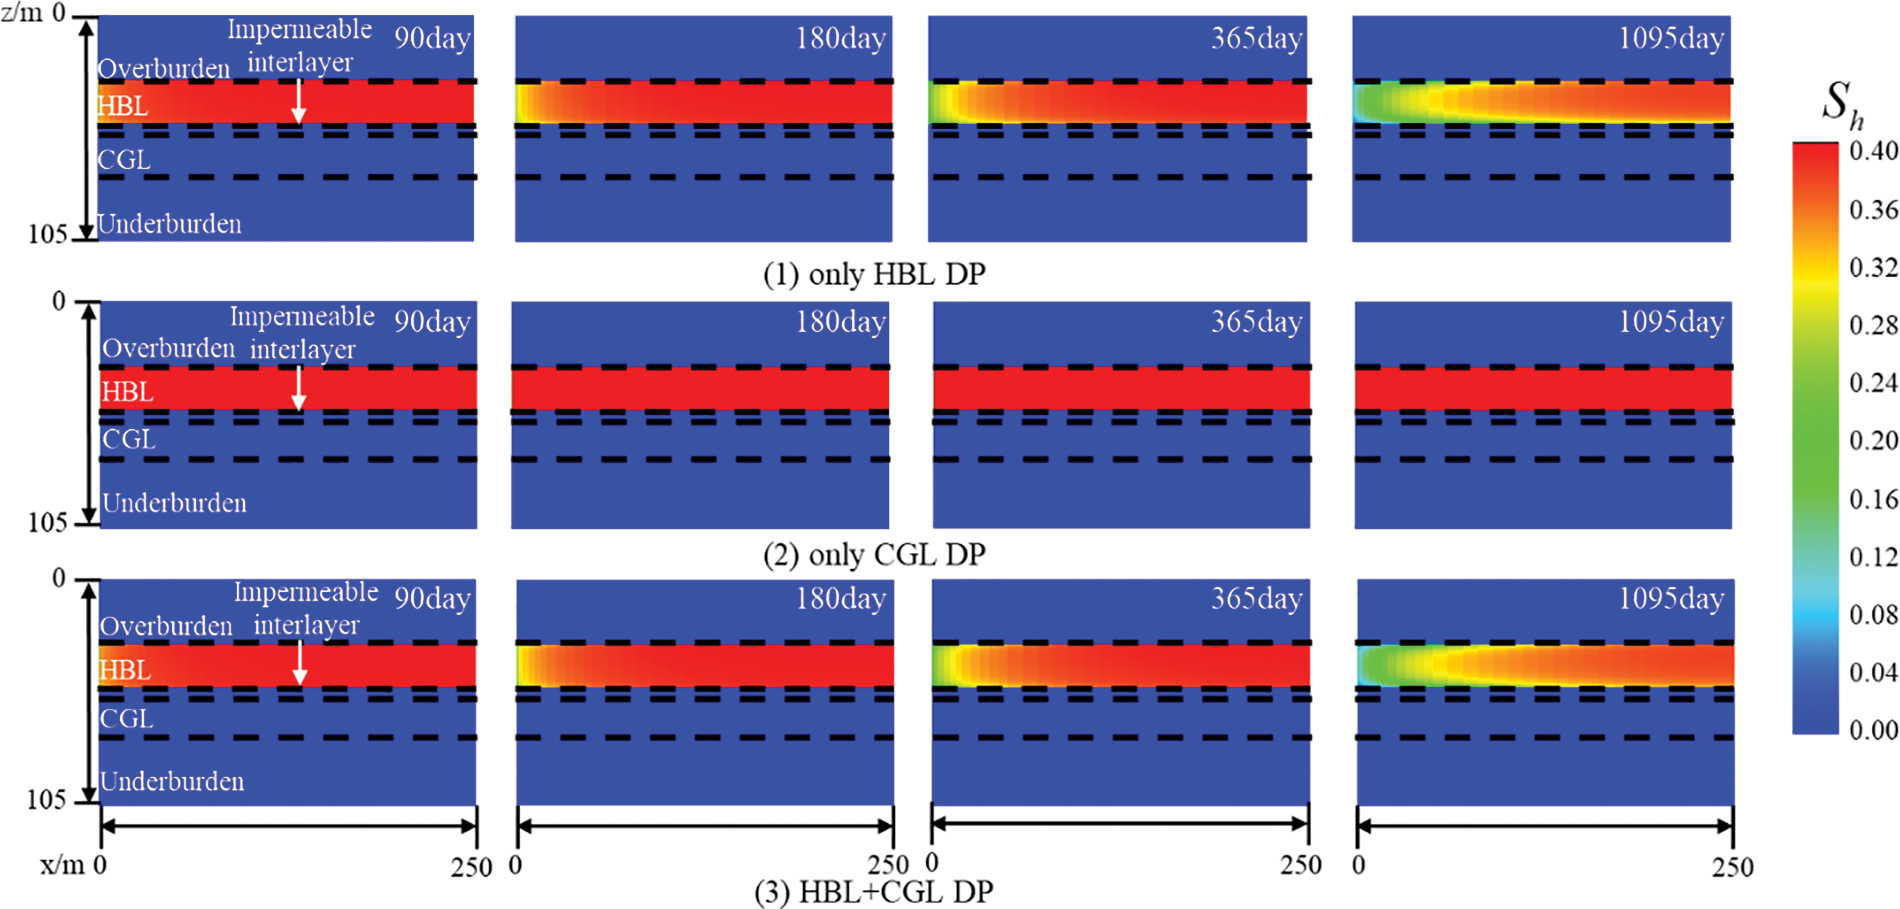
Figure 12: Evolution of hydrate saturation at different production layers under Type C
Fig. 13 shows the comparison of gas production rate and cumulative gas production at different production layers. At the initial stage of depressurization, in the case of only CGL DP and HBL + CGL DP, the gas production rate rapidly reached its peak and sharply decreased, which was the same trend as previously observed for Types A and B. However, it was noteworthy that the peak gas production and cumulative gas production were slightly higher than those of HBL + CGL DP in this production stage for the only CGL DP case. The reason was that in the case of HBL + CGL DP, there was an impermeable interlayer between HBL and CGL. Therefore, for the gas flow in the reservoir, the gas production performance of HBL and CGL did not affect each other. However, for the flow dynamics in the same wellbore, when the HBL and CGL were depressurized at the same time, the produced water of HBL affected the gas flow of CGL in the same wellbore, making the peak of gas production rate slightly decrease in the case of HBL + CGL DP. In the case of only HBL DP, compared with the cases of Types A and B, the pressure dropped very slowly due to the low permeability of the HBL, which inhibited the decomposition and gas production of the hydrate. Meanwhile, the gas seepage from the CGL to HBL was completely impeded by the existence of the impermeable interlayer, thus the gas production rate was very low when only the hydrate layer was depressurized. Therefore, the cumulative gas production of the case HBL + CGL DP was almost equal to the sum of the only HBL DP and only CGL DP.
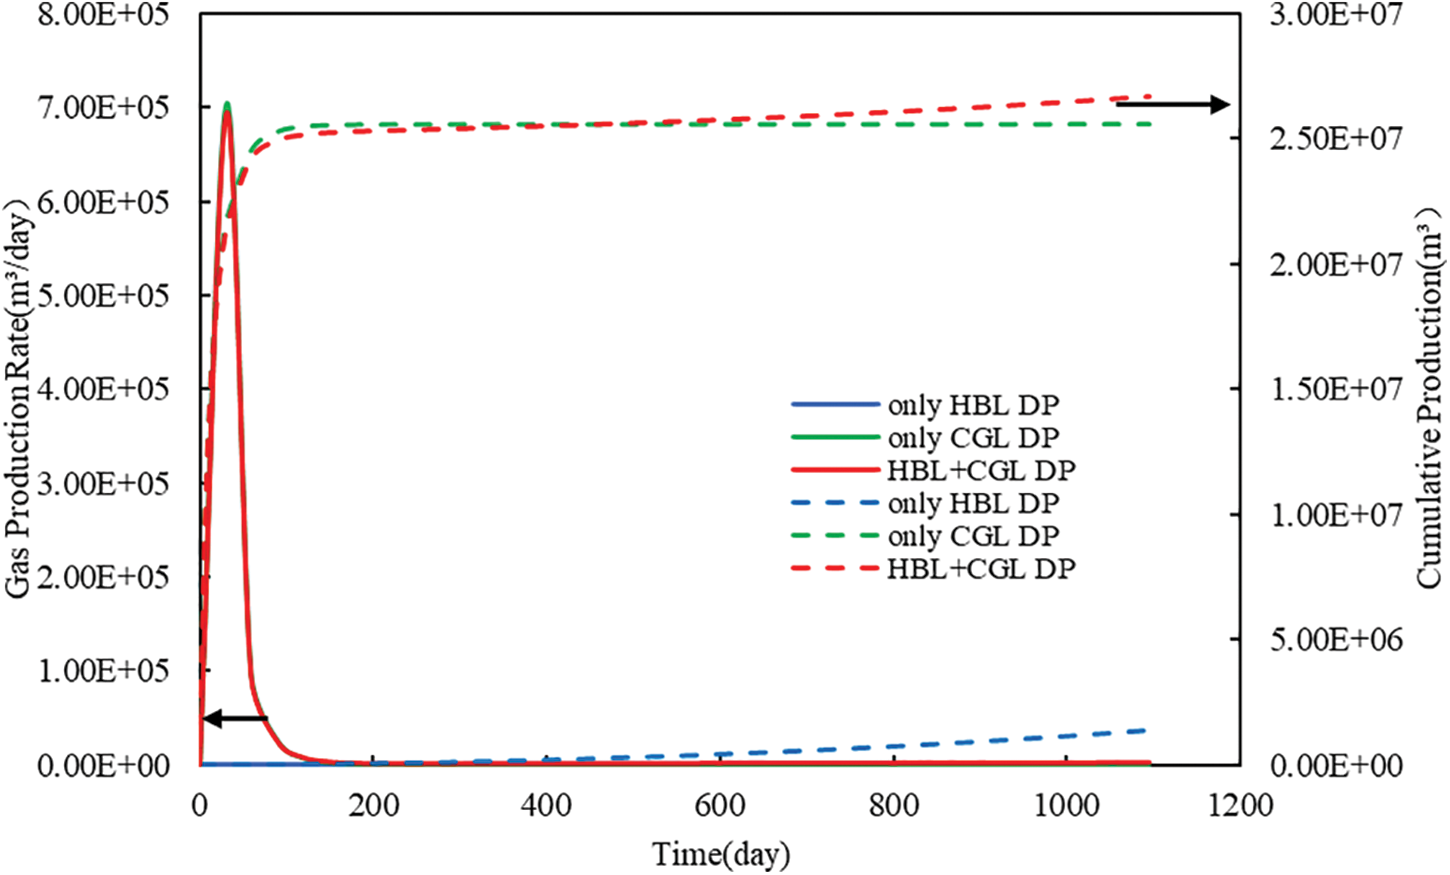
Figure 13: Evolution of gas production rate and cumulative gas production at different production layers under Type C
Fig. 14 shows the comparison of water production rate and cumulative water production at different production layers. In the early stages of depressurization, the water production rate was the highest in the case of HBL + CGL DP and the lowest in only HBL DP. After 120 days of production, the water production rate of CGL DP only was almost zero, while the difference in water production rate between only HBL DP and HBL + CGL DP was not significant, which was because the hydrate decomposition water in HBL was the main source of produced water in the middle and late stages of production. In summary, the cumulative water production with only CGL DP was the lowest over the 3-year production and much lower than the cumulative water production with HBL DP only and HBL + CGL DP.
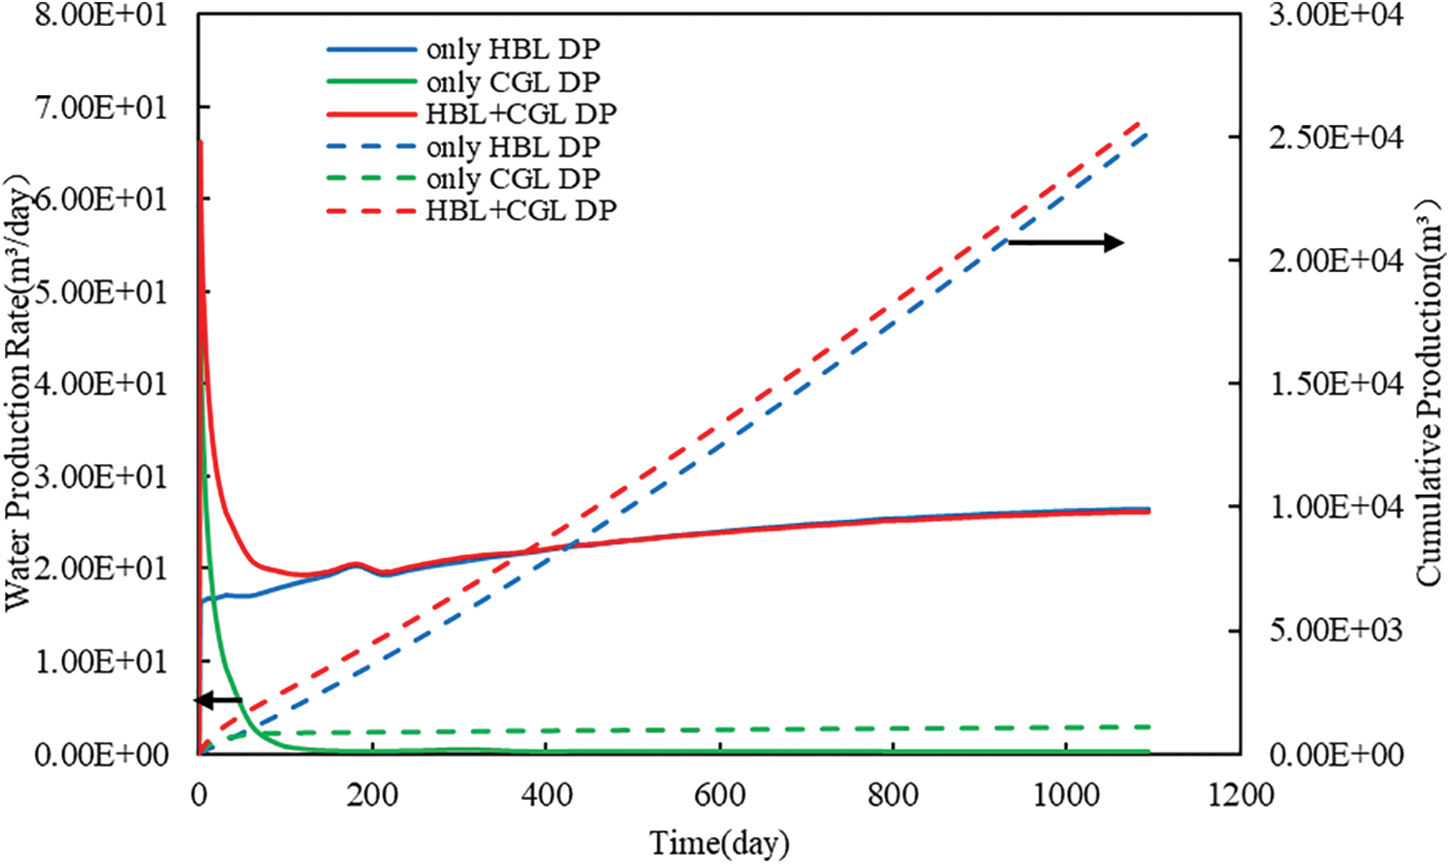
Figure 14: Evolution of water production rate and cumulative water production at different production layers under Type C
3.3 Comparison of Gas and Water Production under Different Coexistent Accumulation Models
The cumulative gas and water production at different production layers under different coexistent accumulation models after three years of depressurized production is presented in Table 2. The cumulative gas production of Type A and Type B was much higher than that of Type C, regardless of whether in the case of only HBL DP, only CGL DP, or HBL + CGL DP, indicating that the existence of an impermeable interlayer had a significant impact on gas production. In the three coexistent accumulation models, the cumulative gas-to-water ratio of only CGL DP was much higher than the other two cases, which was due to the absence of perforation in the HBL and the lower cumulative water production. Therefore, the only CGL DP was recommended when considering the optimal gas-to-water ratio, no matter which type of coexistent accumulation model. The case of HBL + CGL DP had the highest cumulative gas production under the three coexistent accumulation models. Thus, the HBL + CGL DP was optimal when the largest gas production was considered.
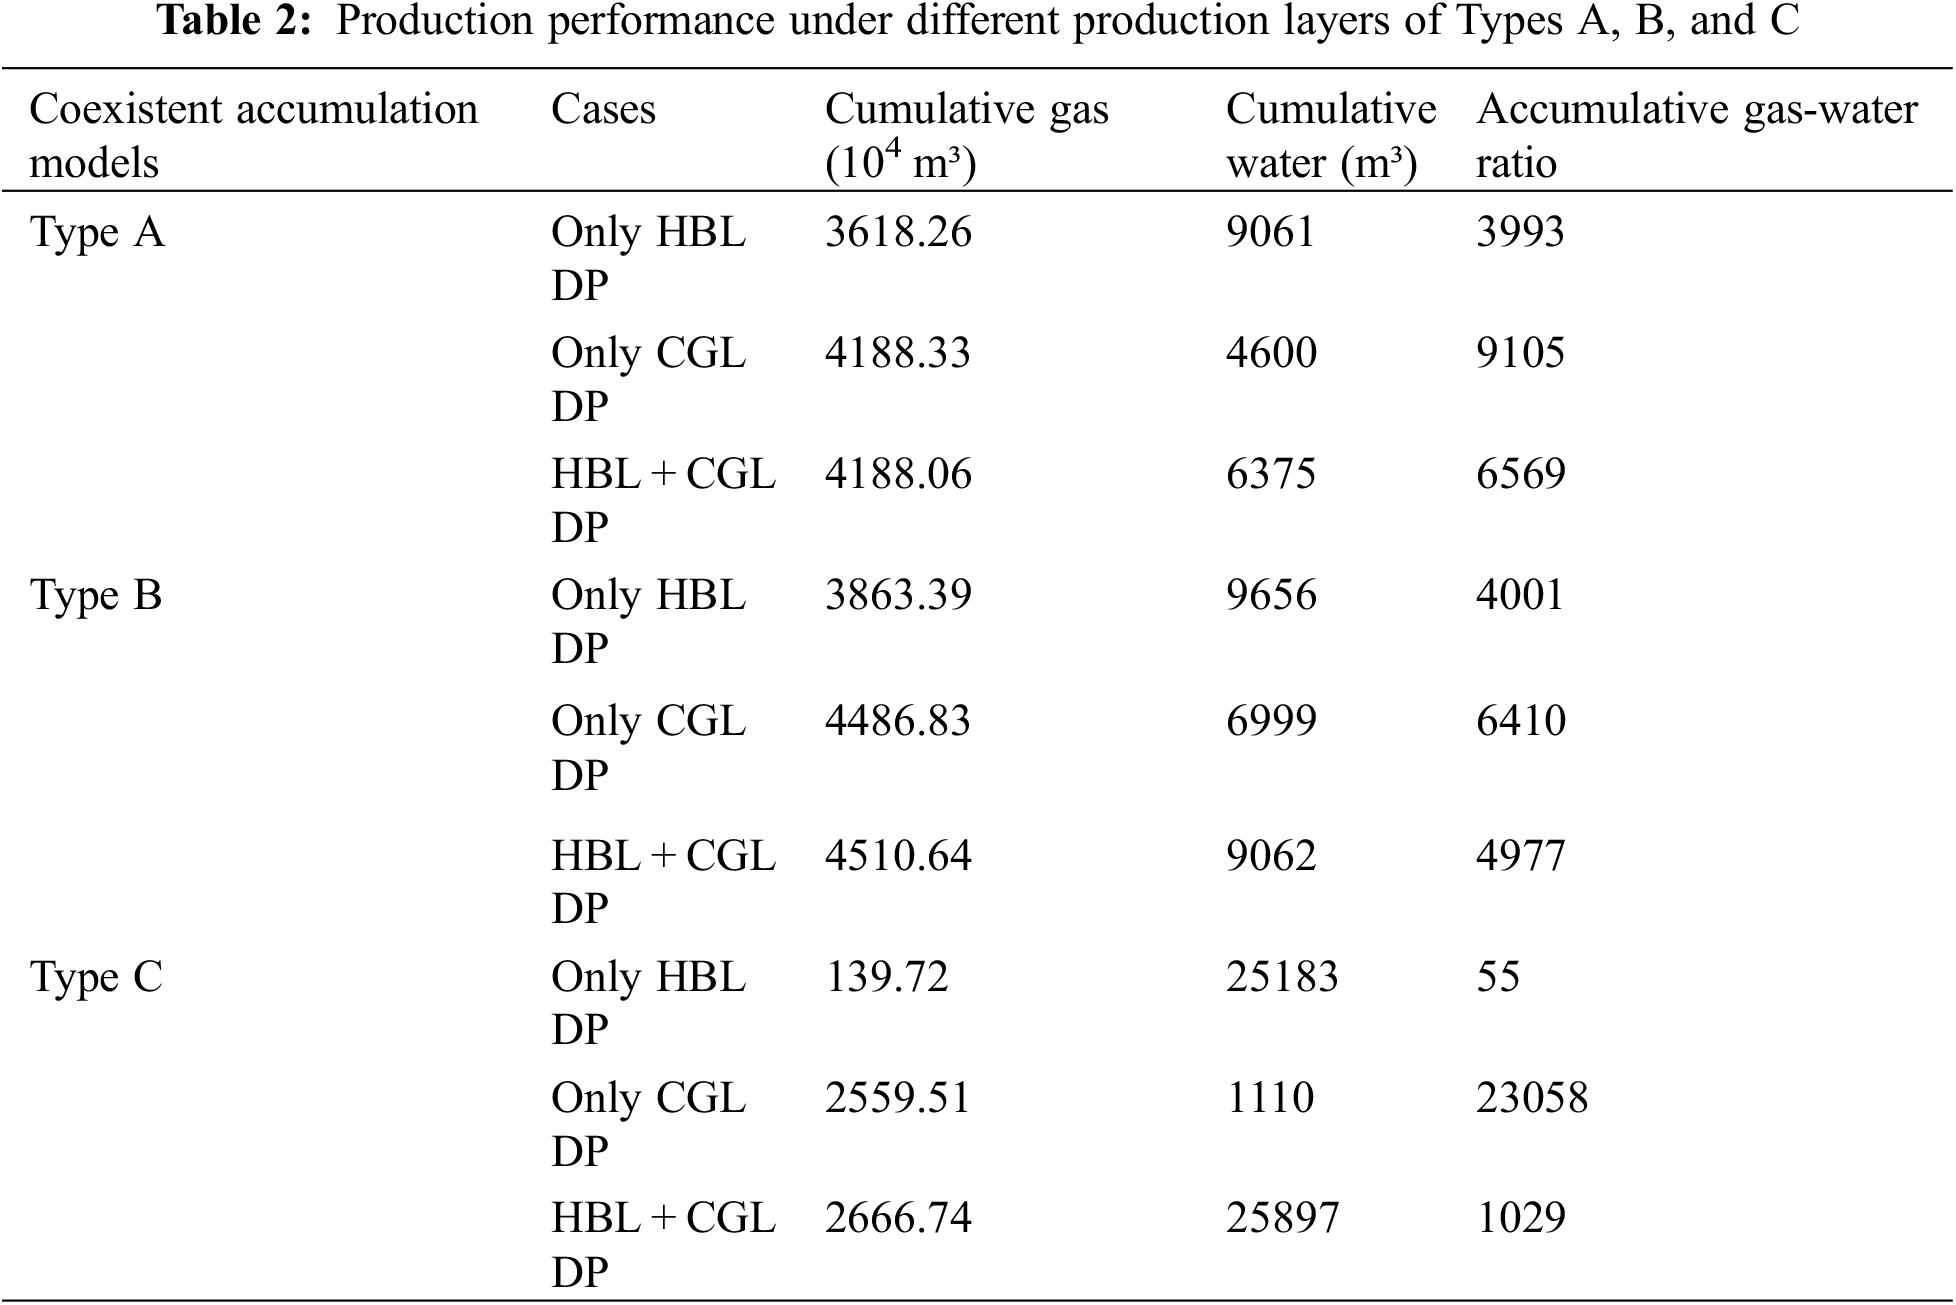
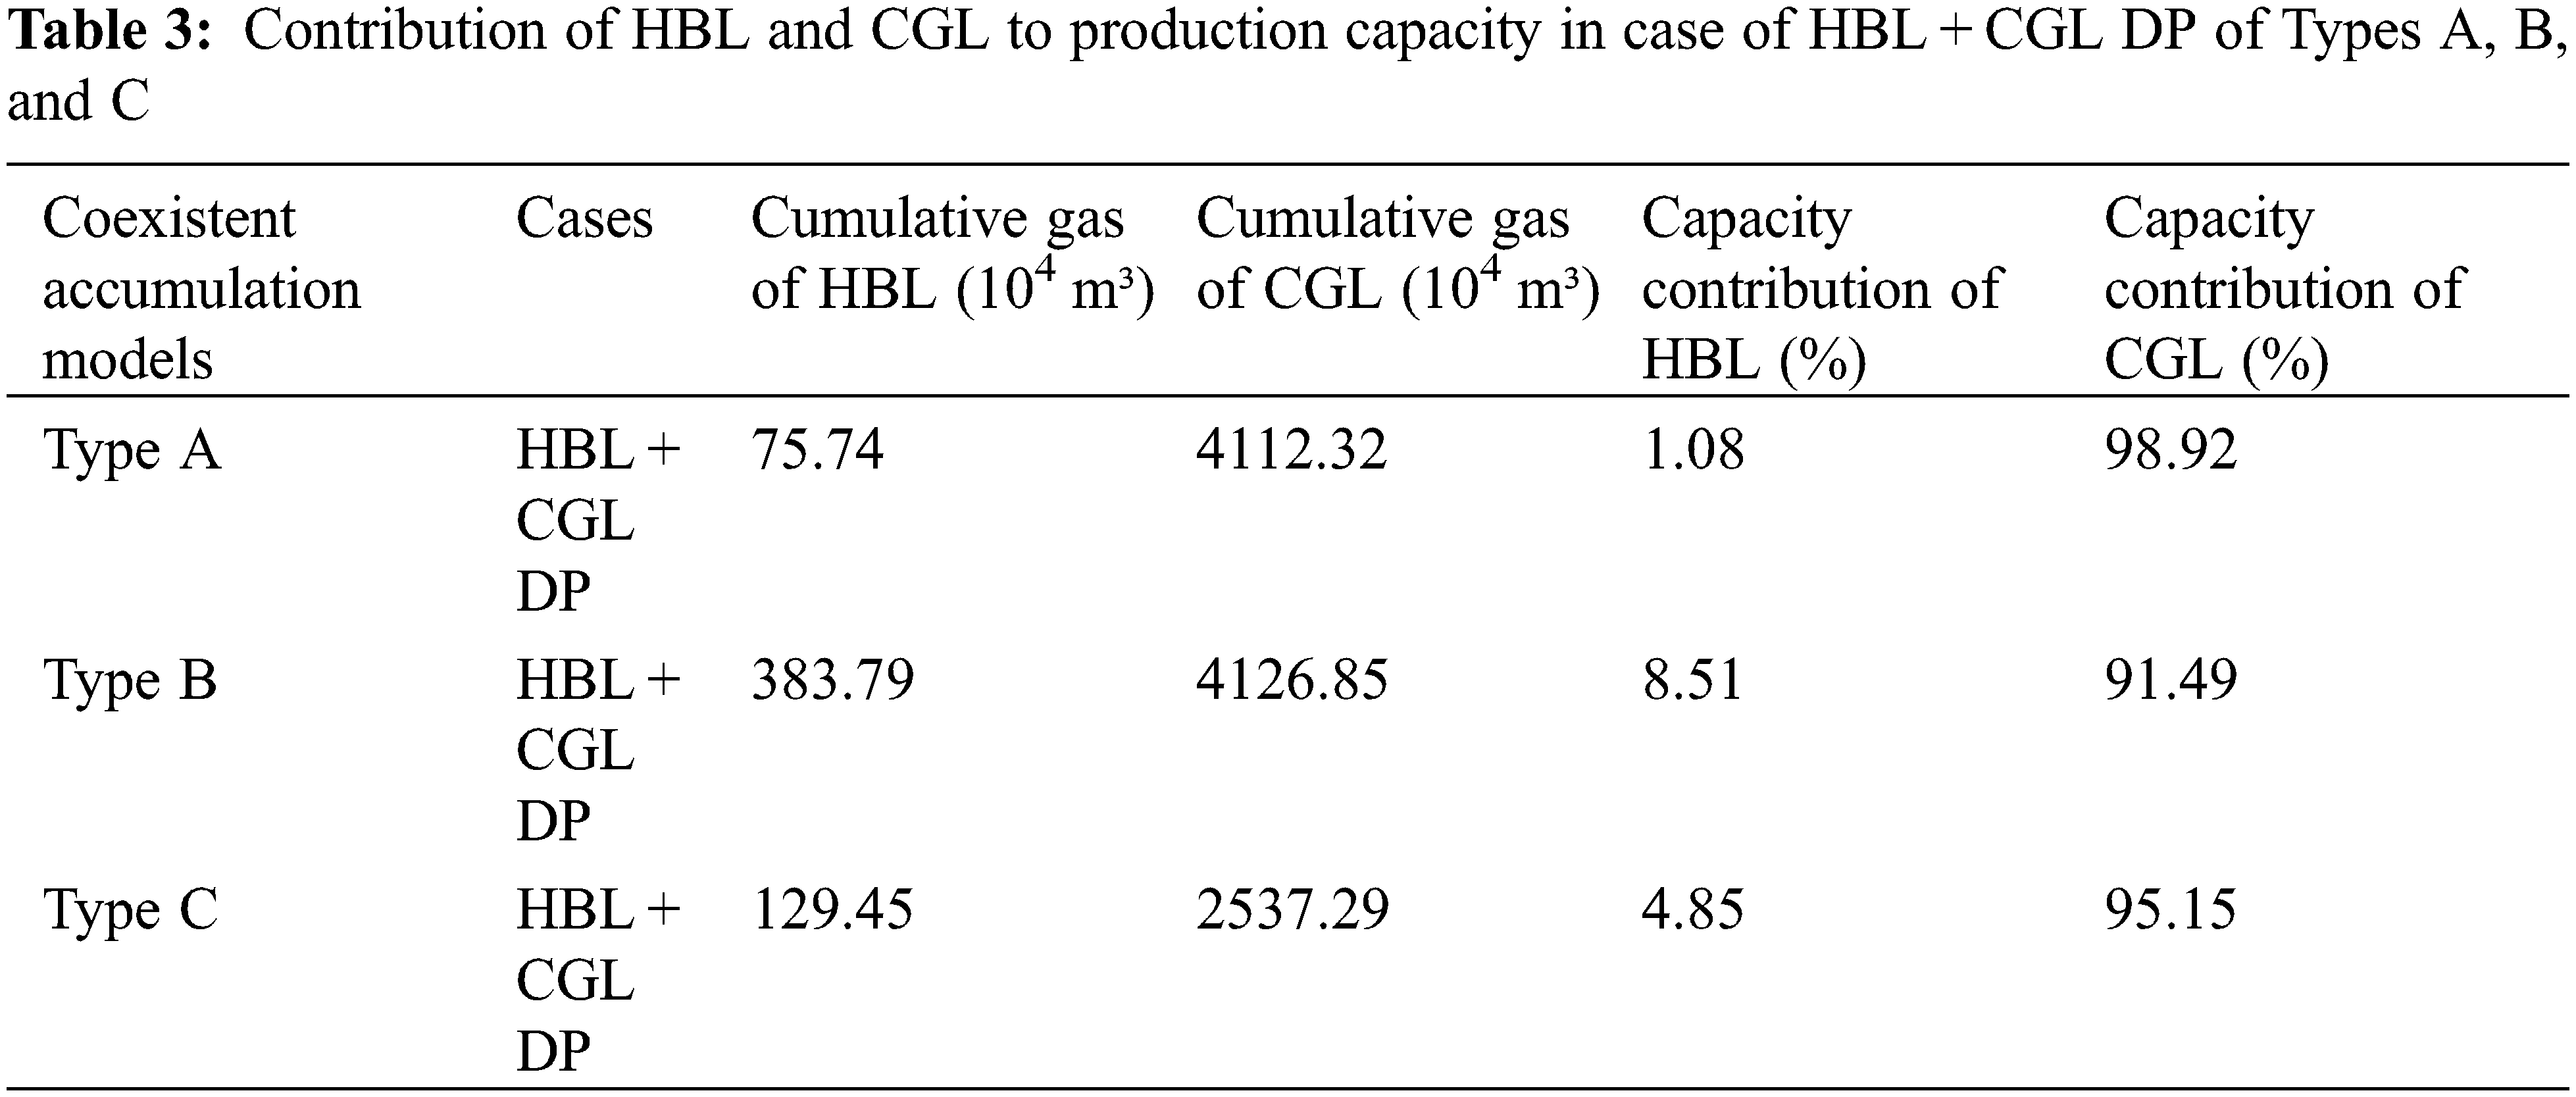
Table 3 analyzes the production contribution of the HBL and CGL in different coexistent accumulation models during HBL + CGL DP. The HBL of Type B had the highest cumulative gas production and Type A had the lowest. However, the spatial evolution of hydrate saturation was similar for both types (as shown in Figs. 4 and 8). This was because most of the dissociated gas in Type A was produced from the CGL, while in Type B the presence of a permeable interlayer impeded the flow of the dissociated gas and therefore was produced from the HBL. In contrast, the HBL pressure propagation range of Type C was limited, resulting in low hydrate decomposition (as shown in Fig. 12) and low cumulative gas production.
(1) Three different coexistent accumulation models of HBL and CGL are proposed in this article. Type A has the HBL directly adjacent to the CGL, Type B has a permeable interlayer existing between the HBL and the CGL, and Type C has an impermeable interlayer between the HBL and the CGL.
(2) For Types A and B, the gas produced from the separate depressurization of HBL or CGL is not the only gas contribution of that layer. For HBL + CGL DP, the contribution of gas production from the HBL increases with the presence of permeable interlayers.
(3) The cumulative gas production of the Type C is much lower than that of Type A and Type B under all three production cases, indicating that the impermeable interlayer is not beneficial to combined production.
(4) The only CGL DP has the largest gas-to-water ratio in all three different coexistent accumulation models. The HBL + CGL DP is optimal when the largest gas production is considered.
Acknowledgement: The authors would like to thank the reviewers and editors for their useful suggestions for the improvement in the quality of our manuscript.
Funding Statement: This work was supported by the National Natural Science Foundation of China (Nos. 52074334, 51991365) and the National Key R&D Program of China (2021YFC2800903), which are gratefully acknowledged.
Author Contributions: The authors confirm contribution to the paper as follows: study conception and design: Hongzhi Xu, Shuxia Li; data collection: Hongzhi Xu, Jian Wang; analysis and interpretation of results: Fengrui Zhao, Chengwen Wang, Yang Guo; draft manuscript preparation: Hongzhi Xu, Jian Wang. All authors reviewed the results and approved the final version of the manuscript.
Availability of Data and Materials: The data that support the findings of this study are available from the corresponding author upon reasonable request.
Conflicts of Interest: The authors declare that they have no conflicts of interest to report regarding the present study.
References
1. Sahu, C., Kumar, R., Sangwai, J. S. (2020). A comprehensive review on exploration and drilling techniques for natural gas hydrate reservoirs. Energy & Fuels, 34(10), 11813–11839. https://doi.org/10.1021/acs.energyfuels.0c02202 [Google Scholar] [CrossRef]
2. Kurihara, M., Sato, A., Funatsu, K., Ouchi, H., Yamamoto, K. et al. (2010). Analysis of production data for 2007/2008 Mallik gas hydrate production tests in Canada. Proceedings of the International Oil and Gas Conference and Exhibition in China, 132155. Beijing, China. https://doi.org/10.2118/132155-MS [Google Scholar] [CrossRef]
3. Fujii, T., Takayama, T. (2008). Wire-line logging analysis of the GMEC/NRCan/Aurora Mallik gas hydrate production test. Proceedings of the 6th International Conference on Gas HydratesVancouver, Canada. https://doi.org/10.14288/1.0041139 [Google Scholar] [CrossRef]
4. Schoderbek, D., Martin, K. L., Howard, J., Silpngarmlert, S., Hester, K. (2012). North slope hydrate field trial: CO2/CH4 exchange. Proceedings of the OTC Arctic Technology Conference, 23725. Houston, USA. https://doi.org/10.4043/23725-MS [Google Scholar] [CrossRef]
5. Yamamoto, K. (2014). Methane hydrate offshore production test in the eastern Nankai Trough: A milestone on the path to real energy resource. Proceedings of the 8th International Conference on Gas HydrateBeijing, China. [Google Scholar]
6. Yamamoto, K., Boswell, R., Collett, T. S., Dallimore, S. R., Lu, H. (2022). Review of past gas production attempts from subsurface gas hydrate deposits and necessity of long-term production testing. Energy & Fuels, 36(10), 5047–5062. https://doi.org/10.1021/acs.energyfuels.1c04119 [Google Scholar] [CrossRef]
7. Zhu, Y., Zhang, Y. (2014). Overview on permafrost gas hydrate exploration in China. Proceedings of the 8th International Conference on Gas HydrateBeijing, China. [Google Scholar]
8. Ye, J., Qin, X., Xie, W., Lv, H., Ma, B. et al. (2020). The second natural gas hydrate production test in the South China Sea. China Geology, 3(2), 197–209. https://doi.org/10.31035/cg2020043 [Google Scholar] [CrossRef]
9. Wu, N., Li, Y., Wan, Y., Sun, J., Huang, L. et al. (2021). Prospect of marine natural gas hydrate stimulation theory and technology system. Natural Gas Industry B, 8(2), 173–187. https://doi.org/10.1016/j.ngib.2020.08.003 [Google Scholar] [CrossRef]
10. Makogon, Y. E., Holditch, S. A., Makogon, T. Y. (2005). Russian field illustrates gas-hydrate production. Oil and Gas Journal, 103(5), 43–47. [Google Scholar]
11. Grover, T., Moridis, G. J., Holditch, S. A. (2008). Analysis of reservoir performance of the Messoyakha gas hydrate reservoir. Proceedings of the SPE Annual Technical Conference and Exhibition, 114375. Denver, USA. https://doi.org/10.2118/114375-MS [Google Scholar] [CrossRef]
12. Xin, S. Y. (2018). Correlation study on natural gas hydrate and hydrocarbon accumulation. Geology and Resources, 27(2), 204–208. [Google Scholar]
13. Cheng, C., Jiang, T., Kuang, Z., Yang, C., Zhang, C. et al. (2020). Characteristics of gas chimneys and their implications on gas hydrate accumulation in the Shenhu area, Northern South China Sea. Journal of Natural Gas Science and Engineering, 84, 103629. https://doi.org/10.1016/j.jngse.2020.103629 [Google Scholar] [CrossRef]
14. Collett, T. S., Johnson, A. H., Knapp, C. C., Boswell, R. (2009). Natural gas hydrates: A review. AAPG Memoir, 89, 146–219. [Google Scholar]
15. Haines, S. S., Hart, P. E., Collett, T. S., Shedd, W., Frye, M. et al. (2017). High resolution seismic characterization of the gas and gas hydrate system at Green Canyon 955, Gulf of Mexico, USA. Marine and Petroleum Geology, 82, 220–237. https://doi.org/10.1016/j.marpetgeo.2017.01.029 [Google Scholar] [CrossRef]
16. Thiagarajan, N., Kitchen, N., Xie, H., Ponton, C., Lawson, M. et al. (2020). Identifying thermogenic and microbial methane in deep water Gulf of Mexico reservoirs. Geochimica et Cosmochimica Acta, 275, 188–208. https://doi.org/10.1016/j.gca.2020.02.016 [Google Scholar] [CrossRef]
17. MacDonald, I. R., Guinasso, N. L., Sassen, R., Brooks, J. M., Lee, L. et al. (1994). Gas hydrate that breaches the sea floor on the continental slope of the Gulf of Mexico. Geology, 22(8), 699–702. https://doi.org/10.1130/0091-7613(1994)022<0699:GHTBTS>2.3.CO;2 [Google Scholar] [CrossRef]
18. Choi, J., Kim, J. H., Torres, M. E., Hong, W. L., Lee, J. W. et al. (2013). Gas origin and migration in the Ulleung Basin, East Sea: Results from the second Ulleung Basin gas hydrate drilling expedition (UBGH2). Marine and Petroleum Geology, 47, 113–124. https://doi.org/10.1016/j.marpetgeo.2013.05.022 [Google Scholar] [CrossRef]
19. Yang, C., Liu, J., Yang, R., Yao, Y., Li, X. et al. (2020). Accumulation model of natural gas hydrate in the Beaufort-Mackenzie Delta Basin, the Arctic. Marine Geology & Quaternary Geology, 40(6), 146–158. [Google Scholar]
20. Osadetz, K. G., Chen, Z. H. (2010). A re-evaluation of Beaufort Sea-Mackenzie Delta basin gas hydrate resource potential: Petroleum system approaches to non-conventional gas resource appraisal and geologically-sourced methane flux. Bulletin of Canadian Petroleum Geology, 58(1), 56–71. https://doi.org/10.2113/gscpgbull.58.1.56 [Google Scholar] [CrossRef]
21. Wu, S., Gong, Y., Mi, L., Wang, Z., Wang, X. (2010). Study on hydrocarbon leakage system and associated gas hydrate reservoirs in the deepwater basin of Northern South China Sea. Geoscience, 24(3), 433–440. [Google Scholar]
22. He, J., Yan, W., Ma, W., Zhu, Y., Chen, S. (2010). The geological significance of the paragenetic association of hydrocarbon and hydrate in Quasi-passive margin the Northern South China Sea. Journal of Southwest Petroleum University (Science & Technology Edition), 32(6), 5–10. [Google Scholar]
23. Ye, J., Wei, J., Liang, J., Lu, J., Lu, H. et al. (2019). Complex gas hydrate system in a gas chimney, South China Sea. Marine and Petroleum Geology, 104, 29–39. https://doi.org/10.1016/j.marpetgeo.2019.03.023 [Google Scholar] [CrossRef]
24. Chen, Z., Jiang, T., Kuang, Z., Cheng, C., Xiong, P. et al. (2022). Accumulation characteristics of gas hydrate-shallow gas symbiotic system in Qiongdongnan Basin. Earth Science, 47(5), 1619–1634. https://doi.org/10.3390/en16010234 [Google Scholar] [CrossRef]
25. Zhang, W., Liang, J., Su, P., Wei, J., Gong, Y. et al. (2019). Distribution and characteristics of mud diapirs, gas chimneys, and bottom simulating reflectors associated with hydrocarbon migration and gas hydrate accumulation in the Qiongdongnan Basin, northern slope of the South China Sea. Geological Journal, 54(6), 3556–3573. https://doi.org/10.1002/gj.3351 [Google Scholar] [CrossRef]
26. He, Y., Liang, J., Shi, W., Kuang, Z., Deng, W. et al. (2022). Influencing factors and accumulation modes of gas hydrate in south low uplift and its surrounding area of Qiongdongnan Basin. Earth Science, 47(5), 1711–1727. [Google Scholar]
27. Grauls, D. (2001). Gas hydrates: Importance and applications in petroleum exploration. Marine and Petroleum Geology, 18(4), 519–523. https://doi.org/10.1016/S0264-8172(00)00075-1 [Google Scholar] [CrossRef]
28. Zhou, S., Li, Q., Lv, X., Pang, W., Fu, Q. (2019). Thinking and suggestions on research direction of natural gas hydrate development. China Offshore Oil and Gas, 31(4), 1–8. [Google Scholar]
29. Zhao, J., Zheng, J., Wang, X., Dong, S., Yang, M. et al. (2022). Effects of underlying gas on formation and gas production of methane hydrate in muddy low-permeability cores. Fuel, 309, 122128. https://doi.org/10.1016/j.fuel.2021.122128 [Google Scholar] [CrossRef]
30. Yang, X., Sun, C. Y., Su, K. H., Yuan, Q., Li, Q. P. et al. (2012). A three-dimensional study on the formation and dissociation of methane hydrate in porous sediment by depressurization. Energy Conversion and Management, 56, 1–7. https://doi.org/10.1016/j.enconman.2011.11.006 [Google Scholar] [CrossRef]
31. Li, R., Cao, B. J., Chen, H. N., Wang, X. H., Sun, Y. F. et al. (2022). Experimental study on the dual-gas co-production from hydrate deposit and its underlying gas reservoir. Energy, 258, 124847. https://doi.org/10.1016/j.energy.2022.124847 [Google Scholar] [CrossRef]
32. Wei, R., Xia, Y., Wang, Z., Li, Q., Lv, X. et al. (2022). Long-term numerical simulation of a joint production of gas hydrate and underlying shallow gas through dual horizontal wells in the South China Sea. Applied Energy, 320, 119235. https://doi.org/10.1016/j.apenergy.2022.119235 [Google Scholar] [CrossRef]
33. Moridis, G. J. (2014). User’s manual for the hydrate v1.5 option of TOUGH+ v1.5: A code for the simulation of system behavior in hydrate-bearing geologic media. https://doi.org/10.2172/1165986 [Google Scholar] [CrossRef]
34. Oshe, O. (2011). A new model that predicts hydrate formation conditions in porous media using the HYDRATERESSIM(RTM) simulator. Kingsville, USA: Texas A&M University. [Google Scholar]
35. Garapati, N. (2013). Reservoir simulation for production of methane from gas hydrate reservoirs using carbon dioxide/carbon dioxide + nitrogen by HydrateResSim. Morgantown, USA: West Virginia University. [Google Scholar]
36. White, M., Lee, W. S. (2014). Guest molecule exchange kinetics for the 2012 Ignik Sikumi gas hydrate field trial. Proceedings of the Offshore Technology Conference, Houston, USA. https://doi.org/10.4043/25374-MS [Google Scholar] [CrossRef]
37. White, M. D., Oostrom, M. (2006). Stomp subsurface transport over multiple phase: User’s guide PNNL-15782 (UC-2010). Richland, Washington: Pacific Northwest National Laboratory. [Google Scholar]
38. Oyama, A., Masutani, S. M. (2017). A review of the methane hydrate program in Japan. Energies, 10(10), 1447. https://doi.org/10.3390/en10101447 [Google Scholar] [CrossRef]
39. Yong, L., Gamwo, I. K. (2009). Comparison of numerical simulators for methane production from hydrate reservoirs. Proceedings of the AIChE Annual MeetingNashville, USA. [Google Scholar]
40. White, M. D., Kneafsey, T. J., Seol, Y., Waite, W. F., Uchida, S. et al. (2020). An international code comparison study on coupled thermal, hydrologic and geomechanical processes of natural gas hydrate-bearing sediments. Marine and Petroleum Geology, 120, 104566. https://doi.org/10.1016/j.marpetgeo.2020.104566 [Google Scholar] [CrossRef]
41. Wilder, J. W., Moridis, G. J., Wilson, S. J., Kurihara, M., White, M. D. et al. (2008). An international effort to compare gas hydrate reservoir simulators. Proceedings of the 6th International Conference on Gas Hydrates, pp. 1–12. Vancouver British Columbia, Canada. [Google Scholar]
42. Li, S., Li, S., Zheng, R., Li, Q., Pang, W. (2021). Strategies for gas production from class 2 hydrate accumulations by depressurization. Fuel, 286, 119380. https://doi.org/10.1016/j.fuel.2020.119380 [Google Scholar] [CrossRef]
43. Uddin, M., Coombe, D., Law, D., Gunter, B. (2008). Numerical studies of gas hydrate formation and decomposition in a geological reservoir. Journal of Energy Resources Technology, 130(3), 032501. https://doi.org/10.1115/1.2956978 [Google Scholar] [CrossRef]
44. Lee, T., Son, H., Lee, J., Ahn, T., Kang, N. (2022). Geomechanically sustainable gas hydrate production using a 3D geological model in the Ulleung Basin of the Korean East Sea. Energies, 15(7), 2569. https://doi.org/10.3390/en15072569 [Google Scholar] [CrossRef]
45. Liu, J. L. (2018). Numerical study on optimization producing scheme of hydrate reservoirs in Shenhu area. Qingdao, China: China University of Petroleum (East China). [Google Scholar]
Cite This Article
 Copyright © 2024 The Author(s). Published by Tech Science Press.
This work is licensed under a Creative Commons Attribution 4.0 International License , which permits unrestricted use, distribution, and reproduction in any medium, provided the original work is properly cited.
 Downloads
 Citation Tools