
 Submit a Paper
 Propose a Special lssue
 Open Access
ARTICLE

Optimization of Gas-Flooding Fracturing Development in Ultra-Low Permeability Reservoirs
1 Tight Oil Research Institute, PetroChina Research Institute of Petroleum Exploration & Development, Beijing, 100083, China
2 Key Laboratory of Unconventional Oil & Gas Development, China University of Petroleum (East China), Qingdao, 266580, China
3 Oil & Gas Technology Research Institute, Changqing Oilfield Company, Xi’an, 710018, China
* Corresponding Author: Wendong Wang. Email:
(This article belongs to the Special Issue: Solid, Fluid, and Thermal Dynamics in the Development of Unconventional Resources )
Fluid Dynamics & Materials Processing 2024, 20(3), 595-607. https://doi.org/10.32604/fdmp.2023.041962
Received 12 May 2023; Accepted 20 September 2023; Issue published 12 January 2024
 View Full Text
 Download PDF
Abstract
Ultra-low permeability reservoirs are characterized by small pore throats and poor physical properties, which are at the root of well-known problems related to injection and production. In this study, a gas injection flooding approach is analyzed in the framework of numerical simulations. In particular, the sequence and timing of fracture channeling and the related impact on production are considered for horizontal wells with different fracture morphologies. Useful data and information are provided about the regulation of gas channeling and possible strategies to delay gas channeling and optimize the gas injection volume and fracture parameters. It is shown that in order to mitigate gas channeling and ensure high production, fracture length on the sides can be controlled and longer fractures can be created in the middle by which full gas flooding is obtained at the fracture location in the middle of the horizontal well. A Differential Evolution (DE) algorithm is provided by which the gas injection volume and the fracture parameters of gas injection flooding can be optimized. It is shown that an improved oil recovery factor as high as 6% can be obtained.Keywords
Nomenclature
| | Porosity |
| | Permeability |
| | Density of oil, gas, aqueous phase |
| | Saturation of oil, gas, aqueous phase |
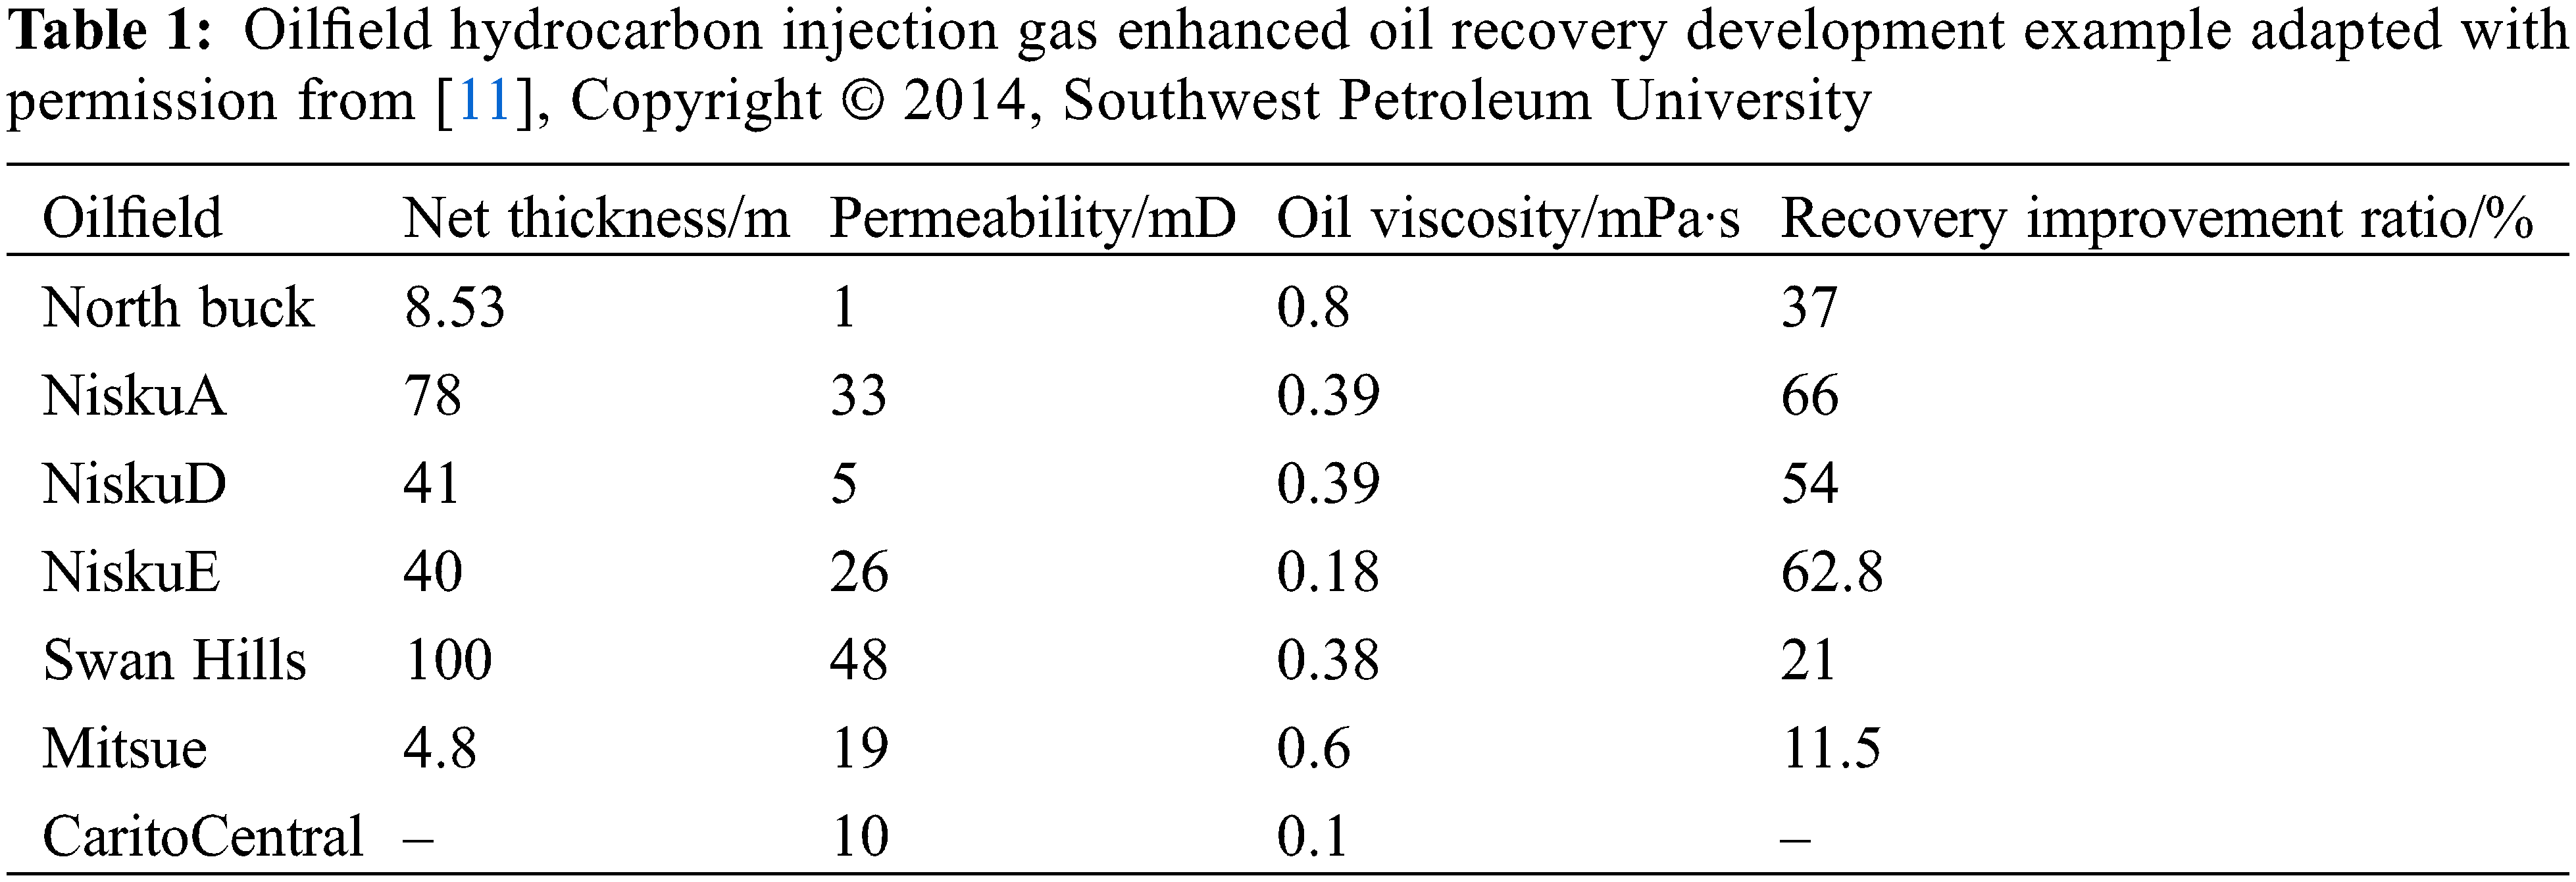
Ultra-low permeability reservoirs are characterized by small pore throats and poor physical properties [1,2], which are at the root of well-known problems related to injection and production. Water injection development is commonly found to be ineffective, and water flooding often results in unsatisfactory development outcomes. Gas injection flooding, however, is has proven to be an effective method for such reservoirs [3,4], significantly improved recovery when combined with implementing horizontal well hydraulic fracturing [5]. As early as the late 1990s, CO2 flooding became the primary method of EOR in the United States [6,7], with output reaching 855 × 104 t, accounting for 23.6% of the total EOR output in the United States [8]. CO2 flooding experiments were carried out successively in Daqing and Dagang oilfields during the 1960s and 1970s [9], and more than 30 well groups were used for gas injection flooding in Jilin Oilfields, with a production capacity of over 200,000 tons [10]. Development examples of enhanced oil recovery through the injection of natural gas are shown in Table 1, demonstrating the effective enhancement of oil recovery and showcasing promising prospects for the application of natural gas injection in development.
In terms of hydrocarbon gas injection and gas energy replenishment, Ding et al. conducted an experimental investigating the factors influencing the efficiency of hydrocarbon gas flooding. They found that the addition of propane could improve the efficiency of hydrocarbon gas flooding, while the timing of gas injection following water flooding exhibited minimal influence on the effectiveness of hydrocarbon gas flooding [12]. Furthermore, the incorporation of CO2 into hydrocarbon gas has been shown to substantially augment the displacement effect on oil [13,14]. On the other hand, the addition of N2, CH4, and flue gas has been observed to elevate the minimum miscible pressure required for hydrocarbon gas displacement of crude oil to varying extents [15,16]. Han et al. carried out experiments using both fine tubes and long cores to investigate the miscibility of various hydrocarbon gas/formation oil, analyze displacement characteristics, and elucidate the variation rule of compositional changes in the produced fluid. Their findings revealed that following gas injection breakthrough, the produced fluid exhibited a heightened presence of lighter components and a reduced amount of heavier components [17]. Drawing from laboratory experiments and numerical simulations, Li et al. pointed out that the higher the recombination fraction content of crude oil in deep fracture-vape reservoirs, the lower the ultimate recovery rate of hydrocarbon gas miscible flooding [18].
Regarding the optimization of fracture parameter, Enab et al., Aly et al. conducted simulation-based optimization of fracture parameters for the tight oil reservoir. They found that the number of fracture clusters and fracture conductivity had a significant effect on the repeated fracturing, while the fracture half-length had a limited effect on oil production levels [19,20]. Jiang et al. examined how fracture parameters in single-well fracturing within horizontal wells influence the production of depleted tight oil reservoirs. They devised a parameter optimization approach using a simulated annealing algorithm to enhance the efficiency of the optimization process [21]. Bhattacharya et al. undertook parameter optimization for fracture parameters aimed at enhancing the development of low-permeability reservoirs. They investigated the effects of fracture conductivity and fracture penetration ratio on single-well production post-fracturing as part of their study [22]. While previous studies have made progress in utilizing gas injection to improve recovery in low permeability reservoirs, it is important to note that reservoir modification becomes a prerequisite prior to implementing gas injection strategies in ultra-low permeability reservoirs. The Shun 98 block within the Changqing oilfield represents a characteristic example of a low-pressure, low-permeability reservoir characterized by pronounced interlayer inhomogeneity and insufficient natural energy supply. There is a lack of a joint optimization solution between gas injection and fracture parameters [23–25]. Therefore, this study proposes to investigate the fracture gas fracture pattern and oil drive mechanism under different fracturing technology modes in ultra-low permeability reservoirs with numerical simulation to establish a foundation for enhancing the efficacy of the gas injection development in ultra-low permeability reservoirs.
2 The Regulation of Gas Channeling for Gas Injection Development in Ultra-Low Permeability Reservoirs
2.1 Seepage Mathematical Model of CO2 Injection
Based on the law of phase equilibrium and mass equilibrium, the traditional multi-phase and multi-component seepage model of CO2 injection is derived by using Darcy’s linear seepage law.
The basic assumptions of the model include:
a. Reservoir fluid is oil, gas and water;
b. Fluid flow in reservoir conforms to Darcy law;
c. Reservoir fluid is divided into Nc components, where i = 1 is CO2 component, i = 2, 3,
d. The effect of gravity is not considered;
e. The whole seepage process is an isothermal process;
f. Formation oil and injected gas are the first contact miscible.
The mathematical model of oil, gas and water three-phase multi-component seepage is established. ni,o, ni,g, ni,w represent the molar fraction of the i components of oil, gas, and water, respectively.
The seepage continuity equation of CO2 component (i = 1):
The seepage continuity equation of i component (i ≠ 1):
Eq. (1) has two more terms
Based on the law of phase balance and material balance, Darcy’s linear seepage law is used to deduce the traditional three-phase seepage model of multi-component oil, gas and water in CO2 injection, which lays a foundation for the numerical simulation of CO2 injection.
2.2 Reservoir Simulation Model
Ordos Basin is a low-pressure and low-permeability reservoir characterized by its low permeability, poor reservoir physical properties, strong inter-formation inhomogeneity and insufficient natural energy supply, etc. Crude oil cannot be recovered very effectively by water injection. At present, some progress has been made in the hydraulic fracturing of gas injection development in the ultra-low permeability reservoir development pilot area in Shun 98 area of Changqing oilfield. The hydrocarbon gas or CO2 gas injected into the well is dissolved in the oil under formation conditions, which reduces the viscosity of the oil and replenishes the energy of the formation, which is very beneficial for production, but it is easy to produce gas scrambling. Therefore, carrying out the study of hydrocarbon gas injection to enhance recovery in the long 8-layer section in this area will play a key role in the development of gas injection in ultra-low permeability reservoirs and improve economic efficiency.
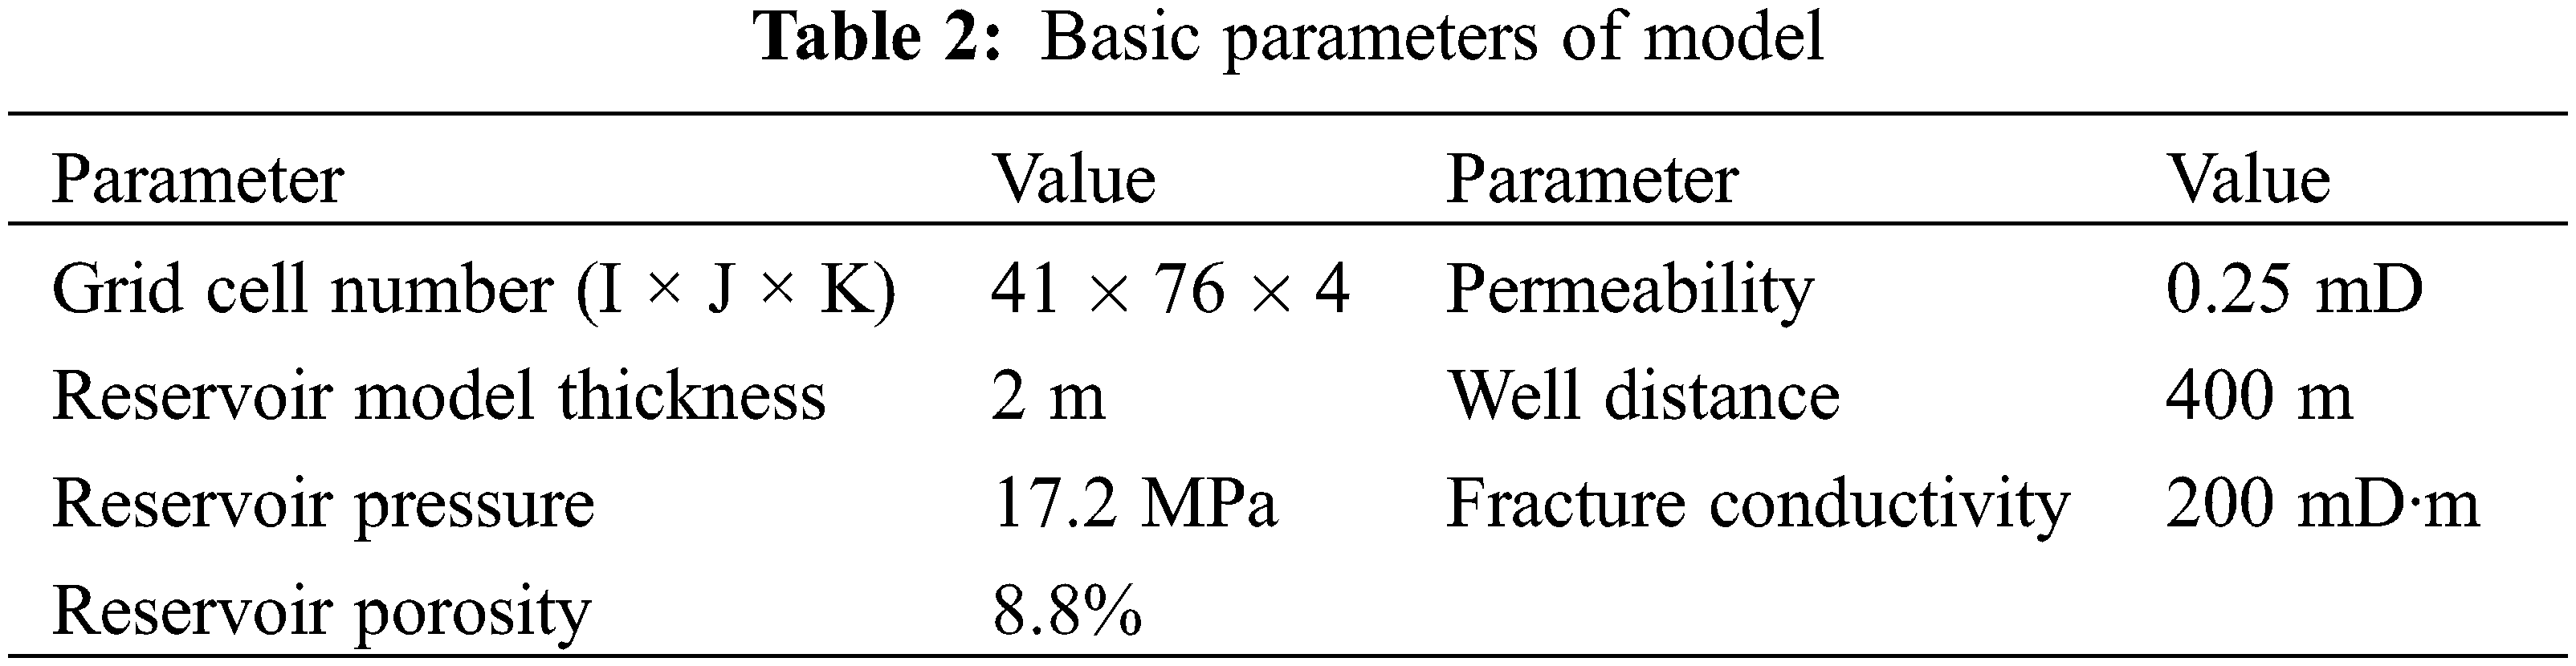
We established a numerical simulation model for different fracturing technology modes, including straight well injection horizontal well extraction in a five-point well network. The dimensions of this model is 410 m × 760 m × 8 m, and the model baseline data are shown in Table 2.
The five-point well network primarily comprises vertical-horizontal well in various geometrical shapes, such as rectangular, spindle, triangular and dumbbell shapes, as shown in Fig. 1. A numerical simulation model is established to investigate different fracturing technology modes in the five-point well network. This model allows for the analysis of fracture channeling patterns, their timing, and the corresponding effects on production enhancement based on different fracture morphologies.
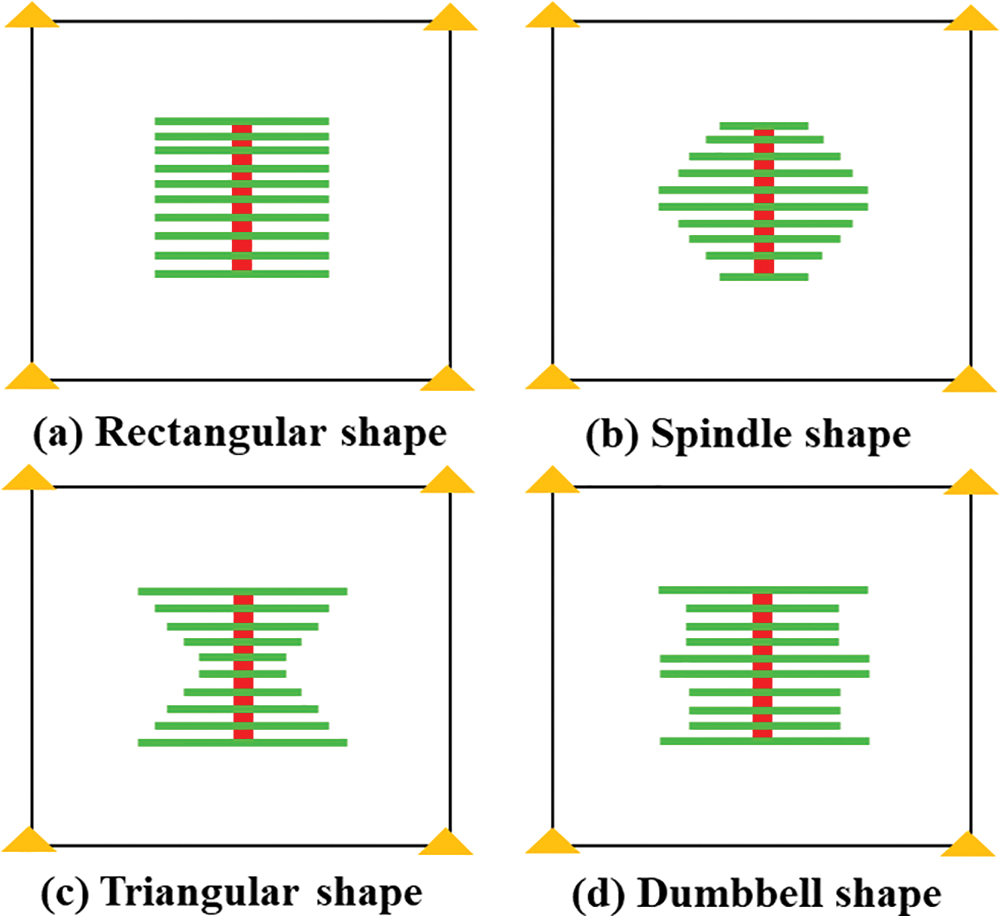
Figure 1: Schematic diagram of different fracturing technologies models for horizontal wells in: (a) rectangular shape, (b) spindle shape, (c) triangular shape, (d) dumbbell shape
2.3 The Regulation of Gas Channeling under Different Fracture Morphology
Using a consistent gas injection volume (19 × 106 m3) of associated gas injection and a bottom flow pressure of 8 MPa in the production well, the effect of gas channeling under different gas rate ranging from 1500 to 5000 m3/d in a single well was evaluated, as shown in Fig. 2. Gas channeling in the gas injection development is determined by the production gas-oil ratio, with a reservoir considered to be experiencing gas channeling when the production gas-oil ratio exceeds 600 m3/m3. The results indicate that as the gas rate increases, the time of gas channeling decreases in the five-point well network with the horizontal wells. Among the four fracture morphologies considered, the spindle fracture morphology demonstrates a significantly delayed gas channeling compared to the other three fracture morphologies. This delay can be attributed to the presence of short side fractures within the spindle morphology.
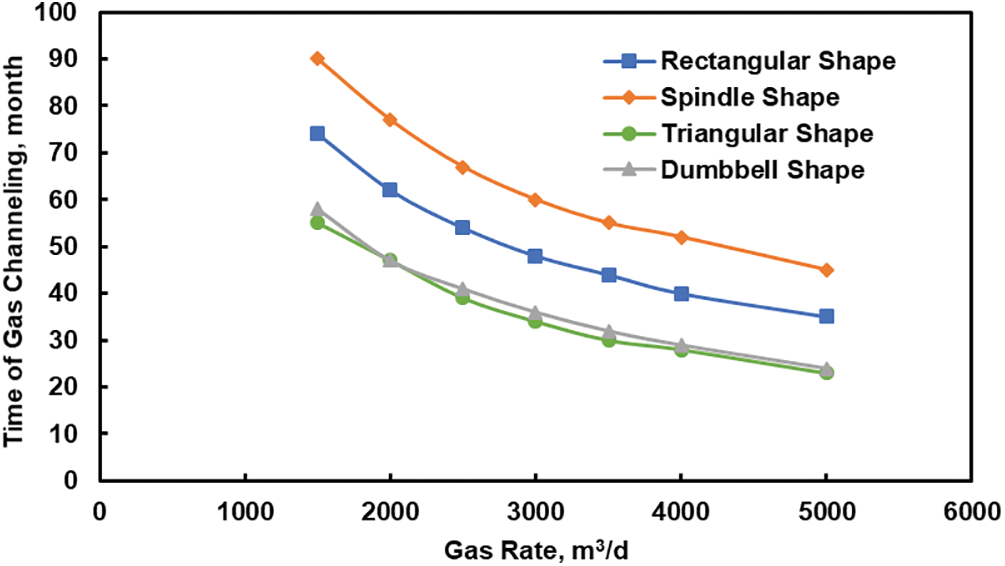
Figure 2: Time of gas channeling with different fracture morphologies
The injection rate of associated gas will remain constant at 3500 m3/d, while the bottom flow pressure of the production well will be maintained at 8 MPa. Fig. 3 compares the cumulative oil production from a single fracture with different fracture morphologies. Notably, the presence of side fractures in the spindle shape results in lower cumulative oil production compared to other fracture morphologies. However, the middle fracture can consistently demonstrates a high oil production effect due to the retardation of gas channeling. Therefore, to retard gas channeling and ensure optimal production, it is recommended to control the length of fractures on the sides while creating longer fractures in the middle. This strategy enables complete gas flooding at the middle fracture location within the horizontal well, thus ensuring that the gas drive effectively reaches this critical point.
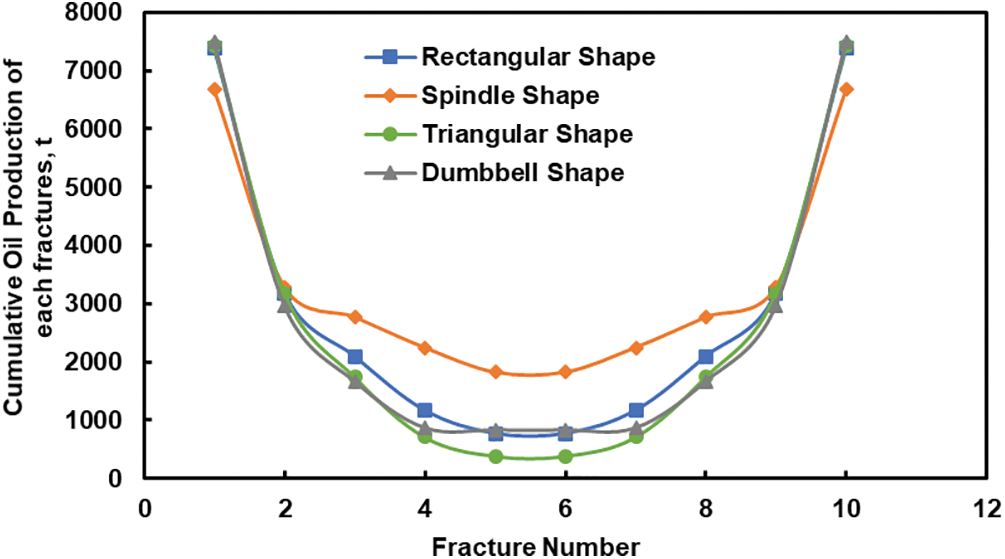
Figure 3: Cumulative oil production of each fractures with different fracture morphology
3 Seepage Mechanism with Different Fracture Morphologies
Compared to water injection development, gas injection development is more susceptible to gas flow along fractures. However, a clear understanding of gas flow characteristics in gas injection development with different fracture morphologies are lacking. Therefore, in order to investigate the seepage mechanism of gas injection development in horizontal wells with different fracture morphologies and establish a foundation for optimizing gas injection and fracture parameters, fracture seepage characteristics and fracture contribution analysis were conducted within the well group unit using the aforementioned model parameters. For the rectangular shape fracture morphology, the fracture half-length is set at 80 m. In the evolved two-stage fracture morphology, the combined fracture half-length is 100 and 140 m, while the three-stage fracture morphology features a combined fracture half-length of 80, 100 and 160 m, as shown in Fig. 4.
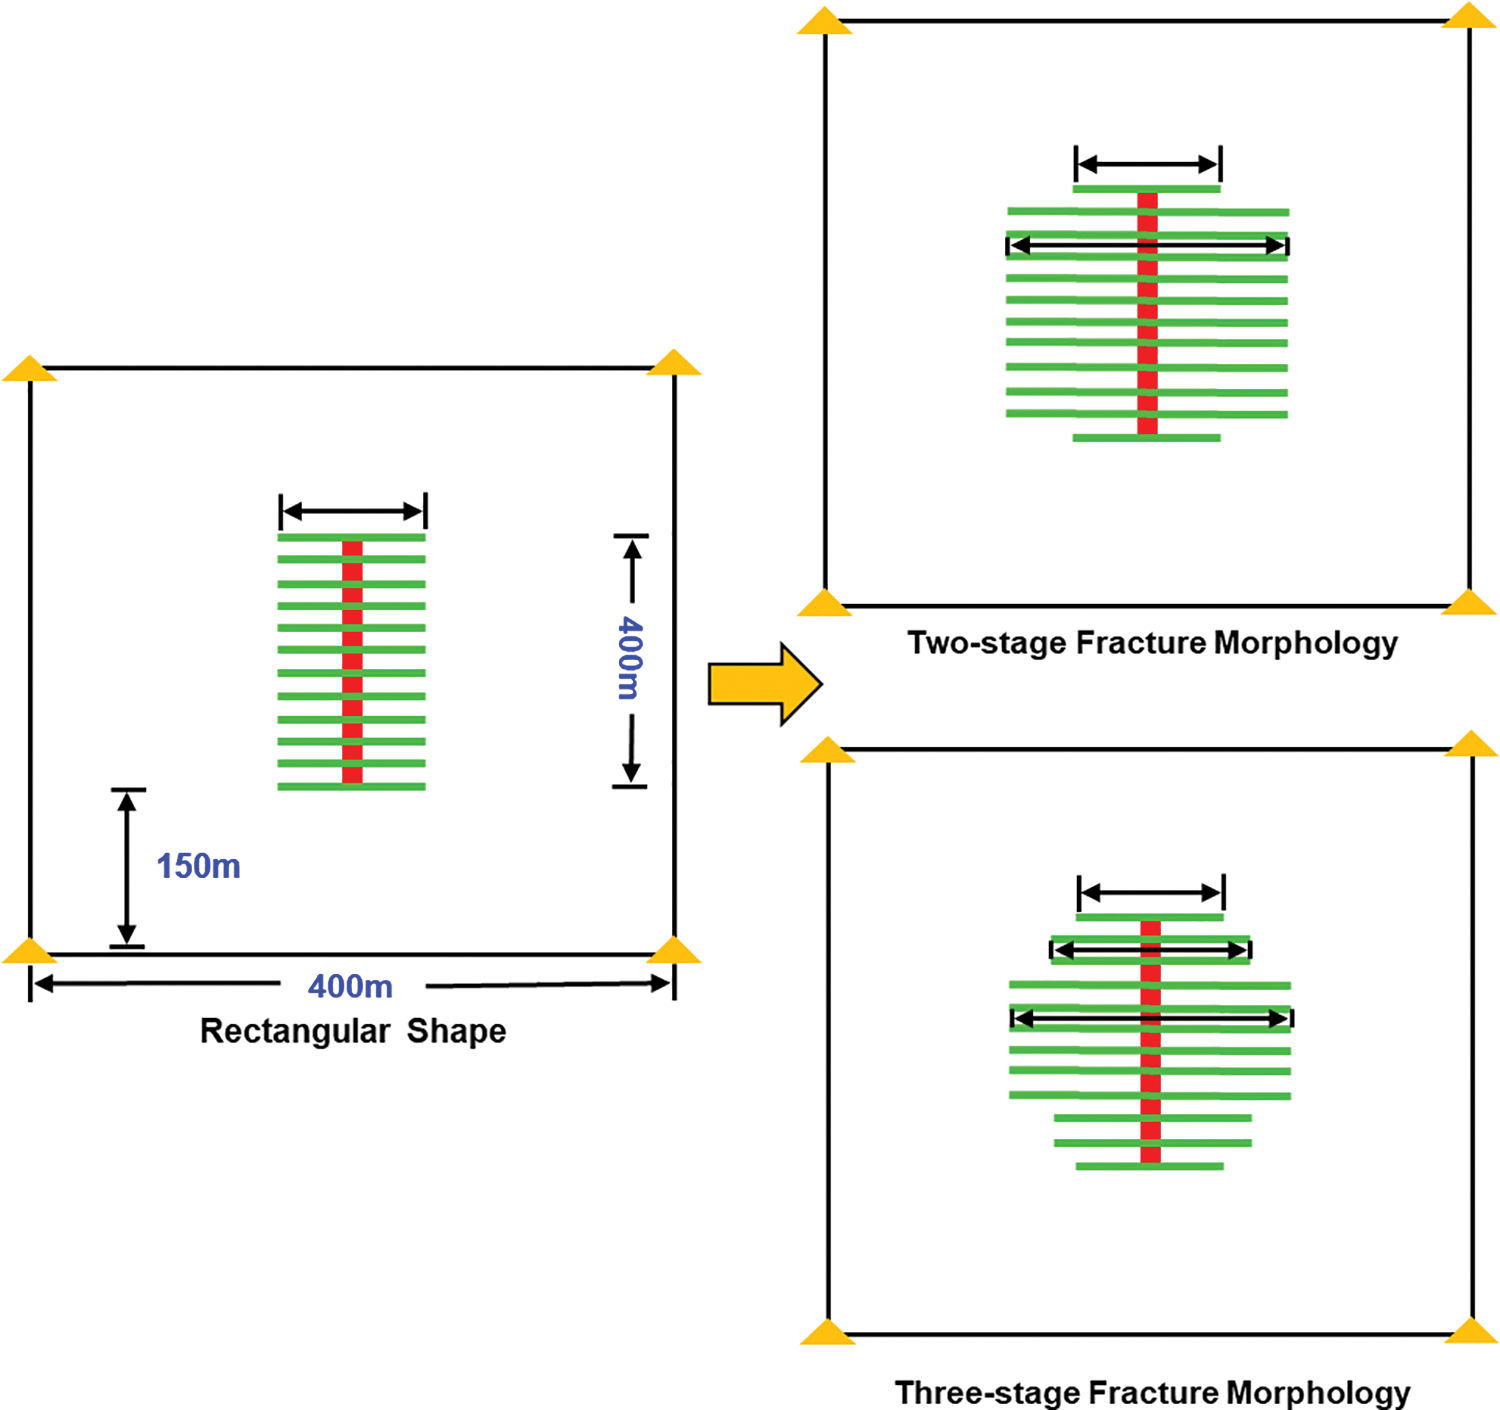
Figure 4: Fracture morphology evolution
3.1 Seepage Mechanism Two-Stage Fracture Morphology Gas Injection Development
Based on the countermeasure of delaying gas channeling observed in the evolution of the rectangular shape network, a two-stage fracture morphology is proposed to explore the seepage mechanism of gas injection development with different fracture half-lengths. The study assumes a constant fracture conductivity of 200 mD·m and an injection rate of 3500 m3/d for a duration of 15 years.
Fig. 5 demonstrates an important observation: as the length of the side fractures decreases, the duration of gas channeling increases, resulting in higher cumulative oil production in the two-stage fracture morphology. Additionally, the production contribution rate of the side fracture and the time duration of gas channeling gradually increase with longer central fractures, ultimately contributing up to 50% of the production from the horizontal well. The optimal fracture parameters are determined to be 80 m for side fractures and 120 m for central fractures. However, when comparing the results to the rectangular fracture morphology, it becomes evident that longer central fractures lead to premature gas channeling. Therefore, considering a three-stage fracture morphology might be a viable option.
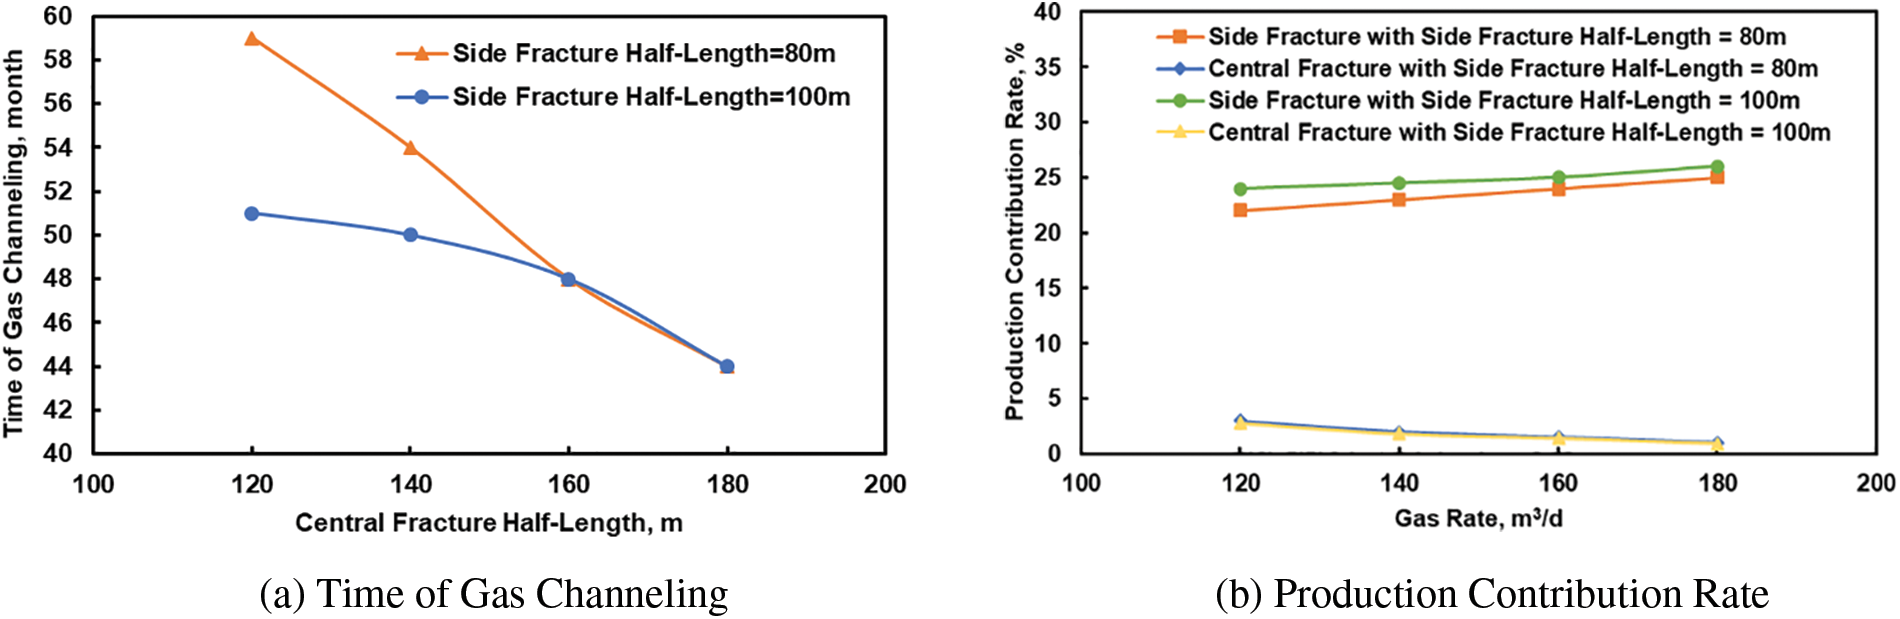
Figure 5: Time of gas channeling and production contribution rate in two-stage fracture morphology with different fracture morphologies
3.2 Seepage Mechanism of Three-Stage Fracture Morphology Gas Injection Development
Based on the insights gained from the two-stage fracture morphology, we propose a three-stage fracture morphology to further investigate the seepage mechanism of gas injection development with different fracture half-lengths. The study maintains a constant fracture conductivity of 200 mD·m and an injection rate of 3500 m3/d over a 15 years period.
Fig. 6 emphasizes the importance of controlling the half-length of the first two sections of the fracture in the three-stage fracture morphology. The production experiences a rapid increase, but it reaches a plateau when the half-length of the middle fracture exceeds 160 m. Interestingly, the cumulative oil production from the side and middle fractures remains fairly consistent despite variations in fracture half-length. However, in contrast to the two-stage morphology, the total production increases as the length of the middle fracture grows. Thus, the three-stage fracture morphology strategy focesus on optimizing the length of the first section of the fracture while maximizing the length of the middle fracture to enhance production.
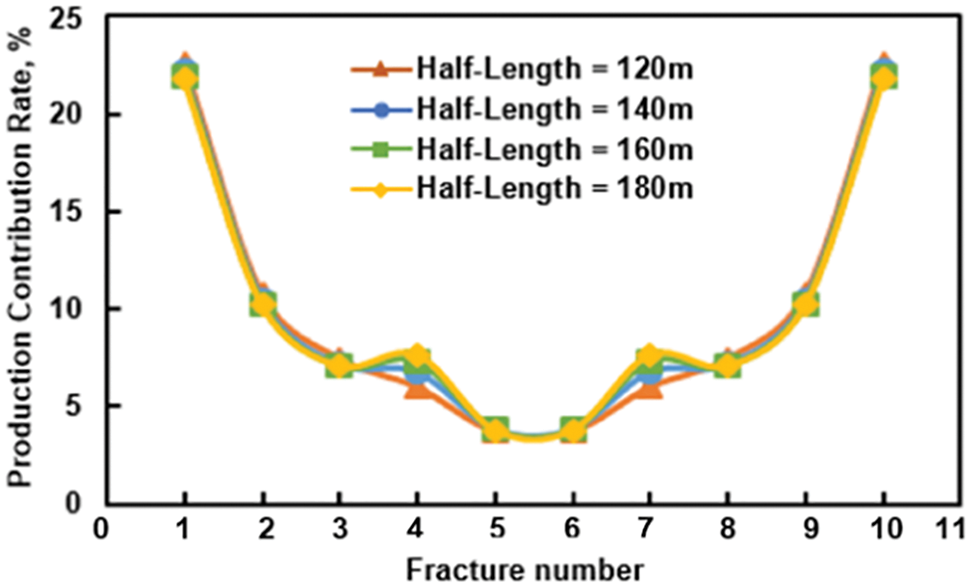
Figure 6: Production contribution rate in three-stage fracture morphology with different fracture morphologies
Figs. 7 and 8 present the results the time of gas channeling and production contribution rate for different fracture morphologies. It is evident that the three-stage fracture morphology outperforms other configurations in both evaluation indexes. The findings highlight the susceptibility of side fractures to gas channeling. Short fractures prove beneficial in delaying gas channeling, while middle fractures exhibit greater resistance. Long fractures, on the other hand, facilitate the injection of gas waves and enhance lateral displacement of crude oil into the fractures. These findings provide valuable insights for selecting fracture morphologies, including fracture half-length and development parameters such as gas injection rate, for effective implementing of fracturing measures in the field.
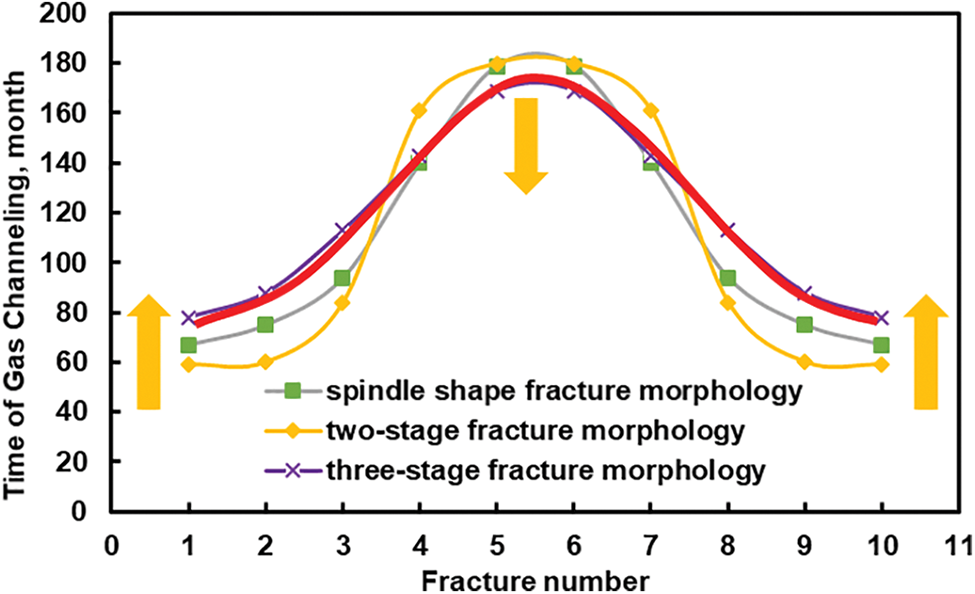
Figure 7: Time of gas channeling with different fracture morphologies
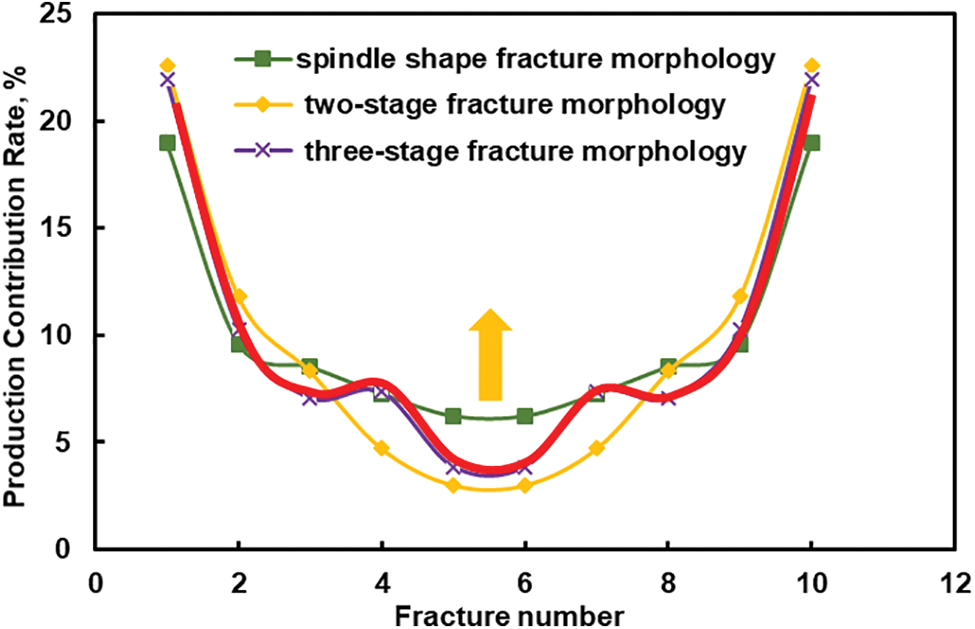
Figure 8: Production contribution rate with different fracture morphologies
4 Optimization of Fracture Parameters Based on Differential Evolutionary Algorithm
4.1 Joint Optimization Workflow of Gas Injection Volume and Fracture Parameters
In the gas injection development of fractured horizontal wells in ultra-low-permeability reservoirs, optimizing fracture parameters is crucial for improving oil recovery and mitigating gas channeling. These parameters include fracture morphology, number of fractures, fracture half-length, fracture conductivity, and gas injection volume. To accomplish this optimization, the paper proposes to use the Differential Evolution (DE) algorithm to jointly optimize the gas injection volume and fracture parameters.
DE is an adaptive global optimization algorithm that operates based on the cooperative and competitive processes within population. By simulating these processes through random search and selection memory in the continuous domain space, DE solves optimization problems. The algorithm is characterized by its simplicity, requiring only a few control parameters, namely the crossover probability and scaling factor, and it is robust and easily implementable. In the DE algorithm, the population represents the evolving entity and comprises multiple groups of individuals. The algorithm involves four genetic operations, including population initialization, mutation, crossover, and selection. A generation of evolution is completed once all individuals within the population have undergone these four genetic operations.
In the scheme design, the optimization of fracture parameters for gas injection and fracture is conducted, considering two-stage and three-stage fracture morphology based on the rectangular fracture shape. By employing the Latin hypercube sampling method, different combinations of fracture parameters are generated to form a machine learning optimization sample set, consisting of a total of 2000 samples. As is shown on Fig. 9, the optimization process begins with parameter initialization, providing initial values for four input parameters: fracture morphologies, number of fractures, fracture half-length and fracture conductivity. And then the DE algorithm is utilized to update the variables, randomly updates within the specified range are performed while adhering to the constraints. The adaptation value of each individual in the population is calculated, and an iteration loop is initiated. The variation, crossover, and selection operations are sequentially carried out until the termination condition is met. The number of iterations is incremented, and the next iteration begins. The adaptation value of each individual is recalculated until the maximum number of iterations is reached, ultimately yielding the optimal solution obtained through automatic preference.
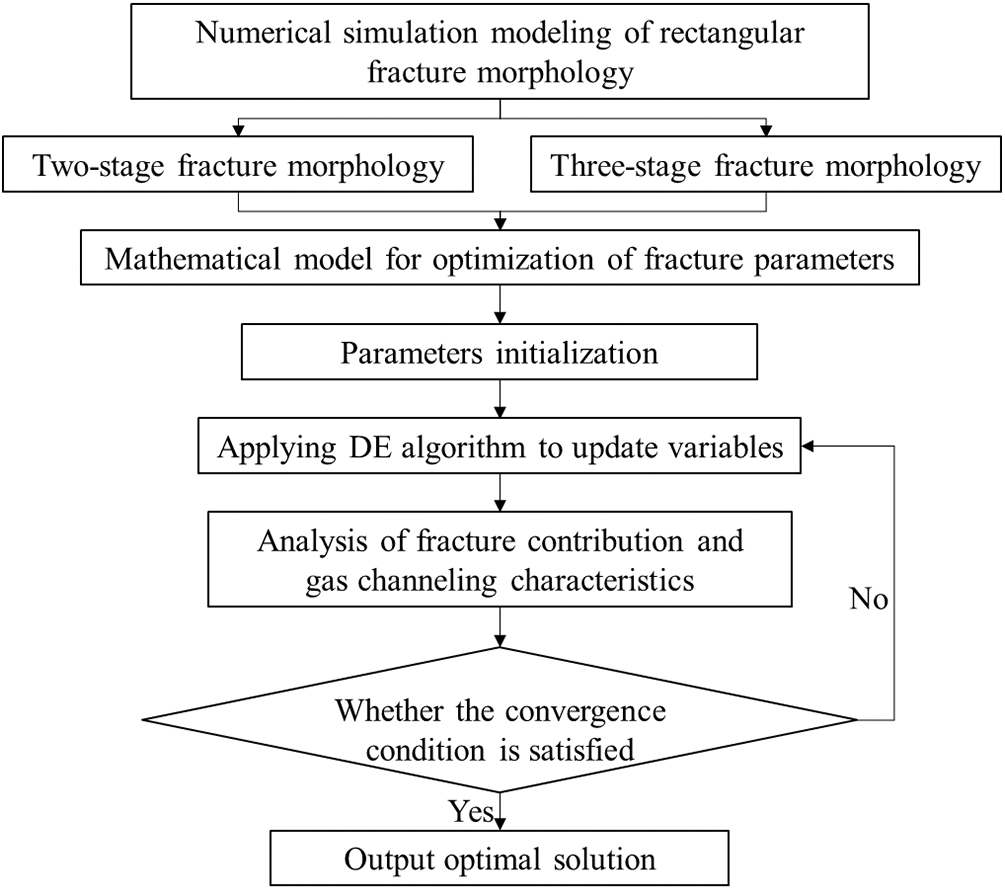
Figure 9: Optimization workflow of fracture parameters
4.2 Optimization Design of Fracture Parameters
Taking the three-stage fracture morphology as an example, Table 3 shows the statistical information of cumulative oil production and recovery degree before and after optimization. The optimized scheme outperforms the maximum value in the design scheme, resulting in higher oil production and recovery factor. This indicates that the optimized scheme yields the most favorable development effect with significantly increased cumulative oil production, surpassing the initial scheme by approximately 11.94%.
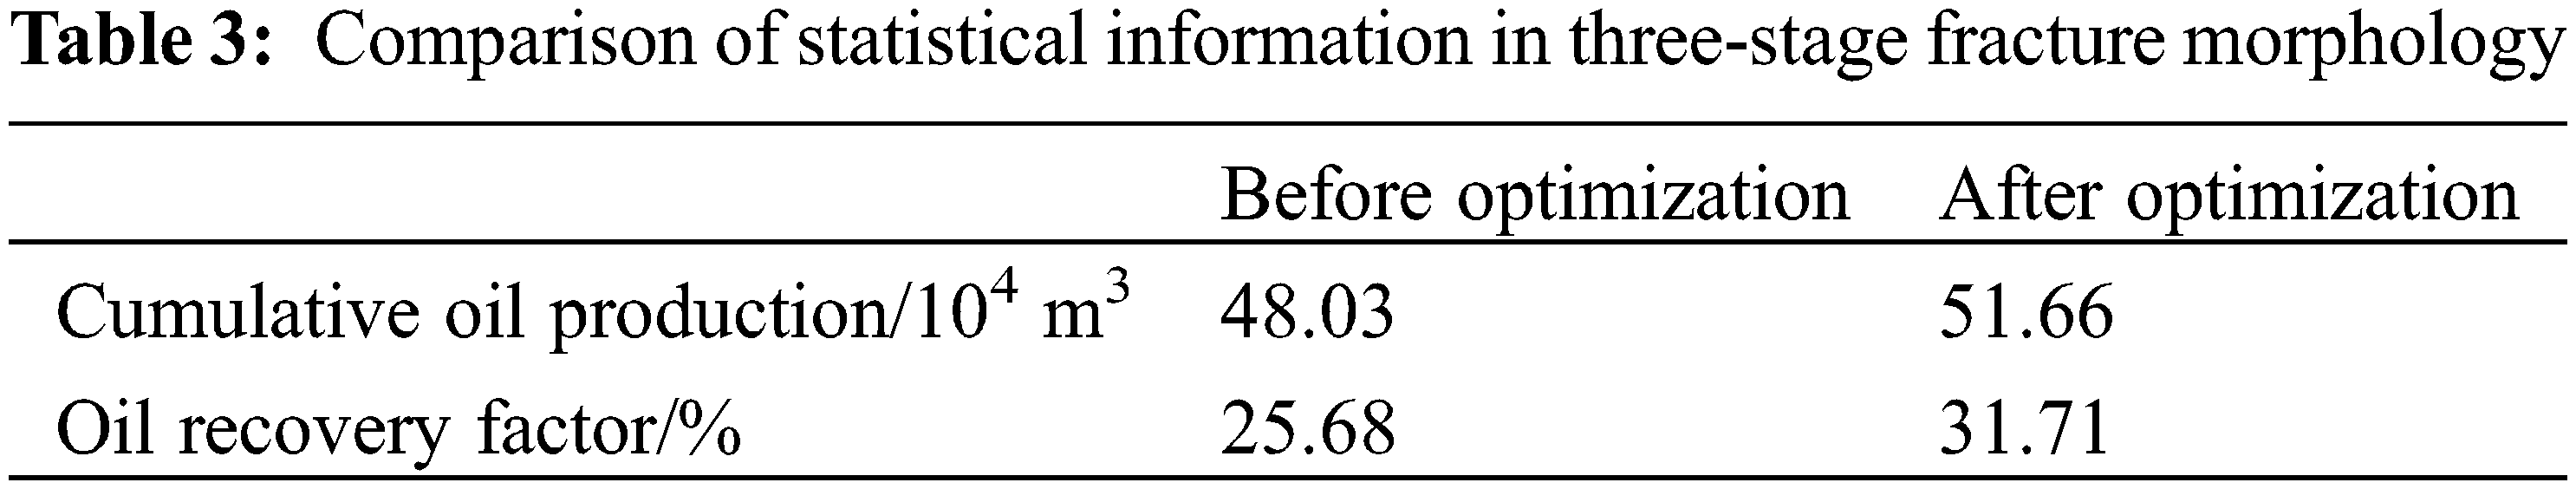
Fig. 10 displays the oil saturation distribution before and after optimization, demonstrating a substantial decrease in oil saturation within the central fracture area across the well group following the optimization process. Specifically, the optimization strategy effectively converts the previously localized high-efficiency residual oil repulsion at the side of the horizontal well into a uniform repulsion across the entire horizontal section. This transformation successfully delays gas channeling and reducing the inefficient circulation of injected gas. Consequently, it enhances the gas utilization rate and achieves an optimal development effect.
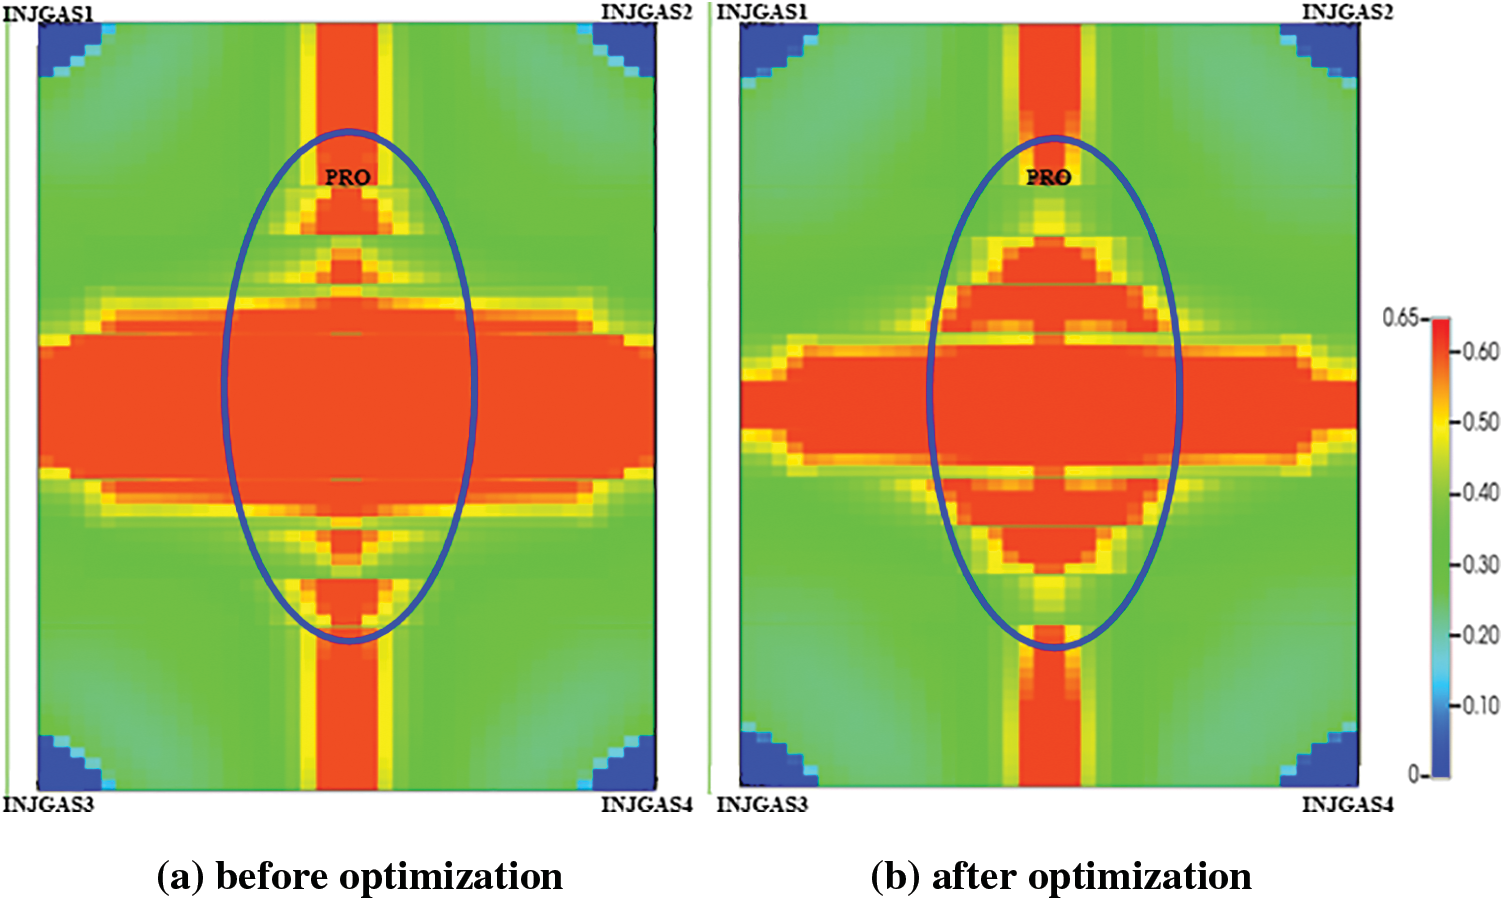
Figure 10: Comparison of oil saturation map in three-stage fracture morphology
Before optimization, the fracture parameters were as follows: a constant gas rate of 3500 m3/d, 10 fractures with a length of 150 m, and a fracture conductivity of 200 mD·m. Based on the DE algorithm, the optimal fracturing parameters for the two-stage fracture morphology were determined. These parameters consist of a gas rate of 3400 m3/d, 6 fractures on the side with a length of 80 m, 4 fractures in the middle with a length of 180 m, and a fracture conductivity of 180 mD·m. For the three-stage fracture morphology, the optimal parameters obtained through the DE algorithm were as follows: a gas rate of 3800 m3/d, 2 fractures on the side with a length of 80 m, 4 fractures in the second section with a length of 160 m, 4 fractures in the middle with a length of 160 m, and a fracture conductivity of 200 mD·m.
As can be seen from Fig. 11, comparing the oil saturation distribution under the two fracture morphologies. A distinct advantage of the three-stage fracture morphology is observed, wherein the presence of a short and fixed second fracture results in significant production during the gas channeling. Furthermore, increasing the fracture length in the middle has minimal influence on the dead zone between the gas injection wells. The oil recovery factor for the three-stage fracture morphology stands at approximately 32.18%, while the two-stage fracture morphology achieves around 28.94%. Therefore, considering the time of gas channeling and the fracture conductivity, it is evident that the three-stage fracture morphology is superior in terms of delaying gas channeling and increasing production.
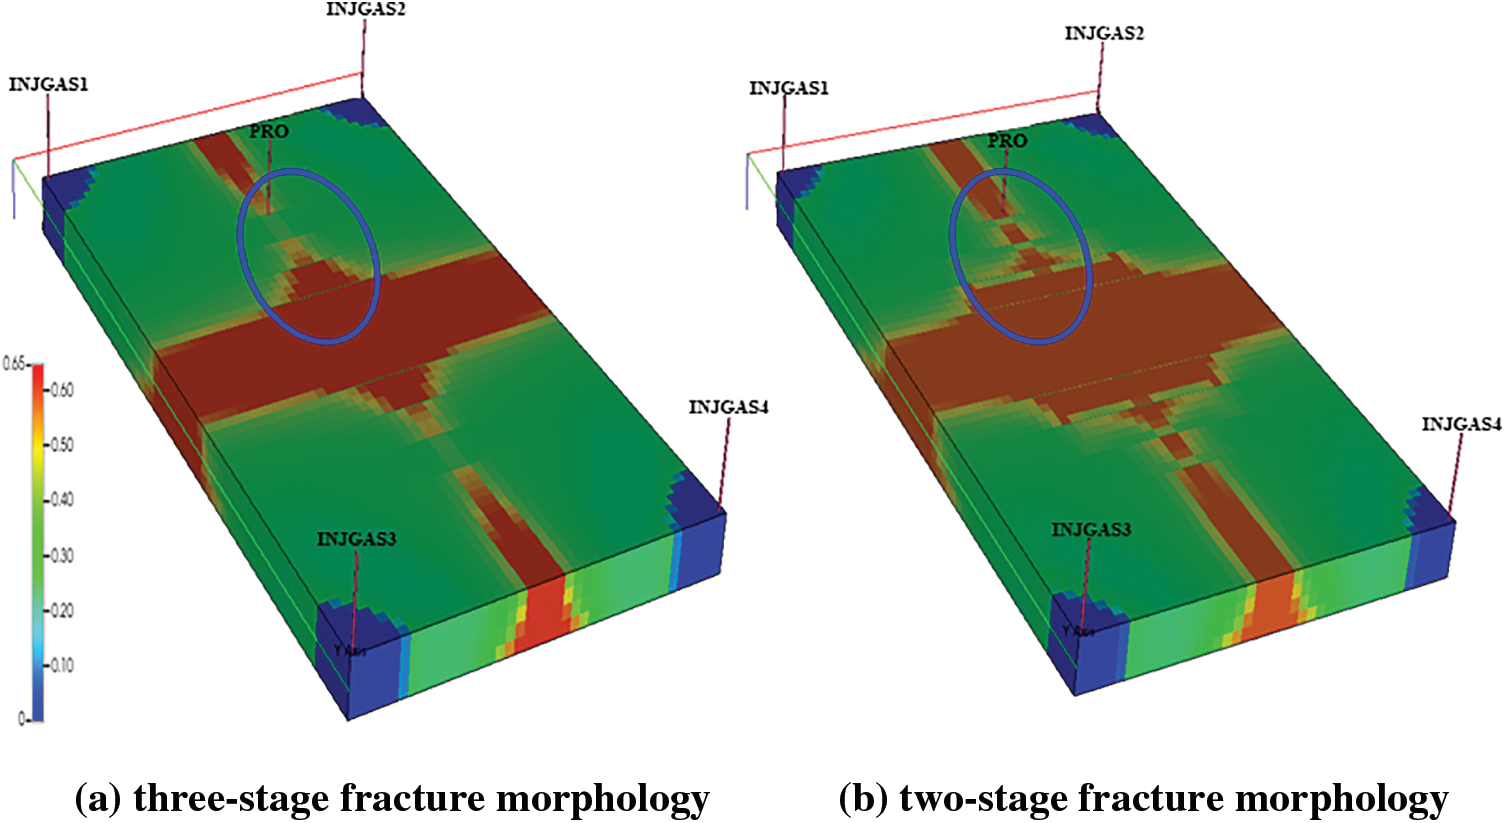
Figure 11: Oil saturation distribution in 15 years of gas flooding with different fracture morphologies
1. Among the four fracture morphologies of horizontal wells, an increase in gas injection reveals that the rectangular fracture morphology has better energy replenishment effect. However, it falls short in terms of both production increase and the time required for gas channeling when compared to the spindle shape. When considering the development characteristics of the four fracture morphologies, it is evident that the spindle pattern yields the best development effect.
2. Compared with the rectangular fracture morphology, it is important to note that excessively long second section fractures under the two-stage fracture morphology can lead to earlier gas channeling. And the three-stage fracture morphology proves to be more effective in delaying gas channeling and increasing production, so as to achieve sufficient gas drive within the middle of the horizontal well. Therefore, considering practical field applications, the adoption of a three-stage fracture morphology for fracture placement can be considered as a viable approach to mitigate gas channeling occurrences.
3. The fracture parameters were as follows: a constant gas rate of 3800 m3/d, 2 fractures in the side with a length of 80 m, 4 fractures in the second section with a length of 160 m, 4 fractures in the middle with a length of 160 m, and a fracture conductivity of 200 mD·m.
Acknowledgement: We would like to express our sincere appreciation to everyone who has contributed to this article. Your support and contributions have been invaluable.
Funding Statement: This work was supported by the Forward Looking Basic Major Scientific and Technological Projects of CNPC (Grant No. 2021DJ2202). The authors would like to thank the reviews whose constructive and detailed critique contributed to the quality of this paper.
Author Contributions: The authors confirm contribution to the paper as follows: study conception and design: Wendong Wang, Yuliang Su; data collection: Lifeng Liu, Jianhui Wang; analysis and interpretation of results: Menghe Shi, Xinyu Zhuang; draft manuscript preparation: Menghe Shi. All authors reviewed the results and approved the final version of the manuscript.
Availability of Data and Materials: The data used in this study is available upon request. Interested researchers can access the data by contacting authors.
Conflicts of Interest: The authors declare that they have no conflicts of interest to report regarding the present study.
References
1. Shanley, K. W., Cluff, R. M. (2015). The evolution of pore-scale fluid-saturation in low-permeability sandstone reservoirs. AAPG Bulletin, 99(10), 1957–1990. [Google Scholar]
2. Blasingame, T. A. (2008). The characteristic flow behavior of low-permeability reservoir systems. SPE Unconventional Resources Conference/Gas Technology Symposium, SPE-114168-MS. Keystone, Colorado, USA. [Google Scholar]
3. Atan, S., Ajayi, A., Honarpour, M., Turek, E., Dillenbeck, E. et al. (2018). The viability of gas injection EOR in Eagle Ford shale reservoirs. SPE Annual Technical Conference and Exhibition, SPE-191673-MS. Dallas, Texas, USA. [Google Scholar]
4. Ghaderi, S. M., Clarkson, C. R., Ghanizadeh, A., Barry, K., Fiorentino, R. (2017). Improved oil recovery in tight oil formations: Results of water injection operations and gas injection sensitivities in the bakken formation of Southeast Saskatchewan. SPE Unconventional Resources Conference, SPE-185030-MS. Calgary, Alberta, Canada. [Google Scholar]
5. Giger, F. M. (1987). Low-permeability reservoirs development using horizontal wells. SPE Rocky Mountain Petroleum Technology Conference/Low-Permeability Reservoirs Symposium, SPE-16406-MS. Denver, Colorado, USA. [Google Scholar]
6. Cinar, Y., Bukhteeva, O., Neal, P. R., Allinson, W. G., Paterson, L. (2008). CO2 storage in low permeability formations. SPE Improved Oil Recovery Conference, SPE-114028-MS. Tulsa, Oklahoma, USA. [Google Scholar]
7. Lim, T. M., Khan, A. S., Sepehrnoori, K., Pope, A. G. (1992). Simulation of carbon dioxide flooding using horizontal wells. Society of Petroleum Engineers, SPE-24929-MS. Washington DC, USA. [Google Scholar]
8. Shoaib, S., Hoffman, B. T. (2009). CO2 flooding the Elm Coulee field. SPE Rocky Mountain Petroleum Technology Conference, SPE-123176-MS. Denver, Colorado, USA. [Google Scholar]
9. Zhu, C., Guo, W., Wang, Y., Li, Y., Gong, H. et al. (2021). Experimental study of enhanced oil recovery by CO2 huff-n-puff in shales and tight sandstones with fractures. Petroleum Science, 2021(18), 52–869. [Google Scholar]
10. Lv, G., Wu, Z., Luan, Z., Chen, J., Lin, W. (2002). Numerical simulation and scheme design of CO2 test area in Jilin oilfield. Oil Drilling Process, 24(4), 39–41+83 (In Chinese). [Google Scholar]
11. Li, C. (2014). Study on the enhanced oil recovery by natural gas injection in block X (Master Thesis). Southwest Petroleum University, China (In Chinese). [Google Scholar]
12. Ding, M., Gao, M., Wang, Y., Qu, Z., Chen, X. et al. (2019). Experimental study on CO2-EOR in fractured reservoirs: Influence of fracture density, miscibility and production scheme. Journal of Petroleum Science and Engineering, 174, 476–485. [Google Scholar]
13. Ahmed, D., Ahmed, E., Curt, B., Mahmoud, A., Mohammed, A. et al. (2012). Early miscible hydrocarbon gas injection in Abu Dhabi heterogeneous carbonate reservoir. SPE EOR Conference at Oil and Gas West Asia, SPE-129238-MS. Muscat, Oman. [Google Scholar]
14. Vatandoost, A., Khorsand, M. R. (2019). Enhanced method-of-characteristics approach for determination of minimum miscibility pressure in displacements with bifurcated phase behavior. Industrial & Engineering Chemistry Research, 58(39), 18397–18410. [Google Scholar]
15. Bougre, E. S., Gamadi, T. D. (2021). Enhanced oil recovery application in low permeability formations by the injections of CO2, N2 and CO2/N2 mixture gases. Journal of Petroleum Exploration and Production, 11, 1963–1971. [Google Scholar]
16. Lin, X., Meisingset, K., Espelid, A. (2014). When BlackOil approximates compositional simulation on dry gas injection: A case study in Oseberg Vestflanken field, Norway. SPE Norway Subsurface Conference, SPE-169215-MS. Bergen, Norway. [Google Scholar]
17. Han, H., Zhou, D., Wang, L., Yu, H., Fan, K. et al. (2021). Control mechanism for enhanced oil recovery with hydrocarbon injection at the top of ultra-deep and thick oil reservoirs. Journal of China University of Petroleum (Natural Science Edition), 45(2), 104–110. [Google Scholar]
18. Li, J., Sun, Z., Tan, T., Guo, C., Xie, S. et al. (2021). Feasibility and influencing factors of hydrocarbon-gas miscible flooding in deep fractured-cavity reservoirs. Xinjiang Petroleum Geology, 42(6), 714–719 (In Chinese). [Google Scholar]
19. Aly, M., Hanamertani, A. S., Saraji, S. (2022). Impact of fracture orientation on supercritical carbon dioxide-foam performance and optimization in sandstones. Journal of Cleaner Production, 377, 134212. [Google Scholar]
20. Enab, K., Ertekin, T. (2021). Screening and optimization of CO2-WAG injection and fish-bone well structures in low permeability reservoirs using artificial neural network. Journal of Petroleum Science and Engineering, 200, 108268. [Google Scholar]
21. Jiang, H., Zhao, Y., Chen, Q., Li, J., Cheng, B. et al. (2020). Optimal method of fracture parameters for horizontal well fracturing in tight oil reservoir. China Olfshore Oil and Gas, 32(3), 77–85. [Google Scholar]
22. Bhattacharya, S., Nikolaou, M., Economides, M. J. (2012). Unified fracture design for very low permeability reservoirs. Journal of Natural Gas Science and Engineering, 9, 184–195. [Google Scholar]
23. Urban-Rascon, E., Aguilera, R. (2020). Machine learning applied to SRV modeling, fracture characterization, well interference and production forecasting in low permeability reservoirs. SPE Latin America and Caribbean Petroleum Engineering Conference, SPE-199082-MS. [Google Scholar]
24. Prasetio, M. H., Anggraini, H., Tjahjono, H., Pramadana, A. B., Akbari, A. et al. (2021). Success story of optimizing hydraulic fracturing design at alpha low-permeability reservoir. SPE Asia Pacific Oil and Gas Conference and Exhibition, SPE-205703-MS. [Google Scholar]
25. Ahmed, S., Elraies, K. A., Hashmet, M. R., Alvinda, S. H., Siti, R. B. (2018). Laboratory study of CO2 foam for enhanced oil recovery: Advanced screening, optimization, and evaluation. SPE Kingdom of Saudi Arabia Annual Technical Symposium and Exhibition, SPE-192351-MS. Dammam, Saudi Arabia. [Google Scholar]
Cite This Article
 Copyright © 2024 The Author(s). Published by Tech Science Press.
This work is licensed under a Creative Commons Attribution 4.0 International License , which permits unrestricted use, distribution, and reproduction in any medium, provided the original work is properly cited.
 Downloads
 Citation Tools