
 Submit a Paper
 Propose a Special lssue
 Open Access
ARTICLE

Microscopic Analysis of Cementitious Sand and Gravel Damming Materials
1 College of Water Conservancy, Yunnan Agricultural University, Kunming, 650201, China
2 Tianqi Engineering Consulting Co., Ltd., Kunming, 650000, China
3 Institute of International Rivers and Ecological Security, Yunnan University, Kunming, 650500, China
* Corresponding Authors: Aimin Gong. Email: ; Feipeng Liu. Email:
(This article belongs to the Special Issue: Advances in Solid Waste Processing and Recycling Technologies for Civil Engineering Materials)
Fluid Dynamics & Materials Processing 2024, 20(4), 749-769. https://doi.org/10.32604/fdmp.2023.042566
Received 04 June 2023; Accepted 29 August 2023; Issue published 28 March 2024
 View Full Text
 Download PDF
Abstract
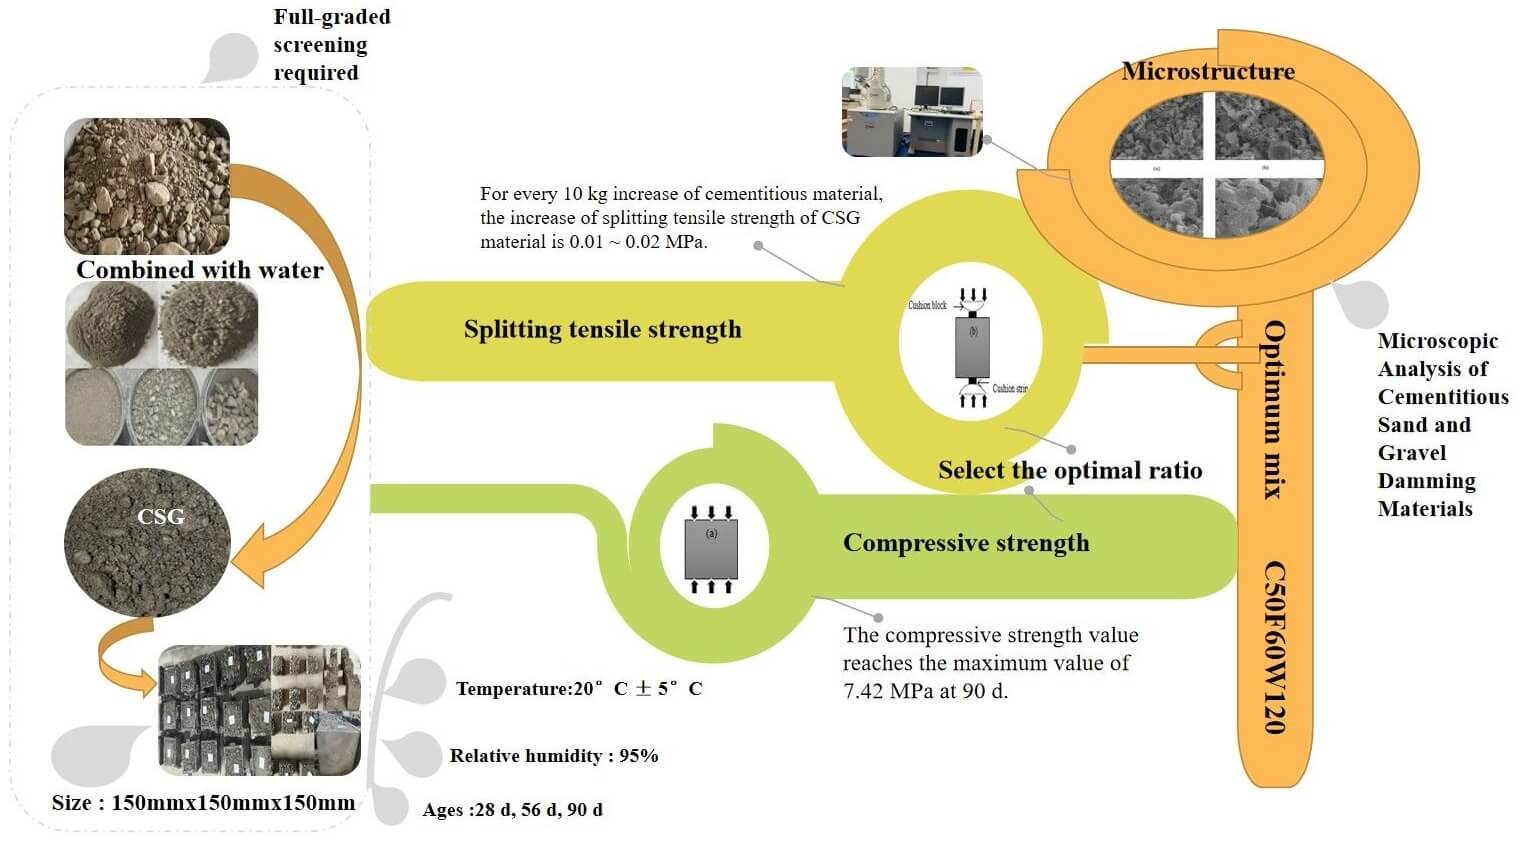
The mechanical properties of cementitious sand and gravel damming material have been experimentally determined by means of microscopic SEM (Scanning Electron Microscopy) image analysis. The results show that the combination of fly ash and water can fill the voids in cemented sand and gravel test blocks because of the presence of hydrated calcium silicate and other substances; thereby, the compactness and mechanical properties of these materials can be greatly improved. For every 10 kg/m3 increase in the amount of cementitious material, the density increases by about 2%, and the water content decreases by 0.2%. The amount of cementitious material used in the sand and gravel in these tests was 80–110 kg/m3, the water-binder ratio was 1–1.50. Moreover, the splitting tensile strength was 1/10 of the compressive strength, and the maximum strength was 7.42 MPa at 90 d. The optimal mix ratio has been found to be 50 kg of cement, 60 kg of fly ash and 120 kg of water (C50F60W120). The related dry density was 2.6 g/cm3, the water content was 6%, and the water-binder ratio was 1.09.Graphic Abstract
Keywords
Nomenclature
| CSG | Cemented sand and gravel |
| SEM | Scanning electron microscopy |
| C | Cement |
| F | Fly ash |
| W | Water |
In the twenty-first century, with the depletion of resources and the severity of problems caused by industrial waste in recent years [1], the relationship between the natural environment and water conservancy projects has attracted increasing public attention. Protecting the natural environment while building modern water conservancy projects faster and at lower costs will be the focus of water conservancy constructions in the future. Dams play a key role in the development and utilization of water resources. Shortage and high cost of dam materials and long construction period of dams are the norm. Hence, it is of practical significance to develop economical, safe, and low-carbon dam materials.
In nature, riverbed sedimentary sand and gravel are abundant. To make full use of natural resources and build friendly and economical dams, the riverbed sedimentary sand and gravel are modified by adding cementitious materials (cement, fly ash, etc.) to form cemented sand and gravel (CSG) material as damming materials. This material can be used locally, and generally no grading screening is performed when it is used. This material has the advantages of reduced cost and environmental pollution, rapid construction speed, small material loss, and low cost [2]. CSG dams built with this material have good seismic performance, strong integrity, and low cost, and do not require temperature control during construction. However, because of the short development period of CSG material, it is a new type of dam building material, and a comprehensive system to evaluate the material performance has not been developed yet. At present, CSG is mostly used in cemented sand and gravel cofferdam projects. To promote the construction of permanent cemented sand and gravel projects and increase the utilization rate of the environment friendly CSG material, it is especially important to perform microscopic and mechanical tests of cemented sand and gravel materials. Raphael [3] and Londe et al. [4] were the first to propose the construction of dam projects with CSG materials mainly based on the study of the properties of modified materials and dam construction technology. Because the dam construction technology not only has the advantages of reducing cost and improving construction efficiency, people have invested a lot of energy to study it. At present, the research on CSG material properties and CSG construction methods is in a mature stage [5,6]. In 2006, Jinsheng Jia first studied the correlation between the strength characteristics and permeability characteristics of CSG materials and CSG dams [7]. Against this background, some scholars made advancements in the study of the characteristics of CSG dam materials, but the performance index system of CSG materials is not perfect.
For long, most scholars believed that the characteristics of CSG materials and concrete materials can classified into one category, and there are few reports that the characteristics of CSG materials and soil materials are also closely related. The influence of the water-binder ratio, cement content, fly ash content, sand ratio, mud content, and other factors on the strength of CSG materials was systematically studied [8]. Some studies reported that the compressive strength of CSG increases with the unit cement content. When the unit cement content exceeds 80 kg/m3, the compressive strength of the material can be guaranteed [9,10], and the compressive strength increases with the amount of cementitious materials. When the amount of cementitious materials exceeds 100 kg/m3, its mechanical properties tend toward those of concrete [11]. The water-binder ratio of the CSG materials is negatively correlated with the content of cementitious materials [12]. The unit water consumption and unit fly ash content have the greatest influence on the working performance, and the sand ratio does not have any clear effect on the working performance and mechanical properties [13]; the unconfined compressive strength and dry density of CSG materials increase with the cement content [14]. The mud content in CSG hinders the hydration of cementitious materials, and the mud content, including the stone powder content of CSG materials, should be less than 10% to ensure the required strength of the test block. The mechanical properties of the material will also have a certain some impact [15,16]; microscopic tests show that at 90 d age, the hydration reaction of the cementitious material is sufficient; that is, an increase in the curing age of the CSG material greatly improves its compressive strength [17]. To effectively use CSG materials, additives were used to improve their permeability and compressive properties [18,19]. In some studies, large-scale triaxial tests were performed to examine the mechanical properties of CSG materials [20]. The experimental study on the mechanical properties of CSG materials is similar to that conducted for concrete [21–23]. Generally, conventional uniaxial compression tests were performed to study CSG materials. Although compression, tensile, and large triaxial tests of CSG materials were conducted in some studies, the experimental studies on the compression, tensile, and shear resistance of materials with different proportions are not comprehensive enough, and the strength index of the system cannot be determined easily. Hence, it is necessary to perform a large number of conventional uniaxial tests on materials with different cement contents, fly ash contents, and unit water consumption to improve the material performance index system. CSG materials have broad application prospects, it is sources can be a good environment-friendly material for building engineering structures such as dams. From this viewpoint, CSG has not been comprehensively examined as yet. Although the characteristics of CSG materials have been actively explored, to make better use of CSG material for building dams and for laying a sound foundation for the use of the material, the material characteristics are still being examined further. Unlike other existing studies [24], in this study, as a step toward more efficient and effective use of CSG as a dam-building material, we examined its compressive strength and splitting resistance corresponding to variations in different parameters and revealed the influence of these parameters on the strength of CSG material. Through our detailed investigations, we revealed the microstructure of the materials and the optimal ratio, specific parameters of material design, and influence of these parameters on the mechanical properties.
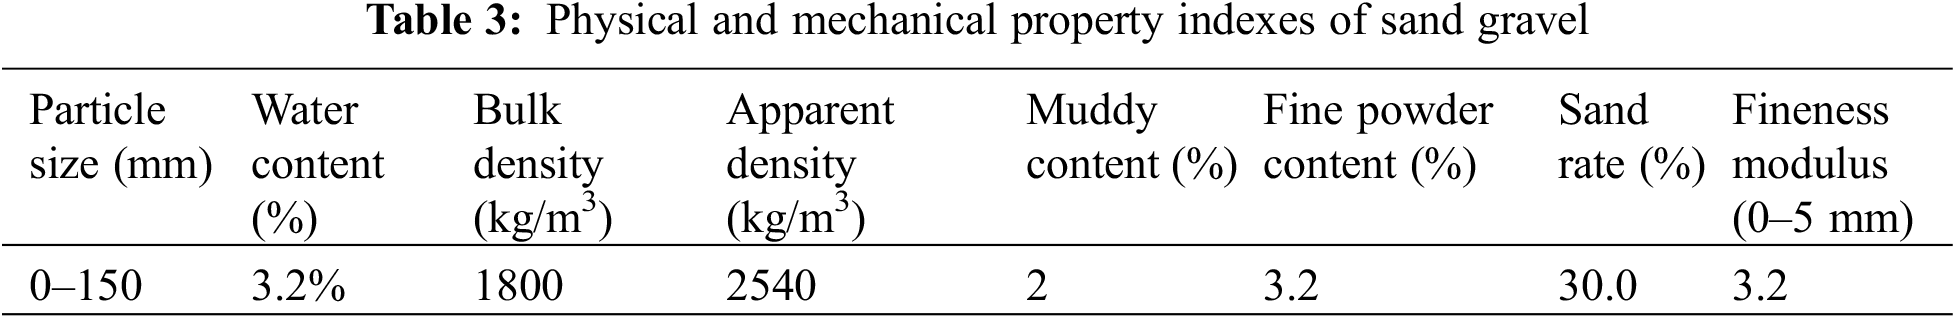
In this experiment, PO42.5 ordinary Portland cement was used. The physical and technical properties of cement were as follows in Table 1. The quality test results of II grade fly ash are listed in Table 2 along with the aggregate [25] sand and gravel are riverbed sand and gravel in a certain area. The results of the laboratory testing of sand and gravel gradation showed that the sand and gravel nonuniformity coefficient was 5.00 and curvature coefficient was 1.34, which indicate good gradation. The gradation curve is shown in Fig. 1, and the physical and mechanical properties are summarized in Table 3.
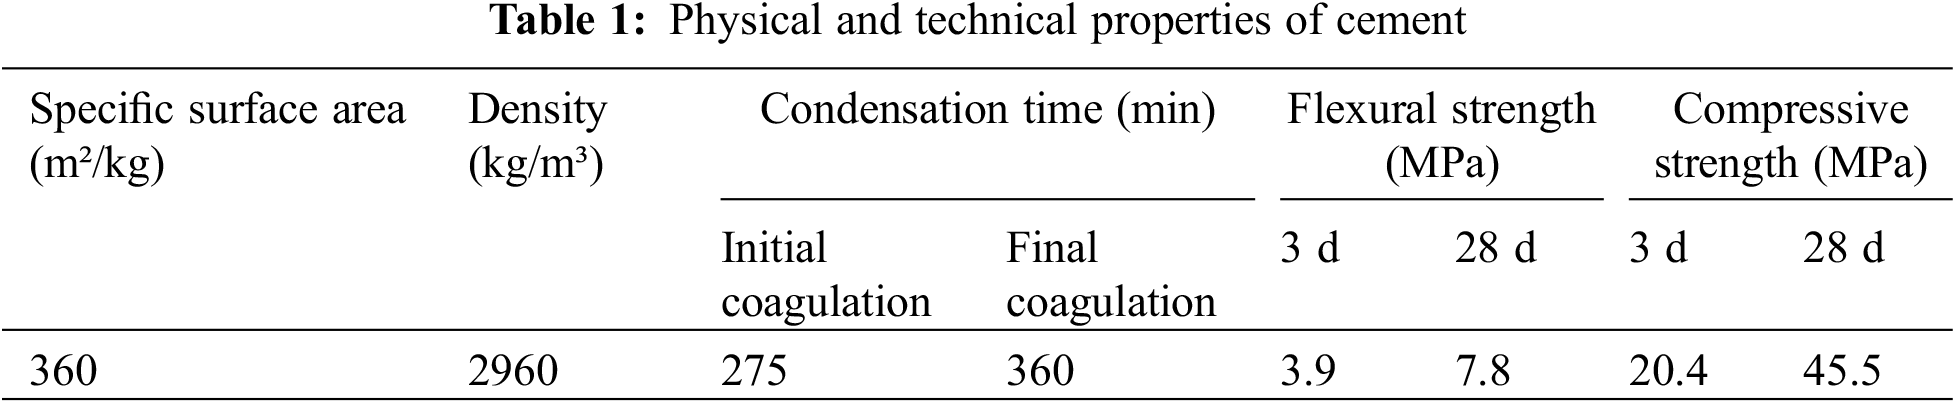
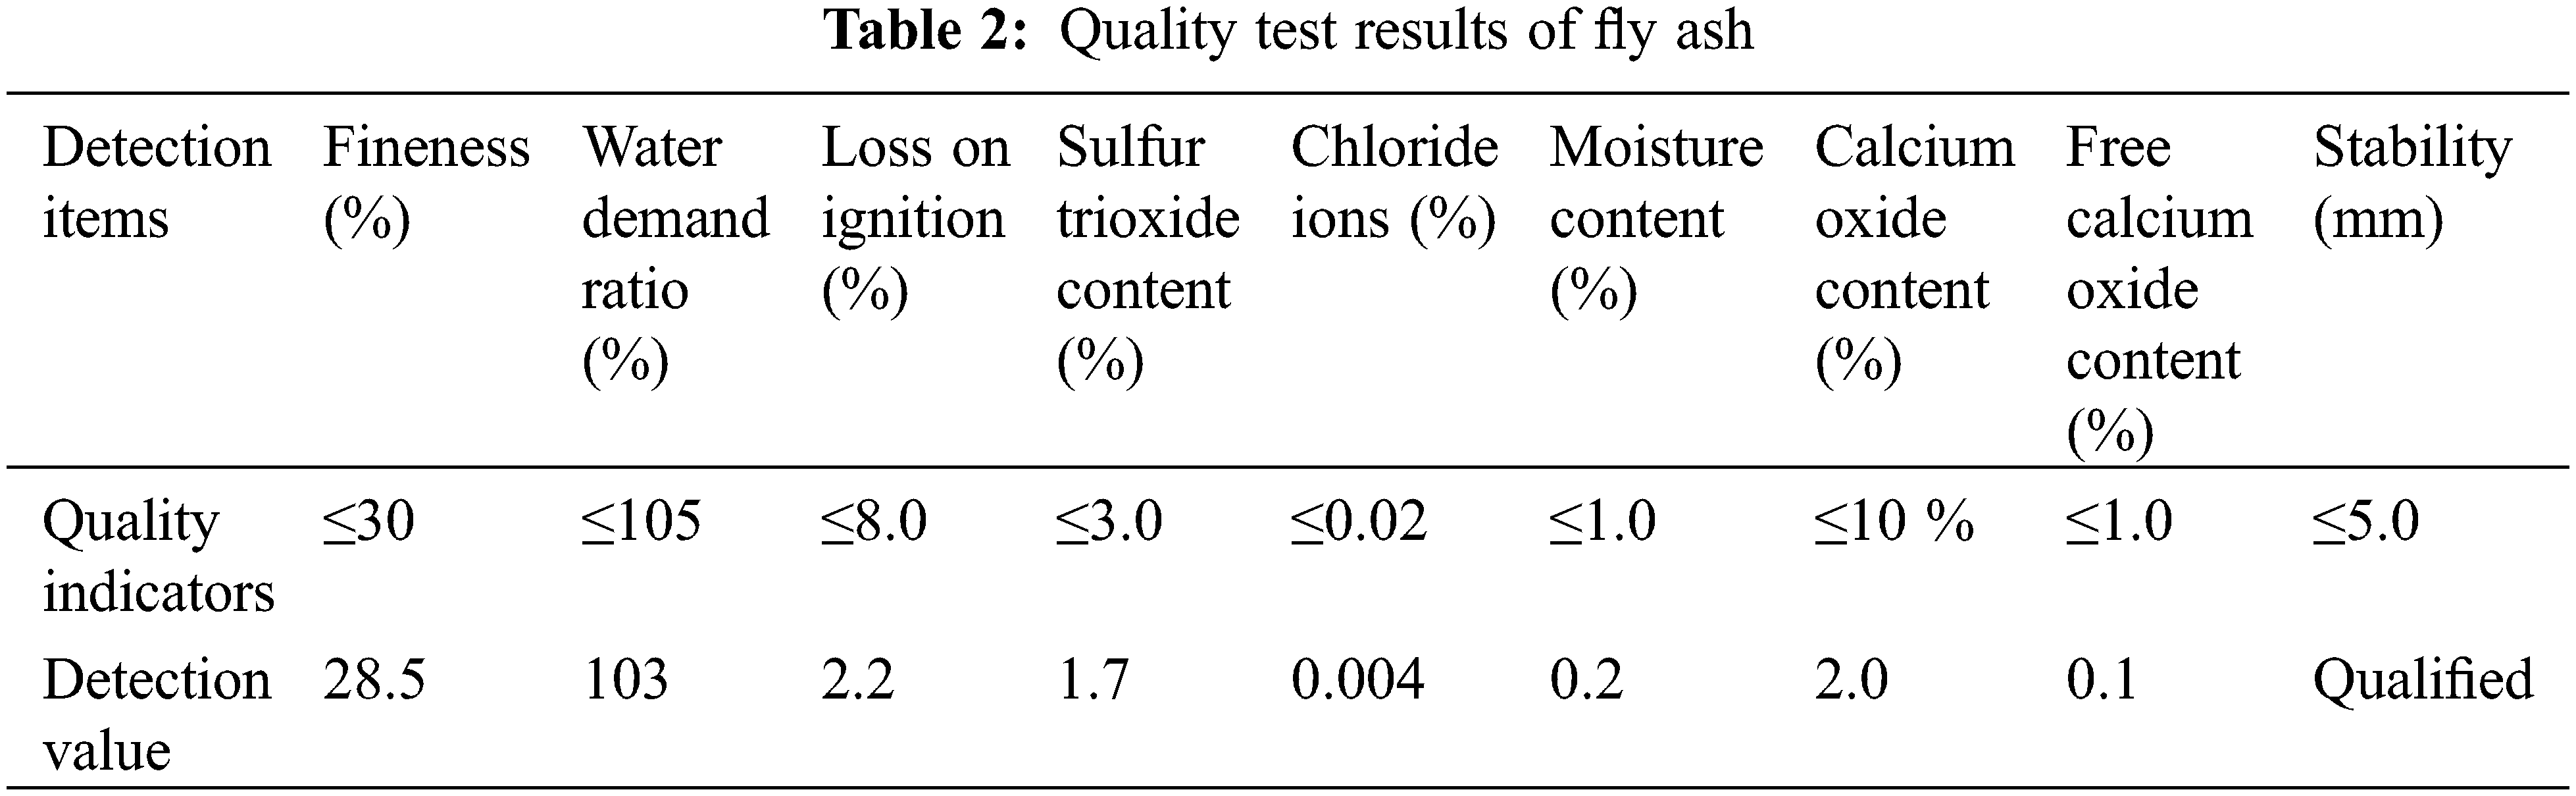
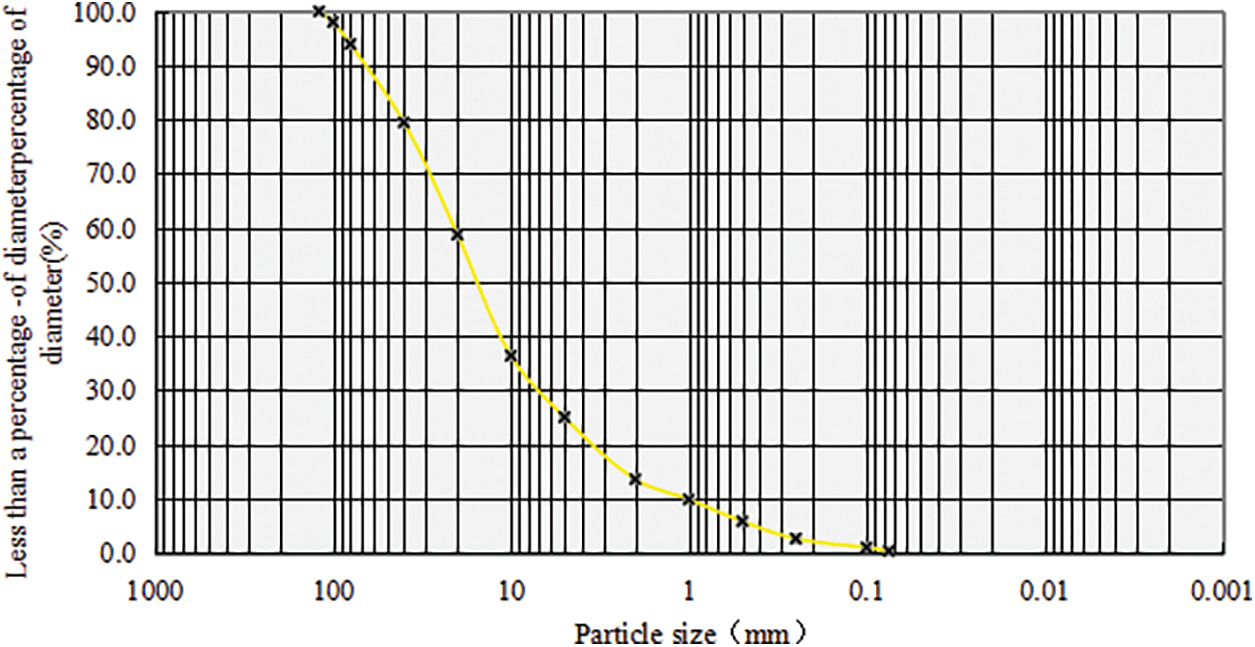
Figure 1: Sand gravel grading curve diagram
The robustness of the aggregate is an important indicator of its durability and stability. Grave has a large bulk density and a small void ratio. It can form a strong skeleton in CSG and affects the anti-cracking ability of CSG. The robustness test of coarse and fine aggregates of gravel shows that the total mass loss rate of fine aggregates under erosion [25] is 3.39%, and the total mass loss rate of coarse aggregate is 1.50%. The coarse aggregate and fine aggregate belong to class I aggregate, which are suitable for concrete with strength grade greater than C60. Because of the limitation of the size of the indoor test instrument and the focus of this test on accuracy, only the secondary cementitious sand and gravel samples were examined, and sand and gravel particles larger than 40 mm were removed before the test. The secondary sand gravel is shown in the photograph in Fig. 2.
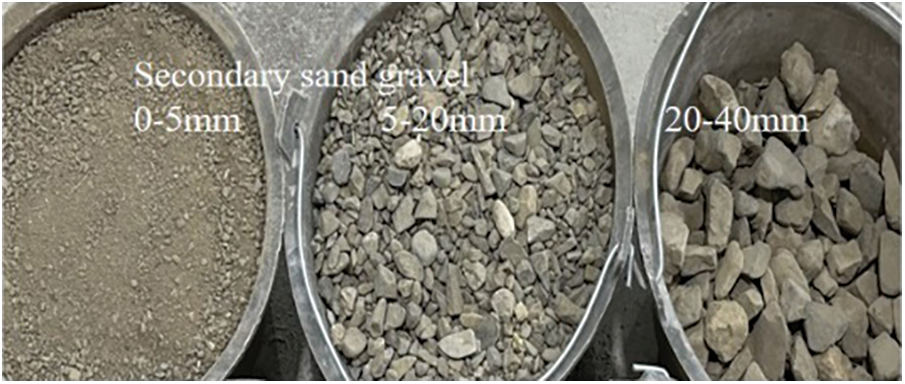
Figure 2: Secondary sand gravel
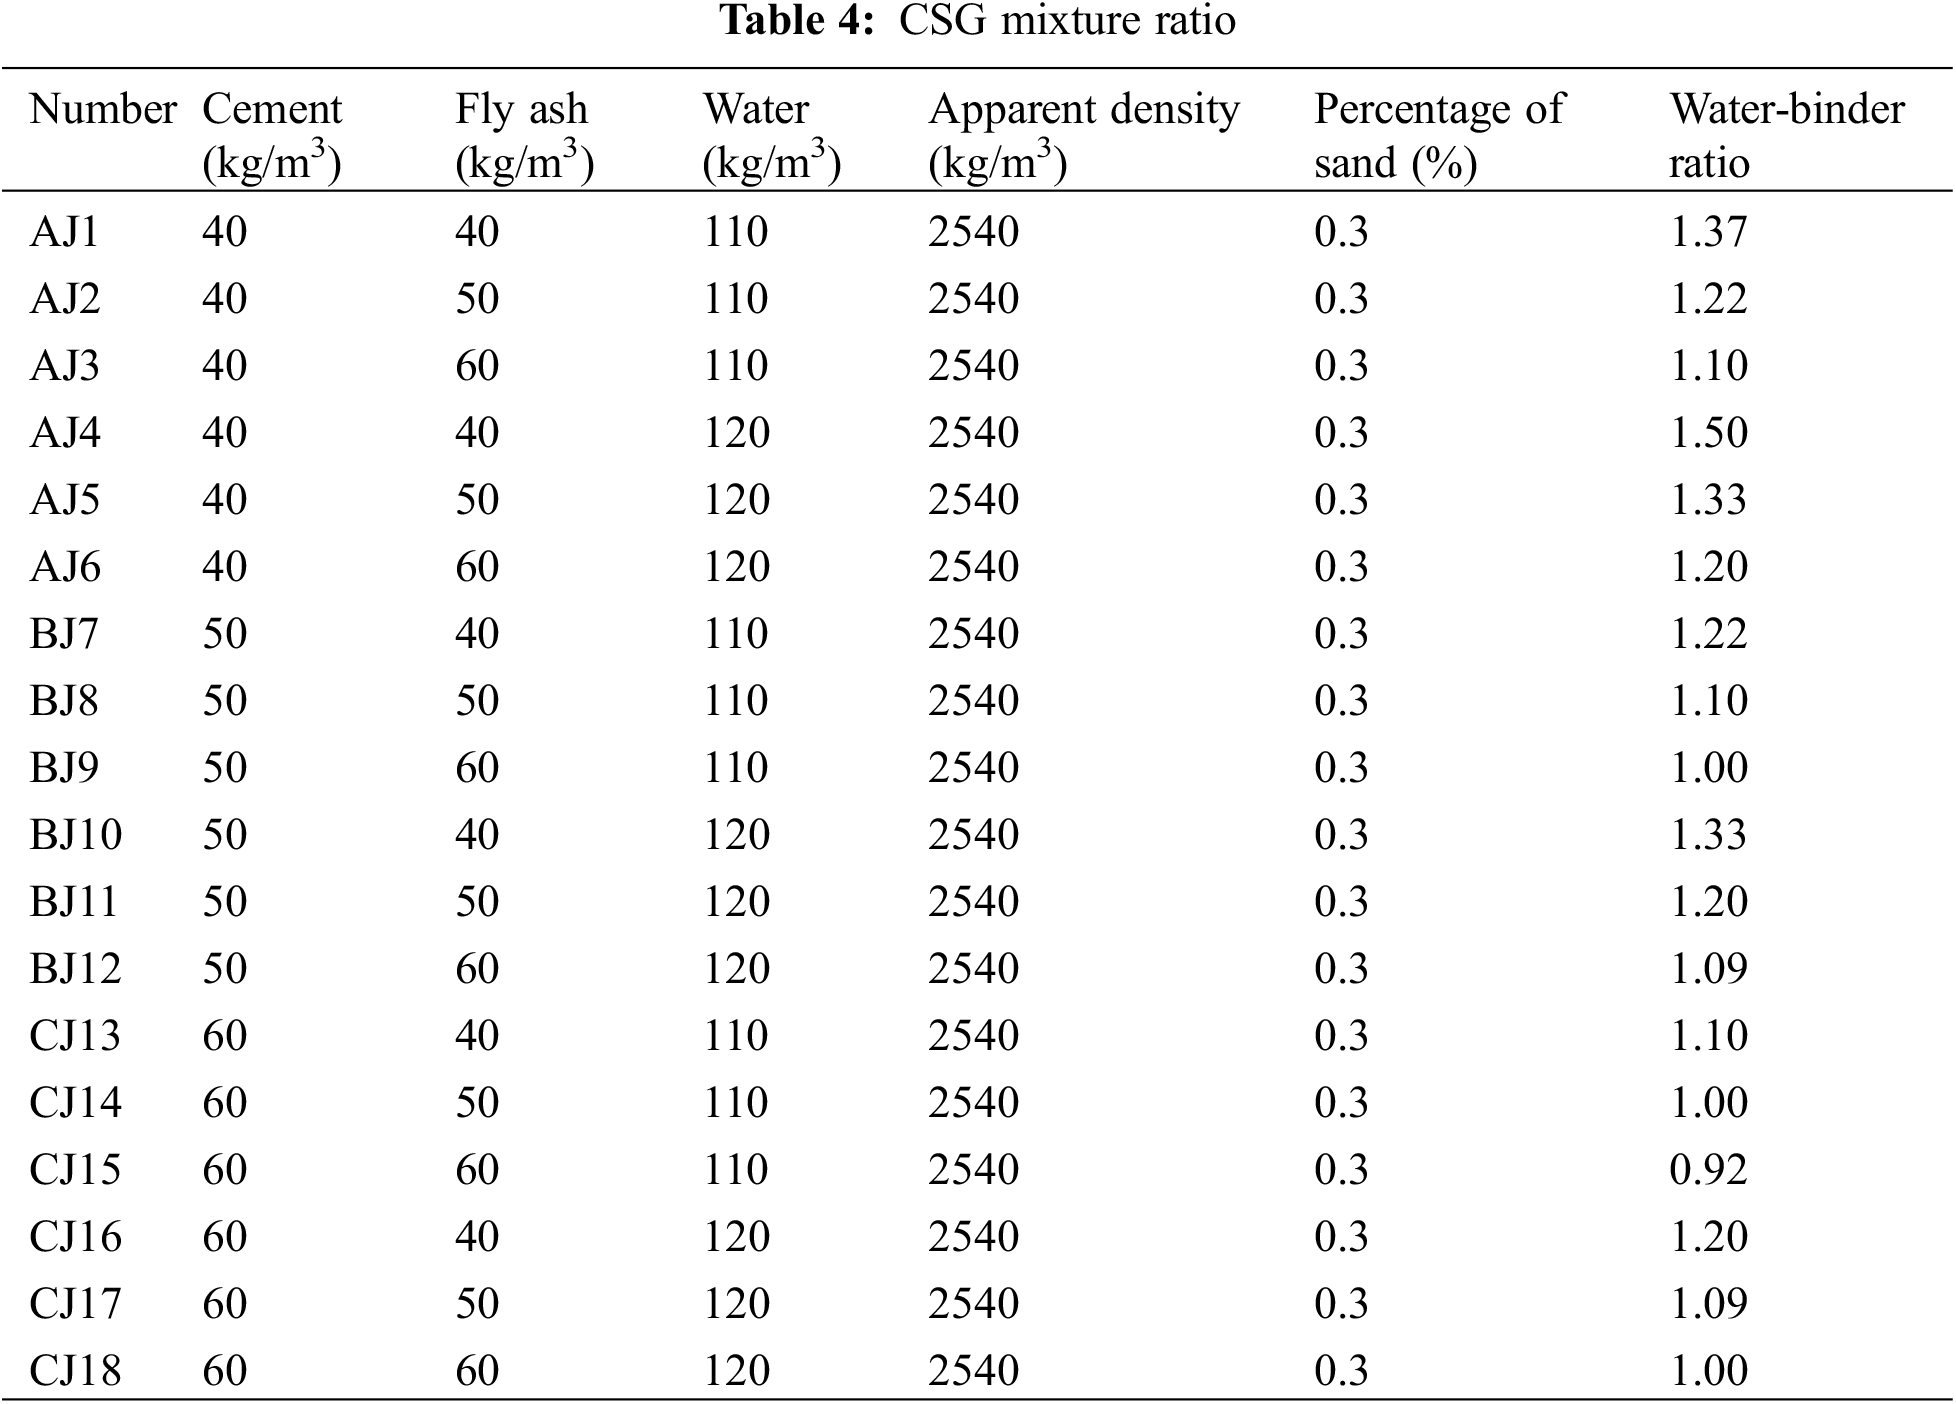
The mix ratio of CSG was determined in laboratory according to the “Technical Specification for Preparation of Ordinary Concrete” (DBJ 53/T-2-2016) and the “Technical Guidelines for Cemented Granular Materials Dam Construction” (SL678-2014). The samples were categorized into three groups depending on different amounts of cement (C; 40, 50, and 60 kg/m3), and they were further classified according to the fly ash contents (F; 40, 50, 60 kg/m3) and water consumption (W; 110 and 120 kg/m3). Thus, each group (A, B, and C) was designed with six mix ratios to prepare CSG test blocks. The mix ratios are listed in Table 4.
2.3 Sample Preparation and Process
The CSG batch used in this experiment was prepared by a two-stage mixing method. The CSG material mixture is shown in Fig. 3. According to the test ratio scheme, first, the coarse and fine aggregates were mixed in a mixer for 30 s; subsequently, half of the required water was added for mixing and stirring. After 60 s, cement and fly ash were added with stirring for 30 s. Thereafter, the remaining water was poured into the mixer with stirring for 120 s. In some previous works, the influence of different mud contents on the compressive strength of cementitious sand and gravel was studied. In previous related studies, microscopic analysis confirmed that the mud content hinders the hydration of cementitious materials. Hence, the mud content of the test block was controlled to be less than 10% to ensure the necessary strength [12]. The mud content of the sand and gravel used in this test was 2%. This value meets the requirements and facilitates a good mixing effect. After the sample was mixed well, it was poured into a mold (150 mm × 150 mm × 150 mm) and stored at room temperature for 1 day to demold. The standard conditions [26,27] (the temperature of the standard curing room should be controlled at 20°C ± 5°C, and the relative humidity should be above 95%) were cured to the specified ages of 28 d, 56 d, and 90 d. The test process is depicted in Fig. 4.
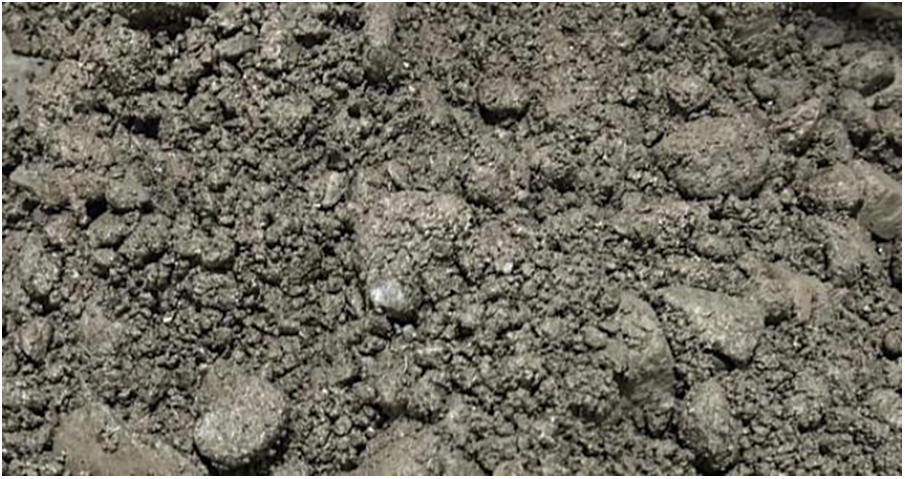
Figure 3: Cemented sand gravel material
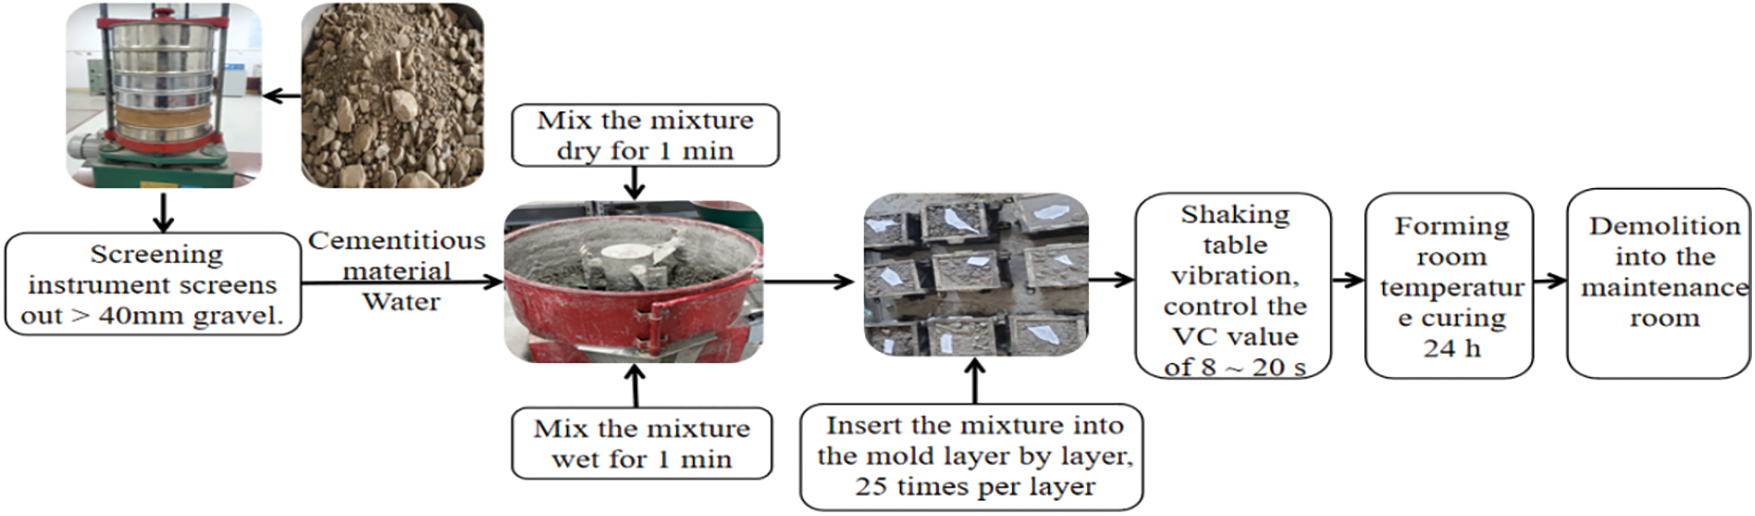
Figure 4: Test process diagram
1) Density detection test. The mixed CSG material was loaded into a mold (150 mm × 150 mm × 150 mm). The construction conditions were simulated. The required weights were applied to apply vibration and compacting effects. The test blocks were then weighed and their masses were recorded (mwet). After standing for one day, the weight of the test block was recorded (mdry). The dry density and water content of CSG material specimens were tested by the concrete test method, and the dry density, wet density, and water content were calculated according to Eqs. (1)–(3). The maximum dry density and optimal water content of the mixture were determined by a geotechnical test, and the relationship curve between dry density and water content was established.
where: mω-wet weight, g;
pω-wet density, g/cm3;
v-cube volume, cm3;
m0-dry weight, g;
ρ0-dry density, g/cm3;
ω-Moisture content, %.
2) Compression test. An HCT-306A microcomputer-controlled electrohydraulic servo pressure testing machine was used to measure the [28] (Fig. 5), the compressive strength of standard cube specimens (150 mm × 150 mm × 150 mm). The unconfined compressive strength of the CSG sample was determined experimentally, and the influence of the mechanical properties of CSG materials under different ratios was analyzed. The compressive strength test schematic diagram of the CSG sample is shown in Fig. 5a. The compressive strength was calculated as shown in Eq. (4).
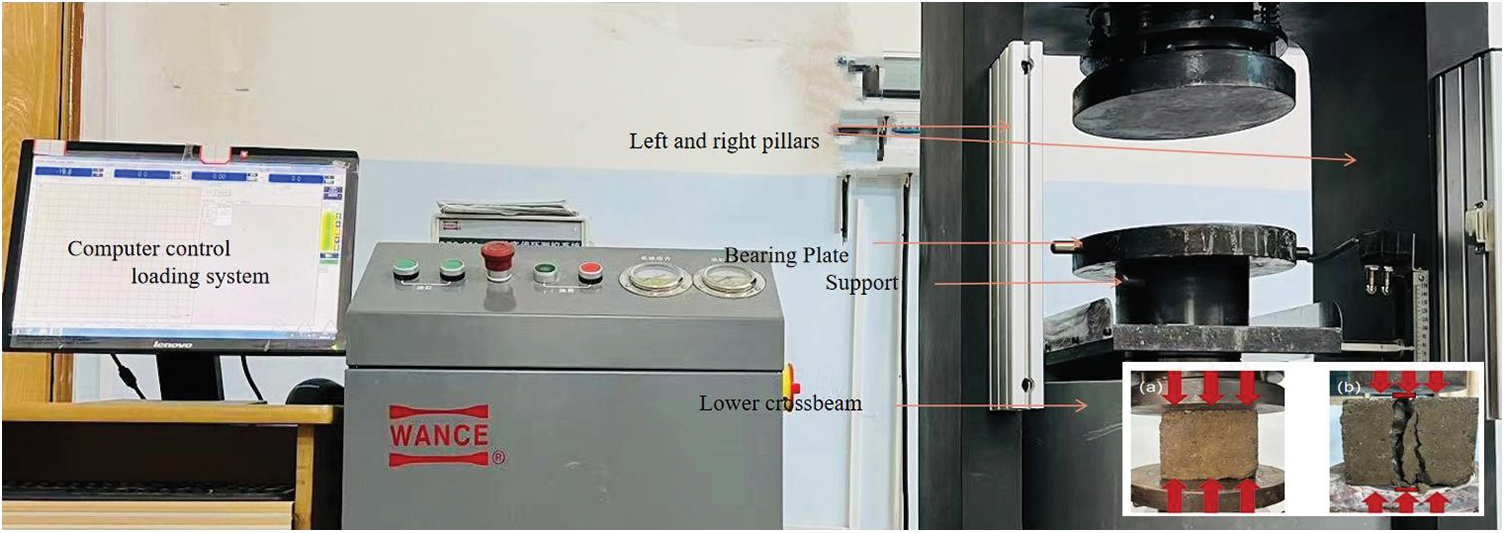
Figure 5: Pressure testing machine diagram (a) compressive strength diagram (b) split tensile strength diagram
where: F-Cube compressive strength, MPa; P-Failure load, N; A-Specimen bearing area, mm2.
3) Splitting tensile test. Using the aforementioned testing machine, the splitting tensile strength of the standard cube specimens (150 mm × 150 mm × 150 mm) was measured. At a rate of 9.0 kN/s, the maximum load of the CSG specimen was used, and arc steel blocks and spacers with 10 times the maximum load were placed between the upper and lower pressure plates to measure and analyze the variations in splitting tensile strength. Fig. 5b shows a schematic of the splitting tensile strength, which is calculated as shown in Eq. (5).
where: fts-Splitting strength, MPa; P-Failure load, N; A-Splitting area of specimen, mm2.
4) Static compression elastic modulus test. Microcomputer-controlled electrohydraulic (HCT-306A) servo pressure testing machine, an XL2118A static resistance strain gage, and an automatic acquisition system (XL2118AU24) and dial gage were used to test the static compression elastic modulus of standard prism specimens (150 mm × 150 mm × 300 mm). The static compression elastic modulus is calculated according to Eqs. (6) and (7). The stress-strain curve of the CSG material was plotted and analyzed.
where: Ec is the static pressure elastic modulus (MPa), and the calculation results are accurate up to 100 MPa.
Fa is the load (N) when the stress is one-third of the axial compressive strength.
F0 is the initial load (N) when the stress is 0.5 MPa.
A is the bearing area of the specimen (mm2).
L is the gage distance (mm).
∆n is the average value (mm) of the deformation on both sides of the specimen at the last loading from F to F.
εa is the average value of deformation on both sides of the specimen (mm) corresponding to Fa.
ε0 is the average value of deformation on both sides of the specimen (mm) corresponding to F0.
5) Electron microscope test. A scanning electron microscope (S-3400N) was used for microscopic analysis. To analyze the macroscopic properties of CSG, observe the microstructure of CSG materials at different ages, and understand the mechanism of influence of the microscopic properties on the macroscopic properties of the material.
Dry density is an important measure of the quality of CSG materials. The results of dry density test are important for the further evaluation of the quality and strength properties of CSG. For a constant cement content, the combination of fly ash and water acts as an inert material that fills the voids in the CSG test block [29]. Hence, the density of the test piece increases with the fly ash content, and the compactness of the CSG is improved [11].
From Fig. 6, it is clearly seen that for every 10 kg/m3 increase in the fly ash content, the density increases by about 2%, and the water content decreases by 0.2%. Dry density is positively correlated with the amount of cementitious materials, whereas water content is negatively correlated with it. Dry density is negatively correlated with water content; dry density increases as the water content decreases. When the moisture content is approximately 5.80%–6%, the CSG materials exhibit the best mechanical properties, and the sample labeled BJ12 has the best CSG mixture ratio. The corresponding dry density and moisture content are 2.569 g/cm3 and 5.86%. During the test, it was found that when the water consumption was less than 120 kg/m3, as the amount of rubber material in the test block increased, the fluidity of the rubber material did not increase sufficiently, and the cementitious material was insufficient to fully fill the gap between the aggregates; the mechanical properties were weak. When the rubber material and water contents were 80–110 and 120 kg/m3, respectively, the mortar filled the gaps between the aggregates, and the formed test block was smooth and had few holes. When the cement and fly ash contents were 60 kg/m3 each, the water consumption was insufficient, and the fly ash, as an inert material, did not fill the pores; the dry density of such CSG specimens was low.
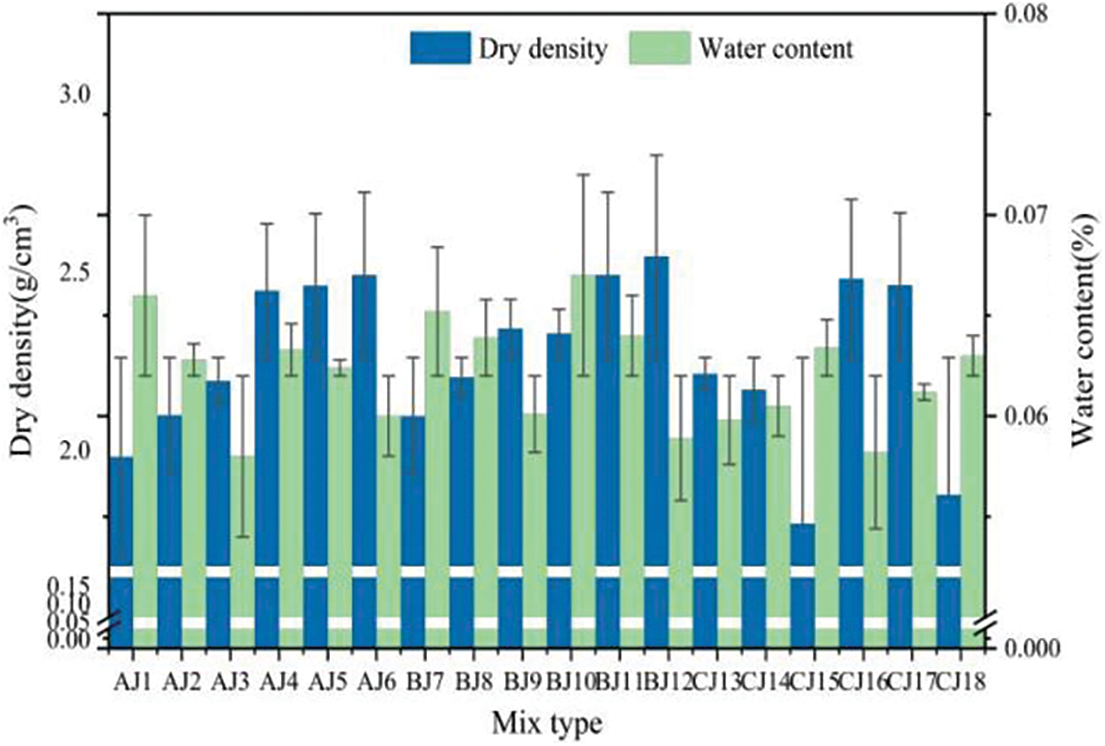
Figure 6: Dry density-water content relationship diagram
The density was thus determined for all CSG mixture ratios, and the results led to the conclusion that the maximum dry density of BJ12 is 2.569 g/cm3, and its moisture content is 5.89%. The compaction standard of a CSG dam is mainly controlled by dry density and moisture content, and in particular, during construction in field, there is a need to control the compaction standard. To further verify the value (dry density of BJ12 is 2.569 g/cm3, and its moisture content is 5.89%), the water content-density control at the construction site should be further accurate. A heavy-duty compactor was simulated in the laboratory, and the compaction work was 2677.2 kJ/m3. The optimum water content of C50F60W120 (C represents the unit amount of cement, F represents the unit amount of fly ash, W represents the unit water consumption) mixture was determined, and the fitting relationship between dry density and water content was established. The relationship between dry density and water content is depicted in Fig. 7.
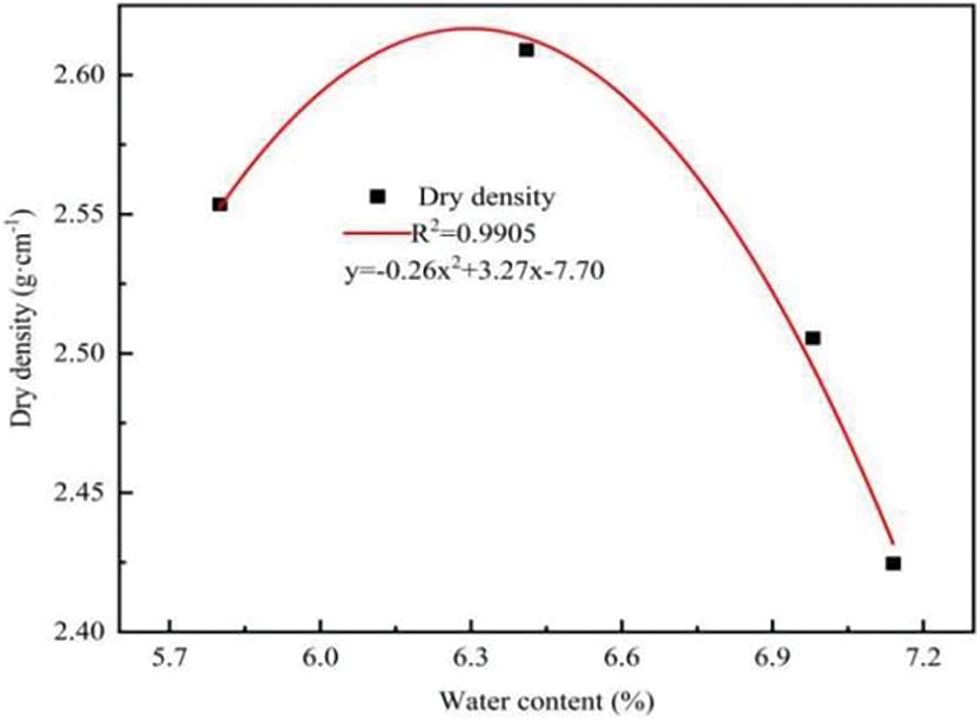
Figure 7: Relationship between dry density and water content of BJ12
From Fig. 7, it is clearly seen that the dry density at this ratio (C50F60W120) increases with an increase in water content. Under compaction, the water content increases, and the colloidal hydrate products on the surface of CSG increase the friction, which is not suitable for compaction. When the water content continues to increase, under the action of an external force, the cemented sand gravel can move easily, and the compaction degree improves: for every 1% increase in water content, the dry density increases by approximately 2.7%. When the water content exceeds 6%, the void volume in the CSG increases, and the dry density decreases. Under the optimal ratio of C50F60W120, the water content is 6%; the dry density is 2.60 g/cm3. The water content in the previous experiment was 5.86%, and the dry density was 2.569%. The difference is not large; this result implies that the geotechnical test method and concrete test method can be applied to perform the dry density-water content test, and the tests conducted by these two methods yield only slightly different or extremely similar test results. By identifying the relationship between dry density and moisture content, the functional relationship between the two can be obtained as follows: y = −0.26X2 + 3.27X − 7.70.
3.2 Mechanical Characteristics Analysis
The behavior of the compressive strength is shown in Fig. 8. From Fig. 8, it is seen that the peak strength value for all the ratios increases along a zigzag pattern for constant unit cement content. From Fig. 8a, we see that the smaller the water-binder ratio, the greater are the strength and increase in unit water consumption and the smaller is the increase of compressive strength. When the amount of cement per unit is constant, an increase in fly ash content causes an increase in the compressive strength of CSG material. The increase in cementitious material content improves the compactness of CSG [30] and enhances the compressive strength. At a water-binder ratio of 1.09, the material flow is the best; the hydration reaction is sufficient; and the peak strength is the best as seen in Fig. 8c. For a cement content of 60 kg/m3, the cementitious material content exceeds 110 kg/m3; the fluidity of the material worsens; and the peak strength decreases drastically. The peak value of the second group (BJ7-BJ12) is the highest, and the peak strength of BJ12 is the highest. The corresponding two-phase cementation ability is the strongest, and the density is the highest.
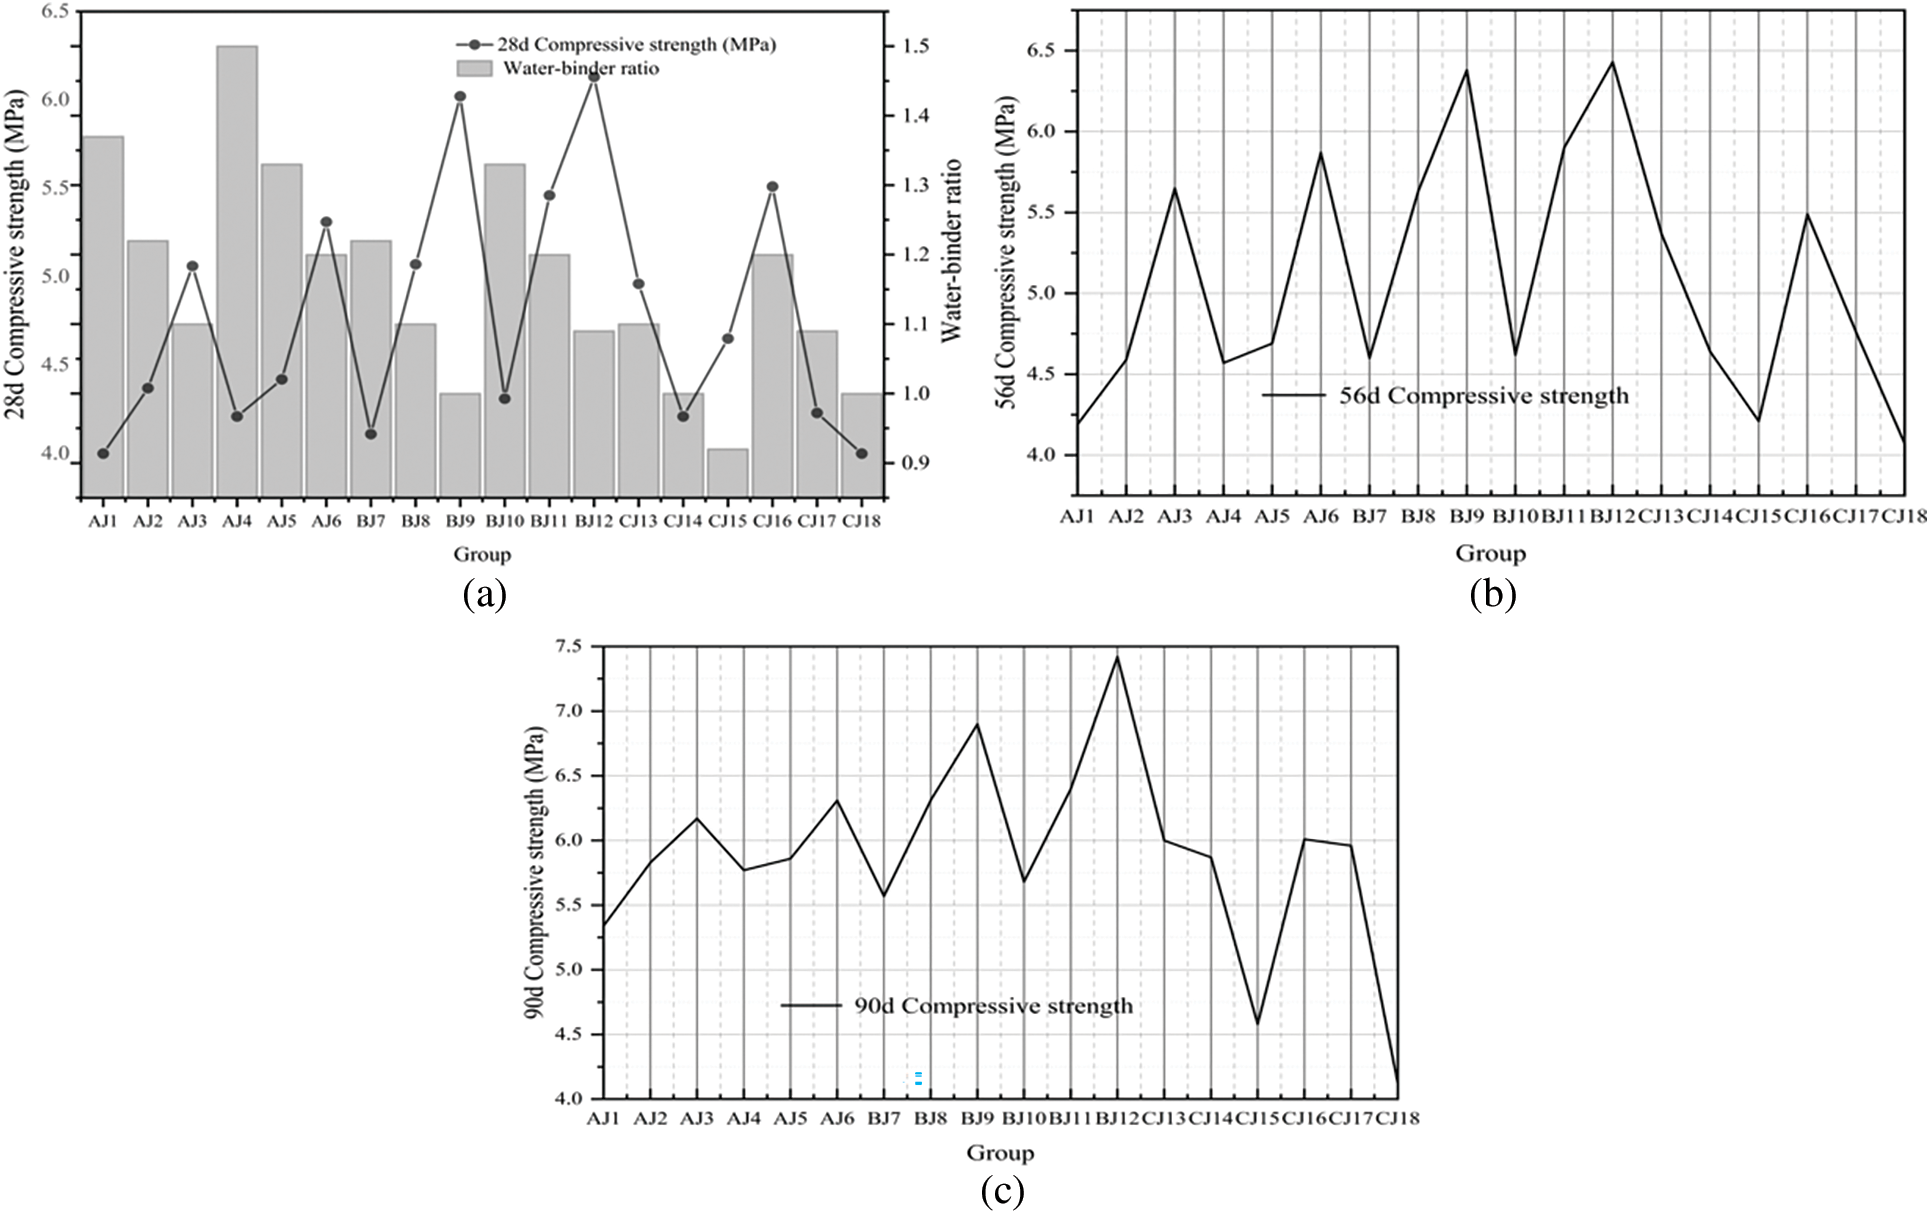
Figure 8: Compressive strength diagrams: (a) 28 d compressive strength and water-binder ratio comparison diagram, (b) 56 d compressive strength diagram, and (c) 90 d compressive strength diagram
The compressive strengths at different ages are shown in Fig. 9. With increasing age, the overall change trend in compressive strength [31] follows a serrated pattern. Fig. 9a shows a box plot, which is used to describe the degree of dispersion of the compressive strength and to reflect whether the compressive data are stable. From Fig. 9a, it is seen that the median of 28 d and 56 d in Group 1 is low, and the corresponding compressive strength is low. The compressive strength value of 90 d is relatively uniform. Overall, the compressive strength value increases with age, and the maximum compressive strength of 90 d is 6.31 MPa. Further, Fig. 9a that the median line of Group 2 lies in the middle of the box diagram, indicating that the compressive strength values in this group of data are evenly distributed, but the strength still increases with increasing age. Among the three groups, the compressive strength value for Group 2 had the maximum value of 7.42 MPa. From Fig. 9a, it can be seen that for all ratios for Group 3, the strength is low, and the degree of dispersion is the smallest; the compressive strength value is low. However, with an increase in age, the strength increases, and the median line shifts higher in the box type plot. For Group 3, the compressive strength of CJ13-CJ18 is enhanced; from Fig. 9b, it can be clearly seen that the compressive strength increases with the age. For Group 3, we clearly see that the compressive strength decreases because the water-binder ratio for CJ13, CJ14, CJ15, and CJ16 decreases; the hydration reaction is not sufficient; and the compressive strength increases. The compressive strength of CJ17 and CJ18 decreases, and the degree of dispersion is small, but with an increase in age, the compressive strength keeps increasing. The maximum ratio of compressive strength was obtained for C50F60W120.
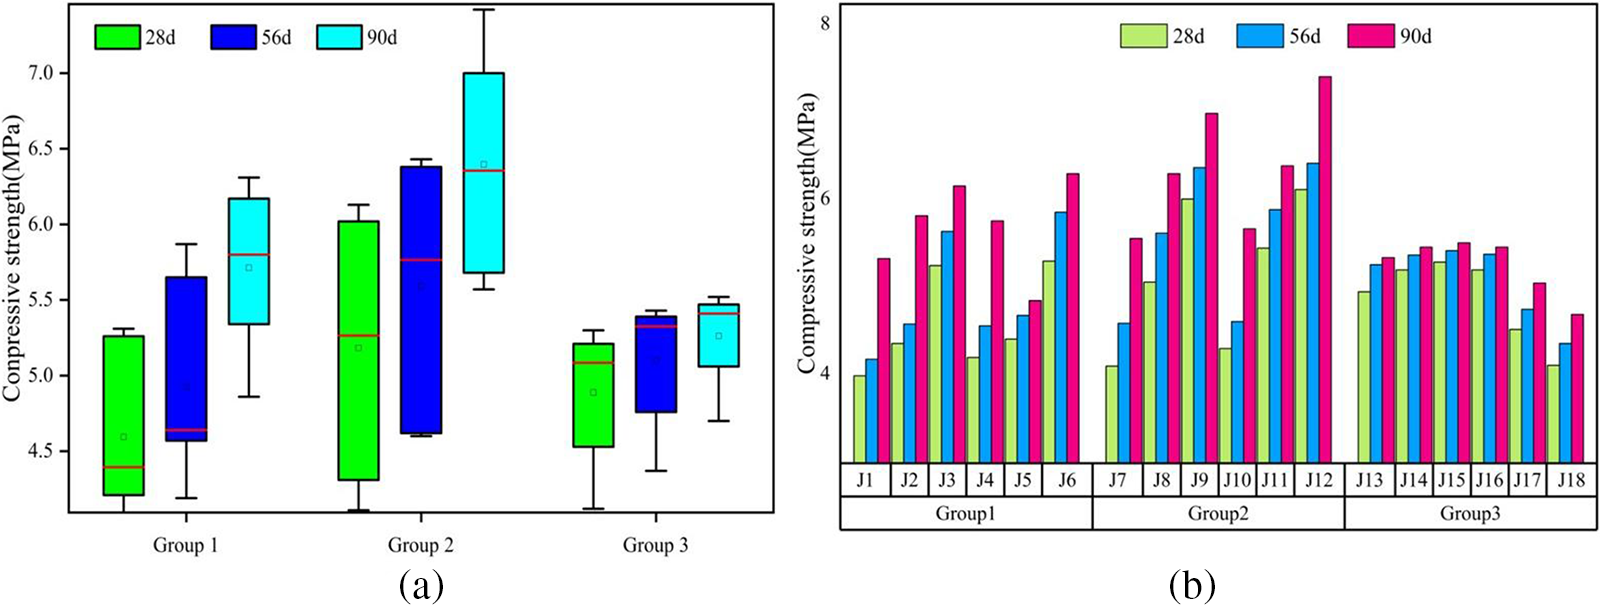
Figure 9: Compressive strength at different ages
The calculation shows that for all groups and all CSG mixture ratios, the compressive strength after 56 d is approximately 25% higher than that after 28 d, and the compressive strength after 90 d is higher than that after 28 d by approximately 50%. With an increase in the amount of cementitious materials, hydration reaction is more sufficient. The weak hydration reaction of fly ash in the early stage, the strength after 56 d was not very different from that after 28 d. However, at an age of 90 d, the strength of CSG material was higher than that after 28 d by 50%. Because CSG material is well mixed with fly ash and because fly ash plays a key role in improving the later strength of the material, the compressive strength at 180 d will be higher than that at 90 d. Thus, it is concluded that the mechanical properties of CSG materials clearly improve with increase in curing age, and therefore, better mechanical effects can be achieved.
3.2.2 Splitting Tensile Strength
Generally, during the use of CSG materials, the splitting tensile strength [32] is not very important. However, this strength greatly affects crack resistance and is an important indicator of crack resistance.
The results of splitting tensile strength test are shown in Fig. 10. From Fig. 10a, it can be seen that for the same unit cement content, the splitting tensile strength for all CSG mixture ratios at 28 d increases following a serrated pattern. The larger the water-binder ratio, the smaller is the splitting tensile strength. From Figs. 10b and 10c, it is seen that when the unit water consumption remains constant, an increase in the amount of cementitious material increases the splitting tensile strength. For every 10 kg increase in cementitious material, the splitting tensile strength increases by 0.01–0.02 MPa. The total amount of cementitious material is less than or equal to 100 kg/m3. When the water-binder ratio is 1.0–1.1, the splitting tensile strength of the CSG material can reach 0.5–0.6 MPa. An increase in unit water consumption has no obvious effect on the splitting tensile strength. Thus, the mechanical properties of the material are not affected greatly by the unit water consumption When the cementitious material content is 110 kg/m3. When the unit water consumption is 120 kg/m3, that is, when the ratio is BJ12 (C50F60W120), and the maximum splitting tensile strength at 28 d is 0.57 MPa. The splitting tensile strength at 56 d is 0.59 MPa, and the splitting tensile strength at 90 d is 0.65 MPa. From Fig. 10d, it is seen that when the cementitious material content exceeds 110 kg/m3, the splitting tensile strength decreases because of decrease in the water-binder ratio, poor fluidity of the material, and weak hydration reaction. Thus, the range of the cementitious material suitable for the use of CSG materials is 80–110 kg/m3.
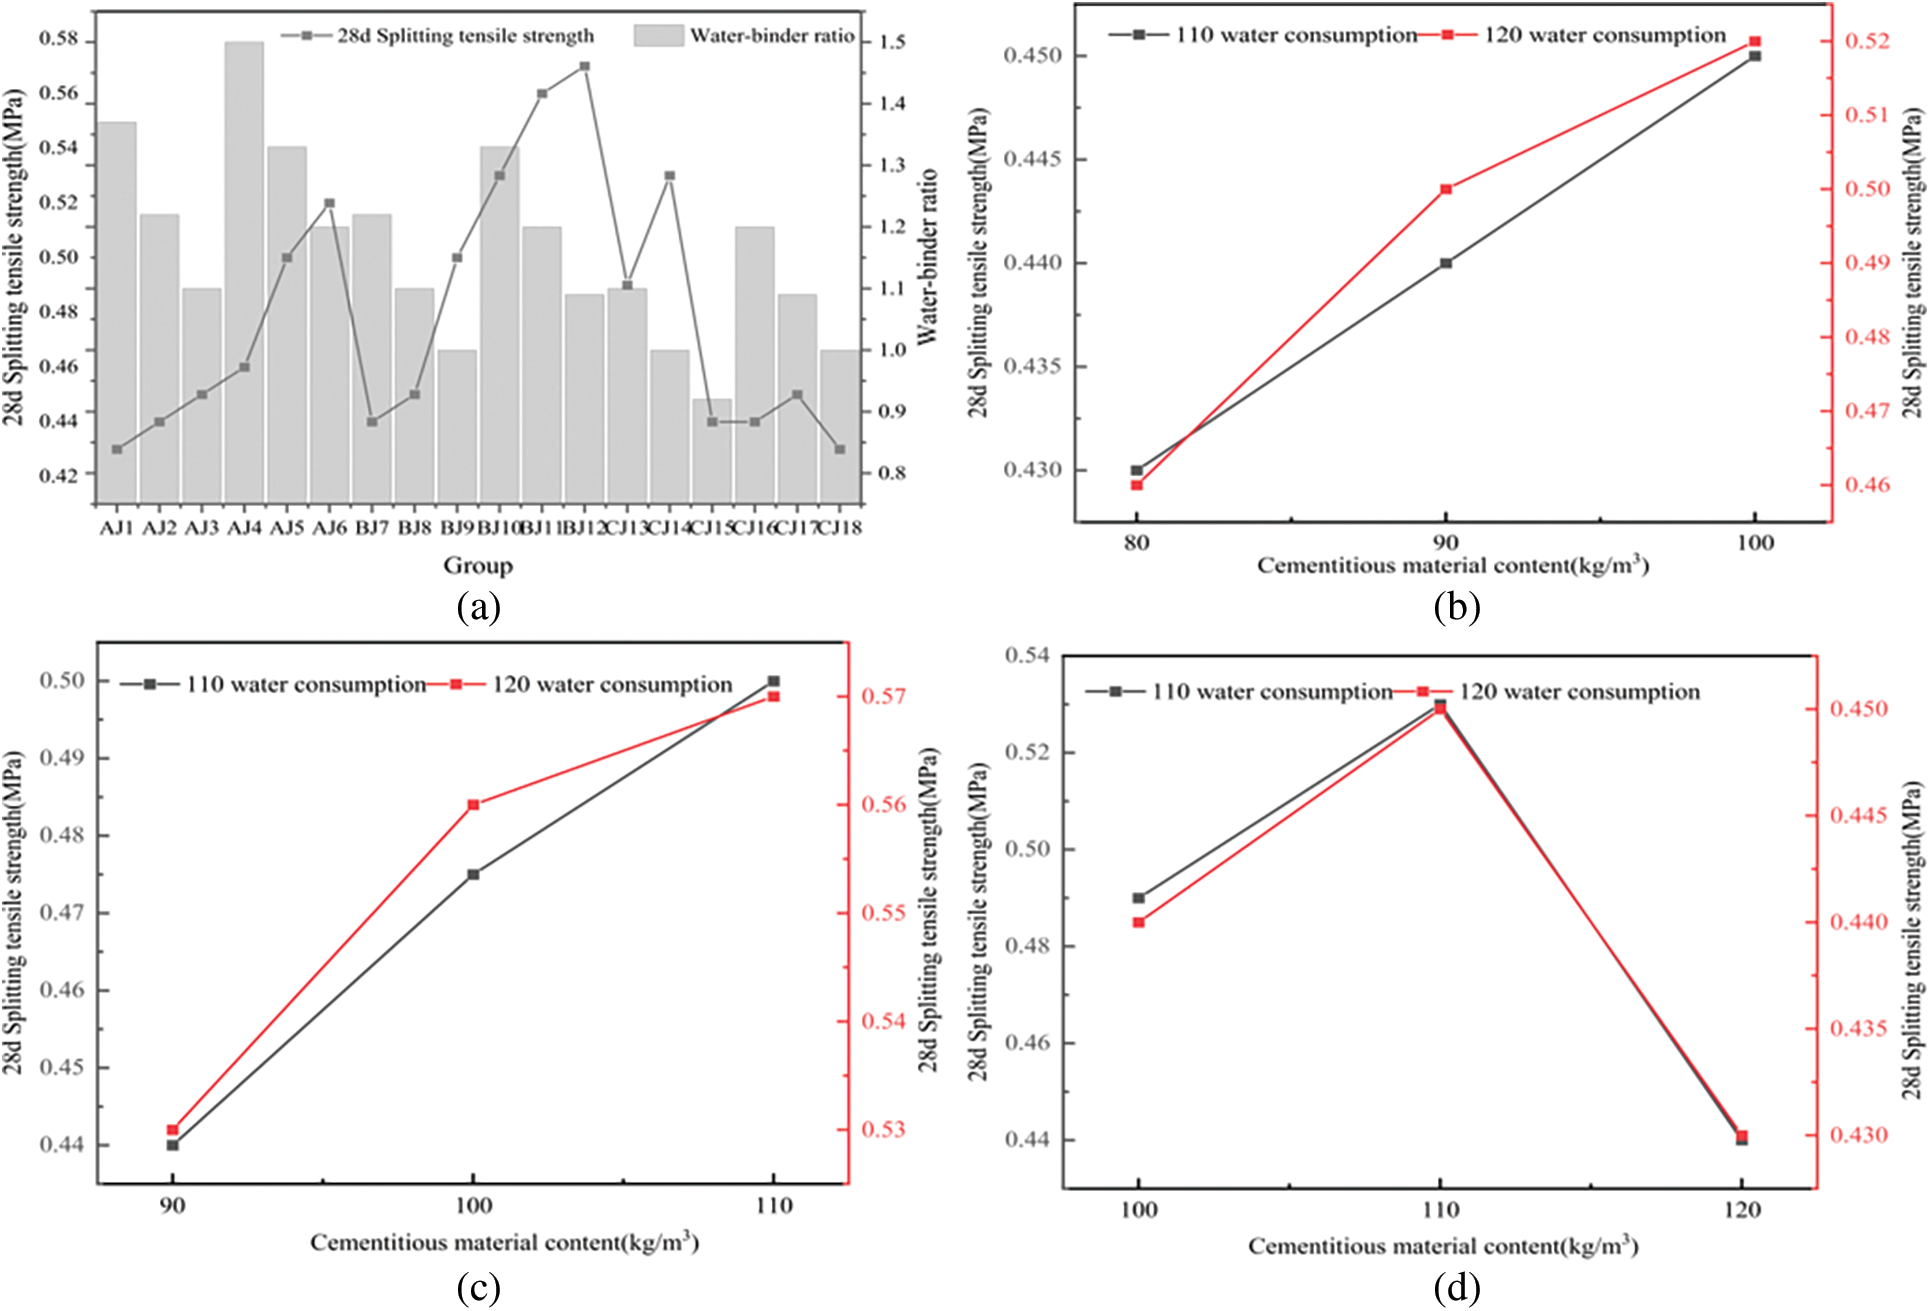
Figure 10: Splitting tensile strength: (a) 28 d splitting tensile strength and water-binder ratio comparison chart, and splitting tensile strength charts for (b) A group, (c) B group, and (d) C group
The experimental analysis shows that the CSG material has low splitting tensile strength. The improvement in the splitting tensile strength with an increase in the amount of cementitious material is not obvious. When using the material to build a dam, the tensile stress should be reduced to avoid damage to the dam body. The optimal splitting tensile strength is obtained for C50F60W120.
The results of splitting tensile strength and compressive strength are shown in Fig. 11. The splitting tensile strength of the CSG material shows a general trend of increasing with an increase in the compressive strength. The splitting strength of the CSG material is about one-tenth that of the compressive strength. The ratio of the splitting strength and compressive strength is constant, with an average of 0.10 and a standard deviation of 0.04.
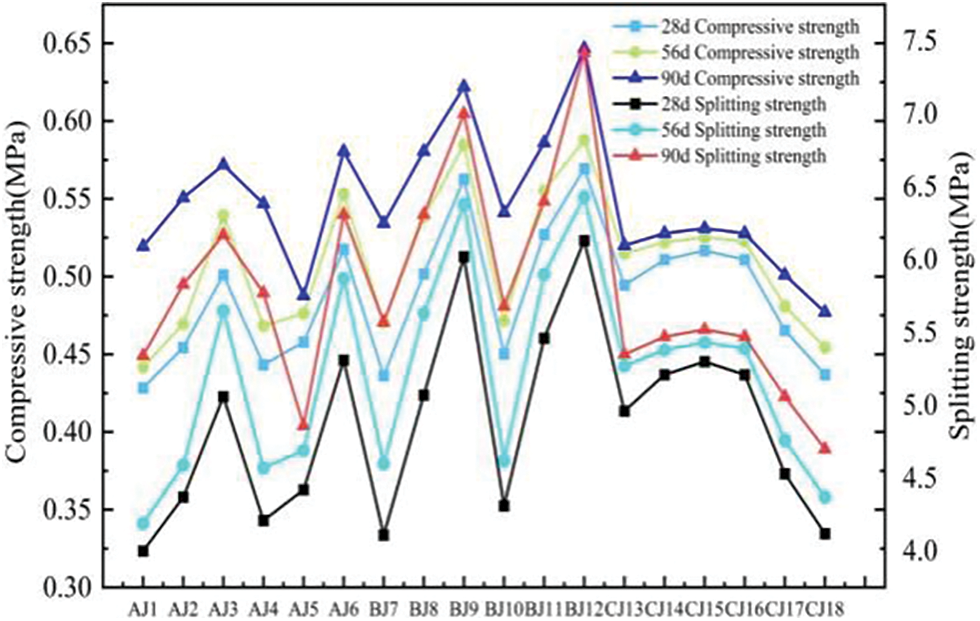
Figure 11: Comparison of splitting strength and compressive strength
3.2.3 Static Compressive Stress-Strain
The maximum ratio of compressive strength and splitting tensile strength is obtained for BJ12 (C50F60W120). The dry density is the highest for this setting. BJ12 has the optimal ratio in this study. The elastic modulus test was conducted for the CSG material. The elastic modulus of the material was 1.10e10 Pa, and the Poisson’s ratio was 0.2. The stress-strain curve [33] is shown in Fig. 12.
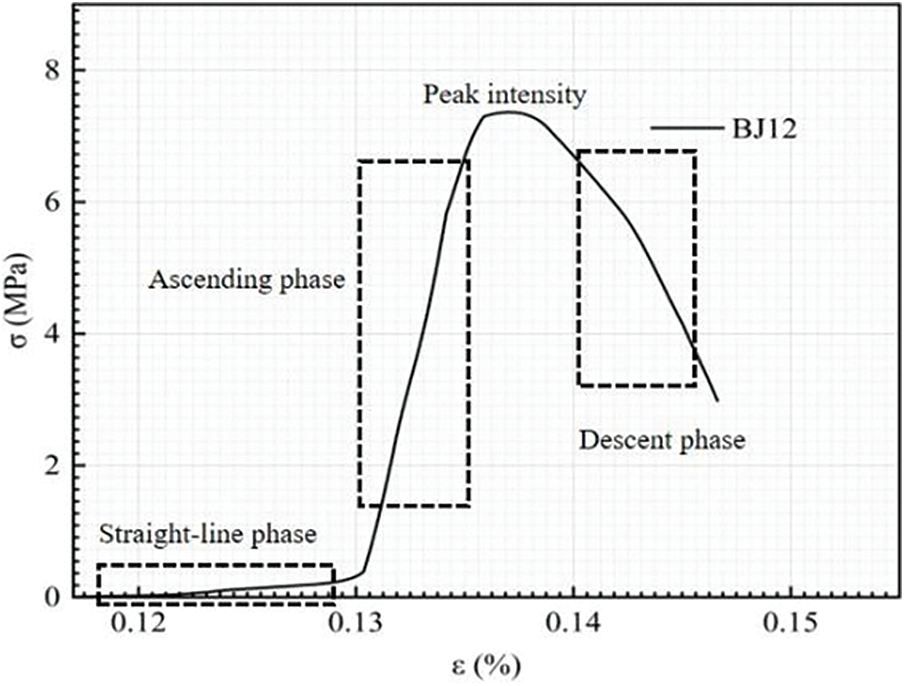
Figure 12: BJ12 stress-strain curve
From Fig. 12, it is seen that CSG material exhibits nonlinear characteristics, strain softening, and expansion reduction. These properties indicate that the CSG material is a typical elastic-plastic material. It exhibits linear elastic properties at low stress levels. When the stress increase gradually, the peak strength is reached after the plastic stage. This behavior is consistent with the stress-strain curve of concrete. The stress-strain curve under uniaxial load is mainly divided into three stages: an approximately straight-line stage, a rising stage, and a falling stage.
From Fig. 12, it is seen that the stress of the specimen increases linearly with the strain, and the CSG specimen attains the peak elastic strength when the strain is 0.135%. At this stage, the CSG material acts as an elastic material; the best ratio BJ12 is the group with the largest peak strength, and the mechanical properties improved by 70% compared with the ratio AJ1. With an increase in strain, the stress in the CSG material is in the rising stage of the stress-strain curve; it begins to increase slowly compared with other ratios (AJ1-BJ11), and the elastic modulus is lower, and the strength decreased. In the descending stage, some cracks appeared in the CSG specimen, and when the ultimate strength was reached, the value of ε was approximately 0.14%.
The deformation of the specimen is depicted in Fig. 13. From Fig. 13a, it can be seen that the CSG specimen has cracks at its peak strength. As the stress increases, the vertical cracks at the peak strength grow longer and wider, as shown in Fig. 13b. When the sample cannot withstand any further increase in stress, the curve descends after crossing the peak strength. New cracks appear in the CSG specimen, and the existing cracks are more seriously cracked, the width and number of cracks increase, and the bearing capacity decreases. The degree of occlusion between the two phases in the specimen increases. The structural collapse is seen in Fig. 13. Finally, the CSG material is broken and peeled off, and the specimen fails.
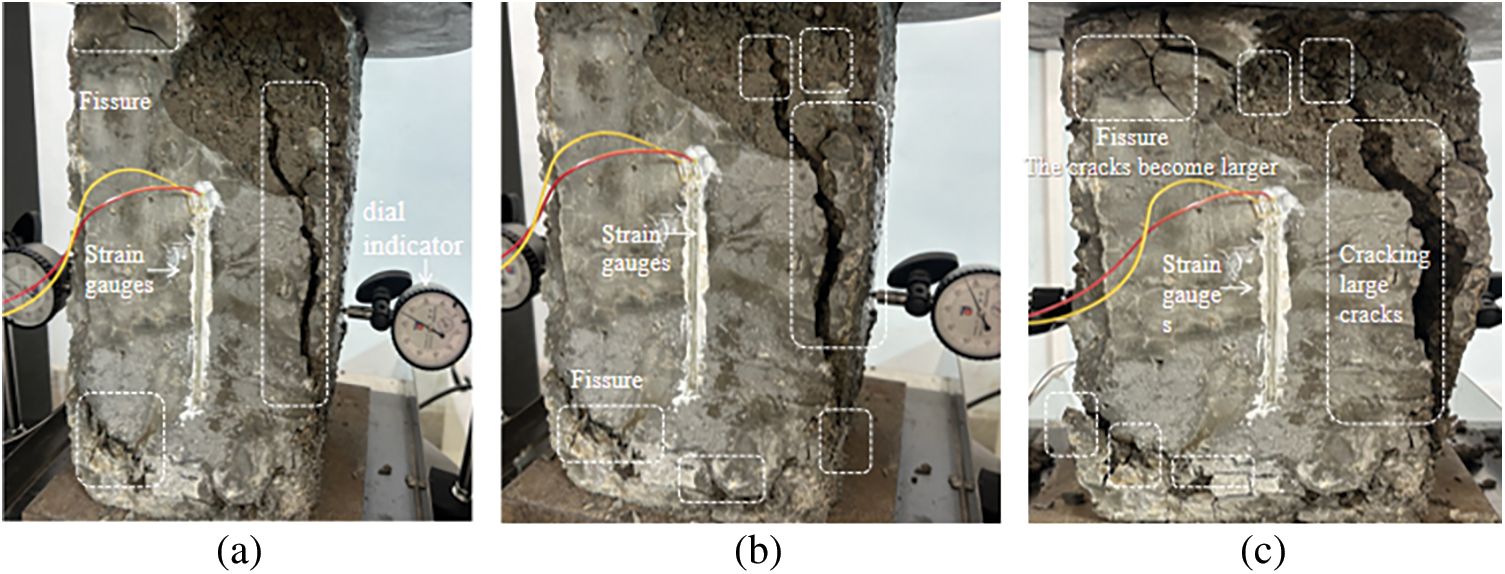
Figure 13: Deformation diagram of BJ12 specime
Under the pressure of the CSG specimen, generally, the aggregate is not damaged, but the CSG cementitious particles are impacted and damaged, and local fractures and cracks appear. The particle size of the sand and gravel used in the experiment is large, resulting in the formation of pores and apertures in the cementitious sand and gravel material. To further understand the microstructural characteristics of CSG materials at different ages and to observe the cementation and products, the optimal ratio (i.e., BJ12) at 28, 56, and 90 d was analyzed by electron microscopy.
Fig. 14 shows the structural characteristics of the two-phase transition zone at 28 d. Fig. 14a shows the image at 500× magnification. At short curing times, the surface of the gravel between the aggregates and gel phase is rough, and the cohesion between the particles is low. The cementation of the cementitious material is sufficiently good. It is clearly seen that an interface transition zone is formed between the gravel and cementitious material, and the adhesion is general. Images obtained under 1000× magnification clearly showed some cracks, indicating that the overall structure has not been improved sufficiently. Therefore, the strength of the CSG is lower than that of the concrete. Fig. 15 shows the structural characteristics of the 56 d transition zone between the two phases. The number of agglomerates between the two phases increases. However, the change is not obvious because the curing age is not sufficient. The cement hydration products gradually form aggregates and are evenly distributed on the sand-gravel interface, thereby increasing the overall density. Observation under 1000× magnification showed that the cementation between the two phases was not as obvious as in the case of 28 d cementation condition. Fig. 16 shows the structure of the transition zone between the two phases at 90 d. The overall structure can be seen to be well formed under 500× magnification in Fig. 16a. A small amount of hydration products such as Ca(OH)2, C-S-H (Concrete sealing curing agent), Aft (Ettringite), etc. It can be observed on the surface of the two phases in the 1000× magnification image shown in Fig. 16b. A bonding and hydration reaction occurs between the cementitious material and gravel. The hydration reaction provides sufficient strength, indicating that the longer the age, the better is the bonding force between the two phases. The effect after 180 d is better.
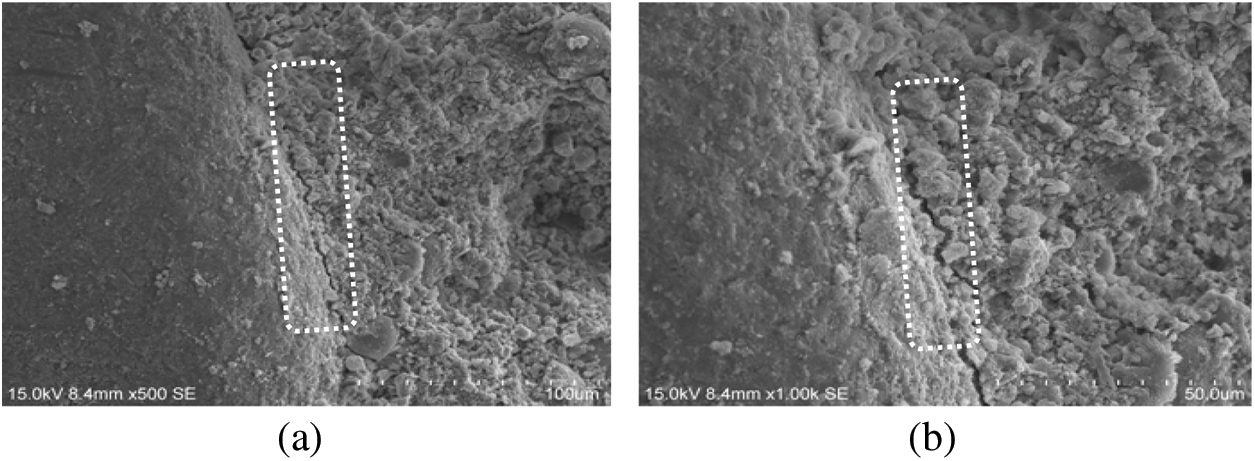
Figure 14: BJ12 28 d interface transition zone (a) 500 times (b) 1000 times
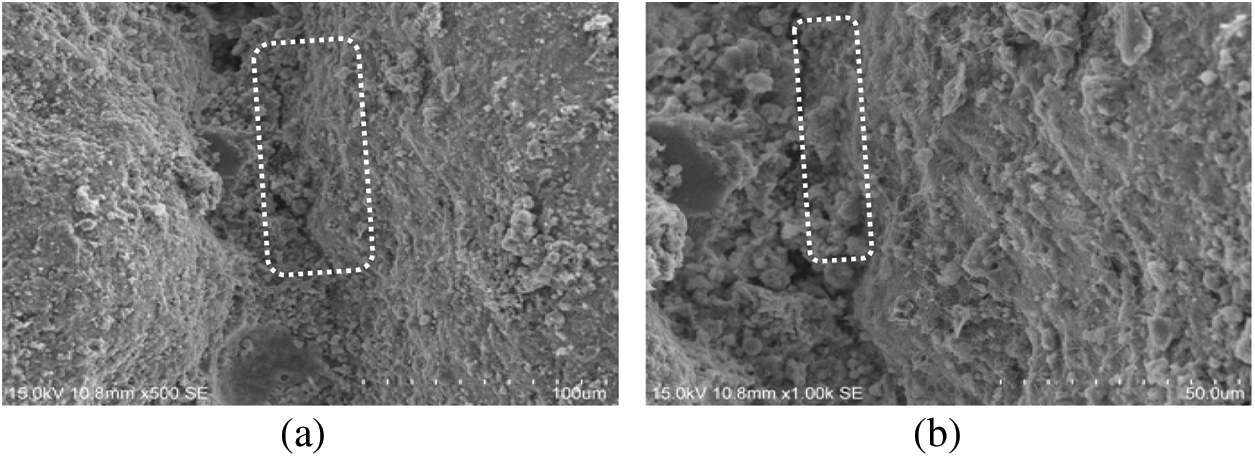
Figure 15: BJ12 56 d interface transition zone (a) 500 times (b) 1000 times
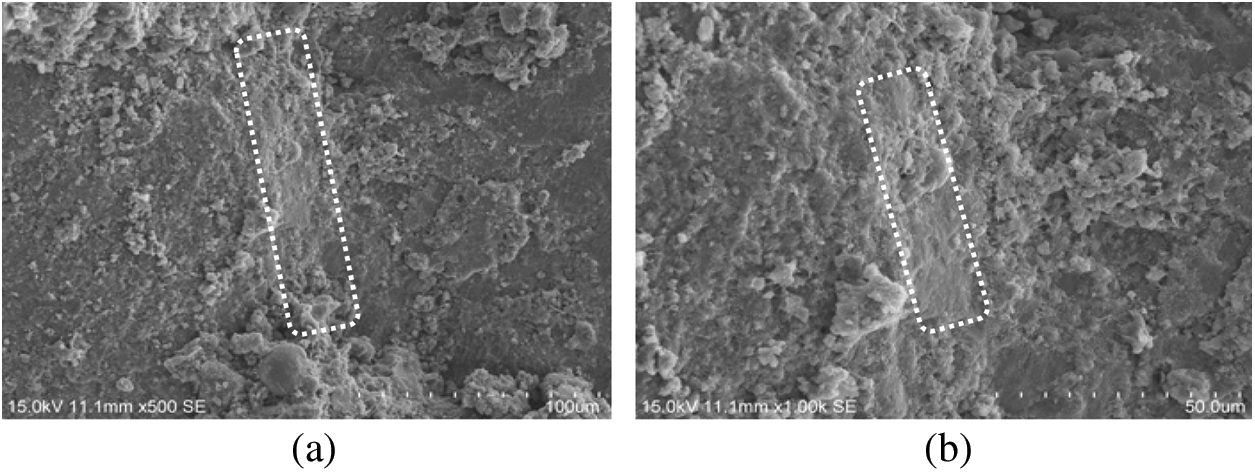
Figure 16: BJ12 90 d interface transition zone (a) 500 times (b) 1000 times
The internal microstructure of 28 d CSG material is shown in Fig. 17. The figure shows that under 3000× magnification, the internal structure of CSG material is disordered; the structure shows an unhydrated area. Sufficient hydration reaction does not occur, confirming that the cementation strength of the 28 d two-phase transition zone is not strong, thereby limiting the mechanical properties. To observe the structure more clearly, the same area was observed under 5000× magnification. Some hydration products were observed to be interlaced with C-S-H gels in the form of twisted fine needles and flakes and the hydration product ettringite.
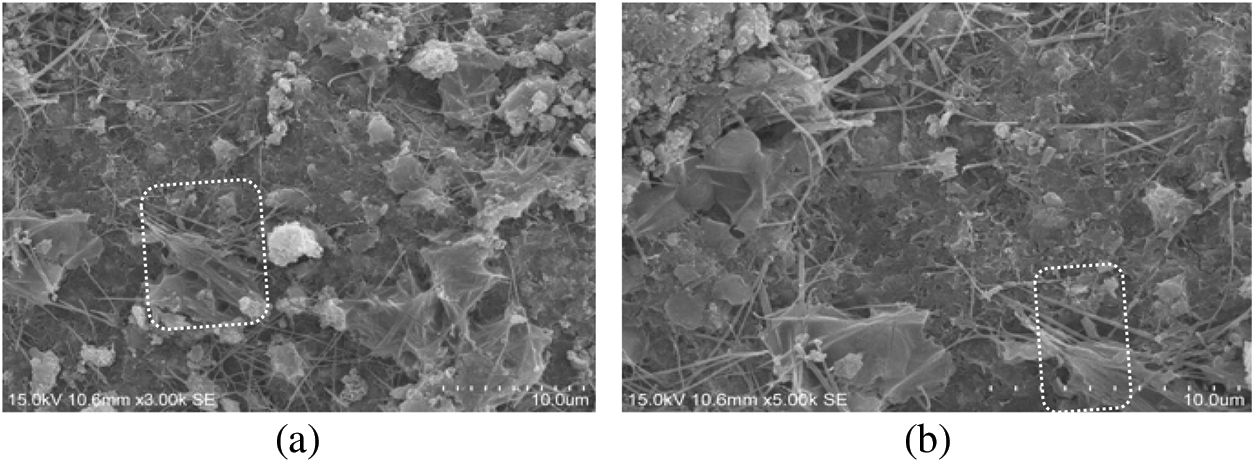
Figure 17: CSG material 28 d internal structure (a) 3000 times (b) 5000 times
The internal microstructure of 56 d CSG material is shown in Fig. 18. Because of the large specific surface area of sand and gravel, the material acts as a cementing material between particles. The oxygen-containing functional groups can provide space for cement hydration. The incorporation of fly ash makes the cementitious material further hydrated and generates small particles of hydrated calcium silicate gel. This gel fills in the microscopic pores of CSG and reduces the number of pores. With the interlacing effect of small hydration products, the internal structure becomes more compact. With increase in age, the mechanical properties of the cementitious materials are improved. The internal structures of different regions are shown in Figs. 18a and 18b; it is seen that although the strength is not high at 56 d, the hydration reaction has occurred. Compared with the flocculent products observed at 28 d, the spherical hydration products, observed under 10× are more obvious, indicating that the internal structure of the optimal ratio BJ12 changed in 56 d.
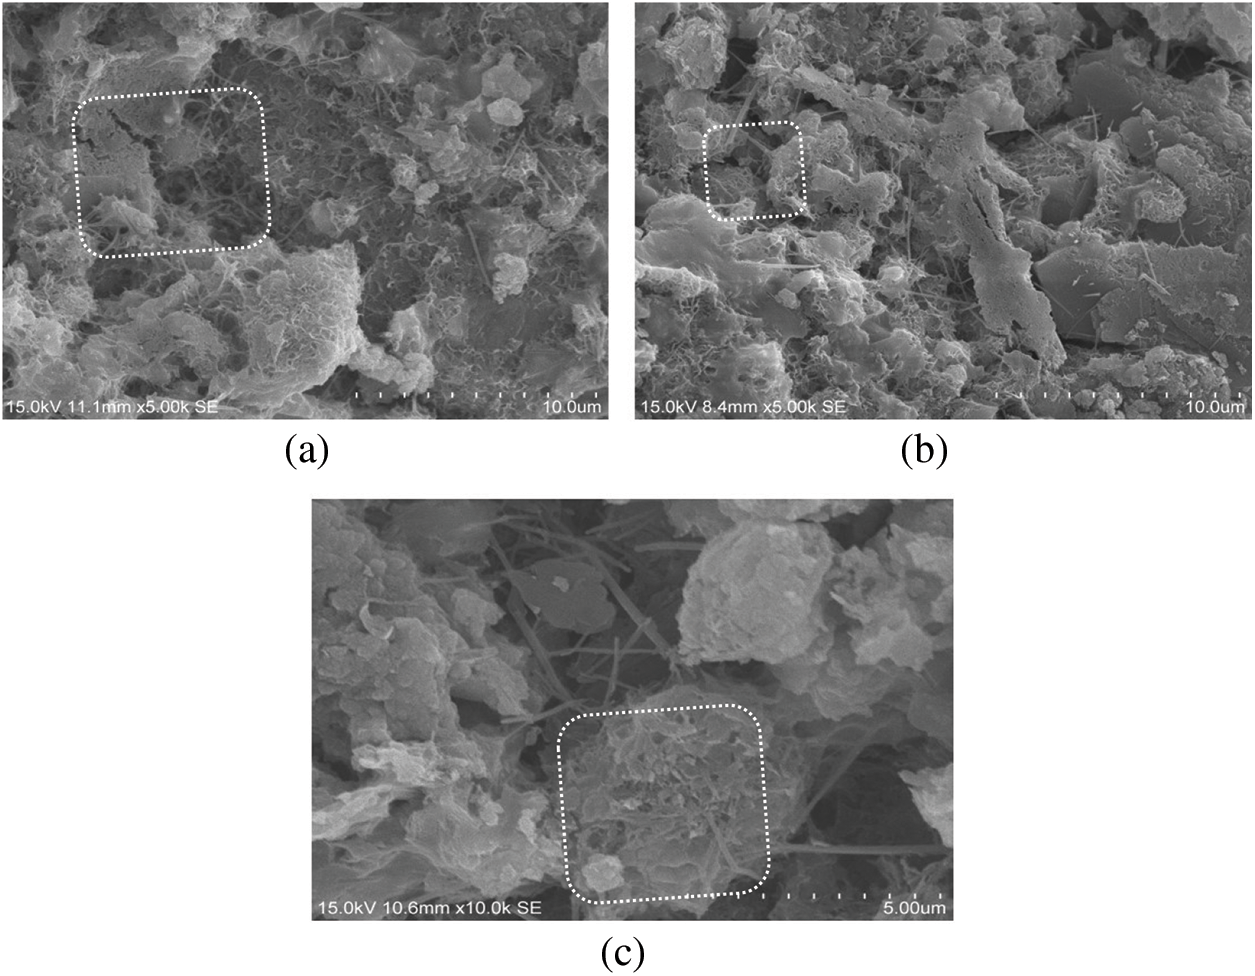
Figure 18: Internal structure of CSG material 56 d (a) 5000 times (b) 5000 times (c) 10000 times
The internal microstructure of the 90 d CSG material is shown in Fig. 19. Panel a of the figure shows a 3000× magnified image of the internal microstructure. More C-S-H, compared to CH, is produced by the hydration. Fig. 19b shows a 5000× magnified image of the internal microstructure. The C-S-H gel mostly occurs as twisted fine needles and flakes that are interlaced with each other. The hydration product ettringite acts as a cement between the particles. To reduce the pore size, fly ash and cement are added to facilitate the hydration reaction. As the age is increased to 90 d, more pores are filled, and the three-dimensional structure is bonded to form a three-dimensional structure; thus, its compactness is improved. In CSG, fly ash is combined with cement. Because of the slow hydration of fly ash to provide water for cement, more cement hydration occurs. This effect is better at 180 d. Fig. 19d shows the 10,000× magnified image of the local structure of the fracture formed by impacting the CSG material after 90 d. The compactness of CSG material is weaker than that of concrete. Under the amplification effect, hydration occurs between the pores. C-S-H, CH, Ca(OH)2, and other products [34] fill the gaps and holes and improve the mechanical properties of CSG. The hydration improves with time. The longer the age, the better are the hydration and mechanical properties.
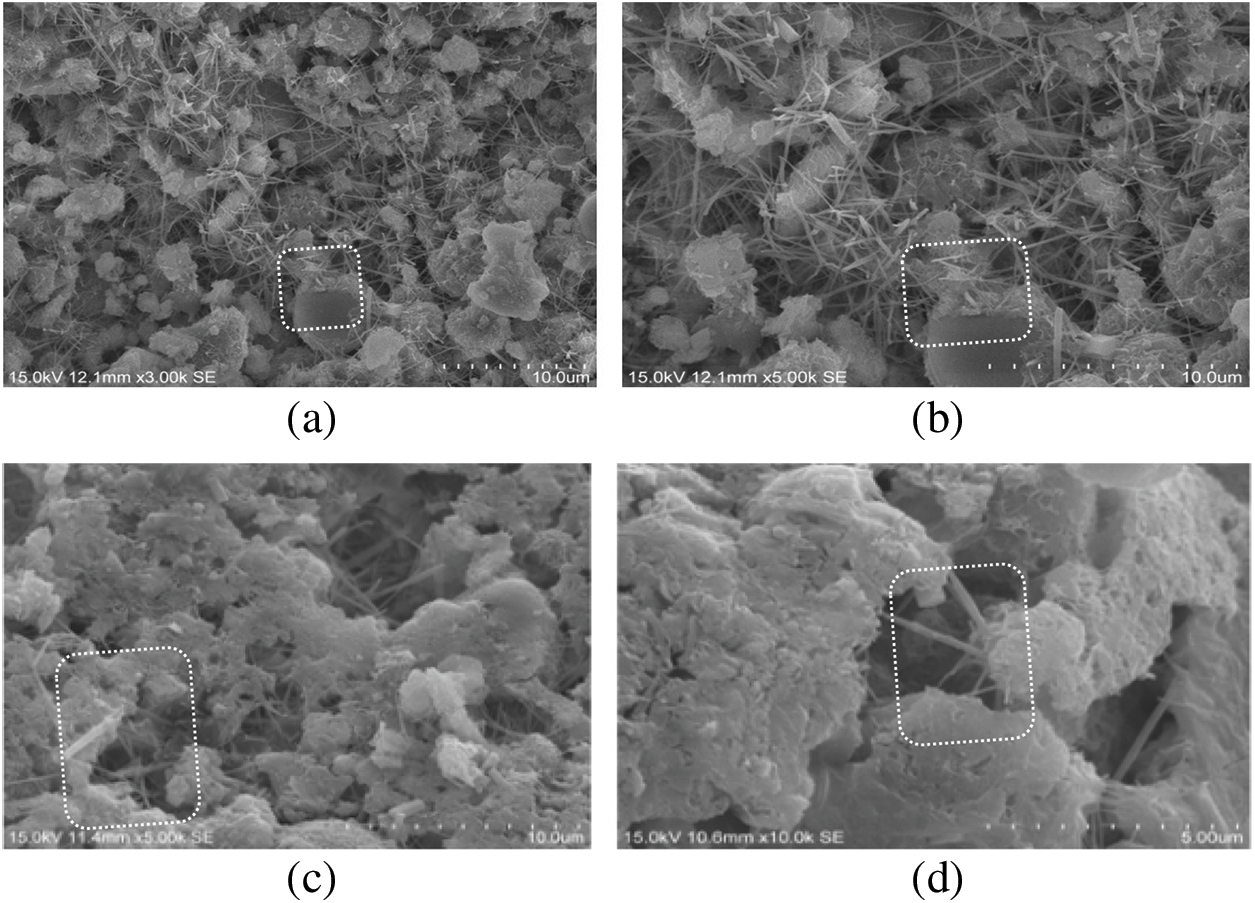
Figure 19: CSG 90 d internal structure (a) 3000 times (b) 5000 times (c) 5000 times (d) 10000 times
Hydration is a long process, in which the strength of the consolidated body continues to increase. When the soil in the sand and gravel is mixed with a certain amount of cement, the hydration of the cement produces C-S-H gel, which improves adhesion between the particles. The cohesive sand and fine sand form a strong bond with Ca(OH)2 and form water-bearing compounds on the contact surface between the cement stone and mineral particles. As the crystal grows, it overlaps with soil particles to form a spatial network, thereby increasing the strength of the CSG material. Fly ash composite material is composed of inorganic aluminosilicate gel, unreacted fly ash particles, voids, etc. Its bulk density is only two-third that of cement, and the particles are more uniformly shaped, and hence, it acts as a good filling material for pore. CSG contains any holes and gaps and has a disordered internal structure. The addition of fly ash in the CSG material further hydrates it to form a small particles of hydrated calcium silicate gel. Therefore, the microscopic pores of the CSG are filled, and the number of pores is reduced. The internal structure becomes more compact because of the interlacing of the small particles of hydration products. With increasing age, the mechanical capacity of the cementitious material increases, and the mechanical properties improve.
CSG can be sourced locally. Compared with concrete, it has low cost and low cement content. The quality control index of raw materials can be adapted to local conditions, and the selection of materials is more flexible. According to Depending on the use of local materials, the comprehensive unit price of CSG material may be approximately 270 yuan/t, which is 30%–50% lower than that of concrete. In addition, the production of CSG materials not only reduces environmental pollution and cost but also has the advantages of a simple production process. The sand and gravel do not have to be screened or washed. This is convenient from the viewpoints of progress control and investment.
The results obtained in this study are approximately consistent with those reported in other works [8–19] in terms of the range of cementitious material dosage, unit water consumption, water-binder ratio, fly ash content, cement content, etc. For example, one study reported that when the cementitious material exceeds 100 kg/m3, the mechanical properties are similar to those of concrete [11]. Unlike this study, when the CSG material has high strength, its mechanical properties are similar to those of concrete, and when the strength is small, the mechanical properties of CSG materials are not significantly similar to those of concrete. In another work [12], the compressive strength of the material was guaranteed when the content of the unit cementitious material was greater than 80 kg/m3, which is consistent with the compressive strength value of the cementitious material used in this study. Further, Guan [17] reported that the longer the age, the better is the hydration and the higher is the compressive strength; these results are consistent with the results of this study. Researchers have reported 90 d or 180 d strength as the design strength, and when the fly ash content is 50% of the total amount of cementitious materials (cement + fly ash), the fly ash content is defined to be optimal; these results are consistent with the best strength of CSG materials at 90 d or 180 d age as defined in this work. However, unlike in this study, the optimal content is 50 kg/m3 cement and 60 kg/m3 fly ash, and the fly ash content accounts for 54% of the total cementitious materials in the previous works. To summarize, CSG materials may be different from other authors’ research results in some aspects, but in general, the change rules of different factors are traceable. In this work, the influence of compressive strength and splitting tensile strength under uniaxial compression conditions was analyzed considering different factors to improve the design parameters of CSG engineering materials.
The analysis and explanation of the results are as follows. From the micro and macro points of view, the longer the age, the better are the mechanical properties. Because fly ash promotes hydration reactions and because of the high content of fly ash, the mechanical properties of CSG materials are better in the later period. The cementitious material content is generally 80–110 kg/m3. When the cementitious material is less than 80 kg/m3 during the test, some amount of mud is present. This is because the materials used are mostly on-site excavation materials. The presence of mud hinders the hydration reaction of cementitious materials and worsens the overall structure of the test block [15]. The presence of less-cementitious materials leads to poor cohesion, fluidity, compactness, and forming effect. When the cementitious material content is greater than 110 kg/m3, the unit water consumption is 120 kg/m3, and the hydration is insufficient. When the unit water consumption is increased to 130 kg/m3 during the test, the forming effect is good. From the viewpoint of economy, an increase in water consumption was not considered. Therefore, the optimal ratio was taken as C50F60W120 considering the mechanical properties and density. In conclusion, this study provides a reference for improving the design parameters of CSG engineering materials. In the follow-up study, the mechanical properties of fully graded CSG will be explored.
In this study, the uniaxial compression, splitting test, and microscopic analysis were performed to examine the CSG material for building dams. It is found that the density, water-binder ratio, cement content, fly ash content, unit water consumption, and age have certain effects on the mechanical properties of CSG. The results imply the following:
(1) The mechanical properties of CSG materials are positively correlated with their density and age. When the unit water consumption is constant, the unit cementitious material content of CSG material increases by 10 kg/m3, the density increases by approximately 2%, and the water content decreases by 0.2%. The greater the density of CSG material, the greater the strength. The longer the age, the more is sufficient the hydration of CSG. With regard to the mechanical properties, reaction for 180 d is better than that for 90 d.
(2) Higher amount of adhesive materials and unit water consumption lead to improved mechanical properties. In this study, the cementitious material content of CSG material is 80–110 kg/m3, and the water-binder ratio is 1–1.50. The splitting tensile strength is one-tenth of the compressive strength, and the maximum strength is 7.42 MPa at 90 d. The mechanical properties of CSG materials are similar to those of concrete and indicates that they are elastic-plastic materials.
(3) The optimal ratio of BJ12 is cement 50 kg/m3, fly ash 60 kg/m3, water 120 kg/m3 (i.e., C50F60W120). When the water-binder ratio is 1.09, the dry density and moisture content ratio is 6%; the maximum dry density is 2.60 g/cm3; the 90 d compressive strength is 7.42 MPa; and the splitting tensile strength is 0.65 MPa.
Acknowledgement: I want to thank Mr. Aimin Gong for guidance in my research. Our conversations inspired me to write the entire work and complete it successfully. He always made me feel confident in my skills. And thank Mr. Wei Li selfless help and dedication to complete the work better.
Funding Statement: This work was supported by the Scientific Research Fund of Yunnan Provincial Department of Education (2022Y286), 15th Student Science and Technology Innovation and Entrepreneurship Action Fund Project of Yunnan Agricultural University (2022ZKX098), and the Yunnan University Professional Degree Graduate Student Practical Innovation Fund Project (Grant Number ZC-22222374), and the Scientific Research Fund Project of Yunnan Education Department (Grant Numbers 2023J1974 and 2023J1976).
Author Contributions: The authors confirm contribution to the paper as follows: study conception and design: Ran Wang, Aimin Gong; data collection: Shanqing Shao, Feipeng Liu; analysis and interpretation of results: Baoli Qu, Fulai Wang; draft manuscript preparation: Jing Xu. All authors reviewed the results and approved the final version of the manuscript.
Availability of Data and Materials: The data that support the findings of this study are available on request from the corresponding author.
Conflicts of Interest: The authors declare that they have no conflicts of interest to report regarding the present study.
References
1. Plaza, P., Sáez del Bosque, I. F., Frías, M., Sánchez de Rojas, M. I., Medina, C. (2021). Use of recycled coarse and fine aggregates in structural eco-concretes. Physical and mechanical properties and CO2 emissions. Construction and Building Materials, 285, 122926. [Google Scholar]
2. Cai, X., Yang, J., Guo, X. W. (2015). Summary of research on cemented sand and gravel dams. Journal of Hohai University (Natural Science Edition), 43(5), 431–441. [Google Scholar]
3. Raphael, J. M. (1970). The optimum gravity dam, rapid construction of concrete dams. American Society of Civil Engineers, 3(7), 221–244. [Google Scholar]
4. Londe, P., Lino, M. F. (1992). The facing symmetrical hard-fill dam: A new concept for RCC. Water Power & Dam Construction, 2(44), 19–24. [Google Scholar]
5. Fujisawa, T. (2002). Study on strength and physical properties of cemented materials for CSG design. Japan: Hydraulic Research Engineering Group, Public Works Research Institute. [Google Scholar]
6. Shigeki, M. (2019). “CSG” method. Water Conservancy Science, 63(5), 17–27. [Google Scholar]
7. Yang, Z. B. (2021). Experimental study on permeability characteristics of cemented sand and gravel (Master Thesis). North China University of Water Resources and Hydropower, Zhengzhou, China. [Google Scholar]
8. Feng, W., Jia, J. S., Ma, F. L. (2013). Study on mix design parameters of cemented sand and gravel materials. Water Conservancy and Hydropower Technology, 44(2), 55–58. [Google Scholar]
9. Jin, G. R., Wang, S. F., Li, M. H., Hu, Q. G., Quan, J. H. (2018). Freeze-thaw durability analysis of CSG materials. Water Conservancy and Hydropower Technology, 49(4), 195–202. [Google Scholar]
10. Xu, T., Jin, G. (2020). Effects of unit cement content and aggregate maximum particle size on compressive strength of cemented sand and gravel materials. IOP Conference Series: Earth and Environmental Science, 508(1), 34. [Google Scholar]
11. Yan, L., He, J. X., Yang, H. H. (2020). Research and engineering application of cemented sand and gravel mixture ratio design. People’s Yellow River, 42(2), 85–88+112. [Google Scholar]
12. Han, L. W., Yang, Z. B., Guo, L. (2021). Study on the influence of water-binder ratio on the compressive strength of cemented sand and gravel. People’s Yellow River, 43(5), 124–127. [Google Scholar]
13. Wu, H. Y. (2022). Study on material properties and filling process of cemented sand and gravel. Water Conservancy Science and Technology and Economy, 28(1), 151–155. [Google Scholar]
14. Seok, K. Y., Ik, Y. K., Hoon, S. H., Seong, Y. K. (2010). Compressive strength properties and freezing and thawing resistance of CSG materials. Journal of the Korean Society of Agricultural Engineers, 52(1), 51–59. [Google Scholar]
15. Guo, L., Wang, J., Guo, L. X., Zhao, T. M., Guan, Z. et al. (2020). Effect of clay content on strength of cemented sand and gravel. People’s Yellow River, 42(3), 136–139. [Google Scholar]
16. Guo, L., Chen, P. P., Guo, L. X., Wang, J., Zhang, F. F. et al. (2021). Study on mechanical properties and hydration mechanism of cemented artificial sand. Water Conservancy and Hydropower Technology (Chinese and English), 52(2), 194–199. [Google Scholar]
17. Guan, Z. (2021). Study on freeze-thaw damage characteristics of cemented sand and gravel materials (Master Thesis). North China University of Water Resources and Hydropower, Zhengzhou, China. [Google Scholar]
18. Karimi, S., Aghajani, H. F. (2023). The strength and microstructure of cemented sand-gravel (CSG) mixture containing fine-grained particles. International Journal of Geo-Engineering, 14(1), 5. [Google Scholar]
19. Karimi, S., Aghajani, H. F. (2023). A new solution for water-tightening of the cemented sand-gravel (CSG) hardfill dams. Innovative Infrastructure Solutions, 8(6), 173. [Google Scholar]
20. Ma, S. K., Duan, Z. B., Liu, Y., Wang, B., Shao, Y. (2020). Large triaxial test study on dynamic characteristics of round gravel. Arabian Journal of Geosciences, 13, 1–9. [Google Scholar]
21. Plaza, P., Sáez del Bosque, I. F., Frías, M., Sánchez de Rojas, M. I., Medina, C. (2021). Use of recycled coarse and fine aggregates in structural eco-concretes. Construction and Building Materials, 285, 122926. [Google Scholar]
22. Tam, V. M. Y., Tam, C. M., Wang, Y. (2007). Optimization on proportion for recycled aggregate in concrete using two-stage mixing approach. Construction and Building Materials, 21(10), 1928–1939. [Google Scholar]
23. Akono, A. T., Chen, J. X., Zhan, M. M., Shah, S. P. (2021). Basic creep and fracture response of fine recycled aggregate concrete. Construction and Building Materials, 266, 121107. [Google Scholar]
24. Zhao, Q., Wu, J. G., Ni, H. T., Wang, Y. Y., Su, Y. (2022). Experimental study on the optimal ratio of filling materials for a phosphate rock. Mining Technology, 22(5), 210–215. [Google Scholar]
25. Jinnmon, K., Kunimine, N. (2000). Technical development of cemented sand and gravel (C. S. G.) method for the purpose of aggregate recycle. Proceedings of the Symposium on Global Environment, 8, 63–68. [Google Scholar]
26. Celik, F., Akcuru, O. (2020). Rheological and workability effects of bottom ash usage as a mineral additive on the cement based permeation grouting method. Construction and Building Materials, 263, 120186. [Google Scholar]
27. Akın, A. (2022). Investigation of different permeability properties of self-healing cementitious composites under colloidal nano silica curing conditions. Structural Concrete, 23(2), 791–804. [Google Scholar]
28. Zhang, T. Z., Wang, L. J., Sun, D. (2013). Integration and development of unconfined compressive strength test equipment. Experimental Science and Technology, 11(5), 16–18. [Google Scholar]
29. Chen, S. K., Fu, Y. Q., Bie, Y. J. (2020). Analysis of influencing factors on compressive strength of cemented sand and gravel. People’s Yellow River, 42(11), 126–129+146. [Google Scholar]
30. Sun, Z. W. (2017). Research on the relationship between water consumption and other influencing factors based on the compressive strength of cemented sand and gravel (Master Thesis). North China University of Water Resources and Hydropower, Zhengzhou, China. [Google Scholar]
31. Piro, N. S., Mohammed, A. S., Hamad, S. M. (2023). Compressive strength and piezoresistivity of smart cement paste modified with waste steel slag. Journal of Building Engineering, 70, 106393. [Google Scholar]
32. Celal, C., Yaren, A., Gebrail, B., Zong, W. G. (2023). Interpretable predictive modelling of basalt fiber reinforced concrete splitting tensile strength using ensemble machine learning methods and SHAP approach. Materials, 16(13), 4578. [Google Scholar]
33. Ik, Y. K., Seok, K. Y., Seong, Y. K. (2010). The compaction and compressive strength properties of CSG material reinforced polypropylene fiber. Journal of the Korean Society of Agricultural Engineers, 52(4), 73–81. [Google Scholar]
34. Francisco, V., Nora, E., Myriam, M., Cristian, G., Yadira, G. et al. (2023). Microstructural and mechanical characteristics of alkali-activated binders composed of milled fly ash and granulated blast furnace slag with μ-limestone addition. Materials, 16(10), 3818. [Google Scholar]
Cite This Article
 Copyright © 2024 The Author(s). Published by Tech Science Press.
This work is licensed under a Creative Commons Attribution 4.0 International License , which permits unrestricted use, distribution, and reproduction in any medium, provided the original work is properly cited.
 Downloads
 Citation Tools