
 Submit a Paper
 Propose a Special lssue
 Open Access
ARTICLE

Experimental Analysis of Radial Centrifugal Pump Shutdown
1 School of Mechanical Engineering, Hunan University of Technology, Zhuzhou, 412007, China
2 College of Mechanical Engineering, Quzhou University, Quzhou, 324000, China
3 Zhejiang Testing & Inspection Institute for Mechanical and Electrical Products Quality Co., Ltd., Hangzhou, 310014, China
4 Quzhou Special Equipment Inspection Center, Quzhou, 324000, China
5 The Zhejiang Provincial Key Lab of Fluid Transmission Technology, Zhejiang Sci-Tech University, Hangzhou, 310018, China
6 Zhuzhou Nanfang Valve Co., Ltd., Zhuzhou, 412000, China
* Corresponding Author: Yuliang Zhang. Email:
Fluid Dynamics & Materials Processing 2024, 20(4), 725-737. https://doi.org/10.32604/fdmp.2023.045541
Received 30 August 2023; Accepted 27 November 2023; Issue published 28 March 2024
 View Full Text
 Download PDF
Abstract
Centrifugal pumps are widely used in the metallurgy, coal, and building sectors. In order to study the hydraulic characteristics of a closed impeller centrifugal pump during its shutdown in the so-called power frequency and frequency conversion modes, experiments were carried to determine the characteristic evolution of parameters such as speed, inlet and outlet pressure, head, flow rate and shaft power. A quasi-steady-state method was also used to further investigate these transient behaviors. The results show that, compared to the power frequency input, the performance parameter curves for the frequency conversion input are less volatile and smoother. The characteristic time is longer and the response to shutdown is slower. The quasi-steady-state theoretical head-flow curves match the experimental head-flow curves more closely at low flow rates when the frequency conversion input is considered. Moreover, in this case, the similarity law predicts the hydraulic performance more accurately.Keywords
As a general-purpose fluid transfer device, centrifugal pumps are widely used in metallurgy, electric power, and other industries [1,2]. When it works steadily, the fluid flow in the pump is stable, and its performance parameters remain relatively stable, with only periodic fluctuations in the blades. However, there are still cases where the various performance parameters change drastically quickly. For example, during its shutdown, rapid and complex energy changes cause water hammer and current shocks, threatening the pump’s safe operation. As a result, it is vital to study the transient performance of centrifugal pumps under the shutdown.
Several scholars have studied various aspects of the pump shutdown through numerical simulations or experiments. For example, the flow characteristics of different pumps and the effect of changes in the pump system and fluid medium during shutdown have been studied experimentally and theoretically. Tsukamoto et al. [3] studied the transient characteristics of centrifugal pumps during stopping and proposed a theoretical calculation method for predicting the transient characteristics. It was found that pressure pulsation and hysteresis are the main reasons for the differences between transient and quasi-steady state characteristics. Zhang et al. [4] used dimensionless analysis and quasi-steady-state methods to investigate the transient characteristics of three typical impeller structure centrifugal pumps. The results showed that the transient hydraulic performance of centrifugal pumps at low-speed shutdown could be predicted using the similarity law for small flow conditions. Liu et al. [5] used CFD methods to investigate the flow during the rapid stopping of a radial flow pump and carried out numerical simulations. The calculation results based on the standard k-e turbulence model combined with the VOF model can well reflect the transient performance of the impeller during rapid shutdown. Shourkaei [6] investigated the transient performance of TRR pumps during shutdown based on a theoretical approach. The results show that flow rate and speed decrease with time during the shutdown, with the rate of decrease greater at the beginning of the shutdown than at the end. Liu et al. [7] proposed a new calculation method and simulated the shutdown of an axial flow pump system. The comparisons between the model test and numerical simulation show that the calculation method can simulate transient flow in axial flow pump systems. Kan et al. [8] investigated the flow characteristics of a tubular pump unit during power failure. It was found that the flow regime generally changes during the runaway power failure, with pump head, speed, and flow rate decreasing significantly with time. Zhang et al. [9] studied the transient performance variation of centrifugal pumps under different non-inertial stopping conditions through experiments and analyzed the transient behavior of the system by using dimensionless analysis and the affinity law. Zhang et al. [10] used CFD software to simulate the start-stop flow of three different viscosity liquids in a centrifugal pump to investigate the effect of viscosity on its transient behavior. It was found that higher-viscosity liquids respond more quickly to changes in pump speed. Feng et al. [11] performed a custom function to solve the angular momentum equation for pump speed and simulated the transient process under pump shutdown. Tanaka et al. [12] studied the transient characteristics of centrifugal pumps during startup and shutdown under low cavitation margin conditions. They found that transient fluctuations are caused by oscillatory cavitation and are similar to those occurring when the discharge valve is open. Cao et al. [13] proposed the Point Implicit Method of Characterization (PIMOC) and an improved pump formulation to simulate the transient flow caused by pump outage. Rohani et al. [14] measured the transient performance of a mixed-flow pump during starting and stopping. It was shown that the quasi-steady state assumption is not suitable for predicting the transient performance of the pump. Lefebvre et al. [15] experimentally investigated the transient behavior of a volute pump during the stopping period and used the characterization method to quantify the transient performance. It was found that the decreases in the performance parameters are not synchronized, and the transient head characteristics are closely related to the steady state system head curve. Thanapandi et al. [16] investigated the transient process under power failure with an analytical method and discussed the method of integrating equations with assumed rigid and elastic fluid columns. Kittredge [17] investigated the water hammer effect and vibration characteristics during pump shutdown. They used the characterized lines method to analyze the velocities and dynamic pressure of the fracturing fluid, axial velocities, and additional stress of piping at different depths. The results showed that the shorter the pump stoppage time, the higher the dynamic pressure of the fracturing fluid, the higher the axial velocity of the pipeline during pump stoppage, and the more likely to damage the pipeline during pump stoppage. Wu et al. [18] simulated the pump shutdown with different initial speeds and rotational inertia with the aid of a flywheel. Due to the action of the flywheel, the pump shutdown is delayed, and the flow rate slowly decreases. In addition, the performance of centrifugal pumps under the startup stage has also been thoroughly investigated [19–22].
In summary, the transient characteristics during pump shutdown have been studied in several ways. However, most of the studies are based on the conditions of the pump system itself and the variation in fluid type and nature. The differences in characteristics caused by external conditions have yet to be studied in depth, such as the effect of different electrical inputs on pump shutdown. Based on this, this paper investigates a centrifugal pump by measuring its transient external characteristics under two shutdown conditions: power frequency and frequency conversion, and obtaining its performance parameters such as inlet and outlet pressure, speed, head, flow rate, and shaft power.
2 Experimental Facility and Pump Model
The power frequency shutdown is a power failure shutdown, which is uncontrolled. The frequency conversion shutdown is controlled by the frequency converter to modify the current frequency to control the motor speed to achieve the final shutdown. The test rig in this paper is identical to the literature [23]. The test rig model can be found in Fig. 1, wherein the current input to the motor can be controlled by adding a frequency converter. The driving motor is a variable frequency motor of 4.0 kW with a scale of 0–50 N.m; the uncertainties of rotating speed and torque are both ±0.25%. The OPTIFLUX2100C electromagnetic flowmeter measures the instantaneous flow rate with a scale of 0–30 m3/h and an uncertainty of ±0.2%. The WIKA S-10 type pressure sensors are used to obtain the transient pressure at the inlet and outlet of the pump in the measuring ranges of −1.0–1.0 MPa and 0.0–1.6 MPa, both with uncertainties of ±0.1%.
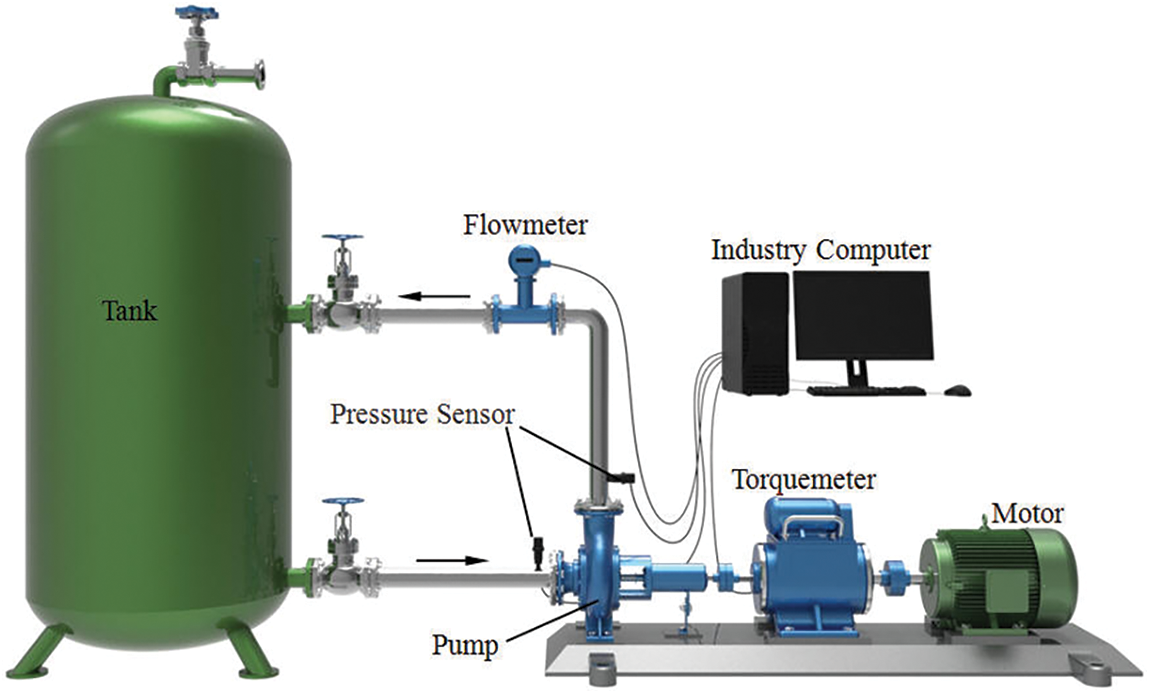
Figure 1: Test rig model
Design and manufacture a low specific-speed centrifugal pump with the following initial design parameters: flow rate Qd = 6 m3/h, head Hd = 8 m, speed nd = 1450 r/min. The 2D-cylindrical blades and closed impeller structure with four long blades are shown in the 3D model in Fig. 2. The volute dimensional variation pattern is in the form of an Archimedean spiral, and other dimensional parameters are shown in Table 1.
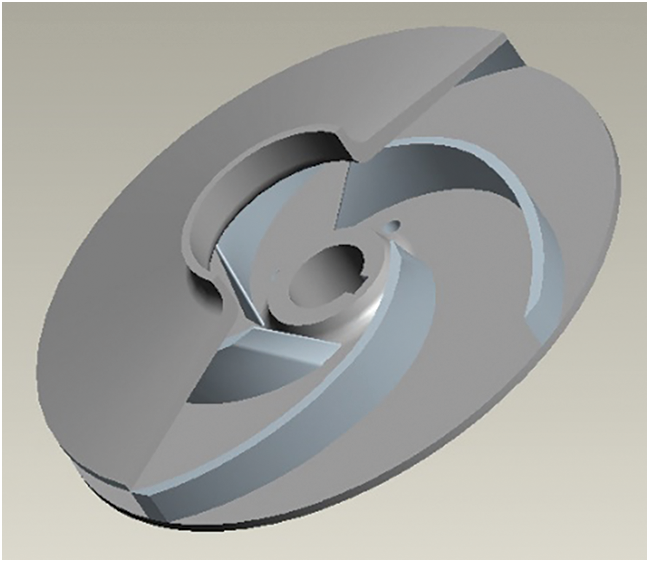
Figure 2: Semi-sectional view of closed impeller
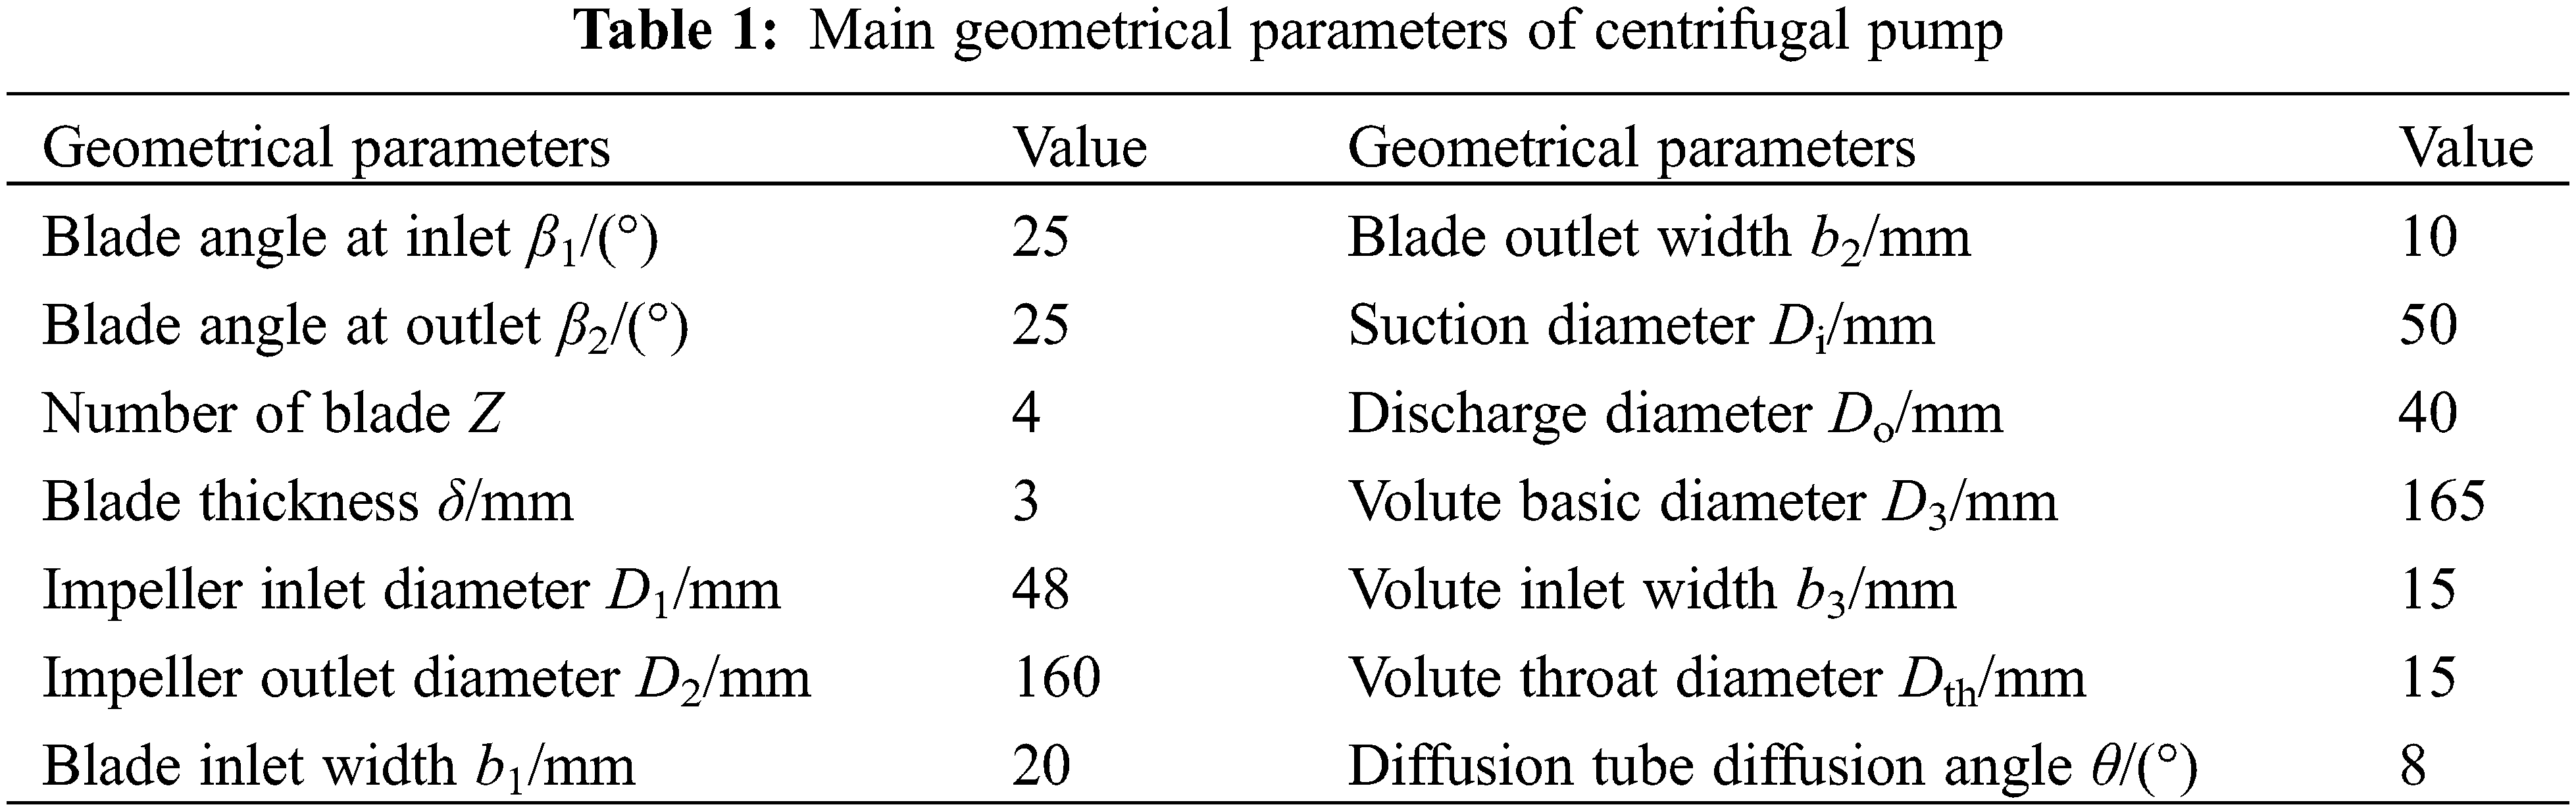
Fig. 3 shows the speed of the experimental pump under shutdown conditions for power frequency and frequency conversion inputs.
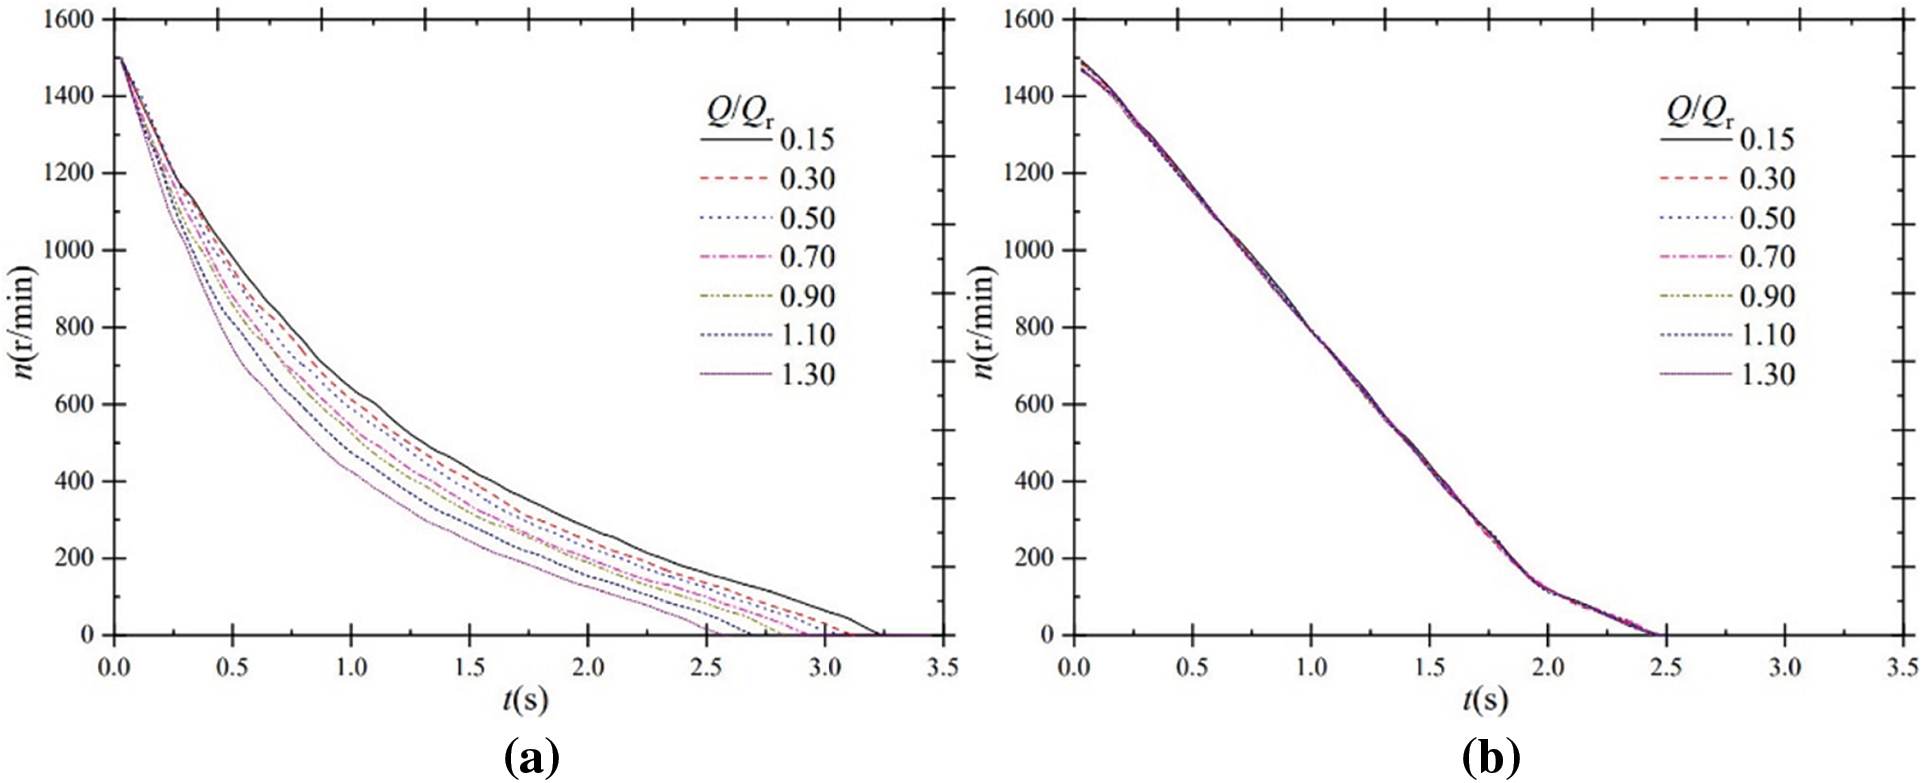
Figure 3: Speed characteristics during shutdown; (a) power frequency; (b) frequency conversion
For power frequency input, regardless of the valve opening, the speed decreases rapidly and then decreases slowly to zero. As seen for power frequency input, the speed curves before t = 1.75 s are much steeper than after t = 1.75 s for each steady-state flow rate ratio. The impeller speed responds quickly to power failure shutdown. It is also found that the speed drop rate increases as the valve opening increases. Compared with the speed curves for Q/Qr = 0.15 and Q/Qr = 1.30, it is clear that the speed curve is steeper for Q/Qr = 1.30.
As the steady-state flow ratio increases, the time required for shutdown decreases. For the steady-state flow ratio Q/Qr = 0.15, 0.30, 0.50, 0.70, 0.90, 1.10, and 1.30 for power frequency input, the corresponding downtime is 3.265, 3.125, 3.062, 2.938, 2.843, 2.703, and 2.593 s, respectively, and the maximum difference of downtime is 0.672 s. The greater the valve opening, the more flow is passed and the greater the resistance torque of the water body on the rotating impeller during the shutdown, thus resulting in the shorter time required for the speed to drop to zero.
For frequency conversion input, the speed curves differ less at each steady-state flow ratio. Under frequency conversion shutdown, the impeller rotational speed under each flow rate is determined by the motor rotational speed, and the motor rotational speed is determined by the current modified by the frequency converter. Hence, the difference of each rotational speed curve is extremely small. While under power frequency shutdown, the rotational speed before shutdown under each working condition is the same, but the difference in water body resistance under each working condition is large, and the attenuation of the impeller rotational speed after shutdown is mainly affected by the resistance of the water body, so the difference in rotational speed curves under power frequency shutdown is significant. Until t = 1.96 s, the speed decreases close to uniformly; after that, the impeller speed also decreases close to uniformly, but at a lower rate; and the speed finally decreases to zero at approximately t = 2.45 s, unlike the power frequency input where the speed first decreases rapidly and then decreases slowly to zero. It is also found that the speed-to-zero time is shorter for frequency conversion input than for power frequency input at each flow ratio. The shortest speed-to-zero time at Q/Qr = 0.15 is about 2.593 s under power frequency shutdown but is still longer than frequency conversion shutdown.
Fig. 4 shows the inlet static pressure of the experimental pump under shutdown for power frequency and frequency conversion inputs. The inlet static pressure is measured by a pressure sensor installed at the pump inlet line and is generally small in absolute value.
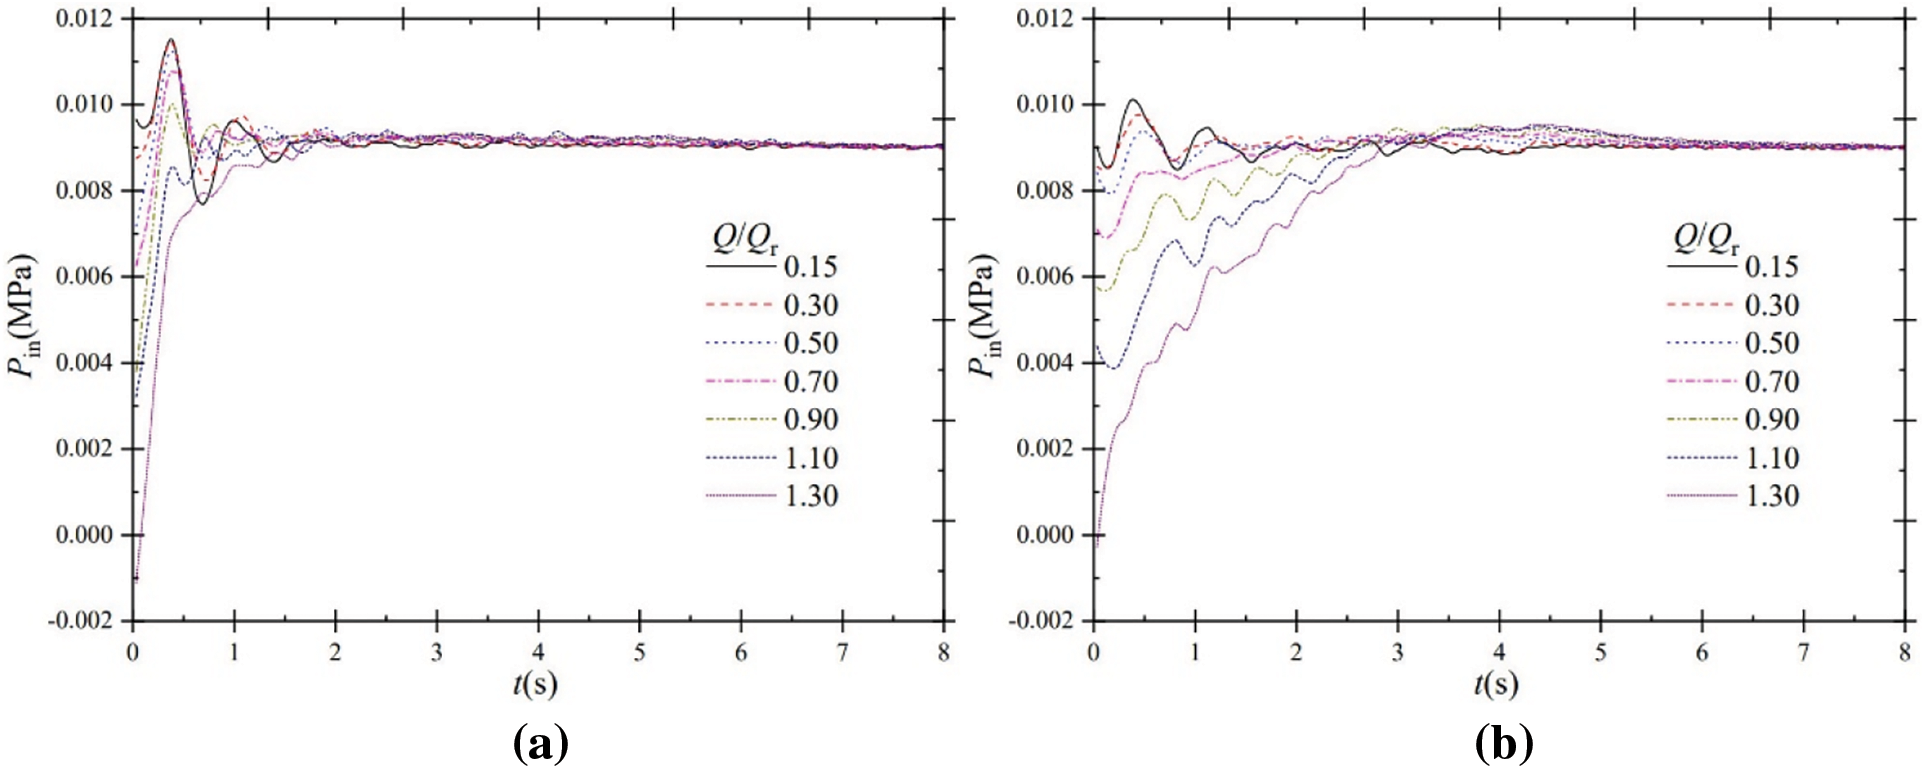
Figure 4: Inlet pressure characteristics during shutdown; (a) power frequency; (b) frequency conversion
As the centrifugal pump starts to shut down for power frequency input, the impeller speed drops rapidly. The inlet static pressure for all seven different steady-state flow ratio scenarios shows dramatic fluctuations and eventually converges to a steady value. For example, at Q/Qr = 0.15, the maximum pressure is 0.0116 MPa, while the minimum pressure is 0.0077 MPa, with a difference of 0.0039 MPa. There are dramatic fluctuations in static pressure in the early shutdown stage. As the impeller speed decreases, the pressure fluctuation decreases, and the pressure stabilizes at around t = 6.5 s at each flow ratio.
It can also be seen that there are significant differences in the inlet static pressure variation for different flow ratio scenarios: static pressure fluctuations change to a stable value at low flow ratios, while static pressure fluctuations rise rapidly to a stable value at moderate and high flow ratios. For example, at a low flow ratio of Q/Qr = 0.15, the initial pressure is 0.0097 MPa and then fluctuates to a stable value of 0.0088 MPa, with a difference of 0.0009 MPa. At a high flow ratio of Q/Qr = 1.30, the pressure rises rapidly from an initial pressure of −0.0011 MP to the same stable value simultaneously, with a difference of 0.0099 MPa.
For frequency conversion input, the overall characteristics of the inlet static pressure curves are similar to those for power frequency input, with only slight differences. The amplitude of the static pressure fluctuations for frequency conversion input is smaller than for power frequency input. For example, with Q/Qr = 0.15 under frequency conversion shutdown, the maximum pressure reaches 0.0101 MPa, while the minimum pressure can reach 0.0085 MPa, the difference between the two is 0.0016 MPa, and the pressure fluctuation is smaller than when the power frequency input is used.
It is also found that at moderate to high flow ratios, the inlet static pressure also tends to rise rapidly in a fluctuating manner for frequency conversion input but at a lower rate than for power frequency input. For example, with Q/Qr = 1.30 under power frequency shutdown, the inlet static pressure rises from −0.0011 to 0.0091 MP from t = 0 s to t = 2.0 s, increasing to 0.0102 MP. In contrast, for frequency conversion input, from t = 0 s to t = 2.0 s, the static pressure only rises from −0.0003 to 0.0076 MP, a rise of 0.0079 MP, a significantly smaller pressure rise than for power frequency input.
Fig. 5 shows the outlet static pressure of the experimental pump under shutdown for power frequency and frequency conversion inputs. The outlet static pressure is measured by a pressure sensor installed at the pump outlet line, which is much higher than the inlet static pressure.
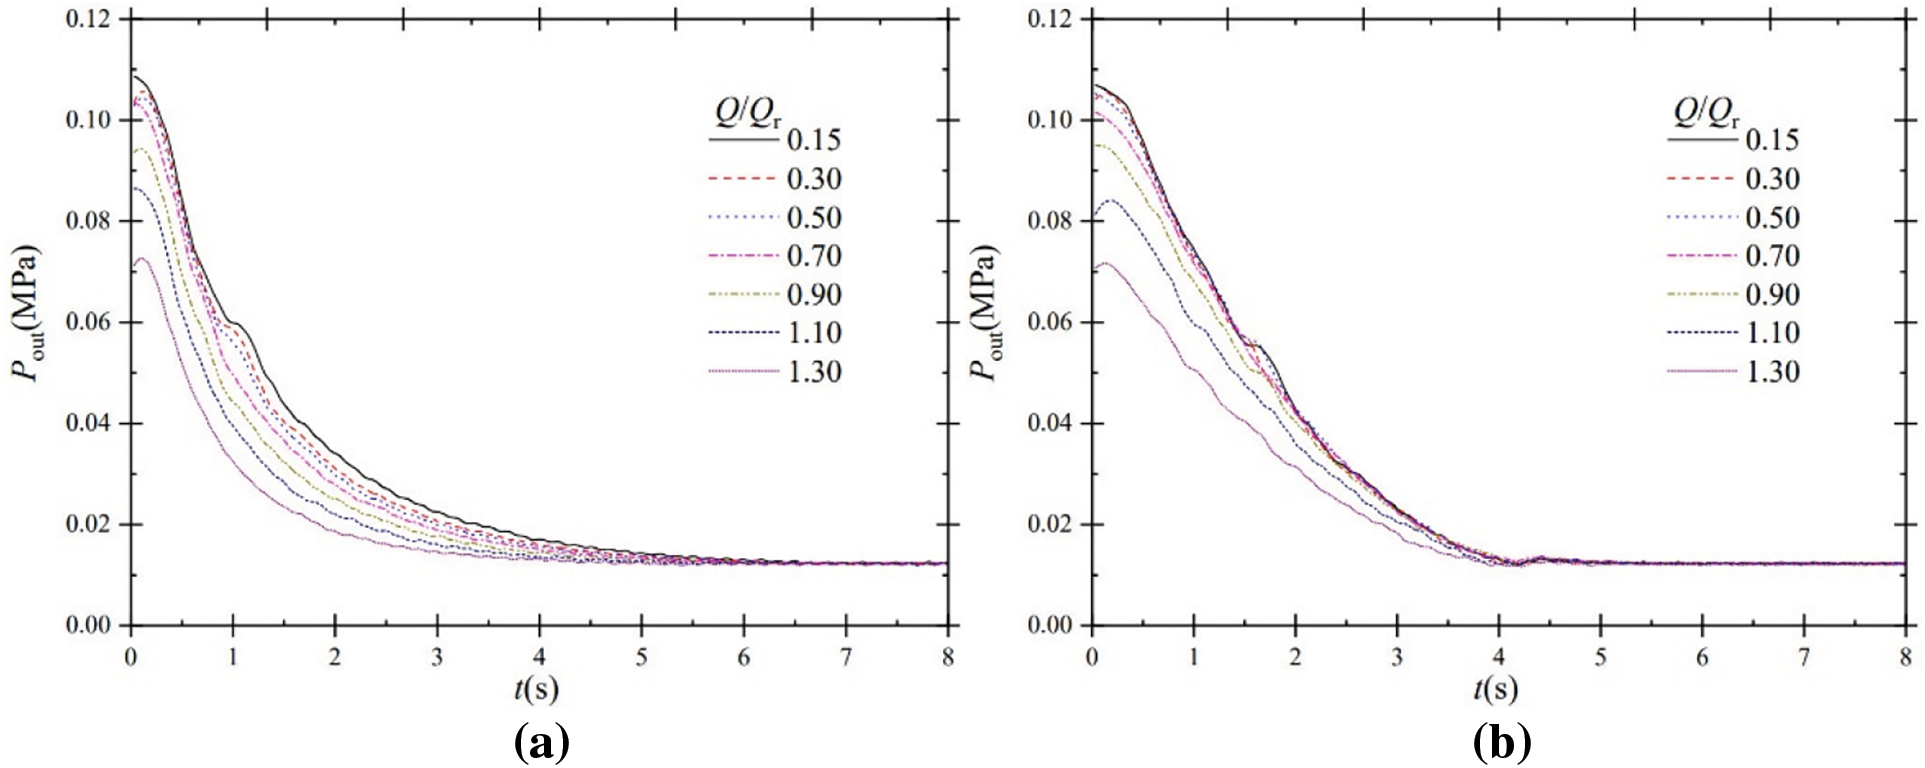
Figure 5: Oulet pressure characteristics during shutdown; (a) power frequency; (b) frequency conversion
The outlet pressure curves for power frequency input show an evolutionary characteristic of a rapid decrease followed by a slow decrease to a stable value at each flow ratio. As seen for power frequency input, the curves fall rapidly before t = 2.0 s, while the curves between t = 2.0 s and the stable value are relatively flat. Unlike power frequency input, the outlet pressure curves for frequency conversion input have a smaller decrease rate in the early shutdown stage and then fluctuate to stable values. Under frequency conversion shutdown, it is not a power failure shutdown. Although the frequency converter modifies the current to reduce the motor speed, the motor can still provide power for the impeller to rotate. Under power frequency shutdown, the power is cut off, and the motor is stopped. The motor no longer rotates independently and only relies on the remaining energy to maintain the rotation of the impeller. Therefore, the outlet pressure in frequency conversion mode decreases more slowly in the early shutdown stage.
As the speed decreases, the outlet static pressure tends to a final stable value of around 0.014 MPa. At seven different steady-state flow ratios, the steady value is reached at around t = 6.5 s for power frequency input, and around t = 5.0 s for frequency conversion input, which takes less time.
Fig. 6 shows the flow rate of the experimental pump under shutdown for power frequency and frequency conversion inputs.
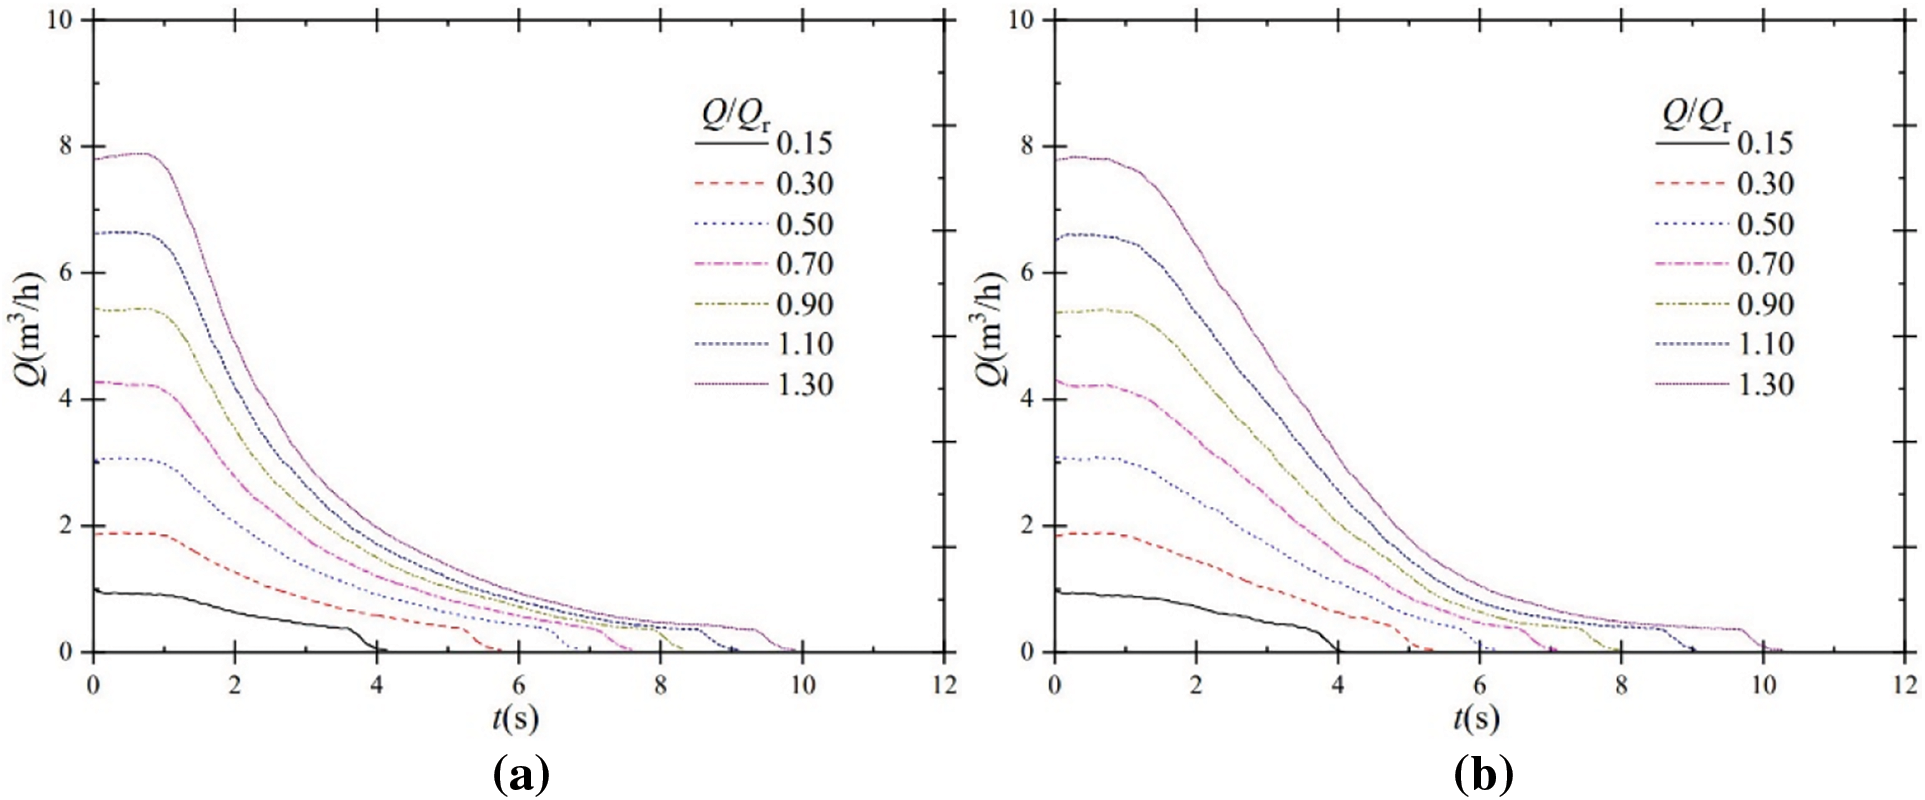
Figure 6: Flow rate characteristics during shutdown; (a) power frequency; (b) frequency conversion
The differences in the overall variation characteristics of the flow rate curves for power frequency and frequency conversion inputs are insignificant. There are four stages of flow rate curve variation at high flow ratios. The flow rate remains relatively stable in the early shutdown stage due to the inertia of the flow rate and does not drop rapidly; after some time, the flow rate drops rapidly; after another period, the flow rate drops slowly; finally, the flow rate drops rapidly again and drops to a zero value. For power frequency input, Q/Qr = 1.30, the flow rate is relatively stable from t = 0 s to t = 0.733 s, with slight fluctuations due to measurement error or test chance; the flow rate at t = 0.733 s is about 7.891 m3/h, while the flow rate at t = 4.000 s is about 1.968 m3/h, with a difference of 5.923 m3/h, and the change in flow rate during this period shows a rapidly decreasing trend; the flow rate at t = 9.335 s is about 0.352 m3/h, compared with the flow rate at t = 4.000 s, the difference is 1.616 m3/h, the flow rate decreases slowly during this period; at t = 9.906 s, the flow rate value is zero, the pump reaches complete shutdown, the flow rate curve shows a fast decreasing trend in the final shutdown period.
On the other hand, at low flow ratios, there are only three stages in which the flow rate curve changes: the flow rate remains stable, then drops slowly, and finally drops rapidly to a zero value. For frequency conversion input, Q/Qr = 0.15, the flow rate is about 0.900 m3/h consistently from t = 0 s to t = 1.439 s, remaining relatively stable and the same as the variation at high flow ratios; the flow rate at t = 3.702 s is about 0.729 m3/h, with a difference of 0.171 m3/h compared to the flow rate at t = 1.439 s, the flow rate at this stage differs from the high flow rate and shows a slow decline at this stage; finally, at the post-shutdown stage, the flow rate drops rapidly and reaches zero at t = 4.109 s. However, it is found that, regardless of the flow rate, the stable flow rate is maintained for a longer time, and the flow rate decreases slower under frequency conversion shutdown. The reason is that, during frequency conversion shutdown, although the motor speed drops, it still rotates independently and drives the impeller to rotate, which can maintain a stable flow rate for a longer time, and the rate of flow rate drop is also affected by the speed of the motor controlled by the frequency converter. Howover, during power frequency shutdown, the flow rate is only subject to flow inertia and maintains stability for a short time, the impeller rotation does not have the power source of the motor, so the flow rate decreases faster.
For steady-state flow ratios of Q/Qr = 0.15, 0.30, 0.50, 0.70, 0.90, 1.10, and 1.30 under power frequency shutdown, the corresponding flow-to-zero time is 4.140, 5.750, 6.890, 7.578, 8.343, 9.125 and 9.906 s, respectively. However, for steady-state flow ratios of Q/Qr = 0.15, 0.30, 0.50, 0.70, 0.90, 1.10, and 1.30 under frequency conversion shutdown, the corresponding flow-to-zero time is 4.109, 5.359, 6.234, 7.094, 7.984, 9.046, and 10.281 s, respectively. Except for the maximum flow rate Q/Qr = 1.30, the time required for the flow to stop is slightly shorter for frequency conversion input than for power frequency input.
Fig. 7 shows the head of the experimental pump under shutdown for power frequency and frequency conversion inputs.
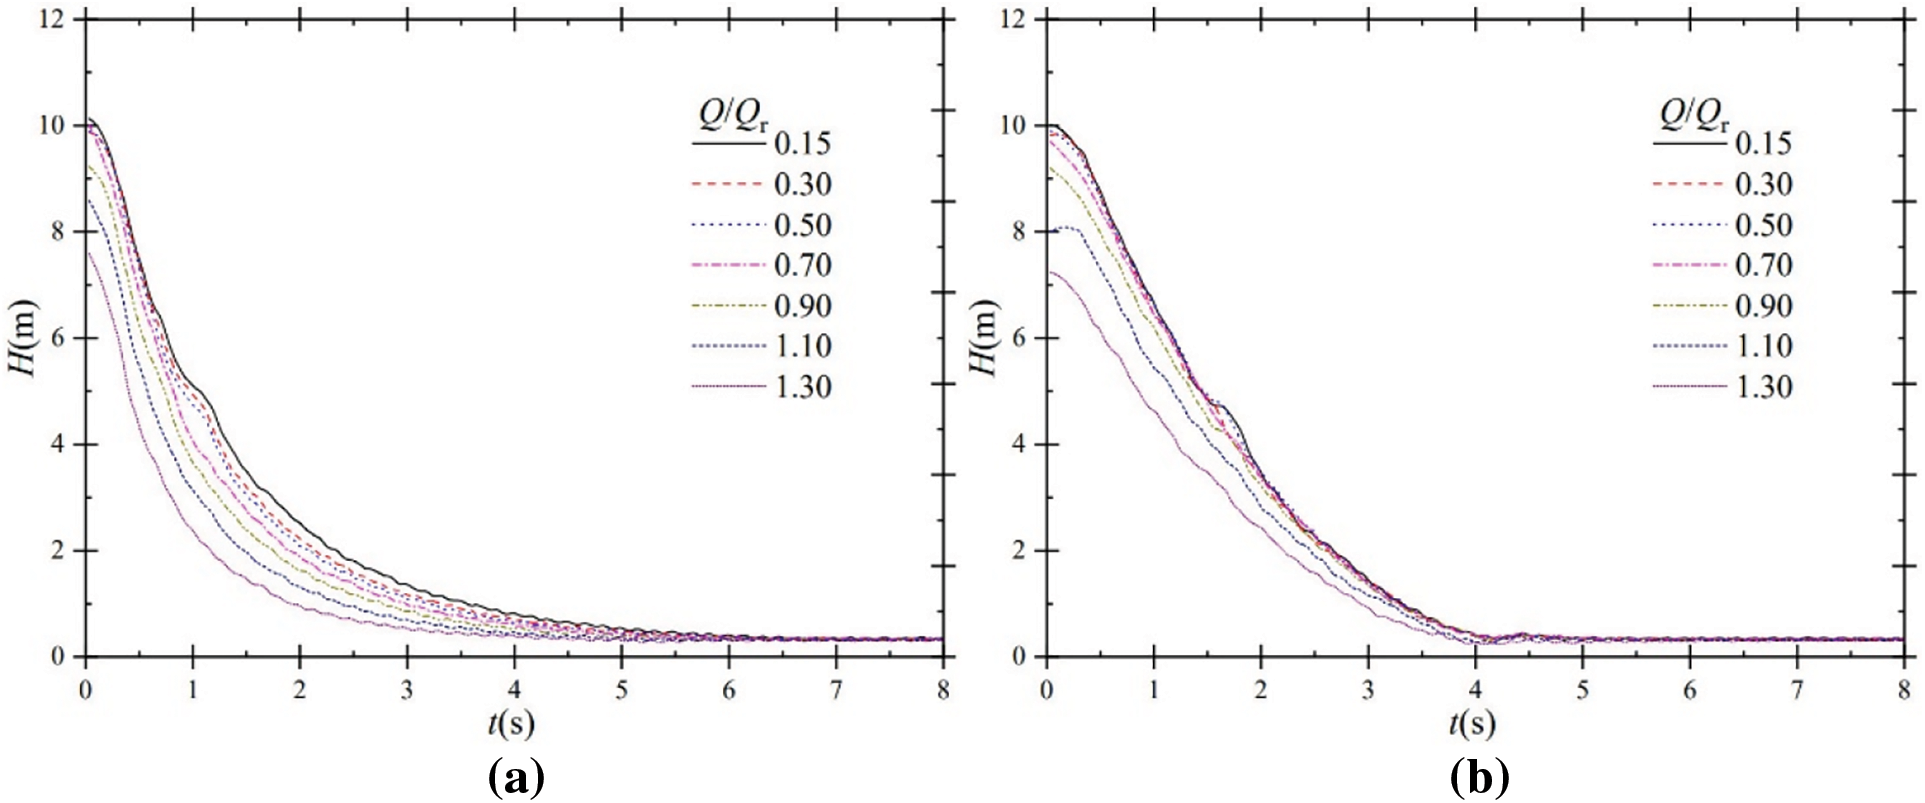
Figure 7: Head characteristics during shutdown; (a) power frequency; (b) frequency conversion
Under power frequency shutdown, the head curves all show a rapid decline and then a slow decline to a stable value for seven different flow ratio scenarios, with the overall variation characteristics broadly consistent with the outlet static pressure curve under the same conditions. By comparing the head curves with the outlet static pressure curves for frequency conversion input, the variation characteristics are also basically the same.
It is also found that the head curves drop to a stable value of around 0.37 m at t = 6.5 s in all seven cases when the power frequency input is applied. The head of 0.37 m is due to the position of the inlet and outlet pressure sensors installed in the experiment. The head curves for frequency conversion input also reach a stable value of 0.37 m at approximately t = 5.0 s. Moreover, it is found that the head and outlet static pressure curves tend to stabilize almost simultaneously for the same input conditions.
For this centrifugal pump, by the impeller work, the outlet static pressure is much higher than the inlet static pressure, and the absolute value of the inlet static pressure is generally tiny, resulting in the head change characteristics being mainly determined by the outlet static pressure change characteristics, so the same conditions of the head and outlet static pressure change characteristics are the same.
Fig. 8 shows the shaft power of the experimental pump under shutdown for power frequency and frequency conversion inputs. A torque-speed sensor is installed between the experimental pump and the motor. The transient shaft power is calculated from the transient torque and speed obtained from the experiment.
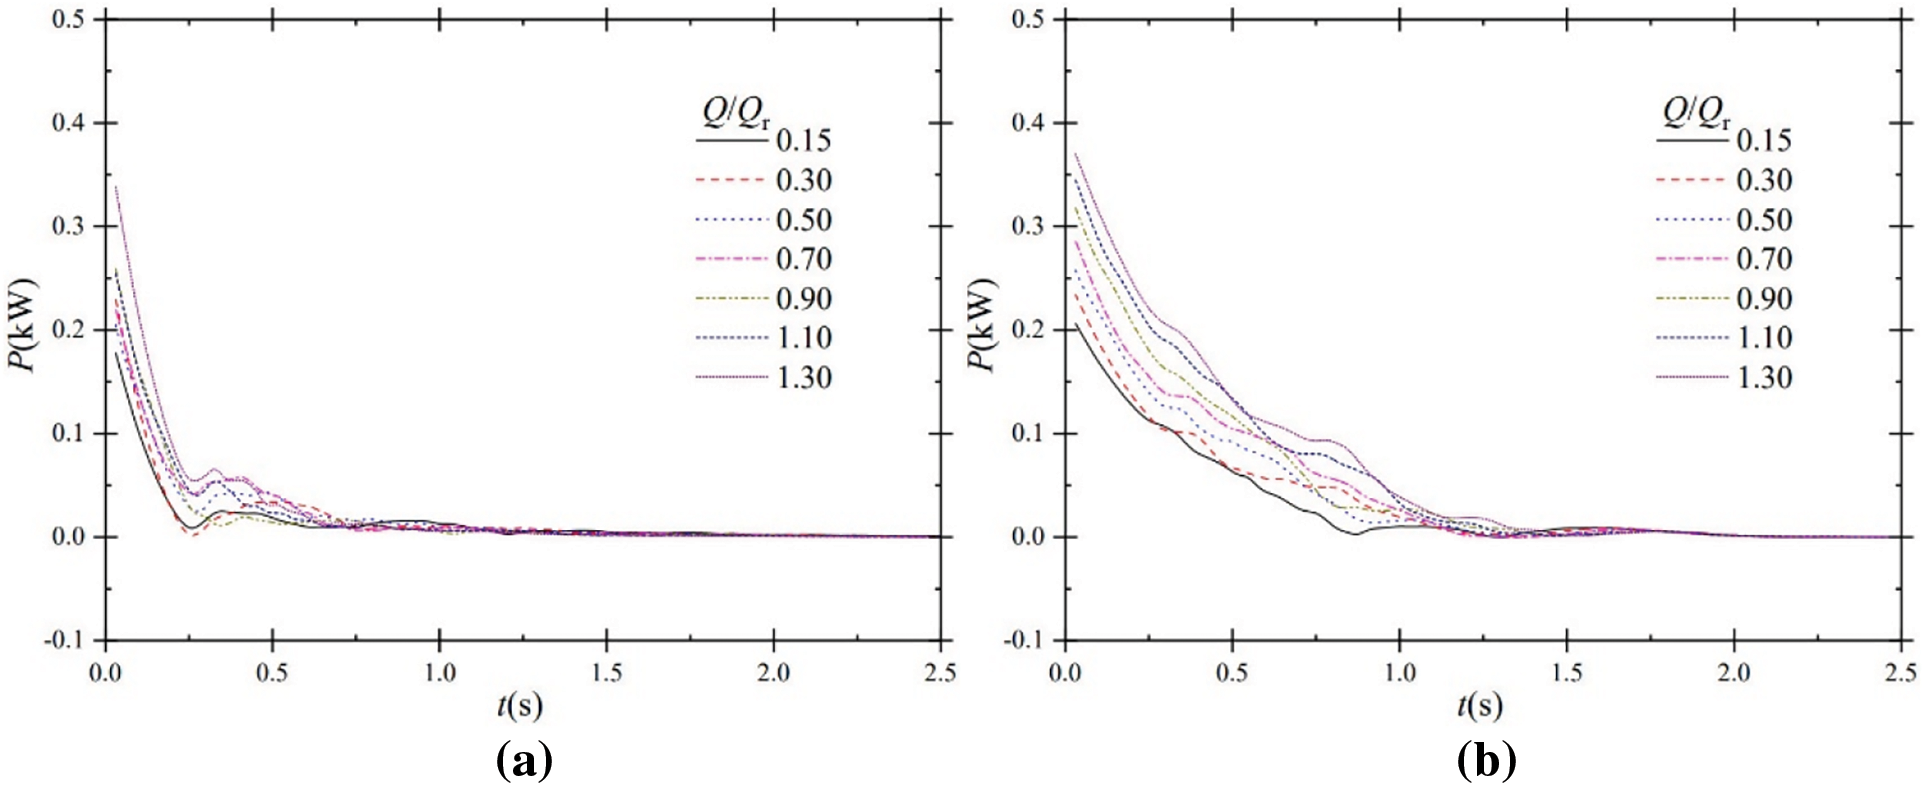
Figure 8: Shaft power characteristics during shutdown; (a) power frequency; (b) frequency conversion
For power frequency input, the shaft power drops rapidly at the moment of power failure, then fluctuates sharply and stabilizes. The power frequency shutdown is a power failure shutdown, so the shaft power drops rapidly after the shutdown. As seen for power frequency input, at a steady-state flow ratio of Q/Qr = 0.15, the shaft power curve drops nearly vertically when the power failure first occurs. The shaft power drops from 0.2357 to 0.0177 kW in just 0.11 s, a drop of 0.2180 kW. As can be seen, shaft power is more sensitive to the response to power failure than other performance parameters and is more severely affected by power failure.
For frequency conversion input, the shaft power shows a fluctuating decrease to a steady state value, and the curve decreases more slowly. For a steady state flow ratio of Q/Qr = 0.15, the shaft power decreases from 0.2083 kW, fluctuating to 0.0087 kW from t = 0 s to t = 0.78 s, a decrease of 0.1996 kW. Compared to power frequency input, the shaft power decreases more slowly for frequency conversion input and is slightly less affected by the pump shutdown. Compared to the power frequency input, the motor keeps rotating autonomously even though its speed decreases during the shutdown period, so the shaft power decreases significantly slower for frequency conversion input.
3.6 Parameter Decay Characteristic Time
The parameter decay characteristic time is the time elapsed when a parameter drops to 37% of its initial value. During the shutdown, performance parameters such as flow rate, head, shaft power, speed, and torque change dramatically with differences in the variation characteristics. By comparing the characteristic decay time under power frequency and frequency conversion shutdown, it is more intuitive to reflect the response sensitivity of each performance parameter to shutdown and the degree of hydraulic impact of the input power during shutdown.
The characteristic time t for flow rate Q, head H, shaft power P, speed n, and torque M with steady-state flow ratio Q/Qr under power frequency and frequency conversion shutdown is shown in Fig. 9.
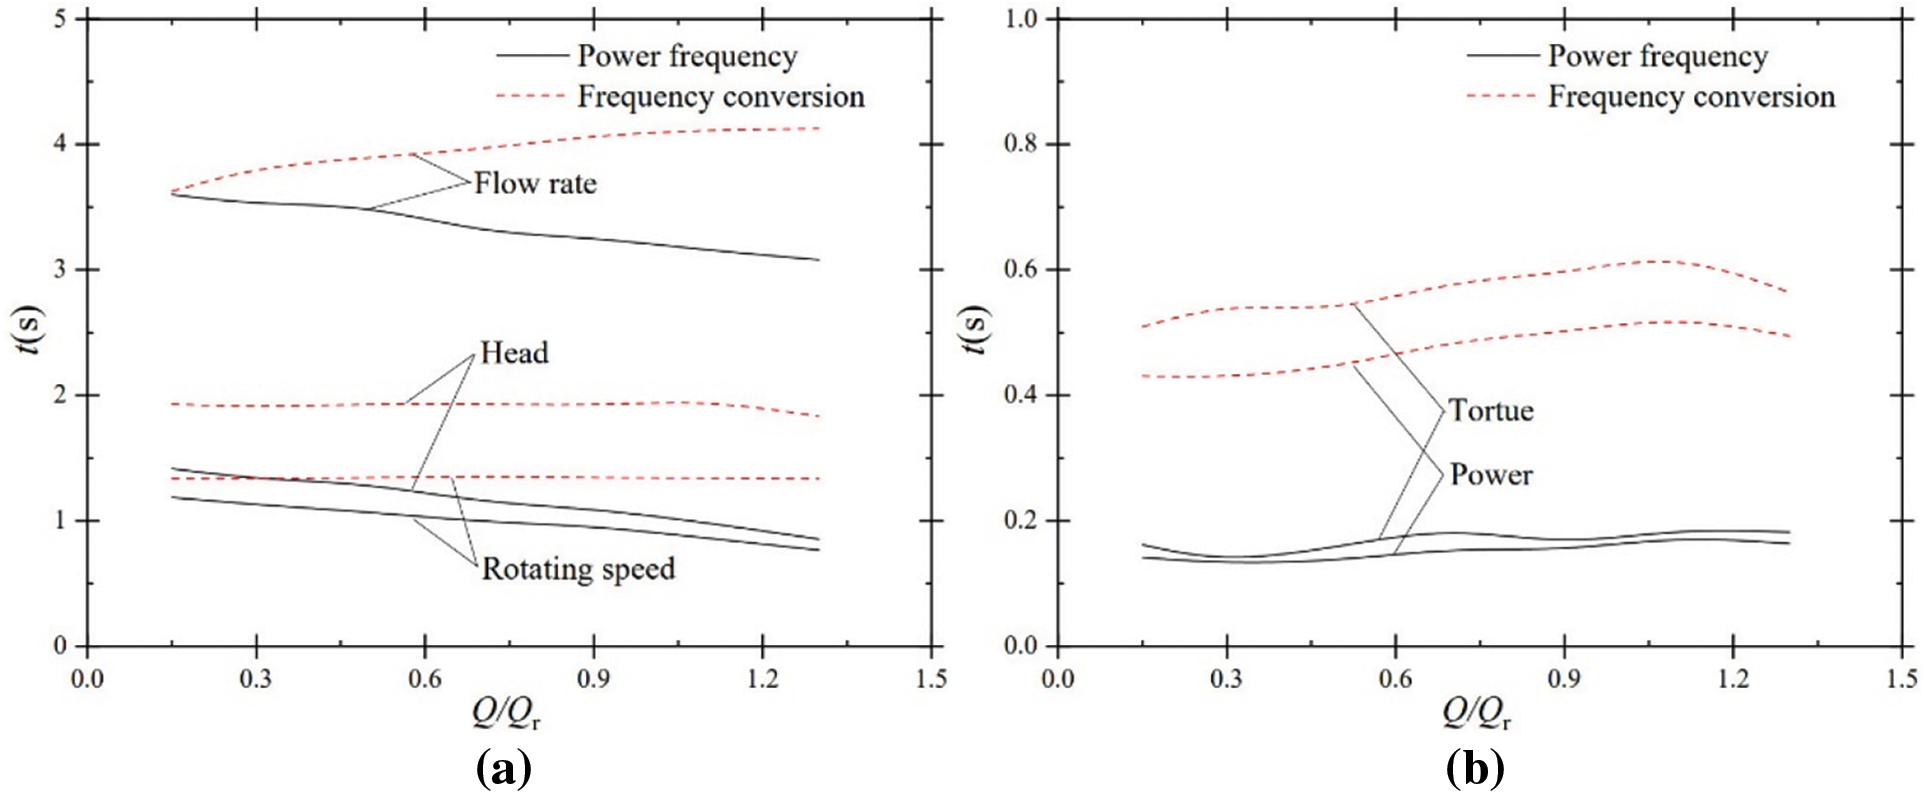
Figure 9: Parameter decay characteristic time at different steady-state flow ratios; (a) flow rate, head, rotating speed; (b) power and torque
Whether power frequency or frequency conversion input, the characteristic times in order from largest to smallest are flow rate, head, speed, torque, and shaft power for the same flow ratio condition. For example, at Q/Qr = 0.90, the characteristic time for flow, head, speed, torque, and shaft power is 3.259, 1.097, 0.960, 0.160, and 0.152 s for power frequency input and 4.073, 1.917, 1.343, 0.593 and 0.500 s respectively for frequency conversion input. It can be seen that the characteristic time of the flow rate is much greater than that of the other performance parameters, which is validated by the fact that the flow rate is subject to inertia and remains relatively constant at the beginning of the shutdown, as described above. In addition, shaft power has the shortest characteristic time, i.e., shaft power is more sensitive to the response of pump shutdown. In other words, the parameters affected during pump shutdown are shaft power, torque, speed, head, and flow rate in descending order of gravity.
It is also found that the parameter decay characteristic time is larger for frequency conversion input than power frequency input for the same flow ratio conditions. For frequency conversion input, the shutdown is not a power failure shutdown, the motor is still rotating to provide energy for the rotation of the impeller, so the parameters under frequency conversion shutdown decay relatively slowly. For example, at Q/Qr = 1.30, the characteristic time for flow rate, head, speed, torque, and shaft power is 3.081, 0.854, 0.767, 0.182 and 0.164 s for power frequency input, and 4.126, 1.832, 1.334, 0.564 and 0.495 s for frequency conversion input. At this flow ratio, the characteristic times for each parameter for frequency conversion input are larger than for power frequency input, with differences of 1.045, 0.978, 0.567, 0.382, and 0.331 s, respectively. It indicates that the performance parameters for frequency conversion input respond relatively slowly to pump shutdown and that the performance fluctuations are relatively gentle. Therefore, where it is necessary to operate as safely as possible, the frequency conversion input should be selected wherever possible.
3.7 Quasi-Steady-State Performance
According to the pump similarity law, it follows that
Comparisons of the quasi-steady state theoretical head-flow curves and the experimental head-flow curves are shown in Fig. 10. The quasi-steady state theoretical head-flow curves are calculated according to the pump similarity law. The experimental head-flow curves are given based on the steady experimental values before shutdown.
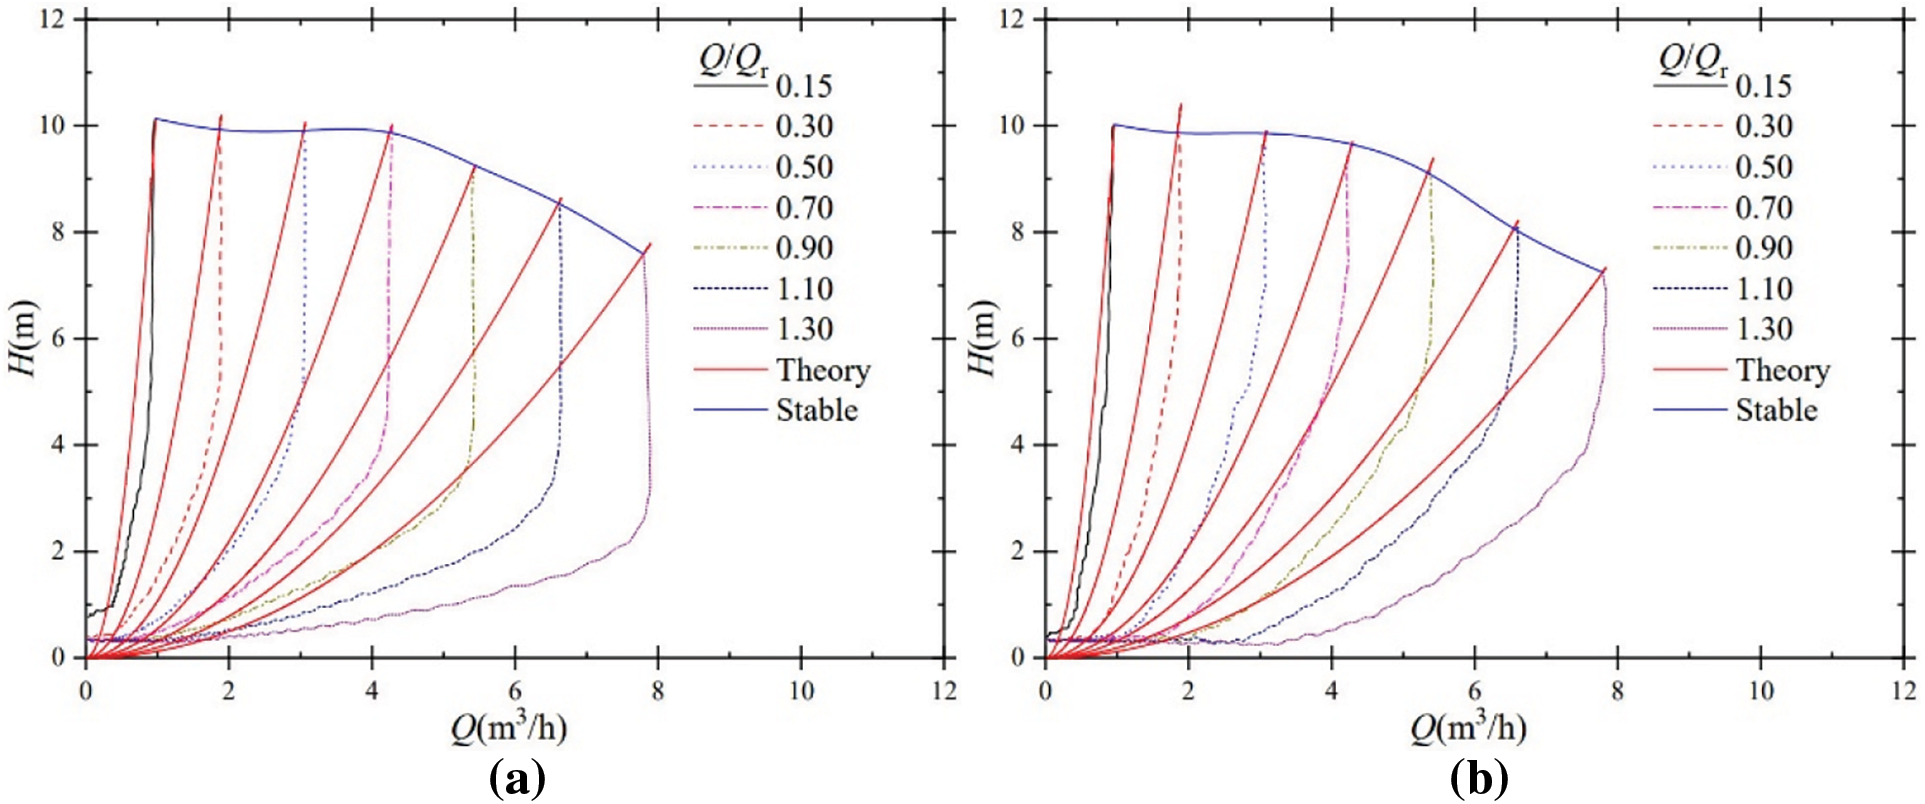
Figure 10: Head-flow curves at different steady-state flow ratios; (a) power frequency; (b) frequency conversion
For power frequency input, the difference between the quasi-steady-state theoretical head-flow curve and the experimental head-flow curve is slight for steady-state flow ratios Q/Qr = 0.15 and Q/Qr = 0.30, and the two curves are closer. However, as the flow ratio increases, the difference between the curves becomes greater. As seen for power frequency input, the quasi-steady-state theoretical head-flow curve at Q/Qr = 0.15 is close to coinciding with the experimental head-flow curve with little difference. In contrast, the curves at Q/Qr = 1.30 have a “diagonal D”-shaped distribution with significant differences. As a result, the pump similarity law can be used to predict transient hydraulic performance at low flow rates but not at moderate to high flow rates.
It is also found that the range of flow ratios is wider for the smaller difference between the two curves for frequency conversion input. As seen for frequency conversion input, the quasi-steady-state theoretical head-flow curves at Q/Qr = 0.15, Q/Qr = 0.30, and Q/Qr = 0.50 have slight differences and good agreement with the experimental head-flow curves. In contrast, only the two curves at Q/Qr = 0.15 and Q/Qr = 0.30 are in better agreement for power frequency input. For frequency conversion input, a wider range of flow ratios can be considered for predicting hydraulic performance using the similarity law.
In addition, the difference between the two curves at each flow ratio is smaller for frequency conversion input than for power frequency input. Under the condition of Q/Qr = 0.15, with a head of 6 m, the experimental flow rate of 0.9216 m3/h under power frequency shutdown and the theoretically calculated flow rate of 0.7514 m3/h, with a difference of 0.1702 m3/h; the experimental flow rate of 0.8727 m3/h under frequency conversion shutdown and the theoretically calculated flow rate of 0.7447 m3/h, with a difference of 0.1280 m3/h. The difference between the two curves is smaller in the low flow rate range for frequency conversion input, and the similarity law is more accurate in predicting the hydraulic performance for frequency conversion input.
In this paper, an experimental study was carried out on centrifugal pump shutdown in power frequency and frequency conversion inputs, and the external characteristics of centrifugal pump were obtained in the two shutdown modes. Through comparison and analysis, the similarities and differences between the two different shutdown methods are known, which provides a reference for the actual engineering application and expects to achieve the expected shutdown purpose by controlling the rotational speed. The results are found:
(1) For the frequency conversion input, the speed curves almost coincide without significant differences, and the impeller stops almost simultaneously and more quickly than the power frequency input.
(2) During the early stage of frequency conversion shutdown, the stable flow rate is maintained for a longer time, and the flow rate decreases slowly. In the low to moderate flow rate, the flow stopping time is shorter for frequency conversion input than for power frequency input.
(3) For frequency conversion input, the head curve is smoother; the head falls more slowly and reaches a stable value more quickly.
(4) For frequency conversion input, the performance parameters of the centrifugal pump take longer to decay, and each parameter responds more slowly to pump shutdown.
(5) The similarity law is more accurate in predicting hydraulic performance for frequency conversion input and low flow rate.
Acknowledgement: None.
Funding Statement: The research was financially supported by the “Pioneer” and “Leading Goose” R&D Program of Zhejiang (Grant No. 2022C03170) and Science and Technology Project of Quzhou (Grant No. 2022K98) and Hunan Province Key Field R&D Plan Project (Grant No. 2022GK2068).
Author Contributions: Study conception and design: Xiao Sun, Yuliang Zhang; data collection: Jiangbo Tong; analysis and interpretation of results: Haibing Cai, Wen Zhou; draft manuscript preparation: Xiaoqi Jia, Litao Ou. All authors reviewed the results and approved the final version of the manuscript.
Availability of Data and Materials: The data used to support the findings of this study are available from the corresponding author upon request.
Conflicts of Interest: The authors declare that they have no conflicts of interest to report regarding the present study.
References
1. Tiwari, R., Bordoloi, D. J., Dewangan, A. (2021). Blockage and cavitation detection in centrifugal pumps from dynamic pressure signal using deep learning algorithm. Measurement, 173, 108676. [Google Scholar]
2. Perissinotto, R. M., Verde, W. M., Biazussi, J. L., Bulgarelli, N. A. V., Fonseca, W. D. P. et al. (2021). Flow visualization in centrifugal pumps: A review of methods and experimental studies. Journal of Petroleum Science and Engineering, 203, 108582. [Google Scholar]
3. Tsukamoto, H., Matsunaga, S., Yoneda, H., Hata, S. (1986). Transient characteristics of a centrifugal pump during stopping period. Journal of Fluids Engineering, 108(4), 392–399. [Google Scholar]
4. Zhang, Y. L., Ji, Y. Y., Zhao, Y. J. (2022). Deep analysis of the transient behavior of centrifugal pumps during startup and shutdown. Measurement and Control, 55(3–4), 155–163. [Google Scholar]
5. Liu, J., Li, Z., Wang, L., Jiao, L. (2011). Numerical simulation of the transient flow in a radial flow pump during stopping period. Journal of Fluids Engineering, 133(11), 111101. [Google Scholar]
6. Shourkaei, H. A. (2015). Transient performance during stopping the research reactor primary loop pump. Kerntechnik, 80(1), 40–44. [Google Scholar]
7. Liu, Y., Zhou, J., Zhou, D. (2017). Transient flow analysis in axial-flow pump system during stoppage. Advances in Mechanical Engineering, 9(9), 1–8. [Google Scholar]
8. Kan, K., Zheng, Y., Chen, H. X., Zhou, D. Q., Dai, J. et al. (2020). Numerical simulation of transient flow in a shaft extension tubular pump unit during runaway process caused by power failure. Renewable Energy, 154, 1153–1164. [Google Scholar]
9. Zhang, Y. L., Zhu, Z. C., Li, W. G., Jia, X. Q. (2019). Non-inertial stopping characteristics of a prototype pump. Advances in Mechanical Engineering, 11(4), 1–15. [Google Scholar]
10. Zhang, Y. L., Zhu, Z. C., Li, W. G., Xiao, J. J. (2018). Effects of viscosity on transient behavior of a low specific speed centrifugal pump in starting and stopping periods. International Journal of Fluid Mechanics Research, 45(1), 1–20. [Google Scholar]
11. Feng, J. J., Ge, Z. G., Zhang, Y., Zhu, G. J., Wu, G. K. et al. (2021). Numerical investigation on characteristics of transient process in centrifugal pumps during power failure. Renewable Energy, 170, 267–276. [Google Scholar]
12. Tanaka, T., Tsukamoto, H. (1999). Transient behavior of a cavitating centrifugal pump at rapid change in operating conditions—Part 2: Transient phenomena at pump startup/shutdown. Journal of Fluids Engineering, 121, 850–856. [Google Scholar]
13. Cao, Y. P., Dou, Y. H., Huang, Y. X., Cheng, J. R. (2019). Study on vibration characteristics of fracturing piping in pump-starting and pump-stopping water hammer. Journal of Failure Analysis and Prevention, 19, 1093–1104. [Google Scholar]
14. Rohani, M., Afshar, M. H. (2010). Simulation of transient flow caused by pump failure: Point-implicit method of characteristics. Annals of Nuclear Energy, 37(12), 1742–1750. [Google Scholar]
15. Lefebvre, P. J., Barker, W. P. (1995). Centrifugal pump performance during transient operation. Journal of Fluids Engineering, 117(1), 123–128. [Google Scholar]
16. Thanapandi, P., Prasad, R. (1995). Centrifugal pump transient characteristics and analysis using the method of characteristics. International Journal of Mechanical Sciences, 37(1), 77–89. [Google Scholar]
17. Kittredge, C. P. (1956). Hydraulic transients in centrifugal pump systems. Transactions of the American Society of Mechanical Engineers, 78(6), 1307–1320. [Google Scholar]
18. Wu, P., Wu, D. Z., Huang, B., Wang, L. Q. (2010). Experimental study on the running down process of a centrifugal pump. Advances in Mechanical Engineering, 31, 21–24. [Google Scholar]
19. Grover, R. B., Koranne, S. M. (1981). Analysis of pump start-up transients. Nuclear Engineering and Design, 67(1), 137–141. [Google Scholar]
20. Fu, S. F., Zheng, Y., Kan, K., Chen, H. X., Han, X. X. et al. (2020). Numerical simulation and experimental study of transient characteristics in an axial flow pump during startup. Renewable Energy, 146, 1879–1887. [Google Scholar]
21. Matteo, L., Mauger, G., Dazin, A., Tauveron, N. (2019). Simulation of a radial pump fast startup and analysis of the loop response using a transient 1D mean stream line based model. International Journal of Turbomachinery, Propulsion and Power, 4(4), 38. [Google Scholar]
22. Shafiey Dehaj, M., Mollaee, M. A., Haghighi, B. (2020). Simulation of transient two phase flow in the centrifugal pump during start up time and evaluation of effective parameters on the performance of the pump. Aerospace Knowledge and Technology Journal, 9(2), 77–87. [Google Scholar]
23. Zhang, Y. L., Zhu, Z. C., Jin, Y. Z., Cui, B. L., Li, Y. et al. (2013). Experimental study on a centrifugal pump with an open impeller during startup period. Journal of Thermal Science, 22(1), 1–6. [Google Scholar]
Cite This Article
 Copyright © 2024 The Author(s). Published by Tech Science Press.
This work is licensed under a Creative Commons Attribution 4.0 International License , which permits unrestricted use, distribution, and reproduction in any medium, provided the original work is properly cited.
 Downloads
 Citation Tools