
 Submit a Paper
 Propose a Special lssue
 Open Access
ARTICLE

Numerical Simulation of Flow and Temperature Distribution in a Bottom-Blown Copper Bath
1 State Key Laboratory of Complex Nonferrous Metal Resources Clean Utilization, Kunming University of Science and Technology, Kunming, 650093, China
2 Faculty of Metallurgical and Energy Engineering, Kunming University of Science and Technology, Kunming, 650093, China
3 Yimen COPPER Corp. Ltd, Yuxi, 651100, China
4 Daye Nonferrous Metallurgical Ltd., Huangshi, 435000, China
* Corresponding Author: Xiaohui Zhang. Email:
Fluid Dynamics & Materials Processing 2025, 21(1), 121-140. https://doi.org/10.32604/fdmp.2025.058683
Received 18 September 2024; Accepted 20 December 2024; Issue published 24 January 2025
 View Full Text
 Download PDF
Abstract
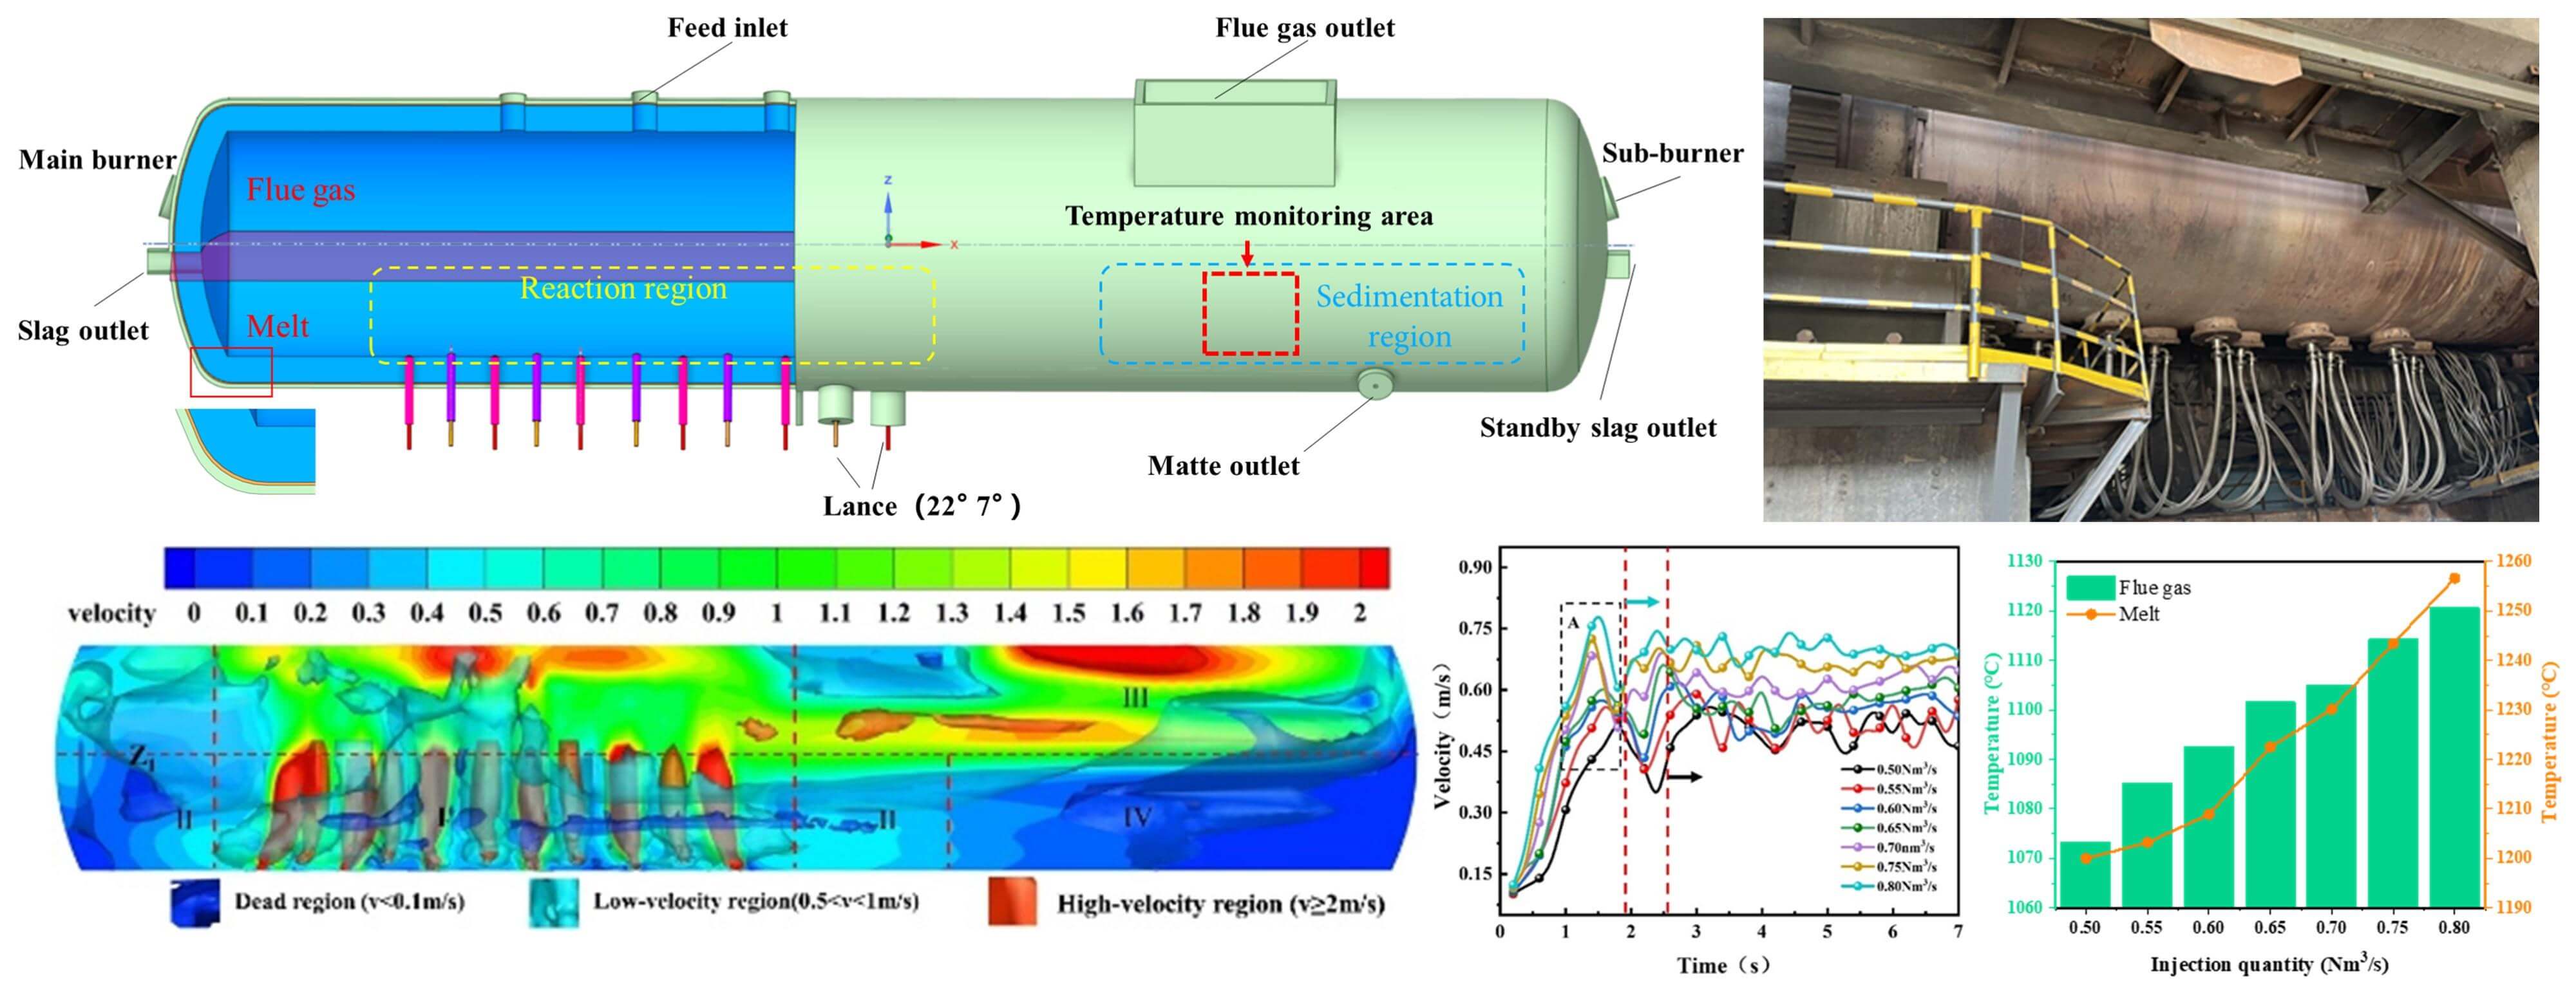
Smelting with oxygen bottom blowing is one of the main methods used in the frame of copper pyrometallurgy. With this approach, feed materials and oxygen-enriched air are introduced in reversed order to enhance multiphase flow within the furnace. Understanding the flow structure and temperature distribution in this setup is crucial for optimizing production. In this study, gas-liquid interactions, and temperature profiles under varying air-injection conditions are examined by means of numerical simulation for a 3.2 m × 20 m furnace. The results indicate that the high-velocity regions are essentially distributed near the lance within the reaction region and the flue gas outlet, while low-velocity regions are located close to the furnace walls on both side of the reaction region. Dead regions appear in the sedimentation region, with gas velocities surpassing those of the molten phase. As the injection rate increases from 0.50 to 0.80 Nm3/s, the stabilization time of the average liquid surface velocity decreases from 2.6 s to 1.9 s, exhibiting a similar trend to the gas holdup. During stabilization, the average liquid surface velocity rises from 0.505 to 0.702 m/s. The average turbulent kinetic energy (TKE) of the fluid in the molten bath increases from 0.095 to 0.162 m2/s2. The proportion of the area distribution with TKE greater than 0.10 m2/s2 and the gas holdup at steady state both rise with an increase in the injection quantity. The maximum splashing height of the melt grows from approximately 0.756 to 1.154 m, with the affected area expanding from 14.239 to 20.498 m2. Under different working conditions with varying injection quantities, the average temperature changes in melt zone and flue gas zone of the furnace are small. The temperature in the melt and in the flue-gas zone spans the interval 1200°C–1257°C, and 1073°C–1121°C, respectively. The temperature distribution of the melt and flue gas reveals a pattern characterized by elevated temperatures in the reaction zone, gradually transitioning to lower temperatures in the sedimentation region.Graphic Abstract
Keywords
Cite This Article
 Copyright © 2025 The Author(s). Published by Tech Science Press.
This work is licensed under a Creative Commons Attribution 4.0 International License , which permits unrestricted use, distribution, and reproduction in any medium, provided the original work is properly cited.
 Downloads
 Citation Tools