
 Submit a Paper
 Propose a Special lssue
 Open Access
ARTICLE

Numerical Simulation of Flow and Temperature Distribution in a Bottom-Blown Copper Bath
1 State Key Laboratory of Complex Nonferrous Metal Resources Clean Utilization, Kunming University of Science and Technology, Kunming, 650093, China
2 Faculty of Metallurgical and Energy Engineering, Kunming University of Science and Technology, Kunming, 650093, China
3 Yimen COPPER Corp. Ltd, Yuxi, 651100, China
4 Daye Nonferrous Metallurgical Ltd., Huangshi, 435000, China
* Corresponding Author: Xiaohui Zhang. Email:
Fluid Dynamics & Materials Processing 2025, 21(1), 121-140. https://doi.org/10.32604/fdmp.2025.058683
Received 18 September 2024; Accepted 20 December 2024; Issue published 24 January 2025
 View Full Text
 Download PDF
Abstract
Smelting with oxygen bottom blowing is one of the main methods used in the frame of copper pyrometallurgy. With this approach, feed materials and oxygen-enriched air are introduced in reversed order to enhance multiphase flow within the furnace. Understanding the flow structure and temperature distribution in this setup is crucial for optimizing production. In this study, gas-liquid interactions, and temperature profiles under varying air-injection conditions are examined by means of numerical simulation for a 3.2 m × 20 m furnace. The results indicate that the high-velocity regions are essentially distributed near the lance within the reaction region and the flue gas outlet, while low-velocity regions are located close to the furnace walls on both side of the reaction region. Dead regions appear in the sedimentation region, with gas velocities surpassing those of the molten phase. As the injection rate increases from 0.50 to 0.80 Nm3/s, the stabilization time of the average liquid surface velocity decreases from 2.6 s to 1.9 s, exhibiting a similar trend to the gas holdup. During stabilization, the average liquid surface velocity rises from 0.505 to 0.702 m/s. The average turbulent kinetic energy (TKE) of the fluid in the molten bath increases from 0.095 to 0.162 m2/s2. The proportion of the area distribution with TKE greater than 0.10 m2/s2 and the gas holdup at steady state both rise with an increase in the injection quantity. The maximum splashing height of the melt grows from approximately 0.756 to 1.154 m, with the affected area expanding from 14.239 to 20.498 m2. Under different working conditions with varying injection quantities, the average temperature changes in melt zone and flue gas zone of the furnace are small. The temperature in the melt and in the flue-gas zone spans the interval 1200°C–1257°C, and 1073°C–1121°C, respectively. The temperature distribution of the melt and flue gas reveals a pattern characterized by elevated temperatures in the reaction zone, gradually transitioning to lower temperatures in the sedimentation region.Graphic Abstract
Keywords
Oxygen-enriched bottom-blown bath smelting is a copper smelting technology independently developed by China. Because of its high smelting intensity, low energy consumption and ability to deal with complex copper resources, it has been highly recognized by all countries in the world [1–3]. This technology has a high oxygen utilization rate, which can significantly reduce fuel usage, while improving smelting yield and reducing energy consumption and raw material consumption per ton of product. During the smelting process, the charge enters from the upper part of the furnace, while oxygen-enriched air enters from the bottom of furnace, forming a gas-liquid-solid three-phase mixed reaction region in the melt region. The oxygen-enriched air acts as a stirring acceleration reaction in melt region. The flow state of the bath is directly related to material mixing, gas phase distribution within the melt, heat and mass transfer, oxygen utilization efficiency, and reaction rate.
Since the bottom-blown smelting process is an extremely complex multi-phase, multi-field, and multi-reaction system, much research focused on flow and heat transfer in the smelting process [1]. Regarding the flow situation in the furnace, many researchers used water experiments and numerical simulation to study the bottom-blown copper bath smelting process, investigating the mixing characteristics, fluctuation characteristics, and bubble behavior. The mixing characteristics of oxygen-rich air, copper matte, ore materials, and slag layers in the molten pool were investigated through water model experiments. Liu et al. [4] elaborated on the mechanism of bottom-blown copper smelting, conducting theoretical analysis, water model experiments, and sampling analysis verification on the gas injection behavior during the oxygen bottom-blown smelting process, the chemical reaction mechanism of matte smelting, and the thermal working state inside the smelting furnace. The oxygen bottom-blown gas flow can form a uniform diffusion zone in the melt, achieving melt stirring, and providing favorable kinetic conditions for the chemical reactions and heat and mass transfer within the furnace. Wang et al. [5] elaborated a test system for the bottom-blown oxygen converting and matte-making process in a converter and used the Particle Image Velocimetry (PIV) method. They investigated the effects of various factors, such as injection air velocity, lance angle, nozzle diameter, and different molten pool depths on the average bubble size and gas holdup. Shui et al. [6] utilized silicone oil and water to simulate the behavior of molten slag and copper matte, numerically simulated the mixing behavior of slag layer and matte layer, and proposed an empirical relationship between the mixing time in a bottom-blown furnace with gas flow rate and bath height. Shui et al. [7] also carried out a cold-state experiment on the bottom-blown copper smelting furnace to research the fluctuation characteristics and transmission behavior of the bath surface during the smelting process. Huang et al. [8] elaborated a water model by scaling down an actual industrial bottom-blowing furnace to a ratio of 1:10.3. They studied the mixing behavior and mixing time of two-phase flow of gas and liquid in the bottom-blown furnace during the lead reduction process using a combination of chemical decolorization technology and RGB-based image analysis. Utilizing numerical simulation methods, Wang et al. [9] elaborated a mechanistic model for the SKS process. The furnace section is divided into seven functional layers, and the hearth is divided into three functional zones along its length. The multiphase and multi-component mass transfer behaviors between different interfaces in the smelting furnace were analyzed. Schmidt et al. [10] simulated the variations in molten bath levels, polydispersity and the agglomeration of matte in industrial flash furnaces. Their research aimed to investigate the settlement mechanisms of matte, with the goal of reducing copper losses. Lu et al. [11] changed the ratio of gas flow rate to lance diameter, and proposed an asymmetric injection method. In addition, the molten pool efficiency was improved by changing the injection intensity between adjacent oxygen lances. Shao et al. [12] used a combination of numerical simulation and experiment to study the gas-liquid flow and mixing effect in the molten pool. The effects of different lance positions, lance numbers and injection quantity on gas-liquid flow, total gas volume and mixing efficiency were analyzed. Liu et al. [13] employed a numerical model that combines Large Eddy Simulation (LES) with the Volume of Fluid (VOF) model to investigate the motion characteristics of bubbles and the multi-scale feature of gas-liquid two-phase flow. Tan et al. [14] used a phase-field lattice Boltzmann (LB) method to simulate the gas-liquid mass transfer process and studied the influence of physical parameters on mass transfer in gas-liquid systems with density difference. Guo et al. [15] developed a simplified equivalent model for a large-scale oxygen bottom-blowing furnace to study the impact of the lance seat and the spacing between two lances on the flow characteristics of the molten bath. This research aimed to optimize the arrangement of the lances. Jiang et al. [16] set up nine different oxygen lance arrangements to study the melt mixing characteristics and evaluate the mixing effect of bath. Zhao et al. [17] evaluated the stirring effects within a bottom-blown copper molten bath based on a novel methodology that combines gas and liquid flow characteristics and mixing homogeneity. They investigated the impact of three types of lance blowing—straight tube, multi-channel, and swirling flow—on the stirring characteristics within the molten bath. Hu et al. [18] employed the VOF method to numerically simulate the side-blown gas-liquid reactor and studied the bubble dynamics, gas-liquid flow characteristics and multi-scale coupling mechanism of the side-blown gas-liquid reactor. Lai et al. [19] studied the influence of gas flow rate, liquid height, and fluid medium characteristics on bubble swarm dynamics, surface behavior, and flow field mixing characteristics in a bottom-blown reactor through coupled simulations using the VOF and LES models.
The heat transfer in the molten pool involves convection heat transfer, radiation heat transfer, chemical reaction heat between multiphase fluids, etc. Due to the high temperature inside the molten bath and the harsh testing conditions, most studies on heat transfer and temperature distribution in molten bath focus on numerical simulation and model experiments [20–22]. Jardón-Pérez et al. [23] utilized the PLIF technique to measure the temperature field of a bottom-blown ladle under non-isothermal conditions, and compared the results between PLIF method and the traditional thermocouple method. The comparison results show that the temperature field obtained by these two methods are in good agreement. Jardón-Pérez et al. [24] employed the PIV-PLIF technique to study the influence of changing the gas injection velocity, number of nozzles, and radial position on the temperature during the melt mixing process in ladle. Chen et al. [25] conducted an experiment on the enhanced heat transfer characteristics of bubble behavior in a bottom-blown process and elaborated a temperature-distributing model. They used chaos theory to study the strengthening mechanism of bubble swarm on bottom blowning stirring and mixing, and evaluated the relation between the maximal Lyapunov index and the heat exchanging coefficient. Loktionov et al. [26] analyzed the radial inhomogeneity of the melt layer temperature distribution and developed a new correlation of Nusselt number to predict the heat transfer of the side surface and the bottom surface of the melt layer heated at the bottom of the molten pool in a serious accident. Jiang et al. [27] carried out the flow-heat transfer numerical calculation of a 100 t converter and obtained the temperature change of the molten pool during the smelting process. They analyzed the variation of the temperature variation of the molten pool with time, and studied the effects of operating parameters and heat release rate in hot spot area on the heat transfer behavior of the molten pool. Chen et al. [28] elaborated a water model to investigate flow phenomena in a bottom-blown molten pool and conducted experimental research on heat transfer characteristics during bubble coalescence. The effects of flow rate, temperature difference and continuous phase height on the condensation heat transfer characteristics of bottom blowing bubbles were analyzed.
The aforementioned research has laid a theoretical foundation for further elucidating heat transfer and temperature distribution in high-temperature molten pool environments. However, research on the flow field-temperature field of bottom-blown furnaces in practical industrial production is limited, lacking practical guidance for optimizing industrial production. This paper focuses on the production process of an oxygen-enriched bottom-blown smelting furnace in a copper smelter. Based on actual injection quantity and operational parameters, a combination of field testing and numerical simulation is adopted to investigate the multiphase flow characteristics and temperature distribution in the melt region within the furnace. The velocity distribution, TKE distribution, maximum splash height of the melt, and variations in gas holdup over time within the flow field at different injection quantitys are analyzed, as well as the temperature distribution in different regions of the furnace under steady state. The physical model used in this research is a model of an oxygen-enriched bottom-blown copper smelting furnace at the actual production scale of the factory. It aims to explore the properties of gas-liquid flow and temperature field distribution within the smelting furnace under high-temperature conditions, providing a theoretical basis for subsequent collaborative research on matte grade, ore blending, and injection. This has significant implications for comprehensively understanding the actual industrial process of bottom-blown copper smelting furnaces.
2 Model Development and Validation
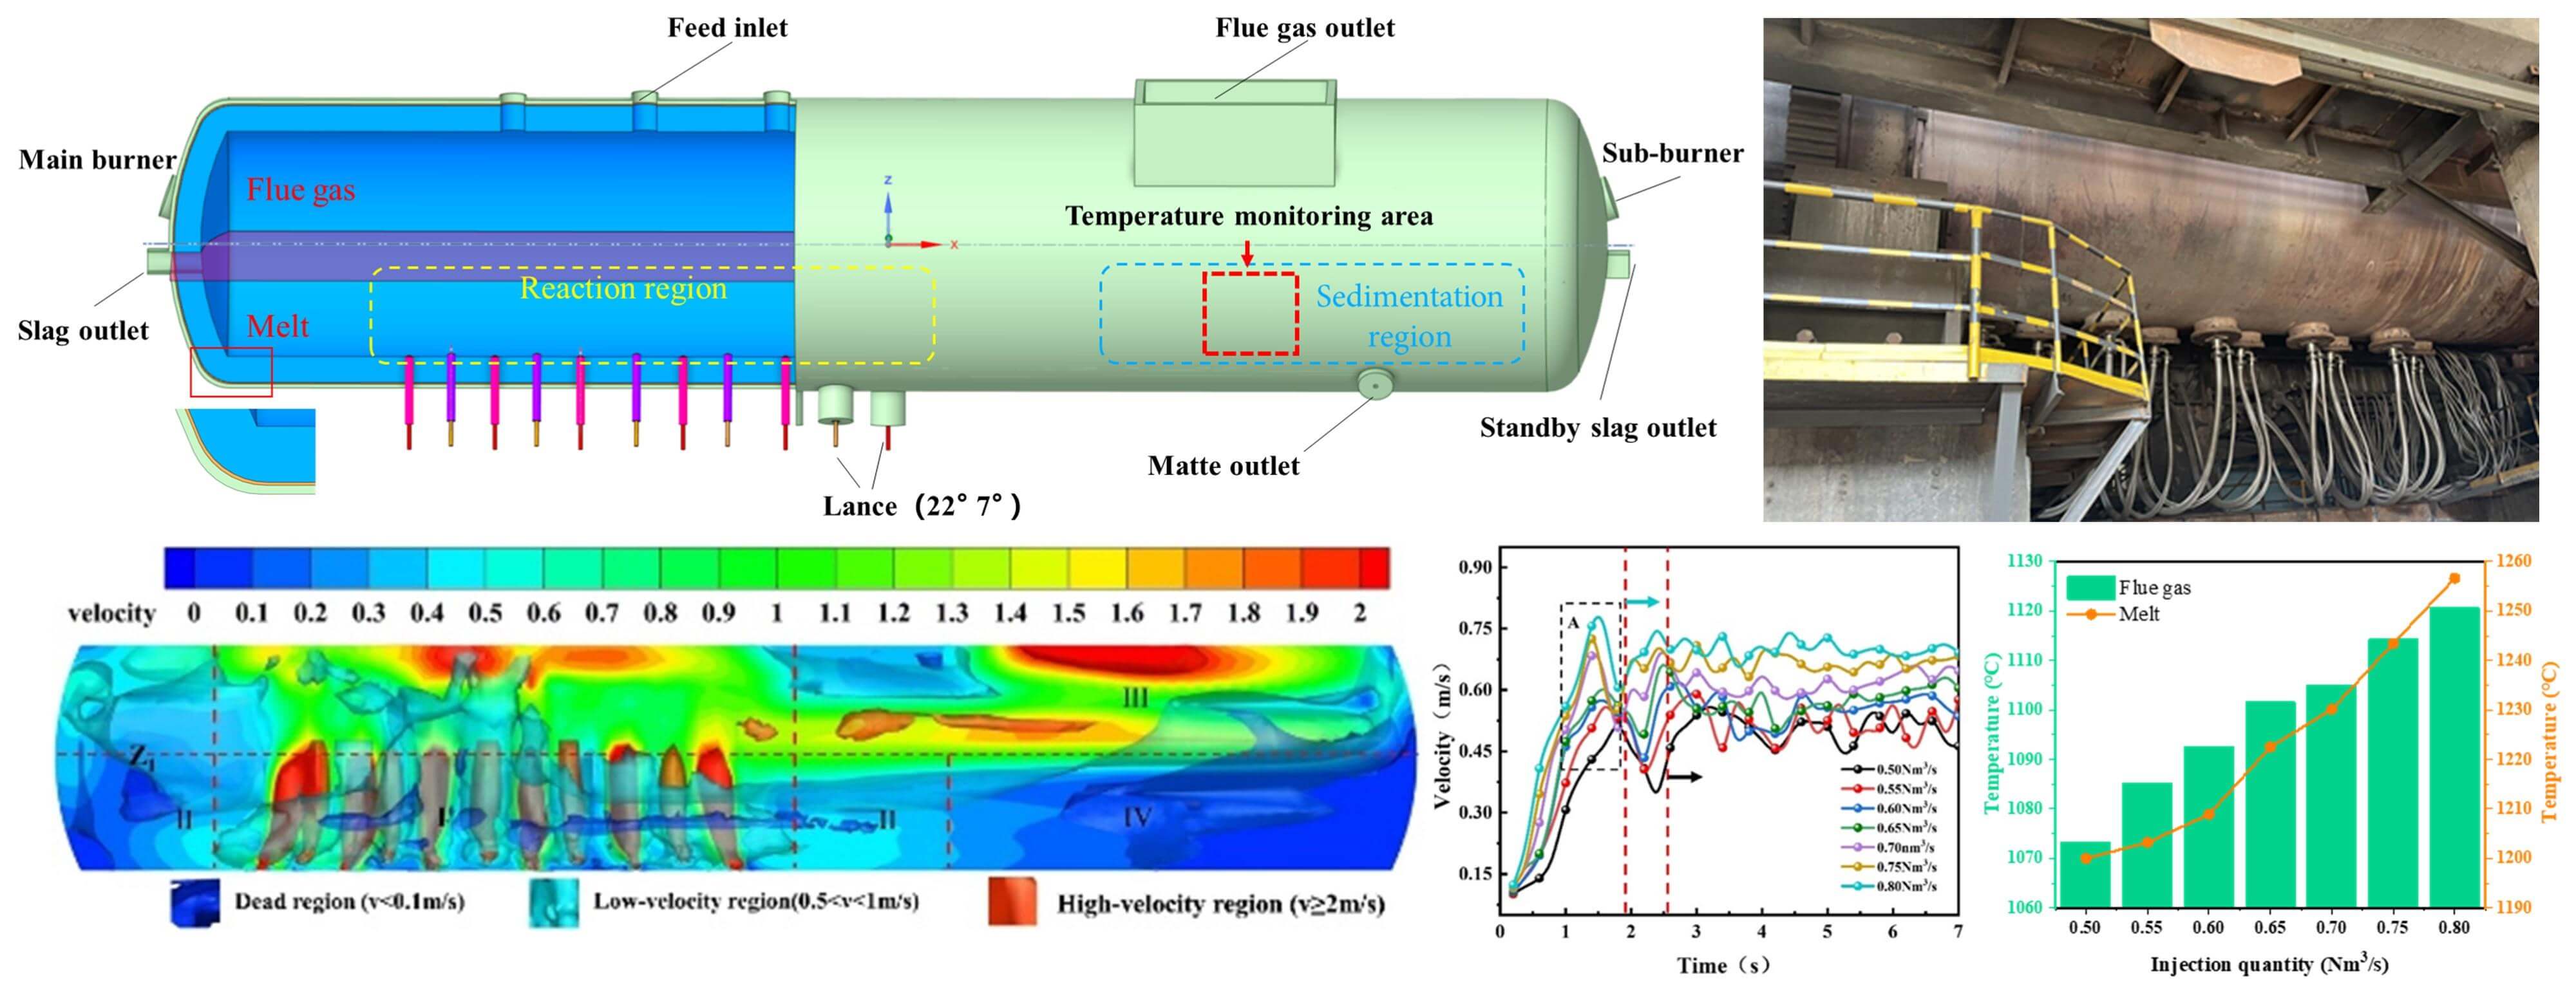
According to the actual structure and size of the bottom-blown smelting furnace in a copper smelting enterprise, a 1:1 smelting furnace model is elaborated, as shown in Fig. 1. The furnace body size is Φ 3.2 m × 20 m. Eleven oxygen lances with a diameter of 60 mm are set at the bottom, arranged side by side, and alternately arranged at angles of 7° and 22° with the axial centerline of the furnace body (Fig. 1b). Three feeding ports are set on the furnace roof above the oxygen lances, and the flue gas outlet is on the right side of the feeding ports. The melt height is set at 1.5 m, and the plane where Z1 = −0.10 m in Fig. 1c is the melt liquid level.
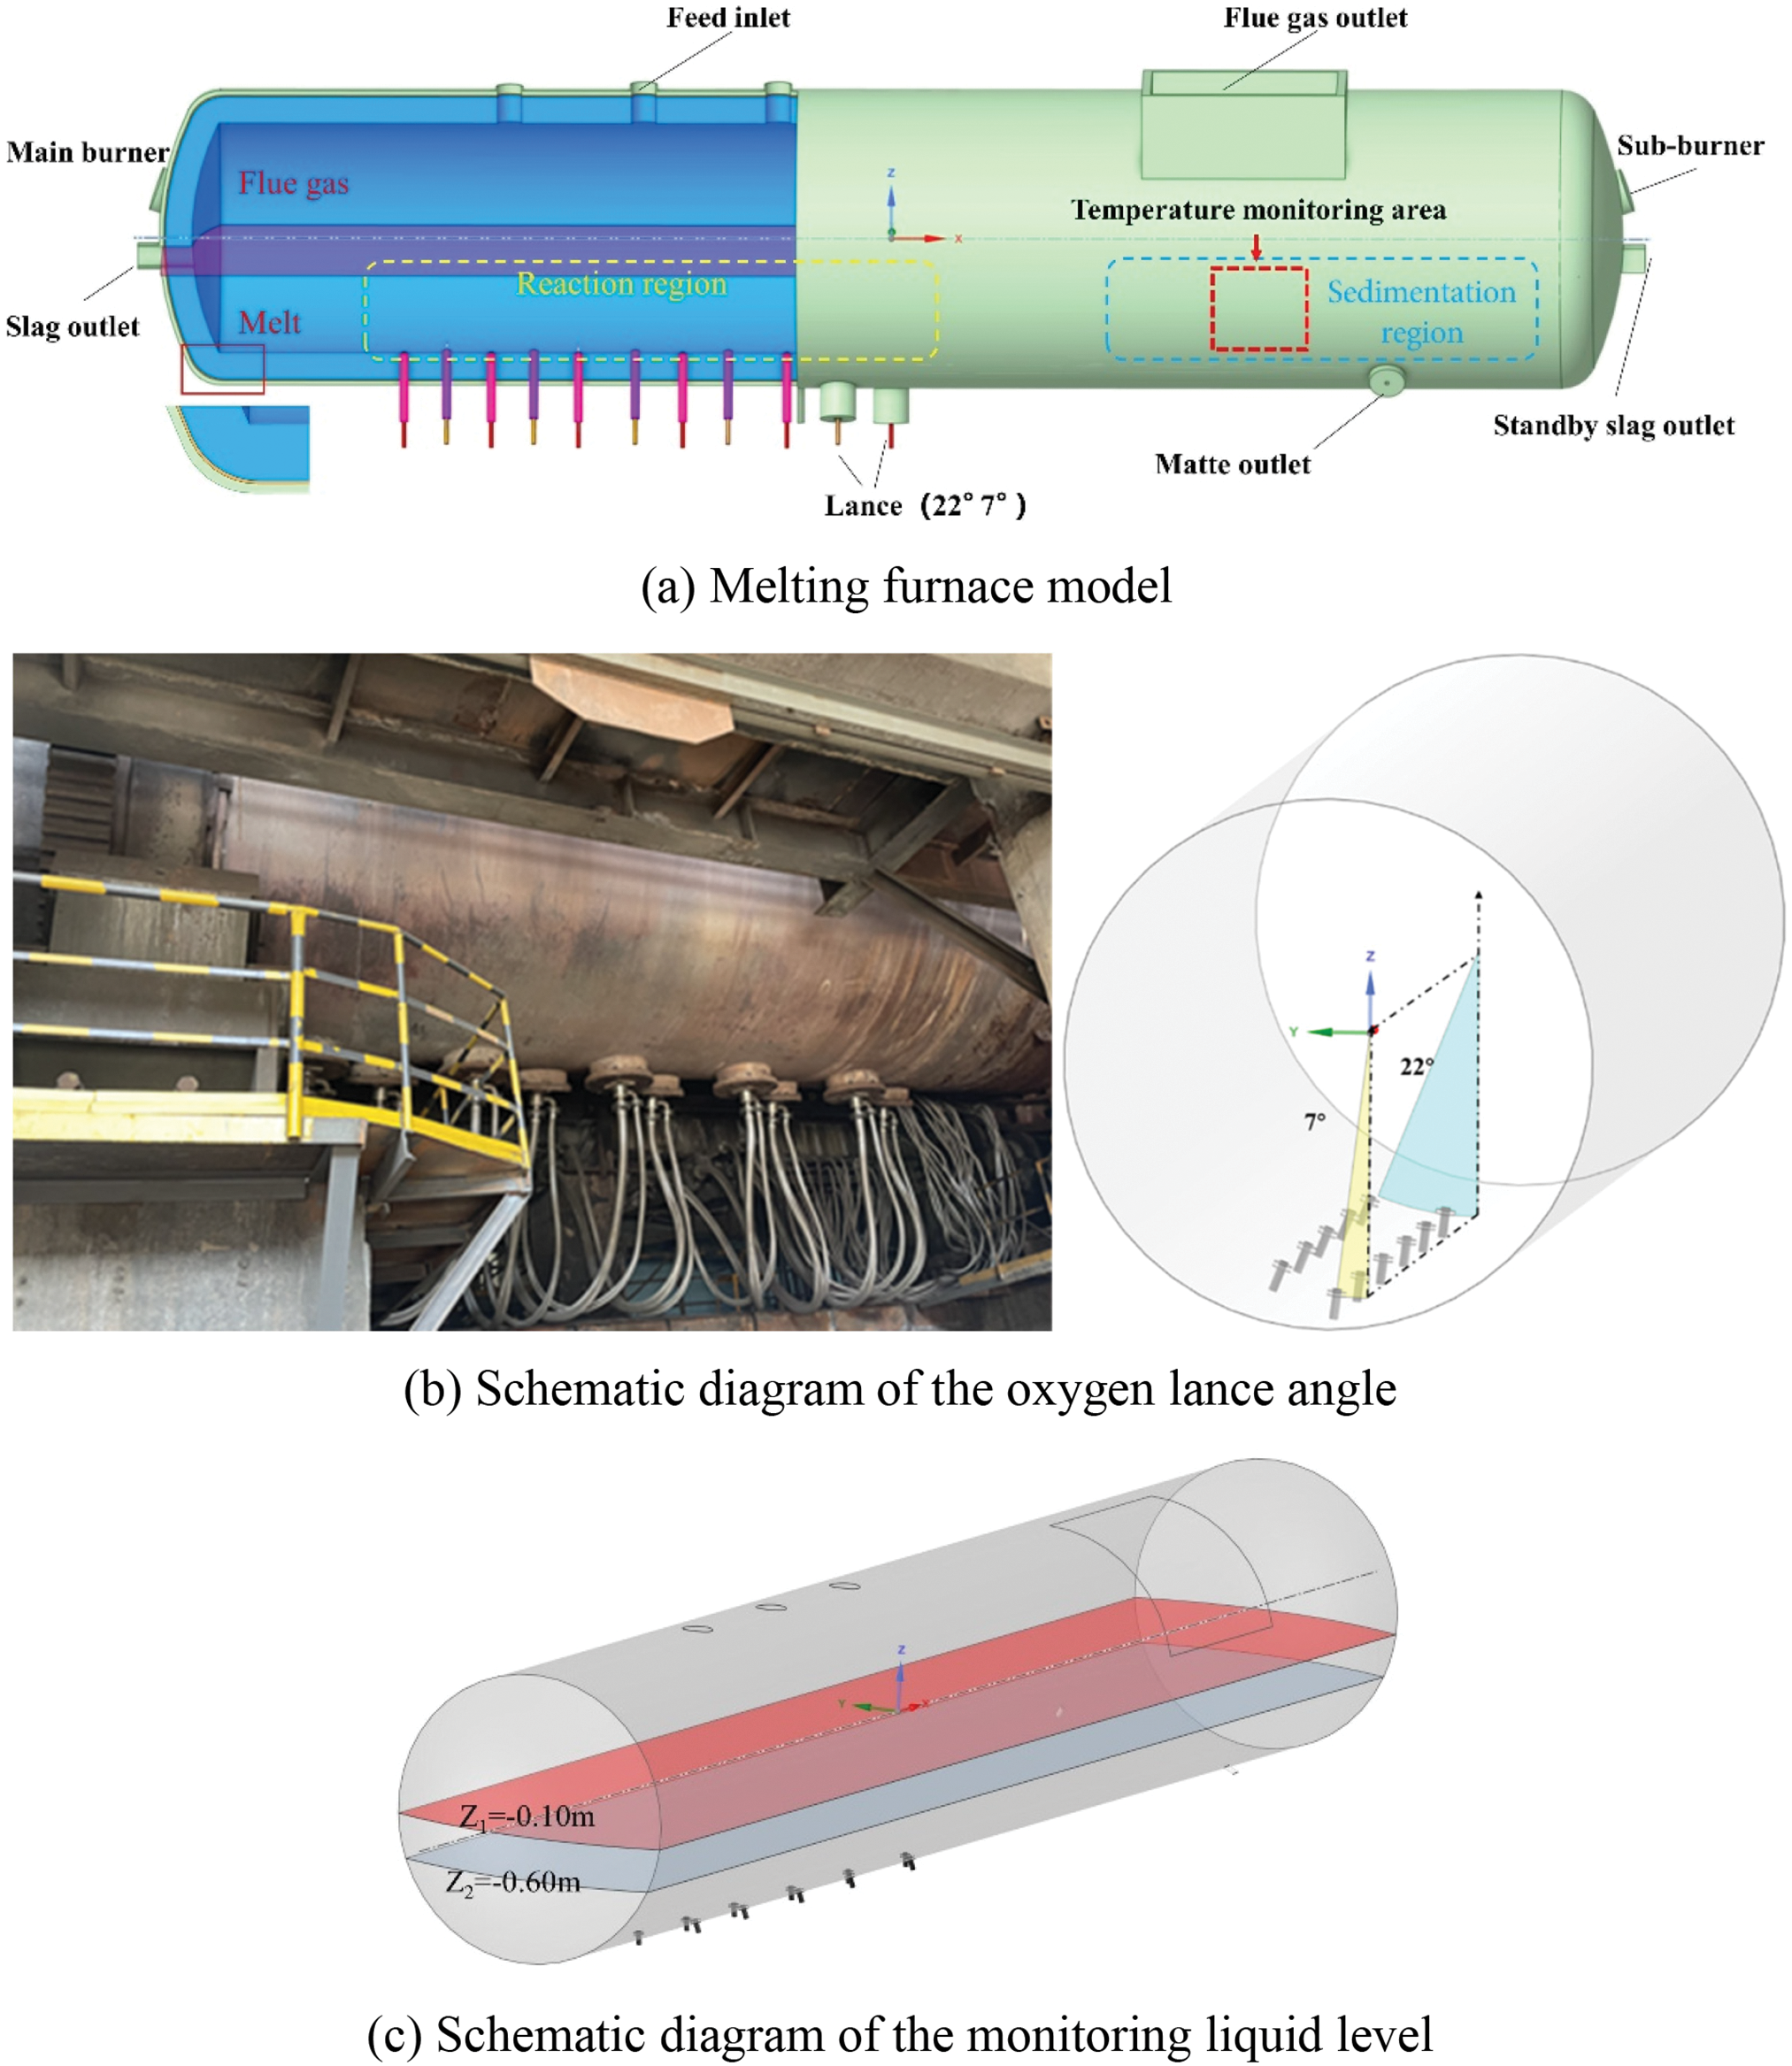
Figure 1: Model of bottom-blown melting furnace
Since the VOF model is suitable for tracking the gas-liquid surfaces and with the advantages of processing transient velocities and a relatively small computational load, the VOF model is used in this study for multiphase flow numerical simulation. The basic equations followed in the solution process include continuity equation, momentum conservation equation and energy conservation equation (as shown in Section 2.2.3) [29–33].
Continuity equation:
Which for an incompressible fluid reduces to:
Momentum conservation equation:
where ρ is the density of the fluid (for incompressible fluid, the density is constant); α is the volume fraction of i phase; v is the phase velocity vector; g is the acceleration of gravity; τ is the viscous stress tensor; R is the turbulent Reynolds stress term.
The Standard k-ε model is applicable to fully turbulent flow, and the influence of molecular viscosity can be neglected, and it can effectively represent the flow characteristics of the melt within the welding pool in this study. Therefore, the Standard k-ε model is adopted for turbulence calculations [27,34]. The model describes the statistical characteristics of turbulence by solving the equations of turbulent kinetic energy (k) and turbulent kinetic energy dissipation rate (ε).
Among them,
Gk and Gb respectively denote the TKE induced by the mean velocity gradient and that generated by buoyancy; C2, C1ε, and C3ε are empirical constants with values of 1.44, 1.92 and 0.09; σk and σε are the turbulent Prandtl numbers of k and ε; Sk and Sε are the source terms; S is a scalar measure of deformation tensor, and Sij is the average strain rate.
In the simulation setup, the energy equation is directly activated, and within the VOF model, the expression for the energy conservation equation is as follows [29,35]:
The first three terms from the left are the transport energies caused by conduction, mass diffusion, and viscous dissipation, respectively, Sh is the heat source term of chemical reaction.
The source term (Sh) in the energy equation represents the reaction heat of the main reactions within the furnace. Based on the analytical outcomes of ingredient composition in practical production, the following primary reactions are taken into account [9,36]:
The reaction heat is calculated according to the content of FeS and Cu2S in the feed amount corresponding to the injection quantity, and the energy source term is set after conversion.
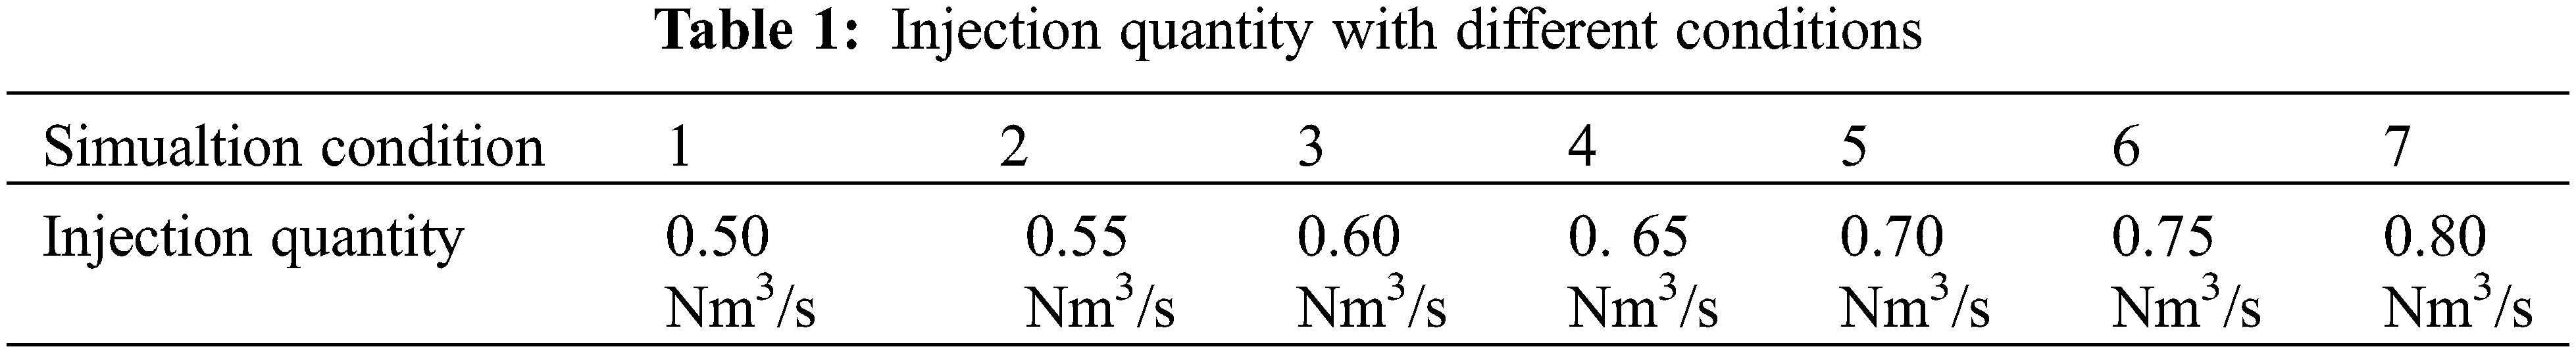
2.3 Simulation Condition Setting
The oxygen injection quantity during the smelting process corresponds to the feeding rate of materials. Therefore, the injection quantity is used as the control variable for the calculation conditions. The injection quantity of each lance is equal. The lance inlet is set as a mass flow inlet, and the injection quantity is the actual injection quantity. The injection quantities of different simulation conditions are shown in Table 1. The boundary condition at the flue gas outlet is configured as a pressure outlet, with the ambient pressure configured to standard atmospheric pressure, and the gravitational acceleration specified set to 9.81 m/s2.
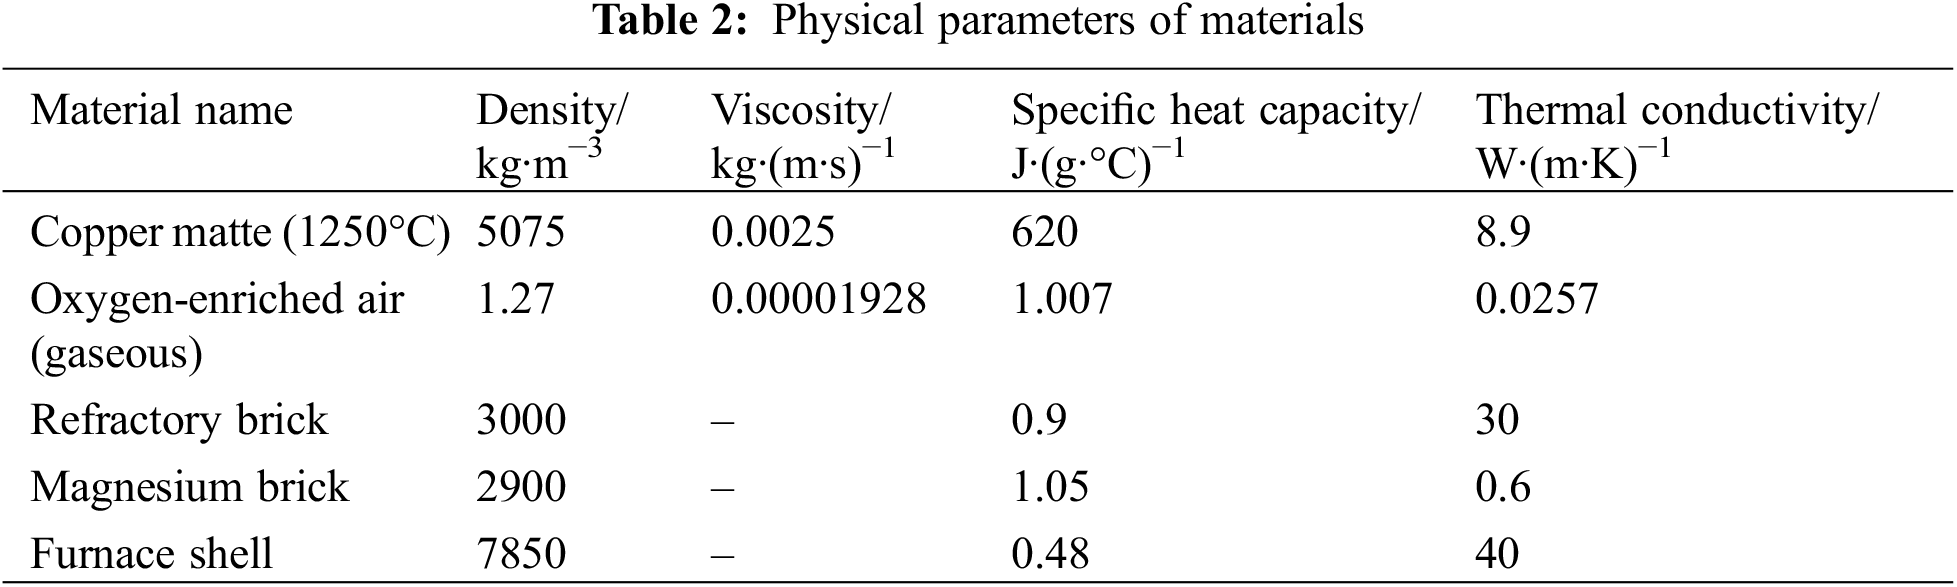
Based on the heat balance results, the heat release is calculated, and the unsteady-state calculation is carried out. The calculation convergence condition is that the temperature reaches a stable state. The closer the initial setting temperature is to the final simulated temperature, the smaller the calculation load. To save computing resources, the initial temperatures of melt and flue gas regions are set at 800°C, and the inlet temperature of oxygen-enriched air is set at 50°C. The reaction heat is calculated according to the contents of FeS and Cu2S in the feeding amount corresponding to the injection quantity. The physical parameters of the furnace body and the material inside the furnace are shown in Table 2.
The following simplified assumptions are made in simulation: (1) The melt liquid level is stable (Z1 = −0.10 m in Fig. 1c), which is the actual average melt height over a period of time, without considering the short-term fluctuations in the liquid level caused by feeding, slag and matte tapping. (2) The oxygen-enriched air blown is an incompressible gas.
In this study, the PISO algorithm in pressure-velocity coupling calculation is used, the PRESTIO! algorithm is used for pressure solution [17,37,38], the standard law of wall is used simultaneously, the discrete format is the second-order upwind scheme, the calculation residual is set to 1 × 10⁻⁶, and the time step is determined to be 1 × 10⁻⁴ s.
2.4 Grid Independence and Model Validation
2.4.1 Grid Independence Validation
The fluid area of the furnace adopts a grid division mode combining hexahedrons and polyhedrons, the lance injection area is encrypted, as shown in Fig. 2. To guarantee that the simulation results and their accuracy are not influenced by the number of grid elements, grid independence verification is necessary. The number of grids for verification is 1,015,321, 1,401,438, 1,812,579, 2,204,315, 2,611,203, 3,018,509, and 3,400,953, respectively. The simulation condition for independence verification is that when the injection quantity is 0.50 Nm³/s, the time from the start of injection to the first bubble reaches at the liquid surface. The results of different grid numbers are shown in Fig. 3. As illustrated in the figure, when the number of grid points exceeds 2,611,203, the time taken for bubbles to reach the liquid surface remains constant and does not vary with further increases in the grid count. Therefore, while ensuring computational accuracy, a grid number of 2,611,203 is selected.
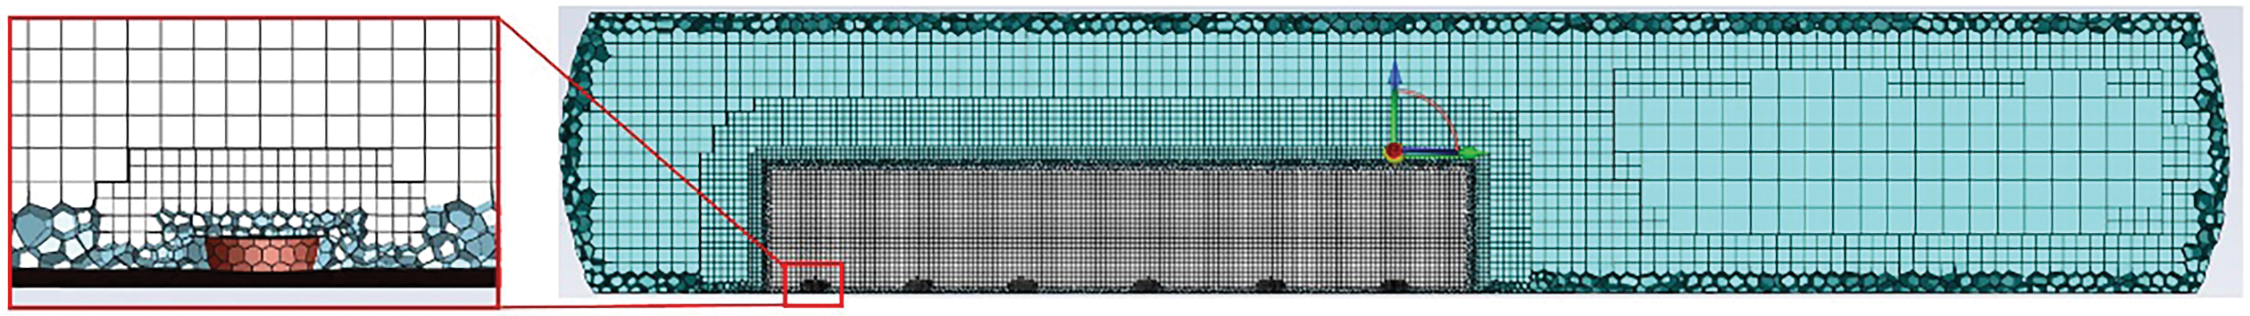
Figure 2: Schematic diagram of grid division
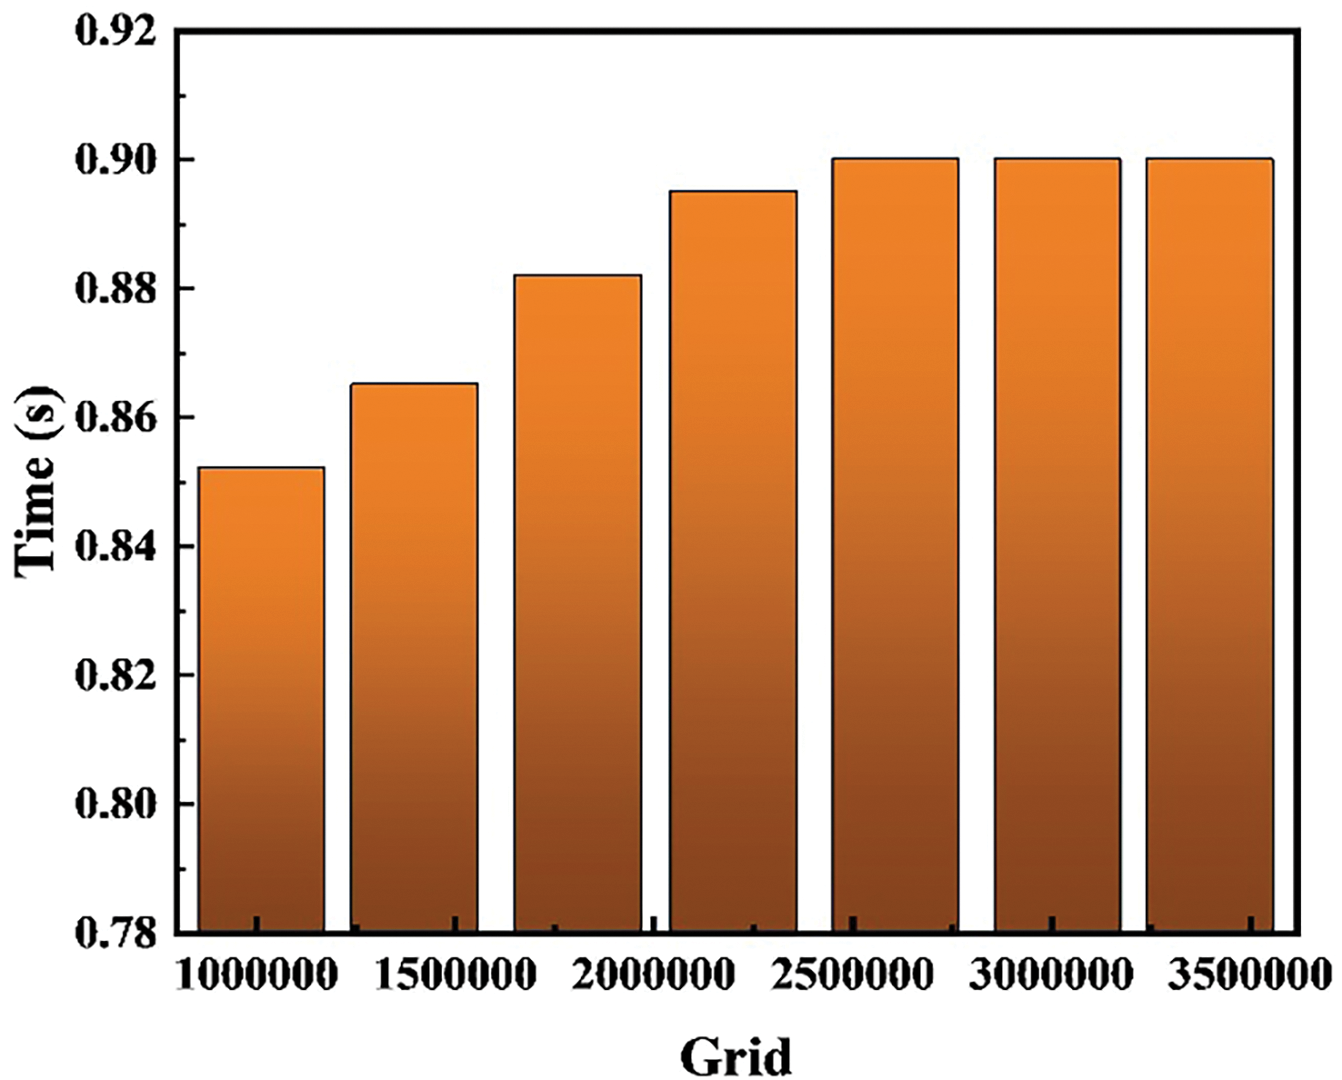
Figure 3: Grid-independent validation
In order to ensure the accuracy of the calculation, the elaborated model needs to be verified. As shown in Fig. 1a, a temperature monitoring area (red dotted box 0.9 × 0.9 m) is selected, which is located at the copper matte wall directly below the flue gas outlet. The simulated and tested average temperature at this monitoring area under different injection quantities are compared to verify the accuracy of the model. As shown in Fig. 4, it is the production site test process and result display based on the infrared thermal imager, and the tested temperature is the external temperature of furnace shell. The melt temperature at the inner wall surface can be obtained from numerical simulation, then the outer wall surface temperature can be obtained by performing heat conduction calculation according to the thermophysical parameters of lining and shell materials of the furnace.
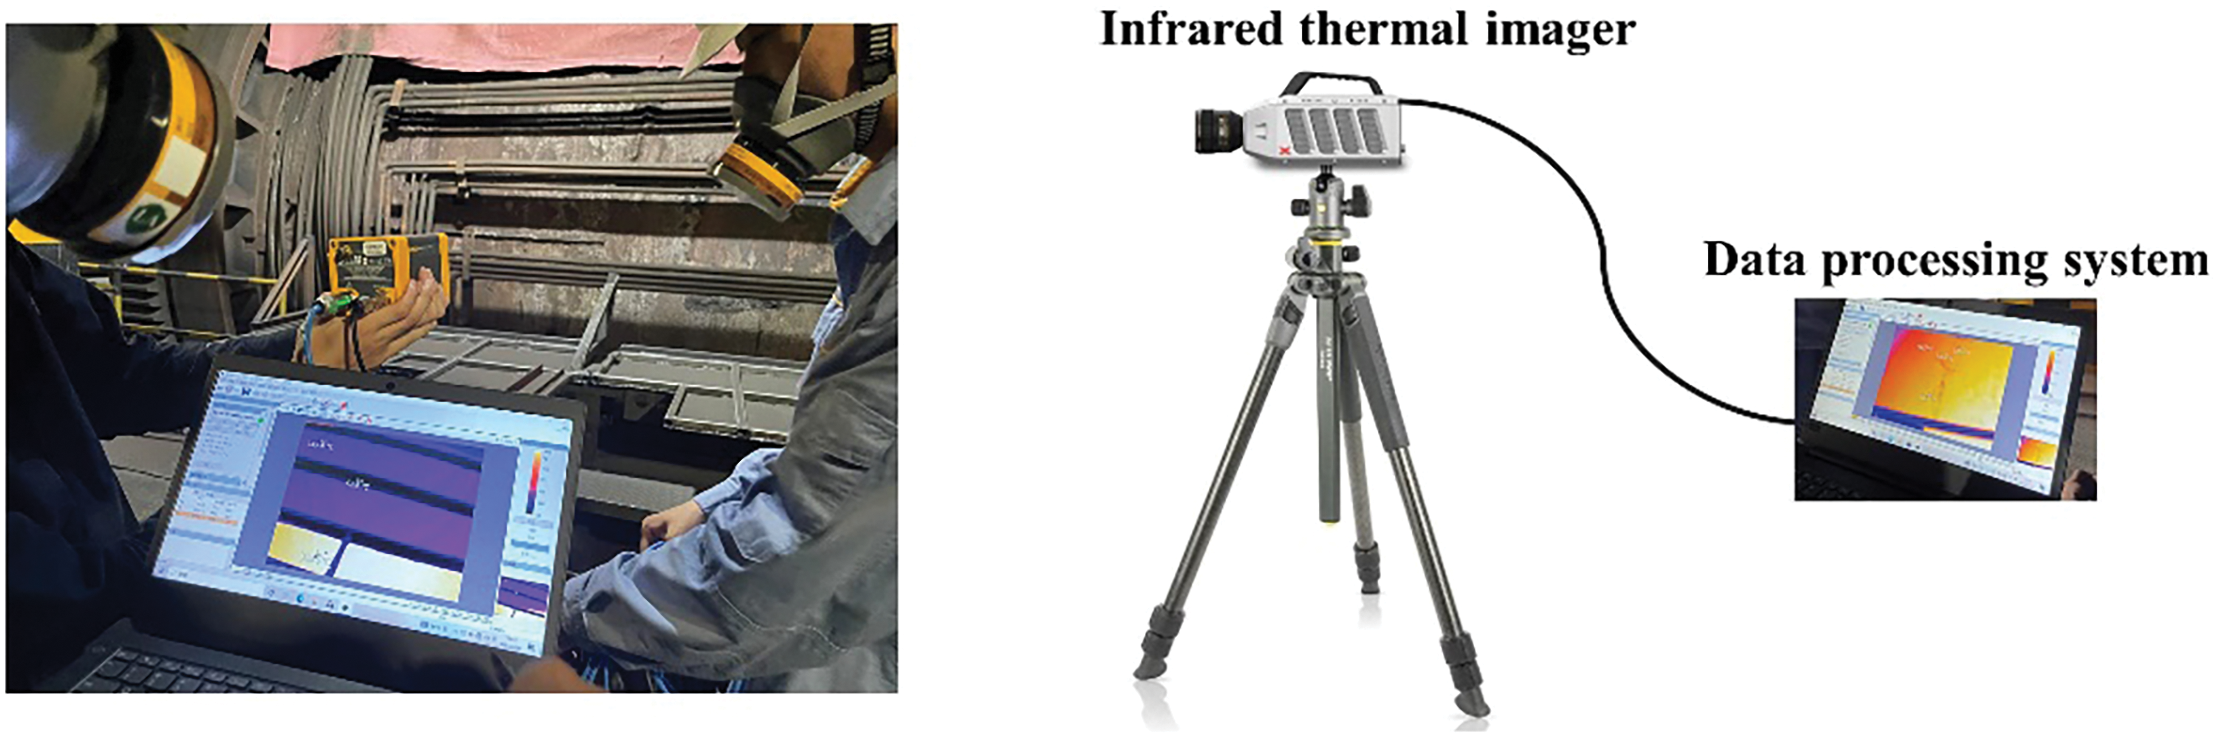
Figure 4: Schematic diagram of temperature monitoring
The working conditions in Table 1 are tested on-site, and the simulations are carried out for these conditions. The tested and simulated temperature at monitoring area are shown in Fig. 5. It can be seen that the average temperature of the monitoring area increases with the increase of injection quantity, and the maximum absolute deviation between the simulated and tested values under all conditions is 4.9°C, indicating that the mathematical model constructed in this paper has high reliability.
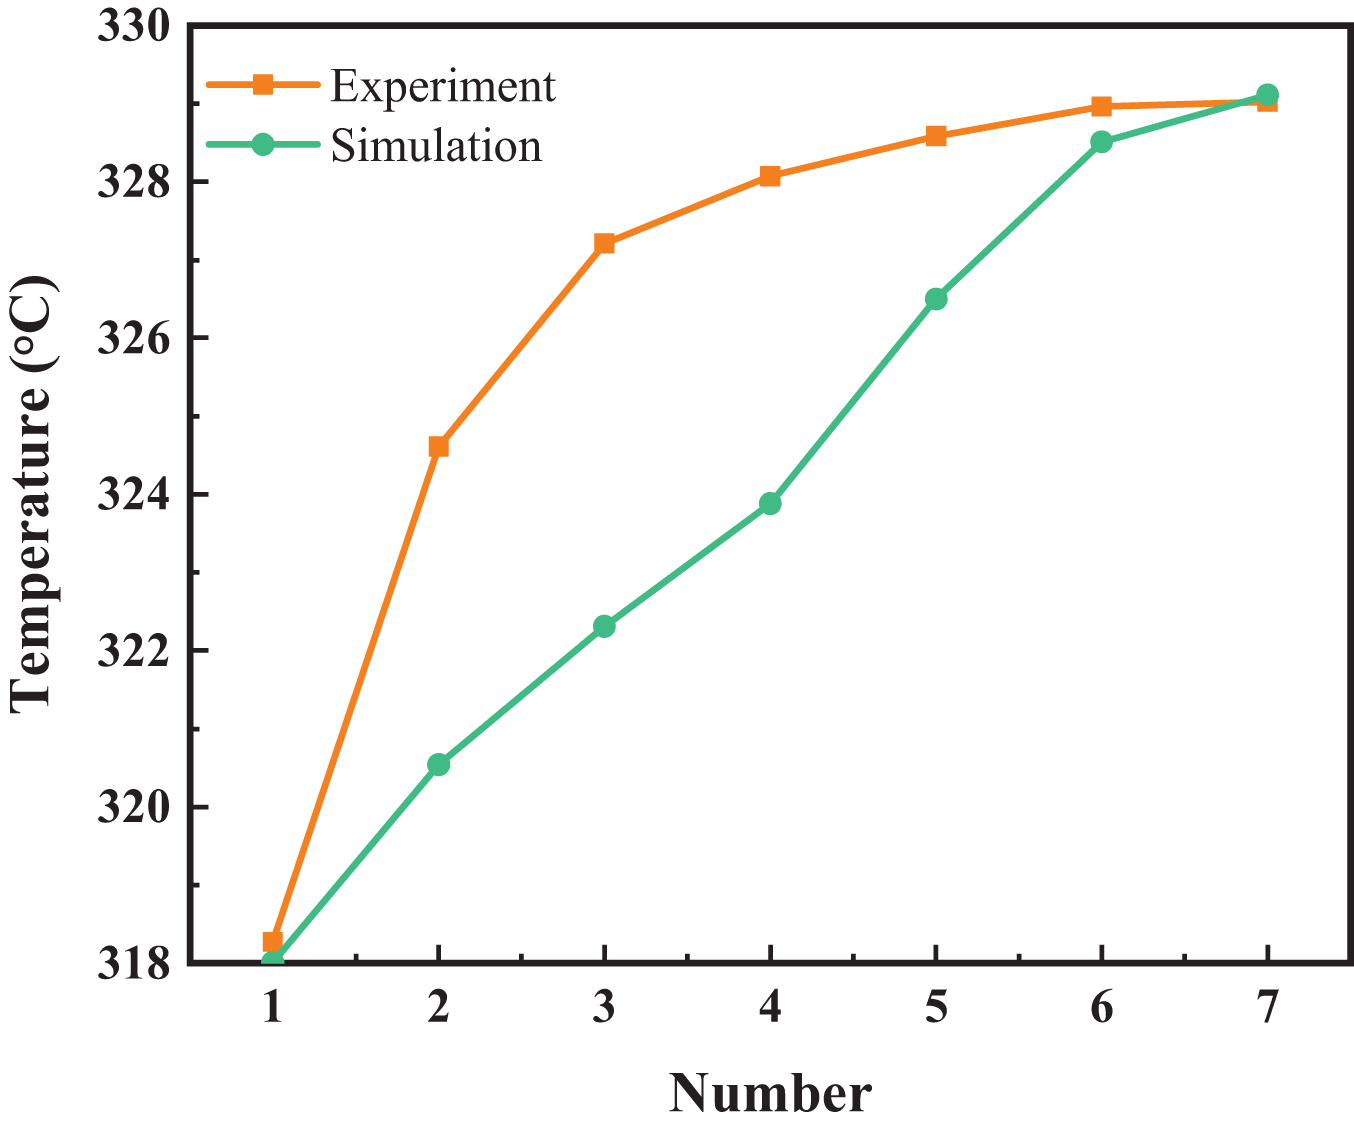
Figure 5: Comparison of experimental and simulation average temperatures at different injection quantities
Fig. 6 illustrates the flow field distribution within the furnace, and the overall velocity distribution in the furnace is analyzed by the density of the streamline and the color change of the streamline. As shown in Fig. 6a, the introduction of oxygen-rich air creates dense flow lines near the nozzle, indicating a higher velocity in this area, which enhances the stirring effect on the melt and facilitates the ongoing reactions within the furnace. After the flue gas rises and exits the melt zone, it forms a dense and uniformly distributed flow pattern in the flue gas area.
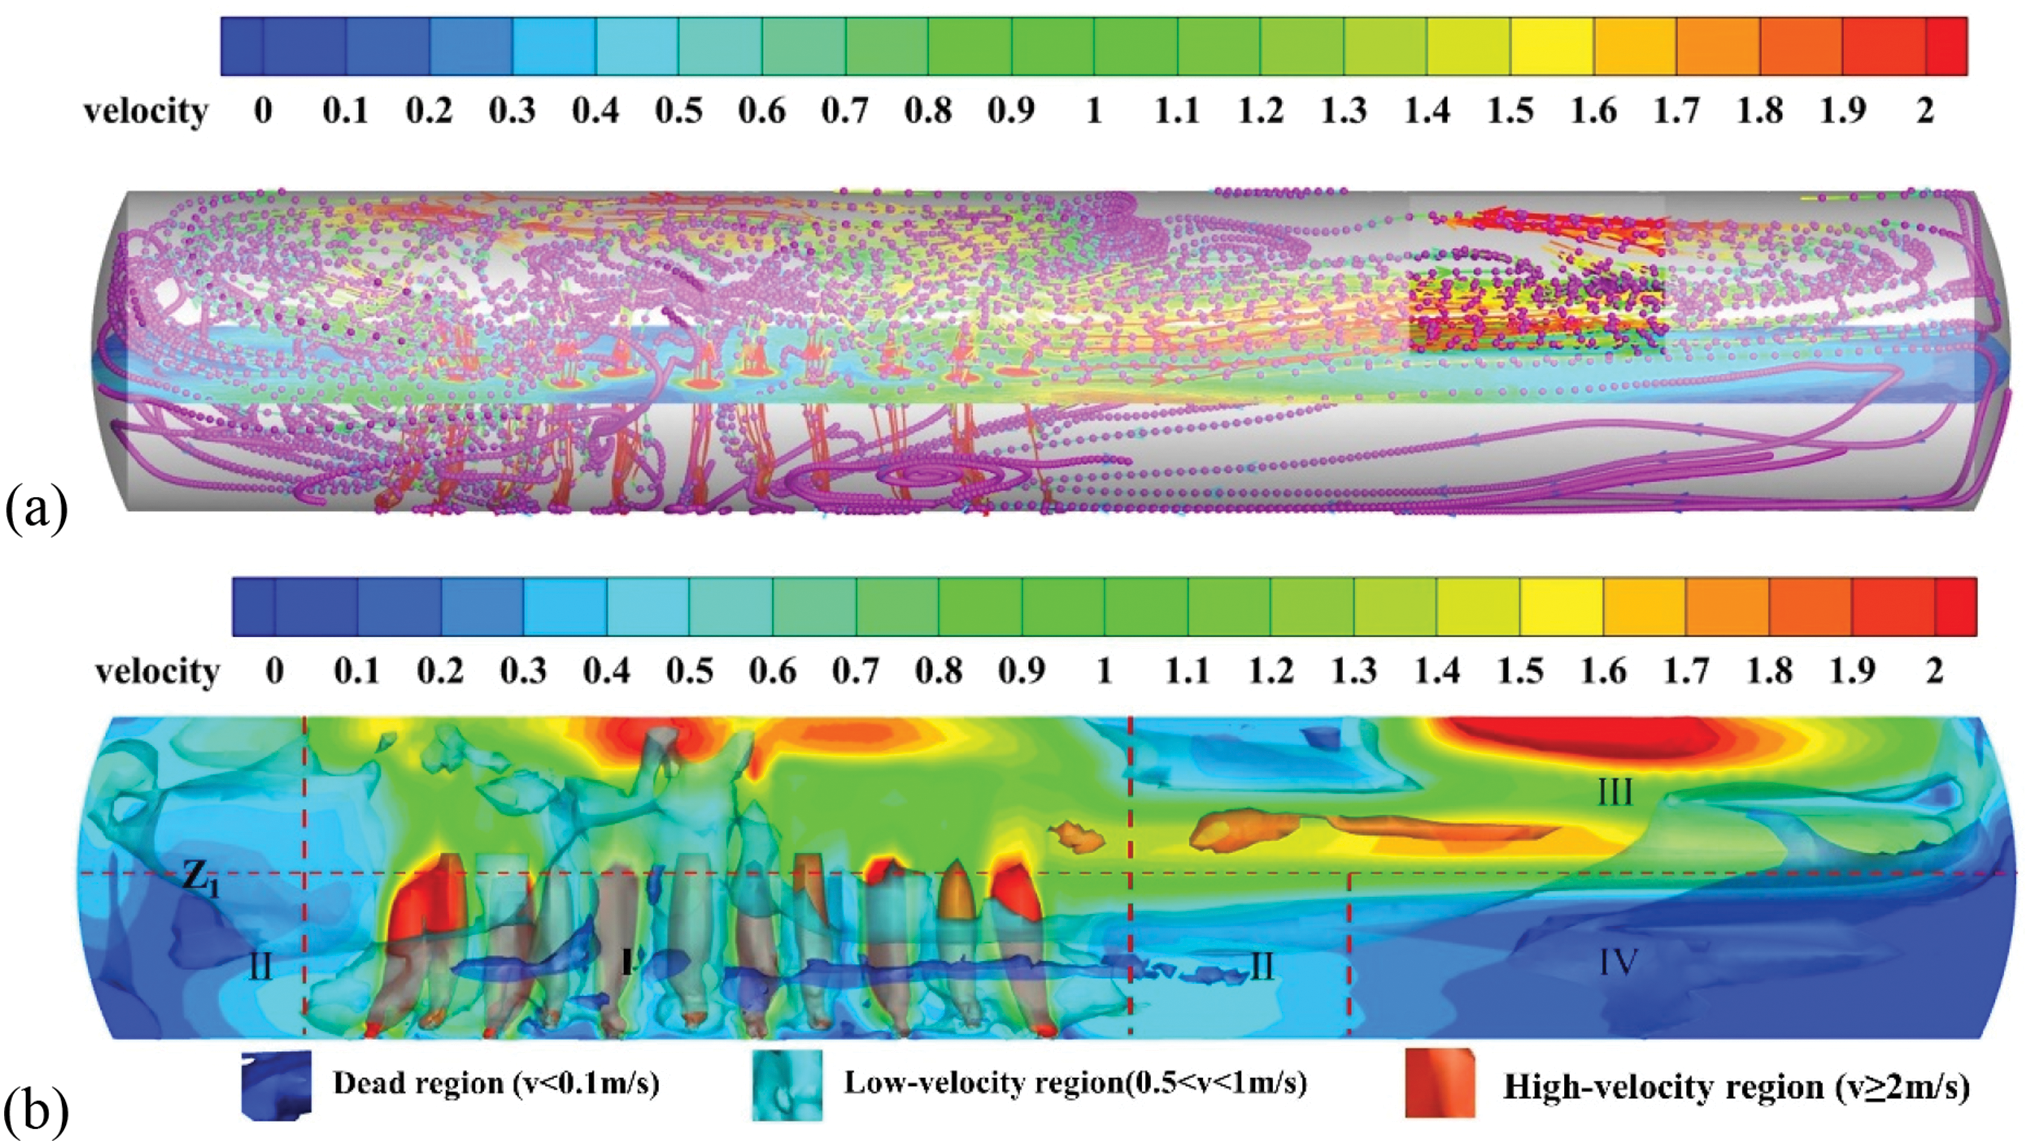
Figure 6: Overall flow field distribution in the bottom-blown furnace: (a) Streamline distribution; (b) Velocity region distribution
Fig. 6b indicates that the high-velocity regions within the furnace are primarily located in the reaction region near the nozzle (I) and the flue gas exit area (III), while the low velocity regions are found along the sides of the furnace close to the walls (II). Dead regions are mainly concentrated in the sedimentation region (IV). The gas velocity is significantly higher than that of the melt, with the melt being primarily influenced by the impact of the high-velocity gas flow, which promotes stirring and mixing within the furnace. The relatively low velocity in the sedimentation region facilitates the settling and stable accumulation of copper matte. When bubbles pass through the liquid surface and break, they create a scouring effect on the furnace roof above the reaction region, spreading into the flue gas area and eventually exiting through the flue gas outlet. Due to pressure effects, a high-velocity region forms at the flue gas exit. Therefore, it is crucial to consider the scouring caused by high-velocity bubble breakage that leads to melt splashing on the furnace roof to ensure operational safety.
Fig. 7 illustrates the variation of the average velocity of the melt over time on the plane at Z1 = 0.10 m. Analysis of Fig. 7 reveals that when bubbles break the liquid surface and subsequently burst, a significant fluctuation occurs at the liquid interface (as indicated in region A of the figure), resulting in velocity fluctuations. Under different injection quantities, the trends in average velocity changes tend to converge; however, the time required to reach stability varies. As the injection rate increases, the time taken for the average melt velocity to stabilize decreases, and the stabilized average velocity increases, indicating improved stirring efficiency of the melt pool. The dashed lines in the figure indicate the times at which the average velocity stabilizes for injection rates of 0.50 Nm3/s and 0.80 Nm3/s. Specifically, for a injection rate of 0.50 Nm3/s, stability is achieved after 2.6 s, with a stabilized average velocity of 0.505 m/s; for a injection rate of 0.80 Nm3/s, stability is reached after 1.9 s, with a stabilized average velocity of 0.702 m/s.
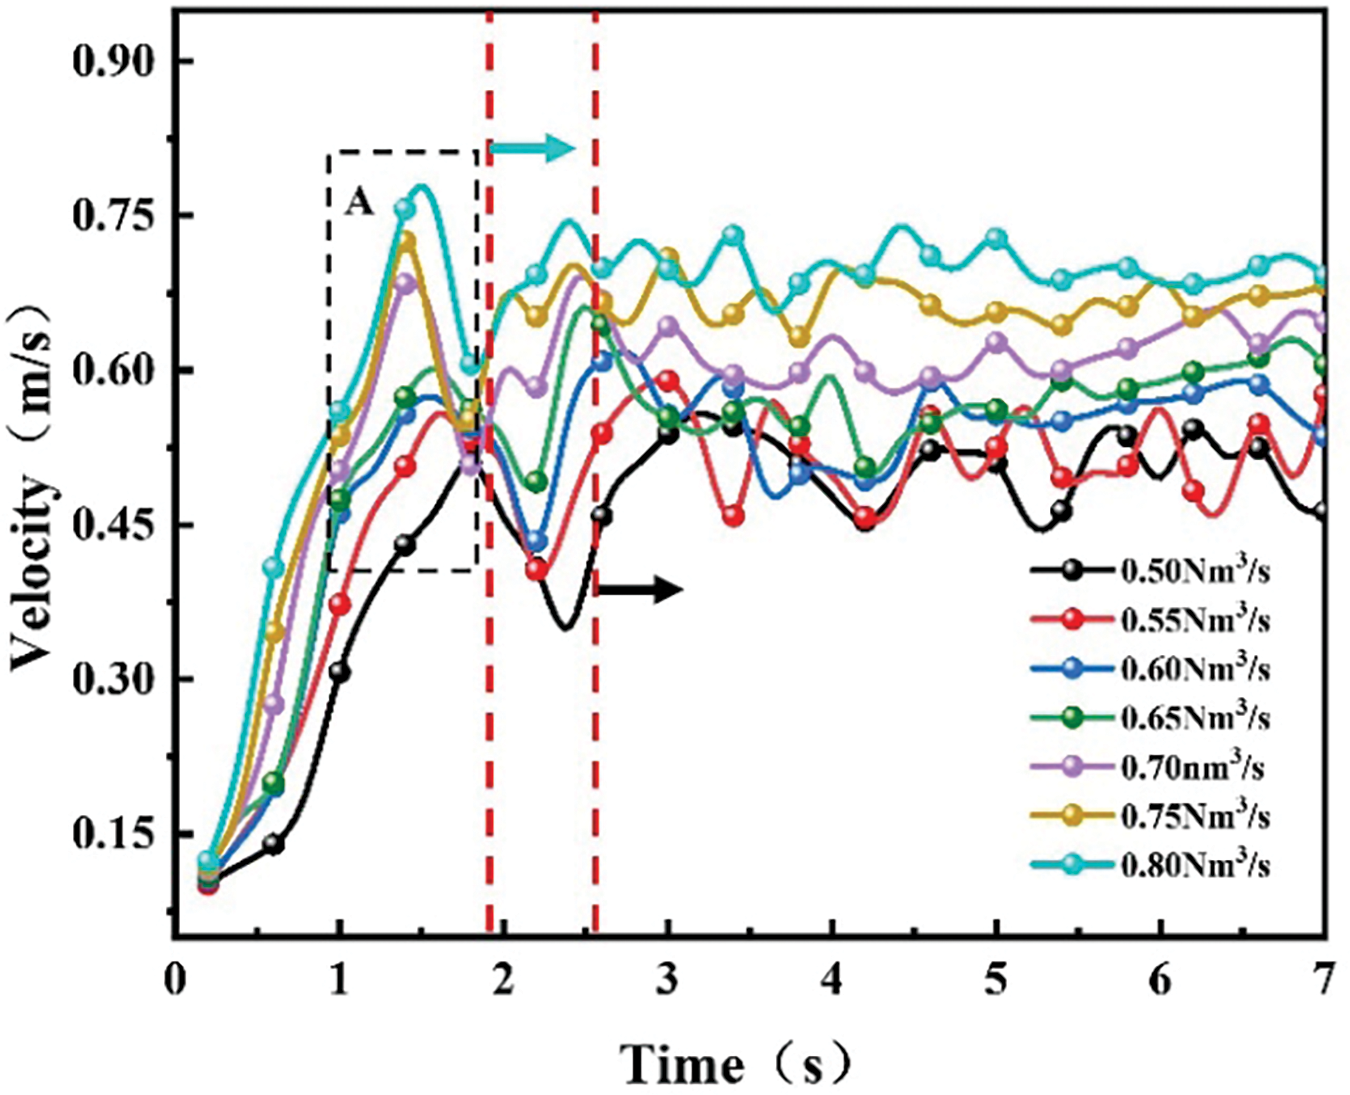
Figure 7: Average velocity of melt on Z1 plane with different injection quantities
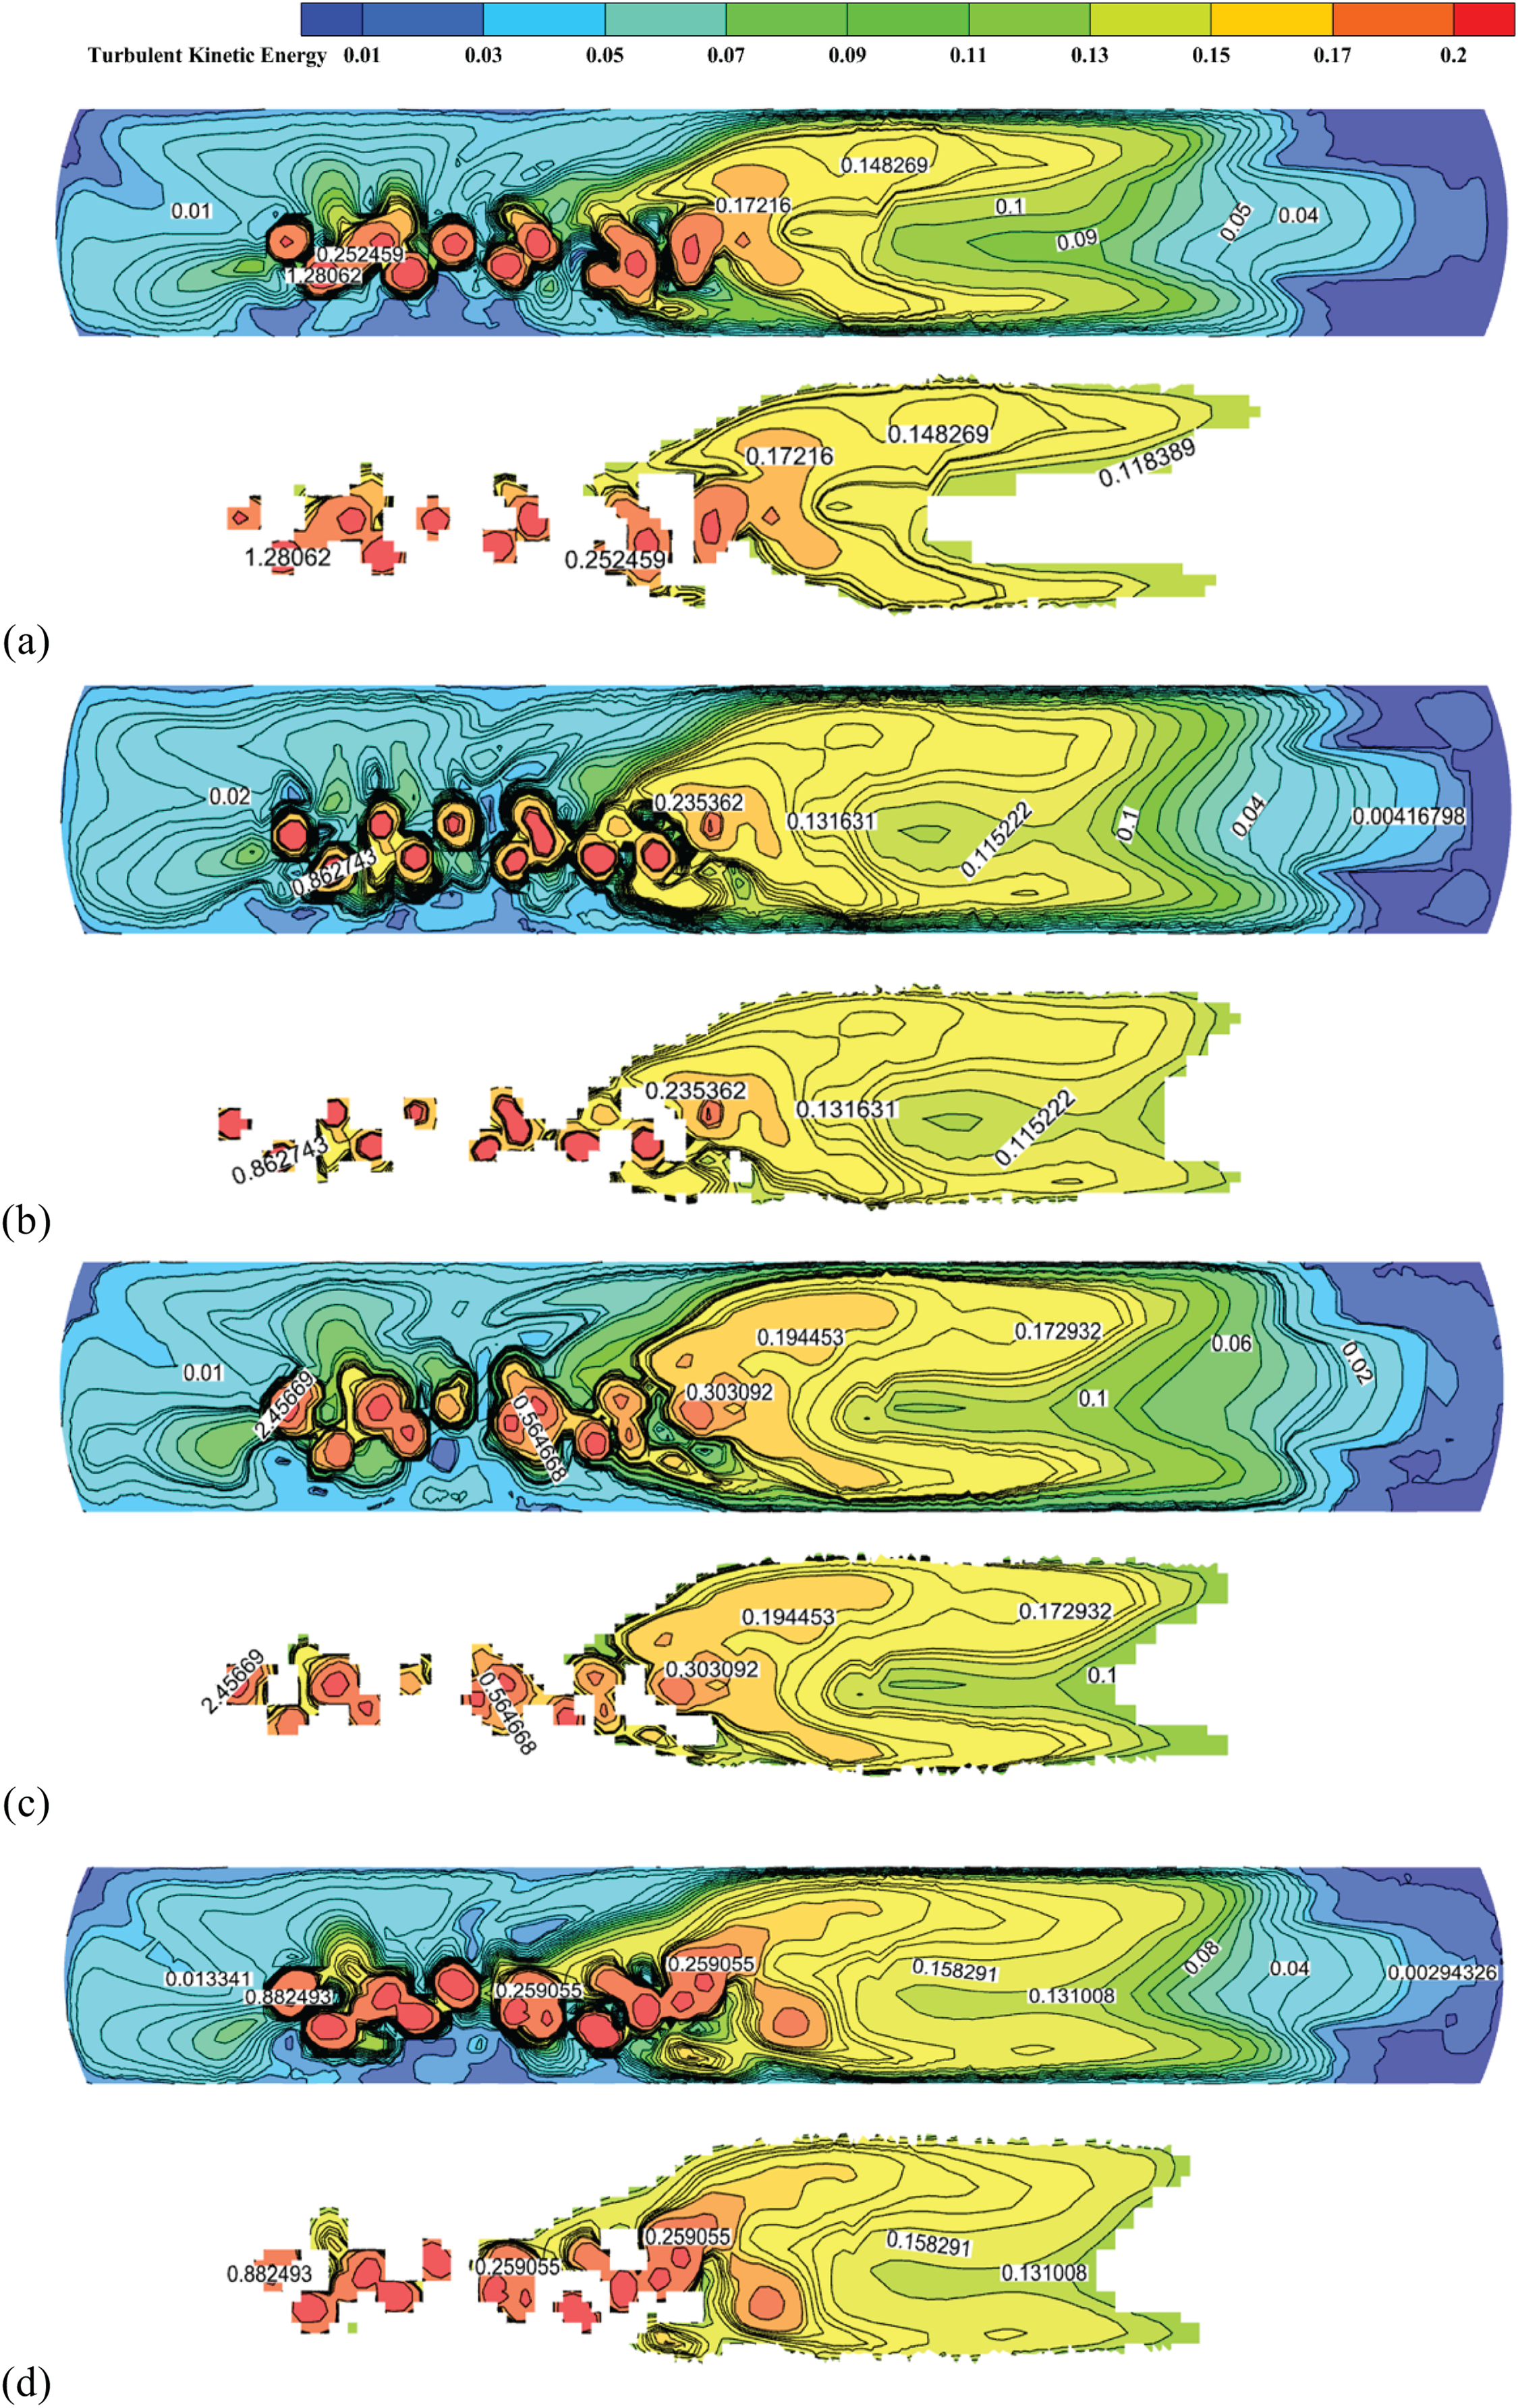
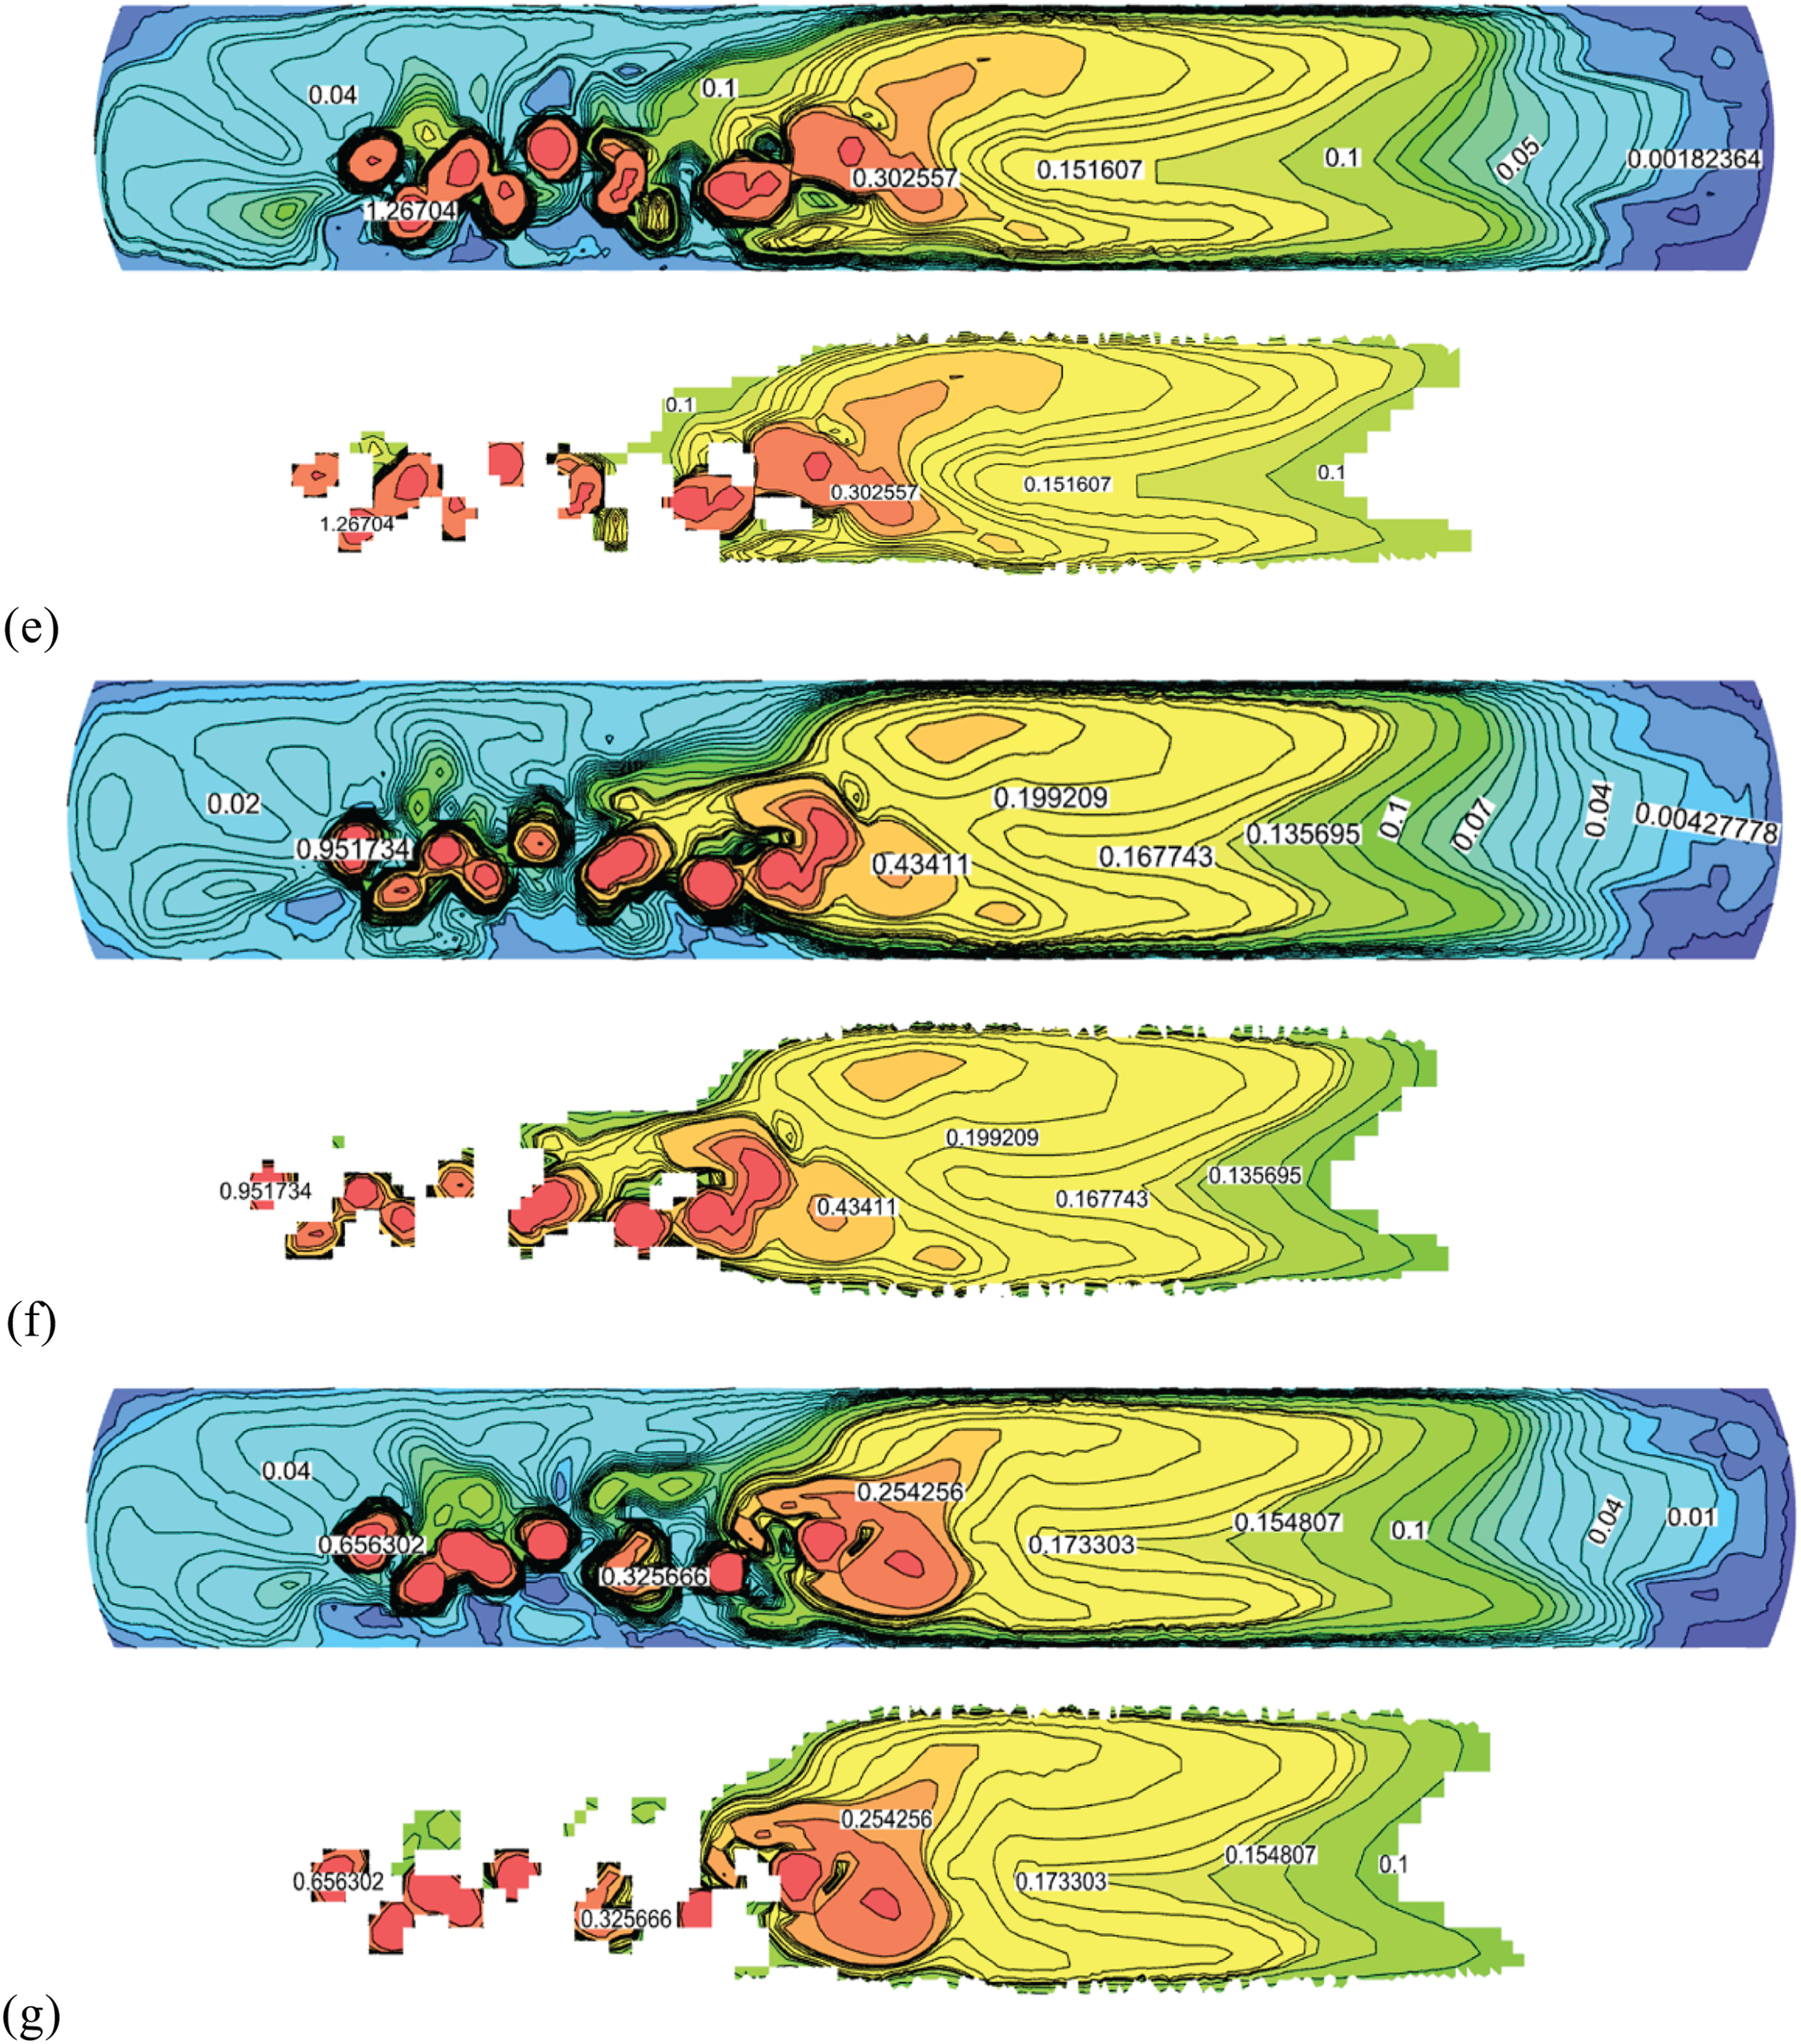
Figure 8: Turbulent kinetic energy distribution on the monitoring surface at different injection quantities: (a) 0.50 Nm3/s; (b) 0.55 Nm3/s; (c) 0.60 Nm3/s; (d) 0.65 Nm3/s; (e) 0.70 Nm3/s; (f) 0.75 Nm3/s; (g) 0.80 Nm3/s
3.2 Average Turbulent Kinetic Energy
Turbulent kinetic energy (TKE) serves as a measure of fluid turbulence intensity, and in multiphase flows, it can reflect the degree of gas-liquid mixing. An increase in TKE aids in enhancing heat and mass transfer processes within the molten pool, reducing dead zones and flow resistance. This indicates that stronger vortices in fluid flow lead to higher transfer efficiencies of momentum, heat, and mass. In this paper, the TKE at the section of Z2 = −0.60 m (as shown in Fig. 1c) is selected to study the influence of the injection quantity on gas-liquid mixing performance. The analysis of TKE is carried out after the injection reaches a dynamic stability.
Fig. 8 illustrates the distribution of TKE at cross-section Z2 = −0.60 m under steady-state conditions for different injection quantities. Areas where the TKE exceeds 0.10 m2/s2 are highlighted separately, providing a clear representation of the TKE distribution within the furnace. As shown in the Fig. 8a–g correspond to injection rates of 0.50 to 0.80 Nm3/s), strong stirring in the reaction region due to the injection results in significant TKE, primarily concentrated near the nozzle. As the injection continues, this TKE gradually diffuses toward the sedimentation region and decreases over distance. Notably, TKE diminishes closer to the wall, which aligns well with the flow field distribution observed in the bottom-blown furnace. As detailed in Table 3, as the injection rate increases from 0.50 to 0.80 Nm3/s, the area where TKE exceeds 0.10 m2/s2 rises from 23.27% to 40.61%. This indicates a more uniform distribution of TKE with a broader impact range, leading to enhanced kinetic, thermal, and mass transfer efficiencies, as well as improved gas-liquid mixing uniformity.
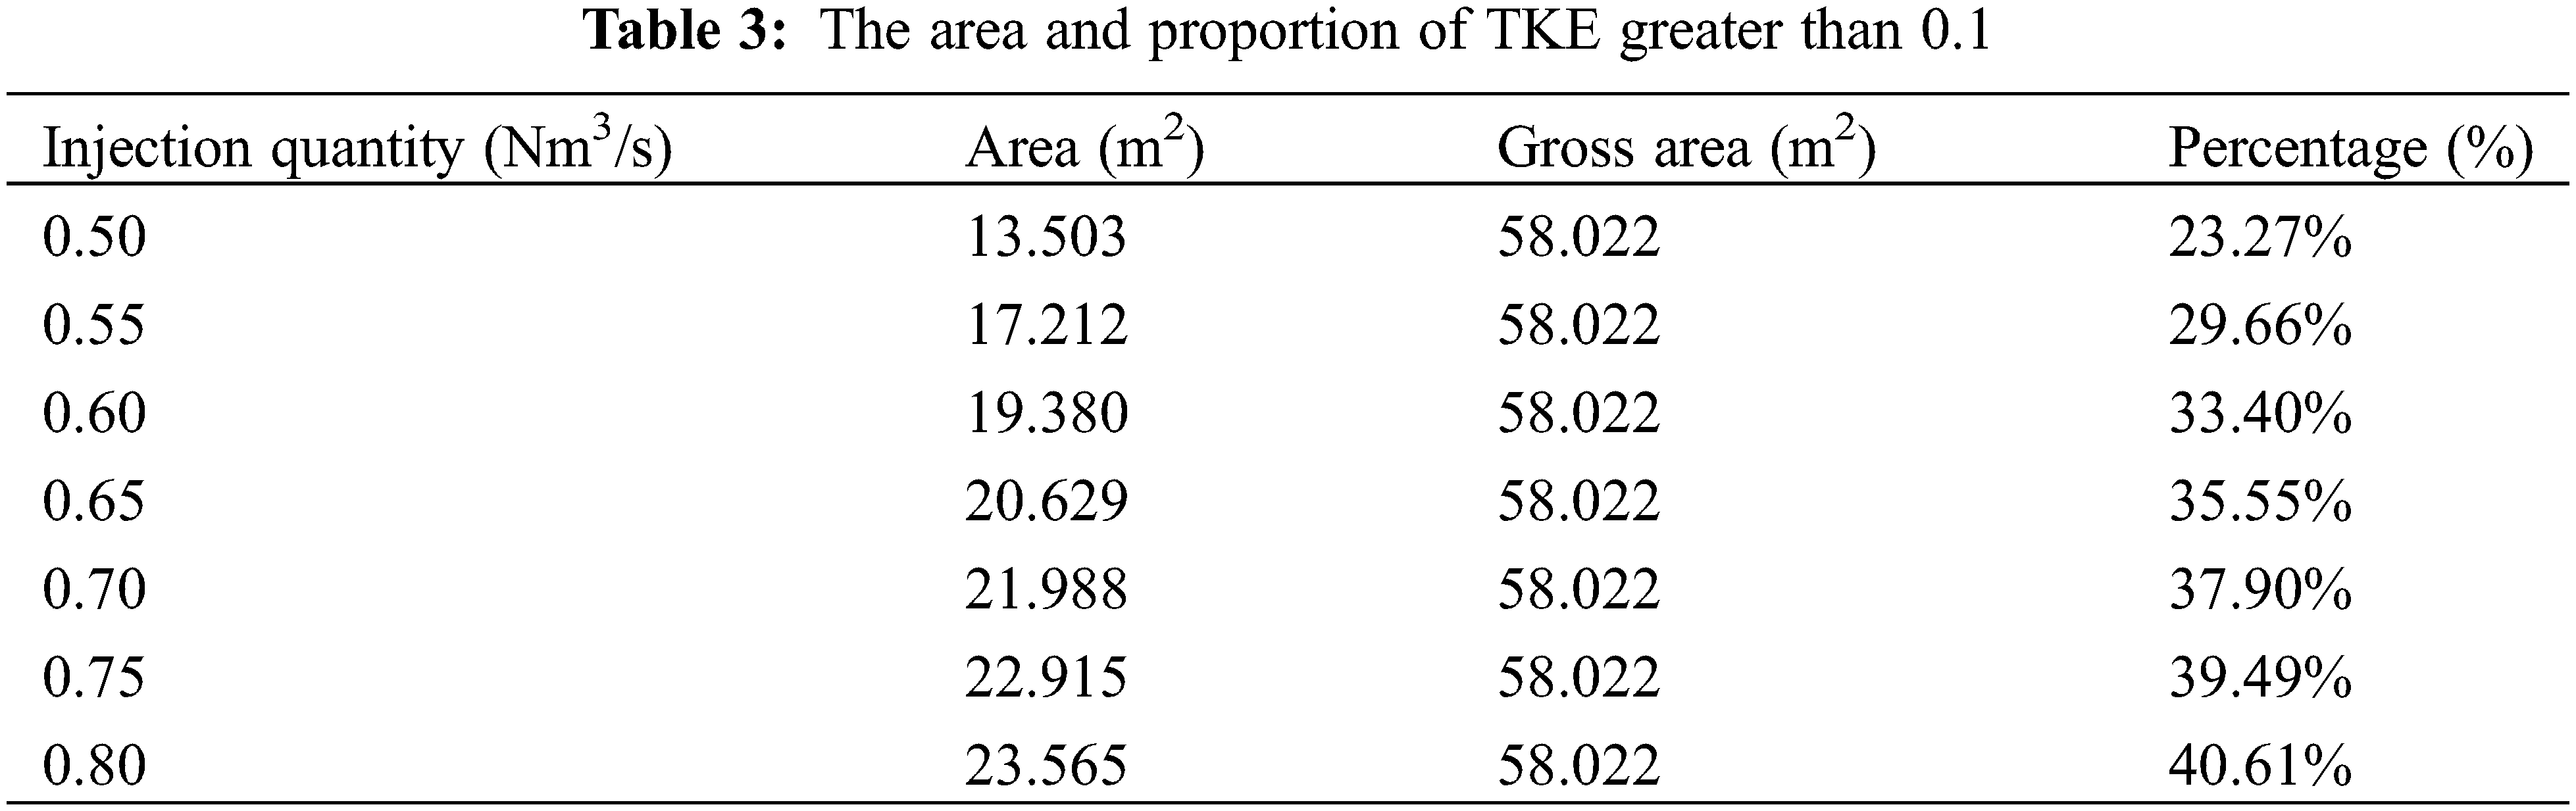
Fig. 9 shows the average TKE in the melt region under different injection quantities. It can be seen that as the injection quantity increases from 0.50 Nm3/s to 0.80 Nm³/s, the average TKE increases from 0.095 to 0.162 m2/s2. This indicates that with the increase in injection quantity, the stirring effect enhanced. When the injection quantity is less than 0.60 Nm3/s, the growth rate of the average TKE is relatively small. When the injection quantity is greater than 0.65 Nm³/s, the increase in injection quantity has a stronger disturbance effect on molten bath, and the growth rate of the average TKE is higher. However, if the injection quantity is too large, this will result that the oxygen not being able to fully participate in chemical reaction and will cause excessive splashing in melt region, which is not conducive to stable production.
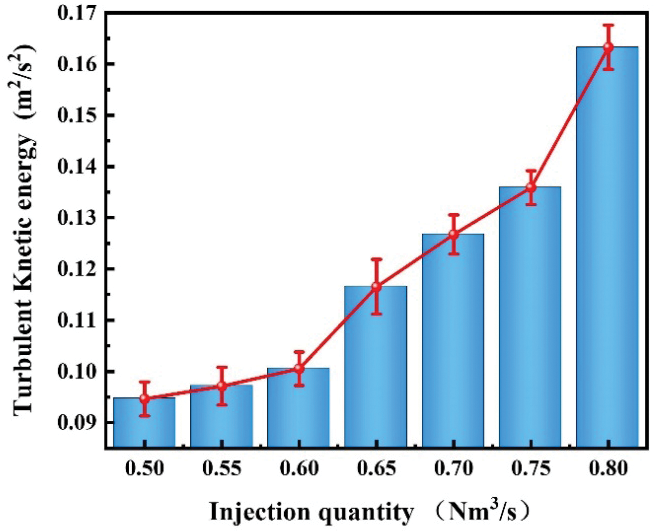
Figure 9: Average turbulent kinetic energy in melt region
The higher the gas holdup in the molten bath, the more sufficient the gas-liquid contact, which has a positive promoting effect on chemical reactions and enhanced stirring. Fig. 10 shows the gas-liquid phase distribution at 0.5 and 0.8 s after the start of injection with the injection quantity of 0.60 Nm3/s. It can be seen that the first bubble leaving the lance rises in a “mushroom cap” shape, and the bubble ejected from the 22° lance approaches the liquid surface earlier than that from the 7° lance.
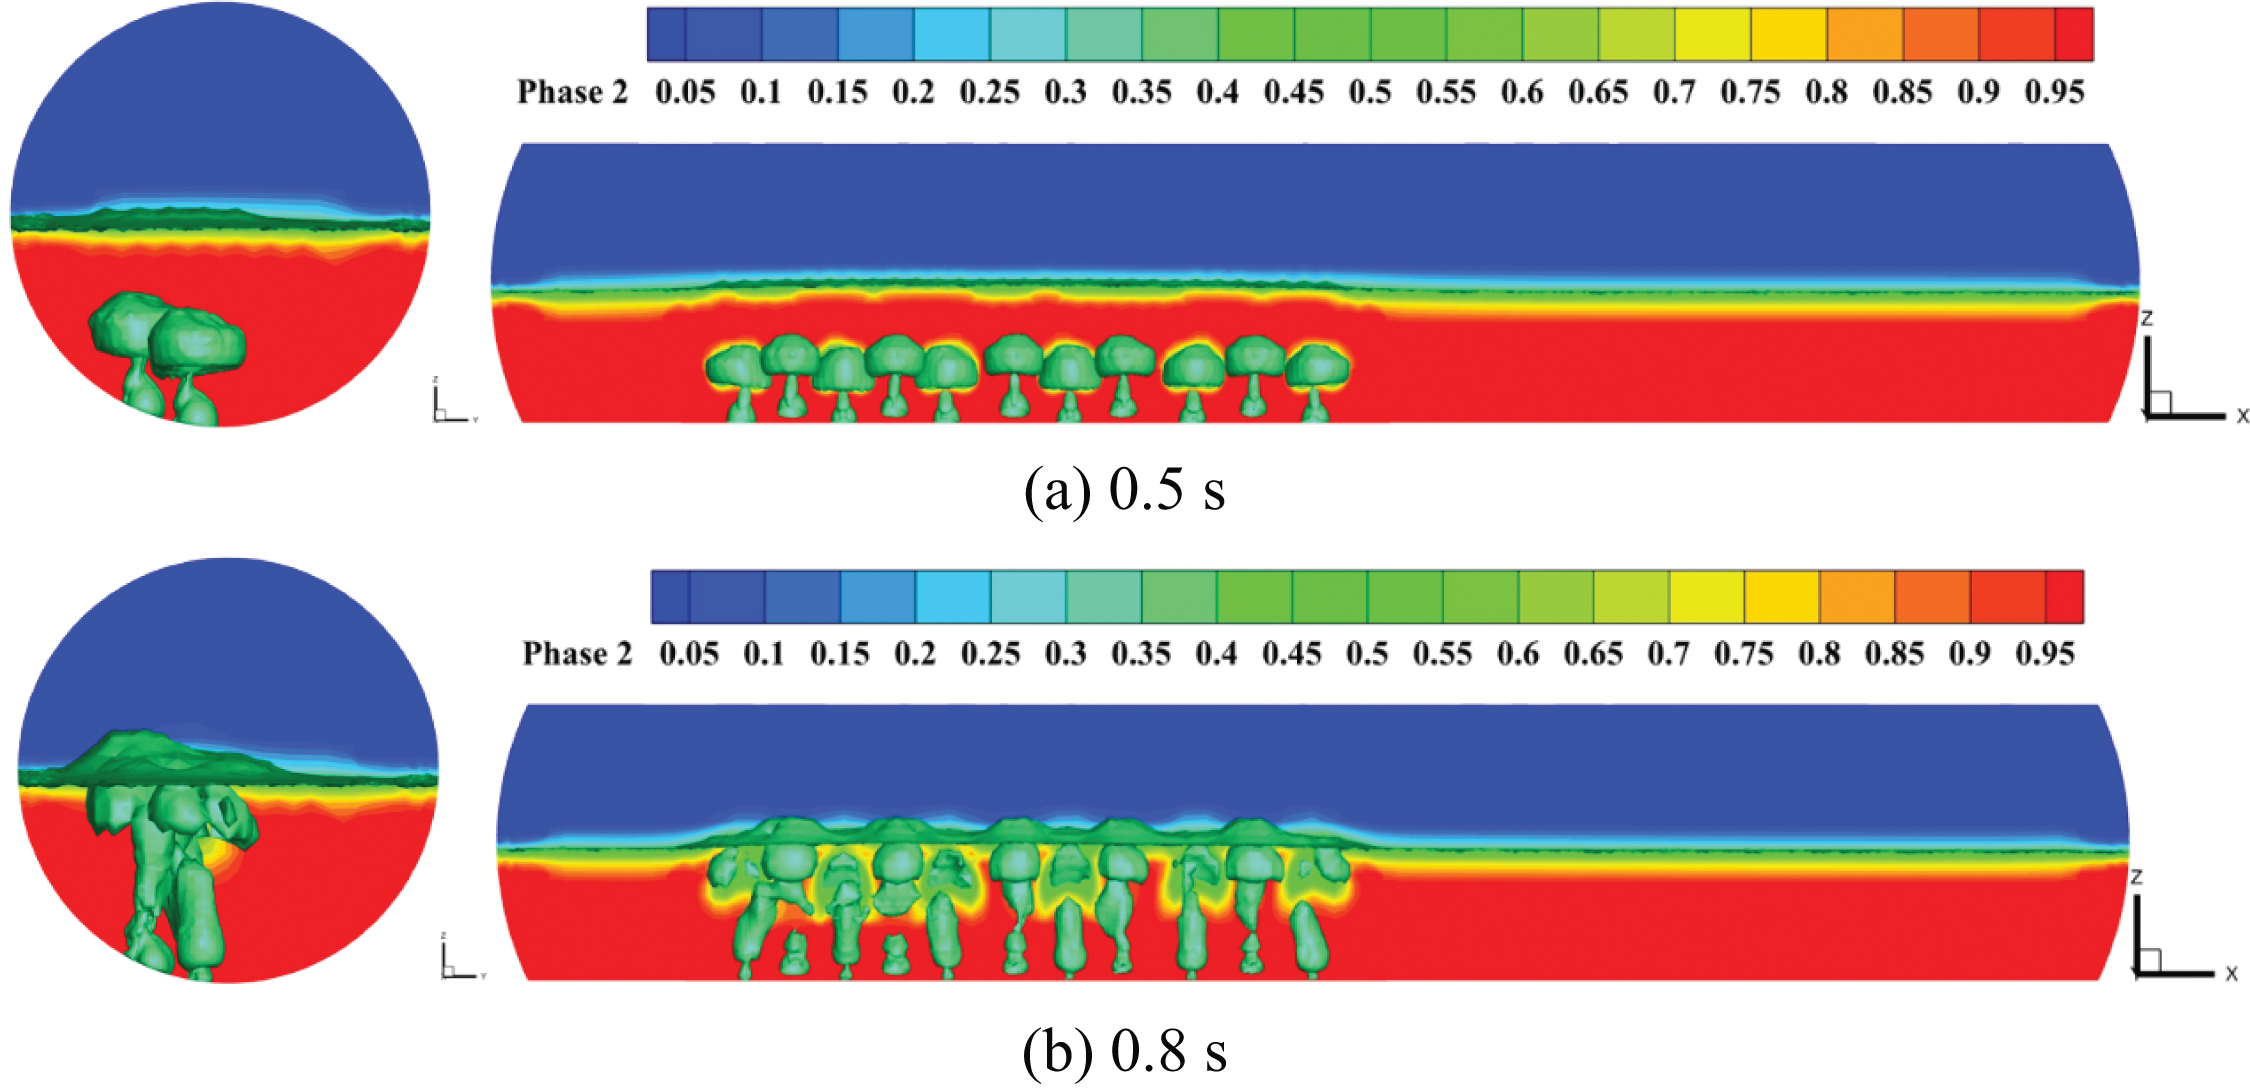
Figure 10: Gas-liquid phase distribution in furnace at different time
Fig. 11 shows the change of gas holdup with time, the variation of gas holdup in the molten pool over time reflects the dynamic distribution and flow state of gas within the molten pool. It can be seen that the change trend of gas holdup under different injection quantities is relatively consistent. Before approximately 0.80 s, the gas in the molten bath is in the accumulation stage, and the gas holdup is continuously increasing. During the interval from 0.80 to 1.60 s, the gas produced by reactions and unreacted oxygen-rich air forms bubbles that break through the liquid surface and enter the flue gas region, leading to a decline in gas holdup within the melt pool. After 1.60 s, bubbles continue to form, the reaction rate increases, and gas holdup gradually rises, stabilizing after 2.40 s, indicating that the stirring effect of injection has reached a steady state and gas holdup achieves dynamic equilibrium. The trend of gas holdup over time aligns well with the changes in average velocity discussed in Section 3.1. At steady state, the gas holdup is 4.03% for an injection rate of 0.50 Nm3/s and 4.22% for 0.80 Nm3/s. An appropriate gas holdup facilitates the creation of an environment conducive to metallurgical reactions, enhances mixing efficiency, promotes chemical reactions, intensifies the smelting process, and maintains the relative stability of the molten pool.
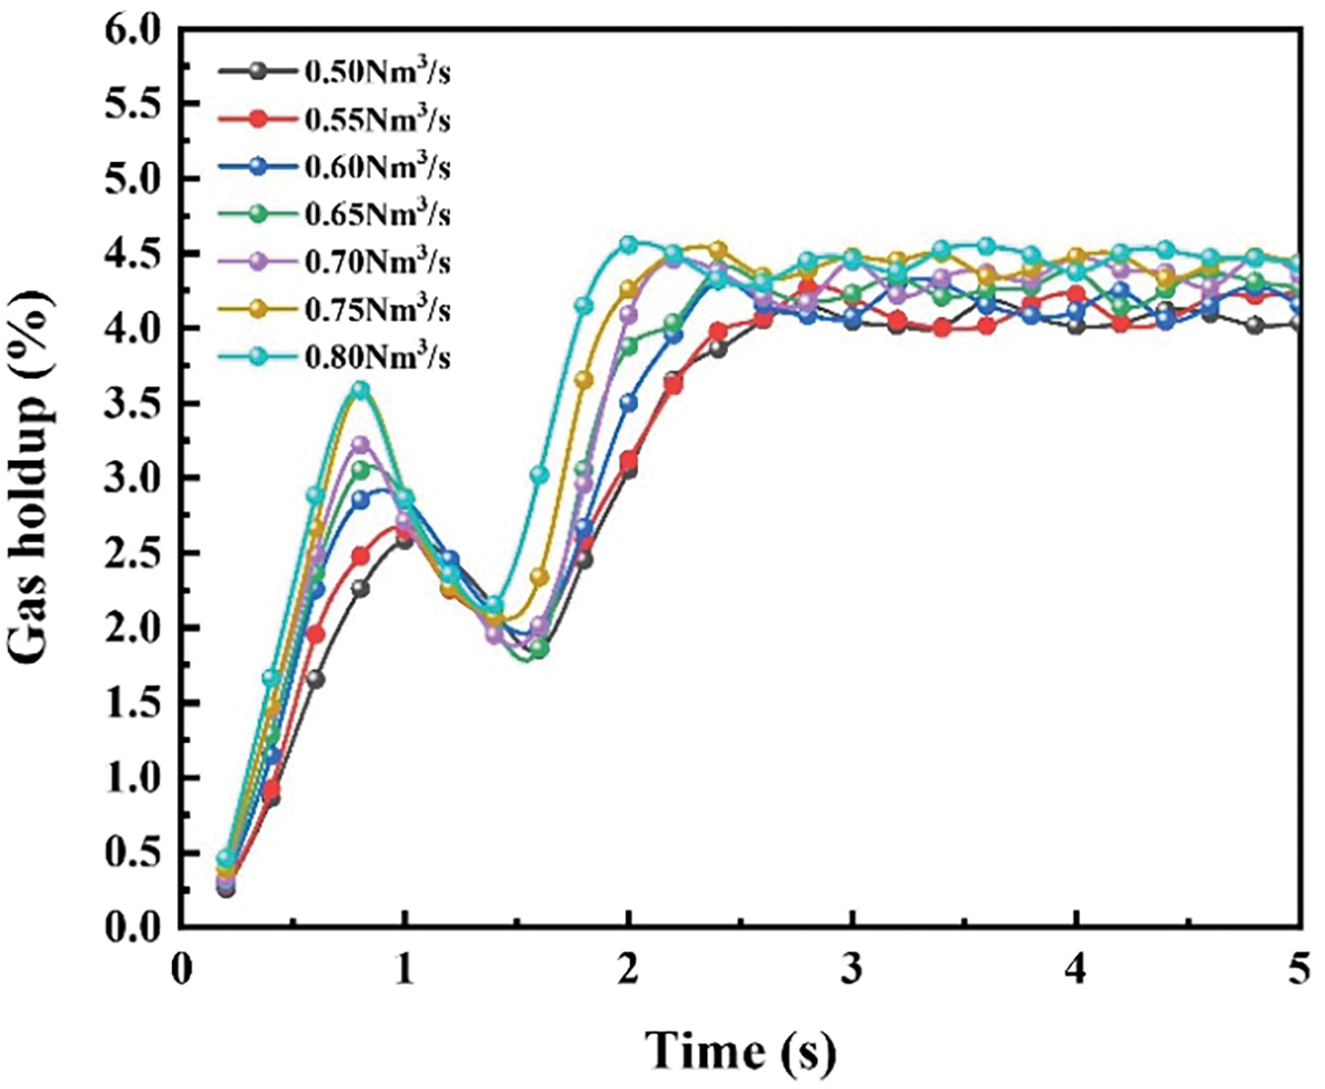
Figure 11: The process of gas holdup changing over time
The height of melt splashing is a critical factor in determining the arrangement, structure, and injection rate of the nozzle. In practical production, the splashing of the melt significantly amplifies the fluctuations and oscillations of the melt surface. The splashed melt ultimately returns to the melt pool under the influence of gravity, greatly enhancing heat transfer within the melt pool and promoting reaction processes. However, excessive splashing height can lead to blockages at the charging port and scouring of the furnace roof, which reduces the service life of the refractory lining and adversely affects the smelting process. Therefore, controlling the melt splashing is crucial. Fig. 12a illustrates the basis for determining the melt splashing height, using the static liquid surface of the melt pool as the reference plane (Z1 = −0.10 m). The maximum height difference between the splashed melt and the free liquid surface is defined as the splashing height H. Fig. 12b shows the splashing state of the melt at a specific moment.
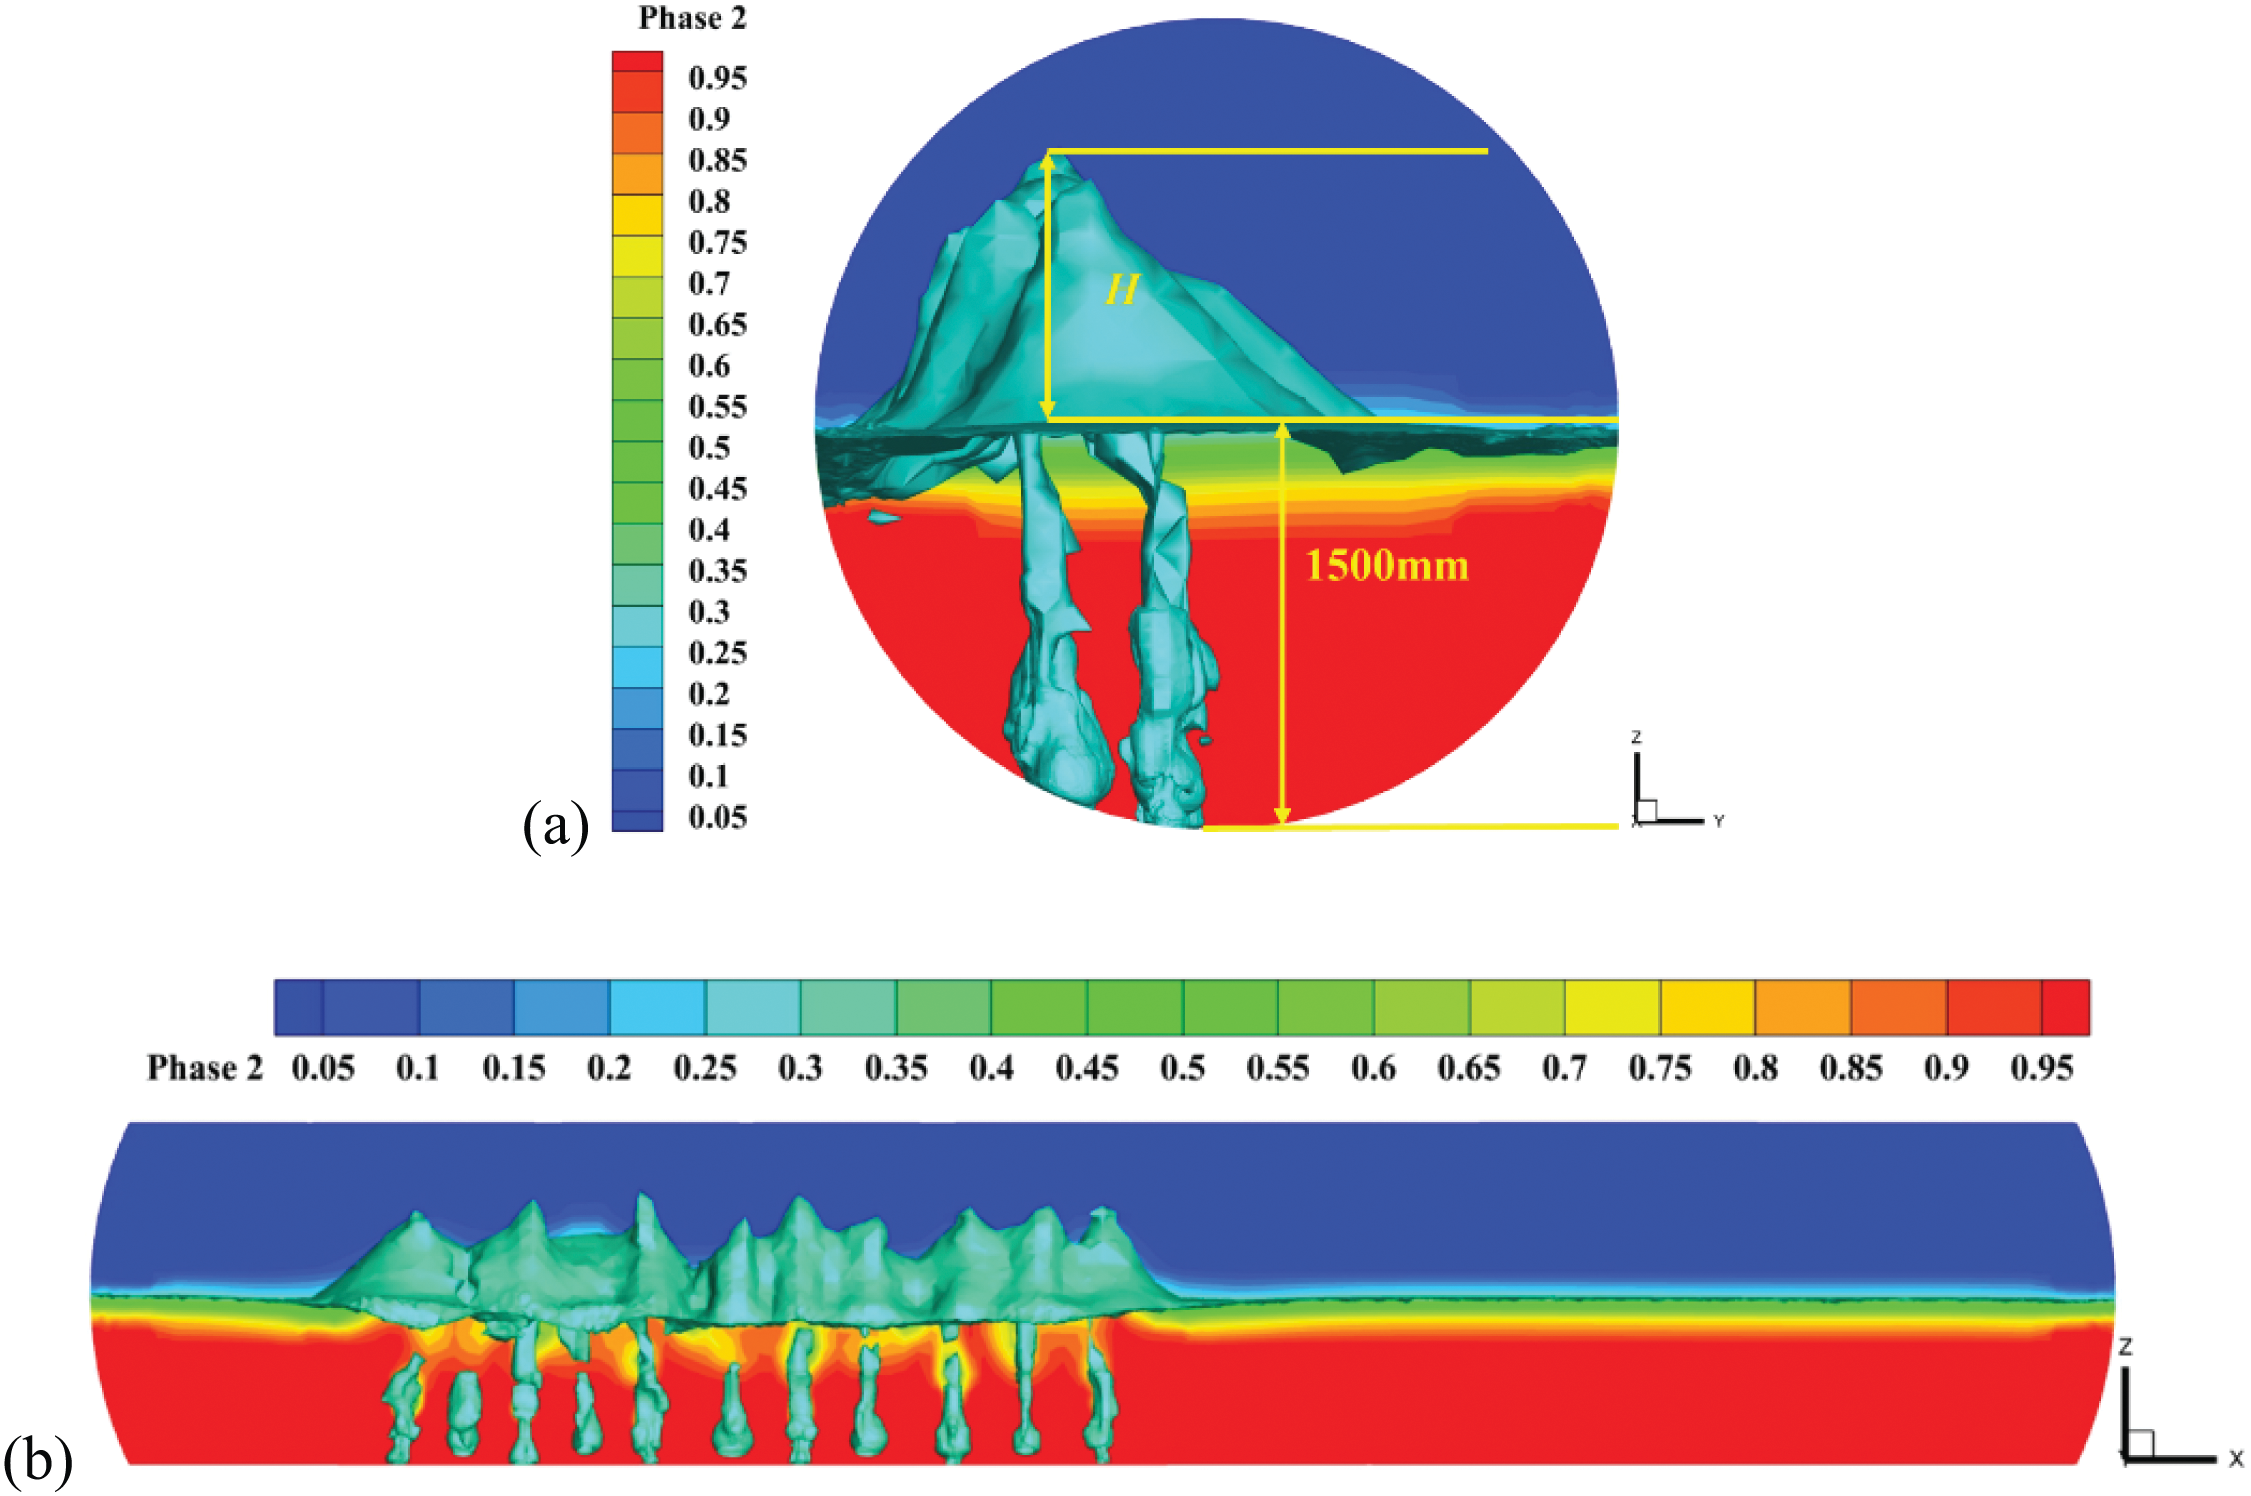
Figure 12: (a) Basis for determining the melt splash height; (b) Melt splash state when injection quantity is 0.80 Nm3/s
Fig. 13 presents the calculated maximum splashing height and its impact range of the melt during the stable injection phase under different injection quantities. It can be observed that as the injection rate increases, both the maximum splashing height and its influence area also gradually increase. When the injection quantities are 0.50 and 0.80 Nm3/s, the melt splash heights are approximately 0.756 and 1.154 m, respectively. It also can be seen that the melt splash height is much lower than the furnace roof height. That is, when the injection quantity is less than 0.80 Nm3/s, there will be no obvious blockage at the charging port and erosion of the furnace roof.
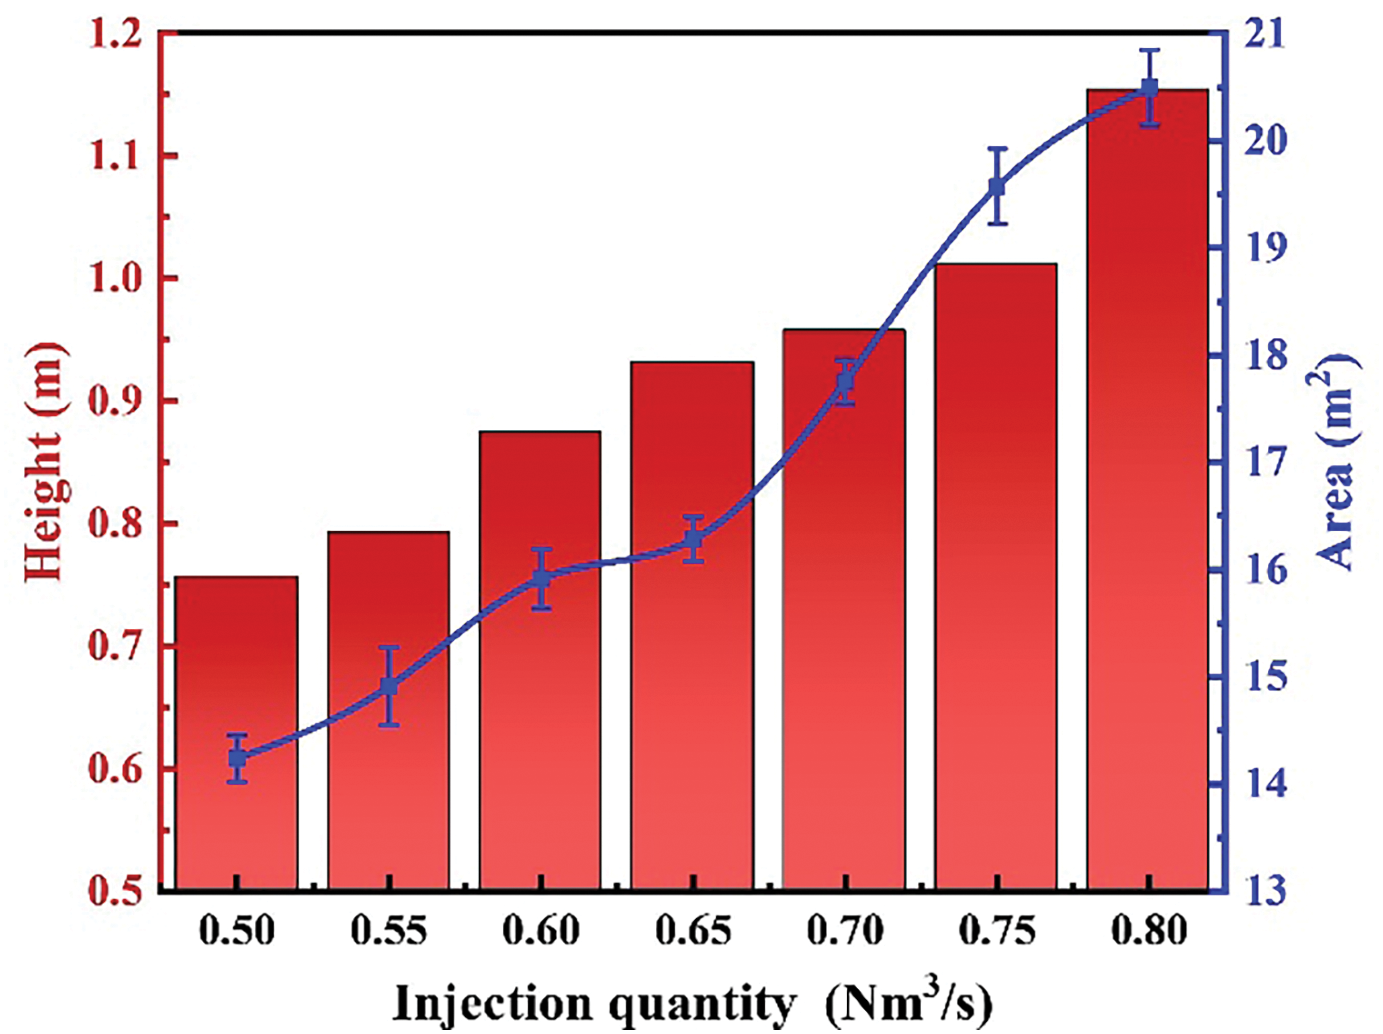
Figure 13: Maximum splashing height and impact area of the melt under different injection quantities
The appropriate melt temperature is crucial for the smooth progress of complex redox reactions within the furnace. In actual industrial production, understanding and mastering the temperature distribution inside the furnace can ensure normal operations while enhancing production efficiency and reducing energy consumption. The variation in furnace temperature is primarily related to factors such as the quality of the raw materials, feed rate, and the amount of oxygen being blown in. Due to the complex high-temperature environment within the smelting furnace, direct measurement of melt temperature is challenging. This study simulates the temperature field and flow field under seven different injection quantities. Fig. 14 shows the temperature distribution in the furnace in the stable stage under different injection quantities. It can be seen that the temperatures of melt and flue gas show a gradually decreasing trend from the reaction region to the settling zone (from left to right in the figure). The highest melt temperature in reaction region is approximately 1281°C, and the highest temperature of outlet flue gas is approximately 1083°C. Due to the thermal conductivity of melt being much greater than that of flue gas, there is a significant temperature stratification in flue gas and melt.
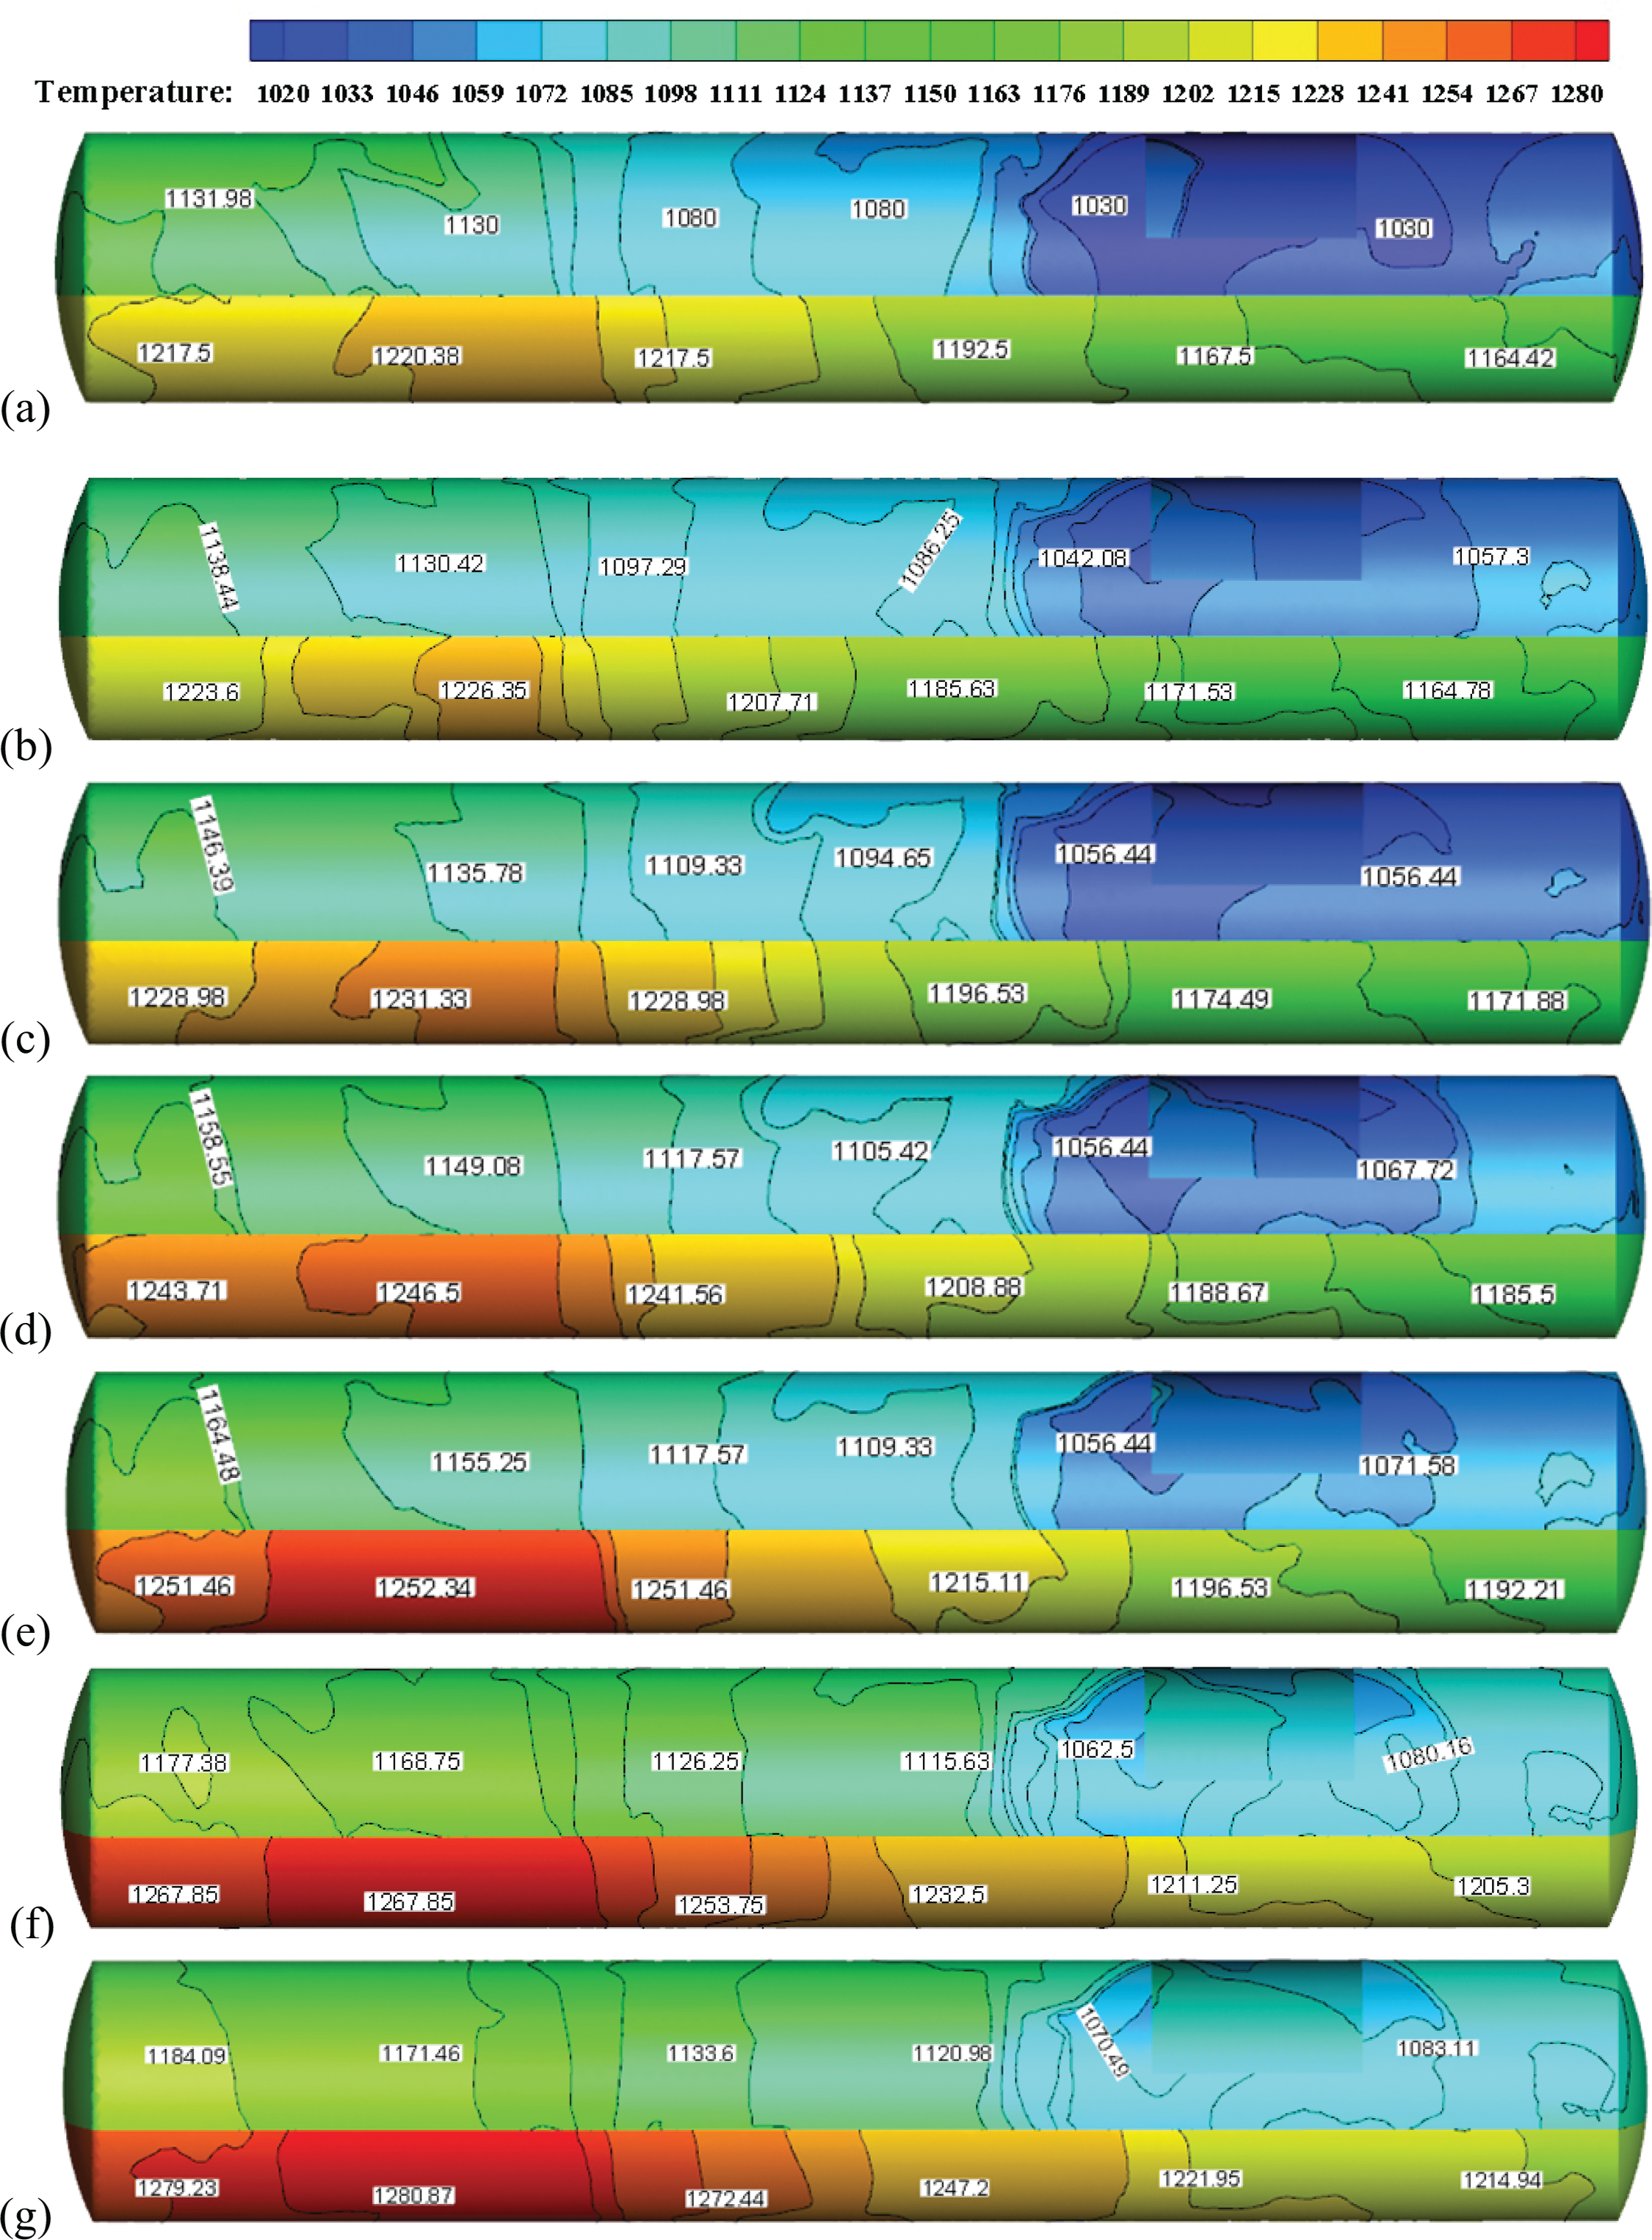
Figure 14: Dynamically stabilized temperature in furnace with different injection quantities: (a) 0.50 Nm3/s; (b) 0.55 Nm3/s; (c) 0.60 Nm3/s; (d) 0.65 Nm3/s; (e) 0.70 Nm3/s; (f) 0.75 Nm3/s; (g) 0.80 Nm3/s
Fig. 15 shows the average temperatures of melt and flue gas under different injection quantities. It can be seen that as the injection quantity increases, the exothermic reaction in furnace is more intense, and the heat release is greater, resulting in an increase in melt temperature. The simulation results show that when the injection quantity increases from 0.50 to 0.80 Nm3/s, the average melt temperature increases approximately from 1220°C to 1257°C, and the average flue gas temperature increases approximately from 1073°C to 1121°C.
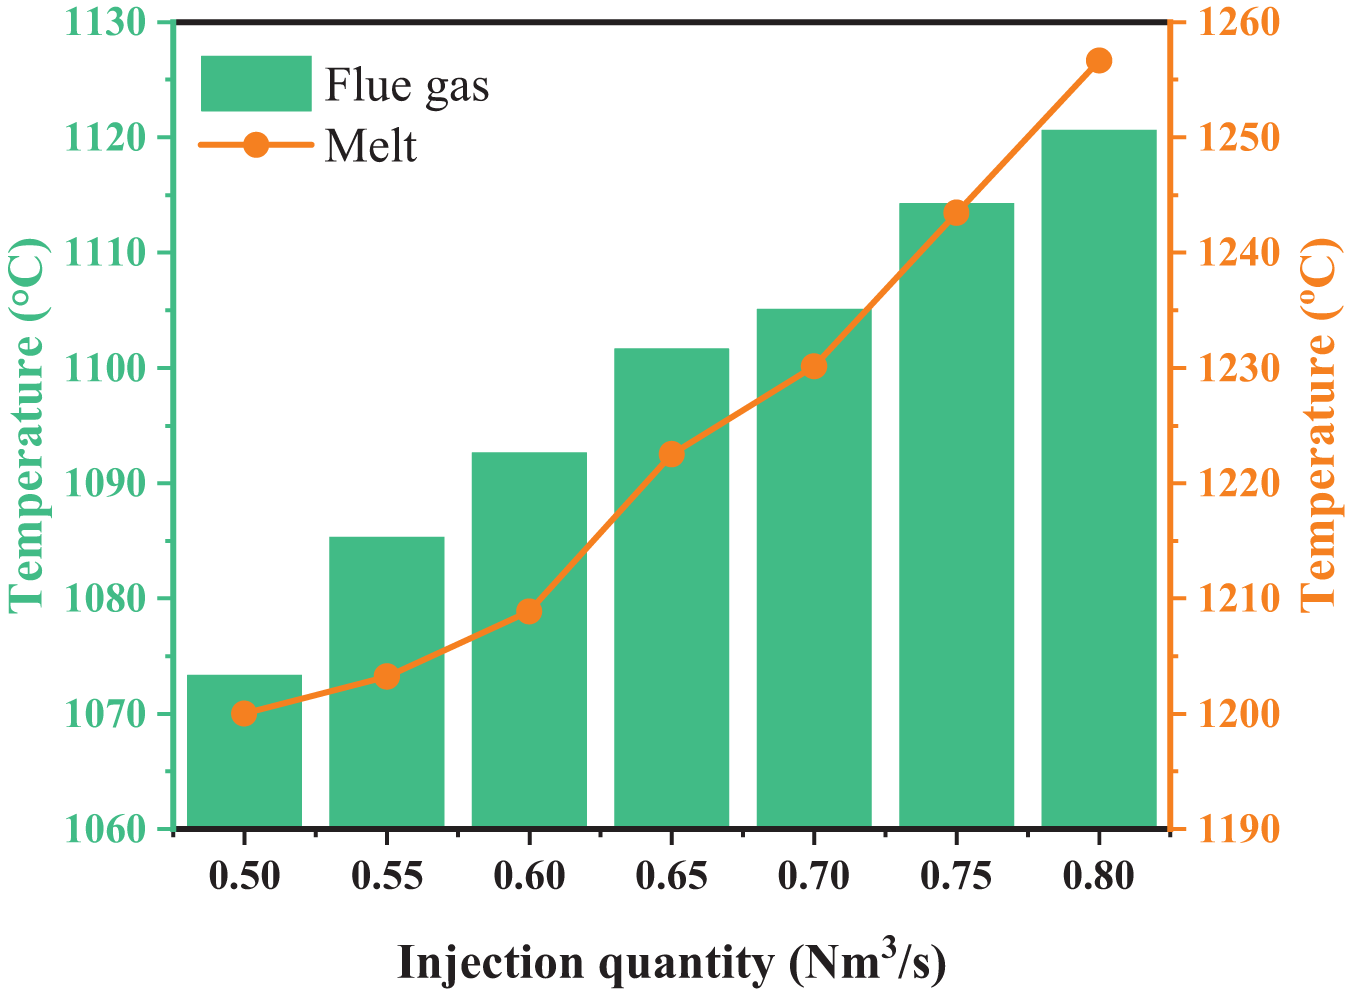
Figure 15: Average temperatures of melt and flue gas at different injection quantities
This paper investigates the flow characteristics and temperature distribution in bottom-blown smelting furnace under different injection quantities, utilizing physical modeling and numerical simulations. By cross-validating with actual production data, it reveals a strong correlation between the distribution of the flow field-temperature field within the furnace and the gas velocity. Effective control of the gas velocity can be achieved by regulating the injection quantity of the gas. Reasonable regulation of the gas velocity can significantly influence the distribution of the flow field and temperature field within the furnace. The main research conclusions are as follows:
(1) The distribution trend of the flow field-temperature field of the melt pool has a good consistency. The high-velocity regions primarily occur near the burner within the reaction region and the flue gas outlet, while low-velocity regions are found close to the furnace walls on either side of the reaction region. Dead regions are located in the sedimentation region, with gas velocities surpassing those of the molten phase.
(2) In terms of flow characteristics. The high-velocity gas injected into the furnace through the bottom-blown lance stirs the melt, resulting in a large turbulent kinetic energy (KTE) in the reaction area. From reaction to the settling area, the KTE gradually decreases. With the increase in injection quantity, the average KTE, gas holdup, and melt splash height continuously increase. When the injection quantity increases from 0.50 to 0.80 Nm3/s, the average velocity of the melt surface rises from 0.505 to 0.702 m/s. Concurrently, the average KTE increases from 0.095 to 0.162 m2/s2, the gas holdup increases from 4.03% to 4.22%, and the melt splash height increases from 0.756 to 1.154 m.
(3) In terms of temperature distribution. Both the melt and flue gas temperatures show a decreasing distribution trend from the reaction to the settling area. With the increase of injection quantity, the temperatures of melt area and flue gas continuously increase. When the injection quantity increases from 0.50 to 0.80 Nm3/s, the average temperature of melt increases from 1200°C to 1257°C, and the average temperature of flue gas increases from 1073°C to 1121°C.
Acknowledgement: The authors acknowledge the support from the State Key Laboratory for the Clean Utilization of Complex Non-Ferrous Metal Resources and Yimen COPPER Corp. Ltd. Technology Center for the on-site technical support in field testing andresearch. The authors especially wish to thank Xiaohui Zhang (Kunming University of Science and Technology) for the assistance provided.
Funding Statement: Supported by Yunnan Fundamental Research Projects (Nos. 202301AT070469, 202301AT070275); Supported by Yunnan Major Scientific and Technological Projects (No. 202202AG050002).
Author Contributions: The authors confirm contribution to the paper as follows: study conception and design, data collection, analysis and interpretation of results, draft manuscript preparation: Teng Xia; conceptualization, resources, writing—review & editing, funding acquisition: Xiaohui Zhang; supervision: Ma Ding, Zhi Yang, Xinting Tong, Yutang Zhao, Hua Wang. All authors reviewed the results and approved the final version of the manuscript.
Availability of Data and Materials: The data that support the findings of this study are available from the corresponding author upon reasonable request.
Ethics Approval: Not applicable.
Conflicts of Interest: The authors declare no conflicts of interest to report regarding the present study.
References
1. Anderson A, Kumar V, Rao VM, Grogan J. A review of computational capabilities and requirements in high-resolution simulation of nonferrous pyrometallurgical furnaces. JOM. 2022;74(4):1543–67. doi:10.1007/s11837-022-05169-4. [Google Scholar] [CrossRef]
2. Coursol P, Mackey PJ, Kapusta JPT, Valencia NC. Energy consumption in copper smelting: a new asian horse in the race. JOM. 2015;67(5):1066–74. doi:10.1007/s11837-015-1380-1. [Google Scholar] [CrossRef]
3. Kapusta JPT. Submerged gas jet penetration: a study of bubbling versus jetting and side versus bottom blowing in copper bath smelting. JOM. 2017;69(6):970–9. doi:10.1007/s11837-017-2336-4. [Google Scholar] [CrossRef]
4. Liu L, Yan HJ, Zhou JM, Gao Q, Zhang ZY, Liu FK, et al. Mechanism and microanalysis of products in the oxygen bottom-blown copper smelting process. Chin J Nonferrous Met. 2012;22(7):1–9 (In Chinese). [Google Scholar]
5. Wang DX, Liu Y, Zhang ZM, Zhang TA, Li XL. PIV measurements on physical models of bottom blown oxygen copper smelting furnace. Can Metall Q. 2017;56(2):221–31. [Google Scholar]
6. Shui L, Cui ZX, Ma XD, Jiang X, Chen M, Xiang Y, et al. A water model study on mixing behavior of the two-layered bath in bottom blown copper smelting furnace. JOM. 2018;70(10):2065–70. doi:10.1007/s11837-018-2879-z. [Google Scholar] [CrossRef]
7. Shui L, Ma XD, Cui ZX, Zhao BJ. An investigation of the behavior of the surficial longitudinal wave in a bottom-blown copper smelting furnace. JOM. 2018;70(10):2119–27. doi:10.1007/s11837-018-3046-2. [Google Scholar] [CrossRef]
8. Huang J, Zhong J, Yi T, Zhang D, Wu Y, Liu F, et al. Water model study on the mixing behaviour of gas-liquid two-phase flow for the SKS lead reduction process in a bottom-blown furnace. Chem Eng Sci. 2024;300:120633. doi:10.1016/j.ces.2024.120633. [Google Scholar] [CrossRef]
9. Wang QM, Guo XY, Tian QH. Copper smelting mechanism in oxygen bottom-blown furnace. Trans Nonferrous Met Soc China. 2017;27(4):946–53. doi:10.1016/S1003-6326(17)60110-9. [Google Scholar] [CrossRef]
10. Schmidt A, Montenegro V, Wehinger GD. Transient CFD modeling of matte settling behavior and coalescence in an industrial copper flash smelting furnace settler. Metallurgical Mater Trans B. 2021;52(1):405–13. doi:10.1007/s11663-020-02026-0. [Google Scholar] [CrossRef]
11. Lu TT, Mu LZ, Xiao YD, Zhao HL, Liu FQ. CFD study on bottom-blown copper smelting furnace with unsymmetric gas injection. J Sustain Metall. 2022;8(3):1235–44. doi:10.1007/s40831-022-00565-1. [Google Scholar] [CrossRef]
12. Shao P, Jiang LP. Flow and mixing behavior in a new bottom blown copper smelting furnace. Int J Mol Sci. 2019;20(22):5757. doi:10.3390/ijms20225757. [Google Scholar] [PubMed] [CrossRef]
13. Liu P, Yang SL, Hu JH, Wang H. Numerical investigation of gas-liquid flow hydrodynamics in three-dimensional bottom-blown reactor via LES-VOF coupled model. Chem Eng Sci. 2023;282(15):119338. doi:10.1016/j.ces.2023.119338. [Google Scholar] [CrossRef]
14. Tan ZK, Yan HJ, Huang RZ, Li Q, Liu L. Investigation on interphase mass transfer coefficient of a deformable bubble with density contrast using phase-field lattice Boltzmann method. Chem Eng Sci. 2024;283:119443. doi:10.1016/j.ces.2023.119443. [Google Scholar] [CrossRef]
15. Guo XY, Jiang BC, Chen JH, Wang QM. Effect of oxygen lance seat arrangement on flow characteristics of large-scale copper smelting bottom-blown furnace. J Central South Univ. 2023;30(8):2542–55. doi:10.1007/s11771-023-5405-6. [Google Scholar] [CrossRef]
16. Jiang BC, Guo XY, Wang QM. Analysis of melt flow characteristics in large bottom-blowing furnace strengthened by oxygen lance jet at different positions. J Sustain Metall. 2023;9(4):1704–15. doi:10.1007/s40831-023-00759-1. [Google Scholar] [CrossRef]
17. Zhao YT, Zhang XH, Tong XT, Yu XL, Luo J, Fu YX, et al. Research on the mixing characteristics of the bottom blowing molten pool based on flow characteristics and mixing uniformity. Phys Fluids. 2024;36:025166. [Google Scholar]
18. Hu J, Yang S, Wang H. VOF study of mesoscale bubble flow dynamics in the side-blown gas-liquid two-phase reactor. Chem Eng J. 2024;480:147983. doi:10.1016/j.cej.2023.147983. [Google Scholar] [CrossRef]
19. Lai K, Yang S, Wang H. VOF-based modeling study of surface oscillation behavior and gas-liquid stirring dynamics in the bottom-blown reactors. Chem Eng J. 2024;501:157450. doi:10.1016/j.cej.2024.157450. [Google Scholar] [CrossRef]
20. Liu YT, Yang TZ, Chen Z, Zhu ZY, Zhang L, Huang Q. Experiment and numerical simulation of two-phase flow in oxygen enriched side-blown furnace. Trans Nonferrous Met Soc China. 2020;30(1):249–58. doi:10.1016/S1003-6326(19)65196-4. [Google Scholar] [CrossRef]
21. Zhao HL, Yin P, Zhang LF, Wang S. Water model experiments of multiphase mixing in the top-blown smelting process of copper concentrate. Int J Miner Metall Mater. 2016;23(12):1369–76. doi:10.1007/s12613-016-1360-7. [Google Scholar] [CrossRef]
22. Ma PF, Liu C, Liu Y, Liu H, Xue JY, Zhao D, et al. Transient heat transfer analysis of double-layer molten pool under severe accident. J Nucl Sci Technol. 2022;59(8):949–60. doi:10.1080/00223131.2021.2023368. [Google Scholar] [CrossRef]
23. Jardón-Pérez LE, Amaro-Villeda AM, Trápaga-Martínez G, González-Rivera C, Ramírez-Argáez MA. Utilization of the planar laser-induced fluorescence technique (PLIF) to measure temperature fields in a gas-stirred ladle. Metallurgical Mater Trans B. 2020;51(6):2510–21. doi:10.1007/s11663-020-01944-3. [Google Scholar] [CrossRef]
24. Jardón-Pérez LE, Conejo AN, Amaro-Villeda AM, González-Rivera C, Ramírez-Argáez MA. Analysis of the effect of gas injection system on the heating rate of a gas stirred steel ladle assisted by physical modeling and PIV-PLIF measurements. ISIJ Int. 2023;63(3):484–91. doi:10.2355/isijinternational.ISIJINT-2022-360. [Google Scholar] [CrossRef]
25. Chen R, Cheng CC, Hu YW, Zhao JY, Zuo Z, Xu JX, et al. Study on bubble formation and heat transfer characteristics and enhanced heat transfer during bottom-blown gas agitation. Appl Therm Eng. 2024;247(11):123066. doi:10.1016/j.applthermaleng.2024.123066. [Google Scholar] [CrossRef]
26. Loktionov V. Modified correlations for the Nusselt numbers at the boundaries of a bottom-heated molten metal layer in a stratified corium melt pool and an assessment of heat transfer conditions during a severe accident. Nucl Eng Des. 2024;416(1):112760. doi:10.1016/j.nucengdes.2023.112760. [Google Scholar] [CrossRef]
27. Jiang R, Sun JK, Mao XP, Liu Q. Numerical simulation of heat transfer behavior in hot spot zone of converter molten bath. Steel Res Int. 2024;95(5):2300646. doi:10.1002/srin.202300646. [Google Scholar] [CrossRef]
28. Chen R, Cheng C, Liu Z, Hu Y, Zhao J, Zuo Z, et al. Heat transfer characteristics during bottom-blown bubble coalescence. Int J Heat Mass Transf. 2024;233:126005. doi:10.1016/j.ijheatmasstransfer.2024.126005. [Google Scholar] [CrossRef]
29. Wan ZH, Yang SL, Kong DS, Li DB, Hu JH, Wang H. Numerical modelling of stirring characteristics of gas−slag−copper matte multiphase flow in bath with top submerged lance. Trans Nonferrous Met Soc China. 2023;33(7):2231–44. doi:10.1016/S1003-6326(23)66255-7. [Google Scholar] [CrossRef]
30. Xi W, Niu L, Song J. Flow field study of large bottom-blown lead smelting furnace with numerical simulation. Metals. 2023;13(6):1131. doi:10.3390/met13061131. [Google Scholar] [CrossRef]
31. Nguyen VT, Park WG. A volume-of-fluid (VOF) interface-sharpening method for two-phase incompressible flows. Comput & Fluids. 2017;152:104–19. doi:10.1016/j.compfluid.2017.04.018. [Google Scholar] [CrossRef]
32. Mulbah C, Kang C, Mao N, Zhang W, Shaikh AR, Teng S. A review of VOF methods for simulating bubble dynamics. Prog Nucl Energy. 2022;154:104478. doi:10.1016/j.pnucene.2022.104478. [Google Scholar] [CrossRef]
33. Akhlaghi M, Mohammadi V, Nouri NM, Taherkhani M, Karimi M. Multi-Fluid VoF model assessment to simulate the horizontal air-water intermittent flow. Chem Eng Res Des. 2019;152:48–59. doi:10.1016/j.cherd.2019.09.031. [Google Scholar] [CrossRef]
34. Shaheed R, Mohammadian A, Kheirkhah Gildeh H. A comparison of standard k–ε and realizable k–ε turbulence models in curved and confluent channels. Environ Fluid Mech. 2019;19(2):543–68. doi:10.1007/s10652-018-9637-1. [Google Scholar] [CrossRef]
35. Strotos G, Malgarinos I, Nikolopoulos N, Gavaises M. Predicting the evaporation rate of stationary droplets with the VOF methodology for a wide range of ambient temperature conditions. Int J Therm Sci. 2016;109:253–62. doi:10.1016/j.ijthermalsci.2016.06.022. [Google Scholar] [CrossRef]
36. Guo XY, Wang QM, Liao LL, Tian QH, Zhang YZ. Mechanism and multiphase interface behavior of copper sulfide concentrate smelting in oxygen-enriched bottom blowing furnace. Nonferrous Met Sci Eng. 2014;5:28–34 (In Chinese). [Google Scholar]
37. Sun JK, Zhang JS, Jiang R, Feng XM, Liu Q. Effect of bottom tuyere arrangement based on impact cavity morphology on kinetic behavior of molten bath in converter. Steel Res Int. 2023;94(1):2200532. doi:10.1002/srin.202200532. [Google Scholar] [CrossRef]
38. Sun JK, Zhang JS, Lin WH, Feng XM, Liu Q. Effect of bottom blowing mode on fluid flow and mixing behavior in converter. Metals. 2022;12(1):117. doi:10.3390/met12010117. [Google Scholar] [CrossRef]
Cite This Article
 Copyright © 2025 The Author(s). Published by Tech Science Press.
This work is licensed under a Creative Commons Attribution 4.0 International License , which permits unrestricted use, distribution, and reproduction in any medium, provided the original work is properly cited.
 Downloads
 Citation Tools