
 Submit a Paper
 Propose a Special lssue
 Open Access
ARTICLE

Numerical Modelling of CO2 Plume Evolution and Dissolution in a Stratified Saline Aquifer
Marine Engineering College, Dalian Maritime University, Dalian, 116026, China
* Corresponding Author: Bohao Wu. Email:
(This article belongs to the Special Issue: Multiphase Fluid Flow Behaviors in Oil, Gas, Water, and Solid Systems during CCUS Processes in Hydrocarbon Reservoirs)
Fluid Dynamics & Materials Processing 2025, 21(10), 2359-2387. https://doi.org/10.32604/fdmp.2025.067651
Received 08 May 2025; Accepted 29 July 2025; Issue published 30 October 2025
 View Full Text
 Download PDF
Abstract
Geological sequestration of carbon dioxide (CO2) entails the long-term storage of captured emissions from CCUS (Carbon Capture, Utilization, and Storage) facilities in deep saline aquifers to mitigate greenhouse gas accumulation. Among various trapping mechanisms, dissolution trapping is particularly effective in enhancing storage security. However, the stratified structure of saline aquifers plays a crucial role in controlling the efficiency of CO2 dissolution into the resident brine. In this study, a two-dimensional numerical model of a stratified saline aquifer is developed, integrating both two-phase flow and mass transfer dynamics. The model captures the temporal evolution of gas saturation, reservoir pressure, and CO2 dissolution behavior under varying geological and operational conditions. Specifically, the effects of porosity heterogeneity, permeability distribution, and injection rate on the dissolution process are examined, and sequestration efficiencies across distinct stratigraphic layers are compared. Simulation results reveal that in the early phase of CO2 injection, the plume spreads radially along the lower portion of the aquifer. With continued injection, high-saturation regions expand upward and eventually accumulate beneath the shale and caprock layers. Pressure within the reservoir rises in response to CO2 injection, propagating both vertically and laterally. CO2 migration and dissolution are strongly influenced by reservoir properties, with progressive dissolution occurring in the pore spaces of individual layers. High-porosity zones favor CO2 accumulation and enhance local dissolution, whereas low-porosity regions facilitate vertical diffusion. An increase in porosity from 0.25 to 0.30 reduces the radial extent of dissolution in the high-permeability layer by 16.5%. Likewise, increasing permeability promotes radial dispersion; each 10 mD increment extends the CO2 dissolution front by approximately 18 m. Elevated injection rates intensify both vertical and lateral plume migration: every 0.25 × 10⁻⁶ m/s increase in rate yields an average 100–120 m increase in radial dissolution distance within high-permeability zones.Keywords
In recent years, the phenomenon of global warming has intensified, posing a significant threat to human survival and the sustainable development of society. The primary cause of the issue is the substantial emission of anthropogenic greenhouse gases, of which carbon dioxide (CO2) is the primary contributor, with its emissions reaching record levels in recent years [1,2,3]. To address the greenhouse effect caused by CO2 emissions, the international community has proposed a series of emission reduction measures aimed at mitigating climate change [4,5]. Among these, Carbon Capture, Utilization, and Storage (CCUS) has emerged as a promising technology for greenhouse gas mitigation, attracting widespread attention and research [6,7]. CO2 geological storage involves the use of depleted reservoirs, such as depleted oil and gas reservoirs and certain deep saline aquifers, to store captured CO2 from CCUS facilities [8]. These geological formations are widely recognized for the potential distribution characteristics of CO2, suitable porosity and permeability, and the stable chemical properties required for long-term CO2 storage [9,10]. In particular, deep saline aquifers are considered promising targets for CO2 storage due to the storage capacity. The saline aquifers typically consist of high-porosity and high-permeability sandstone, coupled with low-permeability and low-porosity shale layers, which effectively restrict the upward migration of CO2 [11].
The detailed process of CO2 sequestration involves injecting captured CO2 into deep geological formations, where the temperature and pressure exceed the critical point of CO2 (T = 31.18°C, P = 7.38 MPa), thereby transforming CO2 into a supercritical state. The density of subsurface supercritical CO2 under reservoir conditions ranges from 250 to 800 kg/m3, while such density remains significantly lower than that of formation water or brine. Due to the low solubility of CO2 in brine, the injected CO2 persists as a separate fluid phase for a considerable timescale, exhibiting a strong upward migration derived from buoyancy. Consequently, the target formation must possess high porosity to accommodate sufficient storage volume, suitable permeability to support large injection rates, and be overlain by low-permeability layers to impede the gravity override of the in-situ fluids. Numerous formations have been identified globally, demonstrating huge storage potential of the deep saline aquifers [12]. For instance, the Sleipner project in the North Sea Basin of Norway represents the longest-running CCS project in deep saline aquifer, with CO2 injection operations commencing in 1996. In the Sleipner area, the Middle Jurassic sandstone reservoir, located at a depth of approximately 3450 m, is utilized for the production of CO2-containing hydrocarbons, while the separated CO2 is injected into a shallower, 250-m-thick Miocene Utsira Formation sandstone saline layer, with a minimum depth of about 800 m [13].
While implementation strategies for geological carbon sequestration differ across projects, CO2 leakage persists as a critical risk requiring rigorous reservoir assessment. Such leakage can arise from multiple failure mechanisms, occurring at the surface, within injection wells, or in the storage reservoir, with typical pathways including natural faults or fractures, caprock imperfections, and hydraulically induced fractures. In the event of CO2 leakage, substantial amounts of CO2 may be released back into the atmosphere, undermining sequestration efforts and leading to operational failure. Furthermore, the leaked CO2 and associated formation fluids may migrate to shallower strata, posing a potential risk of contaminating underground water resources [14]. Numerous studies have investigated CO2 storage in deep reservoirs through experimental and numerical simulations [15,16,17,18,19], often assuming homogeneous and isotropic properties. However, few researches address numerical simulations of CO2 storage in stratified saline aquifers. Yet, most potential geological formations exhibit layering due to sedimentary and erosional processes [20]. Shale layers with low permeability are interbedded within sandstone layers with high permeability, as the structural heterogeneity governs CO2 plume migration and capillary trapping mechanisms in the reservoir. Although the low-permeability layers may not prevent the upward migration of CO2, they play a critical role in mitigating CO2 leakage, particularly in the presence of unanticipated faults in the caprock [21].
Experimental research on CO2 sequestration in stratified saline aquifers primarily focuses on core displacement experiments, reactions between minerals and supercritical CO2, and CO2 dissolution in brine [22]. Kim et al. [23] investigated the two-phase flow behavior of CO2 and brine in highly heterogeneous conglomerate core samples under reservoir conditions using experimental methods. Similarly, Bakhshian et al. [24] examined the impact of anisotropy in Tuscaloosa sandstone on the relative permeability and capillary pressure of the CO2-brine system in both horizontal and vertical directions. The study employed the steady-state method to conduct CO2-brine imbibition experiments under reservoir conditions, with X-ray scanning used to monitor saturation changes. The results revealed that the stratified structure of the rock induces anisotropic behavior in relative permeability curves, with horizontal samples exhibiting higher permeability than vertical samples. The capillary pressure curves of horizontal samples showed greater variability, reflecting stronger heterogeneity in the horizontal direction.
Simulation studies on CO2 sequestration in stratified saline aquifers primarily focus on macroscopic site-scale modeling. Khudaida et al. [25] employed the STOMP-CO2 simulation code to develop three-dimensional homogeneous and heterogeneous models based on geological parameters from the Sleipner Vest field in the Norwegian North Sea. Their study evaluated the effects of various injection strategies, geological heterogeneity, anisotropy, and well orientation on CO2 storage efficiency and dissolution trapping mechanisms. The results revealed that heterogeneous formations augment residual trapping, while homogeneous formations facilitate CO2 dissolution due to faster fluid migration. Cyclic injection in heterogeneous models improved trapping efficiency by increasing capillary pressure, with storage efficiency rising as the vertical-to-horizontal permeability ratio increased. Ganesh et al. [26] developed a simplified physical model for CO2 plume migration in a stratified aquifer-caprock system, conducting detailed simulations using CMG-GEM to account for vertical reservoir heterogeneity and limited caprock permeability. Through parametric analysis, key dimensionless parameters were identified, and a response surface model was proposed to rapidly predict the maximum lateral extent of the CO2-brine interface. Goto et al. [27] constructed stratified models to examine the influence of permeability and depth on gravity variations induced by CO2 sequestration. Their findings indicated that permeability and depth affect both gravity changes and detection timing. In low-permeability settings, gravity reduction intensifies post-injection, whereas in high-permeability settings, gravity decreases later during injection and increases after cessation. Stratified characteristics were found to significantly impact monitoring feasibility. Wang et al. [28] found that the spreading of CO2 plumes intensifies mixing and dissolution, with dissolution being governed by heterogeneity. Consequently, the dissolution efficiency of CO2 is often underestimated. Therefore, further research on CO2 dissolution in heterogeneous reservoirs is needed to improve the understanding of CO2 plume evolution in stratified saline aquifers.
Although previous studies have investigated heterogeneous saline aquifers, the migration and dissolution mechanisms of CO2 in stratified saline aquifers remain incompletely understood. Therefore, this study employs numerical simulations to construct a two-dimensional stratified saline aquifer model representative of subseafloor conditions. The model elucidates the temporal evolution of gas-phase saturation, reservoir pressure, and CO2 dissolution characteristics within the stratified saline aquifer. The effects of porosity heterogeneity, permeability distribution, and injection rate on the CO2 dissolution process are systematically explored, and the storage efficiency across different layers is compared under the influence of key controlling factors.
2.1 Two-Phase Flow Displacement Processes in Porous Media
The present study employs a two-phase flow model to investigate CO2 migration in stratified saline aquifers. The injected CO2 overcomes formation pressure, migrates upward, and becomes trapped beneath the caprock. The variable capillary pressure within the saline aquifer, predominantly driven by buoyancy forces with minor contributions from viscous forces, arises from the density contrast between brine and CO2. A coupled model of two-phase flow in porous media is presented, accounting for interactions between the non-wetting and wetting phases. In this model, the seepage of CO2 in the saline aquifer is integrated with the brine flow process, governed by the mass conservation law and Darcy’s law, as expressed in Eq. (1).
Under the assumption of two-phase flow in the formation pores, the sum of the saturations of the two phases equals 1, as expressed in Eq. (3).
The capillary pressure
By summing the conservation equations for all phases, the integrated conservation Eq. (7) is obtained.
The calculation equation for the total mass source
To investigate the simultaneous flow of wetting and non-wetting phase fluids, the two-phase flow form of Darcy’s law is employed, incorporating the geological parameter of relative permeability. Referencing prior studies, the Brooks and Corey model is adopted as the expressions of the relative permeability, as expressed in Eqs. (9) and (10) [31]. This model maintains consistency with the key parameter
The thermophysical properties of supercritical CO2, such as viscosity and density, vary with temperature and pressure. The equation is applicable within a pressure range of 15 MPa to 40 MPa and a temperature range of 273 K to 553 K [32].
The CO2 density calculation equation is given by Eq. (11).
The CO2 viscosity calculation equation is given by Eq. (12).
2.2 Mass Transfer Processes in Porous Media
In a multicomponent multiphase system, the migration of the dissolved phase in porous media is governed by convection and diffusion. Based on the law of mass conservation, a convection-diffusion equation is formulated. To describe the distribution and dynamic behavior of the gas phase in the liquid phase, the concentration transport model of the gas phase component is expressed as Eq. (13).
In this model,
In this study, to facilitate the analysis and discussion of subsequent results, the dissolution characteristics of CO2 are characterized using the concentration ratio. The concentration ratio is defined as the ratio of the CO2 dissolution concentration calculated by the non-equilibrium mass transfer model to the CO2 concentration in the liquid phase at equilibrium, as expressed by Eq. (15).
3.1 Establishment of the Geometric Model
The present study targets the Enping 15-1 offshore CO2 storage demonstration project in the Pearl River Mouth Basin as the reservoir, establishing a simplified model for supercritical CO2 storage in the stratified saline aquifer. The model parameterizes the plume migration and mass transfer behavior of CO2 in the stratified reservoir. The saline aquifer is simplified into a two-dimensional radial model with a geometric height of 149 m and a radial distance of 600 m. The model consists of four high-permeability sandstone layers and three low-permeability shale layers. The high-permeability sandstone layers, from bottom to top, have thicknesses of 50 m, 30 m, 30 m, and 30 m, respectively, while the low-permeability shale layers are each 3 m thick. The model comprises impermeable caprock layers at the upper and lower boundaries, and the inlet of the CO2 injection is set along the left margin of Saline Aquifer 1 (Fig. 1a).
The selection of key reservoir parameters is based on geological measurement data from the Enping 15-1 project reservoir, which consists of a layered structure with alternating shale and sandstone deposits, capable of serving as a sealing mechanism [33,34,35]. In this study, the sandstone layer is assigned a typical permeability value of 50.65 mD and a porosity of 0.25. The permeability and porosity of the shale layers are typically several orders of magnitude lower than those of the sandstone layers [36,37,38]. In this study, the shale layer is assigned a representative permeability of 0.5065 mD and a porosity of 0.1025. The initial residual brine saturation and CO2 residual saturation are parameterized based on the Brooks and Corey model, with reference to experimental data on the saturation distribution of CO2-brine systems, to ensure the accuracy of two-phase flow simulations [24]. Key model parameters are summarized in Table 1. Furthermore, Fig. 1b delineates a specific model with vertically varying permeability in a depth-stratified reservoir, and the geological implications of which are analyzed in Section 4.4.2 in detail. CO2 is injected at a constant rate for a duration of 1000 days. The temperature and pressure in the saline aquifer exceed the critical point of CO2, resulting in the injected CO2 existing in a supercritical state.
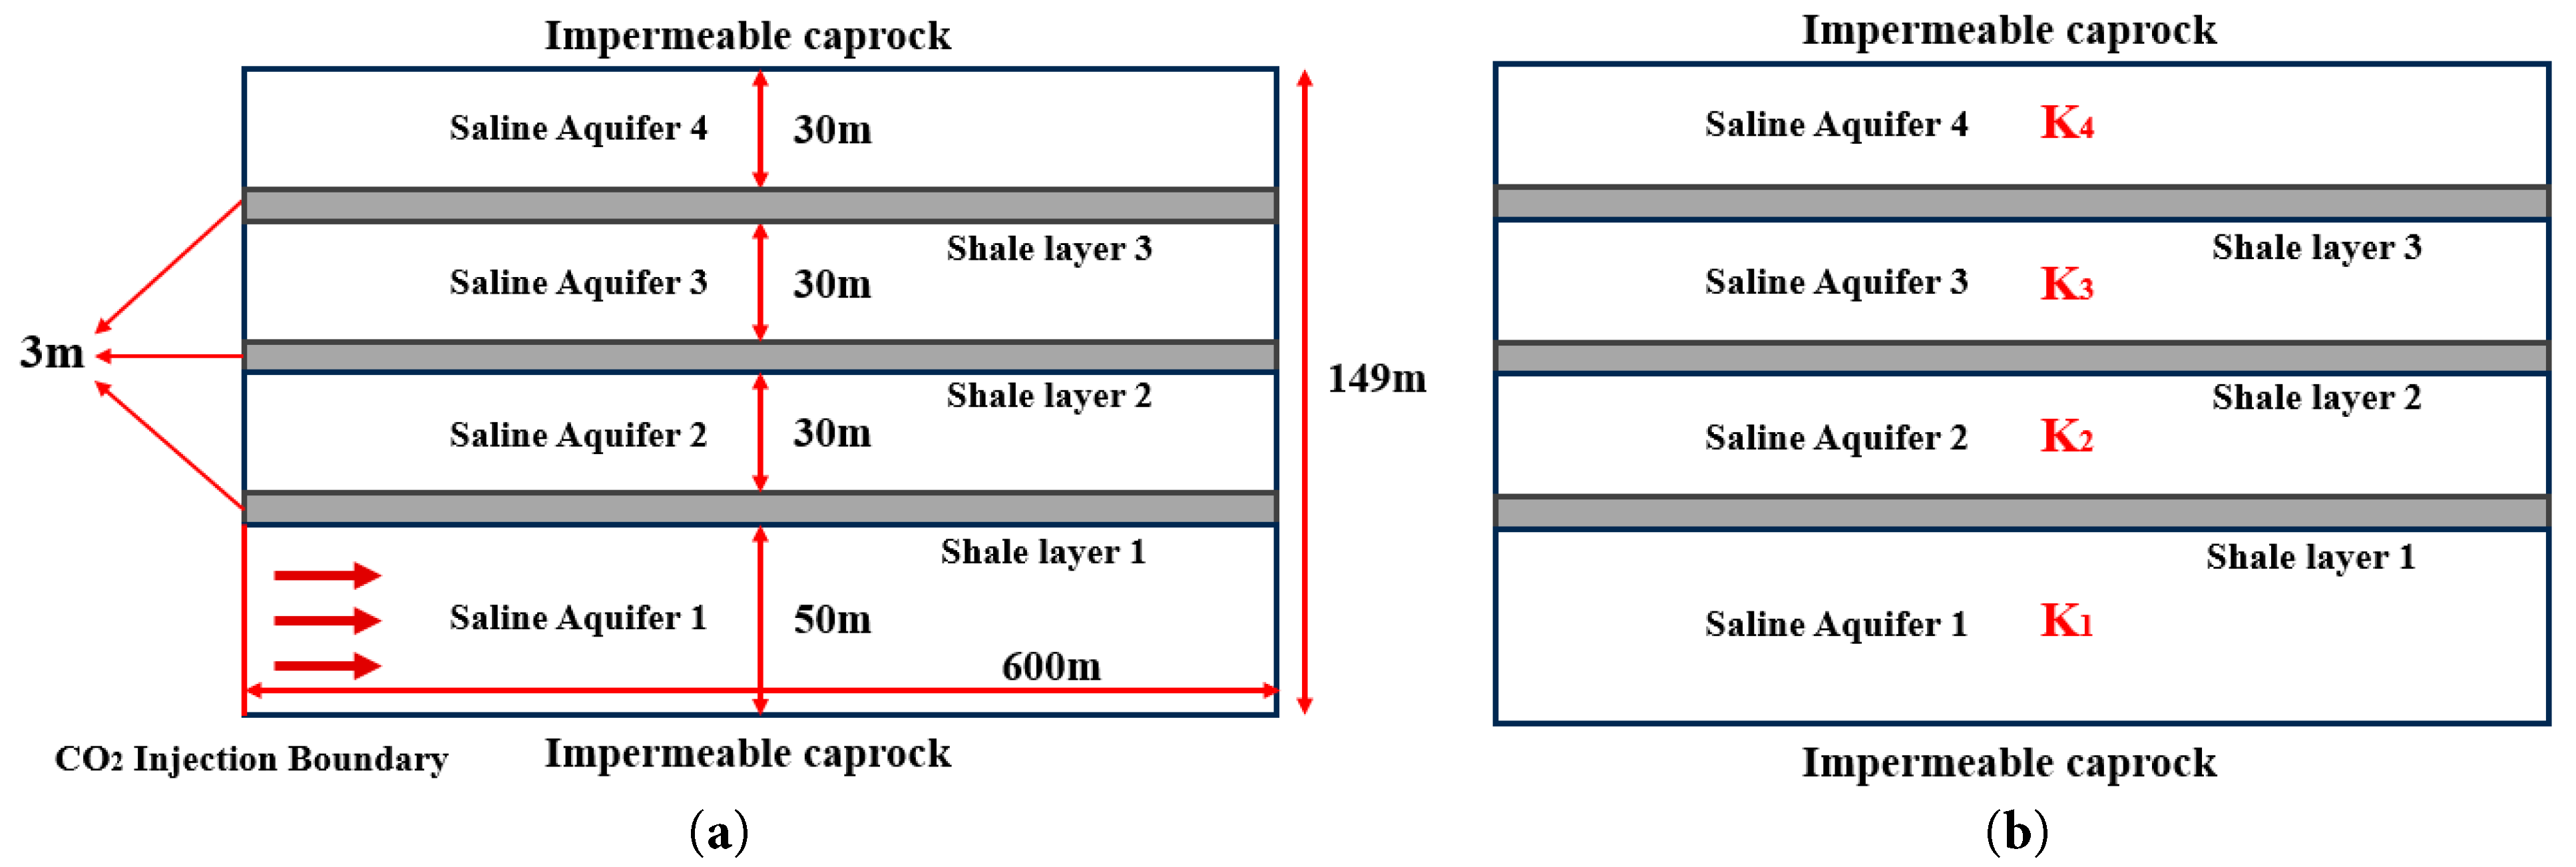
Figure 1: Schematic diagram of the stratified geometry of the two-dimensional radial model. (a) Geometric configuration of the model; (b) a specific model with depth-stratified permeability architecture.
In this study, the compressibility of CO2 is considered, as expressed by Eq. (11), as a function of temperature and pressure to reflect its compressible behavior in the supercritical state. This ensures that the model accurately simulates the flow dynamics of CO2 in high-pressure reservoirs. Meanwhile, brine is assumed to be an incompressible fluid with a constant density of 1020.7 kg/m3 to simplify calculations and maintain model stability. The geochemical reactions between CO2, minerals, and groundwater typically induce significant alterations in pore structure and permeability over timescales spanning decades to centuries [11]. Consequently, within the simulation timeframe of this study, the influence of chemical reactions is relatively minor, and changes in porosity and permeability can be considered negligible.
The CO2 injection process at a constant rate in the stratified saline aquifer was simulated based on the following assumptions, and the CO2 transport and dissolution mechanisms were analyzed in detail.
- (1)Darcy’s law applies to two-phase flow of CO2 and brine at low fluid velocities.
- (2)The stratified saline aquifer is isothermal, indicating that rock and fluid properties do not vary with temperature and are primarily influenced by pressure.
- (3)This study focuses on the long-term migration and dissolution behavior of CO2 plumes, without considering thermal-hydraulic-mechanical (THM) coupling effects, and assumes no heat exchange between fluids.
- (4)There is fluid exchange between the stratified saline aquifer and the shale layer, and no fluid exchange with the upper and lower cap layers.
Table 1: Main parameters of the model.
| Parameters | Value |
|---|---|
| Injection temperature (K) | 325.15 |
| Initial pressure of saline aquifers (MPa) | 18 |
| Porosity of saline aquifer (%) | 0.25 |
| Permeability of saline aquifer (mD) | 50.65 |
| Porosity of the shale layer (%) | 0.1025 |
| Permeability of the shale layer (mD) | 0.5065 |
| Residual CO2 saturation (%) | 0 |
| Residual brine saturation (%) | 0.3 |
| Length of the saline aquifer (m) | 600 |
| Width of the saline aquifer (m) | 149 |
| Pore size distribution index | 2 |
| Brine density (kg/m3) | 1020.7 |
| Brine viscosity (mPa·s) | 0.6881 |
| Diffusion coefficient of CO2 in brine (m2/s) | 2 × 10⁻⁹ |
| Total interfacial mass transfer rate of CO2 in brine (s−1) | 1 × 10⁻⁵ |
| CO2 equilibrium concentration (kg/kg) | 0.05 |
| Injection velocity (m/s) | 0.4475 × 10⁻⁶ |
3.2 Initial and Boundary Conditions
The initial pressure and temperature conditions in the model developed in this study are given in Eqs. (16) and (17). The initial temperature is employed to define the thermodynamic state of the model at t = 0, enabling the computation of the initial density and viscosity of CO2.
The hydrothermal boundary conditions at the left boundary are given by Eqs. (18) and (19).
The coupled model incorporates four primary variables: gas-phase saturation (
To validate the accuracy of the two-phase flow displacement model, present study conducted an analysis by assessing its performance in simulating the displacement process of CO2 and brine within the stratified saline aquifer. The specific methodology involved comparing the CO2 saturation distribution results obtained from the model with simulation results reported in previous literature. The gas-phase saturations computed by Vivek et al. [39] were adopted as the reference benchmark. The reliability of the developed numerical model was confirmed by analyzing the variation in gas-phase saturation as a function of radial distance in the saline aquifer. As shown in Fig. 2, the simulation results indicate that during the initial stage of the CO2-driven brine displacement process, CO2 saturation is elevated near the injection boundary, progressively decreasing with increasing radial distance. The saturation variations observed at different radial distances exhibit strong consistency with the numerical results reported by Vivek et al. [39].
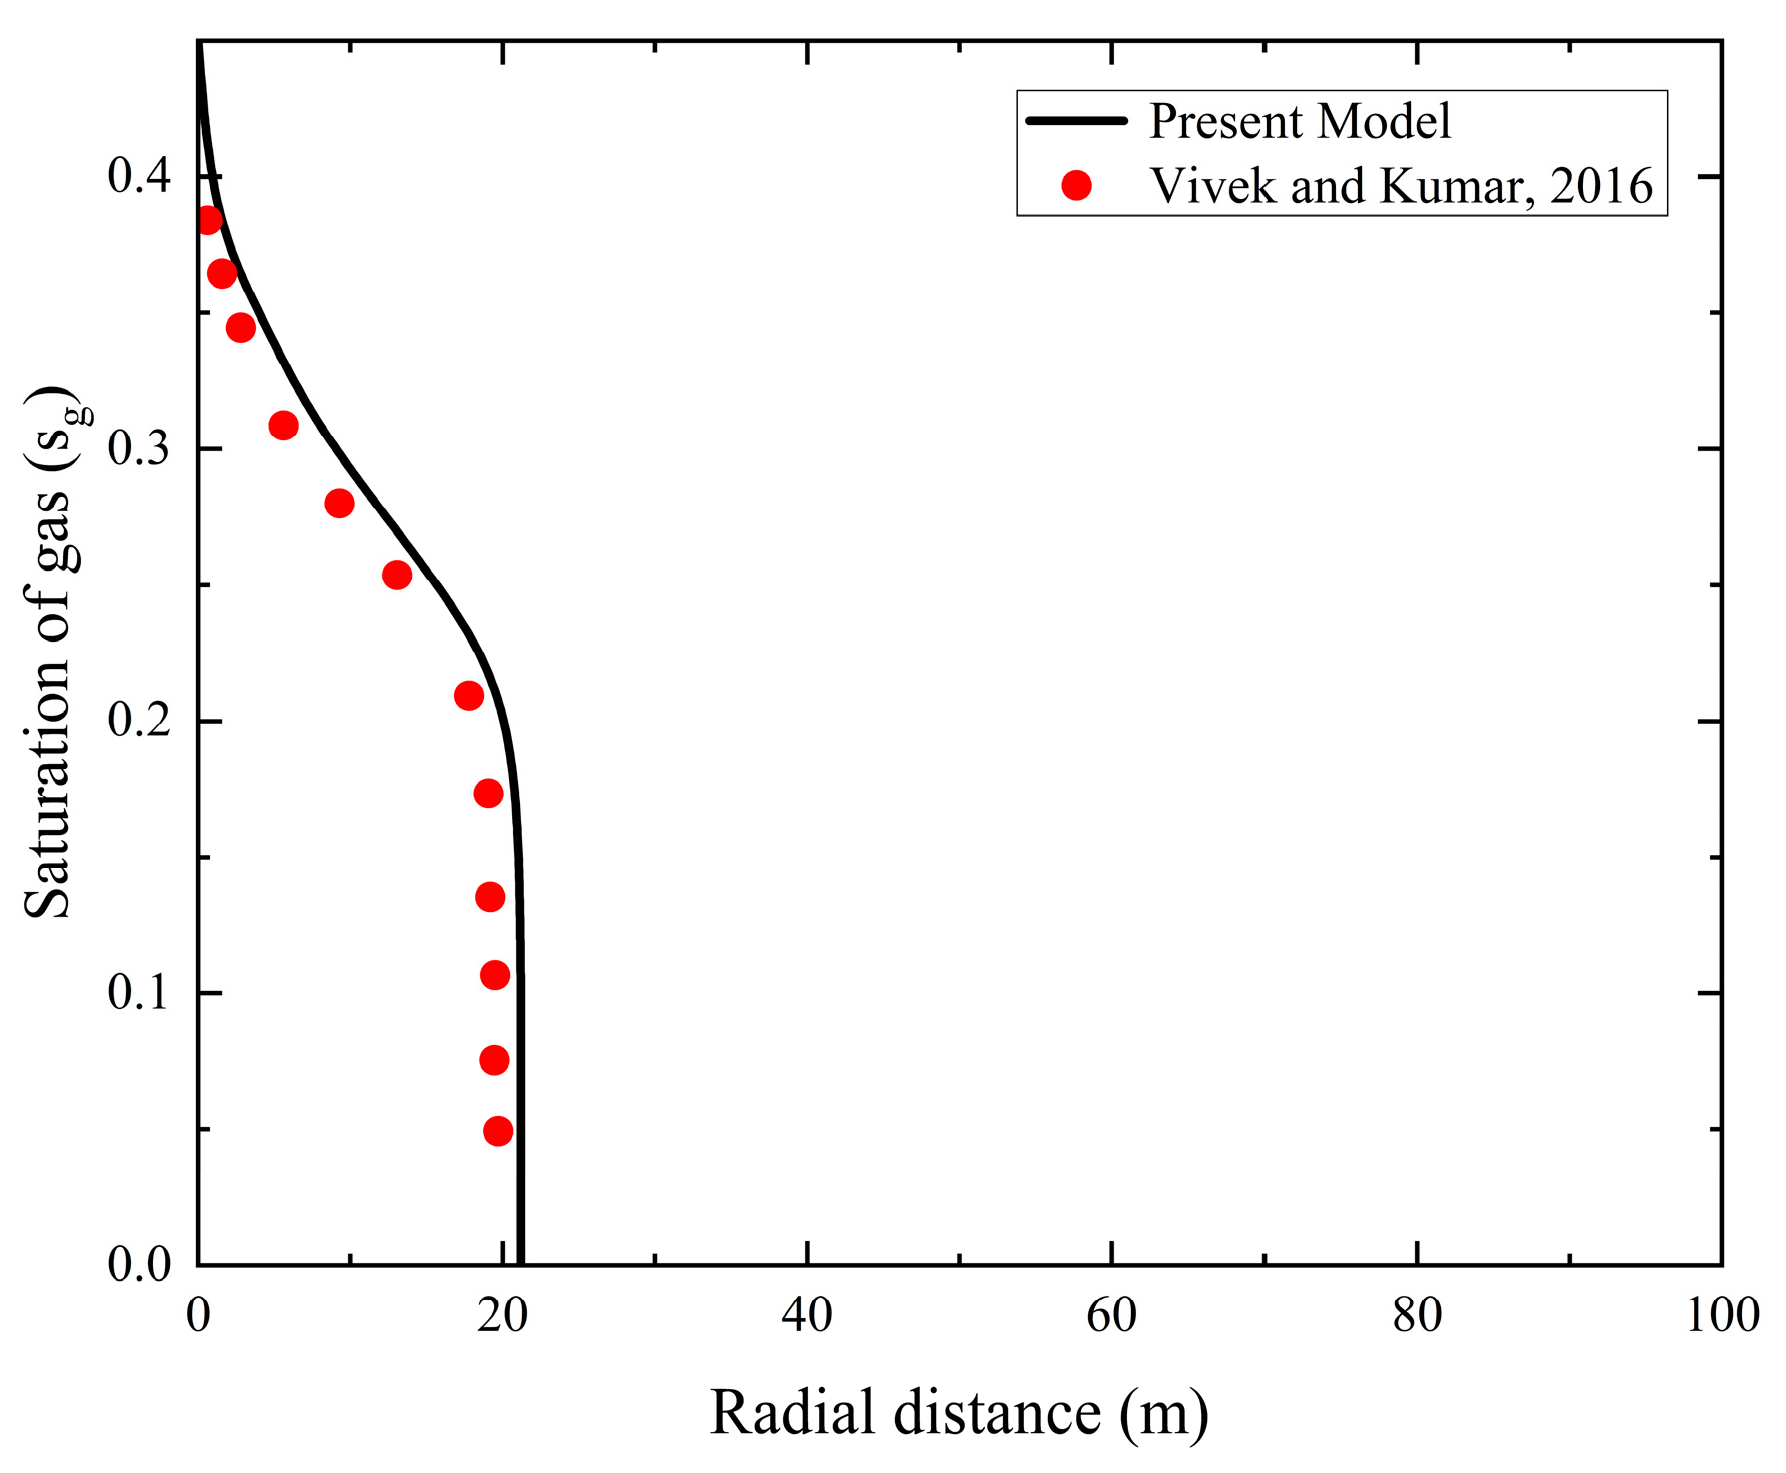
Figure 2: Comparison of the computational results of the model developed in this study with the simulation results of Vivek et al. [39].
4.2 Grid Independence Verification
In numerical simulations, grid independence verification was conducted to evaluate how grid quality affects the numerical solution and its convergence, thereby enabling reasonable control of computational time costs and enhancing the accuracy of the results. To demonstrate that grid discretization does not significantly impact the numerical solution, present study calculated the gas-phase saturation distribution of CO2 plumes in the stratified saline aquifer using grid cell counts of 90,000, 230,000, and 350,000. The gas-phase saturation results for radial grids at a vertical distance of 68 m were compared. As shown in Fig. 3, the curve delineates a boundary, with the left side representing the gas-liquid two-phase coexistence region and the right side indicating the single-liquid-phase region. Within the tested range of grid cell counts, the gas-phase saturation migration patterns in the selected region were highly similar at the end of the simulation, with CO2 migrating 270 m along the radial distance.
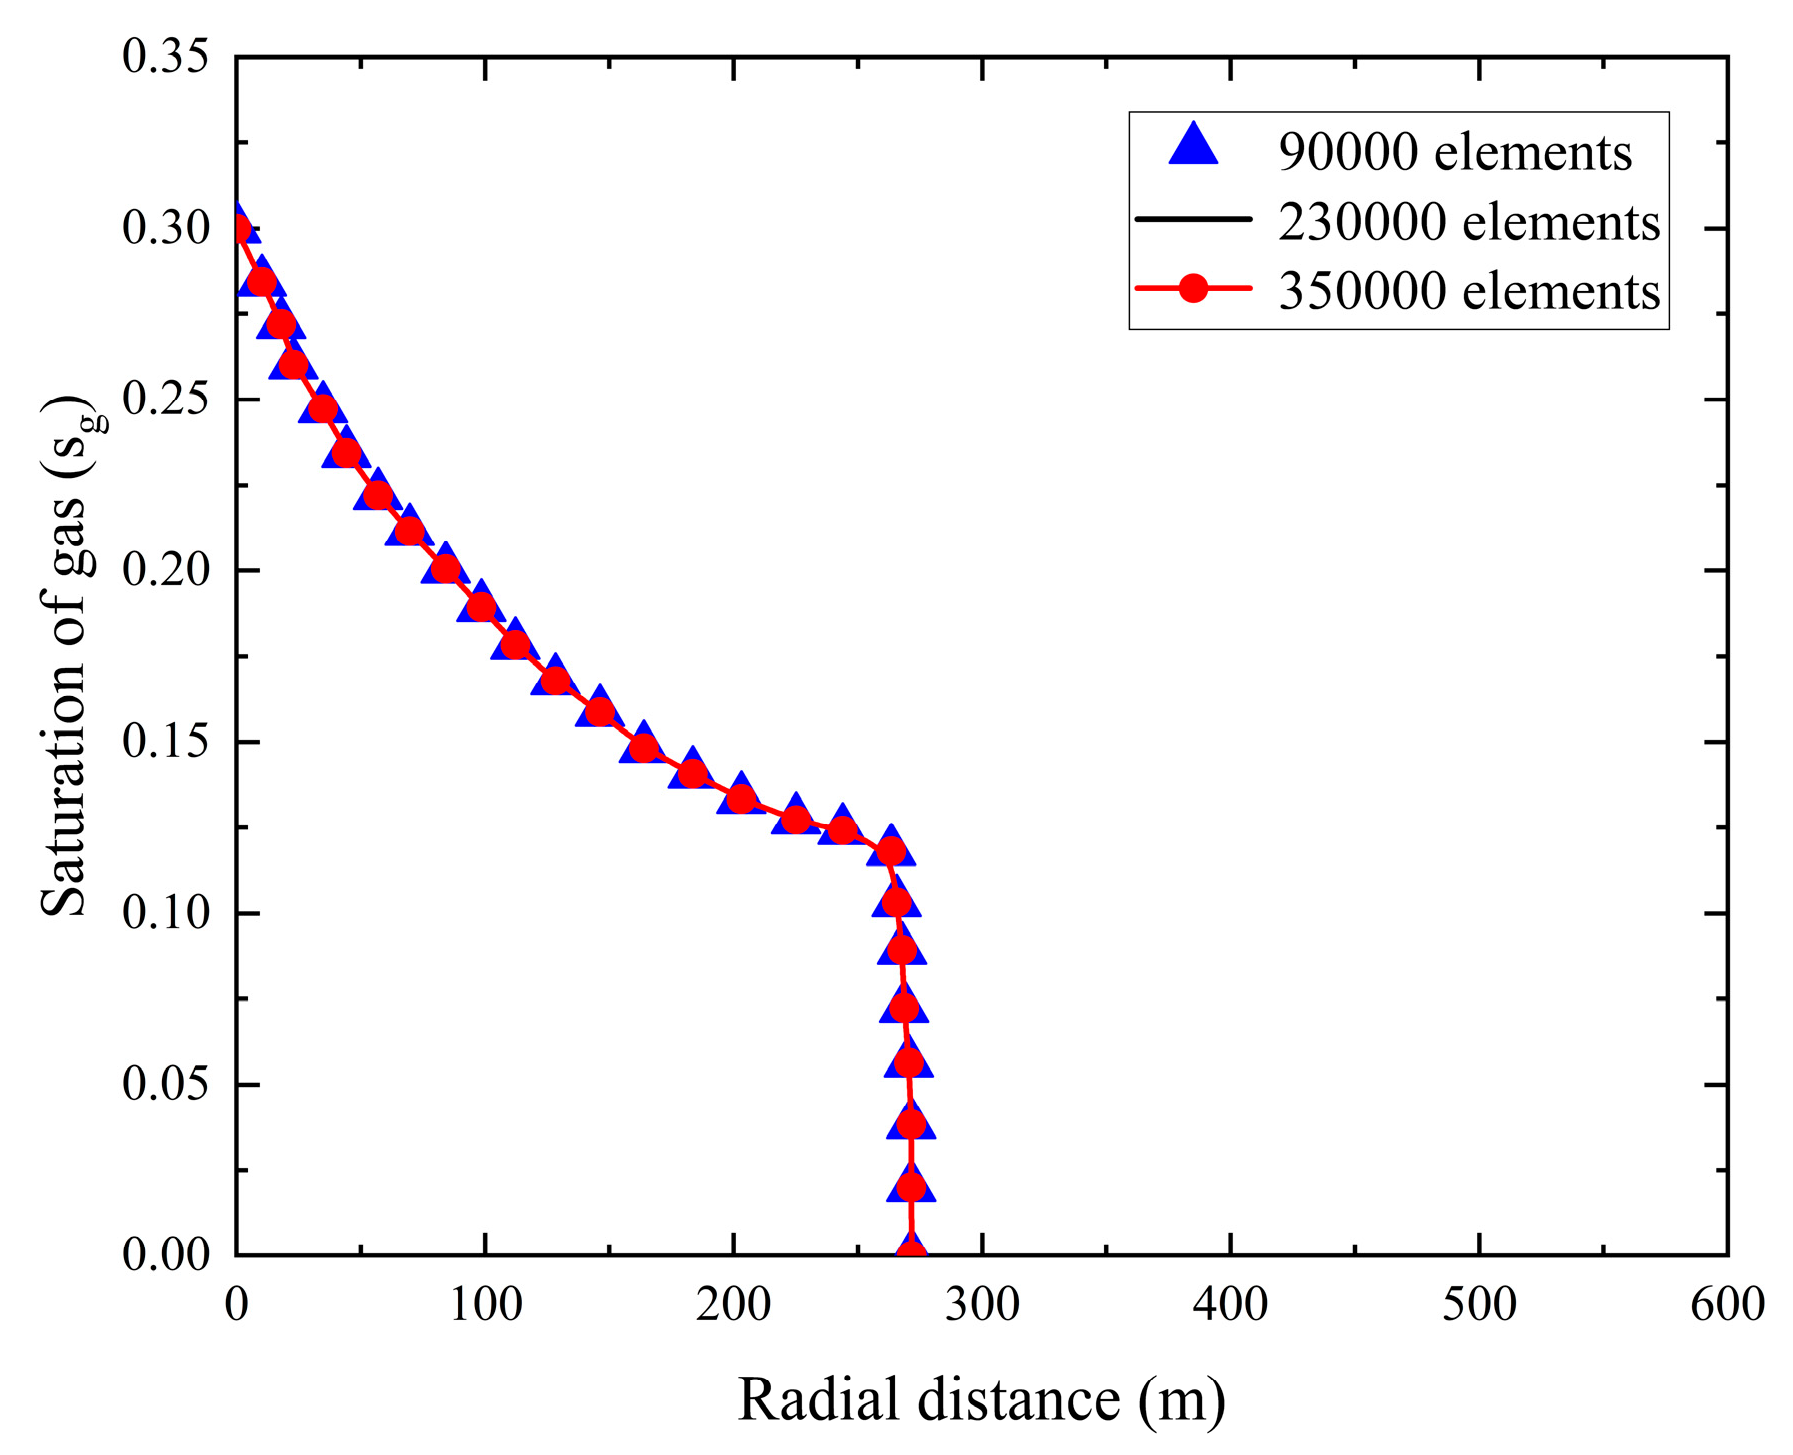
Figure 3: Calculation of gas-phase saturation for radial grids at a vertical distance of 68 m under different grid cell counts.
To further validate grid independence, this study considered a reference solution with 450,000 grid cells and evaluated the simulation results of the gas-phase saturation for grid sizes of 60,000, 90,000, 230,000, and 350,000 cells. A quantitative analysis of the relative error, L2 norm error, and maximum absolute error of the simulation results for the selected grid sizes was performed. As shown in Table 2, the relative error for the 230,000-grid cell simulation is 0.8, with an L2 norm error of 0.01 and a maximum absolute error of 0.003, all of which are very close to the reference solution with 450,000 grid cells. Moreover, the 230,000-grid cell simulation significantly reduces computational time. Therefore, to ensure the stability of the model solution, improve computational efficiency, and effectively avoid anomalies during simulations, this study adopted 230,000 grid cells for subsequent calculations.
Table 2: Quantitative metrics for grid convergence analysis.
| Number of Grid Cells | Relative Error | L2 Norm Error | Maximum Absolute Error |
|---|---|---|---|
| 60,000 | 5.0 | 0.07 | 0.02 |
| 90,000 | 3.5 | 0.05 | 0.015 |
| 230,000 | 0.8 | 0.01 | 0.003 |
| 350,000 | 0.5 | 0.005 | 0.002 |
4.3 Numerical Simulation of CO2 Sequestration in Subseabed Stratified Saline Aquifers
4.3.1 Temporal Evolution of Gas-Phase Saturation in Stratified Saline Aquifers
Fig. 4 shows the gas-phase saturation evolution in the stratified saline aquifer after 250, 500, 750 and 1000 days of continuous CO2 injection. As CO2 injection, the CO2 initially displaces the brine in the lower part of the reservoir. Due to the lower density compared to the brine, CO2 exhibits a tendency to migrate upward and laterally to the right. However, the shale layer with low porosity and permeability induces a portion of the CO2 from migrating further to the right. Only a small fraction of CO2 penetrates the upper stratified saline aquifer through the shale layer. Within the upper saline aquifer, CO2 primarily accumulates at the left end and beneath the shale layer, exhibiting a tendency for plume migration to the right. The radial migration distance of CO2 in Saline Aquifer 3 is significantly shorter than that of the gas phase in Saline Aquifer 1 near the inlet. This is because the CO2 at the left end of the stratified saline aquifer will be heavily endowed and saturated, and it is easier to migrate to the upper part through the shale layer. In addition, the capillary force in the shale layer hinders the migration of the CO2 plume, and the lower permeability and porosity inhibit the rise of CO2.
As illustrated in Fig. 4, CO2 plumes progressively invade the uppermost sandstone layer after 750–1000 days of continuous injection, whereas the evolution of the gas-phase saturation demonstrates retarded kinetics relative to the CO2 propagation in the Saline Aquifer 1 during the early injection stage. The distribution range of gas-phase saturation in Saline Aquifer 4 is smaller than that in Saline Aquifers 1 to 3. Gas-phase saturation progressively accumulates at the base of Shale layers 1 to 3, increasing with extended injection time, with the highest accumulation occurring at the base of Shale layer 1.
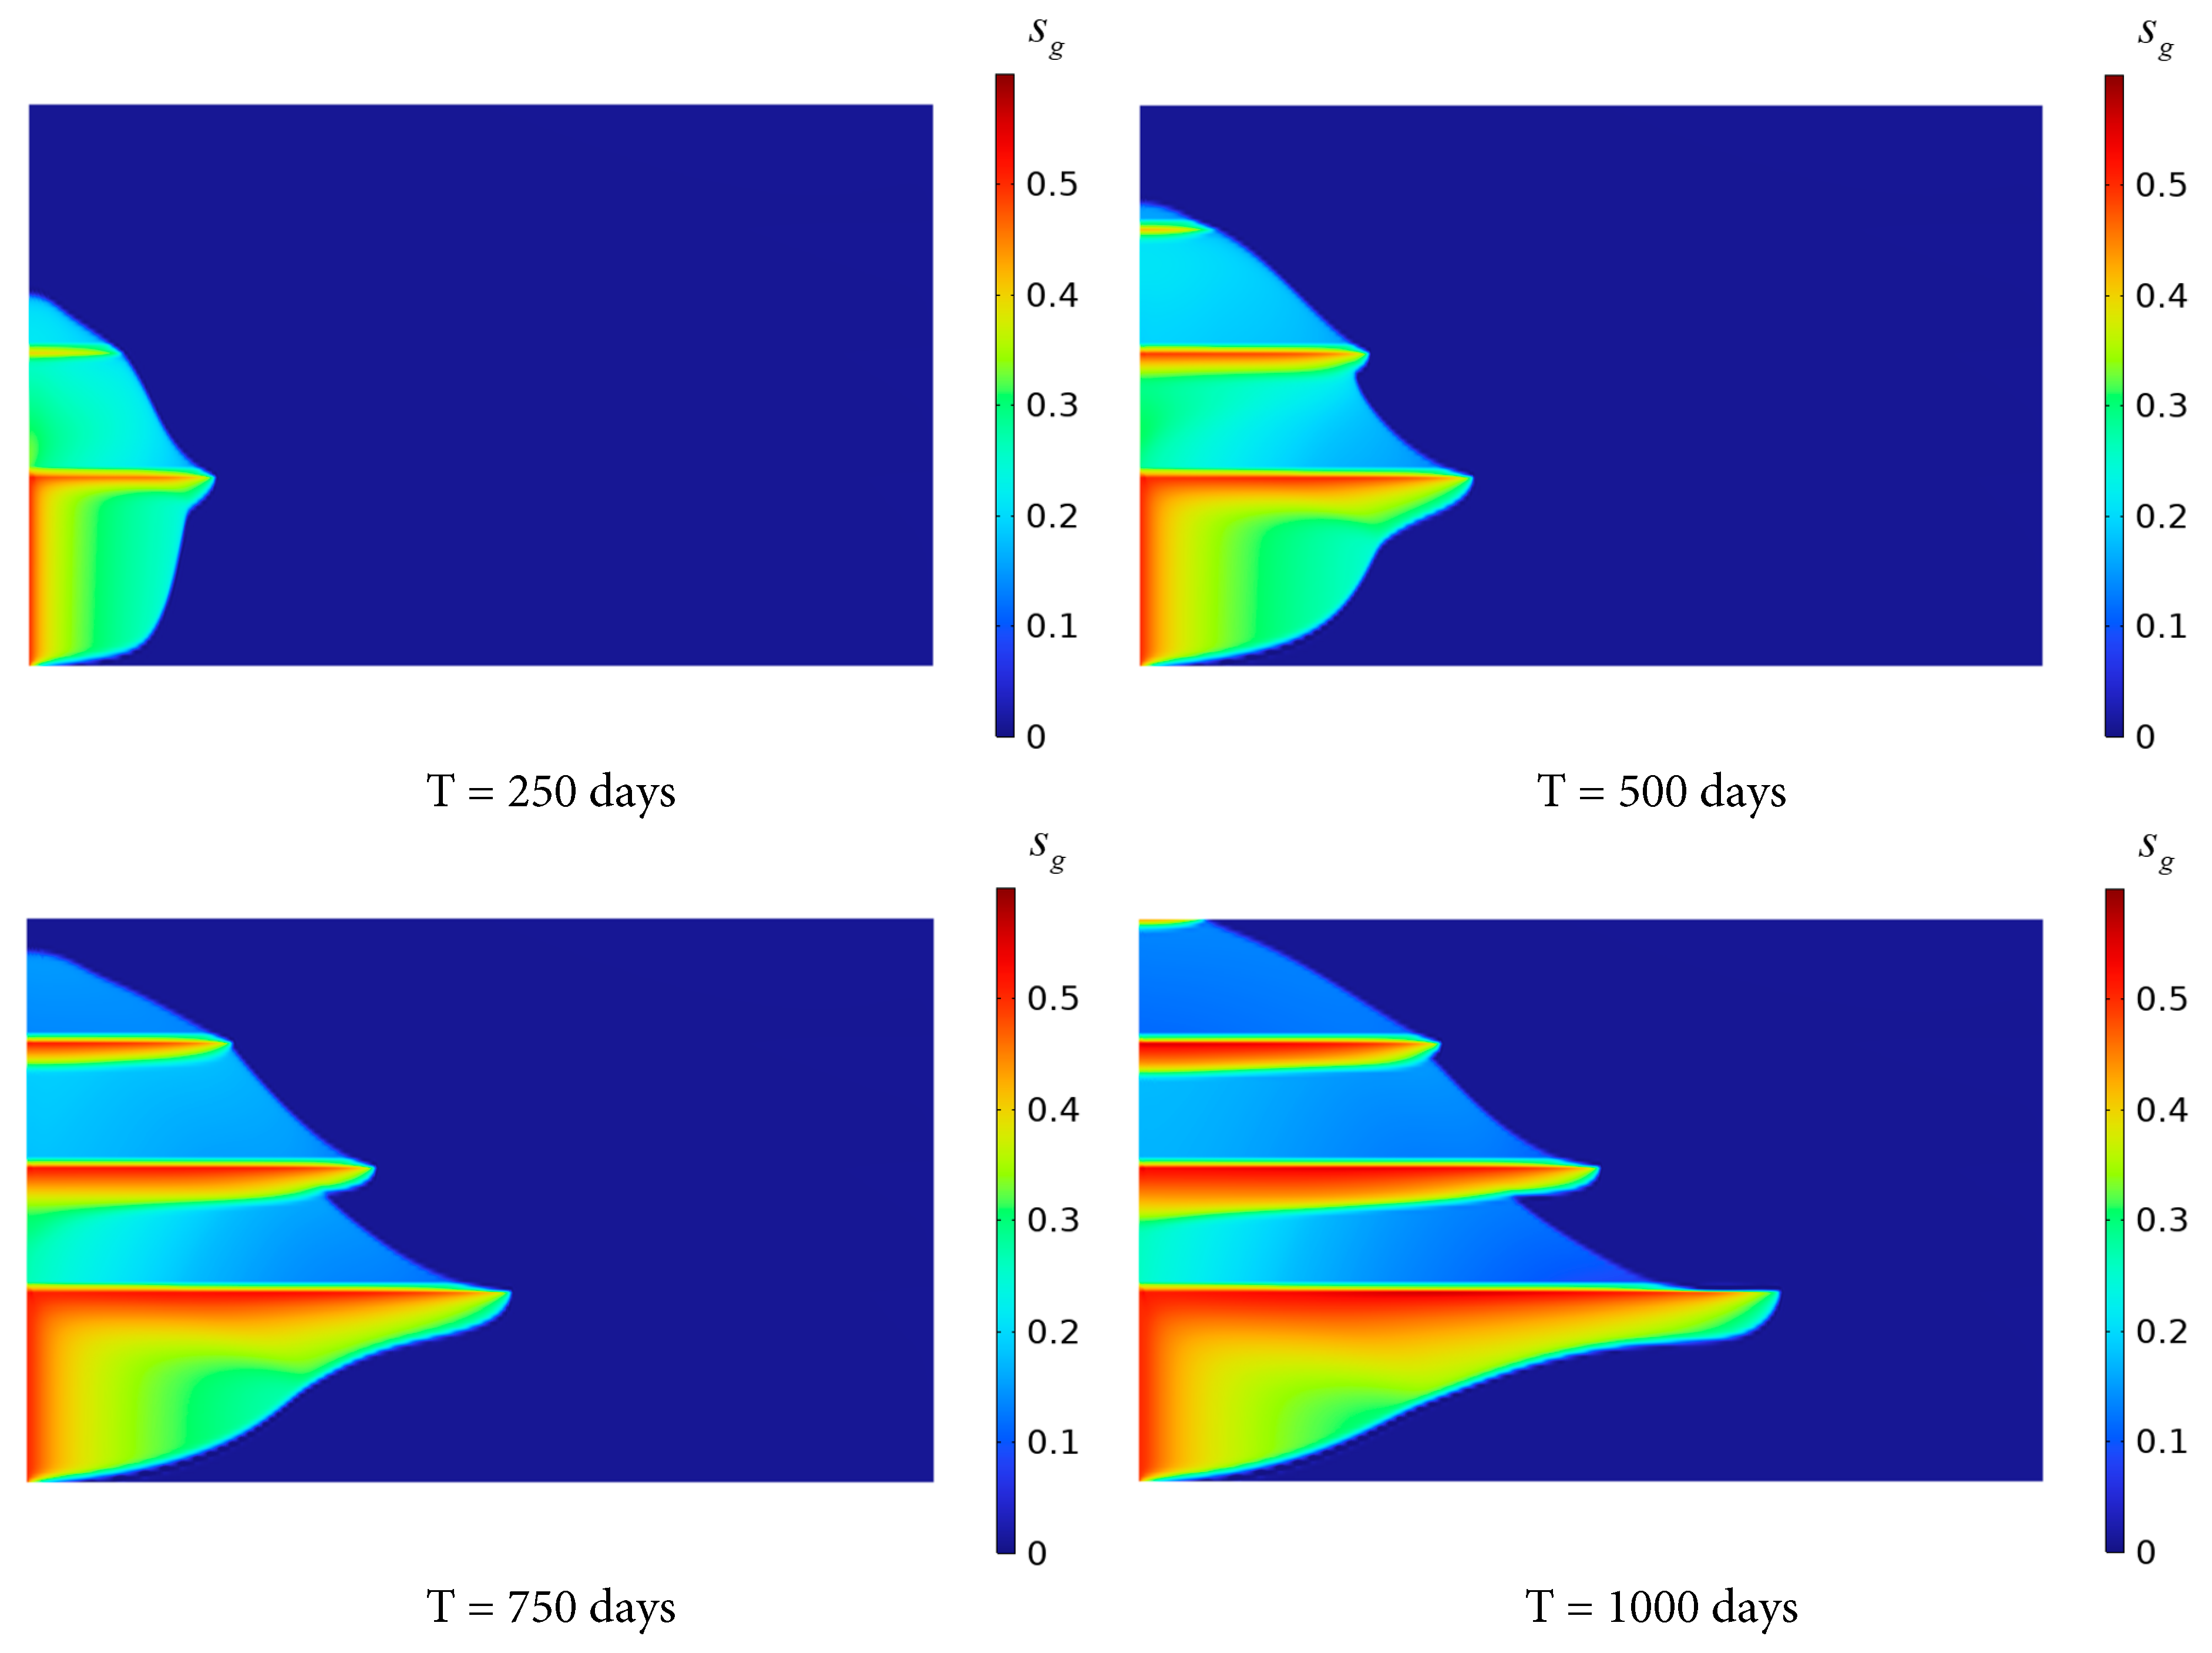
Figure 4: Variation of gas phase saturation distribution with time.
To examine the migration behavior of CO2 following its penetration through a shale layer, a numerical grid was established with a vertical extent of 68 m and a radial extent of 50 m, as shown in Fig. 5. Fig. 5a illustrates that after 250 days of injection, CO2 penetrates the low-permeability shale layer and enters Saline Aquifer 2. The gas-phase saturation is highest near the left boundary, reaching approximately 0.3, and decreases rapidly with increasing radial distance. This is attributed to the proximity to the injection source, resulting in a shorter migration duration. After 500, 750, and 1000 days of injection, CO2 continues to displace brine horizontally within Saline Aquifer 2, with the gas-phase saturation profile extending progressively rightward, expanding its distribution range. Additionally, the saturation near the left boundary slightly decreases, potentially due to CO2 dissolution into the brine near the boundary or minor leakage into adjacent layers, reducing local accumulation.
Fig. 5b illustrates the gas-phase saturation dynamics in Saline Aquifer 1, where saturation initially rises rapidly before stabilizing and accumulating. At 250 days, no breakthrough into Saline Aquifer 3 and 4 is observed. At 500, 750, and 1000 days, the gas-phase saturation in each layer gradually increases, exhibiting pronounced saturation peaks at the base of each shale layer, followed by a rapid decline to a stable value. This behavior is attributed to the low permeability of the shale layers, which severely limits the vertical migration of CO2, leading to significant accumulation at the base of these layers and reduced CO2 saturation in the overlying aquifers. Over time, CO2 gradually permeates through the micro-pores of the shale layers into Saline Aquifer 2 and further, resulting in a progressive increase in saturation. However, due to the sealing effect of the shale, the vertical displacement rate remains markedly lower than the horizontal displacement rate.
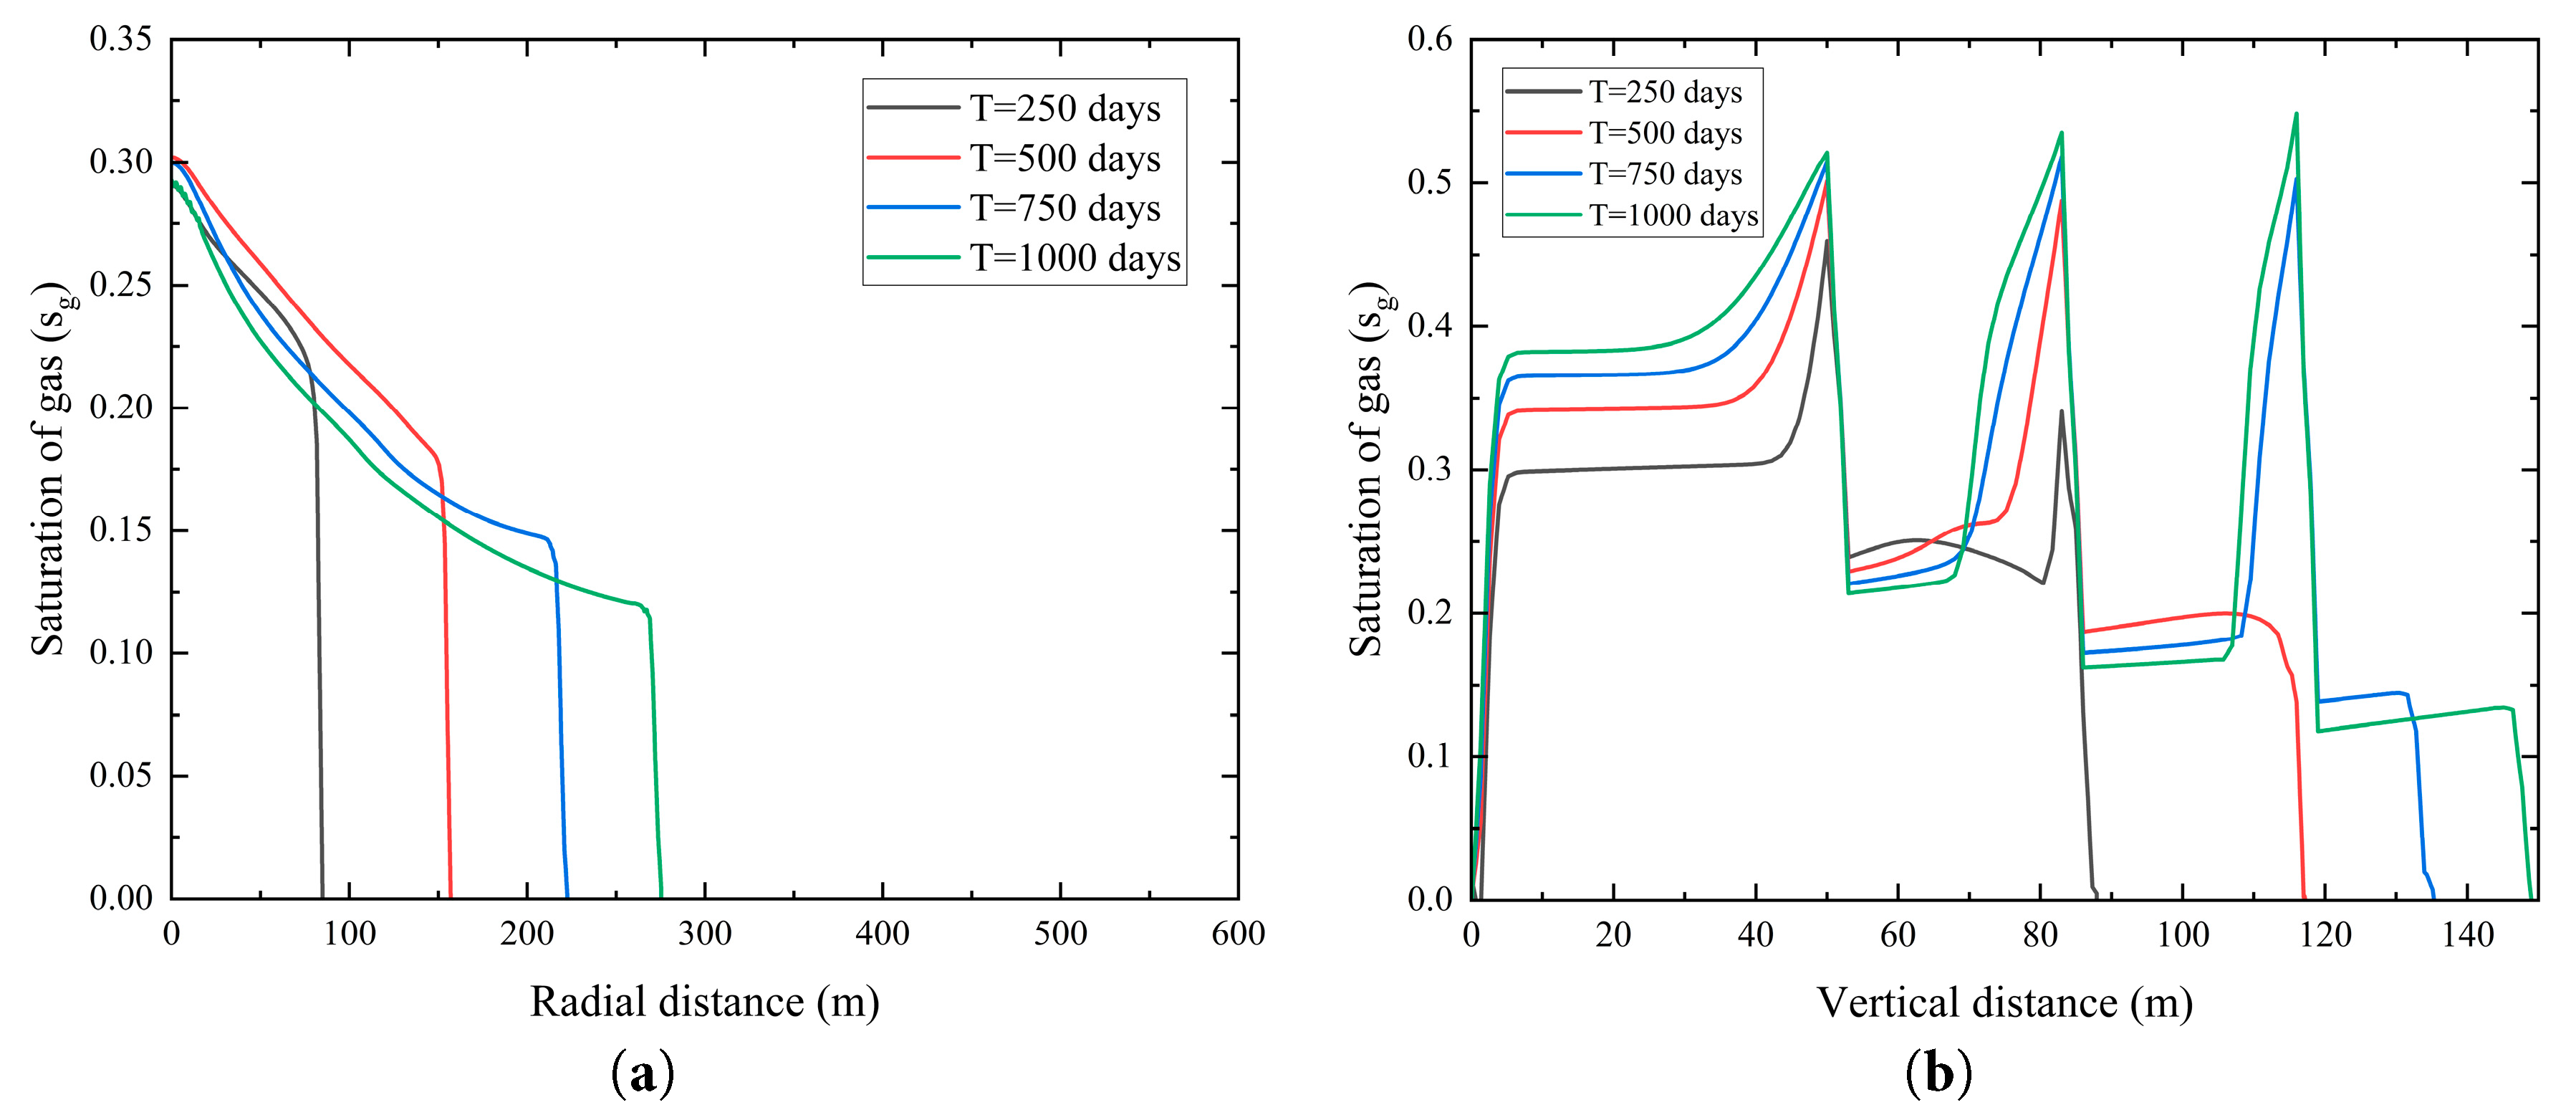
Figure 5: Changes in gas-phase saturation at different injection time. (a) Radial distribution of gas-phase saturation at a vertical distance of 68 m; (b) Vertical distribution of gas-phase saturation at a radial distance of 50 m.
4.3.2 Temporal Evolution of Pressure in Stratified Aquifers
As shown in Fig. 6, pressure accumulation is observed near the injection boundary at the base of the saline aquifer, with a maximum pressure increment of approximately 2 MPa. Over time, the pressure in the aquifer propagates both vertically and radially from the injection boundary, gradually achieving a more uniform distribution. This behavior is driven by the injection of CO2 into the Saline Aquifer 1, which elevates the liquid-phase pressure near the inlet of the CO2 injection, forming a high-pressure zone. The zone generates a pressure gradient toward surrounding low-pressure regions, facilitating the outward flow of CO2 and brine. Furthermore, the low-permeability shale layers impede axial pressure diffusion, confining CO2 primarily within the Saline Aquifer 1. Consequently, pressure diffusion occurs predominantly in the radial direction, with only minimal CO2 migration to overlying aquifers, resulting in a limited pressure response in these layers.
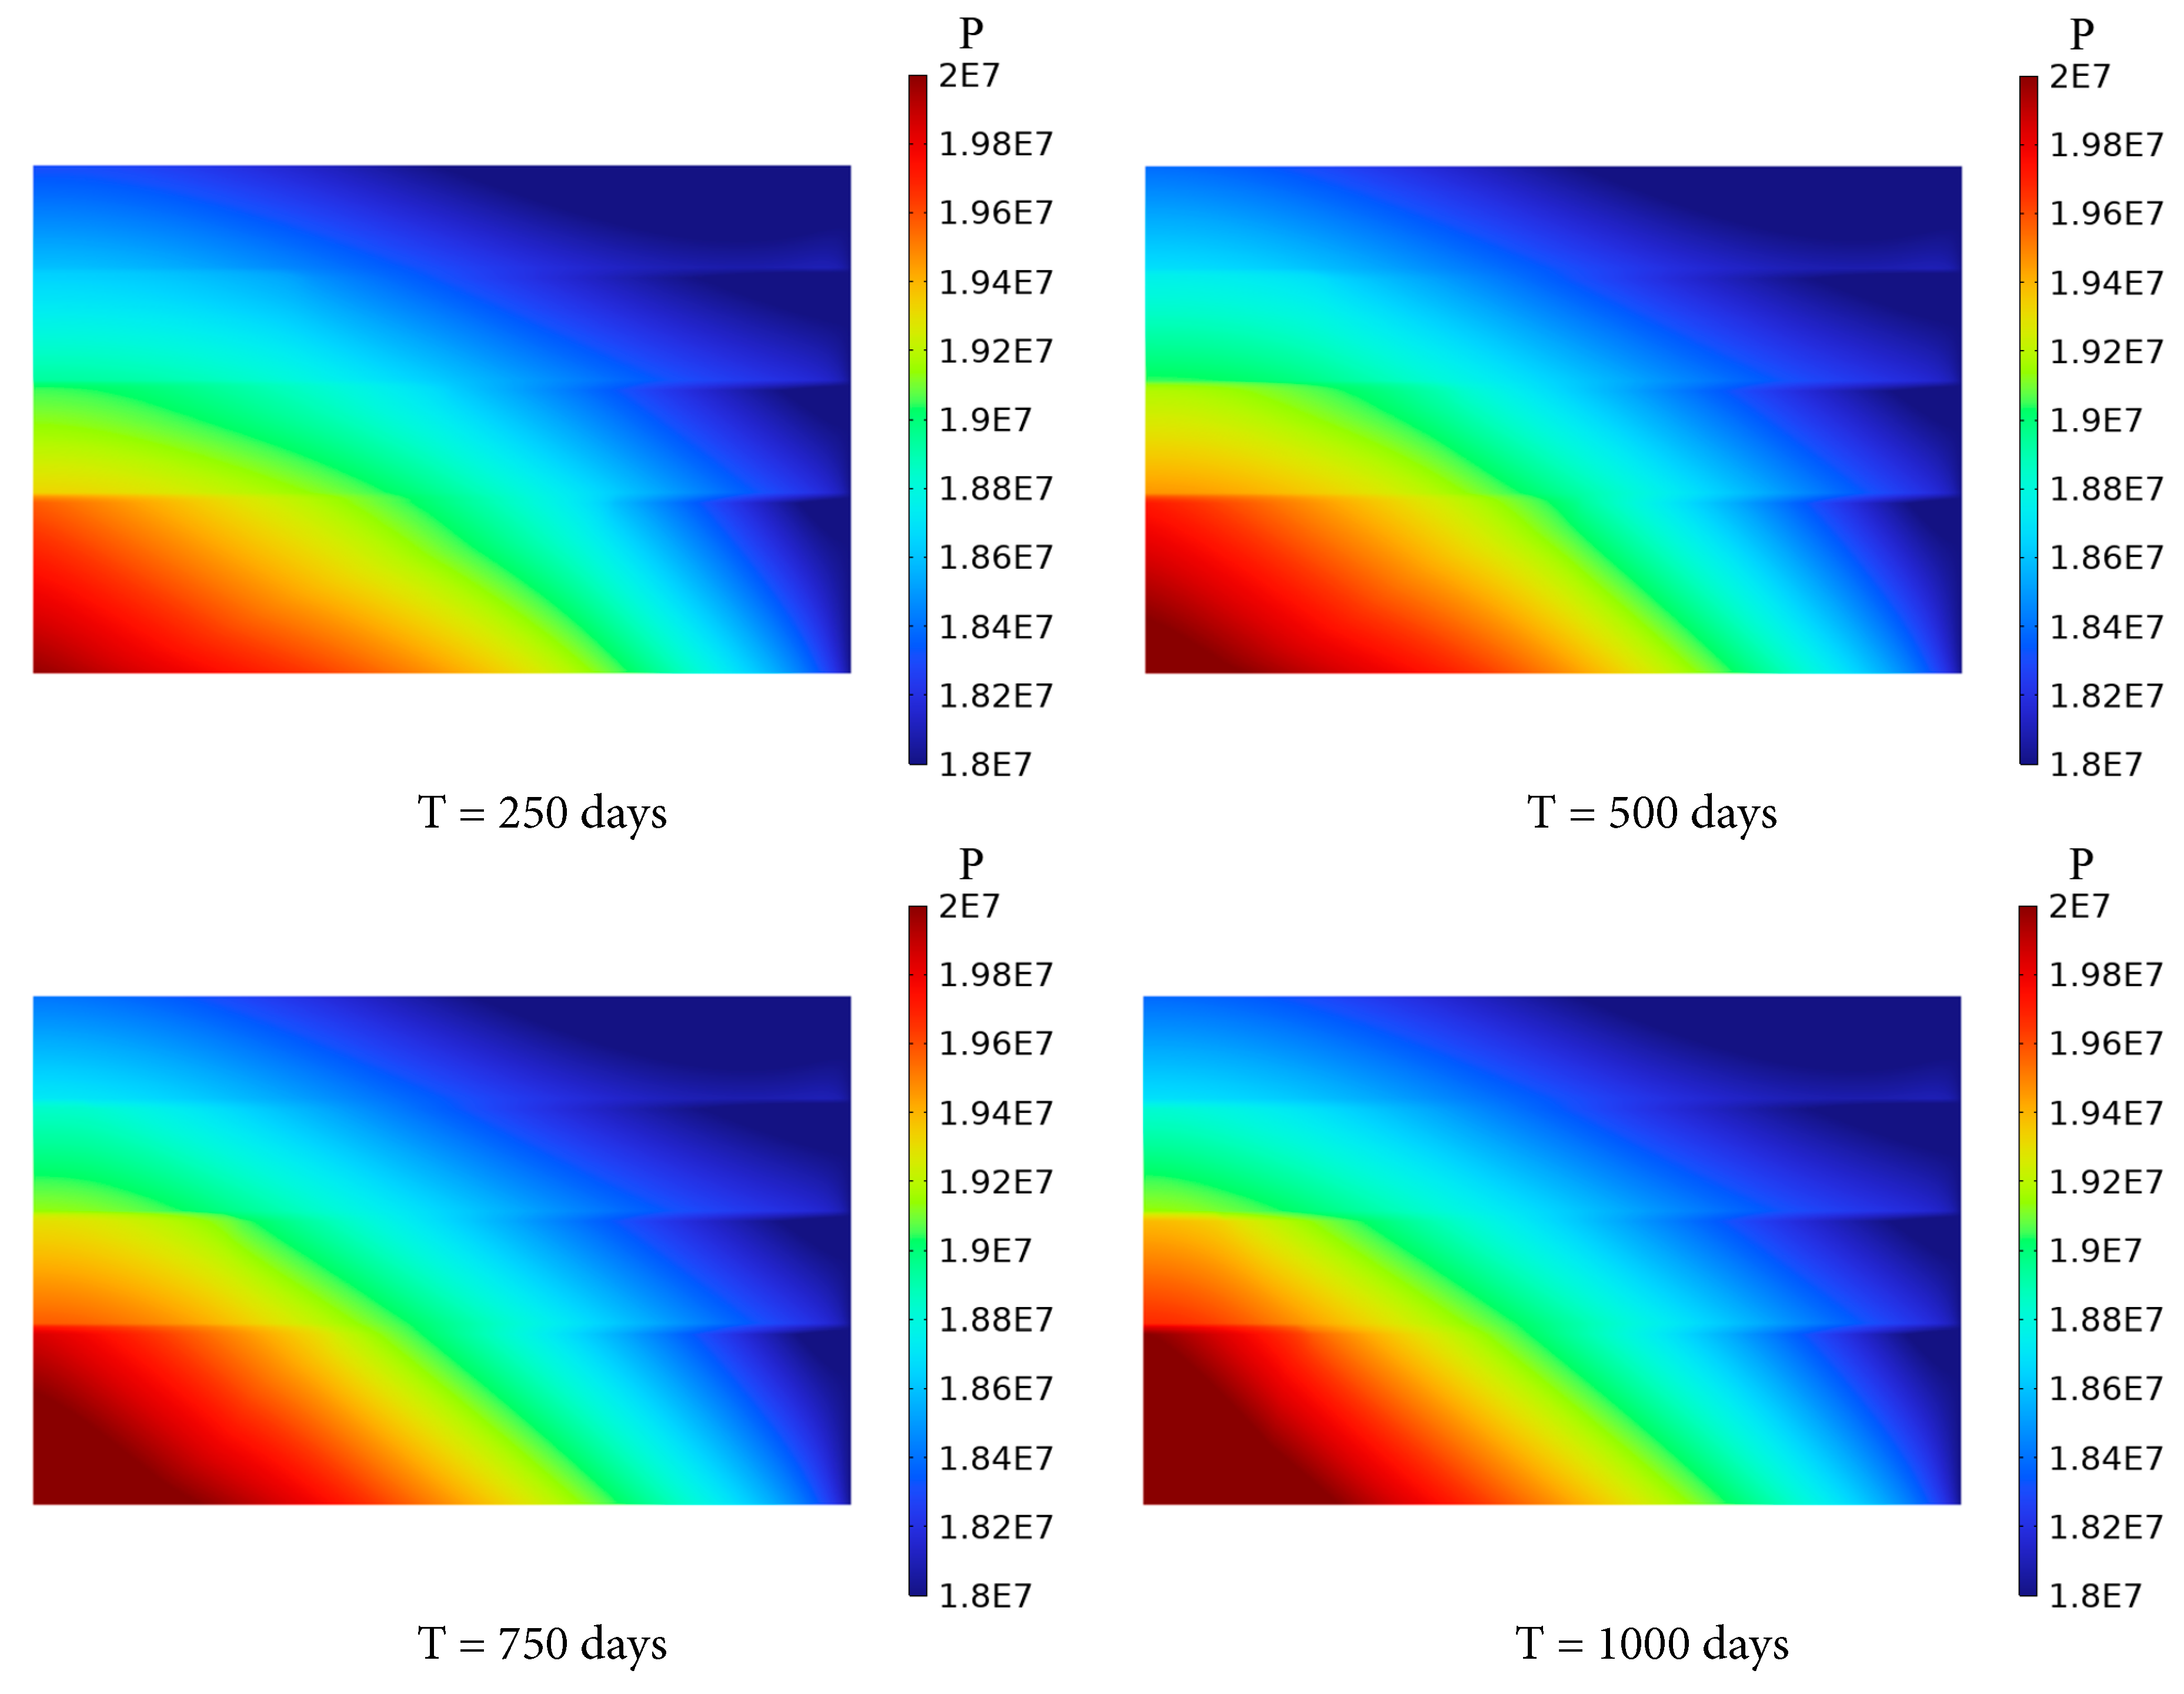
Figure 6: Variation of pressure distribution of the saline aquifer with time.
Fig. 7 illustrates the variations in liquid-phase pressure within the saline aquifer at an elevation of 68 m with radial distance and at a horizontal distance of 50 m with vertical distance across different time intervals. Fig. 7a compares the radial pressure distribution for four injection time, demonstrating that the extent of pressure accumulation due to CO2 injection significantly increases with longer injection times, with greater pressure increments observed. However, as radial distance increases, the pressure decreases and gradually stabilizes. Fig. 7b compares the vertical pressure distribution for the same injection time, revealing a sharp pressure drop near the shale layer. This indicates that a portion of the CO2 is trapped at the base of the shale layer, impeding instantaneous pressure transmission to the overlying saline aquifer. Furthermore, with increasing vertical distance, the influence of injection time on pressure becomes less pronounced.
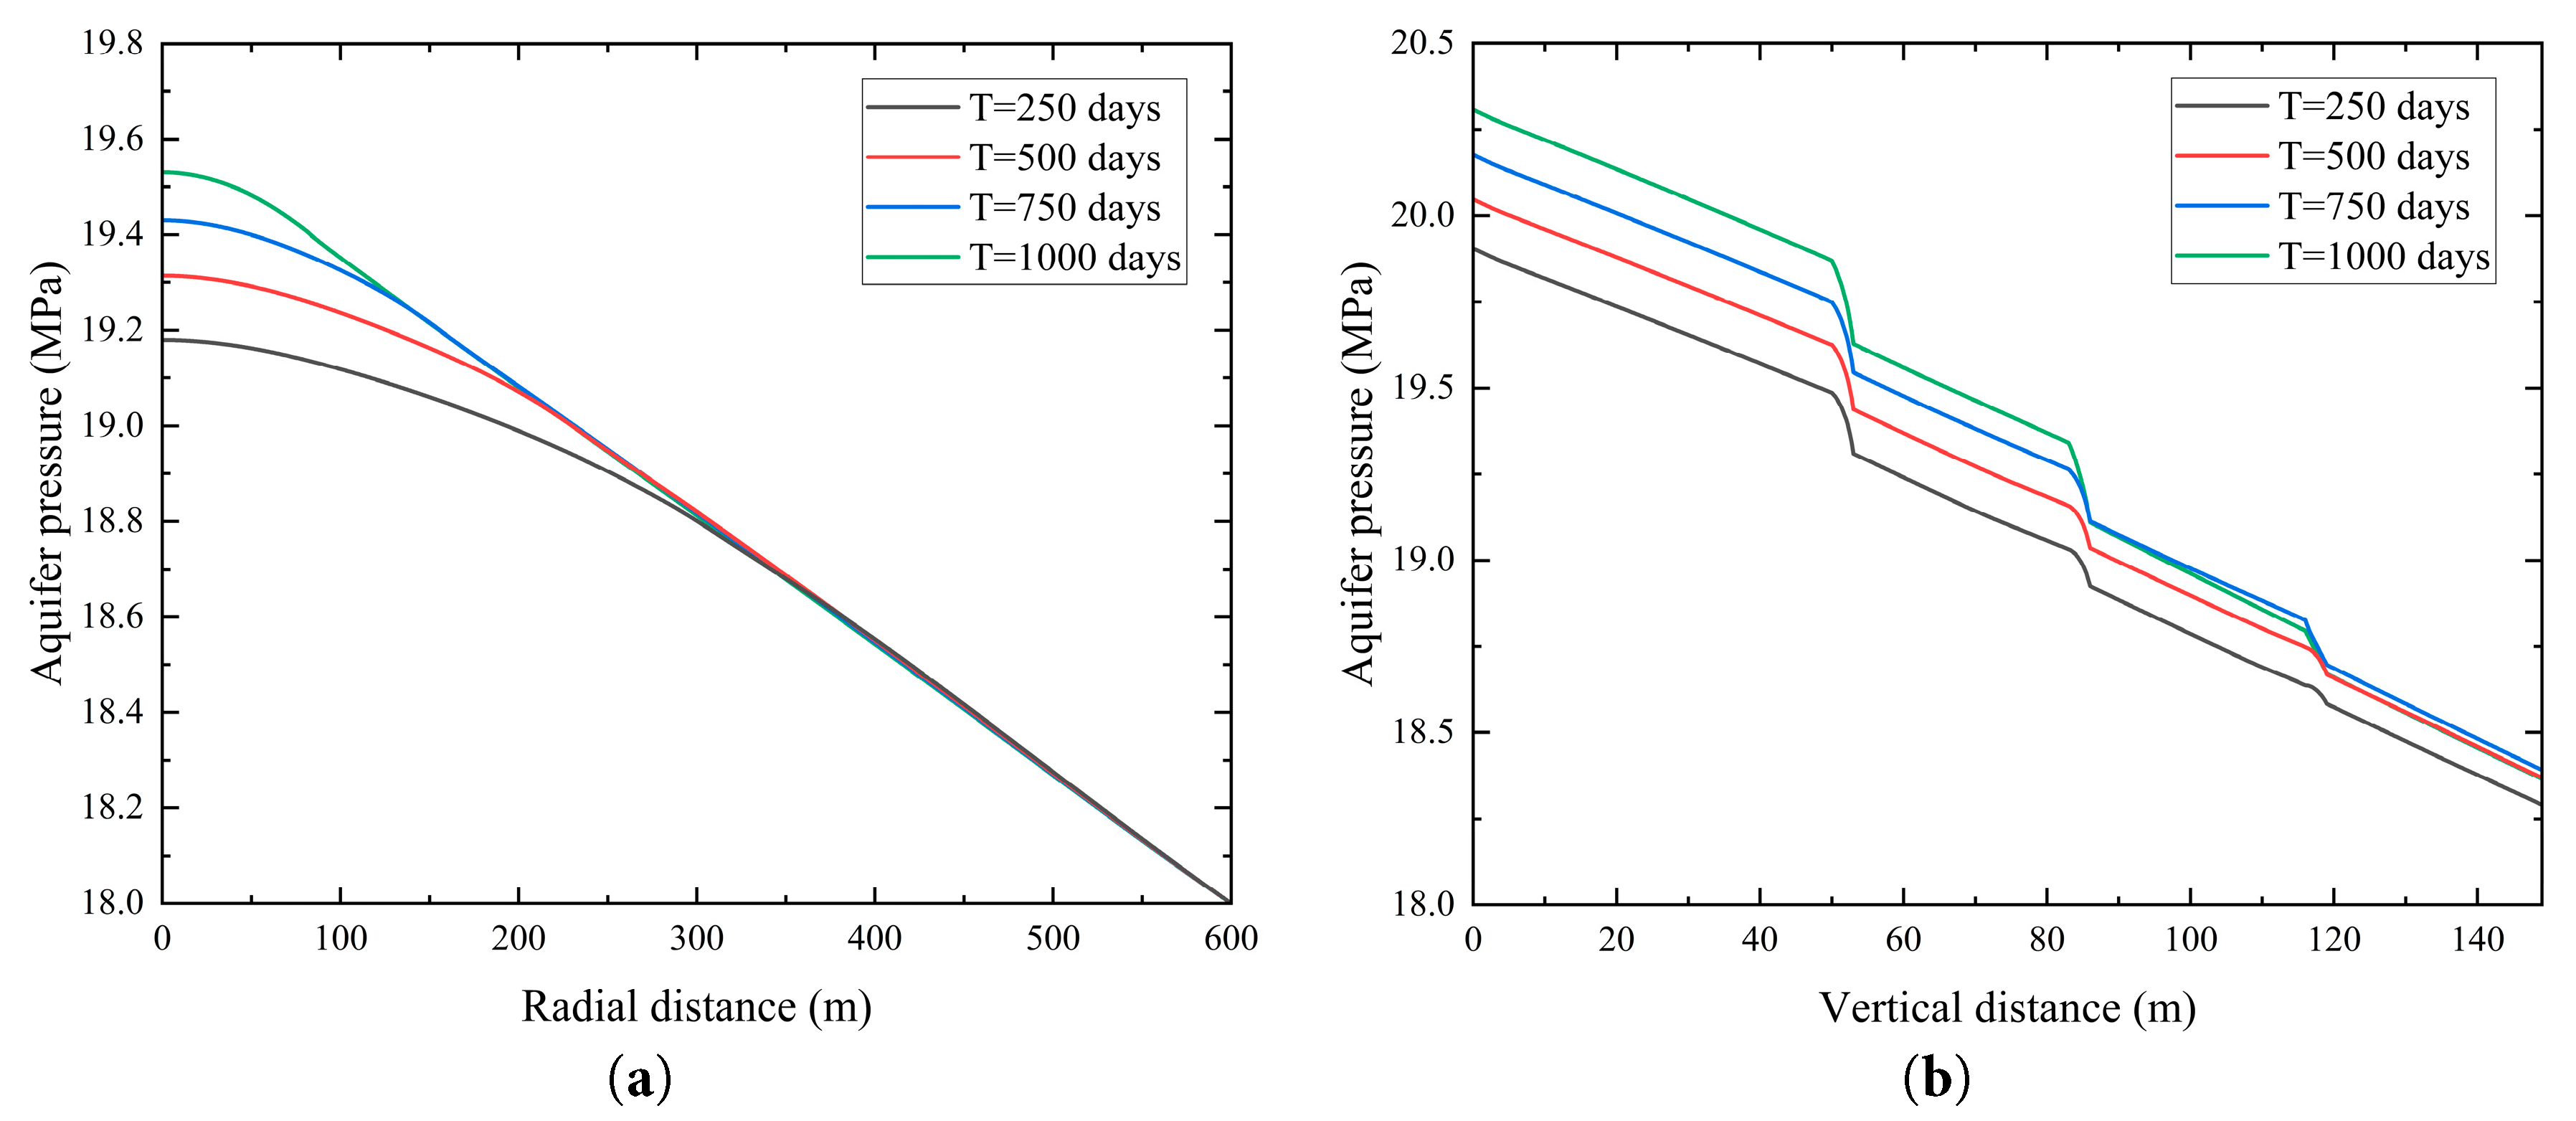
Figure 7: Temporal variations of pressure within the saline aquifer. (a) Radial distribution of saline aquifer pressure at a vertical distance of 68 m; (b) Vertical distribution of saline aquifer pressure at a radial distance of 50 m.
4.3.3 Temporal Evolution of Dissolution Distribution in Stratified Saline Aquifers
Fig. 8 depicts the distribution of the dissolved concentration ratio of CO2 after continuous injection for 250, 500, 750, and 1000 days. After 250 and 500 days of injection, CO2 primarily dissolves in Saline Aquifer 1 and 2, with a limited range of radial migration confined near the left boundary. At these early stages, the short injection duration restricts sufficient diffusion. The high porosity and permeability of the saline aquifers facilitate the horizontal dissolution and diffusion of CO2, whereas the low permeability of the shale layers significantly impedes axial diffusion toward higher saline aquifers, resulting in predominant CO2 dissolution in the lower layers. After 750 and 1000 days, substantial amounts of CO2 penetrate Saline Aquifer 3 and 4, exhibiting distinct stratified characteristics. This is attributed to the prolonged injection time, which allows the high permeability of the saline aquifers to facilitate the radial diffusion range in the lower layers. Concurrently, CO2 gradually permeates through the micro-pores of the Shale layer 2 and 3 to reach the uppermost aquifer. The low permeability and porosity of the shale layers hinder contact between CO2 and brine, but sustained injection overcomes these barriers. Furthermore, as the axial and radial migration distances of the CO2 plume increase, the contact area between the plume and brine expands, leading to preferential dissolution of CO2 and an expedited dissolution rate.
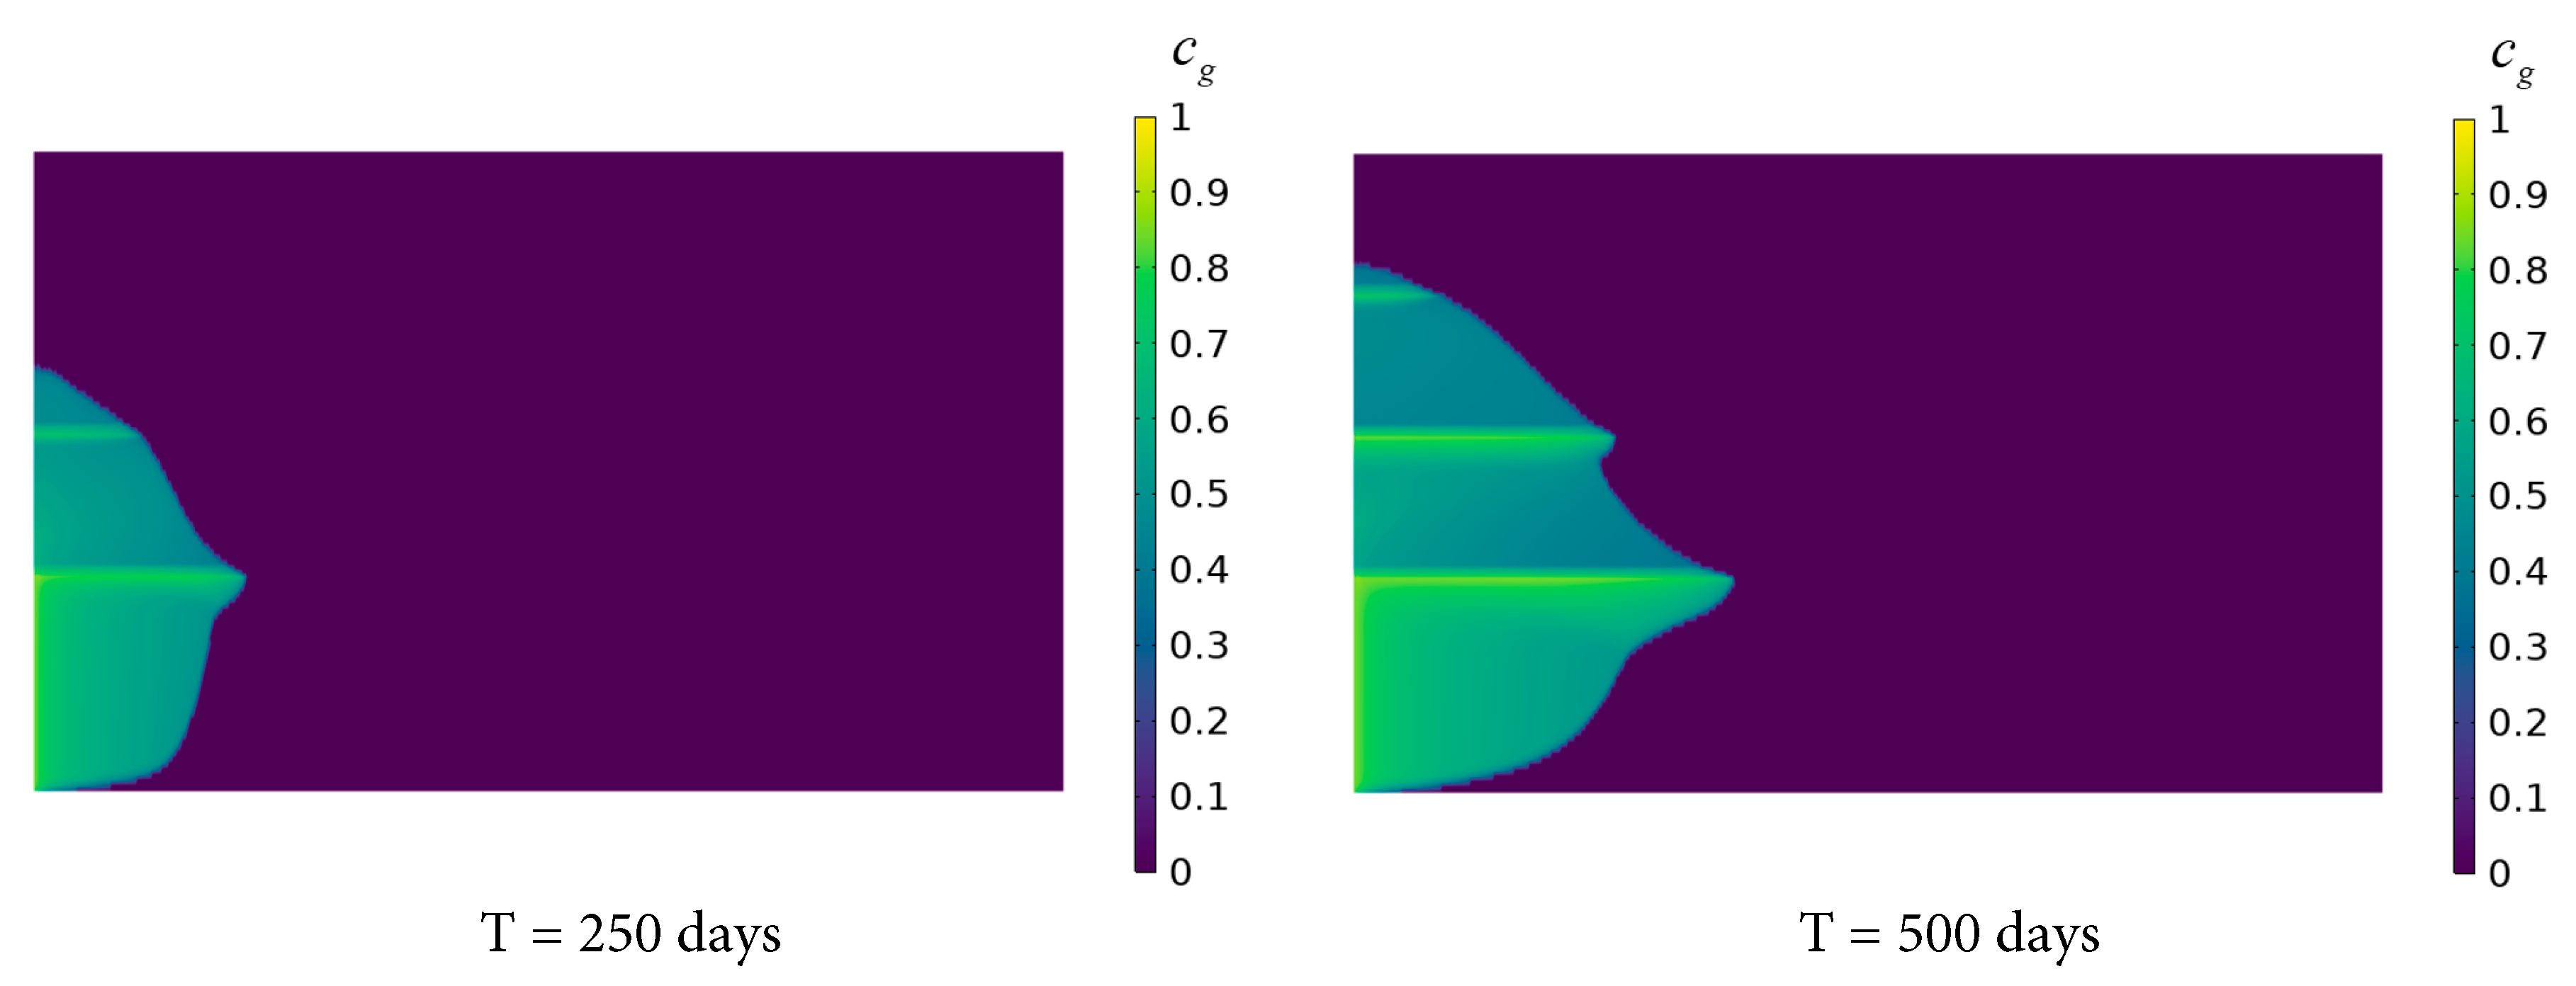
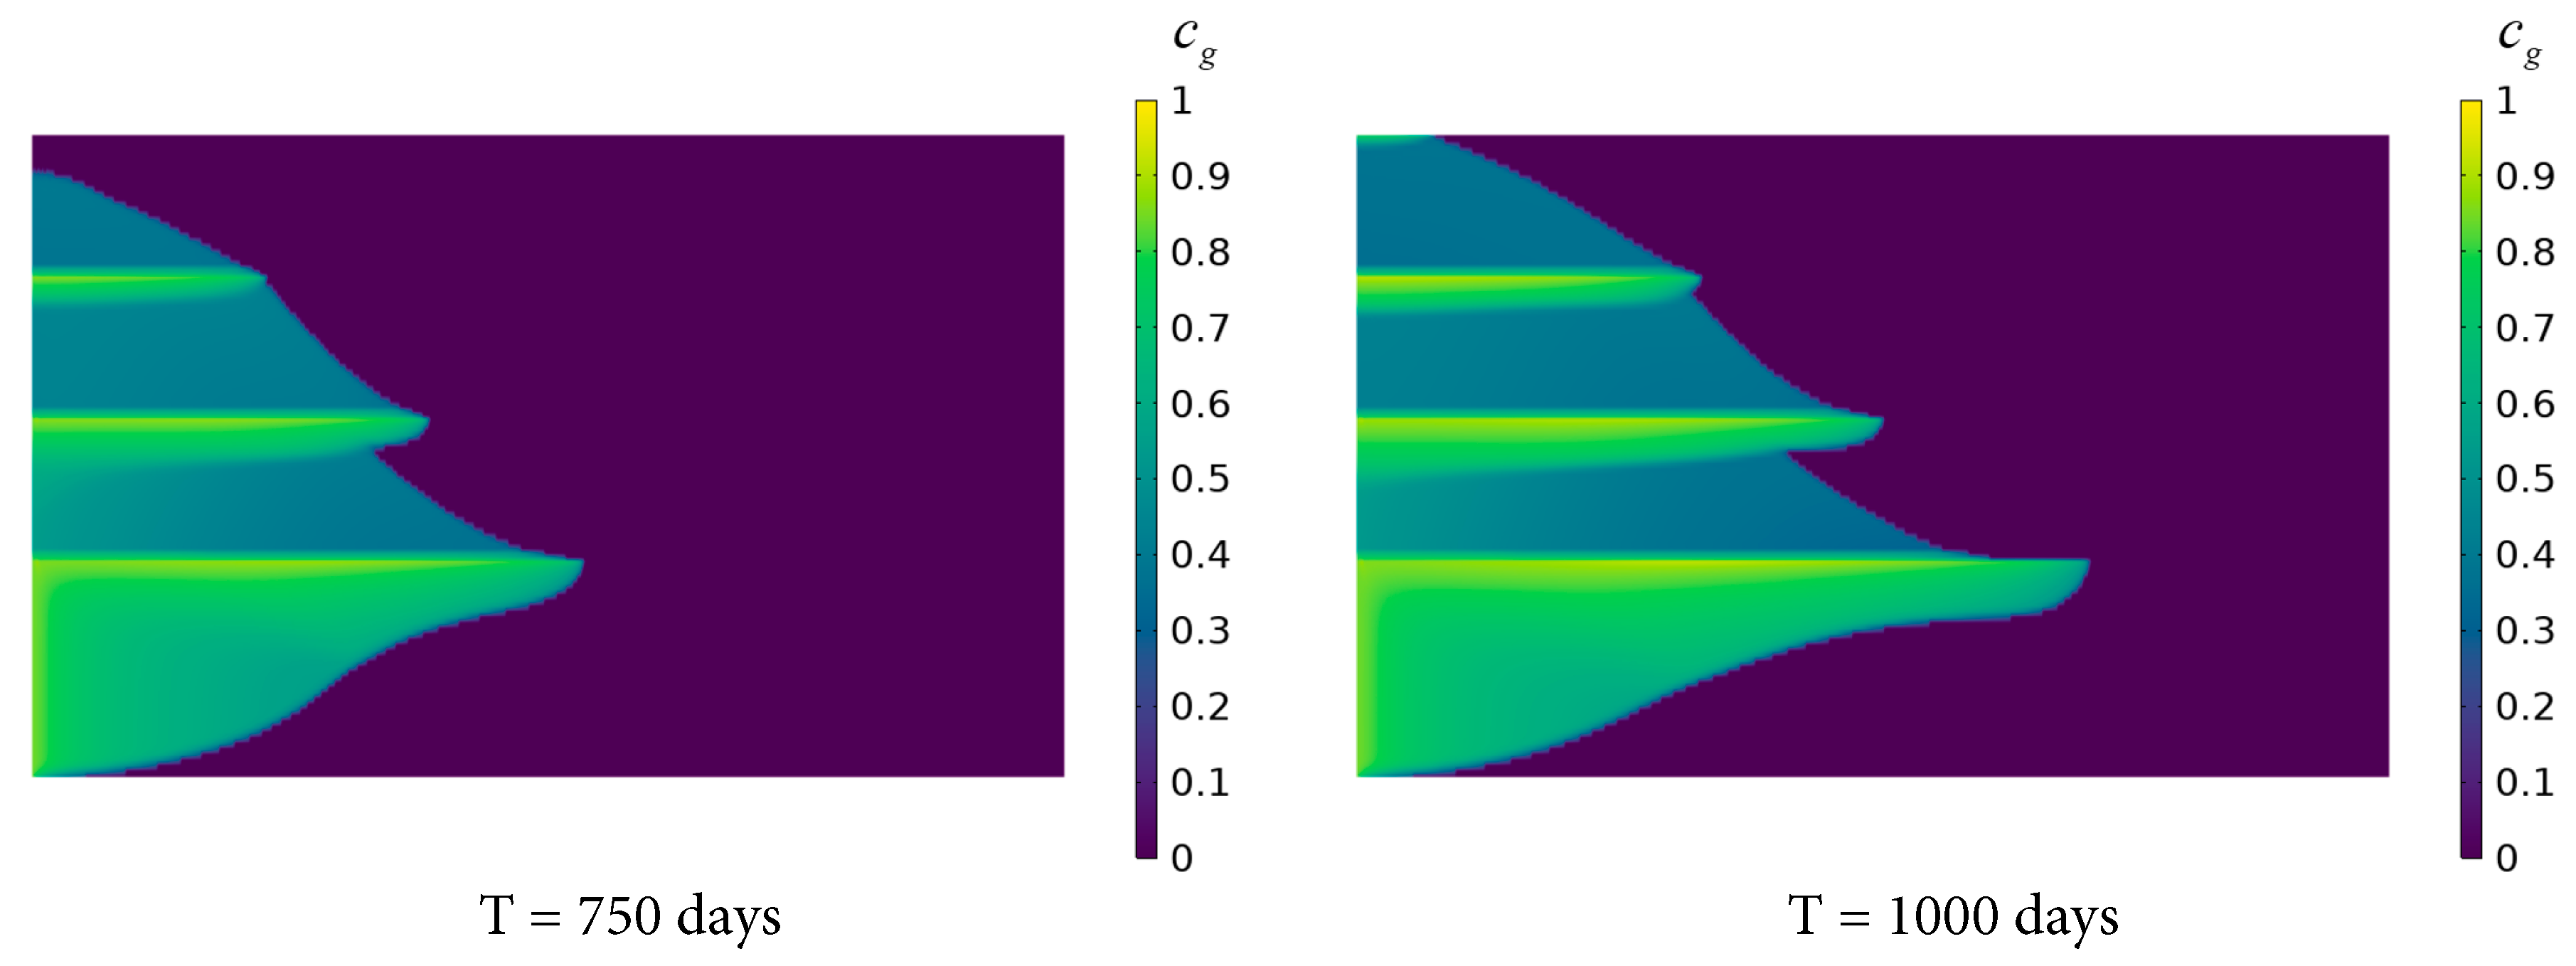
Figure 8: Variation of CO2 dissolution distribution in the saline aquifer with time.
Based on the CO2 dissolution distribution shown in Fig. 8, four grid block—A (10, 10), B (10, 49), C (10, 70), and D (10, 82)—were selected to investigate the temporal evolution of the dissolved concentration ratio. Fig. 9a illustrates that the concentration ratio of the dissolved CO2 at block A and block B increases rapidly with injection time, exhibiting a high dissolution rate during the initial injection phase before gradually approaching the dissolution limit. The higher concentration ratio of dissolved CO2 at block A compared to block B indicates that the amount of dissolved CO2 in the region near Shale layer 1 is greater than at the bottom of the saline aquifer farther from Shale layer 1. This is attributed to the restrictive influence of the shale layer’s properties on the Saline Aquifer 1, which impedes the vertical migration of CO2, leading to localized CO2 accumulation near the shale layer’s base. The CO2 accumulation enhances contact and dissolution with the brine, while the underlying regions, where CO2 diffusion is less restricted, exhibit relatively lower dissolution amount. Fig. 9b shows that the concentration ratio of the dissolved CO2 at block C and block D increases slowly over time, with block D displaying a higher dissolution amount than block C. However, the overall dissolution rate in these regions is significantly lower than in the Saline Aquifer 1, with CO2 predominantly existing in a gaseous state. This phenomenon is due to the dissolution of CO2 in the brine within Saline Aquifer 1, which slows its migration. Additionally, the localized accumulation effect near the base of the Shale layer 2 further accentuates spatial variations in the dissolved concentration ratio, resulting in slightly elevated dissolution amount in regions of Saline Aquifer 2 close to the shale layer.
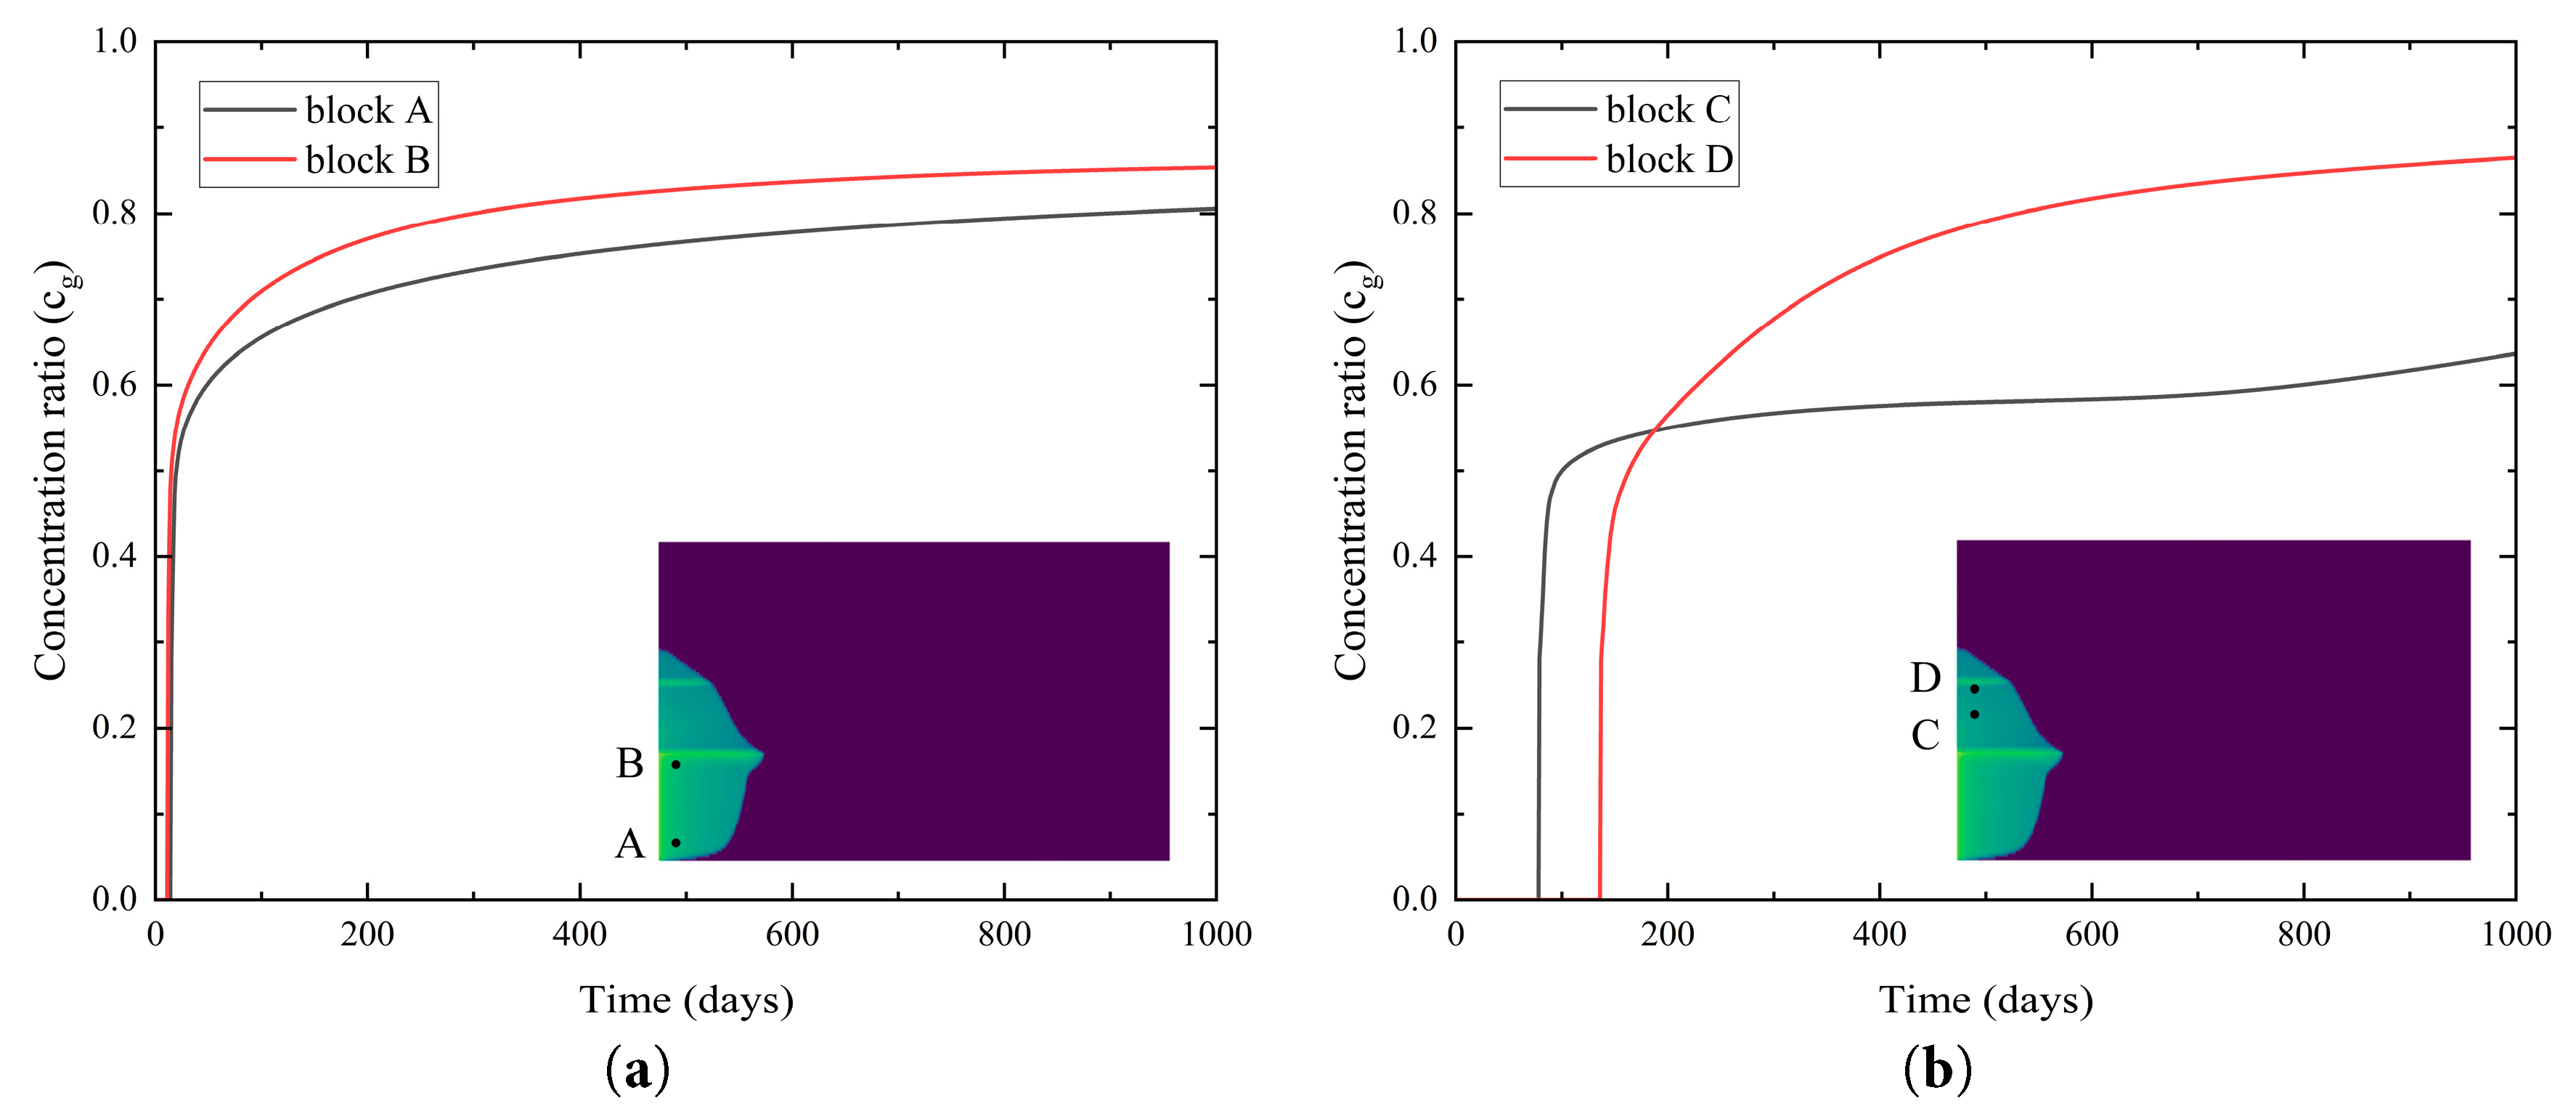
Figure 9: Temporal evolution of the concentration ratio of the dissolved CO2 in (a) Saline Aquifer 1 and (b) Saline Aquifer 2.
4.4 Factors Influencing CO2 Dissolution Characteristics in Stratified Saline Aquifers
4.4.1 Impact of Porosity on CO2 Dissolution Characteristics
When CO2 is injected into a saline aquifer, it reacts with specific minerals in the host rock, resulting in the formation of carbonate precipitates that alter saline aquifer porosity. Consequently, this study evaluates the influence of varying porosity on CO2 migration and dissolution distribution after an injection time of 1000 days. Two average porosity values, approximately 0.25 and 0.3, were considered, employing both normal distribution and constant value as distribution methods. These porosity distribution forms were selected based on experimental observations of sandstone formations by multiple researchers. For instance, studies by Safari et al. [40] and Zech et al. [41] indicate that the porosity of analyzed sandstone formations typically follows a normal distribution. Other sandstone formations, such as the offshore deltaic sandstones in the Bohai Basin, reveal a trimodal porosity distribution spanning 0.065–0.35 [42,43].
For cases adopting a normal distribution, the porosity range was set between 0.05 and 0.5, with a standard deviation of 0.05. Sample points are sparsely distributed near the boundaries of 0.05 and 0.5 in the range, while being more densely clustered around the average values of 0.25 and 0.3. The distribution pattern indicates a tendency for porosity values to concentrate around these mean values, with a lower probability of occurrence at extreme values (i.e., 0.05 and 0.5). Such distribution characteristics reflect the study’s design regarding porosity variation, enabling a more accurate simulation of the actual porosity distribution in sandstone formations. Specific settings for the numerical cases are detailed in Table 3.
Table 3: Settings for different cases of heterogeneous porosity distribution.
| Numerical Example | Average Porosity | Heterogeneity | Permeability (mD) |
|---|---|---|---|
| Porosity | |||
| Case 1 | 0.25 | normal distribution | 50.65 |
| Case 2 | 0.25 | constant | 50.65 |
| Case 3 | 0.3 | normal distribution | 50.65 |
| Case 4 | 0.3 | constant | 50.65 |
Fig. 10 compares the distribution of CO2 dissolved in brine after 1000 days of injection under different porosity conditions. In Cases 1 and 3, the radial dissolution distance of CO2 is shorter compared to scenarios with constant porosity, with differences of 22.46 m and 14.49 m in the Saline Aquifer 1, and 15.24 m and 11.23 m in the Saline Aquifer 2, respectively. Due to the spatial variability of porosity, CO2 accumulates in high-porosity regions, exhibiting a stronger dissolution effect and resulting in shorter gas-phase migration distances. High-porosity regions provide greater storage capacity and increased contact area with brine. Since CO2 dissolution occurs at the gas-liquid interface, an enlarged contact area directly expedites the dissolution rate and the amount of dissolved CO2. Additionally, regions of high porosity and enhanced pore connectivity serve as localized trapping zones, extending the residence time and the dissolution amount of CO2.
Significant differences in radial dissolution distances are observed between Case 2 and Case 4 across different layers. Specifically, in the Saline Aquifer 1, the radial dissolution distance is 427.12 m for Case 2 and 356.56 m for Case 4, a difference of 70.56 m. An increase in constant porosity from 0.25 to 0.3 results in an approximately 16.5% reduction in the radial dissolution distance of CO2 in Saline Aquifer 1. An increase in normally distributed porosity from 0.25 to 0.3 leads to an approximately 15.5% reduction in the radial dissolution distance of CO2 in Saline Aquifer 1. In the Saline Aquifer 2, the radial dissolution distance is 307.85 m for Case 2 and 258.77 m for Case 4, a difference of 49.08 m. These disparities further indicate that increased porosity leads to a reduction in radial dissolution distance. Higher porosity causes CO2 to accumulate within the medium, thereby slowing its radial diffusion rate. Furthermore, the CO2 dissolution rate in the Saline Aquifer 1 is substantially greater than that in the Saline Aquifer 2. This phenomenon suggests that variations in porosity substantially influence fluid resistance in stratified porous media, consequently affecting CO2 dissolution behavior.
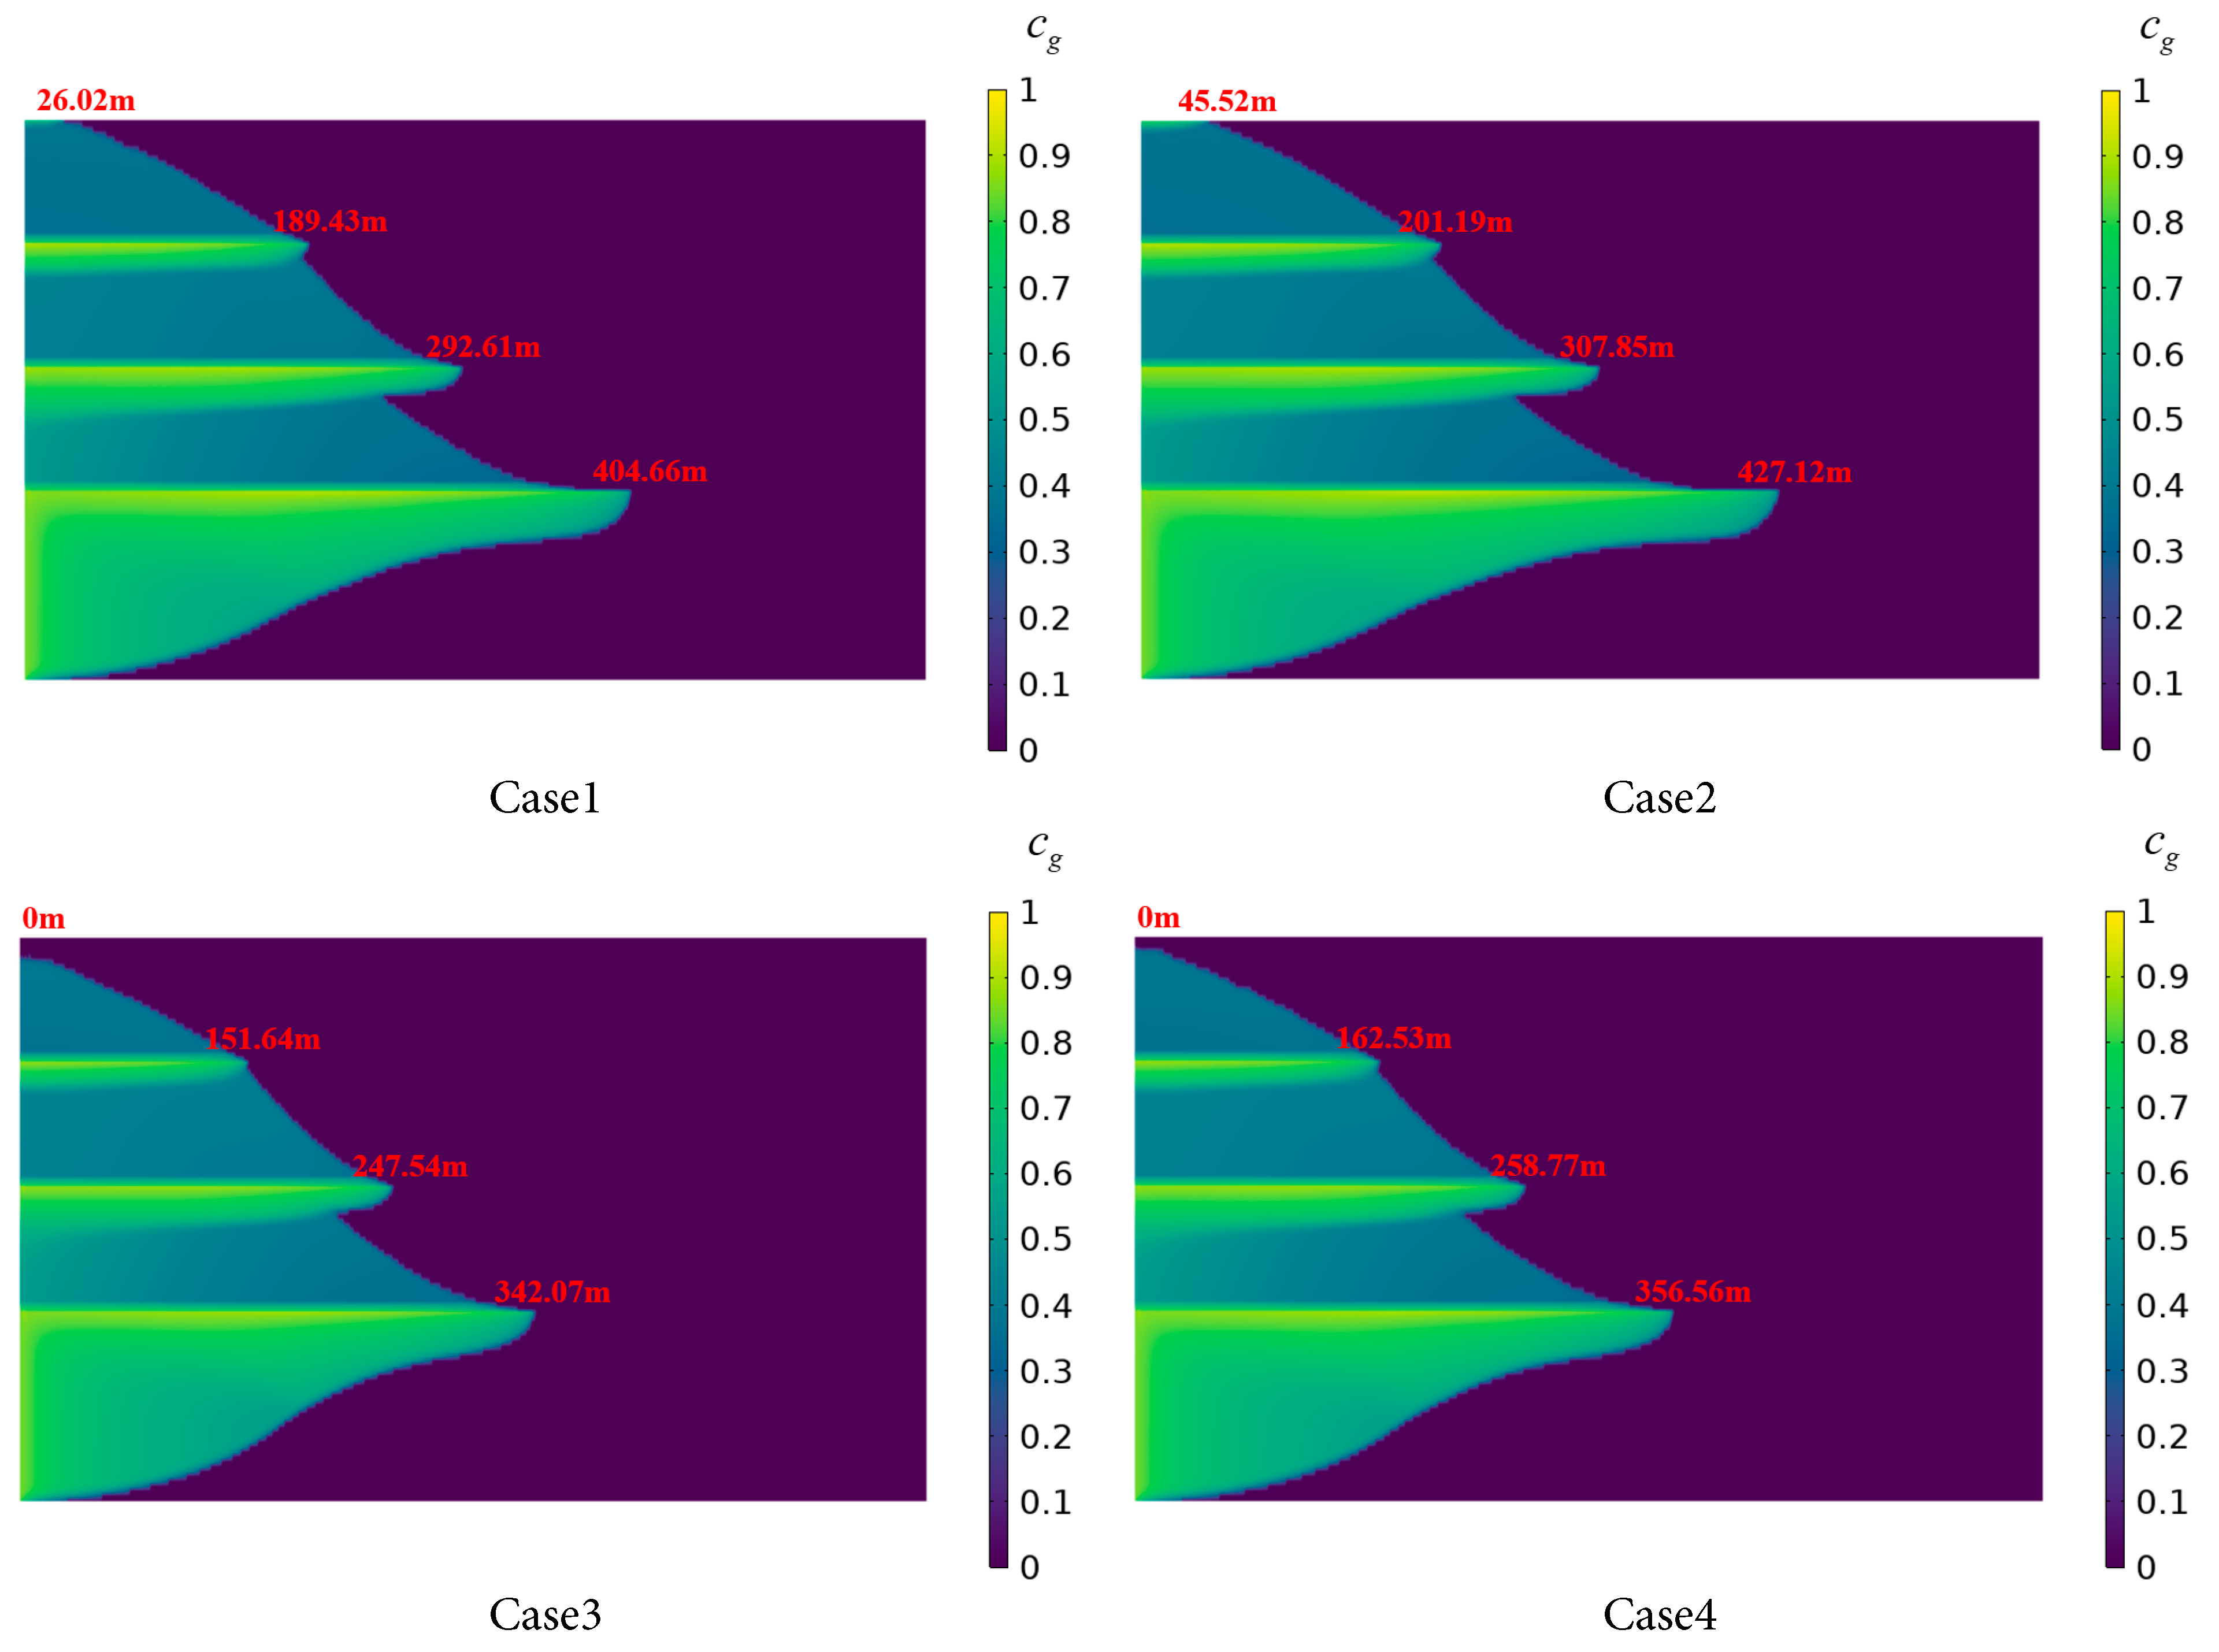
Figure 10: CO2 dissolution distribution in the stratified saline aquifer for different porosity cases.
The impact of reservoir porosity variations on CO2 sequestration efficiency in saline aquifers was analyzed through four numerical cases, with relevant data presented in Fig. 11. The results indicate that in Cases 1 and 2, the CO2 sequestration efficiency across Saline Aquifers 1 to 4 is relatively consistent, exhibiting minor differences and demonstrating stable sequestration performance under these porosity configurations. Similarly, Cases 3 and 4 display comparable sequestration efficiency characteristics within each aquifer layer. Notably, the sequestration efficiency in Saline Aquifers 1 to 3 for Cases 4 is higher than that observed in Cases 1 and 2. This disparity suggests that increased porosity augments CO2 sequestration efficiency in Saline Aquifers 1 to 3. The enhanced efficiency is attributed to a reduced gas-phase migration rate, which extends the contact time between the gas-phase components and the liquid phase, thereby increasing the dissolution of gas-phase components.
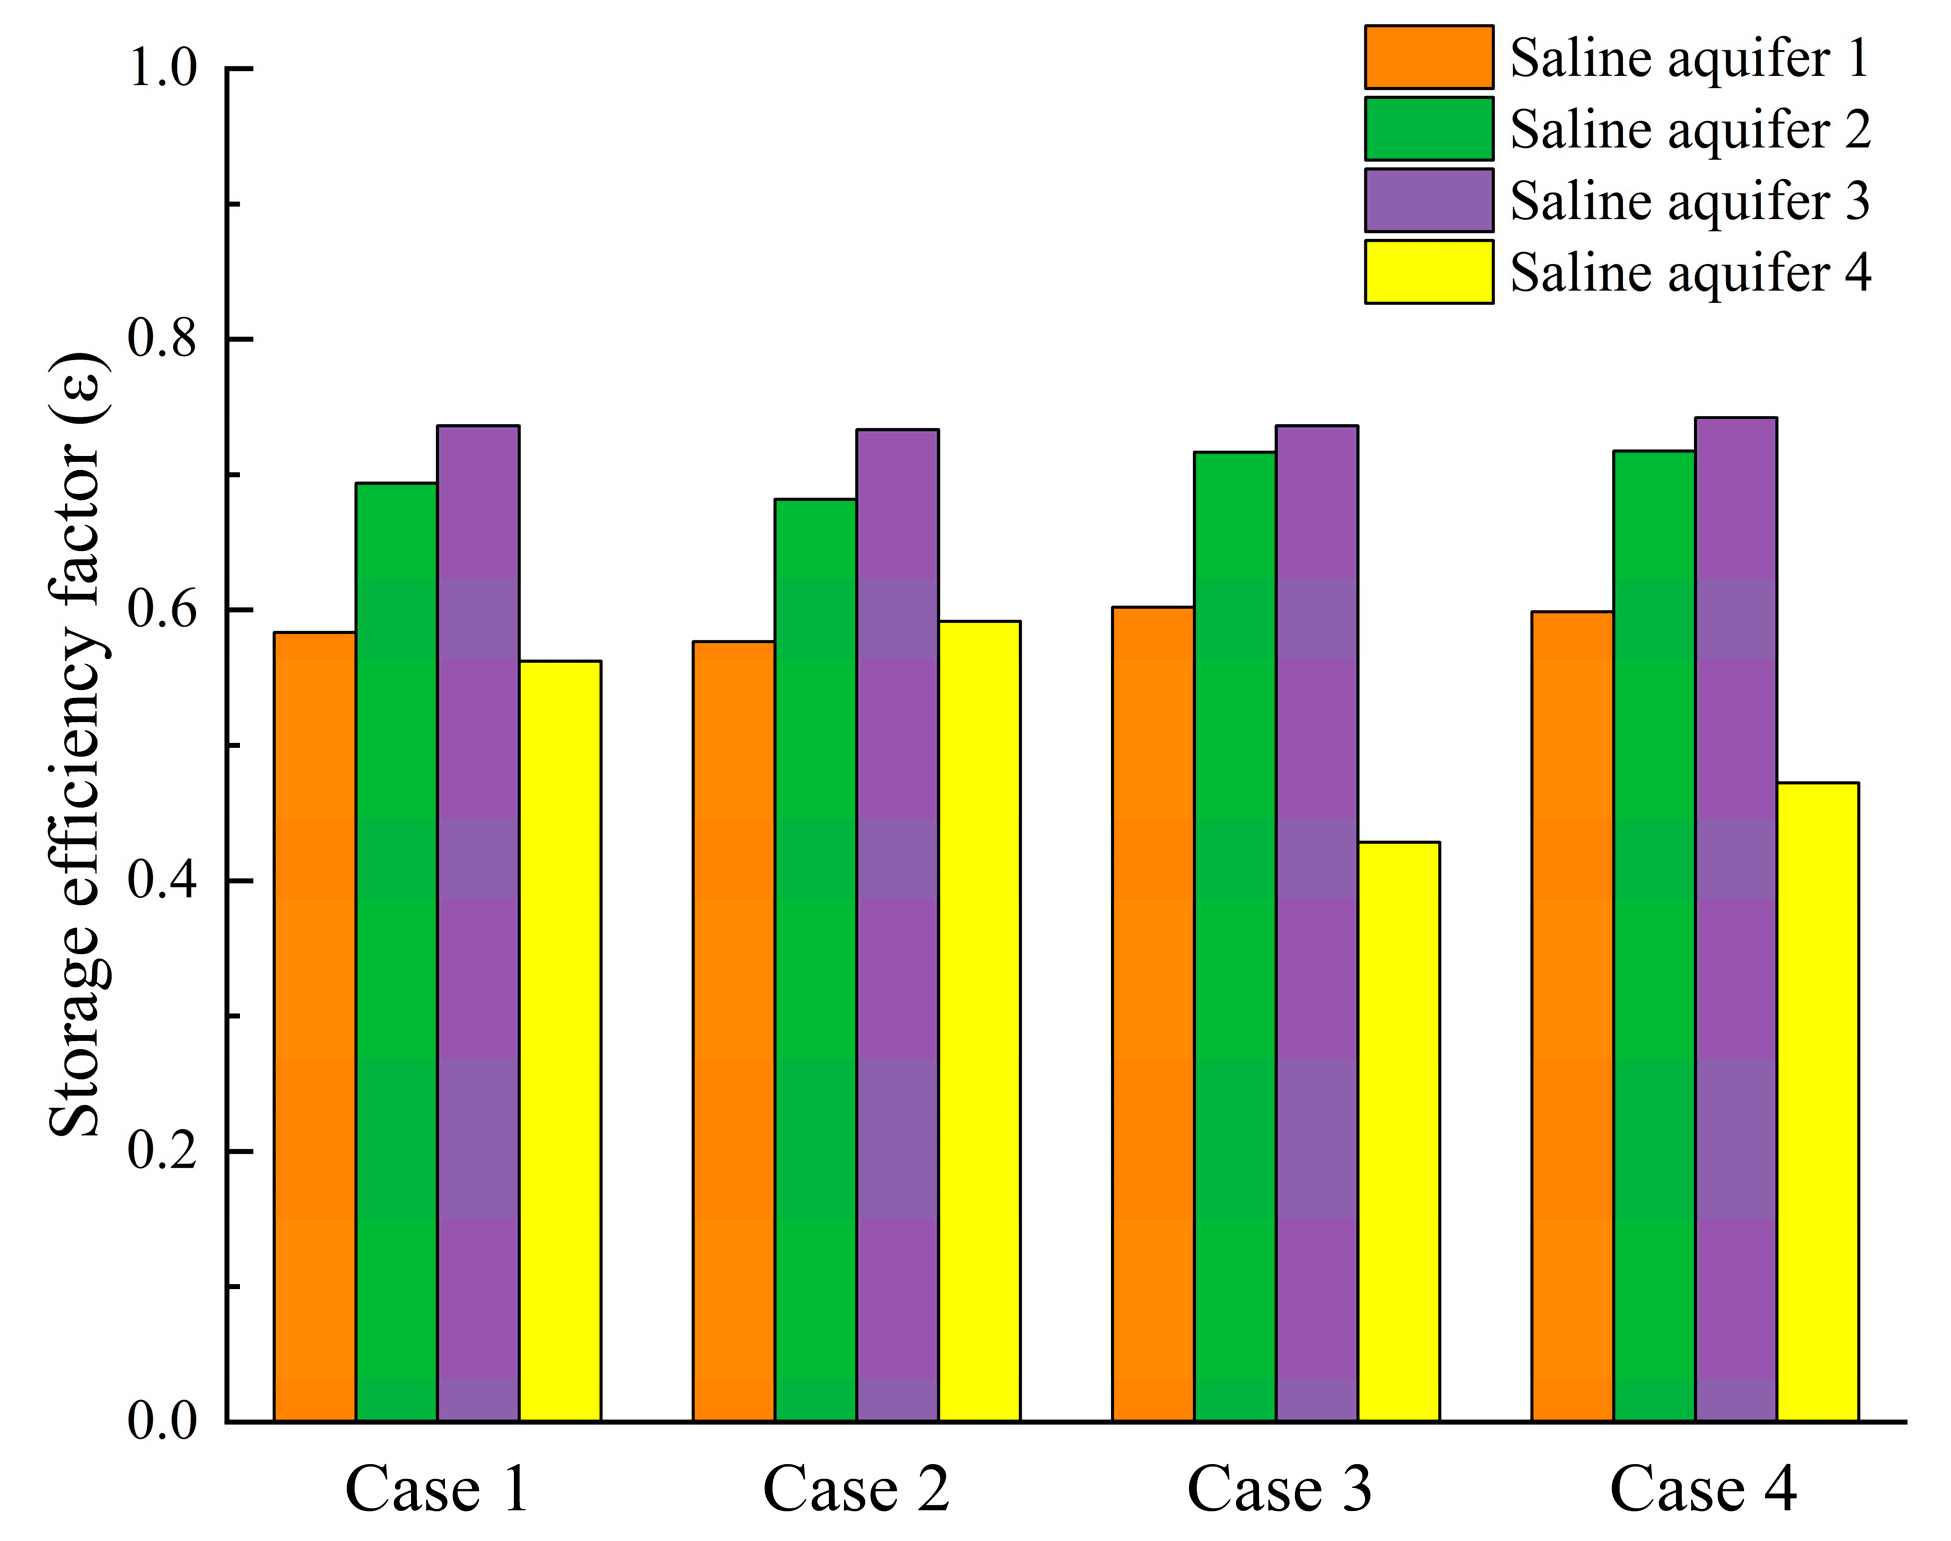
Figure 11: CO2 storage efficiency factors in each layer of the saline aquifer for Cases 1–4.
4.4.2 Impact of Permeability on CO2 Dissolution Characteristics
The formation of carbonate precipitates can alter the connectivity of fluid pathways or increase flow resistance within saline aquifers, thereby modifying permeability. Such changes directly influence the flow paths and dissolution behavior of CO2 in saline aquifers [44]. Permeability heterogeneity plays a critical role in the migration and dissolution processes of CO2, particularly in stratified reservoirs, where variations in permeability across different layers affect convective mixing and dissolution efficiency between fluids [45]. To investigate the impact of permeability on CO2 dissolution behavior in stratified saline aquifers, present study assigns distinct permeability values to each aquifer layer, as illustrated in Fig. 1b.
Uliasz-Misiak et al. [46] studied underground gas storage in saline aquifers, with real-world cases showing significant variations in aquifer permeability. Mahyapour et al. [47] conducted two-dimensional and three-dimensional simulations of random permeability fields, finding that a permeability range of 50–450 mD impacts CO2 dissolution flux and distribution patterns.
To address the heterogeneity requirements for CO2 sequestration in stratified saline aquifers and to investigate the factors influencing gas migration, this study examines the impact of permeability variations across different sandstone layers on CO2 dissolution behavior. The following permeability variation schemes were evaluated in the saline aquifers, with porosity uniformly set to 0.25. Details of the numerical cases are listed in Table 4.
Table 4: Settings for different permeability distribution cases.
| Numerical Example | Permeability K1 (mD) | Permeability K2 (mD) | Permeability K3 (mD) | Permeability K4 (mD) |
|---|---|---|---|---|
| Case 1 | 50.65 | 50.65 | 50.65 | 50.65 |
| Case 2 | 101.3 | 101.3 | 101.3 | 101.3 |
| Case 3 | 50.65 | 101.3 | 151.95 | 202.6 |
| Case 4 | 202.6 | 151.95 | 101.3 | 50.65 |
Fig. 12 illustrates the CO2 dissolved concentration distribution in brine for the four case settings at an injection duration of 600 days. Cases 1 and 2, characterized by uniform permeability distributions, show CO2 migration to the tops of Saline Aquifers 1 to 3 due to buoyancy, forming high-saturation zones. In Case 1, the radial dissolution distance in Saline Aquifer 1 is 271.33 m, whereas the distance reaches 363.66 m in Case 2, demonstrating a greater radial dissolution rate in Case 2. Based on the radial dissolution distances in Saline Aquifer 1 for Case 1 and Case 2, a 10 mD increase in permeability results in an approximate increase of 18 m in the radial dissolution distance of CO2. The radial dissolution distance in Saline Aquifers 2 to 4 exhibit negligible variations between the two cases. This suggests that, at a constant CO2 injection rate, higher permeability facilitates radial CO2 migration, increasing the contact interface between the gas and liquid phases. Additionally, CO2 migration is predominantly lateral due to the barrier posed by low-permeability shale layers, which reduces the dissolution rate in the upward direction.
Cases 3 and 4 employ reverse-order permeability distributions, as shown in Table 4. In Case 3, the radial dissolution distance in Saline Aquifer 1 is 240.91 m, compared to 265.27 m in Saline Aquifer 2, with the latter demonstrating a greater dissolution distance attributable to its higher permeability. This facilitates the migration of CO2 through the shale layer into Saline Aquifer 2, where it undergoes continued dissolution. As vertical distance increases and permeability rises, the radial dissolution distance of CO2 in Saline Aquifer 3 reaches 185.35 m, reflecting a difference of 55.56 m compared to Saline Aquifer 1, while the disparity in CO2 dissolution distance between Saline aquifers 1 and 3 narrows relative to Cases 1 and 2. This indicates that a vertically increasing permeability gradient in stratified saline aquifers promotes CO2 dissolution in upper aquifers. In Case 4, the radial dissolution distance of CO2 in Saline Aquifer 1 reaches 433.29 m, surpassing that of the other three cases, indicating that higher permeability in Saline Aquifer 1 facilitates radial CO2 migration, approximately 59.7% greater than in Case 1. Conversely, Saline Aquifer 2 and 3 exhibit the shortest radial dissolution distances. These findings suggest that, within stratified saline aquifer systems, injecting CO2 into layers with greater permeability can effectively reduce vertical CO2 migration and augment entrapment.
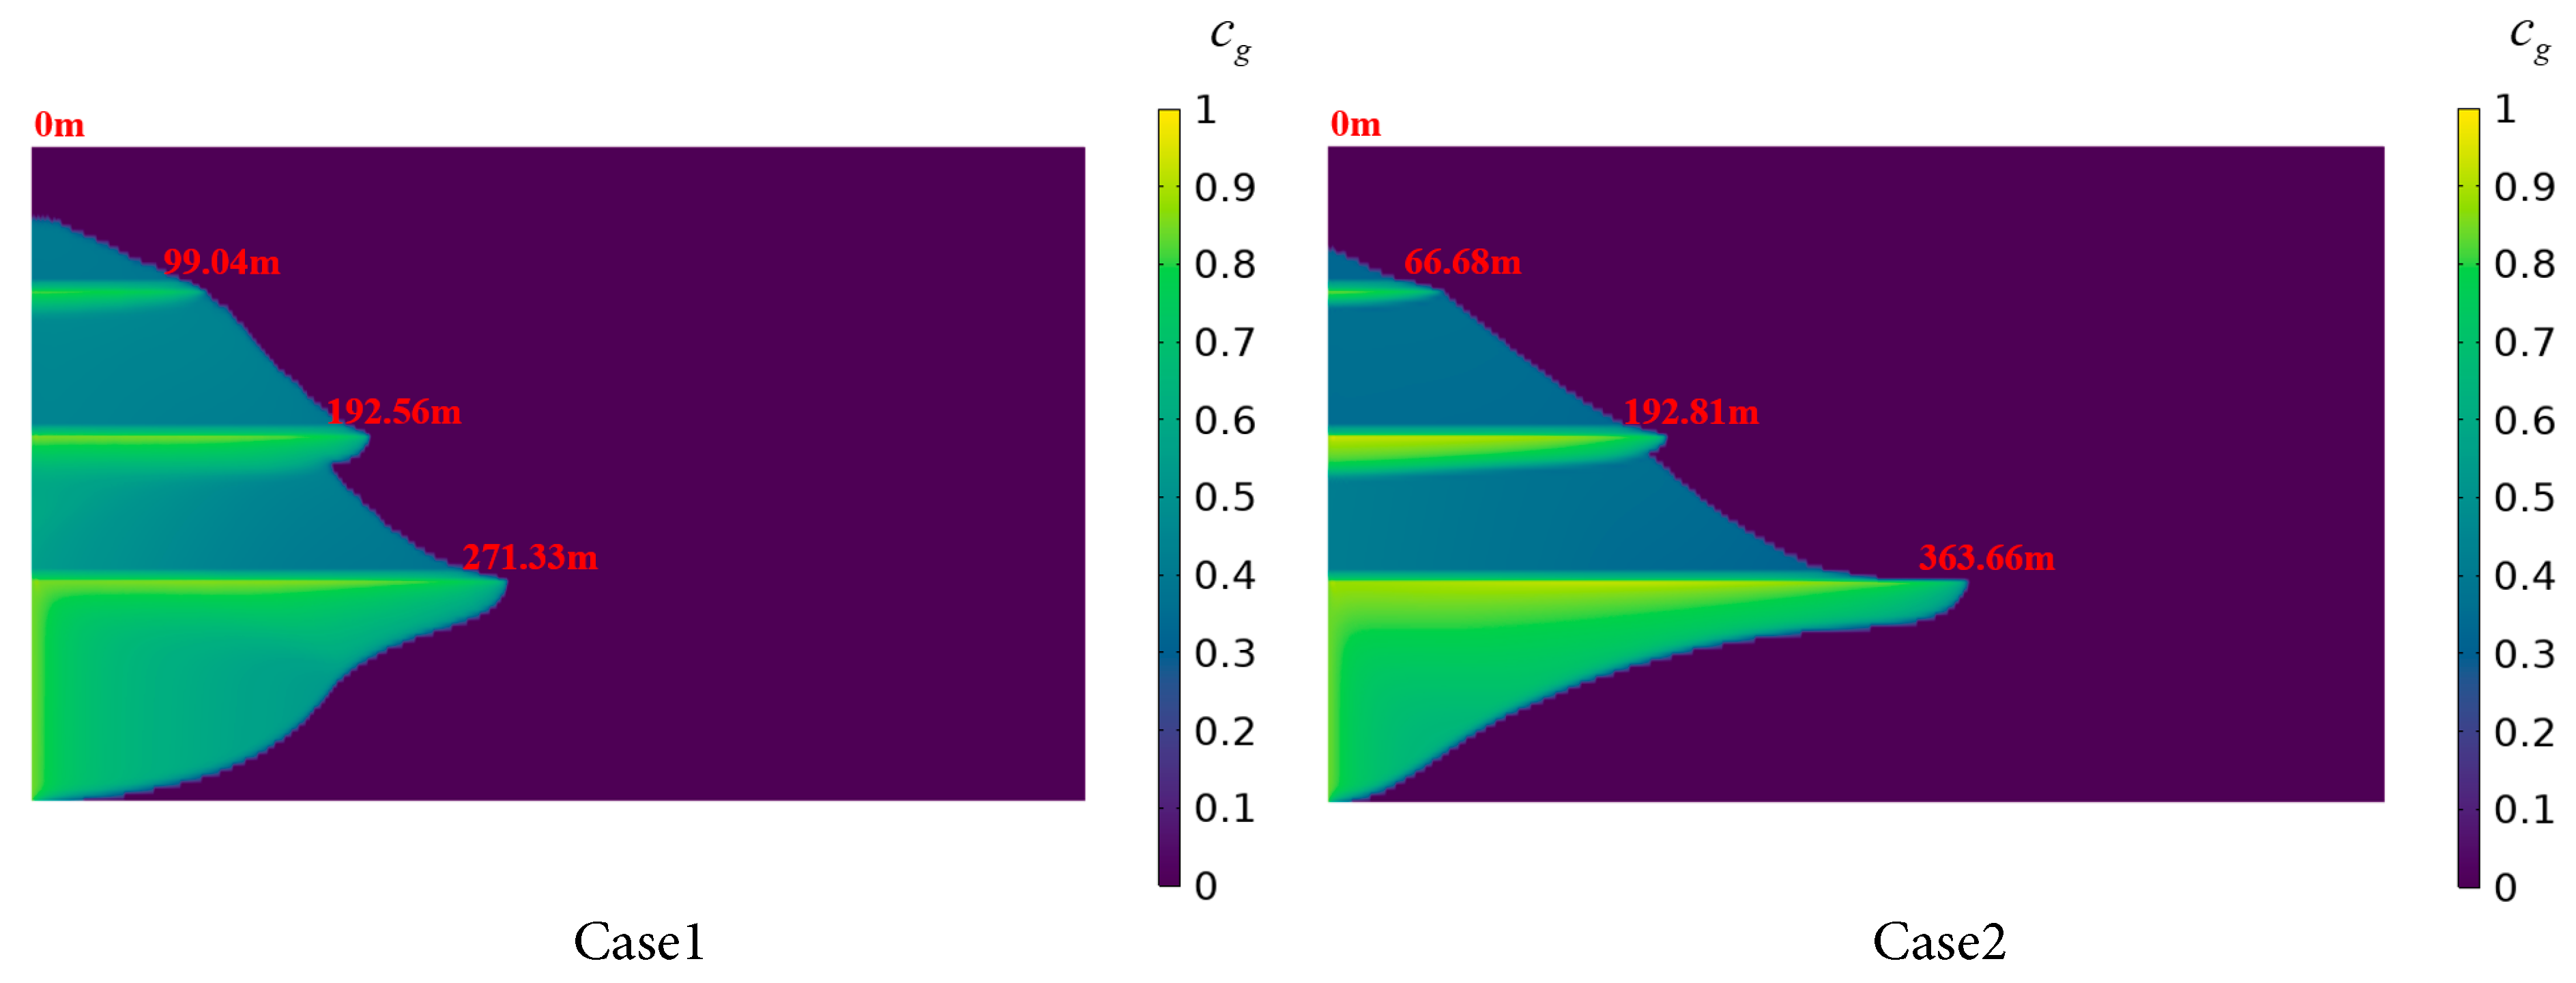
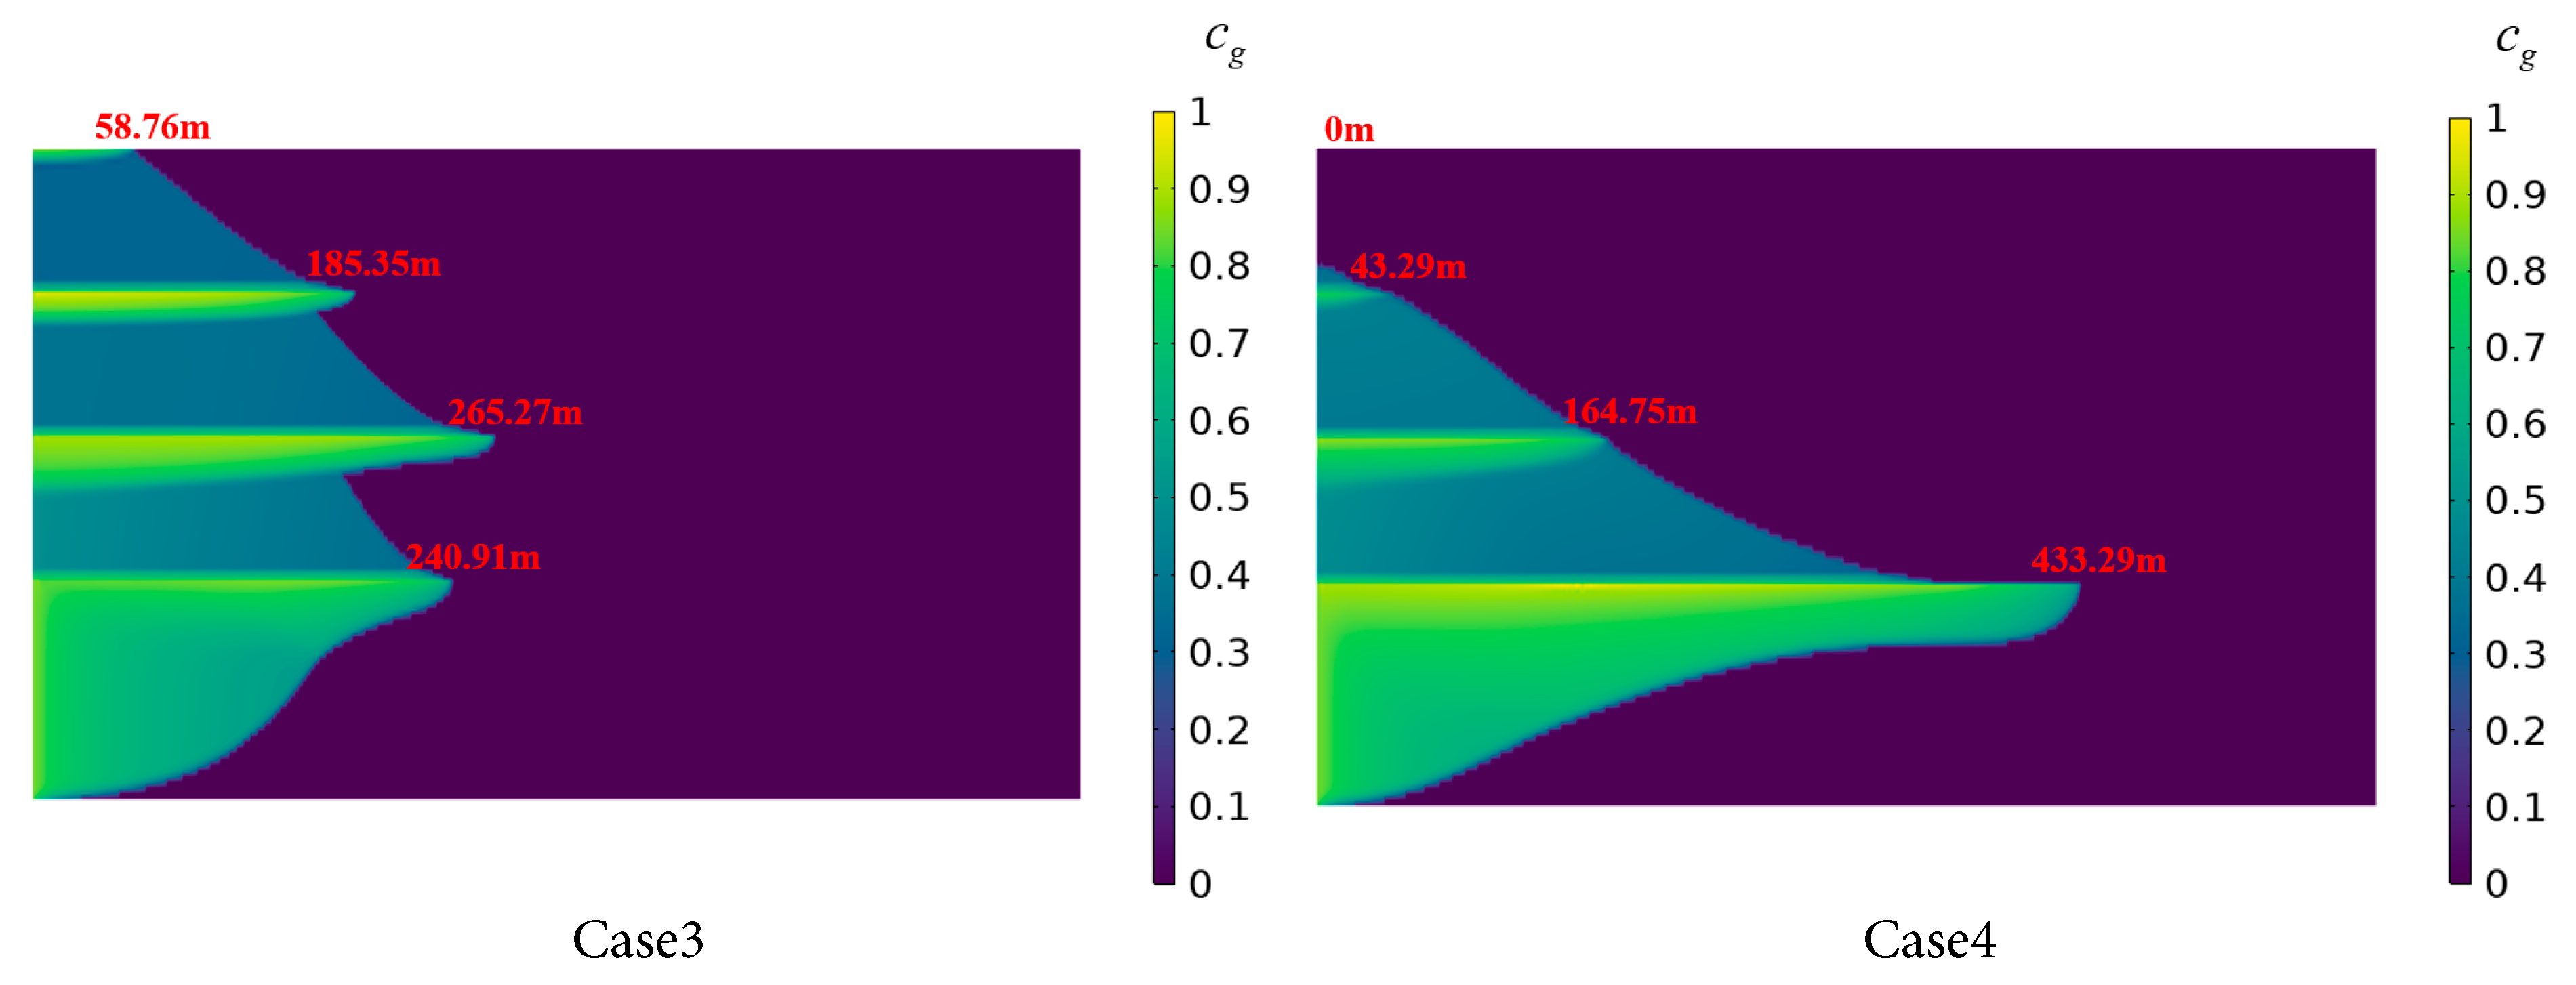
Figure 12: CO2 dissolution distribution in the stratified saline aquifer for different permeability cases.
In the macroscopic Darcy-type flow equation, the macroscopic capillary number is calculated using Eq. (20) [48].
Fig. 13 illustrates the trends of gas-phase saturation and brine saturation as a function of capillary number at grid block E (20, 49), located below a low-permeability shale layer in the stratified saline aquifer. As described by Eq. (20), the capillary number is a dimensionless parameter that quantifies the relative strength of viscous forces to capillary forces during CO2 injection into the saline aquifer. Fig. 13a shows that as the capillary number increases, the gas-phase saturation exhibits an S-shaped increase. At low capillary numbers, where capillary forces predominate, Cases 3 and 4 exhibit a gradual increase in gas-phase saturation, whereas at high capillary numbers, the dominance of viscous forces results in stabilized gas-phase saturation. Despite corresponding to different layers, Cases 1 and 3 share identical permeability in Saline Aquifer 1, leading to similar capillary number evolution processes. In contrast, Case 4 exhibits permeability in Saline Aquifer 1 twice that of Case 2. With a higher capillary number, Case 4 demonstrates faster radial migration of CO2, indicative of enhanced CO2 diffusion and dissolution driven by higher permeability.
Fig. 13b demonstrates that as the capillary number increases, the liquid-phase saturation gradually decreases. At low capillary numbers, the ability to displace brine by CO2 is constrained across all cases, resulting in significant brine retention. As the capillary number increases, brine within the pores is progressively displaced and dissolved into the surrounding brine. Case 3 is sensitive to changes in the capillary number, as the lower permeability in the Saline Aquifer 1 increases flow resistance for CO2 within the pores. The flow resistance makes the displacement of brine more responsive to increases in the capillary number, leading to a more pronounced reduction in liquid-phase saturation.
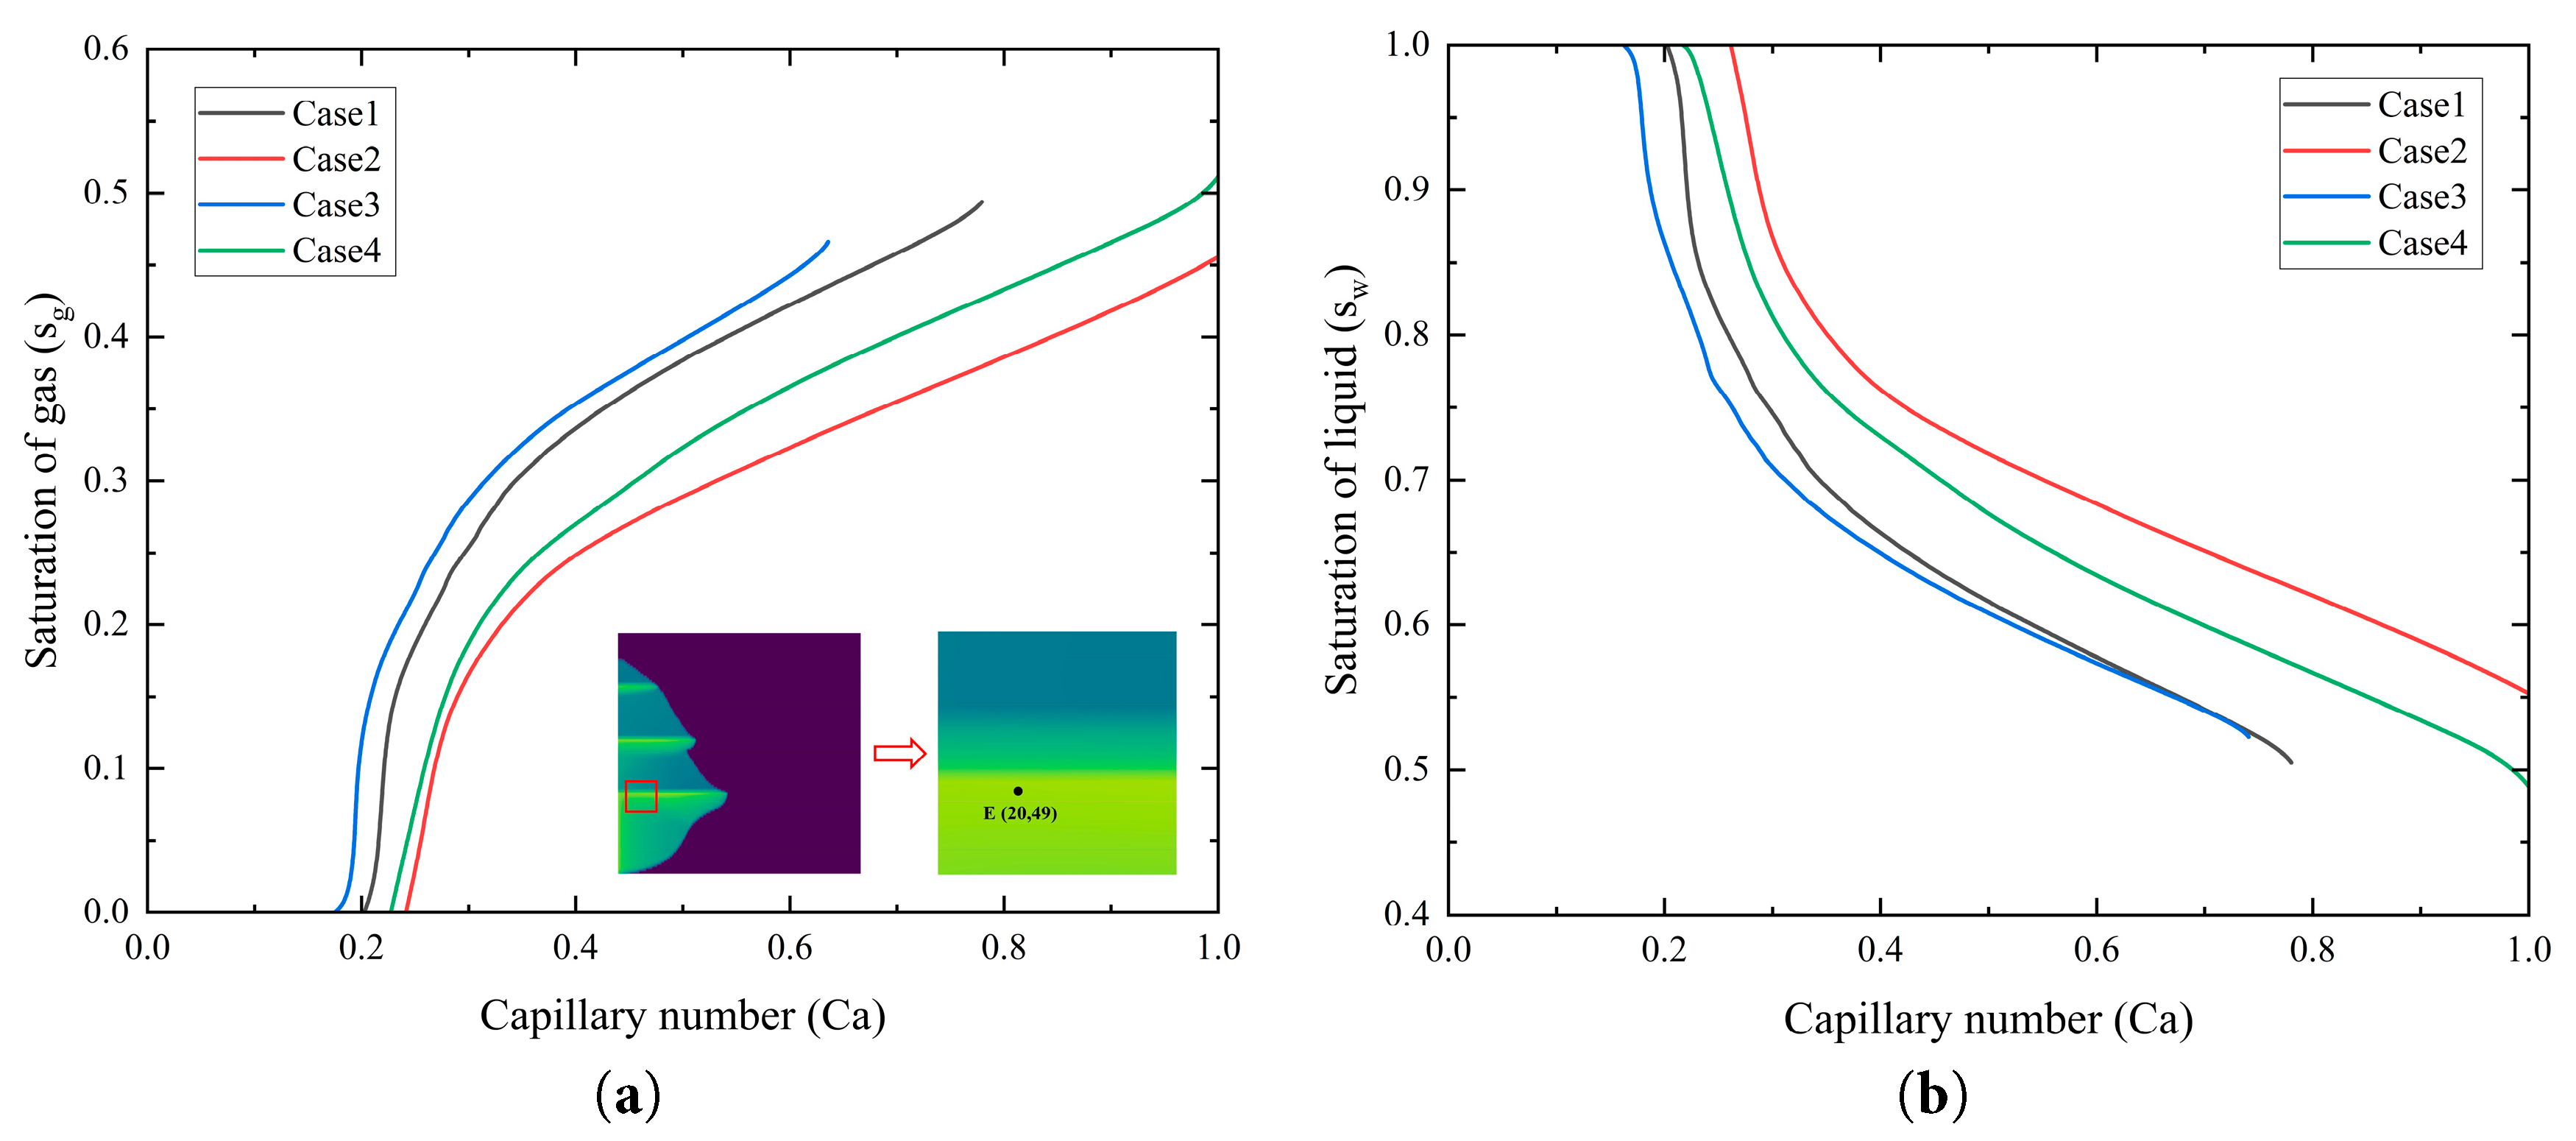
Figure 13: The saturation distribution at grid E for different permeability cases: (a) gas phase saturation variation with capillary number; (b) liquid phase saturation variation with capillary number.
4.4.3 Impact of Injection Rate on CO2 Dissolution Characteristics
To systematically investigate the influence of injection rate on CO2 migration and dissolution in saline aquifers, four distinct cases were established, as detailed in Table 5. These cases correspond to injection rates of 0.25 × 10⁻⁶ m/s, 0.5 × 10⁻⁶ m/s, 0.75 × 10⁻⁶ m/s, and 1 × 10⁻⁶ m/s, respectively. All cases were calibrated to ensure the reliability and accuracy of the simulation results. By analyzing the results of the cases in comparison, the present study evaluates the effects of injection rate on CO2 distribution characteristics, migration trends, and dissolution behavior in the saline aquifers.
Table 5: Settings for different injection rate cases.
| Numerical Example | Injection Rate | Injection Time |
|---|---|---|
| Case 1 | 0.25 × 10⁻⁶ m/s | 750 days |
| Case 2 | 0.5 × 10⁻⁶ m/s | 750 days |
| Case 3 | 0.75 × 10⁻⁶ m/s | 750 days |
| Case 4 | 1 × 10⁻⁶ m/s | 750 days |
Fig. 14 illustrates the dissolution mechanisms of CO2 in stratified saline aquifers under different injection rates, with an injection duration of 750 days. In Case 1, with a low injection rate, CO2 migration and dissolution are limited across Saline Aquifers 1 to 4. The radial dissolution distance in Saline Aquifer 1 is 230.17 m, with only a minimal amount of CO2 diffusing to the uppermost aquifer layer, though the vertical dissolution rate is relatively high. Compared to Case 1, Case 2 employs a higher injection rate, resulting in a significantly increased radial diffusion distance of the CO2 plume, reaching 321.04 m in the Saline Aquifer 1. The contact area between supercritical CO2 and brine in Saline Aquifers 2 to 4 also expands, with an enlarged high-concentration zone and a flatter concentration gradient, leading to a more uniform distribution of dissolved CO2 across the layers.
In Cases 3 and 4 with higher injection rates, the CO2 plume exhibits amplified vertical thickness and achieves radial dissolution distances within Saline Aquifer 1 of 455.49 m and 562.47 m, respectively, surpassing the corresponding distances in Cases 1 and 2 by over 100 m. This indicates that higher injection rates intensify the gas-liquid contact dissolution and the growth of viscous fingering of CO2 in the brine. Additionally, enhanced horizontal migration of the CO2 plume beneath the shale layer strengthens the displacement of formation brine, thereby promoting CO2 dissolution and sequestration, and increasing the dissolved CO2 volume. Overall, the dissolution distribution of CO2 in stratified saline aquifers varies with increasing injection rates. After 750 days, as the injection rate increases from 0.25 × 10⁻⁶ m/s to 1 × 10⁻⁶ m/s, both the radial migration rate and the dissolved CO2 concentration show marked improvements. For every 0.25 × 10⁻⁶ m/s increase in injection rate, the radial dissolution distance of CO2 in Saline Aquifer 1 increases by approximately 100–120 m on average. Higher injection rates enhance the dissolution efficiency of CO2 but may simultaneously elevate the risk of leakage. This occurs because increased injection rates lead to a greater vertical extent of the CO2 plume, thereby facilitating the migration of more CO2 through the pore spaces of Shale layers 1 to 3 into the upper saline aquifers. Therefore, in the design of CO2 geological sequestration, optimizing the injection rate is critical to balancing storage efficiency and safety.
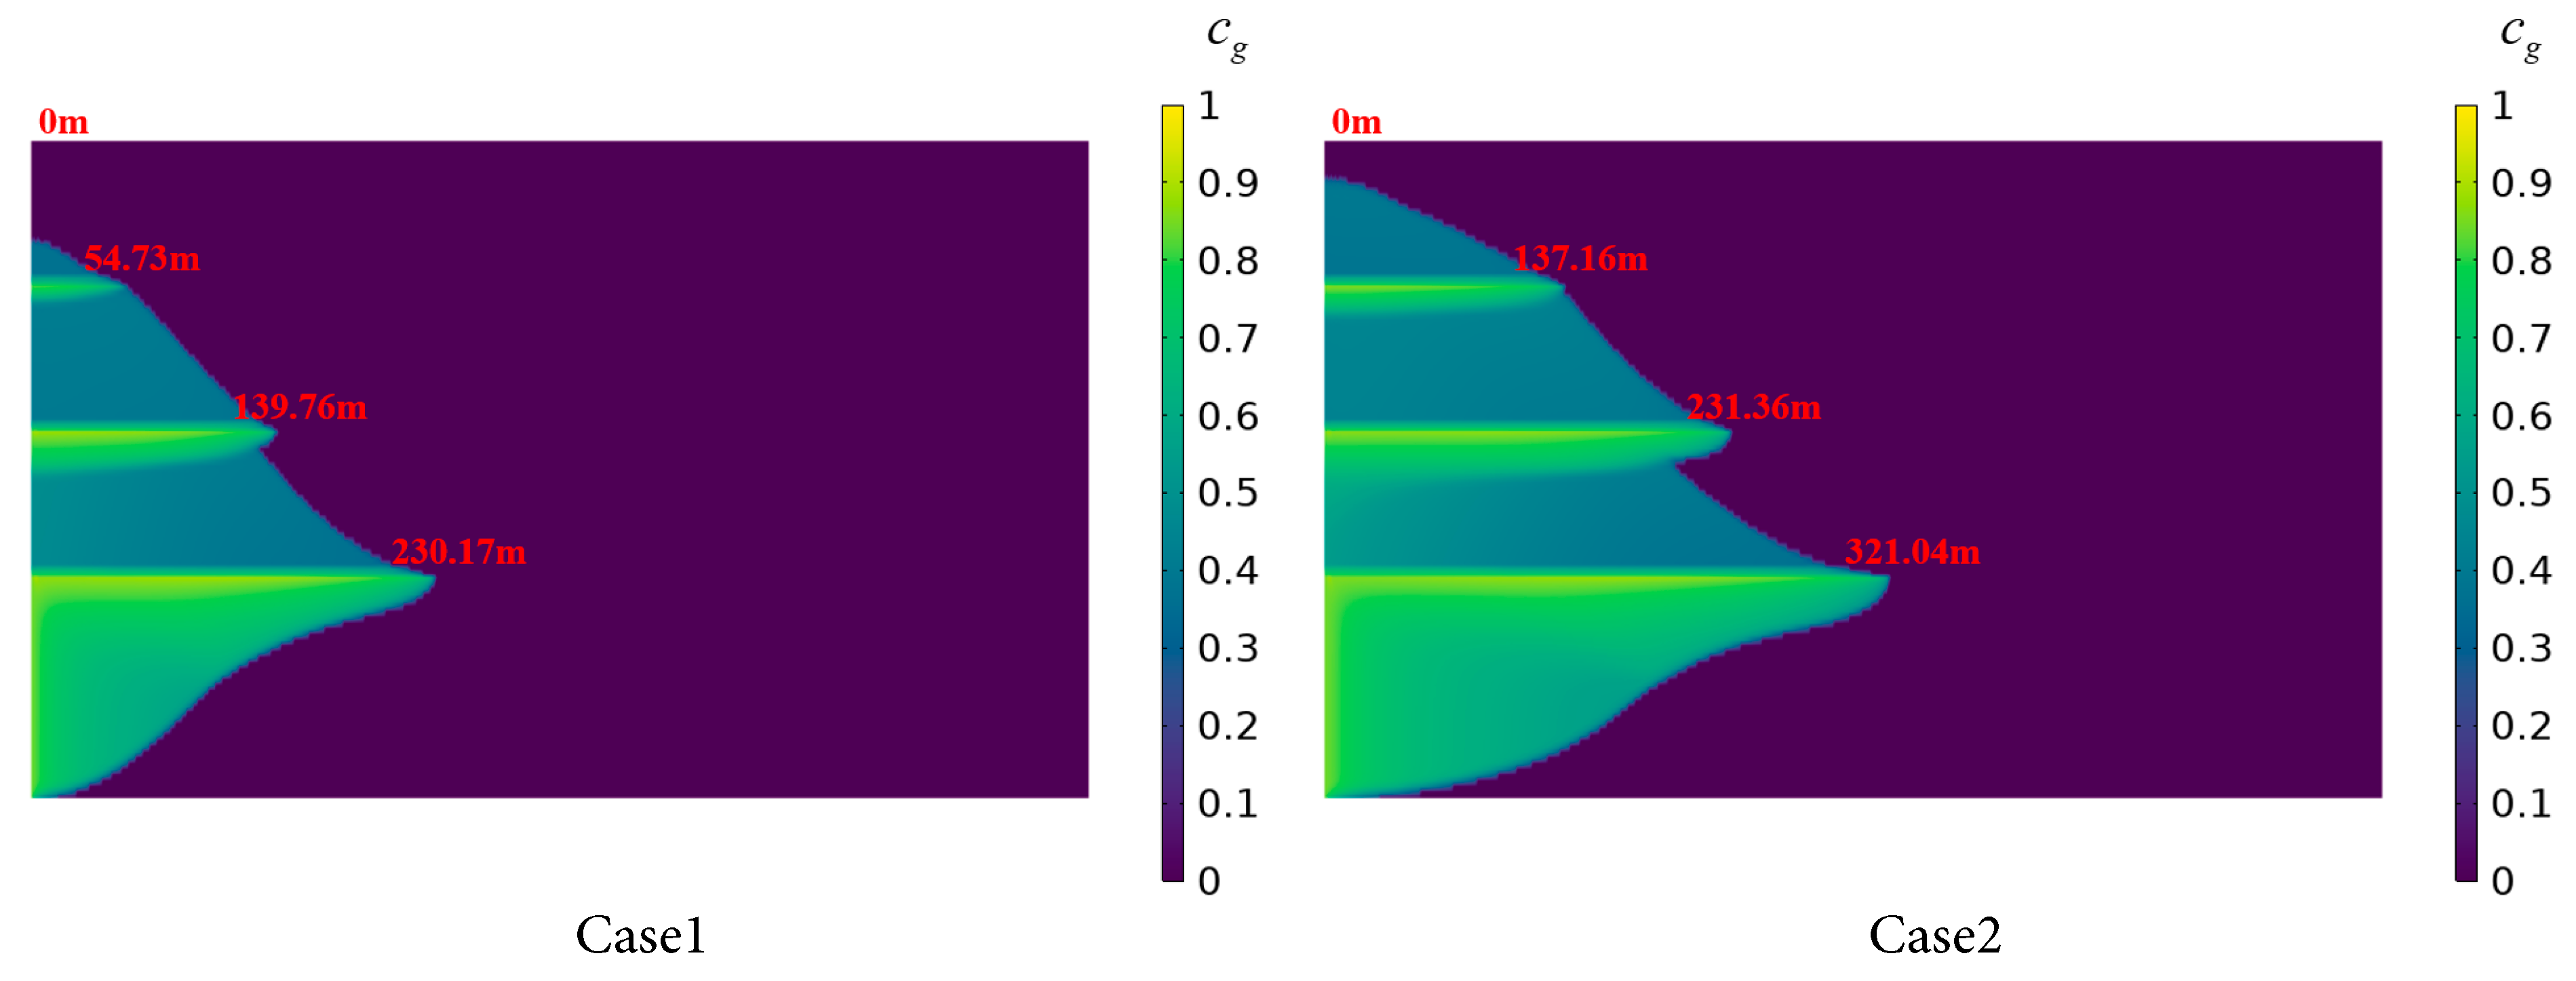
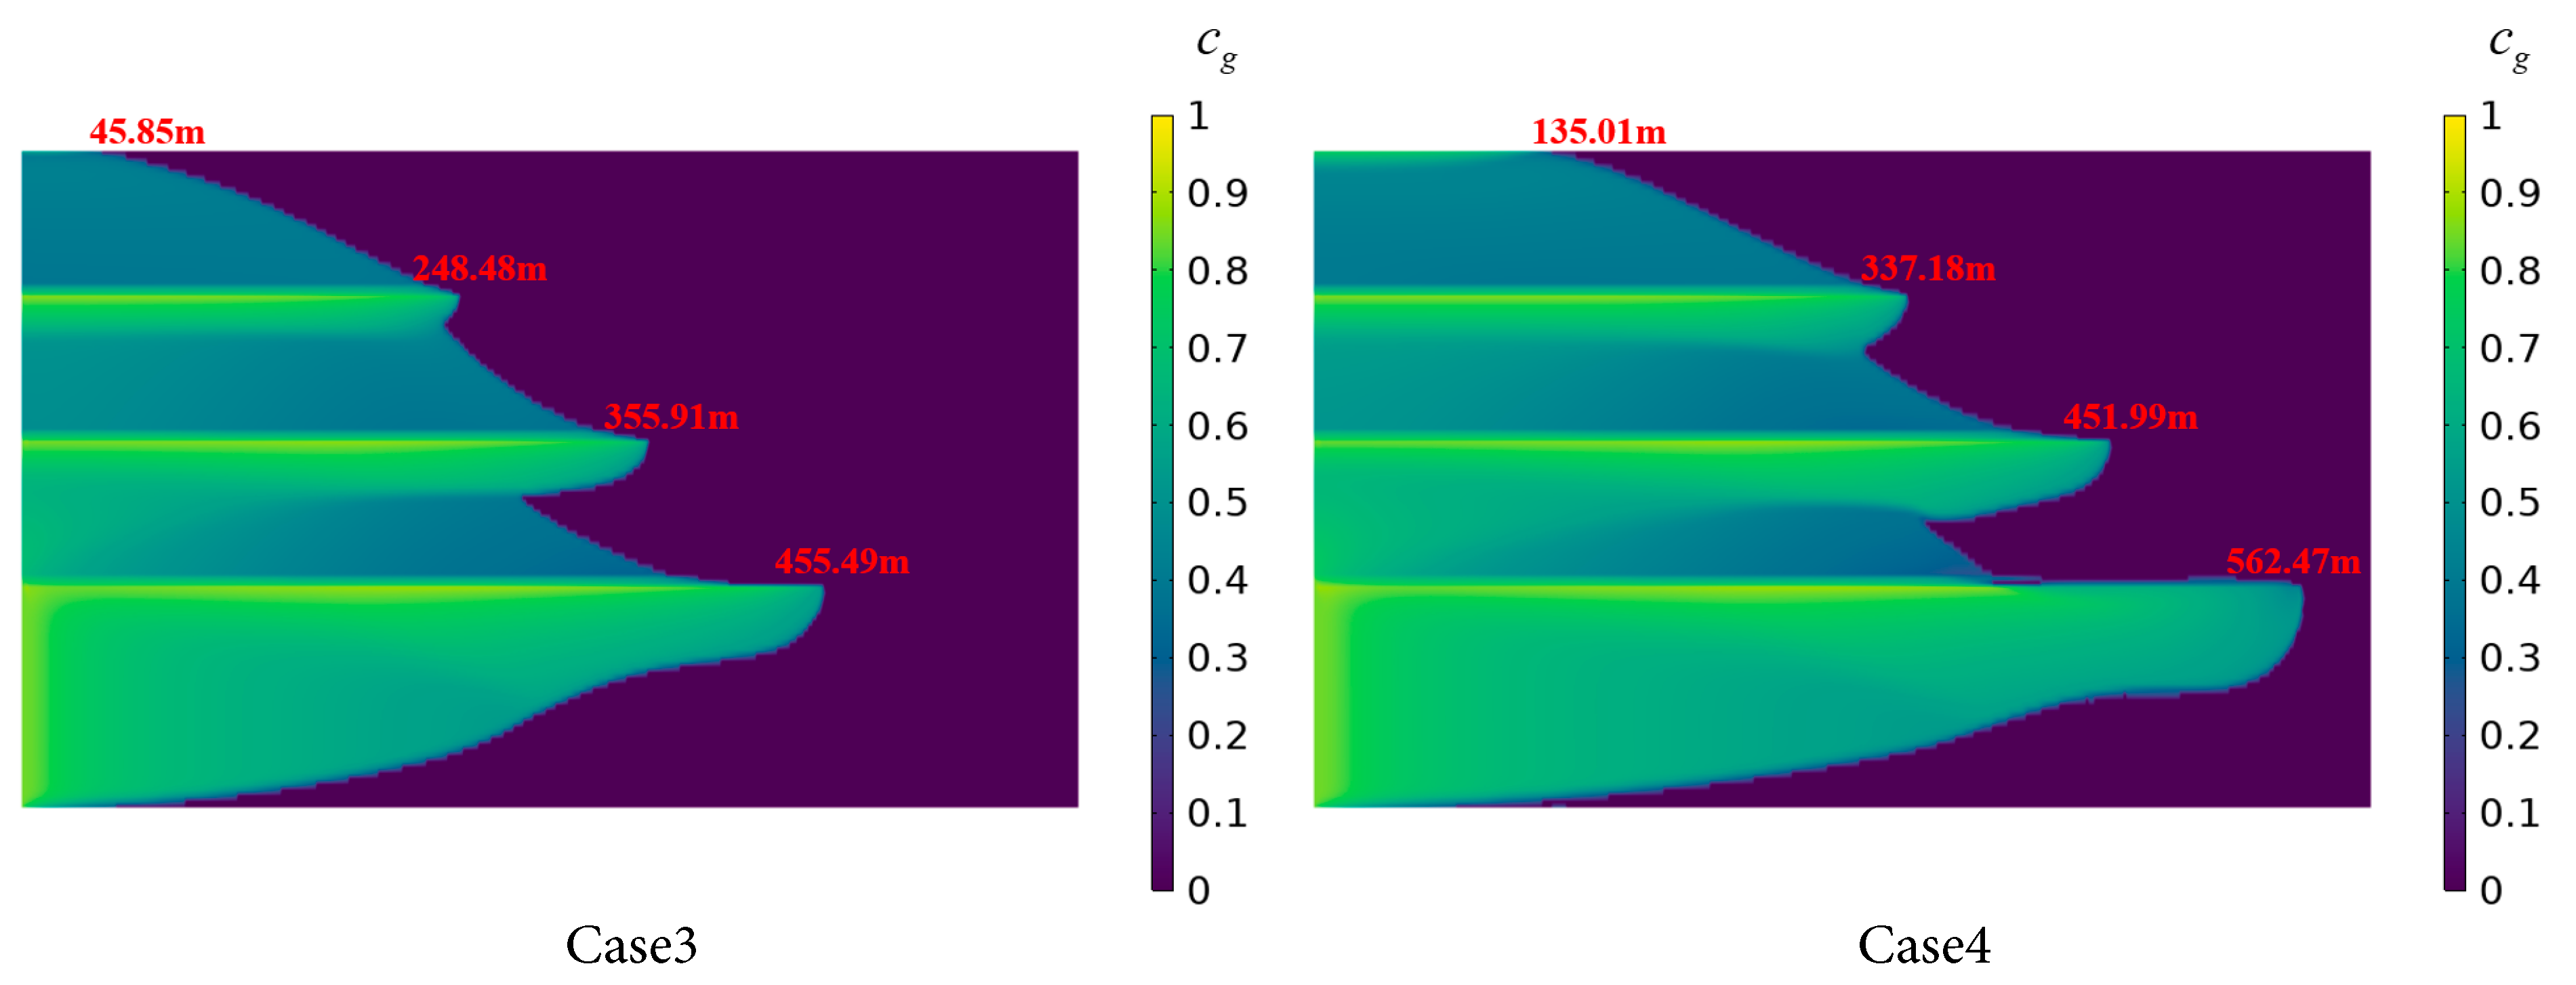
Figure 14: CO2 dissolution distribution in the stratified saline aquifer for different injection rate cases.
Fig. 15 presents a comparative analysis of CO2 sequestration efficiency across the layers of saline aquifers for four different cases after 600 days of injection. As the injection rate increases, the sequestration efficiency of supercritical CO2 exhibits a corresponding improvement. The trend aligns with the dissolution distribution findings discussed earlier, where higher injection rates intensify CO2-brine mixing and dissolution processes, thereby improving CO2 sequestration efficiency. This enhancement is attributed to the prolonged contact time between CO2 and the reservoir medium, which increases the dissolution rate. Furthermore, the positive correlation between injection rate and sequestration efficiency is consistently observed across Saline Aquifers 1 to 4 in all four cases, indicating the robustness of the relationship.
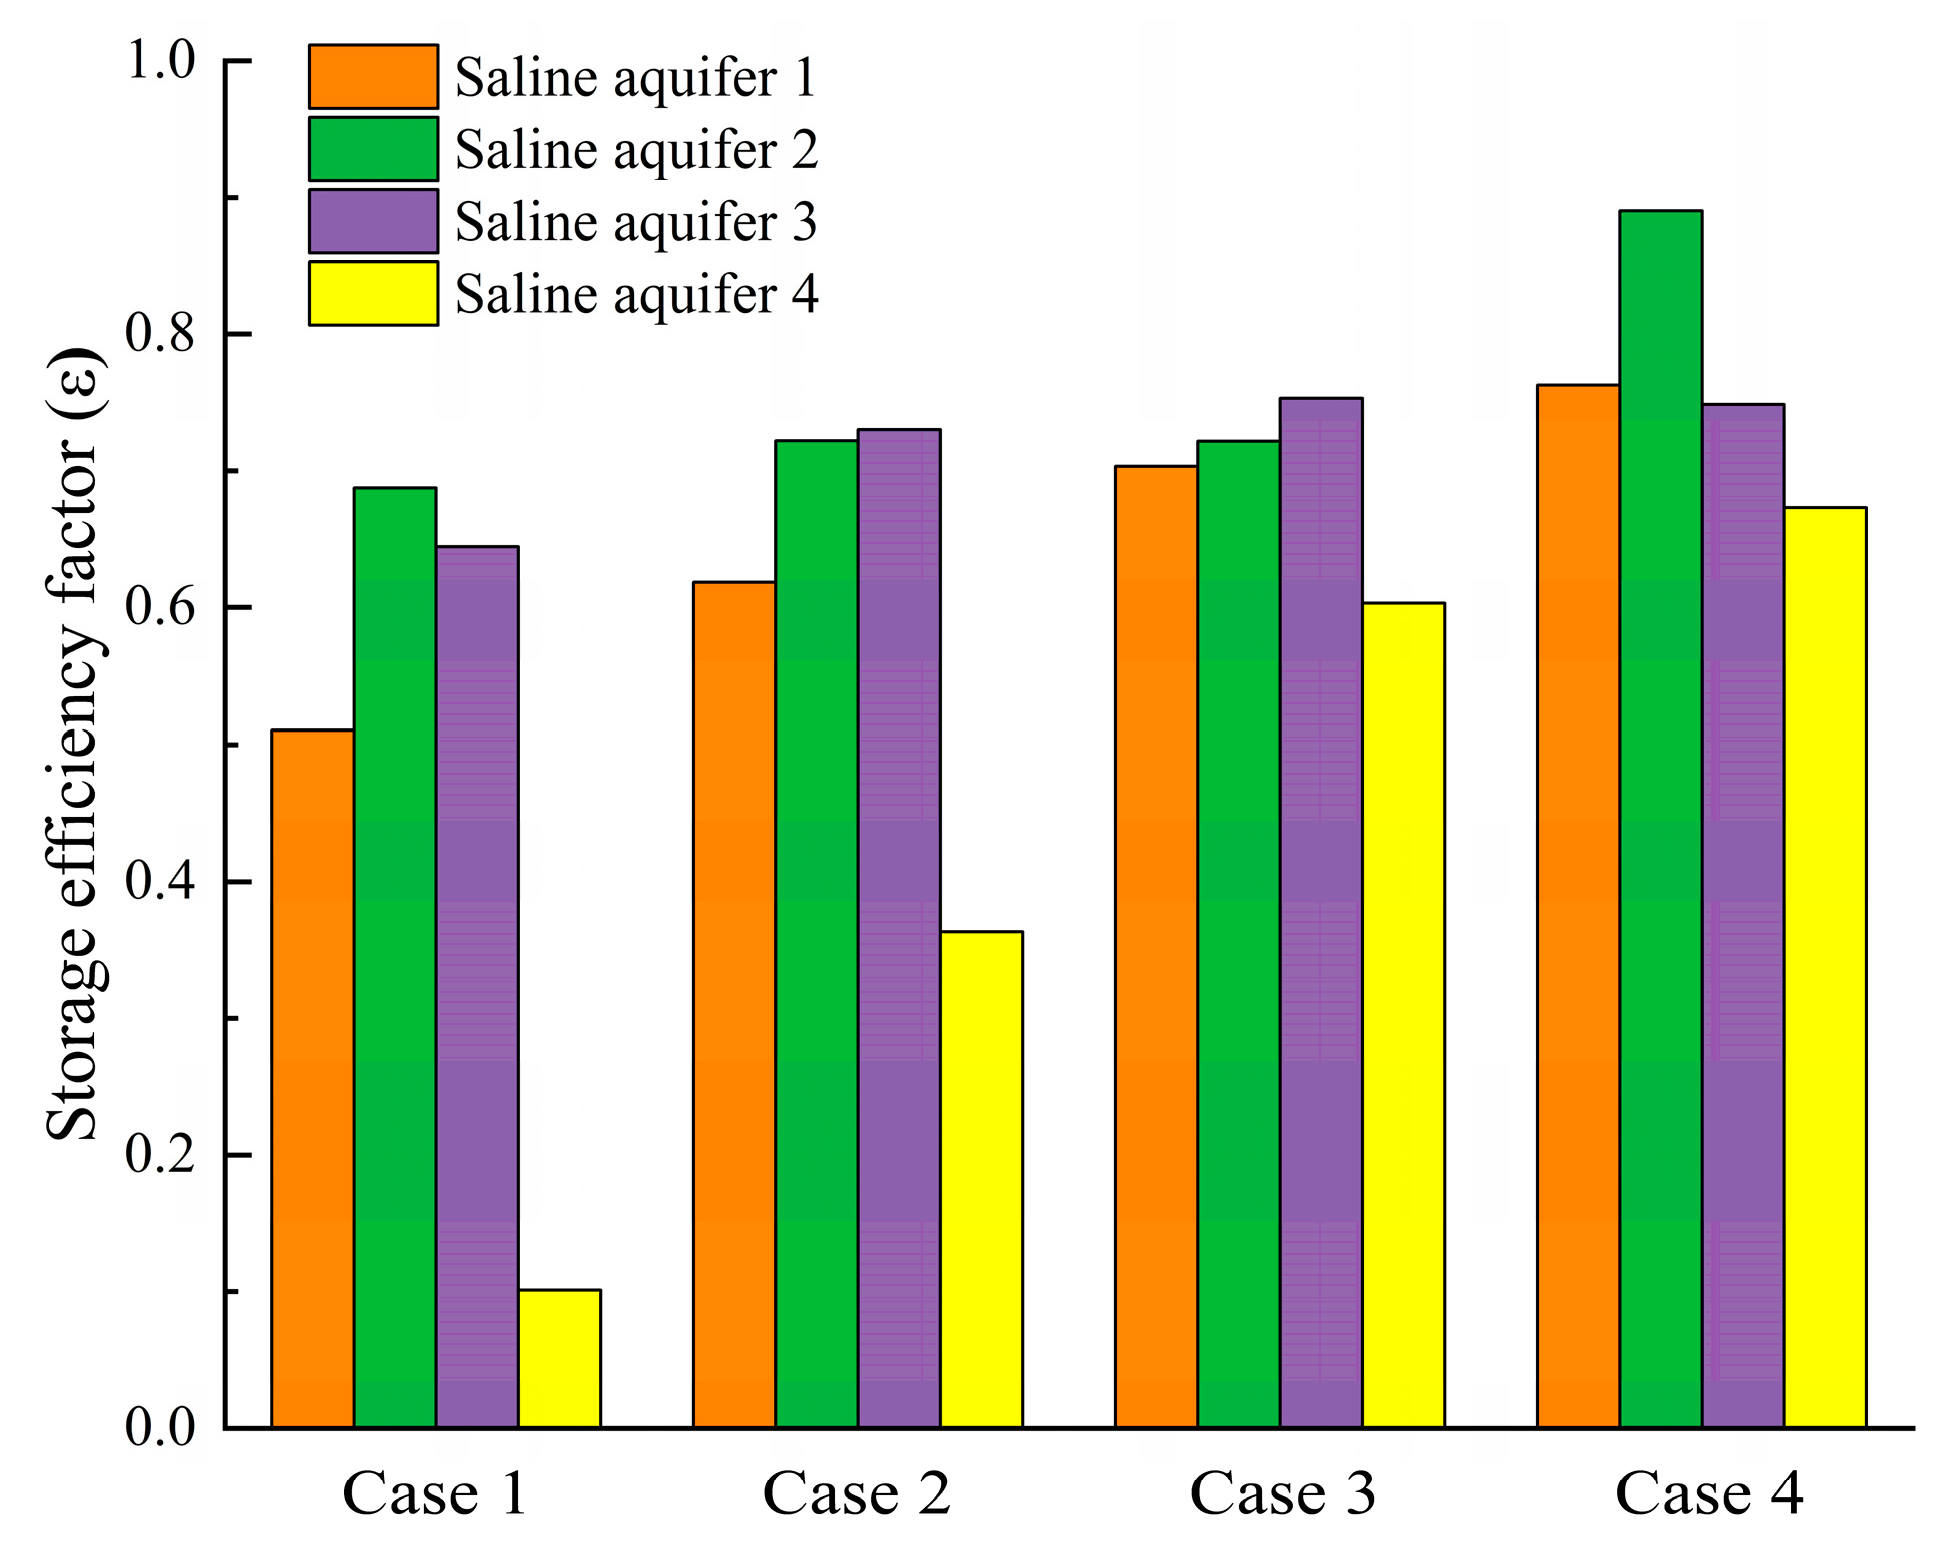
Figure 15: CO2 storage efficiency factors in each layer of the saline aquifer for Cases 1–4.
4.4.4 Nonlinear Multi-Parameter Modeling of CO2 Sequestration Efficiency Based on a Power-Law Function
From the foregoing analysis, it is evident that storage efficiency factor is influenced by reservoir porosity, permeability, and injection rate. This section employs a power-law function for sensitivity analysis to evaluate the extent to which porosity, permeability, and injection rate influence CO2 dissolution and storage. To quantify their nonlinear dependencies, this study employs a power-law function to construct a multi-parameter coupled model, as expressed in Eq. (23).
The coefficient of determination
The residual sum of squares,
The total sum of squares,
The root mean square error, RMSE, represents the average deviation between predicted and actual values, with smaller values indicating better performance, as expressed in Eq. (27).
The present study utilizes the least squares method to fit the storage efficiency factor of stratified saline aquifers, obtaining an empirical equation, as shown in Table 6.
Table 6: Least squares fitting results for the storage efficiency formula.
| Dependent Variable | Fitted Equation | ||
|---|---|---|---|
| 0.969 | 0.019 |
The
Based on the fitted equation, the exponent
This study employs numerical simulations to investigate the injection of supercritical CO2 at a constant rate into stratified deep saline aquifers, with a focus on analyzing the saturation distribution of CO2 and the temporal evolution of CO2 dissolution across the stratified saline aquifer. The influences of porosity heterogeneity, permeability, and injection rate on CO2 dissolution behavior are investigated, providing a theoretical foundation for predicting CO2 displacement and dissolution dynamics in stratified saline aquifers.
- (1)During the CO2 displacement of brine, the gas-phase saturation region primarily migrates radially, gradually migrating toward the base of the shale layer, with a small fraction of CO2 permeating through the shale layer into the topmost region of the saline aquifer. In the uppermost saline aquifer, the gas-phase migration exhibits a progressive reduction in displacement rate across successive layers. The vertical migration rate is lower than the horizontal migration rate, and the migration processes stabilize over time.
- (2)The injection of supercritical CO2 results in a significant increase in liquid-phase pressure near the inlet of the CO2 injection, forming a high-pressure zone. A pronounced pressure gradient develops between the high-pressure zone and surrounding low-pressure regions, driving pressure propagation primarily in vertical and radial directions. Near the shale layer, a sharp pressure drop is observed.
- (3)In the early stages of injection, the CO2 dissolution rate is relatively high. As the dissolution process progresses, the vertical and radial migration distances of the CO2 plume increase, expanding the contact area with brine and expediting the CO2 dissolution rate.
- (4)Spatial heterogeneity in porosity within stratified saline aquifers drives preferential CO2 accumulation in high-porosity zones, enhancing CO2 dissolution due to increased storage capacity and brine contact area. Porosity variations influence fluid flow resistance across aquifer layers, with high-porosity zones reducing gas-phase migration distances and elevating local CO2 dissolution rates. An increase in porosity from 0.25 to 0.3 results in an approximately 16.5% reduction in the radial dissolution distance of CO2 in the saline aquifer near the inlet. CO2 preferentially migrates and dissolves in high-permeability regions, where higher permeability facilitates radial migration of CO2 plume. For every 10 mD increase in permeability, the radial dissolution distance of CO2 in the saline aquifer near the inlet increases by approximately 18 m. Elevated injection rates improve gas-liquid contact and dissolution, with CO2 plume vertical and radial migration rates and dissolved concentrations rising markedly as injection rates increase. For every 0.25 × 10⁻⁶ m/s increase in injection rate, the radial dissolution distance of CO2 in the saline aquifer near the inlet increases by approximately 100–120 m on average. A nonlinear multi-parameter model was fitted to summarize the impacts of porosity, permeability, and injection rate on CO2 storage efficiency.
Acknowledgement:
Funding Statement: This study was supported by the National Natural Science Foundation of China (No. 52306187); the Fundamental Research Funds for the Central Universities of China (Grant No. 3132024205), and the Open Fund of Key Laboratory of Ocean Energy Utilization and Energy Conservation of Ministry of Education (Grant No. LOEC-202004).
Author Contributions: The authors confirm contribution to the paper as follows: Conceptualization, Bohao Wu and Yulong Ji; methodology, Bohao Wu, Xiuqi Zhang and Haoheng Liu; analysis and interpretation of results, Bohao Wu, Xiuqi Zhang and Haoheng Liu; draft manuscript preparation, Bohao Wu and Xiuqi Zhang. All authors reviewed the results and approved the final version of the manuscript.
Availability of Data and Materials: The datasets generated and/or analyzed during the current study are available from the corresponding author on reasonable request.
Ethics Approval: Not applicable.
Conflicts of Interest: The authors declare no conflicts of interest to report regarding the present study.
Based on the explanations in the preceding sections, investigating the migration and dissolution of CO2 in stratified saline aquifers evidently requires coupling the two-phase flow displacement model, the mass transfer model, and the interactions of fluid properties in the saline aquifer. To this end, we employ an iterative approach for solving. The specific computational steps are as follows: First, construct the geometric model of the stratified saline aquifer, incorporate the two-phase flow displacement model and the mass transfer model, and solve for the CO2 saturation, concentration, and reservoir pressure in the saline aquifer. If the results do not converge, adjust the model parameters and recompute; if they converge, output the results for the current time step and proceed to calculate the parameters for the next time step based on updated fluid properties, capillary pressure, and relative permeability. Consequently, the migration and dissolution distribution of CO2 in the stratified saline aquifer across the entire time span can be obtained. Fig. A1 illustrates the specific numerical simulation flowchart for this study.
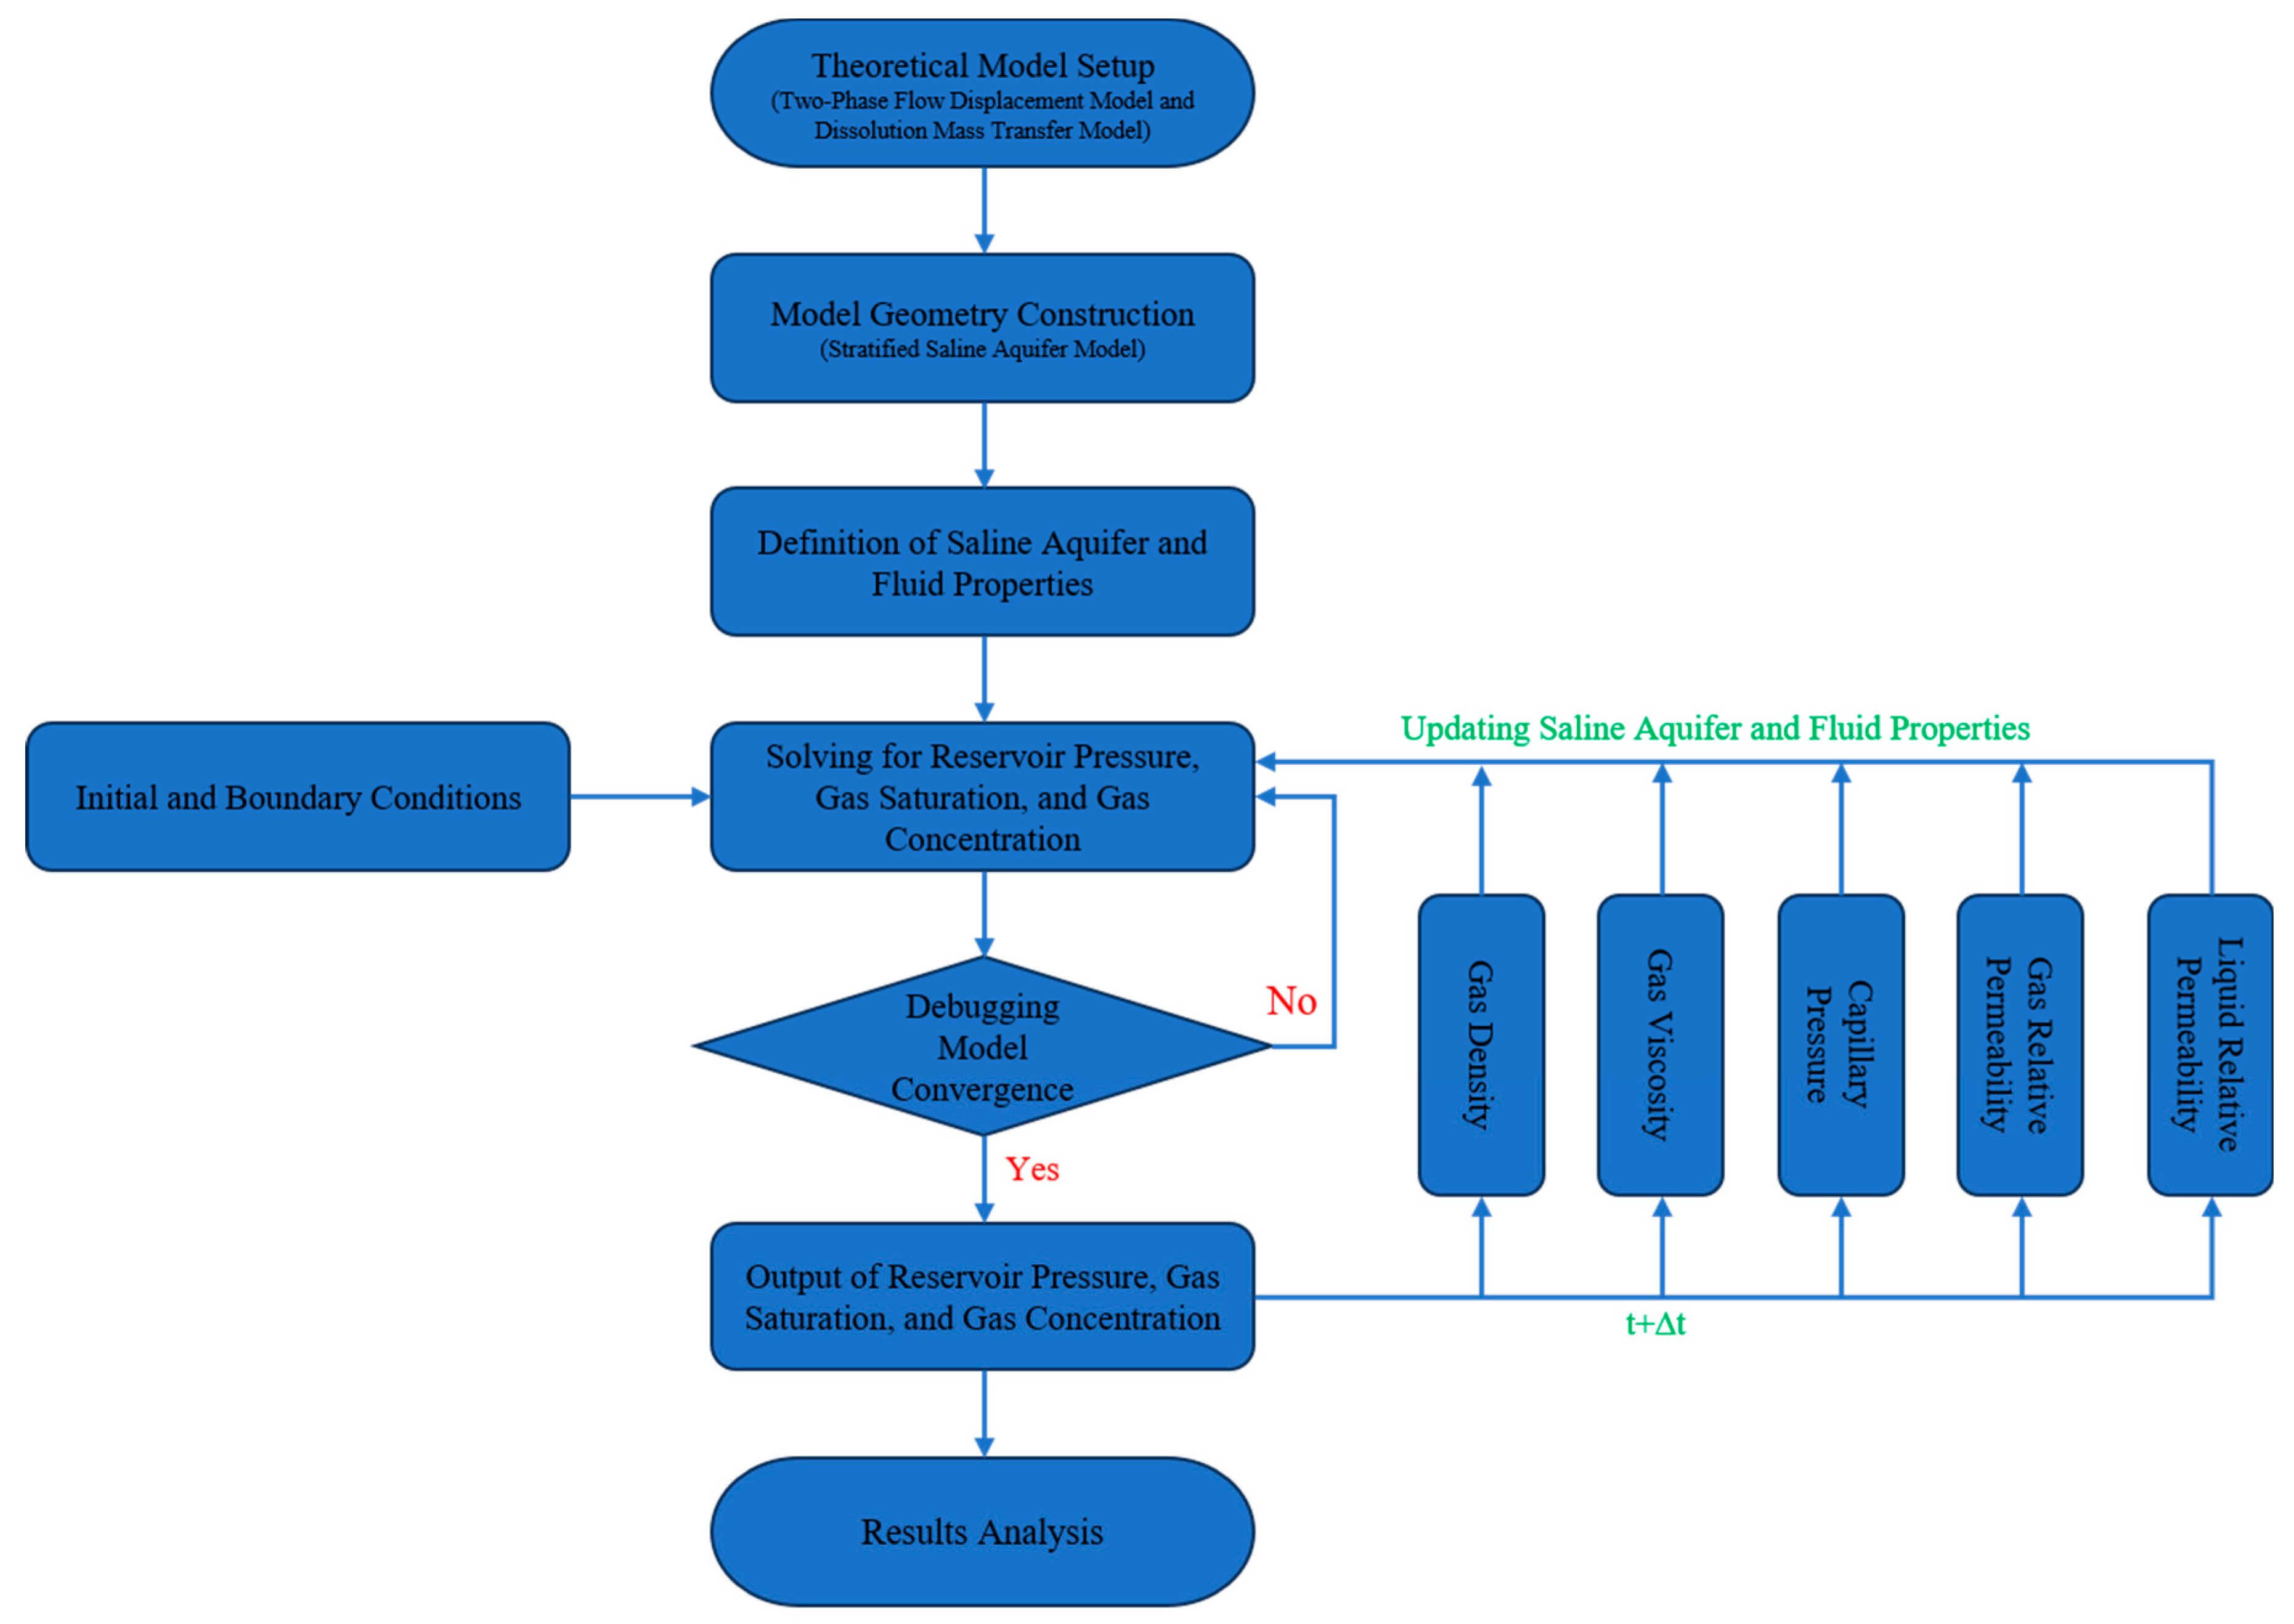
Figure A1: Numerical simulation flowchart.
References
1. Kim JH , Hong SH , Ahn SH , Kim SY . Recent progress in photocathode interface engineering for photoelectrochemical CO2 reduction reaction to C1 or C2+ products. Exploration. 2025; 5( 2): 70010. doi:10.1002/EXP.20240014. [Google Scholar] [CrossRef]
2. Afrane S , Ampah JD , Adun H , Chen JL , Zou H , Mao G , et al. Targeted carbon dioxide removal measures are essential for the cost and energy transformation of the electricity sector by 2050. Commun Earth Environ. 2025; 6: 227. doi:10.1038/s43247-025-02190-8. [Google Scholar] [CrossRef]
3. Mert E , Aksu M , Celiktas MS . Projections of global energy transition models in the wake of industrial revolution and climate change policies. Clean Energy Sci Technol. 2025; 3( 1): 273. doi:10.18686/cest273. [Google Scholar] [CrossRef]
4. Qin C , Li X , Wang T , Xu Z , Chen KJ , Pan F . Metal-organic frameworks-based copper catalysts for CO2 electroreduction toward multicarbon products. Exploration. 2025; 5( 3): 270011. doi:10.1002/EXP.70011. [Google Scholar] [CrossRef]
5. Marouani I . Contribution of renewable energy technologies in combating phenomenon of global warming and minimizing GHG emissions. Clean Energy Sci Technol. 2024; 2( 2): 164. doi:10.18686/cest.v2i2.164. [Google Scholar] [CrossRef]
6. Sorimachi K , Tsukada T , Gabbar HA . Sustainable circulating energy system for carbon capture usage and storage (CCUS). Energy Eng. 2025; 122( 6): 2177– 85. doi:10.32604/ee.2025.064975. [Google Scholar] [CrossRef]
7. Shirafkan SM , Ledari MB , Mohebbi K , Kordi A , Fani M , Vahedi R . Revolutionising the petrochemical supply chain: integrating waste and CO2 from CCUS into a low-carbon circular economy framework. J Environ Chem Eng. 2025; 13( 3): 116722. doi:10.1016/j.jece.2025.116722. [Google Scholar] [CrossRef]
8. Thiedemann TM , Wark M . A compact review of current technologies for carbon capture as well as storing and utilizing the captured CO2. Processes. 2025; 13( 1): 283. doi:10.3390/pr13010283. [Google Scholar] [CrossRef]
9. Mahmoodpour S , Rostami B . Design-of-experiment-based proxy models for the estimation of the amount of dissolved CO2 in brine: a tool for screening of candidate aquifers in geo-sequestration. Int J Greenh Gas Control. 2017; 56: 261– 77. doi:10.1016/j.ijggc.2016.11.031. [Google Scholar] [CrossRef]
10. Koray AM , Appiah Kubi E , Bui D , Asante J , Primasari I , Amosu A , et al. Cost-effective strategies for assessing CO2 water-alternating-gas (WAG) injection for enhanced oil recovery (EOR) in a heterogeneous reservoir. Water. 2025; 17( 5): 651. doi:10.3390/w17050651. [Google Scholar] [CrossRef]
11. Kalam S , Olayiwola T , Al-Rubaii MM , Amaechi BI , Jamal MS , Awotunde AA . Carbon dioxide sequestration in underground formations: review of experimental, modeling, and field studies. J Pet Explor Prod. 2021; 11( 1): 303– 25. doi:10.1007/s13202-020-01028-7. [Google Scholar] [CrossRef]
12. Ismail I , Fotias SP , Pissas S , Gaganis V . Optimized CO2 modeling in saline aquifers: evaluating fluid models and grid resolution for enhanced CCS performance. Processes. 2025; 13( 6): 1901. doi:10.3390/pr13061901. [Google Scholar] [CrossRef]
13. Worden RH . Carbon dioxide capture and storage (CCS) in saline aquifers versus depleted gas fields. Geosciences. 2024; 14( 6): 146. doi:10.3390/geosciences14060146. [Google Scholar] [CrossRef]
14. D’Aniello A , Tómasdóttir S , Sigfússon B , Fabbricino M . Modeling Gaseous CO2Flow behavior in layered basalts: dimensional analysis and aquifer response. Groundwater. 2021; 59( 5): 677– 93. doi:10.1111/gwat.13090. [Google Scholar] [CrossRef]
15. Seo K , Kim B , Liu Q , Lee KS . Simulation of low-salinity water-alternating impure CO2 process for enhanced oil recovery and CO2 sequestration in carbonate reservoirs. Energies. 2025; 18( 5): 1297. doi:10.3390/en18051297. [Google Scholar] [CrossRef]
16. Akai T , Kuriyama T , Kato S , Okabe H . Numerical modelling of long-term CO2 storage mechanisms in saline aquifers using the Sleipner benchmark dataset. Int J Greenh Gas Control. 2021; 110: 103405. doi:10.1016/j.ijggc.2021.103405. [Google Scholar] [CrossRef]
17. Zheng JN , Yang M . Phase equilibrium data of CO2-MCP hydrates and CO2 gas uptake comparisons with CO2-CP hydrates and CO2-C3H8 hydrates. J Chem Eng Data. 2019; 64( 1): 372– 9. doi:10.1021/acs.jced.8b00893. [Google Scholar] [CrossRef]
18. Zhao Y , Lei X , Zheng JN , Li M , Johns ML , Huang M , et al. High resolution MRI studies of CO2 hydrate formation and dissociation near the gas-water interface. Chem Eng J. 2021; 425: 131426. doi:10.1016/j.cej.2021.131426. [Google Scholar] [CrossRef]
19. Zhao G , Zheng JN , Gong G , Chen B , Yang M , Song Y . Formation characteristics and leakage termination effects of CO2 hydrate cap in case of geological sequestration leakage. Appl Energy. 2023; 351: 121896. doi:10.1016/j.apenergy.2023.121896. [Google Scholar] [CrossRef]
20. Cognac KE , Ronayne MJ . Hydraulic disconnection between aquifers: assessing the hydrogeologic controls on inter-aquifer exchange and induced recharge in pumped, multi-aquifer systems. Water. 2025; 17( 11): 1635. doi:10.3390/w17111635. [Google Scholar] [CrossRef]
21. Abitkazy T , Yan L , Albriki K , Baletabieke B , Yuan D , He Y , et al. Comprehensive characterization and impact analysis of interlayers on CO2 flooding in low-permeability sandstone reservoirs. Energies. 2025; 18( 3): 593. doi:10.3390/en18030593. [Google Scholar] [CrossRef]
22. Kone A , Boukadi F , Trabelsi R , Trabelsi H . Simulating horizontal CO2 plume migration in a saline aquifer: the effect of injection depth. Processes. 2025; 13( 3): 734. doi:10.3390/pr13030734. [Google Scholar] [CrossRef]
23. Kim KY , Oh J , Han WS , Park KG , Shinn YJ , Park E . Two-phase flow visualization under reservoir conditions for highly heterogeneous conglomerate rock: a core-scale study for geologic carbon storage. Sci Rep. 2018; 8: 4869. doi:10.1038/s41598-018-23224-6. [Google Scholar] [CrossRef]
24. Bakhshian S , Hosseini SA , Lake LW . CO2-brine relative permeability and capillary pressure of Tuscaloosa sandstone: effect of anisotropy. Adv Water Resour. 2020; 135: 103464. doi:10.1016/j.advwatres.2019.103464. [Google Scholar] [CrossRef]
25. Khudaida KJ , Das DB . A numerical analysis of the effects of supercritical CO2 injection on CO2 storage capacities of geological formations. Clean Technol. 2020; 2( 3): 333– 64. doi:10.3390/cleantechnol2030021. [Google Scholar] [CrossRef]
26. Ganesh PR , Mishra S . Simplified physics model of CO2 plume extent in stratified aquifer-caprock systems. Greenh Gases Sci Technol. 2016; 6( 1): 70– 82. doi:10.1002/ghg.1537. [Google Scholar] [CrossRef]
27. Goto H , Ishido T , Sorai M . Numerical study of reservoir permeability effects on gravity changes associated with CO2 geological storage: implications for gravimetric monitoring feasibility. Greenh Gases Sci Technol. 2020; 10( 3): 557– 66. doi:10.1002/ghg.1974. [Google Scholar] [CrossRef]
28. Wang Y , Fernàndez-Garcia D , Saaltink MW . Carbon dioxide (CO2) dissolution efficiency during geological carbon sequestration (GCS) in randomly stratified formations. Water Resour Res. 2022; 58( 8): e2022WR032325. doi:10.1029/2022WR032325. [Google Scholar] [CrossRef]
29. Zafar M , Sakidin H , Hussain A , Thiruchelvam L , Sheremet M , Dzulkarnain I , et al. A mathematical modeling of 3D cubical geometry hypothetical reservoir under the effect of nanoparticles flow rate, porosity, and relative permeability. Comput Model Eng Sci. 2024; 141( 2): 1193– 211. doi:10.32604/cmes.2024.049259. [Google Scholar] [CrossRef]
30. Slompo PHS , Pinto MAV , Oliveira ML . Comparison between van genuchten and Brooks-corey parameterizations in the solution of multiphase problems in rigid one-dimensional porous media. J Comput Theor Transp. 2023; 52( 6): 429– 51. doi:10.1080/23324309.2023.2287008. [Google Scholar] [CrossRef]
31. Brooks RH , Corey AT . Hydraulic properties of porous media. Hydrol Pap Colo State Univ. 1964; 24: 37. [Google Scholar]
32. Gudala M , Govindarajan SK , Yan B , Sun S . Comparison of supercritical CO2 with water as geofluid in geothermal reservoirs with numerical investigation using fully coupled thermo-hydro-geomechanical model. J Energy Resour Technol. 2023; 145( 6): 061302. doi:10.1115/1.4055538. [Google Scholar] [CrossRef]
33. Gao G , Gang W , Zhang G , He W , Cui X , Shen H , et al. Physical simulation of gas reservoir formation in the Liwan 3-1 deep-water gas field in the Baiyun sag, Pearl River Mouth Basin. Nat Gas Ind B. 2015; 2( 1): 77– 87. doi:10.1016/j.ngib.2015.02.006. [Google Scholar] [CrossRef]
34. Xie M , Wang S , Feng S , Xu C , Li X , Sun X , et al. A stability assessment of fault-caprock trapping systems for CO2 storage in saline aquifer layers using a coupled THMC model. Energies. 2025; 18( 4): 900. doi:10.3390/en18040900. [Google Scholar] [CrossRef]
35. Shen J , Mo F , Tao Z , Hong Y , Gao B , Xuan T . Numerical investigation of offshore CCUS in deep saline aquifers using multi-layer injection method: a case study of the Enping 15-1 oilfield CO2 storage project, China. J Mar Sci Eng. 2025; 13( 7): 1247. doi:10.3390/jmse13071247. [Google Scholar] [CrossRef]
36. Liu C , Wang Z , Gu Z , Hu Q , Zhou K , Liang Q . Resistivity cutoff of low-resistivity and low-contrast pays in sandstone reservoirs from conventional well logs: a case of Paleogene Enping Formation in A-Oilfield, Pearl River Mouth Basin, South China Sea. Open Geosci. 2023; 15( 1): 20220520. doi:10.1515/geo-2022-0520. [Google Scholar] [CrossRef]
37. Zhang L , Pang X , Pang H , Huo X , Ma K , Huang S . Hydrocarbon accumulation model based on threshold combination control and favorable zone prediction for the lower Enping Formation, Southern Lufeng sag. Adv Geo-Energy Res. 2022; 6( 5): 438– 50. doi:10.46690/ager.2022.05.08. [Google Scholar] [CrossRef]
38. Sun J , Zhao Y , Liang J , Zhang X , Zhao Q . Tectonic controls on Late Paleozoic shale gas preservation in western Shandong, China. J Mar Sci Eng. 2025; 13( 6): 1121. doi:10.3390/jmse13061121. [Google Scholar] [CrossRef]
39. Vivek R , Kumar GS . Numerical investigation on effect of varying injection scenario and relative permeability hysteresis on CO2 dissolution in saline aquifer. Environ Earth Sci. 2016; 75( 16): 1192. doi:10.1007/s12665-016-5959-9. [Google Scholar] [CrossRef]
40. Safari H , Balcom BJ , Afrough A . Characterization of pore and grain size distributions in porous geological samples—an image processing workflow. Comput Geosci. 2021; 156: 104895. doi:10.1016/j.cageo.2021.104895. [Google Scholar] [CrossRef]
41. Zech A , de Winter M . A probabilistic formulation of the diffusion coefficient in porous media as function of porosity. Transp Porous Media. 2023; 146( 1): 475– 92. doi:10.1007/s11242-021-01737-5. [Google Scholar] [CrossRef]
42. Li H , Du X , Wang Q , Yang X , Zhu H , Wang F . Formation of abnormally high porosity/permeability in deltaic sandstones (Oligocene), Bozhong depression, offshore Bohai Bay Basin, China. Mar Pet Geol. 2020; 121: 104616. doi:10.1016/j.marpetgeo.2020.104616. [Google Scholar] [CrossRef]
43. Aghli G , Moussavi-Harami R , Mohammadian R . Reservoir heterogeneity and fracture parameter determination using electrical image logs and petrophysical data (a case study, carbonate Asmari Formation, Zagros Basin, SW Iran). Pet Sci. 2020; 17( 1): 51– 69. doi:10.1007/s12182-019-00413-0. [Google Scholar] [CrossRef]
44. Shahriar MF , Khanal A . Effect of formation heterogeneity on CO2 dissolution in subsurface porous media. ACS Earth Space Chem. 2023; 7( 10): 2073– 90. doi:10.1021/acsearthspacechem.3c00175. [Google Scholar] [CrossRef]
45. Chiarella D , Longhitano SG , Spalluto L , Martinius AW . Hierarchies of stratigraphic discontinuity surfaces in siliciclastic, carbonate and mixed siliciclastic-bioclastic tidalites: implications for fluid migration in reservoir quality assessment. Depos Rec. 2025; 11( 1): 373– 402. doi:10.1002/dep2.307. [Google Scholar] [CrossRef]
46. Uliasz-Misiak B , Misiak J . Underground gas storage in saline aquifers: geological aspects. Energies. 2024; 17( 7): 1666. doi:10.3390/en17071666. [Google Scholar] [CrossRef]
47. Mahyapour R , Mahmoodpour S , Singh M , Omrani S . Effect of permeability heterogeneity on the dissolution process during carbon dioxide sequestration in saline aquifers: two-and three-dimensional structures. Geomech Geophys Geo-Energy Geo-Resour. 2022; 8( 2): 70. doi:10.1007/s40948-022-00377-3. [Google Scholar] [CrossRef]
48. Guo H , Song K , Hilfer R . A brief review of capillary number and its use in capillary desaturation curves. Transp Porous Media. 2022; 144( 1): 3– 31. doi:10.1007/s11242-021-01743-7. [Google Scholar] [CrossRef]
Cite This Article
 Copyright © 2025 The Author(s). Published by Tech Science Press.
This work is licensed under a Creative Commons Attribution 4.0 International License , which permits unrestricted use, distribution, and reproduction in any medium, provided the original work is properly cited.
 Downloads
 Citation Tools