
 Submit a Paper
 Propose a Special lssue
 Open Access
ARTICLE

Optimization of Cement-Based Slurry Mix Design Incorporating Silica Fume for Enhanced Setting and Strength Performance
1 PowerChina Railway Construction Investment Group Co., Ltd., Beijing, 100070, China
2 China Water Resources and Hydropower Fourth Engineering Bureau Co., Ltd., Xining, 810007, China
3 China Water Resources and Hydropower Eleventh Engineering Bureau Co., Ltd., Zhengzhou, 450001, China
4 School of Qilu Transportation, Shandong University, Jinan, 250002, China
* Corresponding Author: Wantao Ding. Email:
Fluid Dynamics & Materials Processing 2025, 21(11), 2779-2793. https://doi.org/10.32604/fdmp.2025.072671
Received 01 September 2025; Accepted 13 November 2025; Issue published 01 December 2025
 View Full Text
 Download PDF
Abstract
Traditional cement-based slurries are often constrained by excessive cement consumption, prolonged setting times, and limited controllability, which hinder their broader engineering applications. To overcome these challenges, this study focuses on optimizing ordinary cement-based slurry through the incorporation of targeted additives and rational adjustment of mix proportions, with the aim of developing a rapid-setting, early-strength cementitious system. In particular, a series of comparative and orthogonal experiments were conducted to systematically examine the evolution of the slurry’s macroscopic properties. In addition, the response surface methodology (RSM) was introduced to reveal the interaction mechanisms among key parameters, thereby establishing a quantitative foundation for the precise regulation of slurry performance. The comparative results demonstrate that silica fume significantly outperforms fly ash in enhancing both the rheological and mechanical behavior of the slurry. Regarding fluidity, the average consistency and slump of the silica fume mixture were reduced by 80 mm and 75 mm, respectively, compared with those containing fly ash, indicating more effective control of flowability. In terms of setting and strength development, the silica fume slurry exhibited a setting time up to 9.6 h shorter and a compressive strength up to 3.6 MPa higher under identical mix conditions. These results confirm the clear superiority of silica fume in promoting rapid solidification and early strength gain.Keywords
Shield tunneling has increasingly become the mainstream method for tunnel excavation because of its high degree of mechanization, rapid advance rate, and comparatively low construction risk. Nevertheless, the inherent complexity of the subsurface means that various rock-engineering accidents still occur frequently. To ensure worker safety and maintain construction progress, grouting is commonly adopted to improve unfavorable geological conditions. The injected slurry consolidates fractured rock and soil into a coherent mass, thereby enhancing the load-bearing capacity of the surrounding ground. As one of the most critical operations in shield tunneling, synchronous main grouting plays a pivotal role in reducing ground disturbance and controlling surface settlement [1]. At present, ordinary cement-based grout is the most widely used material because of its low cost. However, it typically involves high cement consumption, a long solidification time, a low stone formation yield, and weak resistance to erosion, which together make it inadequate for grouting in faulted, highly fractured rock masses.
Silica fume, a highly reactive pozzolanic admixture, has been extensively demonstrated to optimize the microstructure of cementitious systems and to improve their mechanical performance and durability by virtue of its ultrafine particle size and strong pozzolanic activity. Its spherical, ultrafine particles can fill the intergranular voids between cement grains, increase packing density, and react with portlandite to generate additional calcium silicate hydrate (C-S-H) gel, thereby markedly reducing permeability and enhancing strength [2]. Fly ash, owing to its unique microstructure, can exert an aggregation effect in grouting, concentrating hydration products around fly ash particles and enhancing the overall strength of the grouted body [3]. At the same time, fly ash is the principal solid waste produced by coal-fired power plants. It is collected as a fine powder from flue gases after combustion. Its more regular spherical morphology underpins many of its rheological benefits, while the beneficial use of fly ash also carries important environmental implications [4,5].
A substantial body of work has focused on the development of grouting materials and on improvement strategies guided by engineering needs. Koyama’s team [6] prepared two different slurries and injected them into various soils to study the long term effects of shield grouting, finding that the long term effectiveness increased progressively with greater grout take. Atiş et al. [7] investigated how sodium hydroxide dosage influences strength development in fly ash cement polymer systems and, based on testing, proposed an optimal dosing range. Pradip Nath et al. [8] analyzed fly ash cement slurry using scanning electron microscopy (SEM) and X-ray diffraction (XRD), and showed that the hydration products jointly construct the strength of the bonded system. Shubbar et al. [9] examined the effects of grinding time and waste paper sludge ash (PSA) replacement on mortar surface resistivity and compressive strength, considering three grinding durations, two replacement levels, and three curing ages. The results indicated that grinding PSA for 10 min and using it to replace up to 50% of the cement content yielded mechanical and durability performance comparable to ordinary Portland cement after 28 days of curing. Tavakoli et al. [10] conducted targeted experimental research to elucidate the mechanisms by which waste-tile aggregates influence mortar performance. By testing slump, compressive strength, and splitting tensile strength at different curing ages and combining these results with microstructural observations, they quantified how the replacement rate of waste-tile aggregate affects workability, mechanical properties, and durability; comparisons among aggregate size fractions clarified the optimal replacement strategy and application boundaries. Rahmouni et al. [11] explored the feasibility of jointly using silica fume and ceramic waste in mortar production. Their tests showed that as silica fume and ceramic waste content increased, compressive strength and density both improved, whereas porosity trended in the opposite direction. When a silica fume ceramic waste blended sand with 15% sand content and a silica fume dosage equal to 5% of cement weight was used, the best overall performance was achieved. In parallel, Shao et al. [4] adjusted the types and dosages of composite activators (including CaO and Na2SO4) in fly ash mortars, tested properties at different mix ratios, and compiled the resulting data to build machine learning models that can support rapid, adaptive decision-making for dynamic adjustments in engineering applications.
Synthesizing the above research, both silica fume and fly ash emerge as high performance slurry additives, and mix proportioning is the primary determinant of slurry properties. To reduce the cement content of cement-based grouting materials, to enhance the baseline physical properties of cement-based slurries, and to achieve rapid setting with early strength gain, researchers have selected mineral admixtures for incorporation into the slurry. In cement-based mortars, adding silica fume not only increases compressive strength but also significantly improves impact resistance and corrosion resistance. At the same time, fly ash—because of its physical form and chemical reactivity—can improve workability, contribute to later-age strength, and partially replace cement, thereby reducing the environmental footprint associated with clinker production.
However, most existing studies have remained confined to exploring the influence of a single factor under one-variable-at-a-time control, without incorporating interactions among multiple factors into the analytical scope. This limitation makes it difficult for the results to fully reflect the true effects of multiple factors acting in concert under the complex working conditions encountered in real engineering projects. It also constrains the precision with which grout mix proportions can be optimized. In other words, while single factor studies can reveal directional trends, they are poorly suited to quantifying how variables jointly shape rheology, stability, solidification behavior, and strength development. As a result, empirical formulations derived from such studies tend to exhibit limited transferability and robustness when project constraints vary from the original test conditions.
Against this backdrop, introducing a multifactor experimental framework together with statistical tools such as response surface methodology becomes essential for capturing interaction effects and for translating those effects into practical guidance for design and construction. A systematic approach that integrates comparative testing with orthogonal or RSM based experiments can reveal not only the main effects of key variables but also the significance and directionality of their interaction terms. Such an approach provides a more convincing, mechanism-consistent basis for optimizing slurry formulations to balance pumpability with segregation resistance, shorten setting time without causing line blockage, and raise early strength while maintaining constructability and cost control.
2 Slurry Materials and Test Methods
2.1 Slurry Material Proportioning
Grouting material is essentially a cementitious mortar. Such mortars consist of a cementitious binder and an aggregate. In civil engineering, “cementitious materials” are those that, through a series of physical and chemical reactions, bind discrete granular or lumpy solids into a single monolithic mass. “Aggregates” serve as the skeletal filler that provides mechanical support. In this study, the cementitious components are cement, silica fume, fly ash, and bentonite, and the aggregate is powdered fine sand.
The cement used in this study is P.O 42.5 ordinary cement. Mixed with water, powdered fine sand, and other constituents, it forms a cement mortar that behaves as a lubricating medium prior to setting and, upon hardening, serves as the binder that locks the solids into a dense, monolithic body. Its physical properties are listed in Table 1.
Table 1: Physical properties of P.O 42.5 ordinary silicate cement.
| Specific Surface Area (m2/kg) | Incipient Condensation Time (min) | Final Solidification Time (min) | Silicon Dioxide Content (%) | Heat Loss (%) | 3d Flexural Strength (MPa) | 28d Flexural Strength (MPa) |
|---|---|---|---|---|---|---|
| 367 | 165 | 240 | 2.20 | 98 | 5.4 | 9.4 |
The bentonite employed is a non-metallic mineral dominated by montmorillonite. Owing to its strong water absorption, swelling capacity, plasticity, and thixotropy, bentonite enhances slurry stability and water retention. Silica fume is an ultrafine, amorphous silica by-product collected from the off-gases during silicon/ferrosilicon smelting. Its particles are extremely small—on the order of micrometers and even nanometers. Fly ash, in contrast, is the principal solid residue from coal-fired power plants and is captured as fine particulates from combustion flue gases. When incorporated into cement mortar, fly ash improves mixture compatibility and workability, and can partially replace cement to reduce material cost; it is therefore widely used in slurry systems. Silica fume can also substitute for a portion of cement, likewise lowering cement demand, though at an equal dosage it is typically more expensive than fly ash. However, silica fume both fills voids between cement grains and reacts pozzolanically with hydration products to form additional gels, thereby increasing compressive strength and delivering more pronounced improvements in impact resistance.
With reference to previous studies [12], the mix ratio design for this experiment is shown in Table 2.
Table 2: Comparative test Slurry mix ratio.
| Test Number | Water (g) | Bentonite (g) | Additive (g) | Cement (g) | Sand (g) |
|---|---|---|---|---|---|
| A-B-1 | 360.00 | 72.00 | 150.00 | 450.00 | 600.00 |
| A-B-2 | 360.00 | 72.00 | 146.34 | 453.66 | 600.00 |
| A-B-3 | 360.00 | 72.00 | 142.86 | 457.14 | 600.00 |
| A-B-4 | 420.00 | 84.00 | 150.00 | 450.00 | 600.00 |
| A-B-5 | 420.00 | 84.00 | 146.34 | 453.66 | 600.00 |
| A-B-6 | 420.00 | 84.00 | 142.86 | 457.14 | 600.00 |
| A-B-7 | 480.00 | 96.00 | 150.00 | 450.00 | 600.00 |
| A-B-8 | 480.00 | 96.00 | 146.34 | 453.66 | 600.00 |
| A-B-9 | 480.00 | 96.00 | 142.86 | 457.14 | 600.00 |
Before mixing, the inner surface of the mixing bowl and the blades were moistened with a damp towel. Water, cement, additive (silica fume or fly ash), powdered fine sand, and bentonite were each weighed to the nearest 0.01 g using an analytical balance. The dry constituents—cement, additive, sand, and bentonite—were placed in the mixing bowl and blended at low speed for 30 s to minimize splashing and material loss. The premeasured water was then added, the mixer speed was set to an appropriate level, and mixing continued for 3 min.
After formulating the slurry mix, its basic properties were evaluated. Fluidity is a reflection of plasticity of grouts and it’s mainly used to evaluate flowability of grouts and closely related to the pumpability and filling property [13]. However, excessive fluidity can cause undue penetration into soil fissures, wasting material, weakening support, and reducing water retention, which undermines grouting effectiveness. Accordingly, fluidity in this study is quantified using consistency and slump (collapse) tests [12].
Stability is defined as the time over which the slurry maintains its initial dispersion and flowability. For the mixes considered here, the secretion rate is used as an indicator of gravity-induced segregation; in practice, lower bleeding corresponds to better stability.
Strength is directly tied to fast solidification and early strength gain. From the perspective of strength development time, we distinguish short-term and long-term strength. Short-term strength is represented by setting time, determined via penetration-resistance testing of cement mortar [14]. Long-term strength is represented by the unconfined compressive strength measured 3 h after setting, reflecting the material’s capacity to resist external loads during early service.
The slurry consistency apparatus is shown in Fig. 1a, and the consistency test proceeds as follows:
(1) Before the test. Lubricate the slide bar. Wipe the cone and the cone cylinder with a damp towel to remove dust; ensure no free water remains on the surfaces. (2) Place the freshly mixed mortar into the cone cylinder in a single lift. Rod the mortar 25 times from the center outward to the wall, then lightly vibrate to level the surface. Fix the cone cylinder beneath the cone. (3) Loosen the locking screws and lower the slide bar until the cone tip just touches the mortar surface; tighten the screws. Lower the rack-and-pinion measuring rod until its lower end just contacts the top of the slide bar, then set the dial to zero. (4) Release the locking screws to allow free penetration for 10 s. At exactly 10 s, re-tighten the screws, bring the rack-and-pinion rod back into contact with the slide bar, and read the dial to the nearest 1 mm. This value is the slurry consistency.
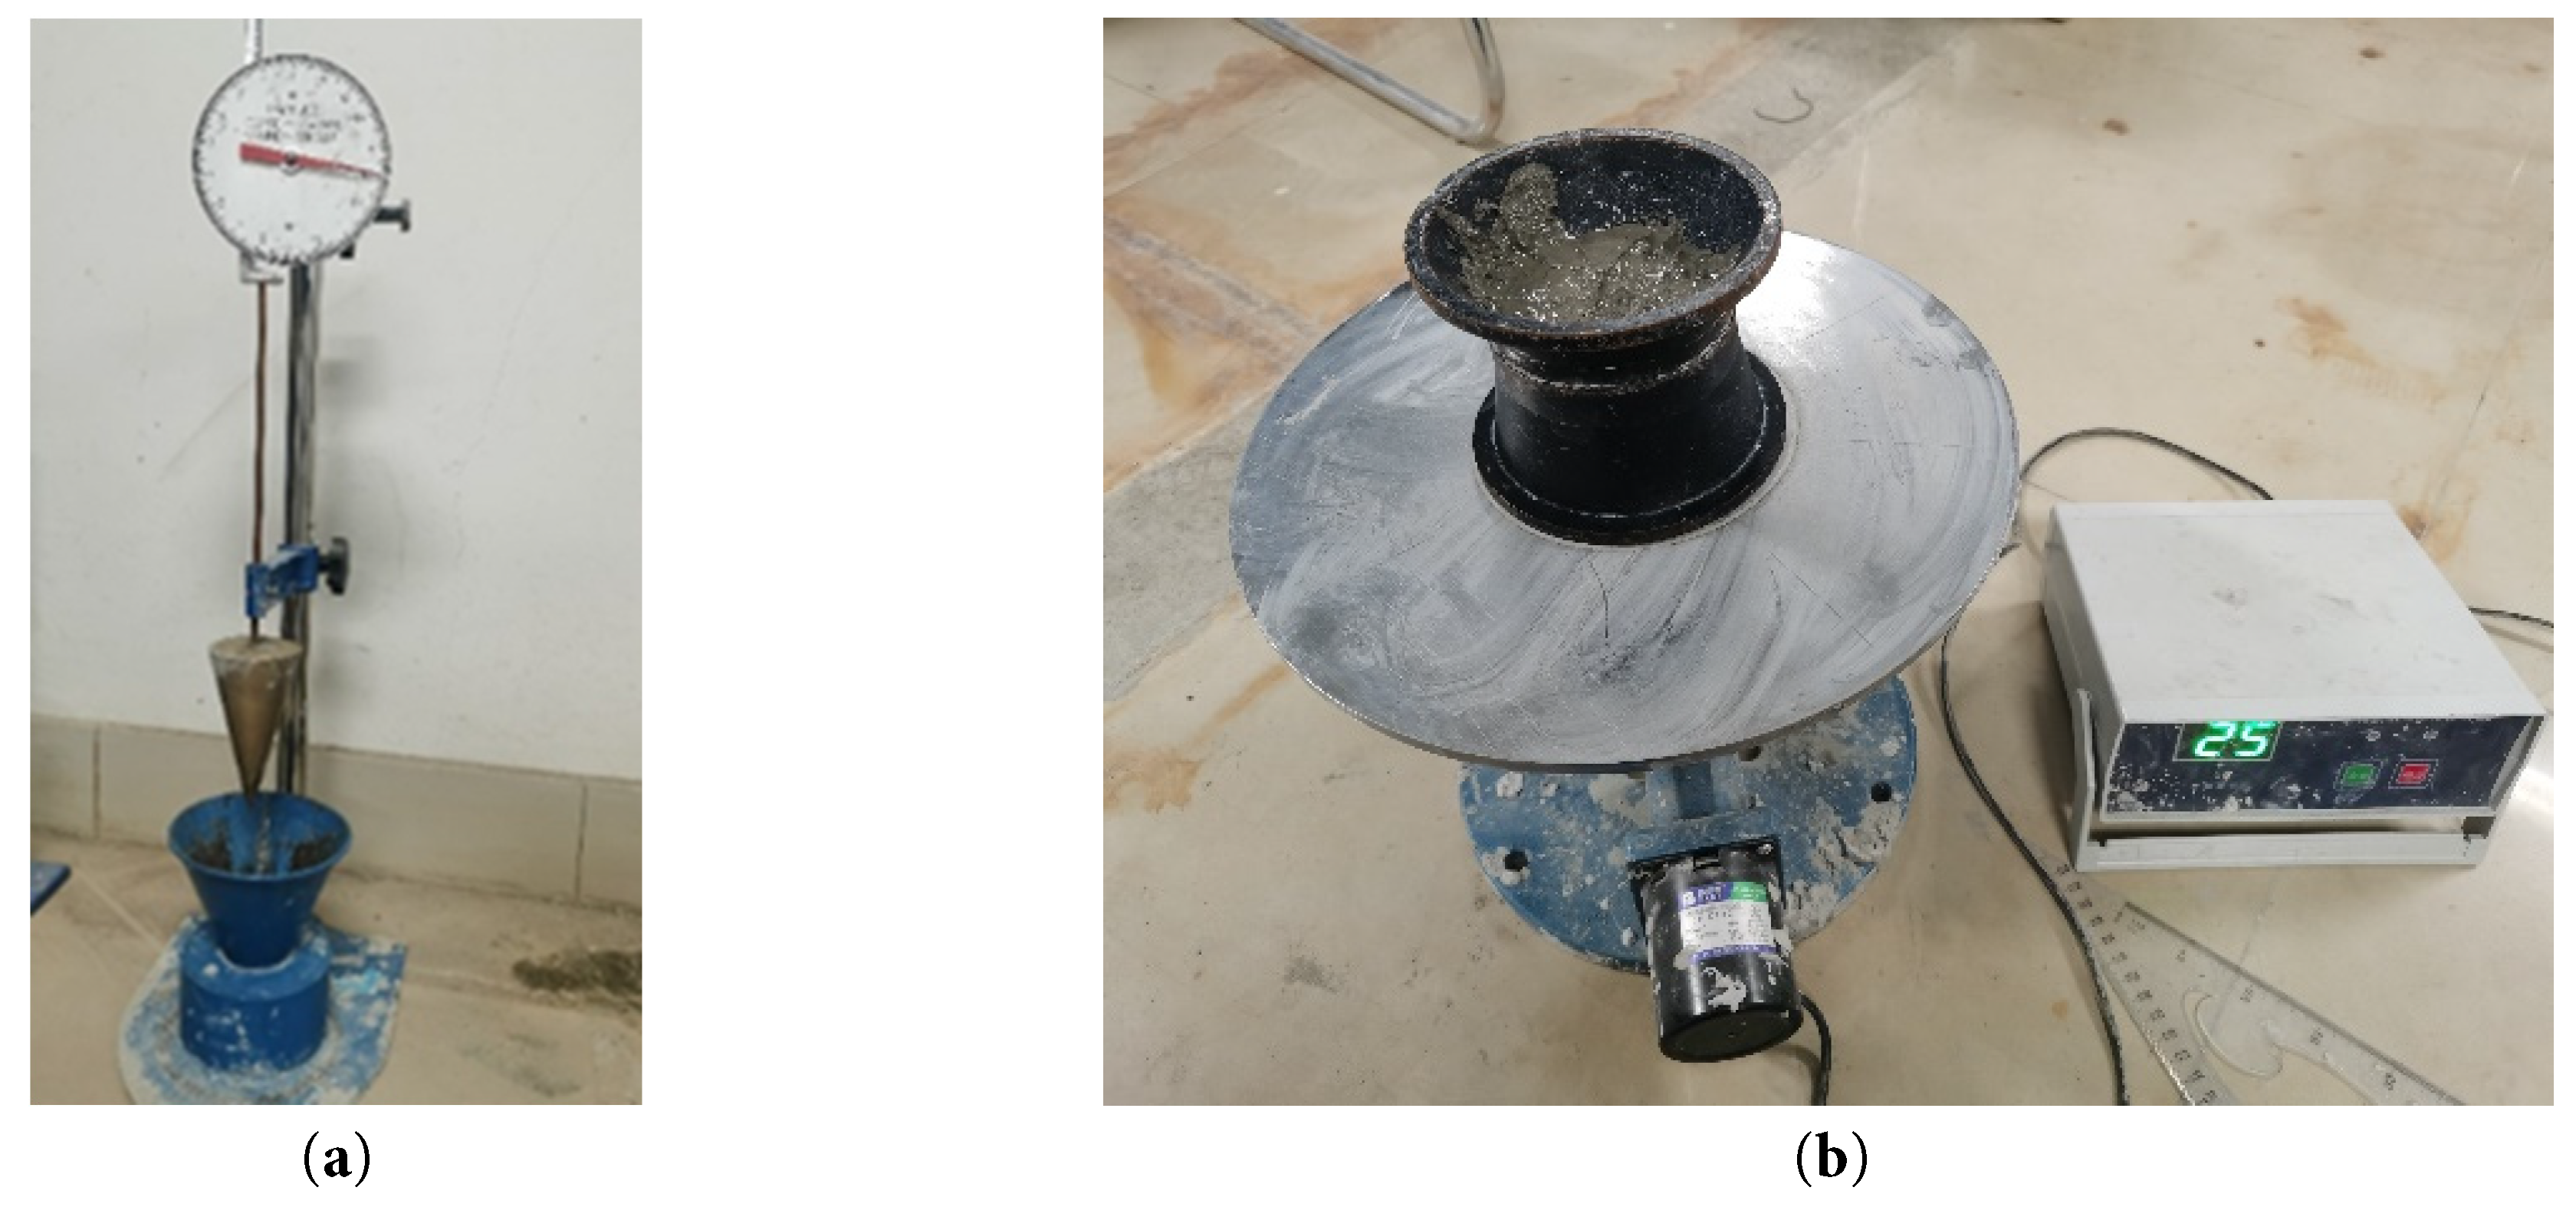
Figure 1: Slurry fluidity test apparatus: (a) Consistency tester; (b) Jumping cone method collapse degree tester.
The slurry collapse degree apparatus is shown in Fig. 1b, and the collapse degree test is carried out according to the following test steps:
(1) Moisten the surface of the flow table, the inside of the test mold, and the tamping rod. Position the mold in the marked location on the table. (2) Fill the mold in two layers, rodding each layer; strike off excess slurry with a spatula. (3) Lift the mold vertically and, immediately after removal, operate the apparatus as specified. (4) Measure the final spread diameter of the slurry with a tape measure and report the average of multiple measurements.
The slurry water secretion rate apparatus is shown in Fig. 2. The procedure is as follows:
(1) Using a funnel, charge a graduated cylinder with 150 ± 10 mL of freshly mixed slurry. Cover the mouth with plastic film to minimize evaporation. (2) Place the cylinder on a level surface, allow it to stand for 1 min, and record the initial slurry volume. (3) After 2 h, measure the volume of the water that separates from the slurry, and then make a ratio with the initial volume, and then calculate the water secretion rate of the slurry.
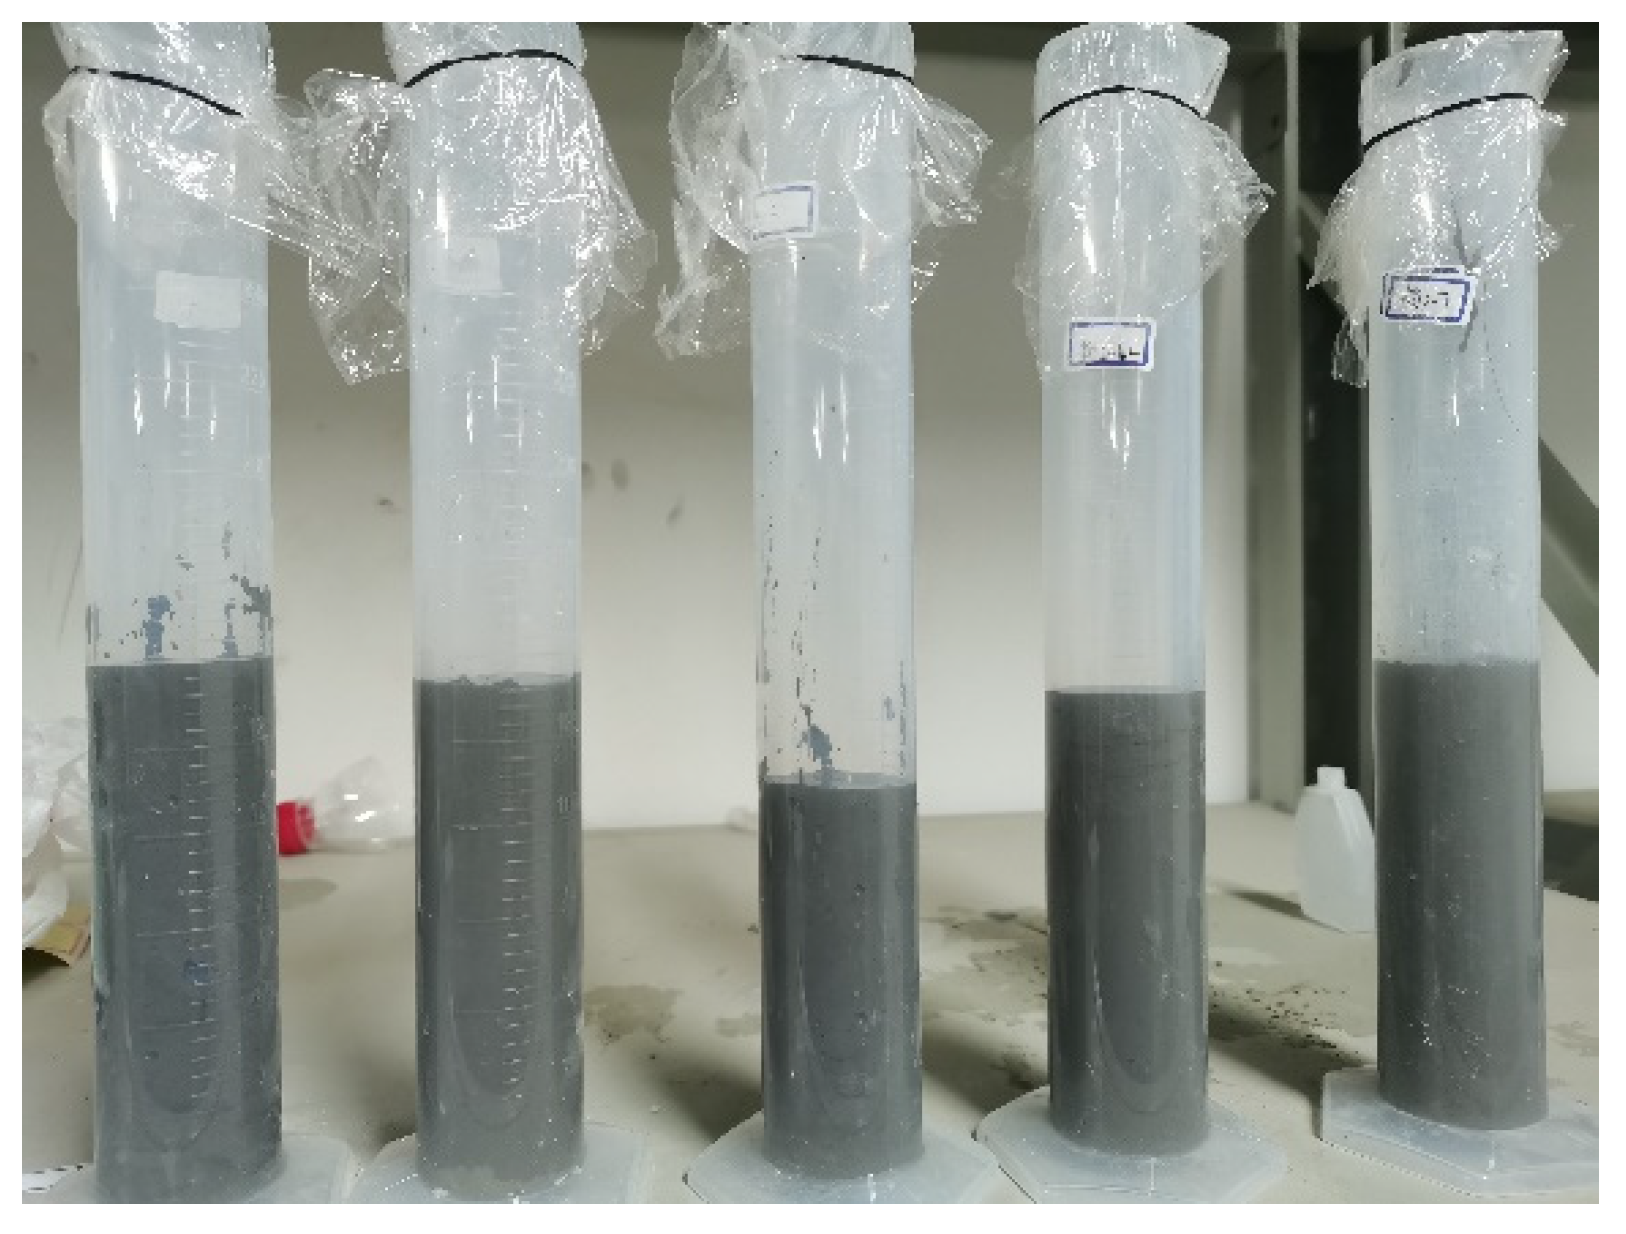
Figure 2: Measurement of slurry secretion rate by 250 mL measuring cylinder.
The slurry solidification time apparatus is shown in Fig. 3a. The procedure is as follows:
(1) Place the freshly mixed slurry in the container, finish the surface, and keep it 10 mm below the rim. (2) Bring the penetration needle into contact with the slurry surface using the loading bar, then press the needle to a depth of 25 mm within 10 s at a uniform rate; record the penetration resistance. (3) Starting from the first measurement, repeat the test every 30 min until the resistance reaches 0.3 MPa. Thereafter, take readings every 15 min until the resistance reaches 0.7 MPa, at which point the test ends.
The unconfined compressive strength test setup is shown in Fig. 3b. The testing steps are:
(1) Mix the slurry thoroughly and fill the mold. Rod the specimen uniformly 25 times with the tamping bar. (2) Place the time at a temperature of 20 ± 5°C for one day and night. Label the specimens and demold. (3) Center the specimen on the lower platen of the testing machine. Apply axial load uniformly at a constant rate until failure, and record the peak load.
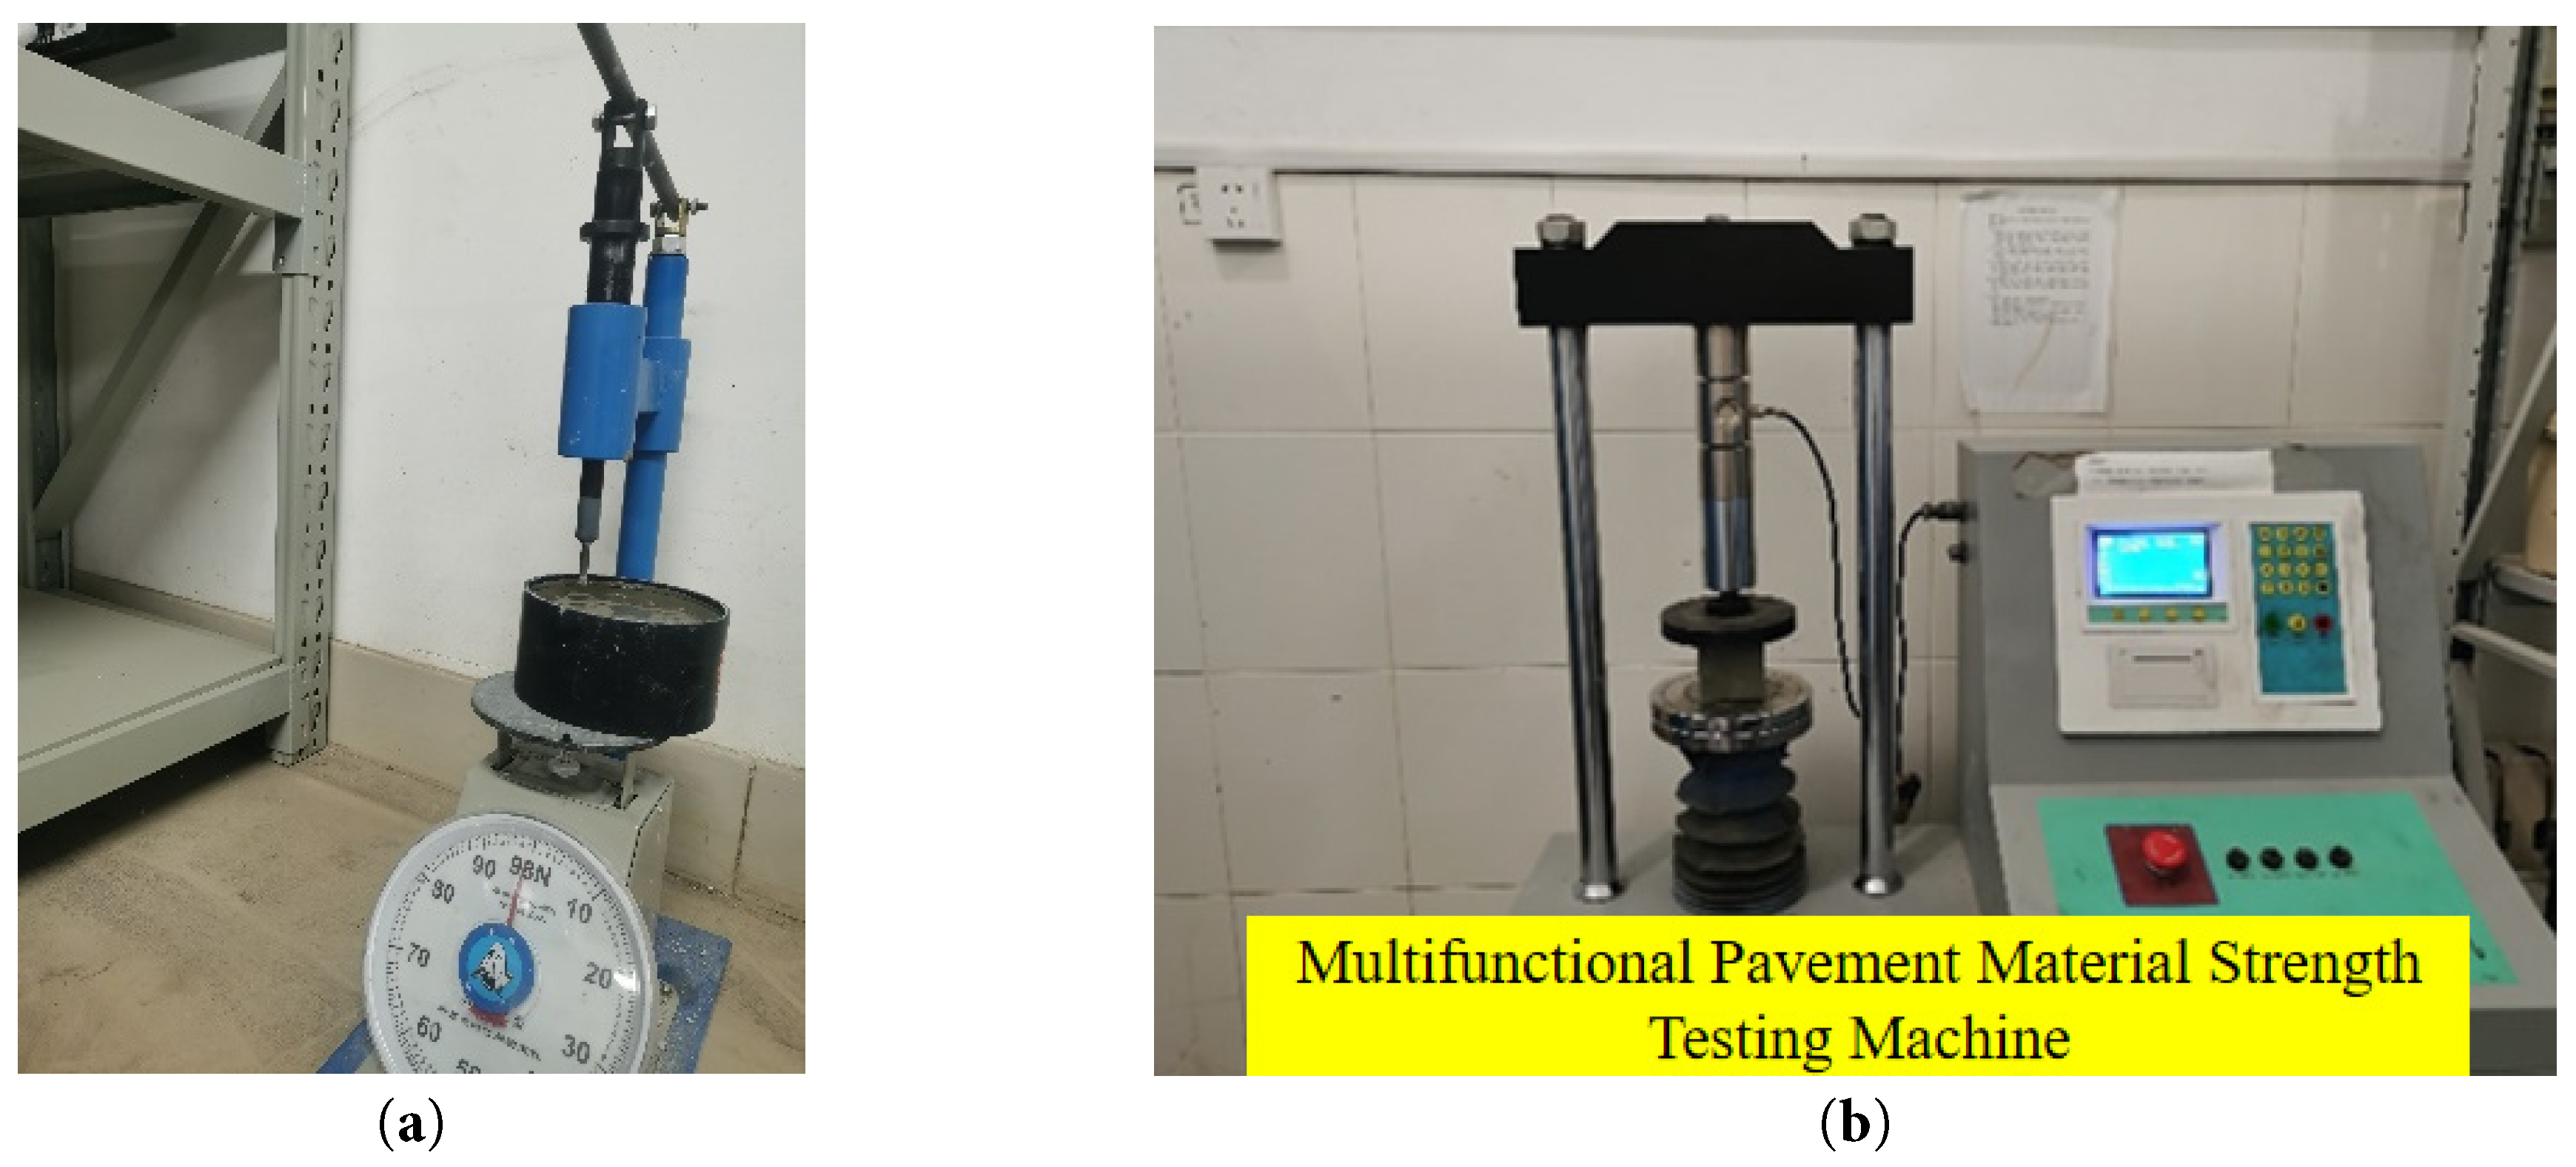
Figure 3: Slurry strength test apparatus: (a) Solidification time tester; (b) Cubic compressive strength tester.
3 Comparison of Basic Properties of Slurry with Different Additives
Because fly ash and silica fume differ in chemistry and microstructure, the slurries prepared with them exhibit distinct properties. Based on prior tests and field experience, mixes containing silica fume generally show lower as-mixed (intrinsic) fluidity than those with fly ash. At the same replacement level, the water required to reach standard consistency also differs; in our case, silica-fume mixes required less water than fly-ash mixes.
To examine how additive content affects slurry performance—and to identify the more suitable additive under the target formation conditions—we varied the water-to-cement ratio, W/B (0.6:1.0, 0.7:1.0, 0.8:1.0), and the cement replacement ratio, C/I (3.0:1.0, 3.1:1.0, 3.2:1.0), while holding B/S and Ben/W constant. Where, W/B represents the ratio of the mass of water to the mass of cement-base material. Among them, the cement-based materials include cement, silica fume or fly ash, and bentonite. C/I denotes the mass ratio of the cement to the mass of additive (i.e., the “cement replacement rate” used in this study). B/S represents the ratio of the mass of cements to the mass of aggregate sand. And Ben/W is the bentonite--water mass ratio. With reference to the change in the fluidity of the slurry under different water cement ratio conditions, adjust the range of slurry ratios and design a comparative test program, the comparative test program is shown in Table 2 (Section 2.1).
3.1 Comparison Test Results of Slurry Consistency
The consistency is closely related to the thinness and the pumpability of the slurry, and an unsuitable consistency may lead to larger pipe bulges, so the consistency needs to be controlled within a reasonable range in the actual project.
Fig. 4a shows that, at a fixed W/B, mixes containing silica fume exhibit lower consistency than those with fly ash. Consistency also decreases monotonically with increasing C/I, a trend that is more pronounced for silica fume mixes. This behavior is attributed to silica fume’s much finer particle size and larger specific surface area—roughly 50–70 times that of fly ash—which promotes greater adsorption of free water, thickening the mix and reducing the penetration-based consistency reading. Fig. 4b shows that, at a fixed C/I, the consistency of both silica fume and fly ash mixes increases as W/B rises. Under identical C/I and W/B conditions, fly ash mixes yield higher consistency values than silica fume mixes. The difference stems from silica fume binding a larger fraction of the mixing water into silica-fume–water aggregates, thereby lowering the amount of free water and reducing the measured consistency.
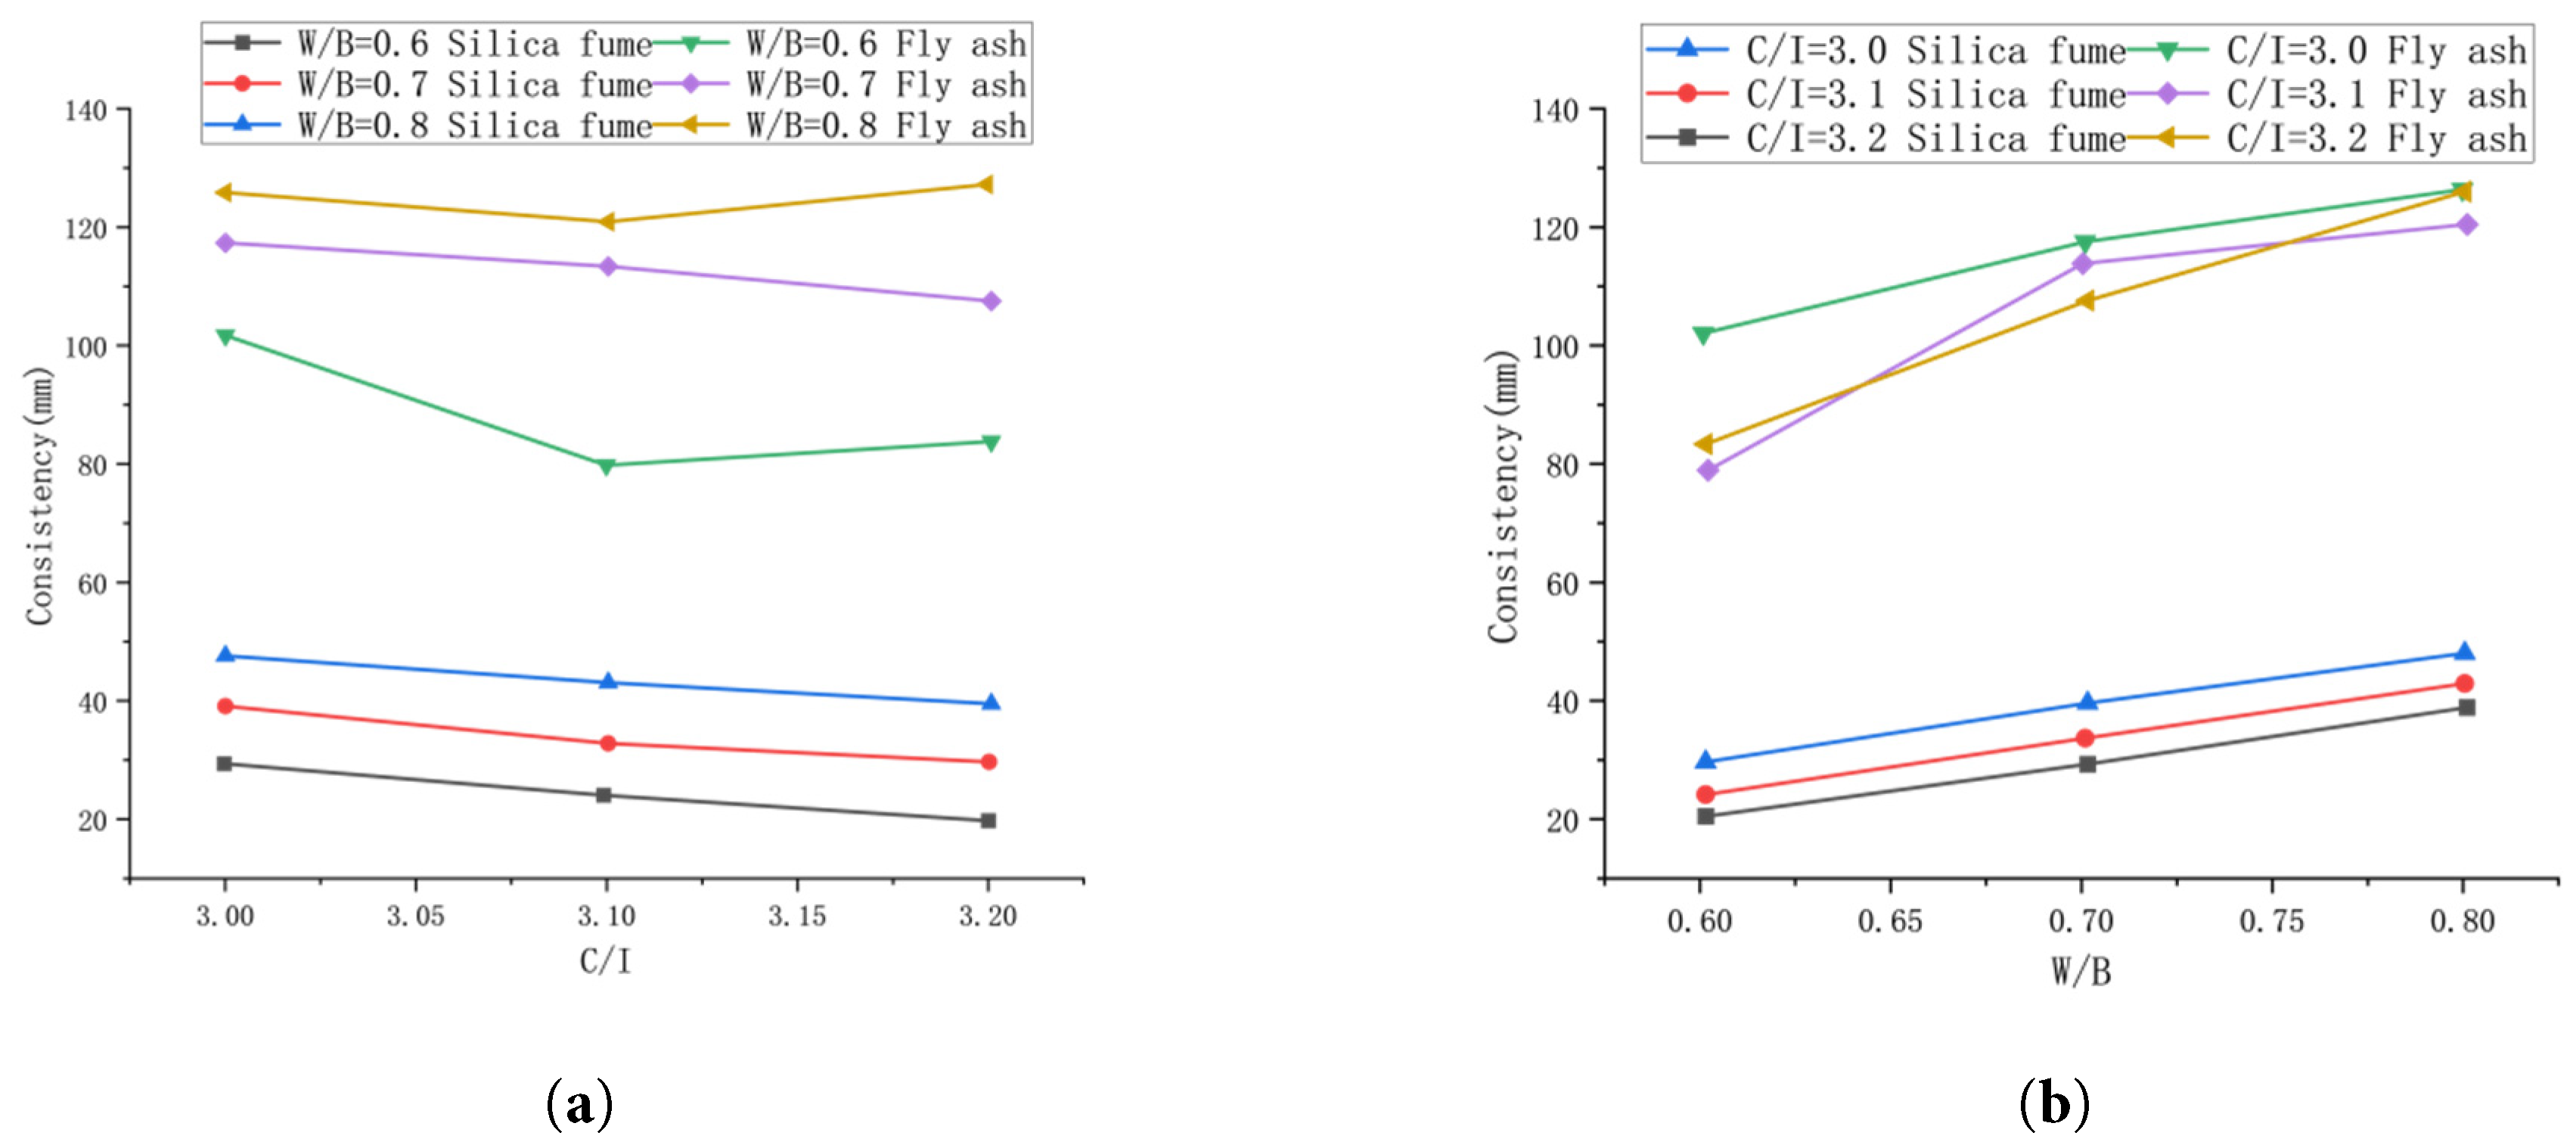
Figure 4: Results of the consistency comparison test: (a) The variable is C/I; (b) The variable is W/B.
3.2 Comparison Test Results of Slurry Collapse Degree
Fig. 5a shows that, at a fixed W/B, mixes containing fly ash exhibit greater fluidity than those with silica fume, which means that the slurry prepared with fly ash has more excellent pumping performance. Fig. 5b further shows that fluidity decreases with increasing C/I for both additives, with the reduction more pronounced in fly ash mixes. These trends primarily reflect differences in particle morphology and size distribution: the relatively spherical fly ash particles promote flow, whereas the ultrafine silica fume increases water demand and interparticle friction.
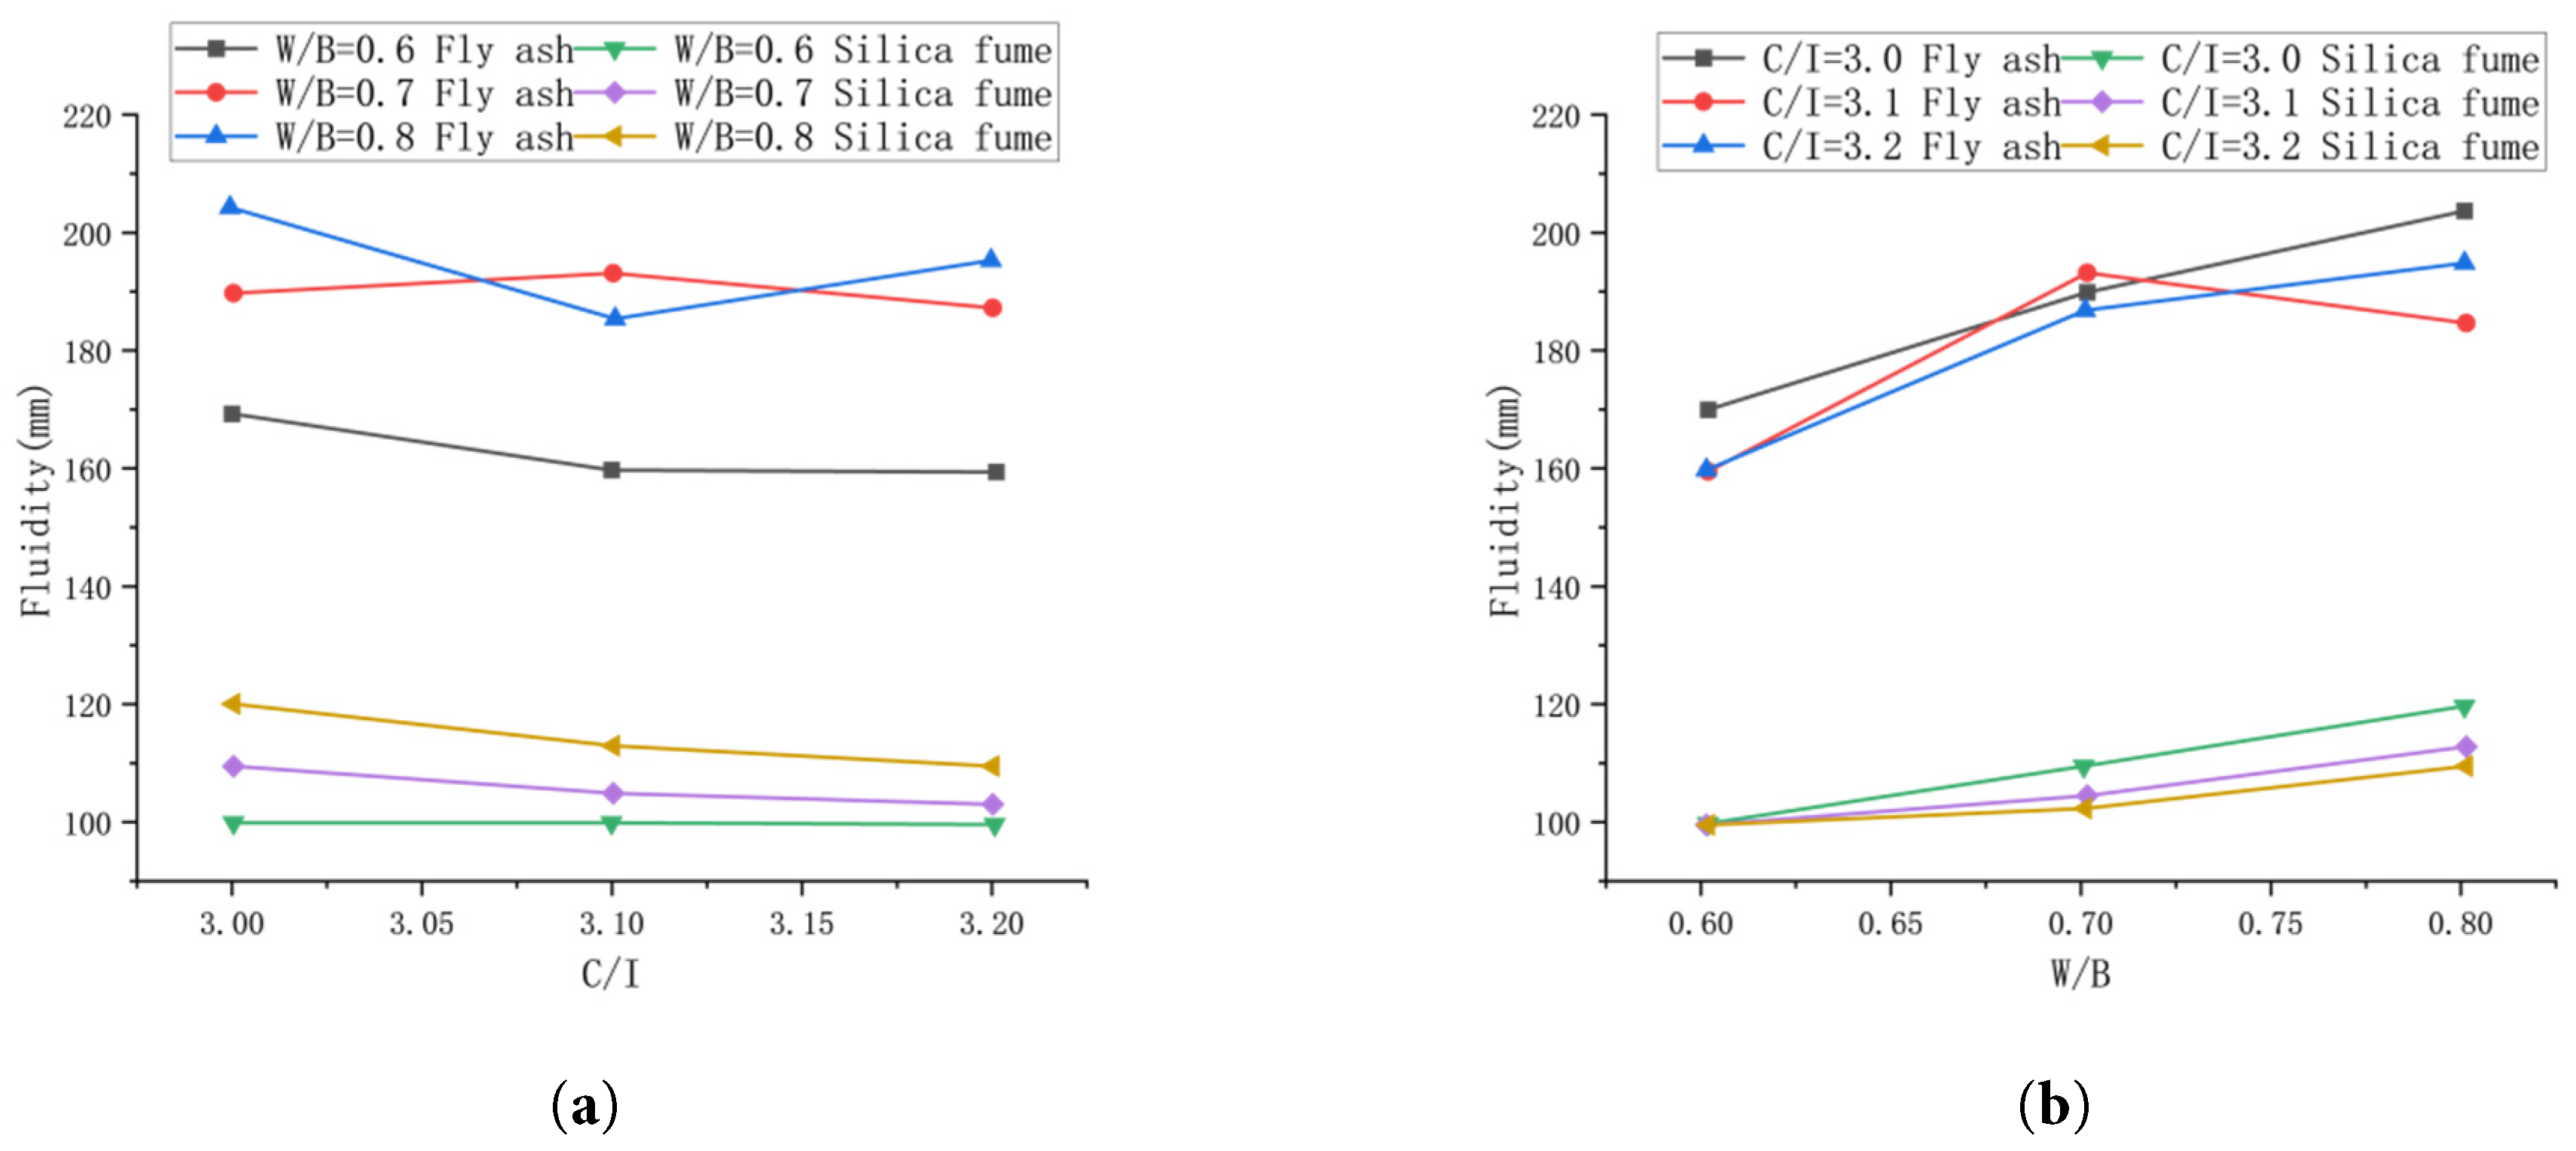
Figure 5: Results of collapse degree comparison test: (a) The variable is C/I; (b) The variable is W/B.
Practically, fluidity is an operational proxy for slurry plasticity and is closely tied to pumping and filling performance. If fluidity is too low, pumping pressures and costs rise; in extreme cases, inadequate flow can cause slurry-line blockage, delaying construction and degrading project quality.
3.3 Comparison Test Results of Slurry Secretion Rate
Fig. 6a shows that, at a fixed W/B, the secretion rate of silica-fume mixes is markedly lower than that of fly ash mixes. Bleeding increases progressively with increasing C/I, and the rise is more evident for fly ash mixes. Mechanistically, silica fume’s ultrafine particles have higher reactivity and specific surface area, binding more free water through adsorption and secondary reactions with cement hydration products; consequently, some silica fume mixes exhibited no visible bleeding.
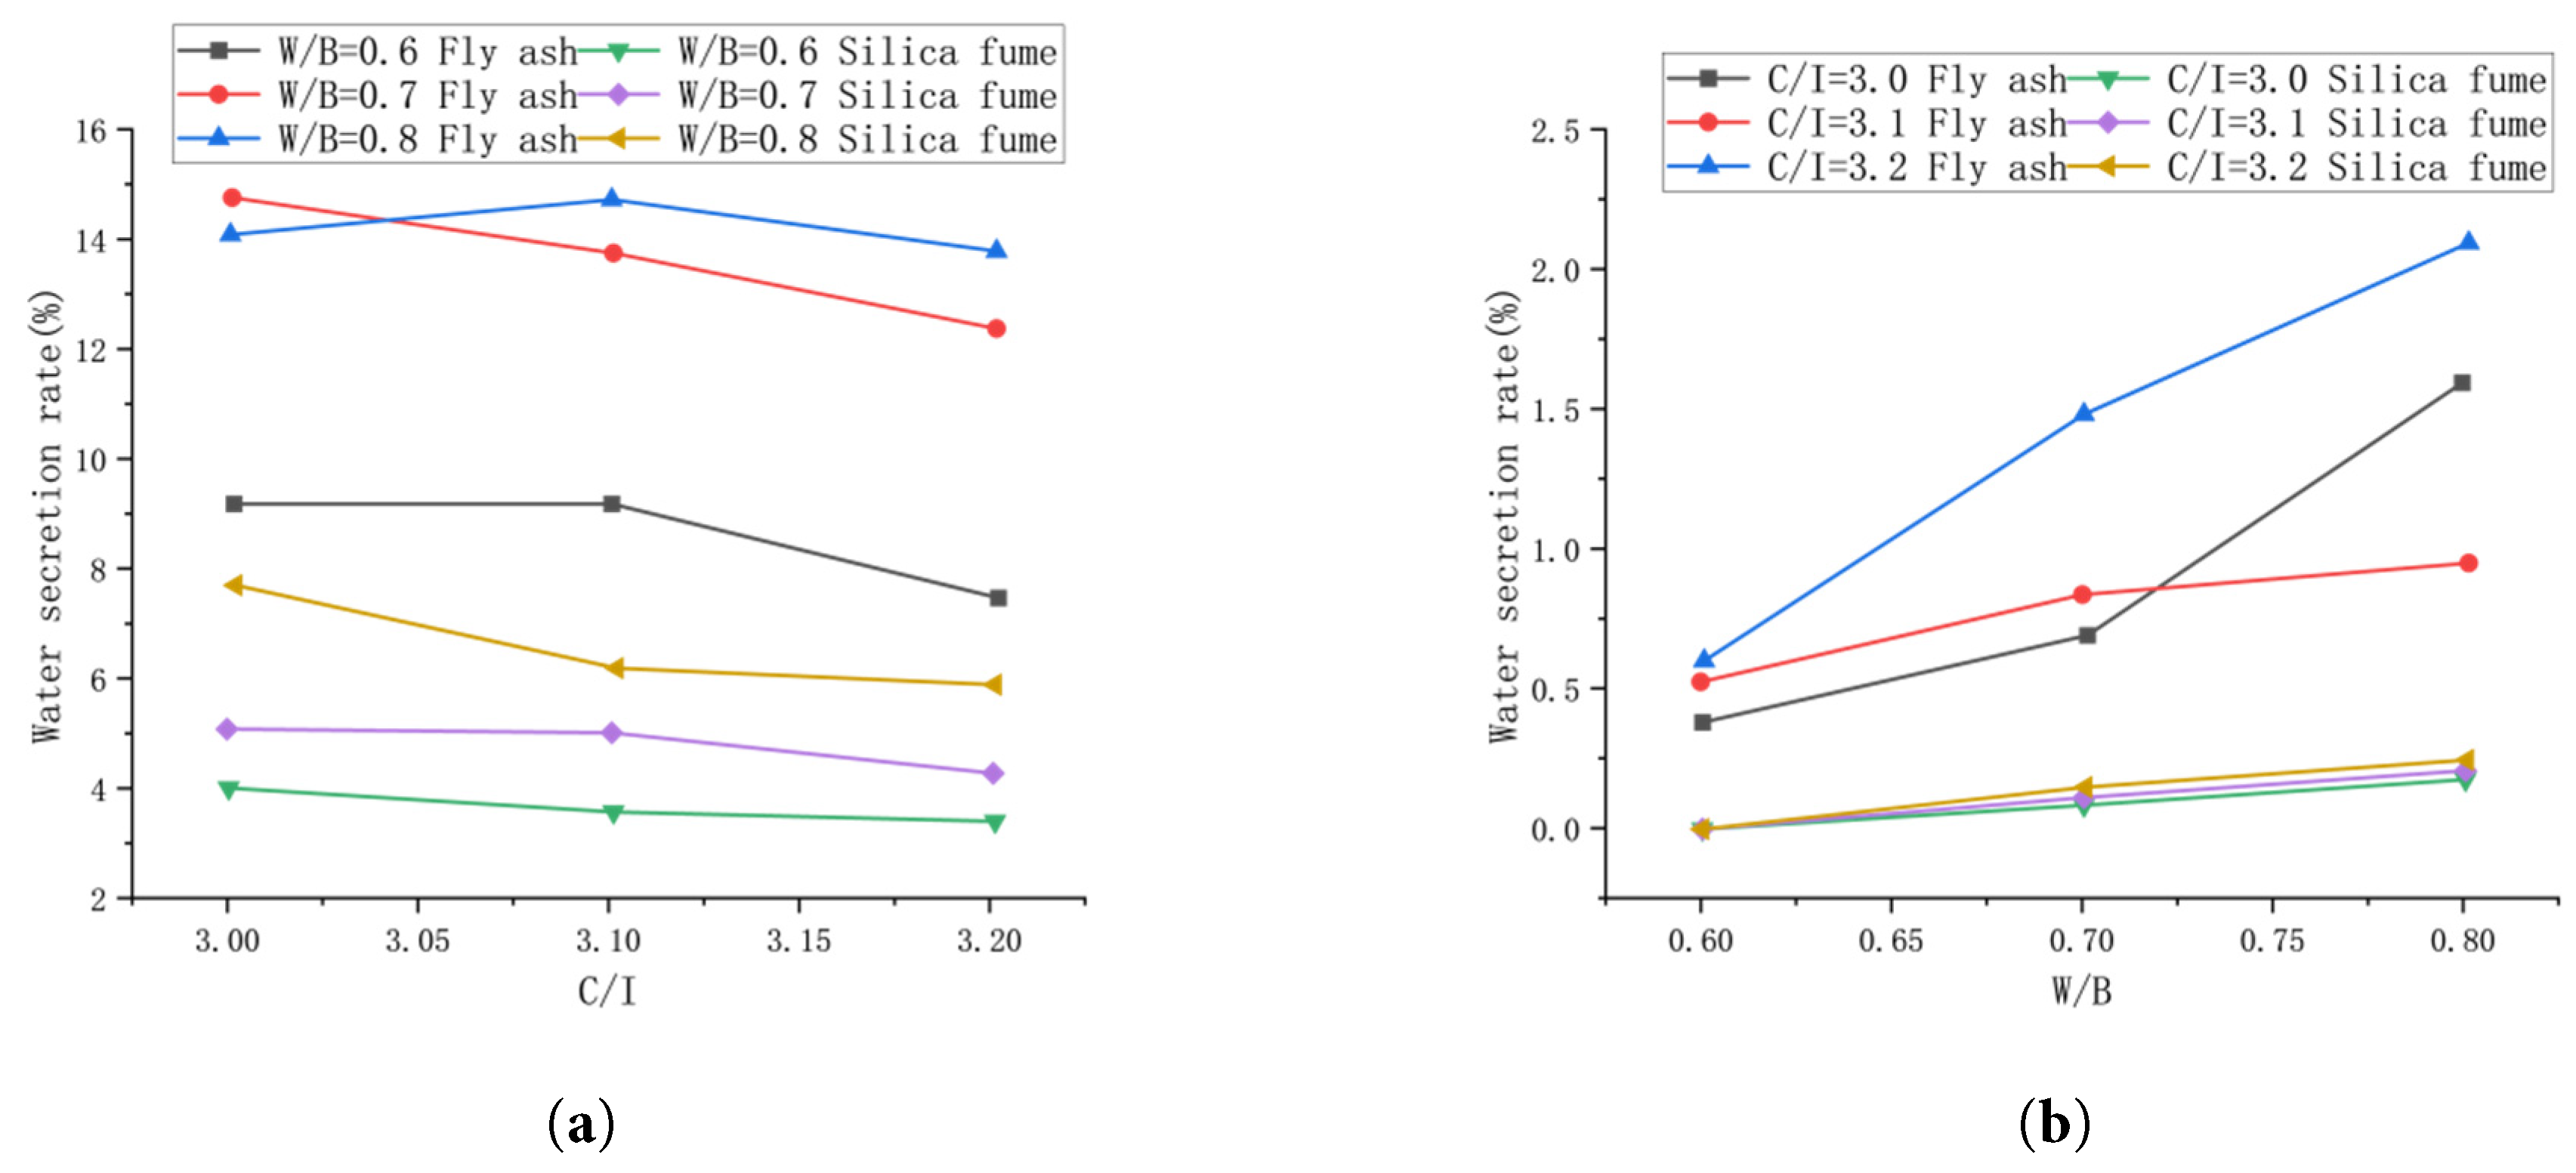
Figure 6: Comparative test results of water secretion rate: (a) The variable is C/I; (b) The variable is W/B.
Fig. 6b indicates that, secretion rate increases with W/B for both additives. Both the absolute secretion rate and its rate of increase are slightly higher in fly ash mixes than in silica fume mixes, indicating better stability for the latter.
Here, the water secretion rate is defined as the volume fraction of expressed water separated from a unit volume of slurry due to sedimentation and particle segregation, and it is a key indicator of slurry stability.
3.4 Comparison Test Results of Slurry Solidification Time
Fig. 7a shows that: at a fixed W/B, the solidification time of both silica fume and fly ash slurries decreases as C/I increases (i.e., as the cement fraction rises). Under identical W/B and C/I, silica fume mixes exhibit shorter solidification times than fly ash mixes. This trend reflects faster structure build up driven by higher clinker content and the ultrafine, highly reactive nature of silica fume, which promotes early gel formation through nucleation and secondary reactions with hydration products.
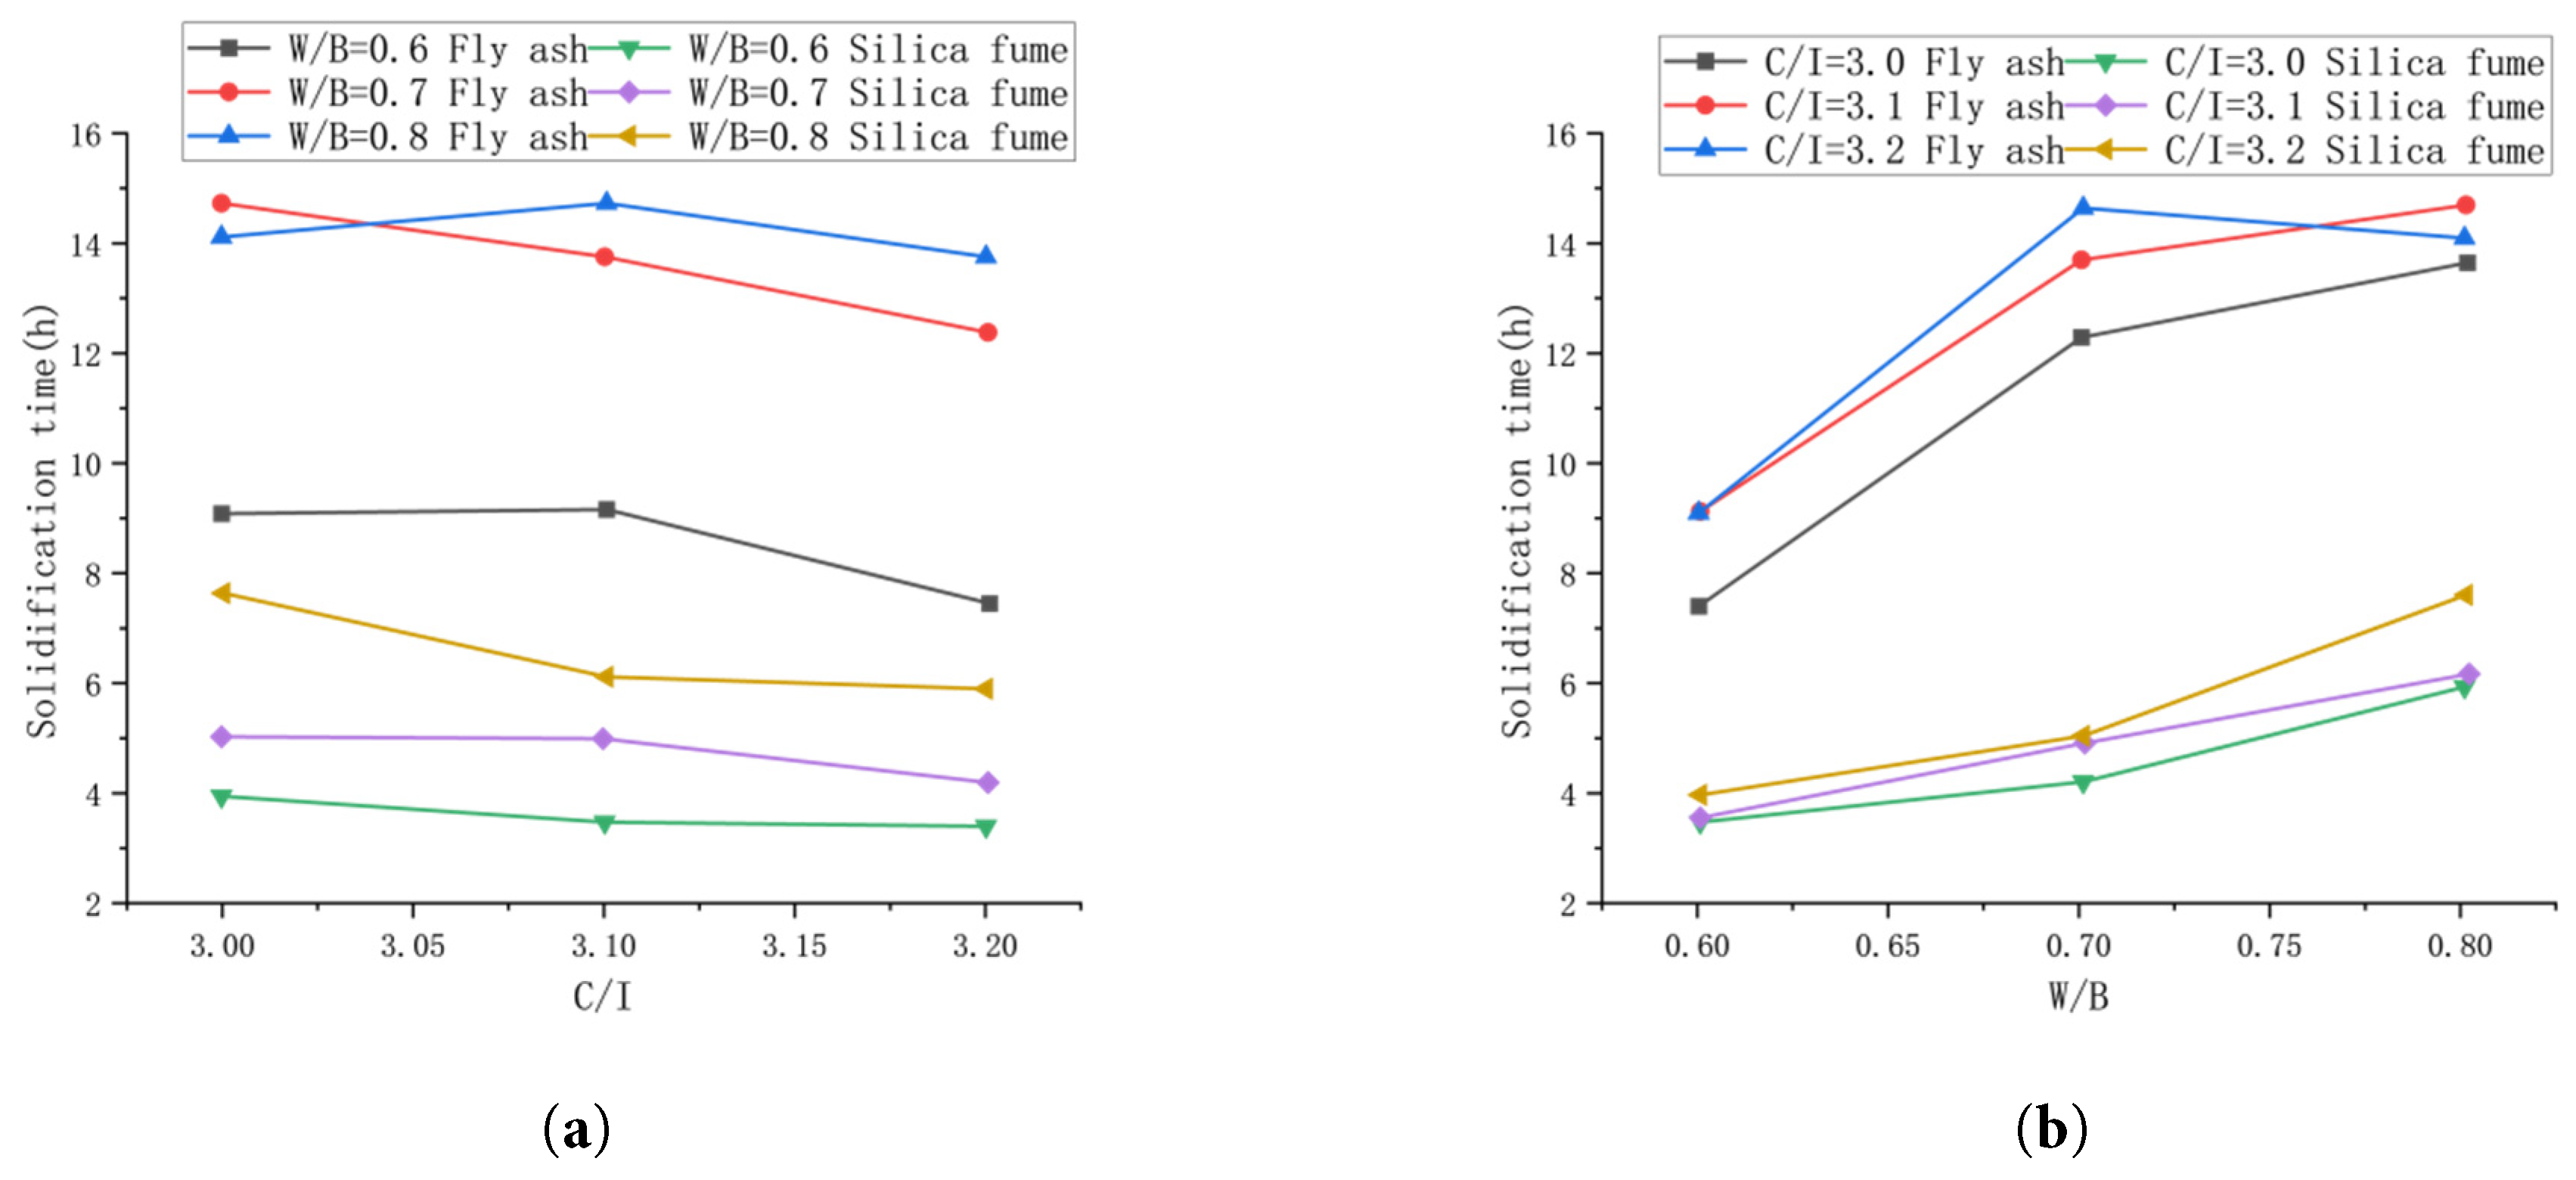
Figure 7: Comparison test results of solidification time: (a) The variable is C/I; (b) The variable is W/B.
Fig. 7b shows that, at a fixed C/I, the setting time increases with W/B. The prolongation is more pronounced for fly ash mixes, consistent with dilution effects (greater interparticle spacing and reduced solids concentration) and the slower early reactivity of fly ash.
The solidification time is one of the important parameters affecting the grouting performance, if the solidification time of the slurry is excessive, the slurry may be diluted by groundwater before stiffening and may not achieve the early strength needed to control ground settlement or prevent segment uplift.
3.5 Comparison Test Results of 3 h Compressive Strength
Fig. 8a shows that, at a fixed W/B, the compressive strength of both silica fume and fly ash slurries increases with C/I. As the replacement level of silica fume or fly ash decreases, more cement is available to hydrate and form solid hydration products, leading to higher strength.
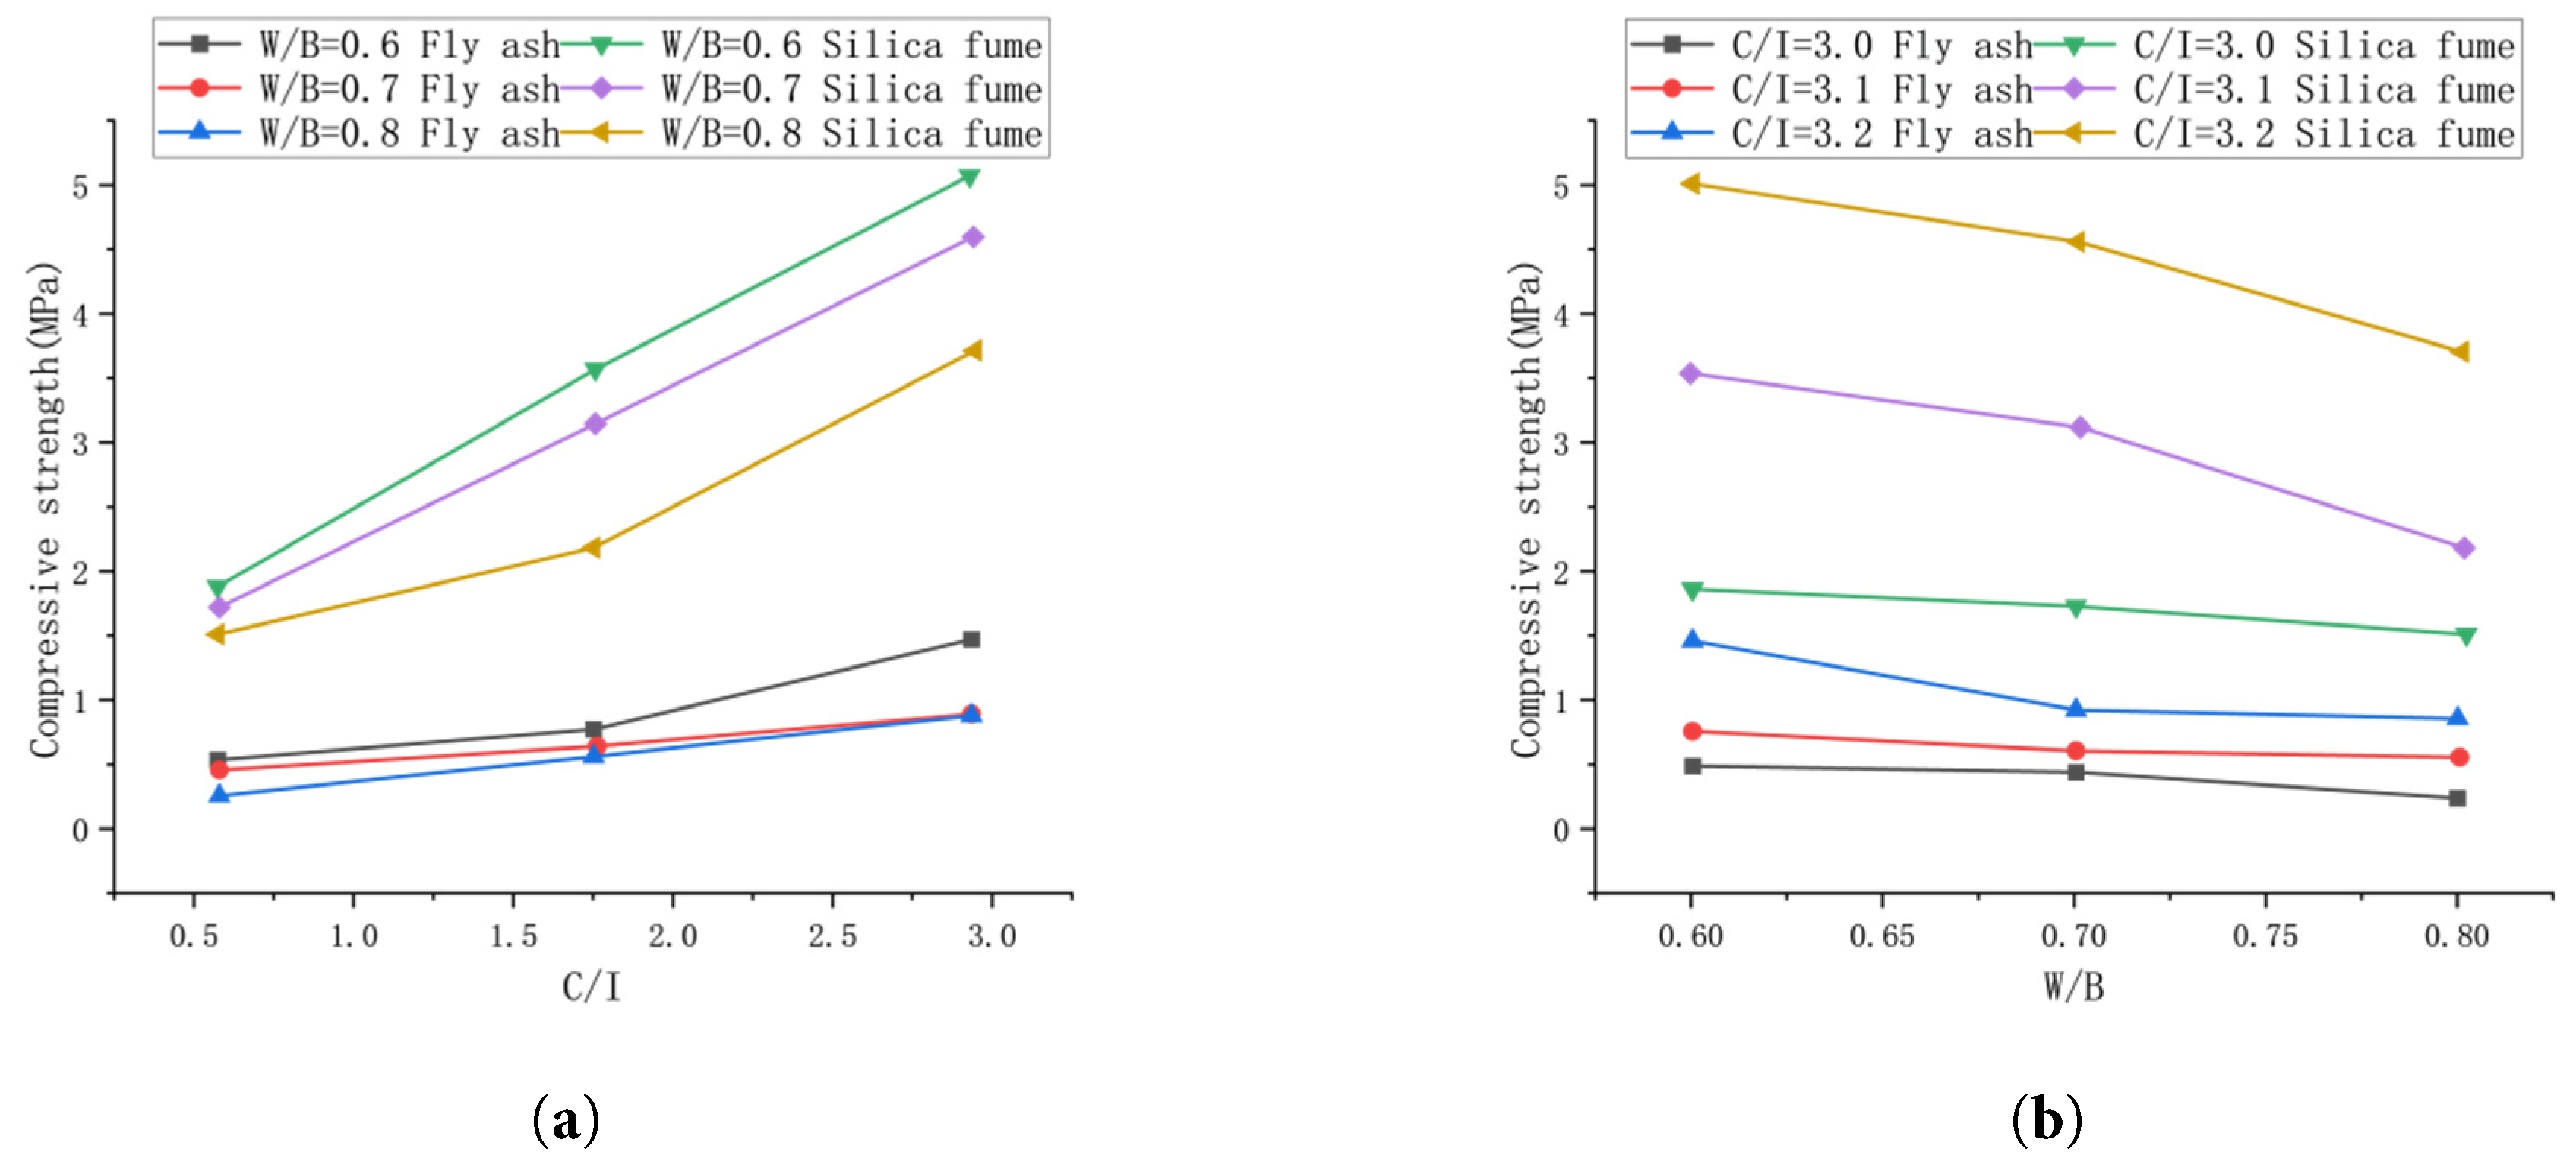
Figure 8: 3d compressive strength comparison test results: (a) The variable is C/I; (b) The variable is W/B.
Fig. 8b shows that, at a fixed C/I, with the gradual increase of W/B, the compressive strength of the slurry is gradually reduced. Among them, the reduction of compressive strength of silica fume group with C/I of 3.0 and 3.1 is more significant. While the W/B increases, there is too much free water in the slurry, which leads to a more unstable slurry, and the appearance of segregation reduces the compactness of the stone body, so the compressive strength of the slurry is reduced.
Taken together (Fig. 8a,b), silica fume mixes generally achieve higher compressive strength than fly ash mixes. The slurry must have a certain strength after solidification, so that after the slurry is injected into the void at the end of the shield, it can connect the tube sheet with the surrounding rock and make it form a whole. Uniformly withstand the pressure of the surrounding rock, to ensure the stability of the tunnel structure, and reduce tunnel water seepage. By referring to previous studies on the compressive strength of silica fume slurry after consolidation [15], we found that within a certain range (3.5%~10.5%), a higher silica fume content can significantly improve the compressive strength of the grout.
Silica fume particles are finer than fly ash particles, with high silica content, volcanic ash activity and other Physical and chemical characteristics, so for the enhancement of the compressive strength of the role of the two aspects: structure filler role and play a role in the early hydration of the nucleus, the volcanic ash reaction can change the pore structure of the slurry, so that the number of large pores to reduce the number of small pores, but also make the slurry in the calcium hydroxide to reduce the number of crystals to become fine. The crystals become fine and enhance the bonding between the slurry and the aggregate; the fine silica fume particles are more capable of filling the pores between the cement particles, which improves the denseness of the crystalline body, so the compressive strength is improved. From the microscopic point of view, the generated gel has good cementing performance, and the unhydrated silica fume fills the voids between the particles together, which enhances the compressive strength of the stone body to a certain extent.
A broader comparison of slurries with fly ash versus silica fume (Fig. 4, Fig. 5, Fig. 6, Fig. 7 and Fig. 8) shows: within a certain range of mixing ratios, the consistency difference between the slurry prepared with fly ash as additive and the slurry prepared with silica fume as additive with the same mixing ratios is the largest and reaches 87 mm, when the water-to-cement ratio is about 0.7 and the C/I is about 3.1, the flow difference of the two slurries is significant and reaches 88 mm; the consistency and flow of the slurry with silica fume as additive are both worse than that with fly ash as additive, the difference in flow is 88 mm. 3.1, the difference in the flow of the two slurry is significant, and the difference in the flow reaches 88 mm, and the consistency and flow of the slurry prepared with silica fume as additive are worse than that of the slurry prepared with fly ash as additive. Under the condition of larger water-to-cement ratio, the water secretion rate of the slurry prepared with fly ash as additive was larger, and the water secretion phenomenon of the slurry was more significant when the substitution rate of fly ash was larger. In terms of solidification time, the slurry prepared with silica fume as additive solidified faster than the slurry prepared with fly ash as additive. This is mostly because in terms of setting behavior, silica-fume mixes set faster than fly-ash mixes, largely due to more rapid secondary (pozzolanic) reactions.
Based on these comparative results, the cement-based slurry incorporating silica fume demonstrated superior overall performance to that with fly ash. Accordingly, silica fume was selected as the additive for the subsequent orthogonal test program.
4 Orthogonal Tests of Silica Fume Cement-Based Slurry and Analysis of Results
Response surface methodology (RSM), first introduced by Box and Wilson in 1951, provides an experimental and statistical framework for problems in which a target response is influenced by multiple variables. Response surface methodology is the expression of the complex relationship between inputs (factors) and outputs (target outcomes) through the form of a function [16].
With comparatively few experimental runs, response surface methodology can yield a regression model with high accuracy and strong predictive performance, while quantifying both main effects and interactions among factors. The response surface methodology supports both quantitative and qualitative analysis: after fitting, analysis of variance (ANOVA) can be applied to the overall model and to individual factors, enabling clear, interpretable assessment—often with visual summaries—of how each factor influences the response.
Comparison tests reveal only how different additives affect slurry properties under identical mix ratios. To further quantify the effects of mix proportions and their interactions on slurry performance, we designed orthogonal experiments within a response surface methodology framework. This allowed us to evaluate the magnitude of each factor’s effect under simultaneous variation of independent variables and to identify the governing influence patterns of statistically significant terms.
From the results of comparison tests, silica fume mixes exhibited lower fluidity than fly ash mixes. In order to ensure the normal preparation of the slurry and the normal conduct of the basic project test. When carrying out the response surface test of the slurry prepared with silica fume, with reference to the common range of slurry mixing ratios in the actual project, W/B was increased to 1.3~1.5, B/S was reduced to 0.4~0.8, Ben/W range was selected at 0.1~0.5, and C/I was reduced to 0.4~0.8. The levels and symbols of the factors are shown in Table 3, and the experimental design is shown in Table 4.
Table 3: Coding table for each factor.
| Factor | Code | Level | ||
|---|---|---|---|---|
| −1 | 0 | 1 | ||
| W/B | x1 | 1.3 | 1.4 | 1.5 |
| B/S | x2 | 0.4 | 0.6 | 0.8 |
| Ben/W | x3 | 0.1 | 0.3 | 0.5 |
| C/I | x4 | 0.4 | 0.6 | 0.8 |
Table 4: Orthogonal experimental design.
| Test Number | W/B | B/S | Ben/W | C/I | Test Number | W/B | B/S | Ben/W | C/I |
|---|---|---|---|---|---|---|---|---|---|
| A-1 | 1.3 | 0.4 | 0.3 | 0.6 | A-15 | 1.4 | 0.4 | 0.5 | 0.6 |
| A-2 | 1.5 | 0.4 | 0.3 | 0.6 | A-16 | 1.4 | 0.8 | 0.5 | 0.6 |
| A-3 | 1.3 | 0.8 | 0.3 | 0.6 | A-17 | 1.3 | 0.6 | 0.1 | 0.6 |
| A-4 | 1.5 | 0.8 | 0.3 | 0.6 | A-18 | 1.5 | 0.6 | 0.1 | 0.6 |
| A-5 | 1.4 | 0.6 | 0.1 | 0.4 | A-19 | 1.3 | 0.6 | 0.5 | 0.6 |
| A-6 | 1.4 | 0.6 | 0.5 | 0.4 | A-20 | 1.5 | 0.6 | 0.5 | 0.6 |
| A-7 | 1.4 | 0.6 | 0.1 | 0.8 | A-21 | 1.4 | 0.4 | 0.3 | 0.4 |
| A-8 | 1.4 | 0.6 | 0.5 | 0.8 | A-22 | 1.4 | 0.8 | 0.3 | 0.4 |
| A-9 | 1.3 | 0.6 | 0.3 | 0.4 | A-23 | 1.4 | 0.4 | 0.3 | 0.8 |
| A-10 | 1.5 | 0.6 | 0.3 | 0.4 | A-24 | 1.4 | 0.8 | 0.3 | 0.8 |
| A-11 | 1.3 | 0.6 | 0.3 | 0.8 | A-25 | 1.4 | 0.6 | 0.3 | 0.6 |
| A-12 | 1.5 | 0.6 | 0.3 | 0.8 | A-26 | 1.4 | 0.6 | 0.3 | 0.6 |
| A-13 | 1.4 | 0.4 | 0.1 | 0.6 | A-27 | 1.4 | 0.6 | 0.3 | 0.6 |
| A-14 | 1.4 | 0.8 | 0.1 | 0.6 |
4.2 Analysis of the Results of the Orthogonal Test
The p-value was used to evaluate the significant terms of the model, and Table 5 presents the results of the parameter analysis for the interaction terms. Among them, the smaller the p-value, the more significant the impact of the interaction term on the response value [16].
Table 5: Results of parameter analysis.
| Response | Consistency | Collapse Degree | Solidification Time | Compressive Strength |
|---|---|---|---|---|
| Type | p-Value | p-Value | p-Value | p-Value |
| x1x2 | 0.8768 | 0.7909 | 0.1358 | 0.8615 |
| x1x3 | 0.1687 | 0.7909 | 0.0026 | 0.0005 |
| x1x4 | 0.1486 | 0.6237 | 0.8655 | 0.24 |
| x2x3 | 0.4009 | 0.7909 | 0.8004 | <0.0001 |
| x2x4 | 0.5896 | 0.7909 | 0.0991 | 0.8007 |
| x3x4 | 0.0467 | 0.5226 | 0.044 | <0.0001 |
The test results of slurry consistency are shown in Fig. 9a. The significance of the interaction terms is ranked based on the p-value of the interaction terms and combined with the coding of the factors in Table 3. The significance is ranked from largest to smallest: x3x4 > x1x4 > x1x3 > x2x3. That is, the interaction term of bentonite-water ratio and cement replacement rate have the strongest ability to influence the slurry consistency. Analyzing this interaction term and the test results, it can be seen that as the bentonite-water ratio Ben/W increase from 0.1 to 0.5 and cement replacement rate C/I decrease from 0.8 to 0.4, the consistency drops from 100.5 mm to 62.5 mm.
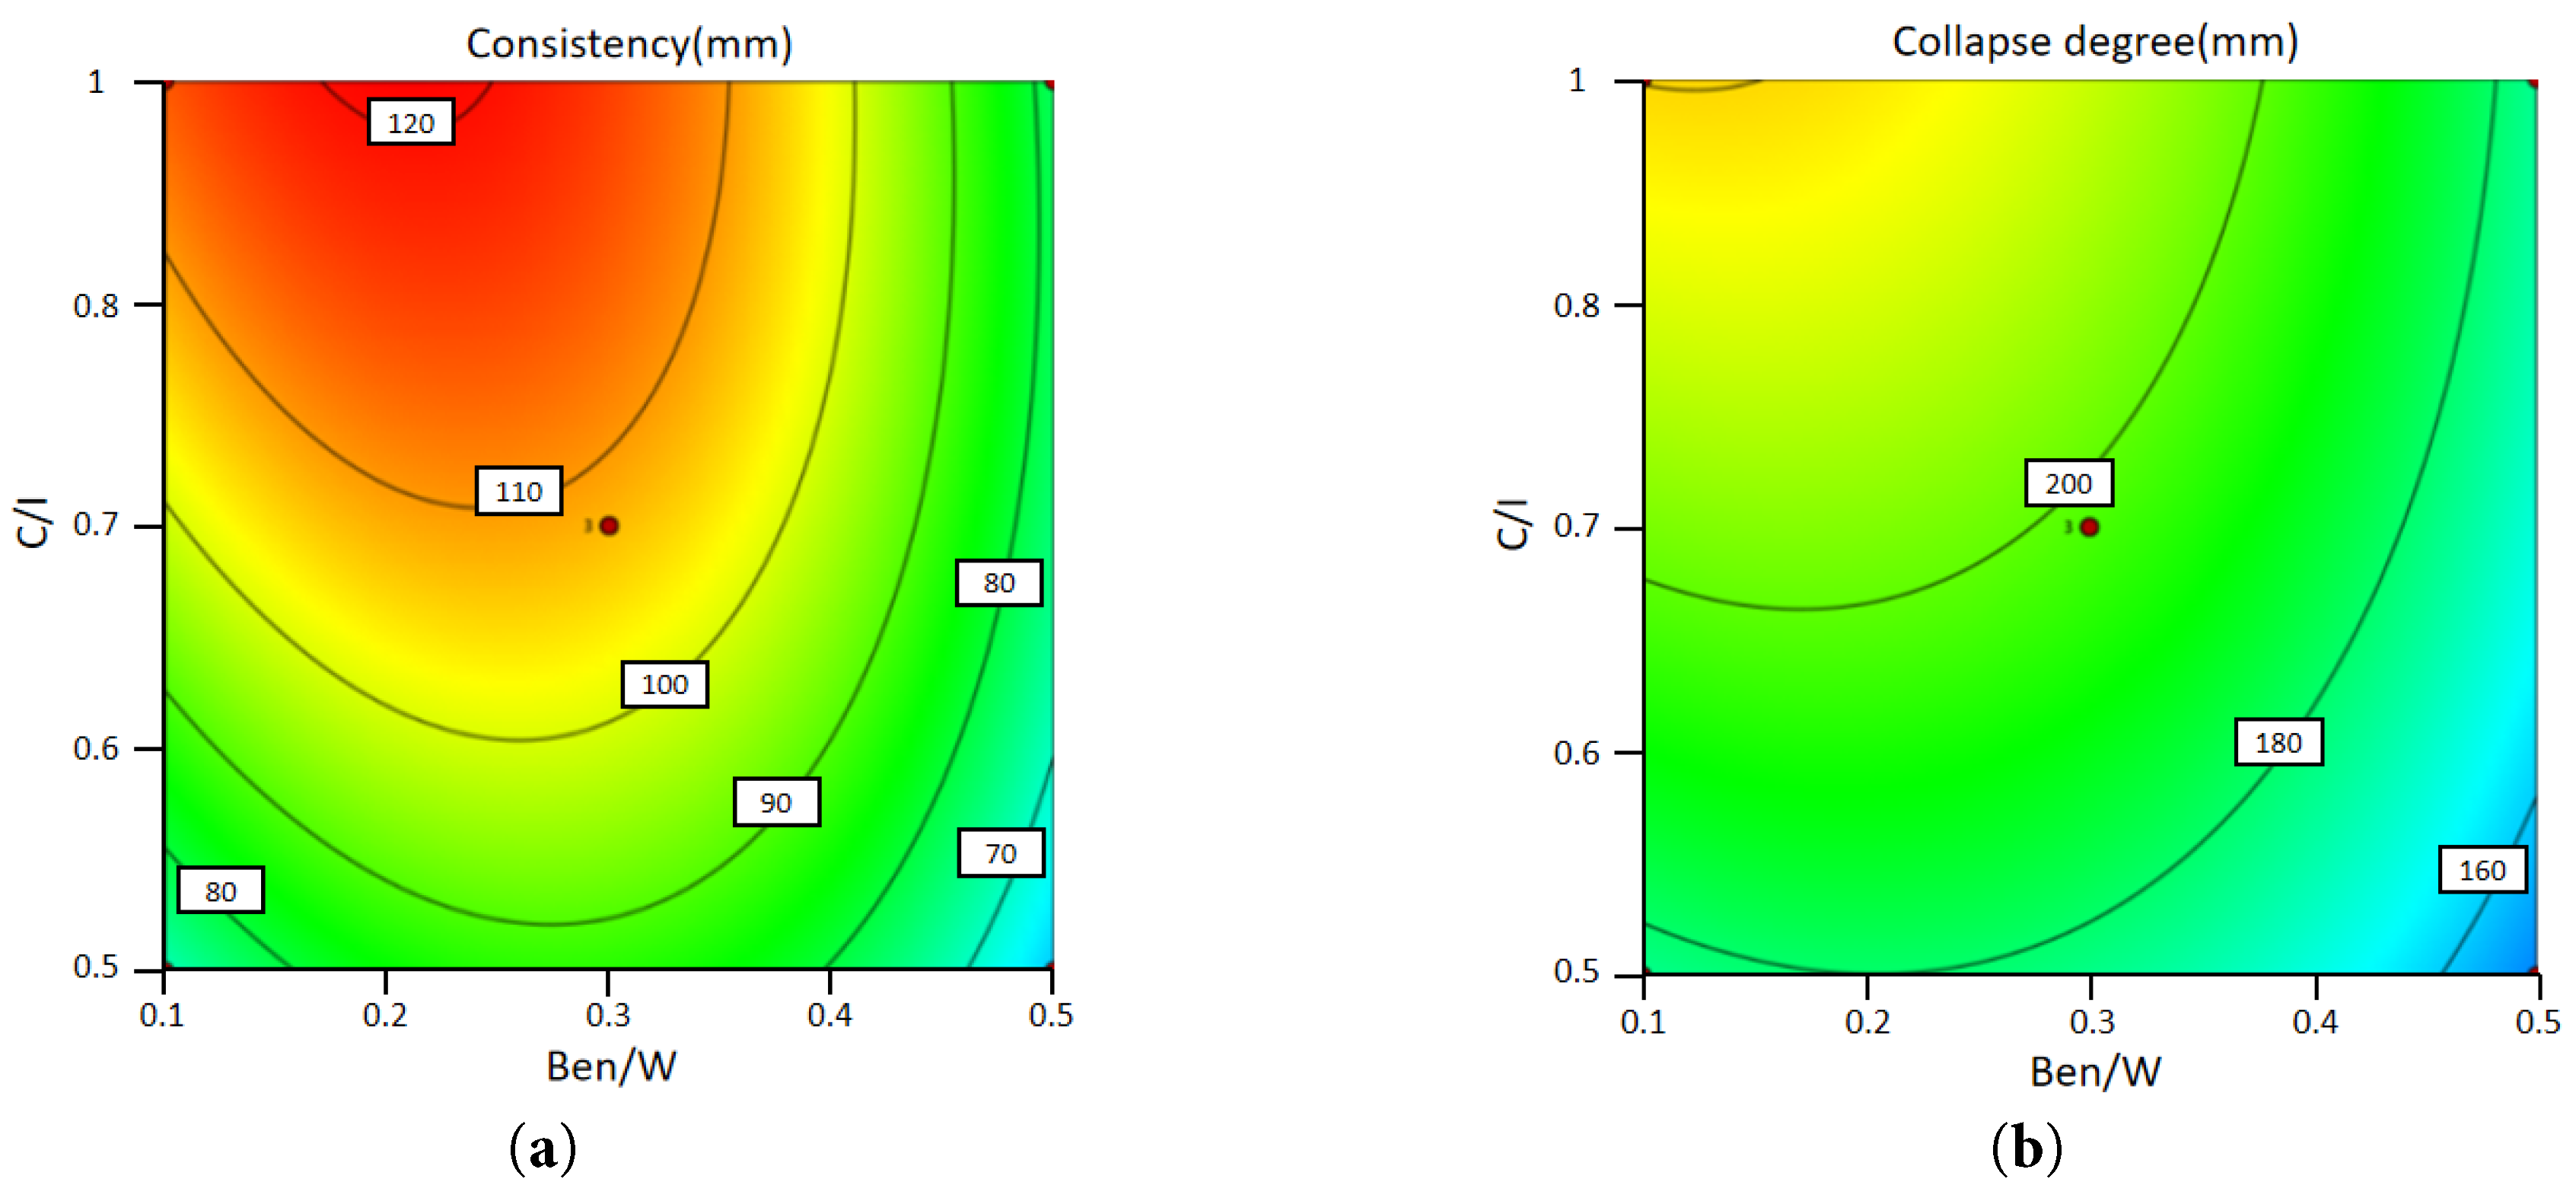
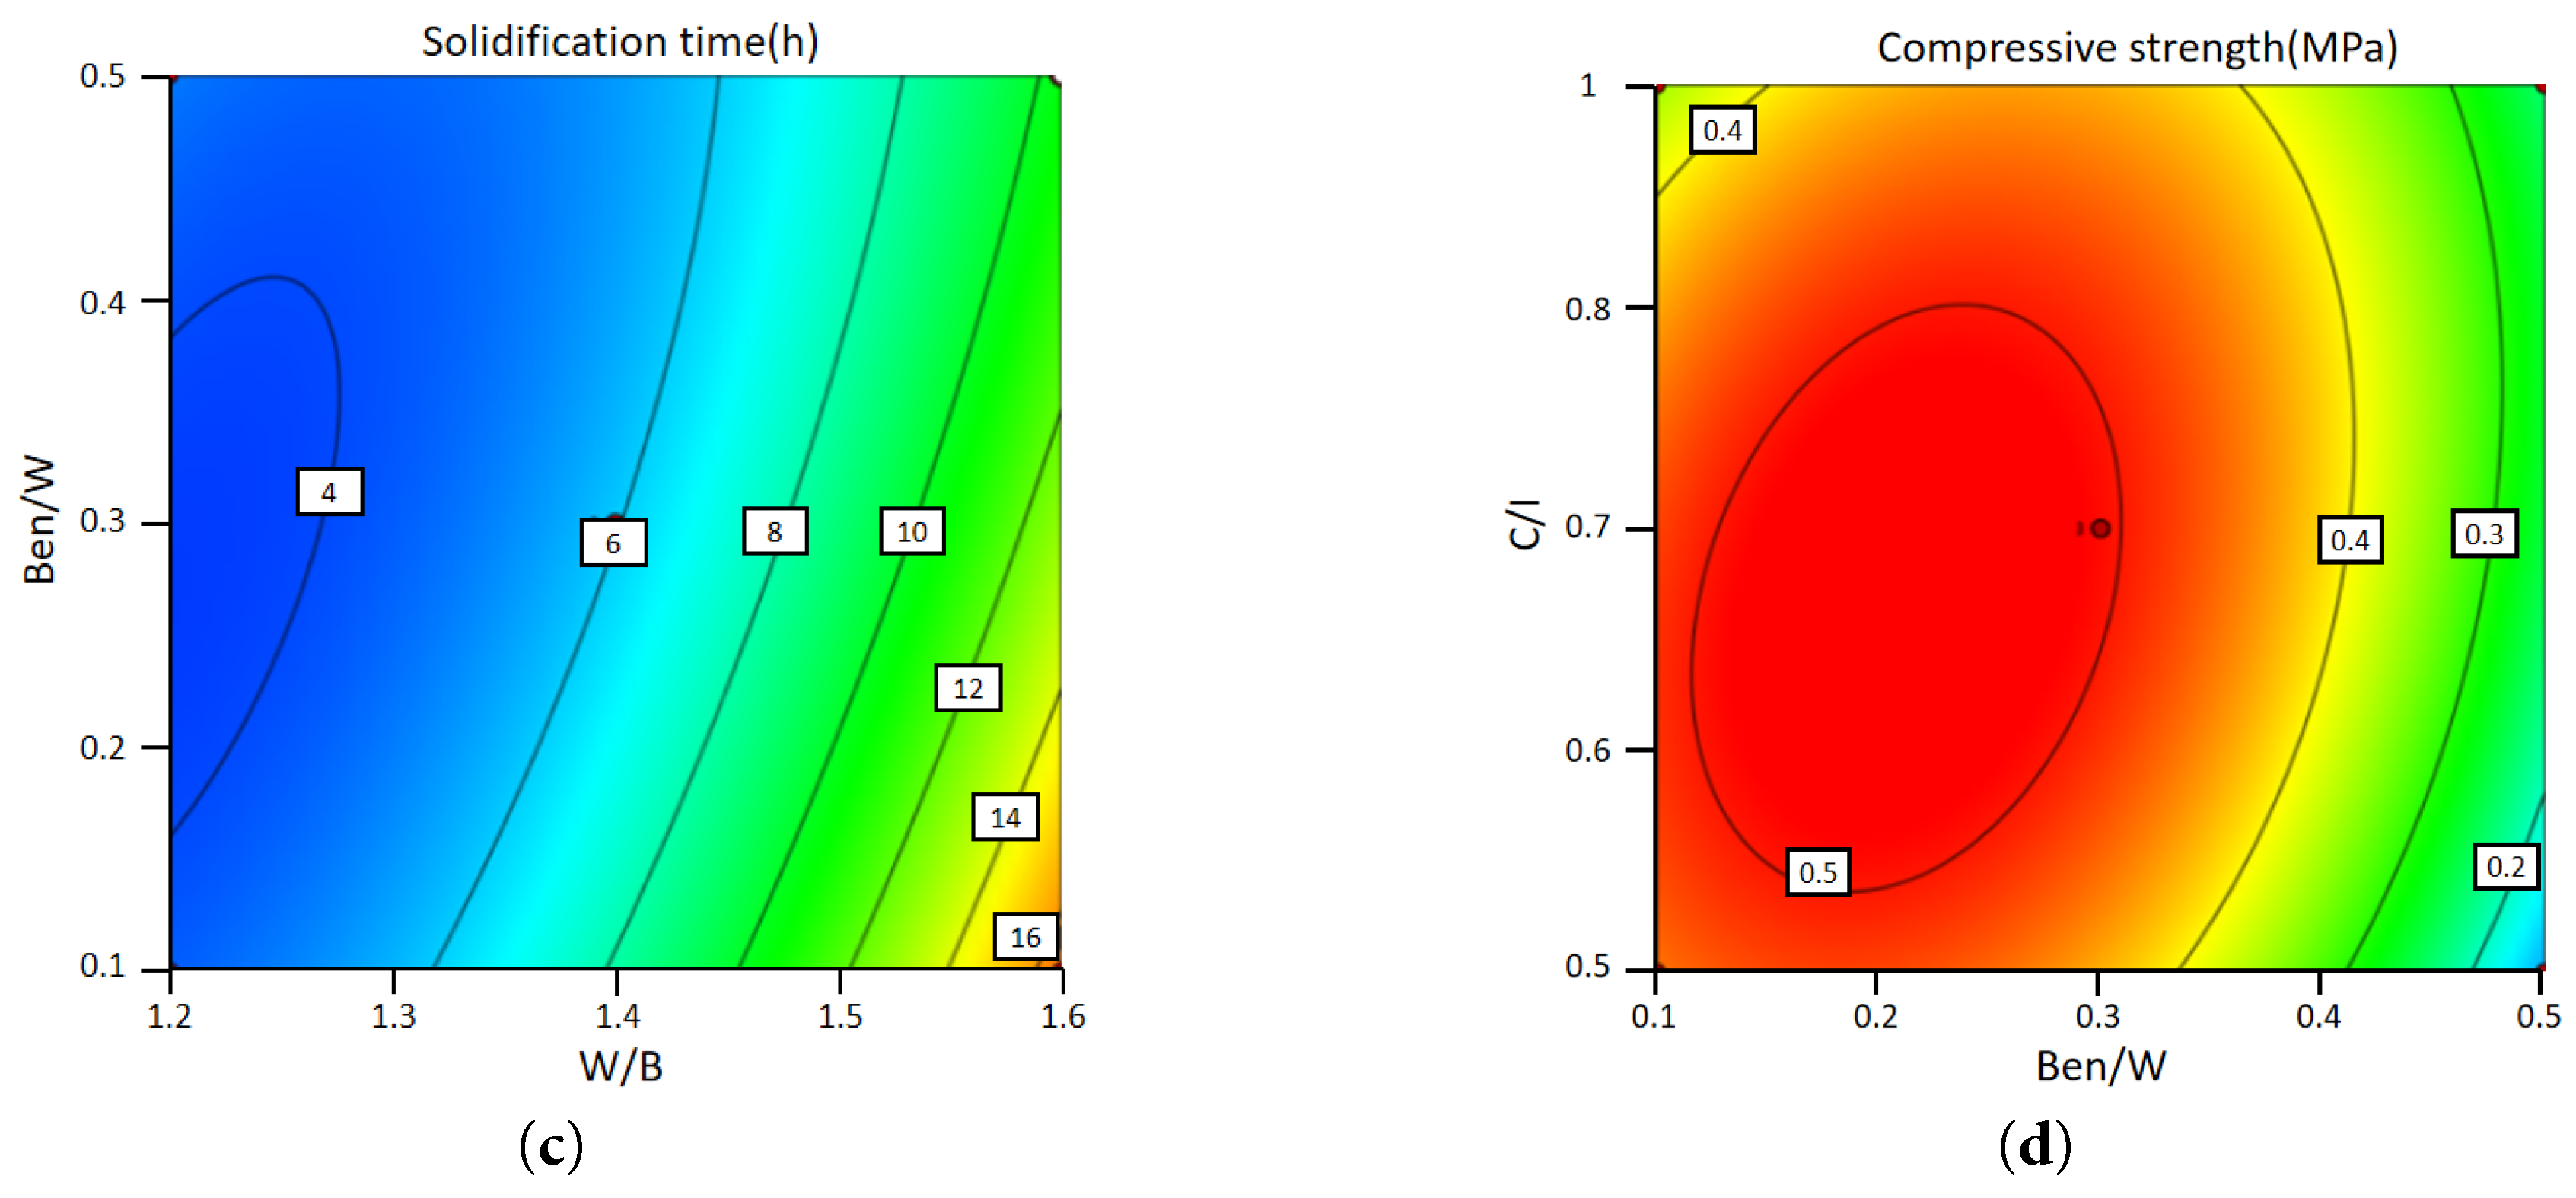
Figure 9: Contour map of orthogonal test results: (a) Result of consistency; (b) Result of collapse degree; (c) Result of solidification time; (d) Result of compressive strength.
The test results of slurry collapse degree are shown in Fig. 9b. The ranked significance of the interaction terms is: x3x4 > x1x4 > x1x3 = x2x3, indicating that the interaction terms of bentonite-water ratio and cement replacement rate have the most significant effect on collapse degree. Analyzing the most significant interaction term and the test results, when one factor is held constant, changing the other produces large variations. And the effect of cement replacement rate C/I is much more significant compared to bentonite-water ratio Ben/W. The slurry collapse degree decreases from a maximum of 230.5 mm to 145.5 mm.
The test results of solidification time of the slurry are shown in Fig. 9c. The ranked significance of the interaction terms is x1x3 > x3x4 > x2x4 > x1x2, in other words, the bentonite-water ratio and water-cement ratio have the most significant effect on the slurry solidification time. Analyzing the most significant interaction terms and the test results, it can be seen that the combined effect of water-cement ratio W/B and bentonite-water ratio Ben/W in affecting the solidification time of slurry is relatively weak. And the influence of water-cement ratio W/B is stronger than the effect of bentonite-water ratio Ben/W.
The test results of the compressive strength of the slurry are shown in Fig. 9d. The ranked significance of the interaction terms is x3x4 = x2x3 > x1x3 > x1x4, that is, the interaction terms of bentonite-water ratio and cement replacement rate have the strongest ability to influence the slurry consistency. The 3 h compressive strength of the slurry reaches a maximum of 0.51 MPa when both factors are varied to their intermediate values. At low levels of bentonite-water ratio, the compressive strength decreased to a minimum of 0.05 MPa.
This study systematically examines additive selection and mix-proportion effects in cement-based slurries, moving beyond traditional one-factor analyses by introducing response surface methodology (RSM) to quantify interaction effects. Using comparative tests and orthogonal designs, and evaluating consistency, slump, solidification time, and compressive strength. We elucidate the governing mechanisms of slurry fluidity, stability, and strength. The main contributions and findings are:
Comparative tests clarify how different additives regulate the basic properties of cement-based slurries. Under identical mix proportion conditions, a comparison of two additives—silica fume and fly ash—reveals that silica fume exerts a significantly stronger regulatory effect on slurry fluidity and strength than fly ash, owing to its smaller particle size and higher silica content. Specifically, silica fume slurries exhibit an average consistency 80 mm lower and an average slump 75 mm lower than those of fly ash slurries. This demonstrates that silica fume enables more precise optimization of slurry fluidity, addressing the issue of excessive fluidity fluctuations in traditional fly ash-based slurries. In practical engineering, enhancing slurry fluidity effectively reduces losses during transportation; however, it also increases transportation difficulty accordingly. Incorporating an appropriate amount of silica fume, tailored to specific engineering conditions, allows for more effective fluidity control. While this slightly elevates pumping difficulty, it substantially reduces grout loss—offering clear economic benefits.
Silica fume reacts more readily with cement and adsorbs more free water, lowering the average bleeding rate by 7%, enhancing stability. As a result, the average secretion rate of silica fume slurry is 7% lower than that of fly ash slurry, significantly improving slurry stability. At the same time, silica fume has a more significant promoting effect on cement setting, shortening the average slurry time by 7 h. Ultimately, this increases the average compressive strength of the set grout by 2.6 MPa, providing a key basis for the design of high-strength grout formulations. A faster solidification speed and higher compressive strength can effectively prevent surface subsidence and water leakage issues. However, a shorter setting time may lead to blockages during transportation. Therefore, the use of silica fume grout may require more innovative pumping methods and incur higher transportation costs.
The effect of interaction terms on slurry properties is quantified by combining orthogonal tests with response surface methodology (RSM). On the basis of orthogonal tests with silica fume as the additive, the response surface methodology is introduced for the first time to quantitatively analyze the interaction terms of mix proportions. Surface fitting and sensitivity analysis of the response surface methodology clarify both the degree of influence and inherent patterns of how different mix proportion interaction terms affect slurry properties.
The W/B–C/I interaction exerts the strongest influence on consistency, slump, and compressive strength. Quantitative calculation via the response surface methodology shows that the change rates of these three dependent variables reach 37.8%, 36.9%, and 90.2%, respectively. Among them, the change rate of compressive strength is nearly 90%, indicating that this interaction term is the core parameter for regulating the strength performance of silica fume slurry. The effect of W/B is attributed to the relative increase in the mass of cement-based materials. On one hand, these materials adsorb water molecules in the slurry to form a bound water layer; on the other hand, they fill the gaps between bentonite particles, thereby effectively influencing properties of the slurry such as consistency. The effect of C/I, by contrast, is due to silica fume’s smaller particle size and larger specific surface area, which allow it to adsorb more water molecules in the slurry and thereby drive significant changes in physical properties.
The interaction term between W/B and Ben/W has the most prominent influence on slurry solidification time. Analysis by the response surface methodology shows that its change rate is 68.8%. The effect of Ben/W on the slurry is attributed to the change in the overall solid content of the slurry. When the bentonite content is relatively high, the combination between bentonite particles and water molecules is not tight, which leads to the formation of aggregates with a larger volume but lower water content. After the specimen is consolidated for 3 h, the water molecules between the particles are depleted, lubricating effect of water between the particles is insufficient, and the 3 h compressive strength increases.
These quantitative results provide actionable guidance for precisely regulating setting time and other properties, addressing the limitations of empirical mix design that often struggles to balance rapid set with constructability.
Combined with comparative experiments and orthogonal experiments, the study systematically analyzes the variation laws of the slurry’s macroscopic basic properties, and innovatively introduces the response surface methodology (RSM) to conduct research on the influence mechanism of interaction terms, thereby providing precise theoretical support for the regulation of slurry performance. However, several limitations remain and warrant further work.
Macroscopic focus. The analysis relies almost entirely on bulk performance metrics; microstructural characterization (e.g., SEM) was not performed, limiting mechanistic explanations for observed trends.
Regarding the compressive strength of the slurry, no long-term durability tests have been conducted. Additionally, there is a lack of integration with actual engineering and practical applications, which results in the research conclusions lacking a certain degree of depth to some extent.
There was no project-specific cost modeling was conducted; only dosage-level comparisons were made, which may render the predictions overly conservative.
Subsequent research will incorporate microscopic testing to track particle-scale morphology under different mix ratios and to more accurately resolve the factors controlling slurry rheology and strength. Coupling these microstructural insights with RSM will enable a more precise, interaction-aware regulation of setting behavior and mechanical performance, and will be complemented by durability testing and engineering-condition cost analyses.
Acknowledgement:
Funding Statement: This research was funded by the National Natural Science Foundation of China (52278403).
Author Contributions: Conceptualization, Ke Li and Bendong Liu; methodology, Ke Li and Yulong Han; software, Ke Li; validation, Yulong Han and Yafeng Zhang; investigation, Chunqi Yang; resources, Dawei Yin and Wantao Ding; data curation, Chunqi Yang and Yafeng Zhang; writing—original draft preparation, Ke Li; writing—review and editing, Dawei Yin and Yazhou Zhang; visualization, Yazhou Zhang; project administration, Wantao Ding. All authors reviewed the results and approved the final version of the manuscript.
Availability of Data and Materials: The original contributions presented in this study are included in the article. Further inquiries can be directed to the corresponding author.
Ethics Approval: Not applicable.
Conflicts of Interest: The authors declare no conflicts of interest to report regarding the present study.
References
1. Bezuijen A , Talmon AM , Kaalberg FJ , Plugge R . Field measurements of grout pressures during tunnelling of the Sophia Rail Tunnel. Soils Found. 2004; 44( 1): 39– 48. doi:10.3208/sandf.44.39. [Google Scholar] [CrossRef]
2. Zhang Z , Zhang B , Yan P . Comparative study of effect of raw and densified silica fume in the paste, mortar and concrete. Constr Build Mater. 2016; 105: 82– 93. doi:10.1016/j.conbuildmat.2015.12.045. [Google Scholar] [CrossRef]
3. Bao J , Zhu X , Wei S , Ren F , Luo W , Xu S . Effect of composite fibers and fly ash on the properties of Portland–sulfoaluminate composite cement-based grouting sealing materials. Coatings. 2024; 14( 8): 989. doi:10.3390/coatings14080989. [Google Scholar] [CrossRef]
4. Shao S , Gong A , Wang R , Chen X , Xu J , Wang F , et al. A machine-learning approach for the prediction of fly-ash concrete strength. Fluid Dyn Mater Process. 2023; 19( 12): 3007– 19. doi:10.32604/fdmp.2023.029545. [Google Scholar] [CrossRef]
5. Ma J , Wang D , Zhao S , Duan P , Yang S . Influence of particle morphology of ground fly ash on the fluidity and strength of cement paste. Materials. 2021; 14( 2): 283. doi:10.3390/ma14020283. [Google Scholar] [CrossRef]
6. Koyama Y . Present status and technology of shield tunneling method in Japan. Tunn Undergr Space Technol. 2003; 18( 2–3): 145– 59. doi:10.1016/S0886-7798(03)00040-3. [Google Scholar] [CrossRef]
7. Atiş CD , Görür EB , Karahan O , Bilim C , İlkentapar S , Luga E . Very high strength (120 MPa) class F fly ash geopolymer mortar activated at different NaOH amount, heat curing temperature and heat curing duration. Constr Build Mater. 2015; 96: 673– 8. doi:10.1016/j.conbuildmat.2015.08.089. [Google Scholar] [CrossRef]
8. Nath P , Sarker PK . Use of OPC to improve setting and early strength properties of low calcium fly ash geopolymer concrete cured at room temperature. Cem Concr Compos. 2015; 55: 205– 14. doi:10.1016/j.cemconcomp.2014.08.008. [Google Scholar] [CrossRef]
9. Shubbar AA , Sadique M , Nasr MS , Al-Khafaji ZS , Hashim KS . The impact of grinding time on properties of cement mortar incorporated high volume waste paper sludge ash. Karbala Int J Mod Sci. 2020; 6( 4): 394– 403. doi:10.33640/2405-609x.2149. [Google Scholar] [CrossRef]
10. Tavakoli D , Heidari A , Karimian M . Properties of concretes produced with waste ceramic tile aggregate. Asian J Civ Eng. 2013; 14( 3): 369– 82. [Google Scholar]
11. Rahmouni ZEA , Maza M , Tebbal N , Belouadah M . On the combination of silica fume and ceramic waste for the sustainable production of mortar. Fluid Dyn Mater Process. 2023; 19( 5): 1083– 90. doi:10.32604/fdmp.2022.021970. [Google Scholar] [CrossRef]
12. Choudhary R , Gupta R , Nagar R , Jain A . Mechanical and abrasion resistance performance of silica fume, marble slurry powder, and fly ash amalgamated high strength self-consolidating concrete. Constr Build Mater. 2021; 269: 121282. doi:10.1016/j.conbuildmat.2020.121282. [Google Scholar] [CrossRef]
13. Ding Y , Ahmad MR , Chen B , Yu X . Ground granulated blast furnace slag-modified magnesium phosphate cement used as grouting material: workability, mechanical property and corrosion resistance optimization. J Build Eng. 2024; 96: 110450. doi:10.1016/j.jobe.2024.110450. [Google Scholar] [CrossRef]
14. Liu J , Zhao C , Yu S , Zhang J , Huang N . Similarity solutions for spherical cavity expansion in strain-softening soils and its application in cone penetration test. IOP Conf Ser Earth Environ Sci. 2024; 1337( 1): 012004. doi:10.1088/1755-1315/1337/1/012004. [Google Scholar] [CrossRef]
15. Deng C , Jiang Y , Tian T , Yi Y . Laboratory mechanical properties and frost resistance of vibration-compacted cement-fly ash slurry and cement-fly ash-treated macadam mixtures. Constr Build Mater. 2024; 419: 135555. doi:10.1016/j.conbuildmat.2024.135555. [Google Scholar] [CrossRef]
16. Cao K , Chen M , Zhang M , Wang H , Hu M , Ding W . Mechanism of seawater intrusion on property degradation of slurry in slurry shield tunneling. Tunn Undergr Space Technol. 2025; 159: 106487. doi:10.1016/j.tust.2025.106487. [Google Scholar] [CrossRef]
Cite This Article
 Copyright © 2025 The Author(s). Published by Tech Science Press.
This work is licensed under a Creative Commons Attribution 4.0 International License , which permits unrestricted use, distribution, and reproduction in any medium, provided the original work is properly cited.
 Downloads
 Citation Tools