
 Submit a Paper
 Propose a Special lssue
 Open Access
ARTICLE

Effect of Fin Spacing on Frost Growth and Airflow Dynamics in ASHP Evaporators
1 School of Mechanical and Electrical Engineering, China University of Mining and Technology, Xuzhou, 221000, China
2 Zhejiang Zhongguang Electrical Co., Ltd., Lishui, 323000, China
3 School of Automotive Engineering, Shandong Jiaotong University, Jinan, 250357, China
* Corresponding Author: Zhengqing Zhang. Email:
(This article belongs to the Special Issue: Fluid Mechanics & Thermodynamics in Renewable Energy and HVAC Systems)
Fluid Dynamics & Materials Processing 2025, 21(12), 2927-2943. https://doi.org/10.32604/fdmp.2025.071115
Received 31 July 2025; Accepted 21 November 2025; Issue published 31 December 2025
 View Full Text
 Download PDF
Abstract
Frost accumulation on the evaporator fins of air source heat pumps (ASHPs) severely degrades heat transfer performance and overall system efficiency. To address this, the present study employs computational fluid dynamics (CFD) to investigate how fin spacing influences frosting behavior, emphasizing the coupled evolution of frost thickness, density, airflow, and temperature distribution within fin channels. Results reveal that fin spacing is a key parameter governing both the extent and rate of frost growth. Wider fin spacing enhances frost accumulation, with a final frost mass of 6.41 g at 12 mm, about 71.8% higher than at 4 mm. In contrast, narrower spacing suppresses frost formation by accelerating airflow. The frost layer exhibits a distinct two-stage growth pattern: at 12 mm spacing, the early-stage average thickness growth rate reaches 0.021 mm/min, nearly 4.3 times that at 4 mm. Frost density follows similar initial trends across different spacings but diverges later due to thermal resistance and airflow variations.Keywords
Air-source heat pumps (ASHPs) have been widely applied in building heating, domestic hot water supply, and industrial waste heat recovery fields because of their environmentally friendly and energy-efficient characteristics [1,2,3]. However, under cold and humid conditions, frost formation easily occurs on the surface of ASHP evaporators, thus severely compromising the operational stability and energy efficiency of the system [4,5]. Frost accumulation not only reduces the effective heat exchange area of the evaporator and increases airflow resistance but also triggers the occurrence of frequent defrosting cycles, resulting in higher energy consumption and system failure rates. Frosting on ASHP evaporators has become one of the key bottlenecks restricting the performance of heat pump systems [6,7].
Previous studies have shown that various factors influence the frosting behavior of evaporators, including the ambient temperature and humidity, the air velocity, and the material and structural parameters of the fins. Methods to delay frosting on ASHP evaporators have been investigated extensively. Gu et al. [8] proposed the construction of a superhydrophobic aluminum surface to actively inhibit frost adhesion, thereby increasing the number of frosting cycles and increasing the operational continuity and efficiency of the heat pump system. This approach achieves the suppression of frost formation by regulating micro/nanostructures and surface energy to promote water droplet rolling. Ye et al. [9] experimentally evaluated the effect of a modified hydrophobic membrane on frost adhesion in finned-tube heat exchangers. The results demonstrated favorable anti-frost performance under natural condensation conditions, which is particularly suitable for intermittent defrosting processes. Wang et al. [10] developed a heater-assisted defrosting system that allows for defrosting without completely interrupting the heating supply, significantly enhancing thermal comfort for users. Jia et al. [11] validated the operating characteristics of a screw-type heat pump system integrated with an air heat absorption defrosting unit, which exhibited high defrosting efficiency and minimal disturbance to the main system. Ye et al. [12] reviewed anti-frost mechanisms in microchannel heat exchangers and proposed noncontact defrosting methods such as vibration or acoustic excitation, including ultrasonic-assisted defrosting technology, which enables efficient defrosting without thermal input. Ma et al. [13] proposed the hot liquid subcooling method, which relies on the use of waste heat from the condenser to defrost multiple outdoor units in parallel, reducing energy consumption while maintaining continuous heating.
In terms of the structural design of ASHP evaporators, the fin spacing has gradually attracted research attention as a key geometric parameter that influences airflow passage and the space available for frost growth. Although a smaller fin spacing can increase the heat transfer area, it also promotes the formation of frost bridges under humid air conditions, which obstruct airflow and rapidly block the heat exchanger channels. Conversely, an excessively large fin spacing may reduce the heat transfer efficiency, leading to reduced thermal performance of the system [14]. Therefore, an in-depth investigation into the mechanisms by which fin spacing affects the frosting process is important for enhancing the frost resistance of ASHPs and increasing the overall operational efficiency of the system.
In recent years, scholars worldwide have extensively researched the optimization of ASHP evaporator fin structures. Zhang et al. [15] designed a novel anti-frost fin configuration and systematically investigated the relationship between frost growth behavior and thermal resistance evolution under varying fin spacing conditions. In their literature review, Ma et al. [16] reported that an evaporator with a fin spacing of 1.4 mm could effectively extend the frosting cycle by 36% compared to that of one with a 2.8-mm spacing, thereby increasing the defrosting energy efficiency. Yu et al. [17] experimentally verified the strong correlation between the fin arrangement and the frost growth rate. Kropas et al. [18] employed dynamic image acquisition technology to track the morphological evolution of frost formation, revealing the intrinsic coupling between the fin spacing and the density of frost structures. In addition, Zhong et al. [19] and Li et al. [20] reported that a proper combination of fin spacing and surface hydrophobic treatment can effectively suppress frost adhesion and improve the frost resistance of heat pump systems.
Over the past decade, numerous researchers have conducted systematic experimental studies of the relationship between the fin spacing and frosting behavior [21,22]. However, experimental approaches are often limited by test conditions, high time and cost requirements, and image resolution constraints, making it difficult to elucidate the initial formation mechanisms and dynamic evolution of frost under different microstructural configurations. With the advancement of computational fluid dynamics (CFD) technology, numerical simulation has become an effective tool for investigating frosting behavior in evaporators, enabling visualization and quantitative analysis of microscale frost deposition, morphological changes, and thermal resistance evolution [6,23]. Popovac et al. [24] developed a frosting model for finned-tube evaporators using the finite volume method and revealed the coupled evolution of thermal and moisture resistance features under different fin spacing configurations. Zhang et al. [25] employed a three-dimensional CFD model to simulate frost migration and accumulation along fin surfaces and demonstrated strong agreement between the simulation results and experimental data. In their review, Lu et al. [26] reported that compared with experiments, numerical simulations offer superior precision and flexibility, especially in coupling phase-change heat transfer, airflow disturbances, and multiphase interfacial dynamics. In addition, recent studies have incorporated parameters such as surface wettability treatment, fin cavity structures, and fin material thermal conductivity into numerical models to achieve higher-level structural optimization of frosting behavior [27].
While previous studies, such as that of Popovac et al. [24] and Zhang et al. [25], have aimed to effectively model frosting thermal resistance and simulate frost migration along fins, most research has focused on macroscopic performance parameters. However, systematic investigations that simultaneously capture the coupled, dynamic evolution of aerodynamics, thermodynamics, and frost morphology under the influence of a key geometric parameter, namely, the fin spacing, are lacking. As such, in this study, the dynamic evolution of frost formation on the cold fin surfaces of evaporators with different fin spacings is systematically investigated. The effects of fin spacing on the frost morphology, growth rate, and heat transfer performance are analyzed to provide theoretical guidance and design references for the structural optimization of ASHP evaporator fins and to promote their efficient and stable operation in complex climatic regions.
2.1 Geometric Model and Assumptions
The fins of the ASHP evaporator are arranged in parallel, thereby forming air channels (interfin gaps) through which airflow occurs, facilitating heat exchange between the fins and the air, as depicted in Fig. 1. This study focuses on the frost formation process on fin surfaces and the underlying mechanisms. The frost formation process exhibits relatively uniform characteristics along the spanwise direction (perpendicular to the airflow) but exhibits inhomogeneous features along the longitudinal direction (airflow direction). Consequently, the spanwise variations can be neglected, allowing the study to concentrate primarily on the frost development characteristics along the longitudinal direction. In this study, a two-dimensional simplification is employed to reduce computational cost while capturing the essential physics along the airflow direction. This approach is justified because the primary focus is on frost development along the fin channel length, where the highest gradients (temperature, concentration, and frost thickness) occur. The spanwise (perpendicular to airflow and the fin plane) variations in frost formation, such as edge effects, are assumed to be secondary for the purpose of investigating the general influence of the fin spacing. This simplification is common in foundational studies of finned heat exchanger frosting [21,28]. Although 3D effects might quantitatively alter local distributions, we expect the qualitative trends and comparative conclusions regarding the impact of fin spacing to be robustly captured by the 2D model.
In this study of fin frosting, the evaporator fin surfaces constitute the cold surfaces. An interfin airflow channel of length l = 50 mm is selected in this work. To ensure that the inlet velocity was sufficiently developed, a 5-mm extension was introduced upstream of the computational domain, as shown in Fig. 1. This length was determined by conducting preliminary tests with different inlet extension lengths (5 and 10 mm), which revealed negligible differences in the velocity and pressure profiles at the entrance of the fin channel. Similar inlet development treatments have been reported in previous studies [21]. In this study, the temperature of the moist air was 285.15 K, the relative humidity was 83%, and the temperature of the cold surface was 263.15 K. The fin spacing was adjusted from 4 to 12 mm. This range is wider than that typically employed in commercial ASHP evaporators (usually 1.5–3 mm). This deliberate choice was made to elucidate the fundamental physical mechanisms governing the frosting process. Larger spacings reduce the rate of channel blockage, allowing for more detailed and prolonged observations of the coupled evolution of the frost layer morphology and the aerodynamic–thermal fields, which is the primary focus of this investigation. Although the absolute values of the performance metrics (such as time to blockage) are spacing dependent, the underlying physics and qualitative trends revealed in this study are foundational and expected to be applicable to narrower, more practical fin spacings, where the same mechanisms would manifest more rapidly and intensely.
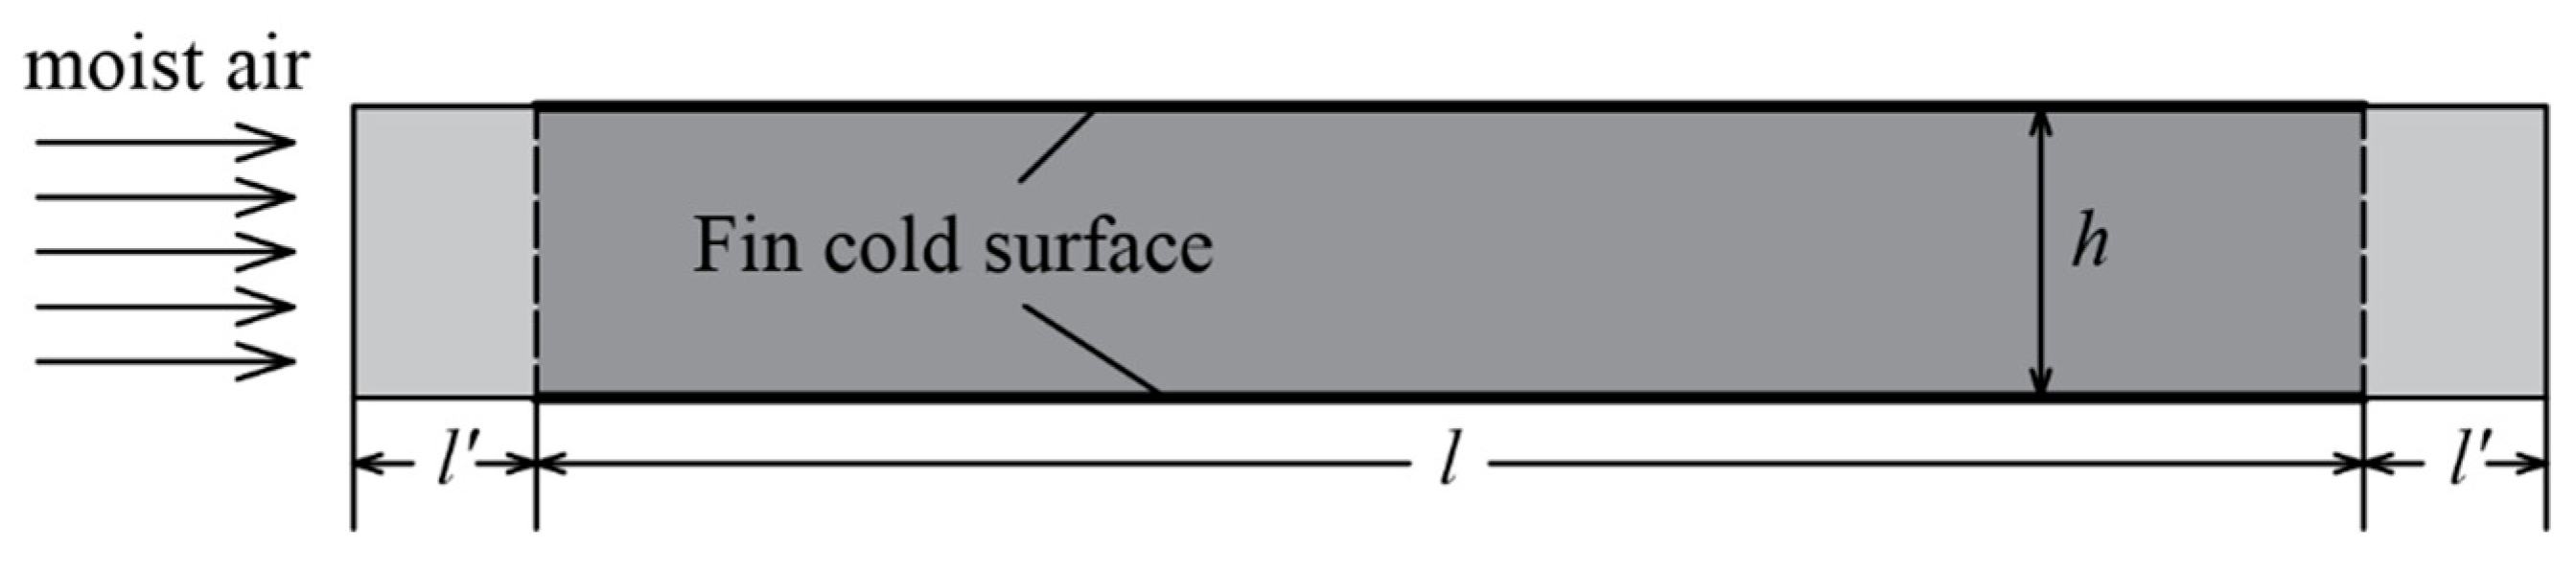
Figure 1: Schematic illustration of the calculation domain for the cold surface of the fin gap.
Frost formation on cold surfaces entails a phase transition process involving flow, heat transfer, and mass transfer. During the frost formation process on finned cold surfaces, water vapor in moist air condenses into frost when it encounters cold surfaces, after which it transforms from a gaseous state to a solid state. Within the computational domain, the following two phases exist: moist air and ice. The entire process can be described using a gas-solid two-phase flow model, where moist air and ice are the primary and secondary phases, respectively. The two-phase flow model includes equations for volume fraction conservation, mass conservation, energy conservation, momentum conservation, and water vapor component transport [21,29].
- (i)Volume fraction conservation:
- (ii)Mass conservation of the ice phase:
- (iii)Mass conservation of moist air:
- (iv)Momentum conservation of the ice phase:
- (v)Momentum conservation of moist air:
- (vi)Energy conservation if the ice phase:
- (vii)Energy conservation if moist air:
- (viii)Water vapor component transport:
The interaction between the moist air and the ice phase, including momentum transfer, energy transfer, and mass transfer between the two phases, is represented by source phases in the governing equations. The mass source phases of moist air and ice phases are expressed in Eq. (9), and the mass source phase of moist air is expressed in Eq. (10).
For the ice phase volume fraction conservation equation, the source phase is the ratio of the mass rate increase of the ice phase to the density of the ice phase, as expressed in Eq. (11).
The source term of the momentum equation for moist air and ice can be expressed as follows:
The energy equation sources for moist air and ice phases can be expressed as follows:
An analysis of the source terms in the governing equations reveals that the mass transfer rate
The dynamic coupling between frost growth and aerodynamic changes is inherently captured by the model through the following mechanism: the mass transfer source term (Eq. (16)) captures the local frost deposition rate, which can be used to update the volume fraction of the ice phase in each computational cell at every time step. This update alters the local geometry of the flow domain by effectively reducing the volume available for the air phase. The flow and pressure fields are then recomputed by solving the momentum and continuity equations over this updated geometry in the subsequent time step. This process creates the following fully coupled feedback loop: frost growth changes the geometry, altering the flow field, which in turn affects the subsequent heat and mass transfer rates governing frost growth. This approach self-consistently simulates the increasing pressure drop and evolving airflow distribution without the need for external assumptions or prescriptions.
2.3 Meshing and Boundary Conditions
The computational domain relied on a velocity inlet boundary condition at the entrance and a pressure outlet boundary condition at the exit. The cold surface boundary condition was defined as a constant wall temperature. A structured rectangular mesh was applied to discretize the computational domain, with mesh refinement implemented near the wall surfaces. The frost formation process on the cold surface was simulated under identical operating conditions while varying the mesh scales dx and dy. A mesh independence study was performed, and the results are shown in Fig. 2. When the dx scale was reduced below 0.1 mm and the value of dy was below 0.05 mm (with a grid number of 4.8 × 10⁴), both the frost mass accumulation and the average frost layer density did not significantly vary with further mesh refinement. Consequently, dx = 0.1 mm and dy = 0.05 mm were adopted for the subsequent study.
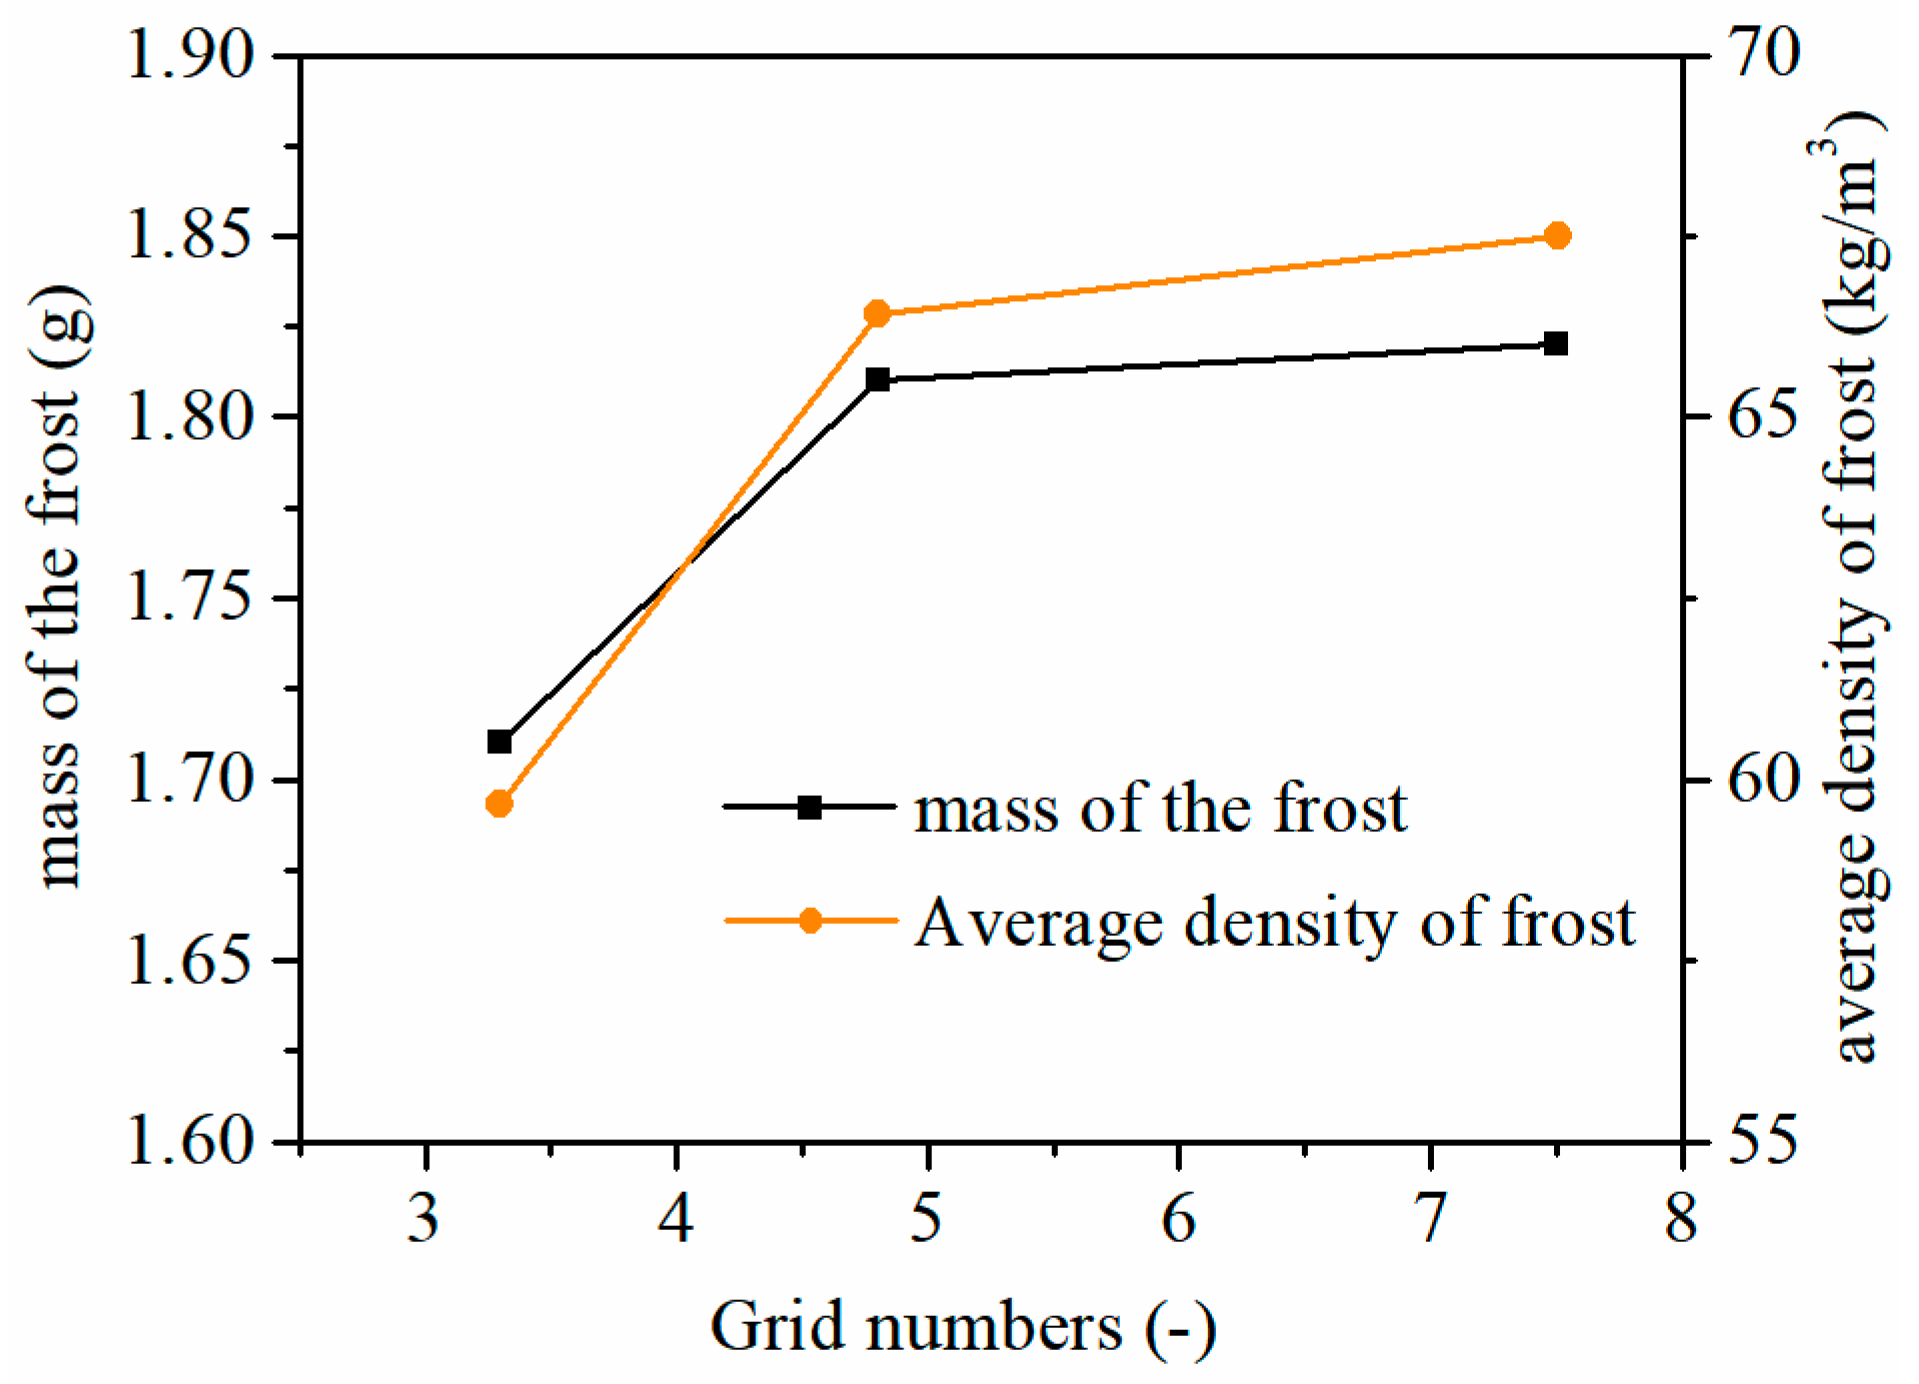
Figure 2: Verification of grid independence.
2.4 Calculation Method and Validation
The numerical simulations in this study were performed using the ANSYS Fluent platform (Release 2021 R1). User-defined functions (UDFs) were developed to incorporate source terms into the governing equations and model the interactions between moist air and the ice phase, including momentum exchange, energy exchange, and mass exchange. The coupling of pressure and velocity was resolved via the Semi-Implicit Method for Pressure Linked Equations (SIMPLE) algorithm. The QUICK scheme was employed to discretize the governing equations for the volume fraction, water vapor mass fraction, momentum, and energy. Computational verification demonstrated that a time step of 0.1 s satisfies the requirement for time step independence.
On the basis of the numerical model established in this work, the experimental process described in Ref. [21] was simulated. Validation was performed under matching conditions. The air temperature was 285.15 K, the relative humidity was 83%, the air velocity was 1.0 m/s, and the cold surface temperature was 263.15 K, with a fin spacing of 8 mm. The validity of the established model was confirmed by comparing the experimental and simulation results. As shown in Fig. 3, the comparison between the computational and experimental results indicates that the maximum deviation of the present model is less than 5%. Therefore, the model can be used reliably for subsequent computational investigations.
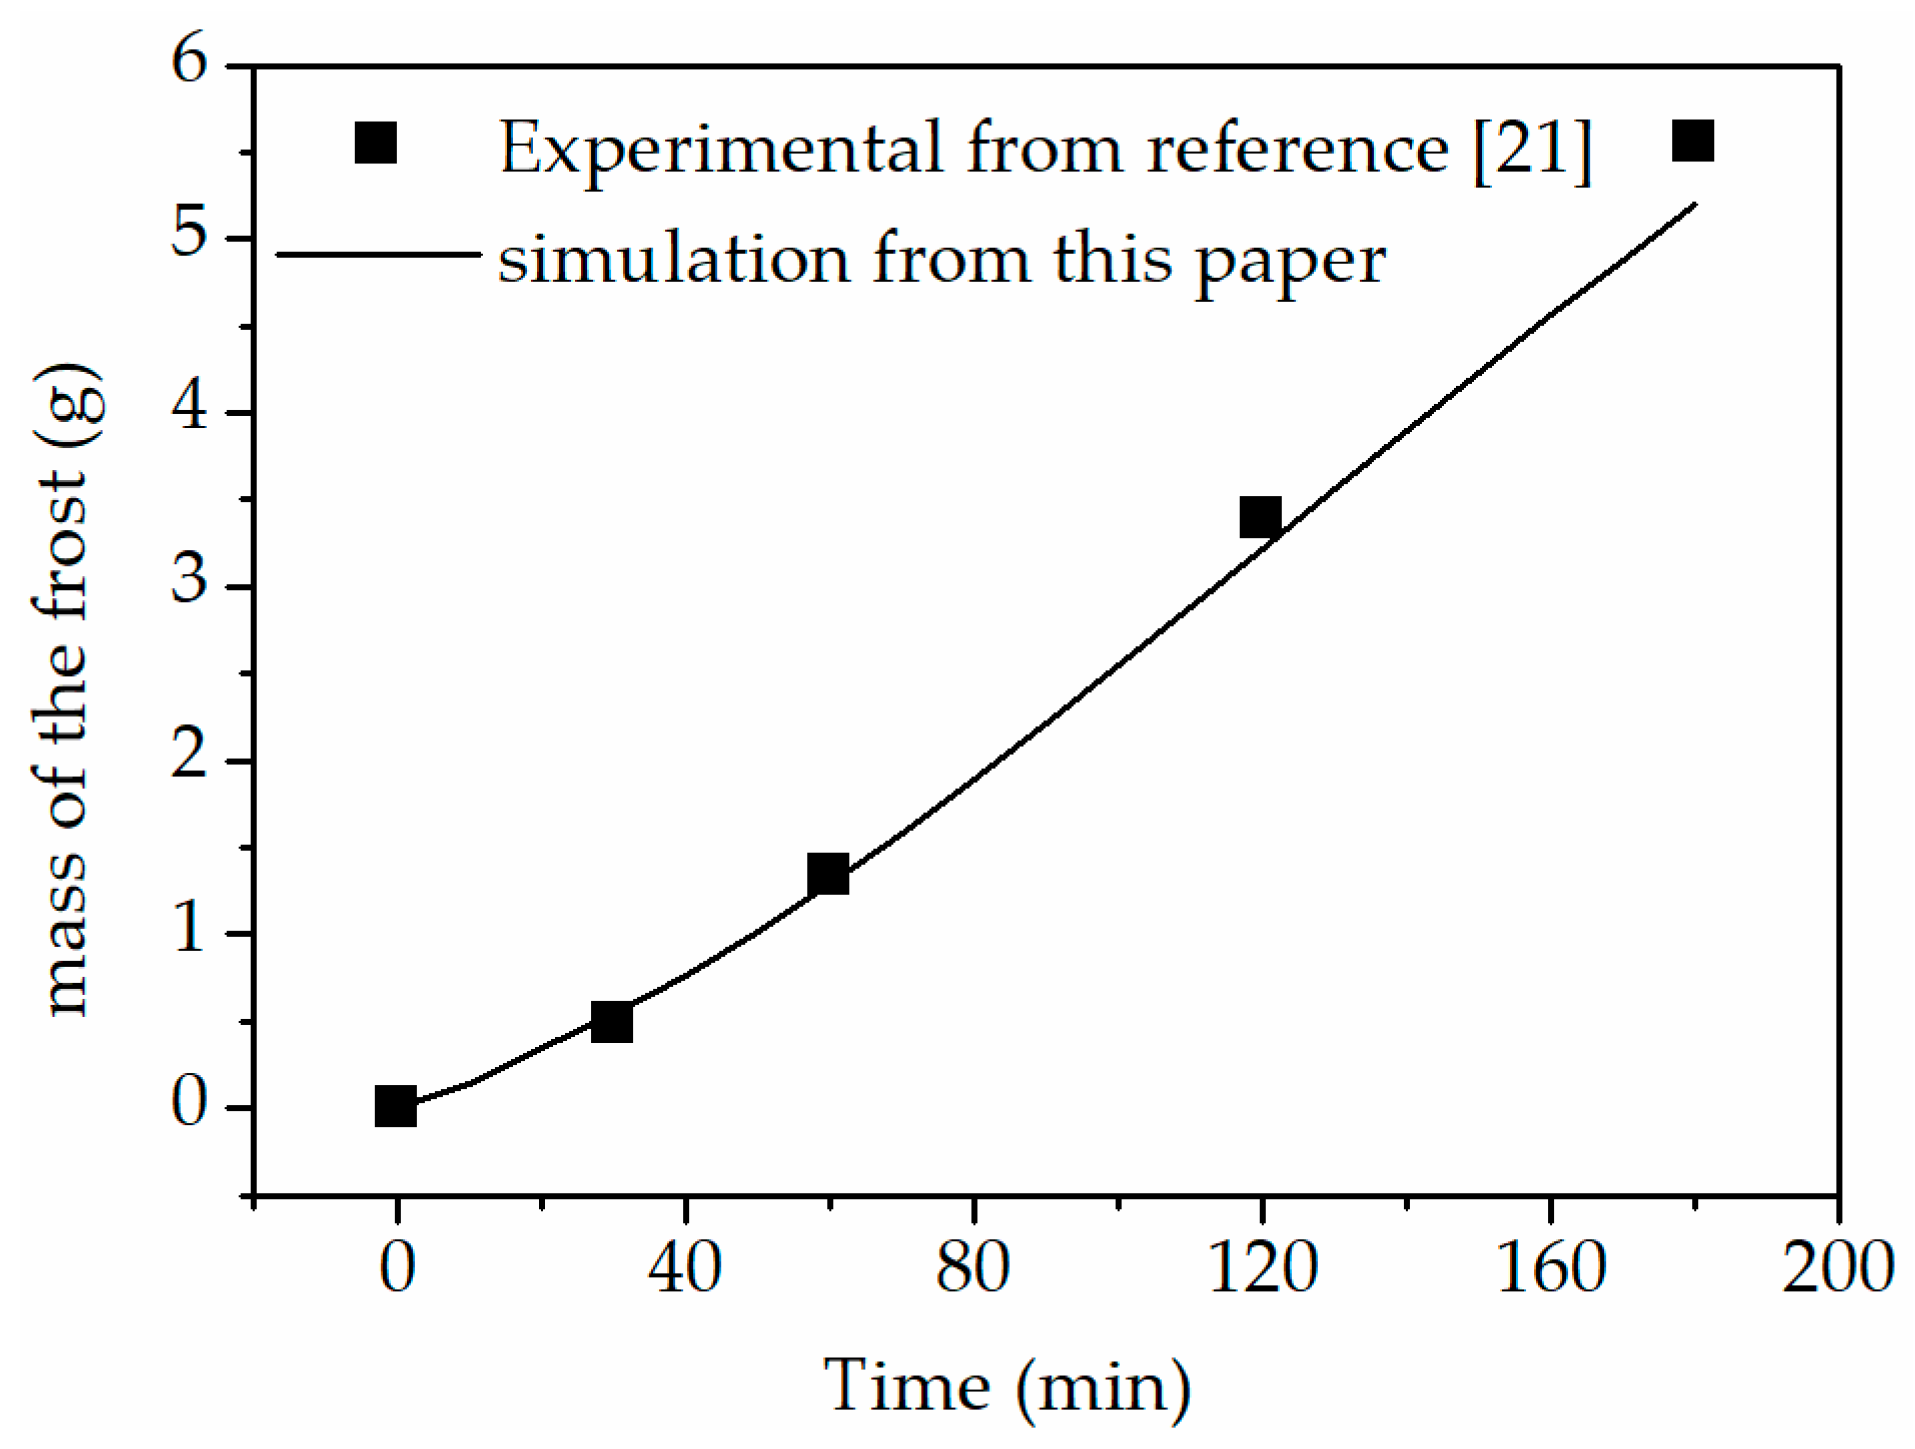
Figure 3: Comparison between simulated and experimental data.
3.1 Variation in the Ice Phase Volume Fraction with Time
The typical evolution of the ice volume fraction over time for a fin spacing of 8 mm is shown in Fig. 4. The frost formation process on the cold fin surface is manifested as a dual evolution process involving the simultaneous growth of both the frost layer thickness and density. At the early stage, the cold surface temperature is significantly lower than the freezing point of the condensate, leading to the rapid deposition of water vapor as ice crystals and a relatively high frost formation rate. During this phase, the increase in the ice volume fraction primarily reflects a rapid increase in the frost layer thickness. The frost structure is relatively loose and has a low density, indicating that the frost layer occurs in the initial growth phase dominated by a dendritic structure.
At the later stage, as time progresses, the frost layer gradually thickens. The increased thermal resistance at the frost surface reduces the heat transfer rate. Consequently, water vapor partially condenses within the interstices of the upper ice crystals before it reaches the cold surface, resulting in the formation of a denser structure. In this stage, growth in the ice volume fraction stems mainly from an increase in the ice density per unit volume, indicating that the ice crystals progressively fill the existing pores. The frost structure becomes more compact, indicating the transition of the frost formation process into the compaction growth phase.
From a spatial perspective, the frost layer thickness gradually increases along the airflow direction and thickens from the leading edge of the fin toward the trailing edge. At the end of the flow channel, the frost layer reaches its maximum thickness. This simulated nonuniform growth pattern, characterized by thicker frost at the channel rear, is consistent with experimental observations reported in the literature. For instance, Kropas et al. [18] employed dynamic image acquisition to directly visualize the frosting process and confirmed the pronounced spatial heterogeneity of frost layer formation along the airflow direction. This finding can be attributed to the combined effects of a lower airflow velocity, longer residence time, and higher water vapor concentration in this region. Notably, the distribution of frost is highly sensitive to the operating conditions. Although an increasing thickness trend is observed here, studies under colder and drier conditions have reported a decreasing trend because of the rapid depletion of moisture upstream [30,31]. The prevailing trend is determined by the dominant mechanism: mass transfer limitation under cold–dry conditions versus thermal and residence time effects under warm-humid conditions. Furthermore, the distribution of the ice volume fraction is nonuniform across different areas of the cold surface, revealing a significant modulating effect of the fin structure on local heat and mass transfer processes.
In summary, frost formation between fins is not only governed by temporal factors but also governed by the coupled effects of fin structural parameters and flow conditions. The frost formation process exhibits distinct spatial heterogeneity and stage-specific characteristics.
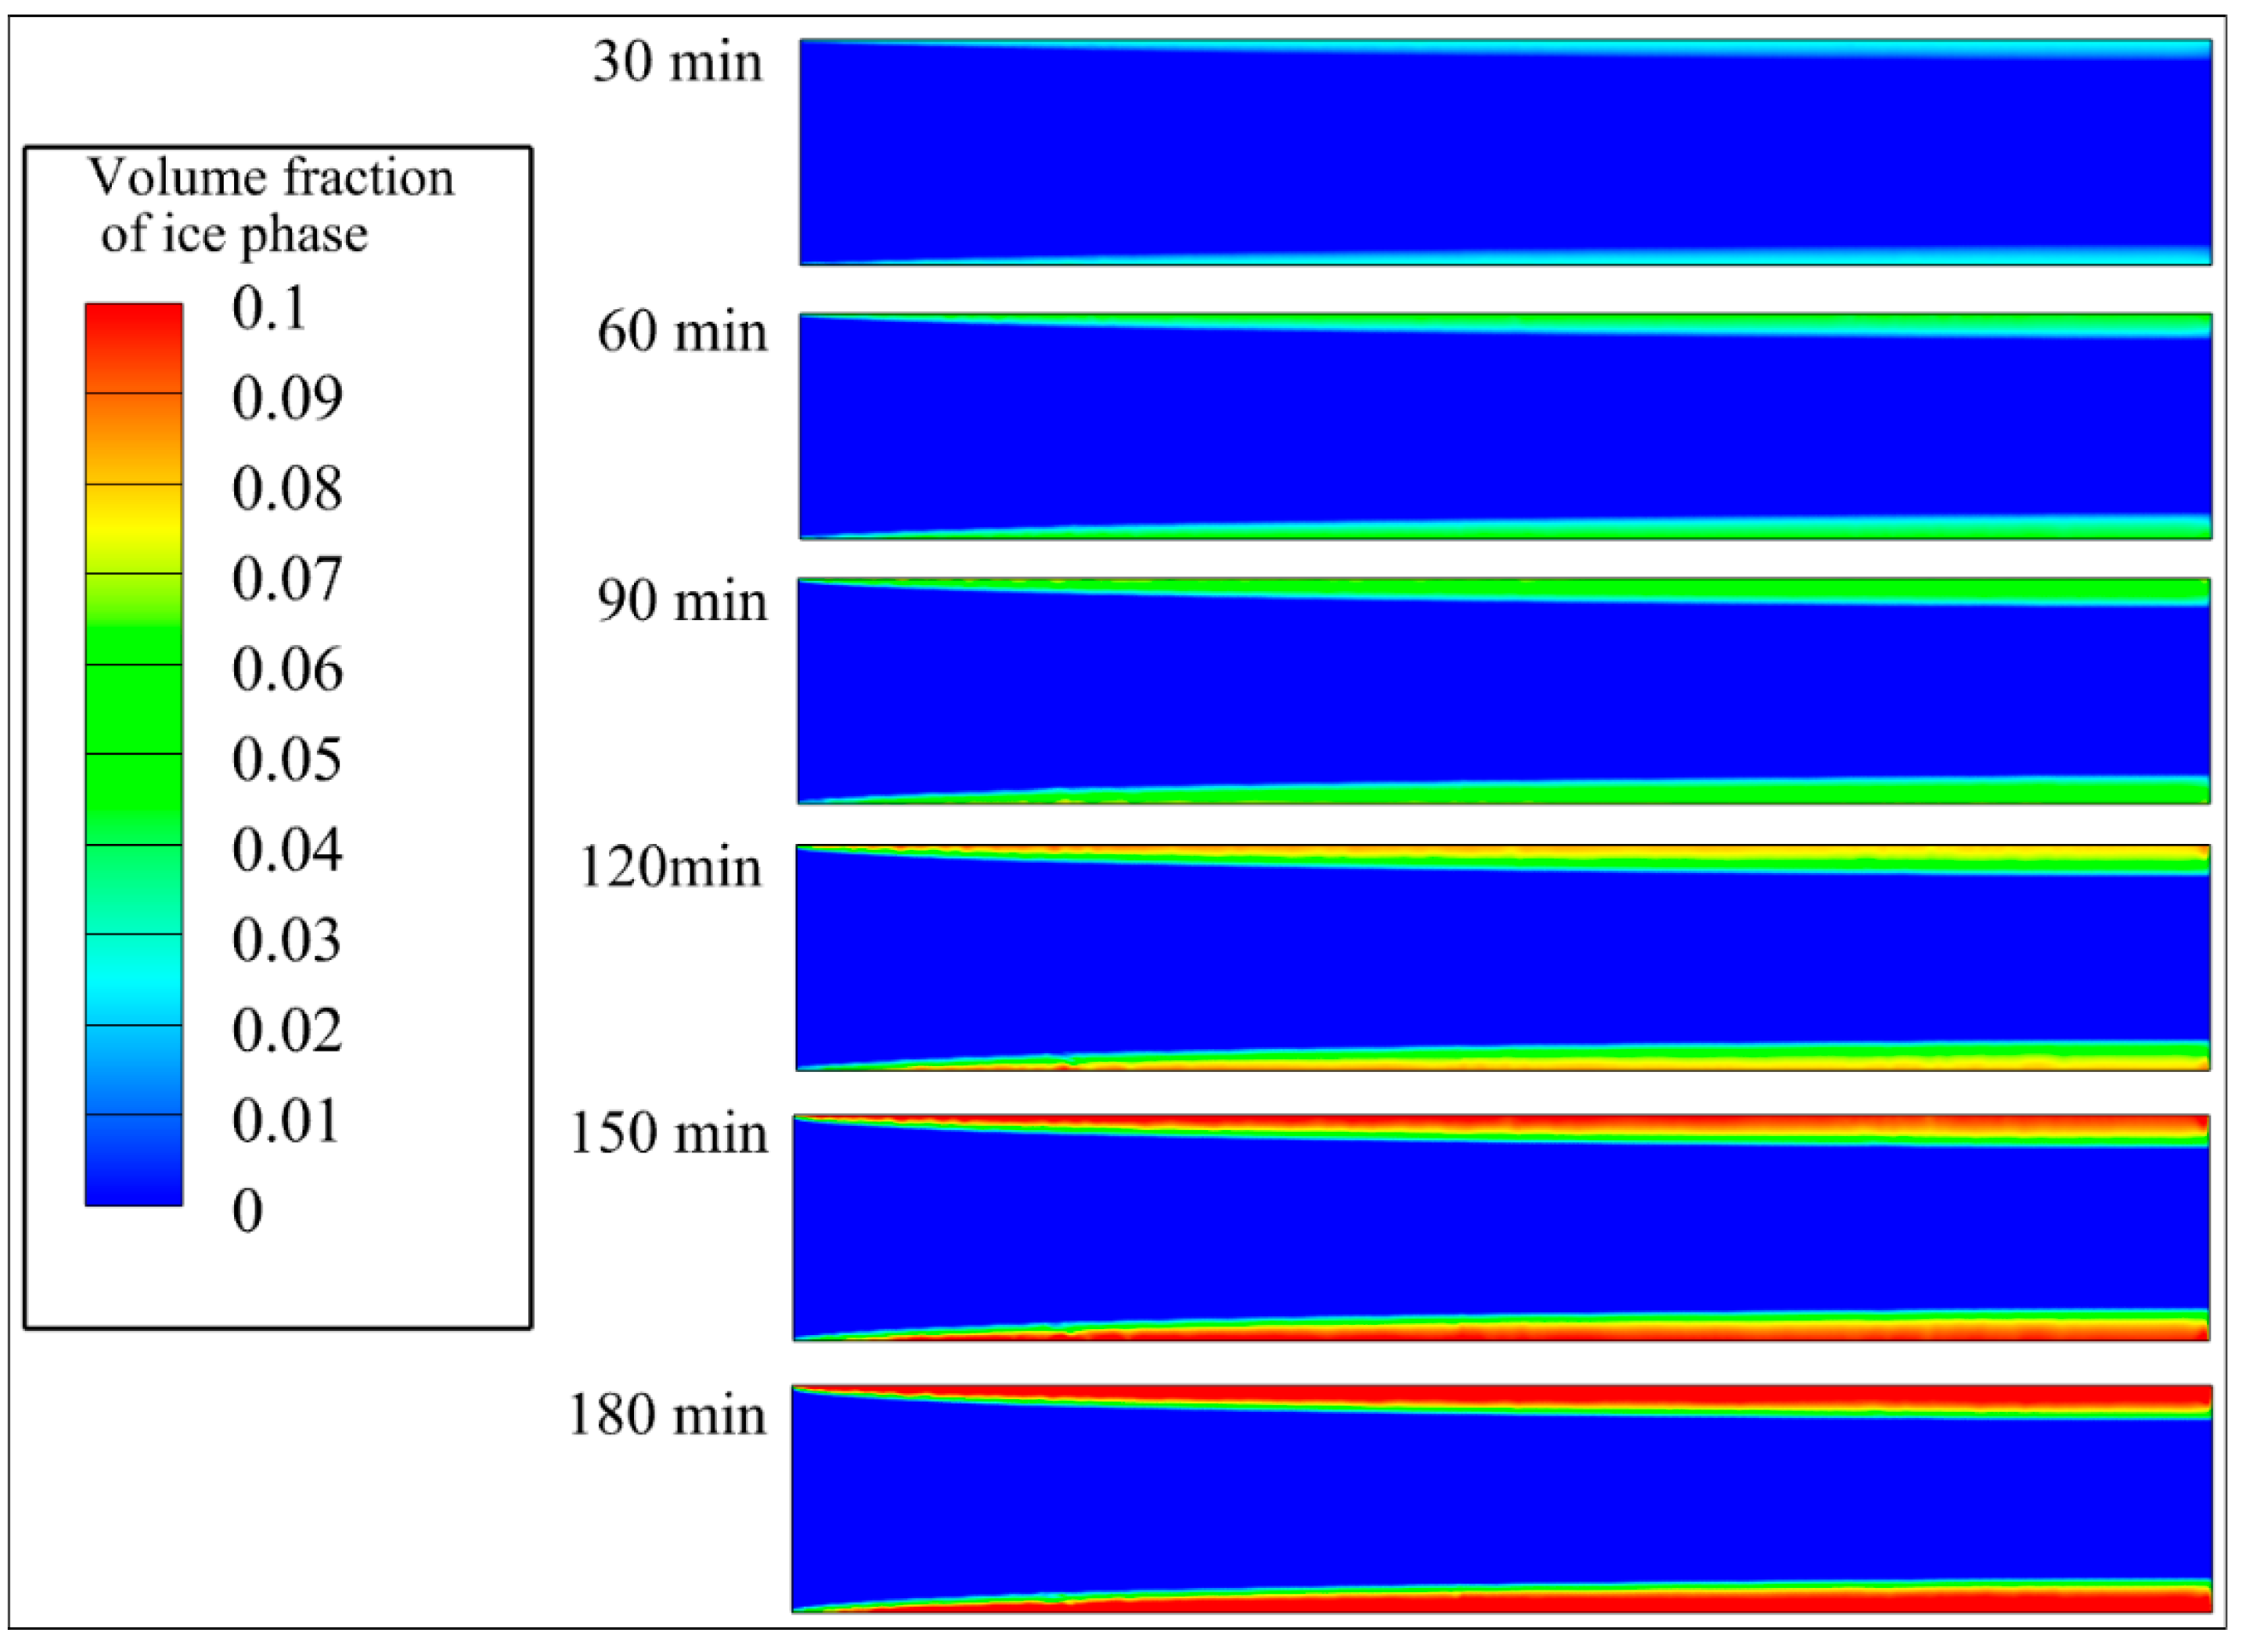
Figure 4: Volume fraction distribution of the ice phase with time (d = 8 mm).
3.2 Evolution of the Aerodynamic Fields
The contour plots in Fig. 5 illustrate the evolution of the air velocity within the fin structure over time. A comparison of this figure with the distribution of the ice volume fraction clearly reveals that the growth of the frost layer significantly affects the airflow characteristics.
At the early stage, the channels between fins are unobstructed. Airflow, which is governed primarily by the fin structure and inlet conditions, is relatively uniformly distributed. However, the frost layer gradually accumulates on the cold fin surfaces with the progression of frost formation, thereby substantially altering the geometric characteristics of the channels. The growth of the frost layer progressively reduces the effective flow cross-sectional area between fins. Local constriction of the flow channels occurs, leading to a significant local increase in airflow velocity, particularly in regions with thicker frost layers. This phenomenon is especially notable toward the rear end of the flow channel, where the air velocity is considerably higher than that in the front region. This nonuniform velocity primarily stems from asymmetric channel constriction caused by the progressive thickening of the frost layer along the airflow direction. This constriction induces a contraction nozzle effect near the channel end, accelerating the flow.
Notably, a distinct feedback coupling exists between the airflow velocity and frost layer growth. Frost growth constricts the channel space, increasing the local airflow velocity. In contrast, as the local velocity increases, the enhanced kinetic energy results in a reduced residence time of moisture-laden air; this reduced heat and mass transfer effect subsequently inhibits the further rapid growth of the frost layer. This process highlights the bidirectional coupling between aerodynamics and ice phase-change behavior, which represents a key physical mechanism driving the transition of frost formation from the rapid growth phase to the slow compaction phase. Furthermore, in regions with high local velocity gradients, such as the mid-to-rear sections of the fin channels, enhanced turbulence or the development of secondary vortex structures may occur. These flow features can influence ice crystal deposition patterns and the evolution of the frost microstructure. Therefore, accurately characterizing the evolution of the flow field is crucial not only for elucidating frost formation mechanisms but also for providing a theoretical foundation for frost control strategies and the design of frost-resistant heat exchangers.
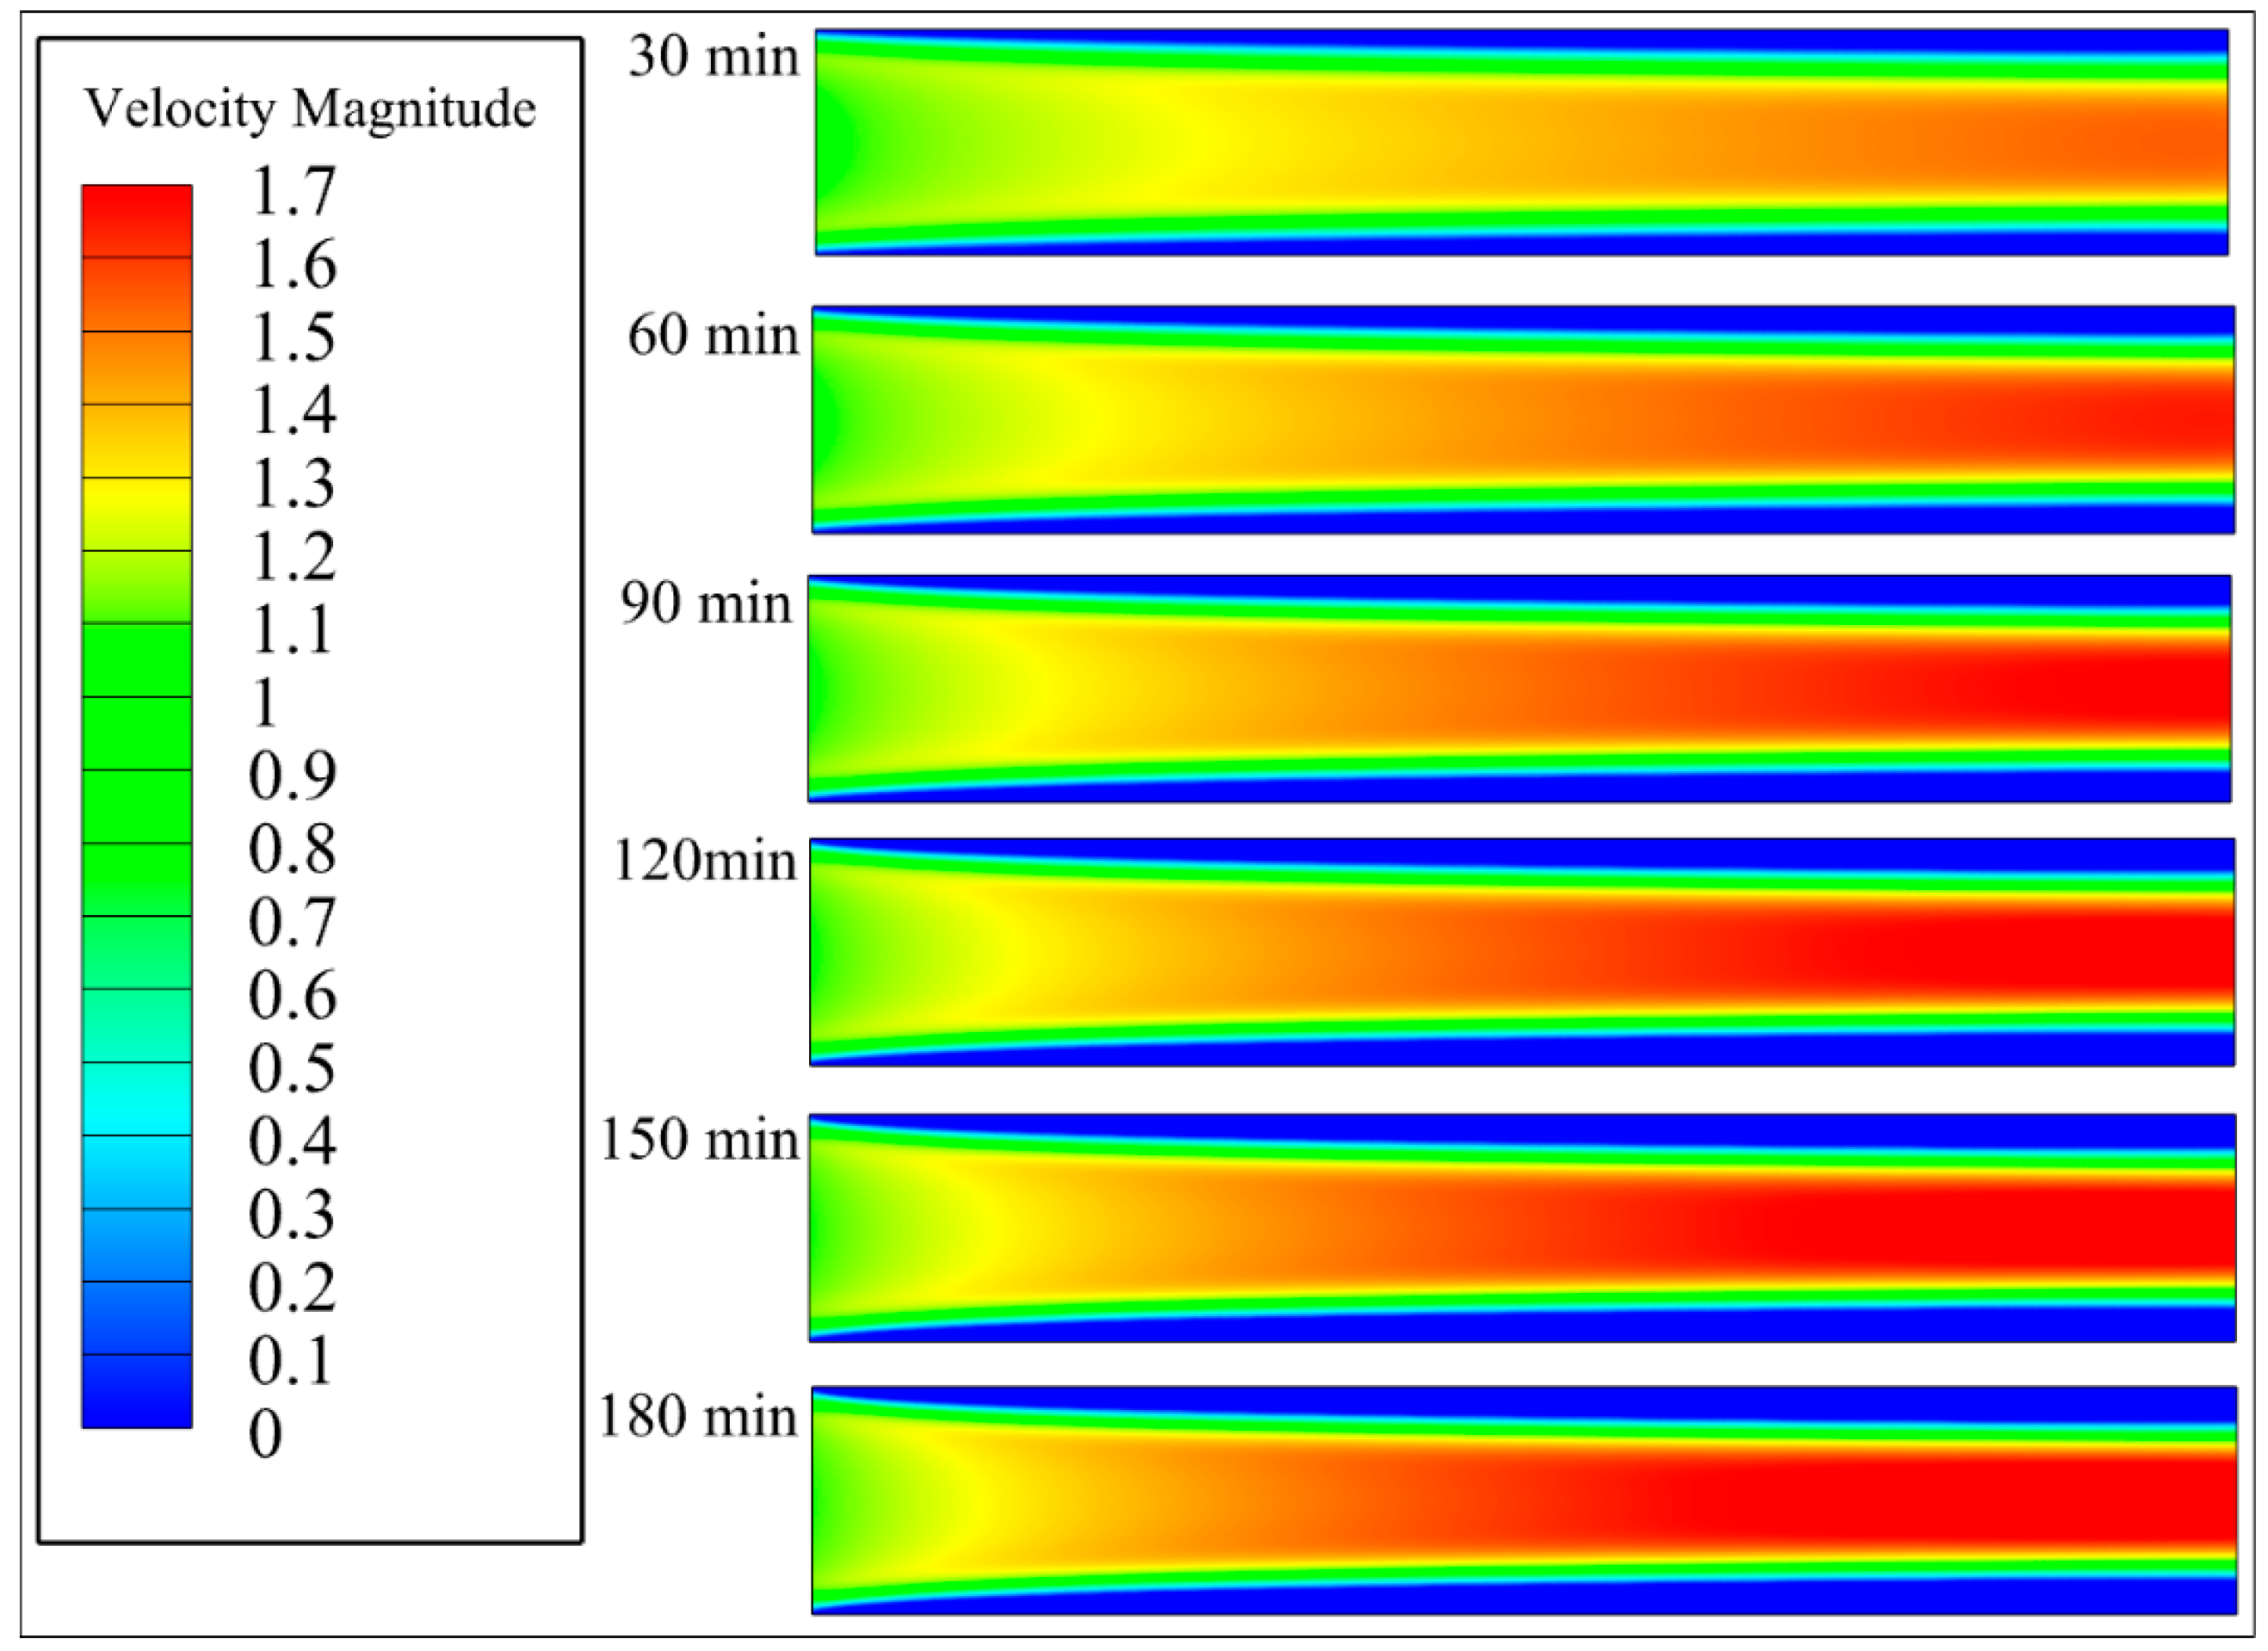
Figure 5: Velocity magnitude distribution with time (d = 8 mm, m/s).
The pressure contours during the frost formation process are shown in Fig. 6. Notably, frost growth significantly influences the pressure field distribution within the fin channels, primarily manifested as a progressive increase in the pressure drop along the airflow direction. At the early stage, the channels between fins exhibit a regular structure with low flow resistance. Consequently, the airflow exhibits a relatively smooth pressure drop distribution along the channels. However, as the frost layer continuously grows and gradually covers the fin surfaces, the channel geometry is altered. Particularly in regions experiencing advanced frost formation later in the process, the local cross-sectional area drastically decreases, leading to a sharp increase in flow resistance.
Analysis of the contours indicates that a distinct zone of high-pressure gradient forms in the rear section of the channel. This signifies that the airflow encounters significantly increased resistance as it passes through the progressively constricting frost layer. This phenomenon corroborates the flow obstruction effect induced by frost layer growth, namely, that the frost layer reduces the effective flow area, causing a local increase in airflow velocity and consequent changes in dynamic pressure. In regions with thick frost layers, the airflow is forced to increase, resulting in a pressure drop characteristic of a throttling effect.
Notably, a coupling relationship exists between the pressure distribution and the ice volume fraction. The constriction of flow channels due to frost thickening directly increases the pressure drop. In contrast, localized high-pressure zones may in turn modulate the phase-change conditions in the frost region by influencing the local airflow temperature and velocity distribution. For instance, in regions with sharp pressure drops, the airflow temperature might slightly increase, thereby inhibiting rapid frost growth in that area and contributing to the spatial heterogeneity in the frost structure.
Overall, the pressure contours demonstrate the significant decrease in the aerodynamic performance caused by frost accumulation. These findings indicate that frost formation not only affects heat transfer efficiency but also poses potential threats to system operational safety and stability. Therefore, conducting an in-depth analysis of the dynamic evolution of pressure distribution holds significant engineering implications for understanding frost layer development mechanisms, establishing multifield coupled prediction models, and developing effective defrosting strategies.
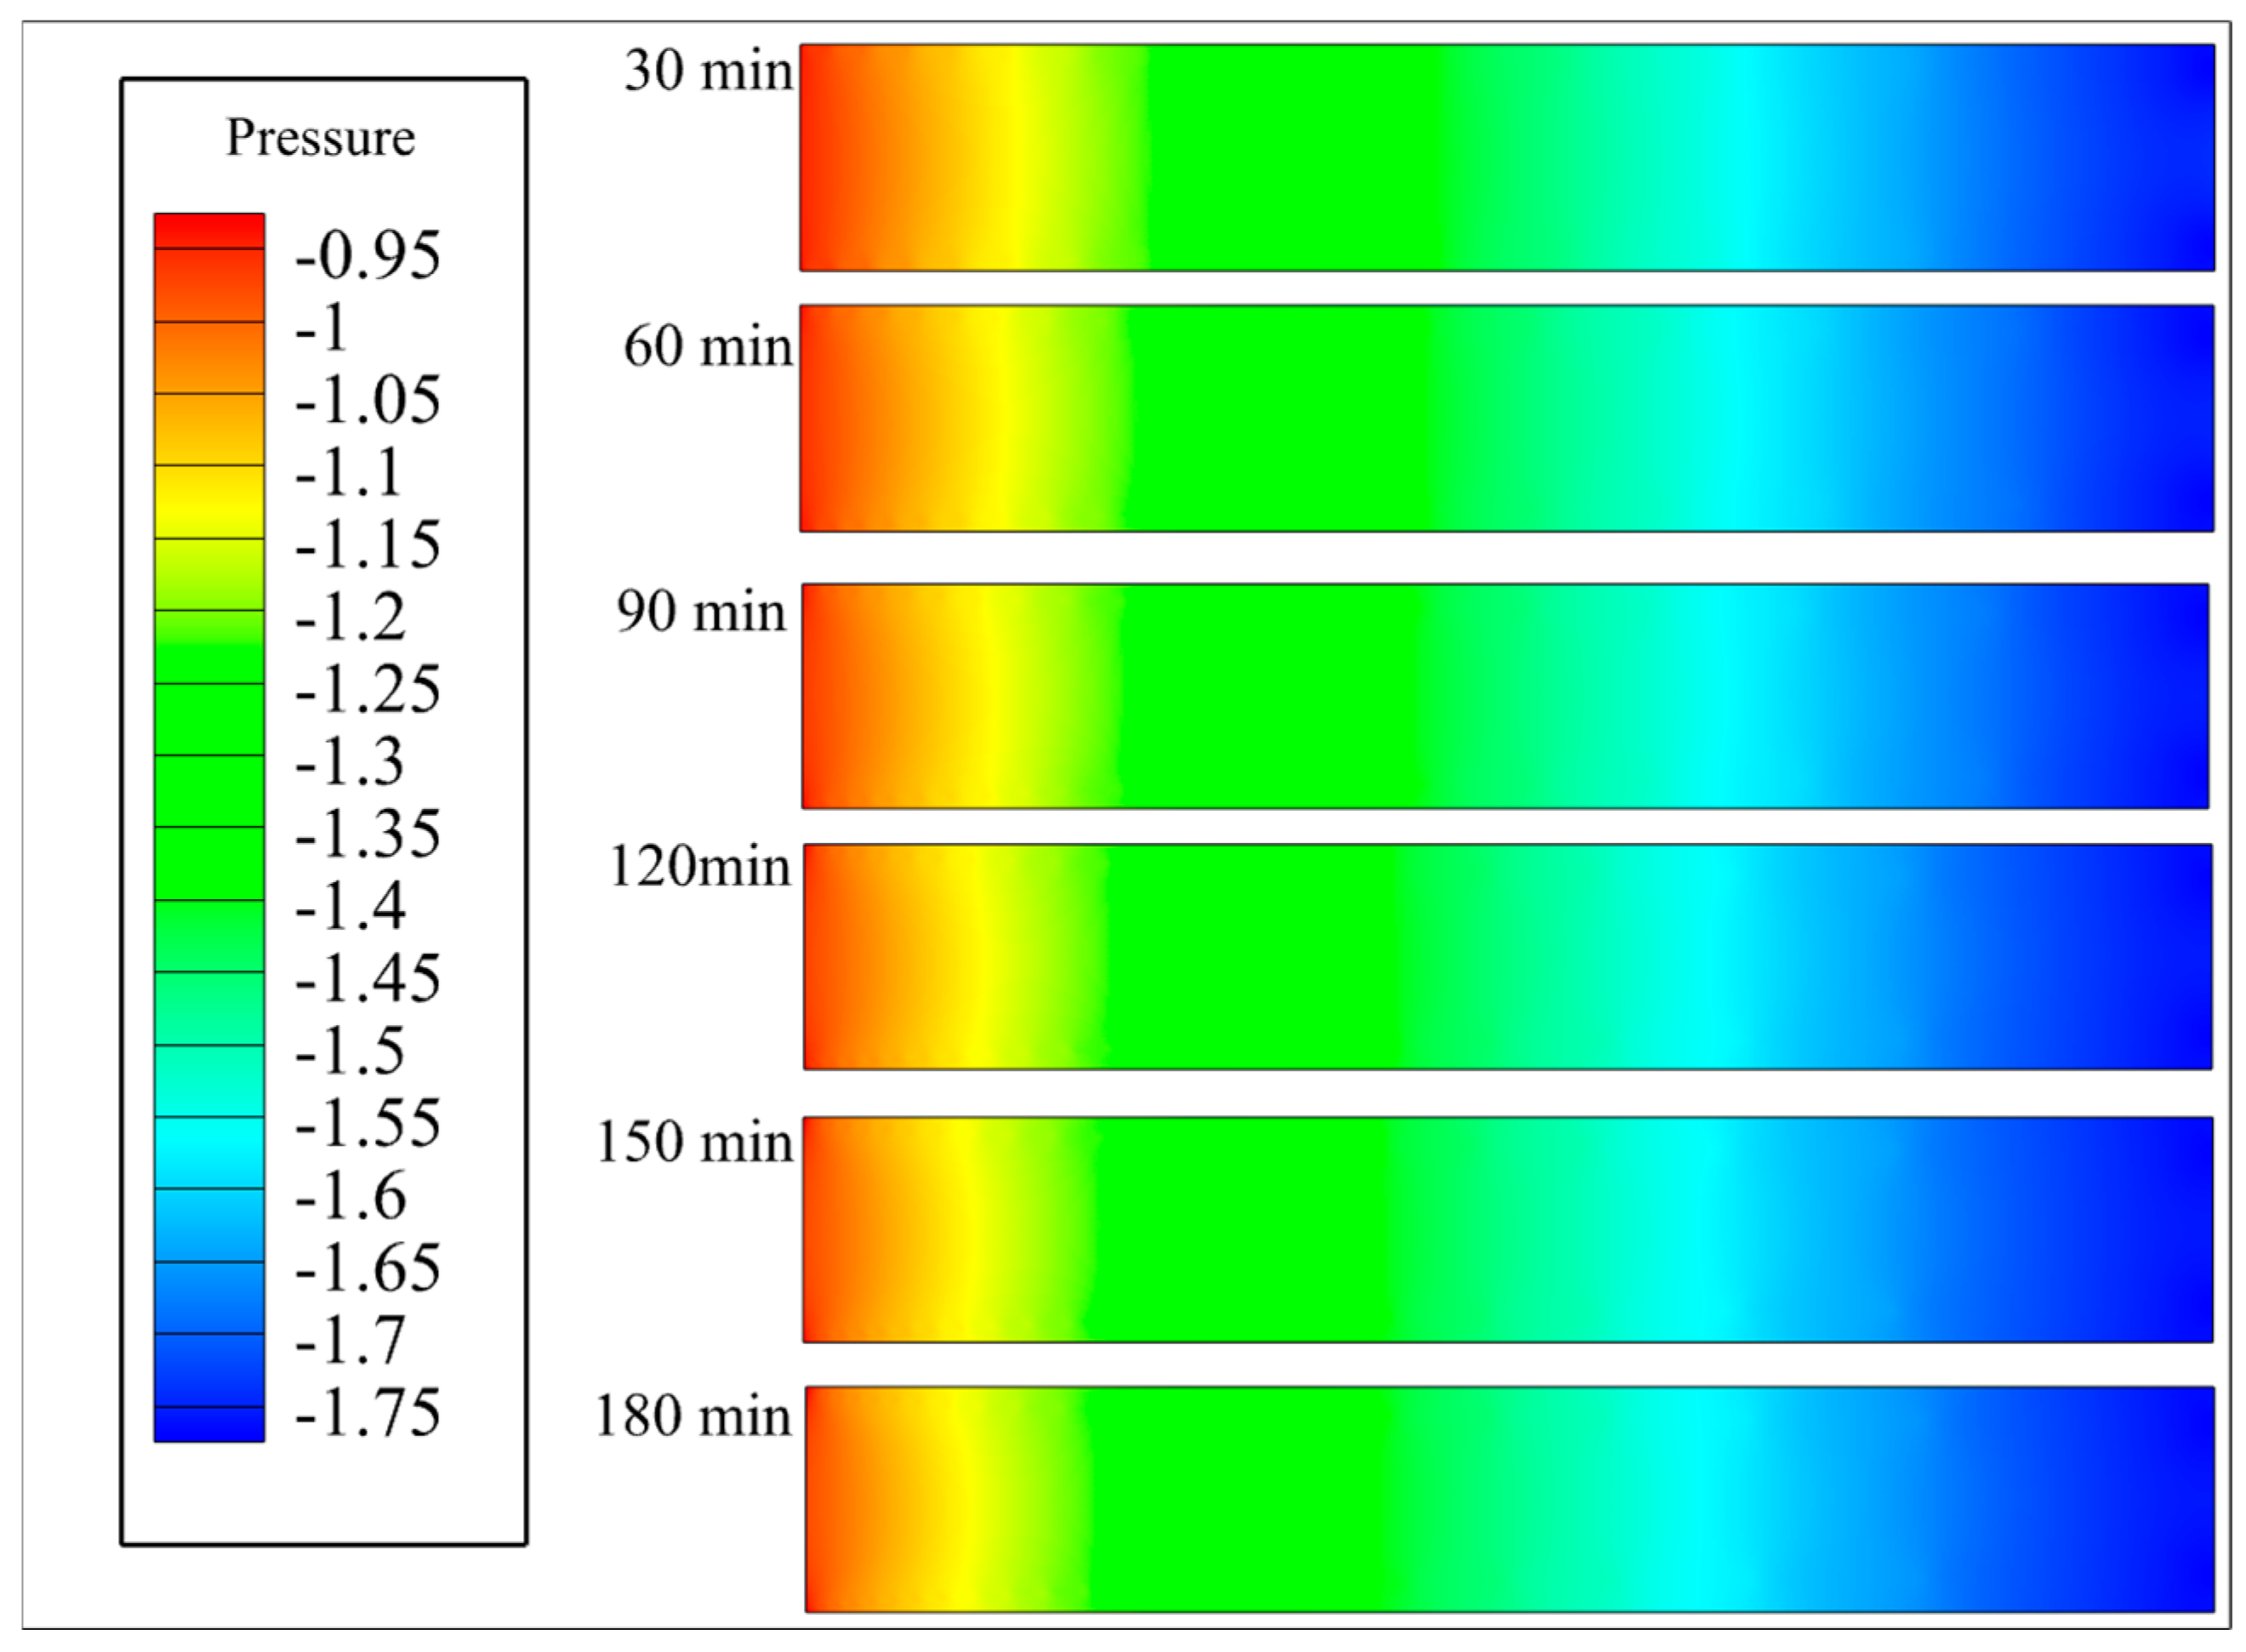
Figure 6: Pressure distribution with time (d = 8 mm, Pa).
3.3 Evolution of Temperature Fields
The temperature contours during the frost formation process are shown in Fig. 7. Notably, frost growth significantly alters the distribution structure of the temperature field within the interfin channels. This phenomenon is characterized primarily by a gradual expansion of the low-temperature region, with the high-temperature zone concentrated near the channel inlet. Concurrently, the temperature progressively decreases along the mid-to-rear sections of the channel, resulting in a pronounced increase in the temperature gradient.
At the early frost formation stage, a significant thermal resistance layer will not yet be formed on the fin surfaces. Consequently, the heat exchange efficiency between the air and fins is relatively high, resulting in a relatively uniform temperature distribution on the cold surfaces. However, as the frost layer gradually accumulates on the fin surfaces, its inherently low thermal conductivity increases the effective thermal conduction path length between the actual heat exchange surface and the airflow. This leads to a progressive decrease in the heat transfer efficiency. In the temperature contours, this process is manifested as an expansion of the cold region and the development of localized lower-temperature zones. This effect is particularly pronounced in the rear sections of the channels where the frost layer is thicker, leading to more intensely localized low-temperature zones. Furthermore, the presence of the frost layer alters the spatial distribution of the cold surface temperature, concentrating the temperature gradient more intensely near the frost layer boundaries. This indicates an increase in heat flux concentration and a limitation on the transfer intensity of local heat. Additionally, frost growth impedes the remixing of air near the wall, increasing the boundary layer thickness and further suppressing the turbulence-enhanced heat transfer effect.
Notably, a coupling relationship exists between the airflow velocity and the temperature field. In regions with higher airflow velocities, the relatively larger heat transfer coefficient results in slightly higher local temperatures. Conversely, in regions with reduced flow velocity or flow recirculation, heat transfer is impeded, leading to significantly lower temperatures. This flow‒thermal coupling effect further influences the local frost growth rate and density distribution.
In summary, the evolution of the temperature field reflects not only the increasing thermal resistance during frost formation but also the long-term degradation trend of the effect of the frost layer structure on the thermal management performance of the fin. In practical applications, understanding the variation patterns of the temperature field is critical for predicting frost development trends, optimizing the frost-resistant structural design of heat exchangers, and establishing coupled thermal-flow-phase-change multiphysics models.
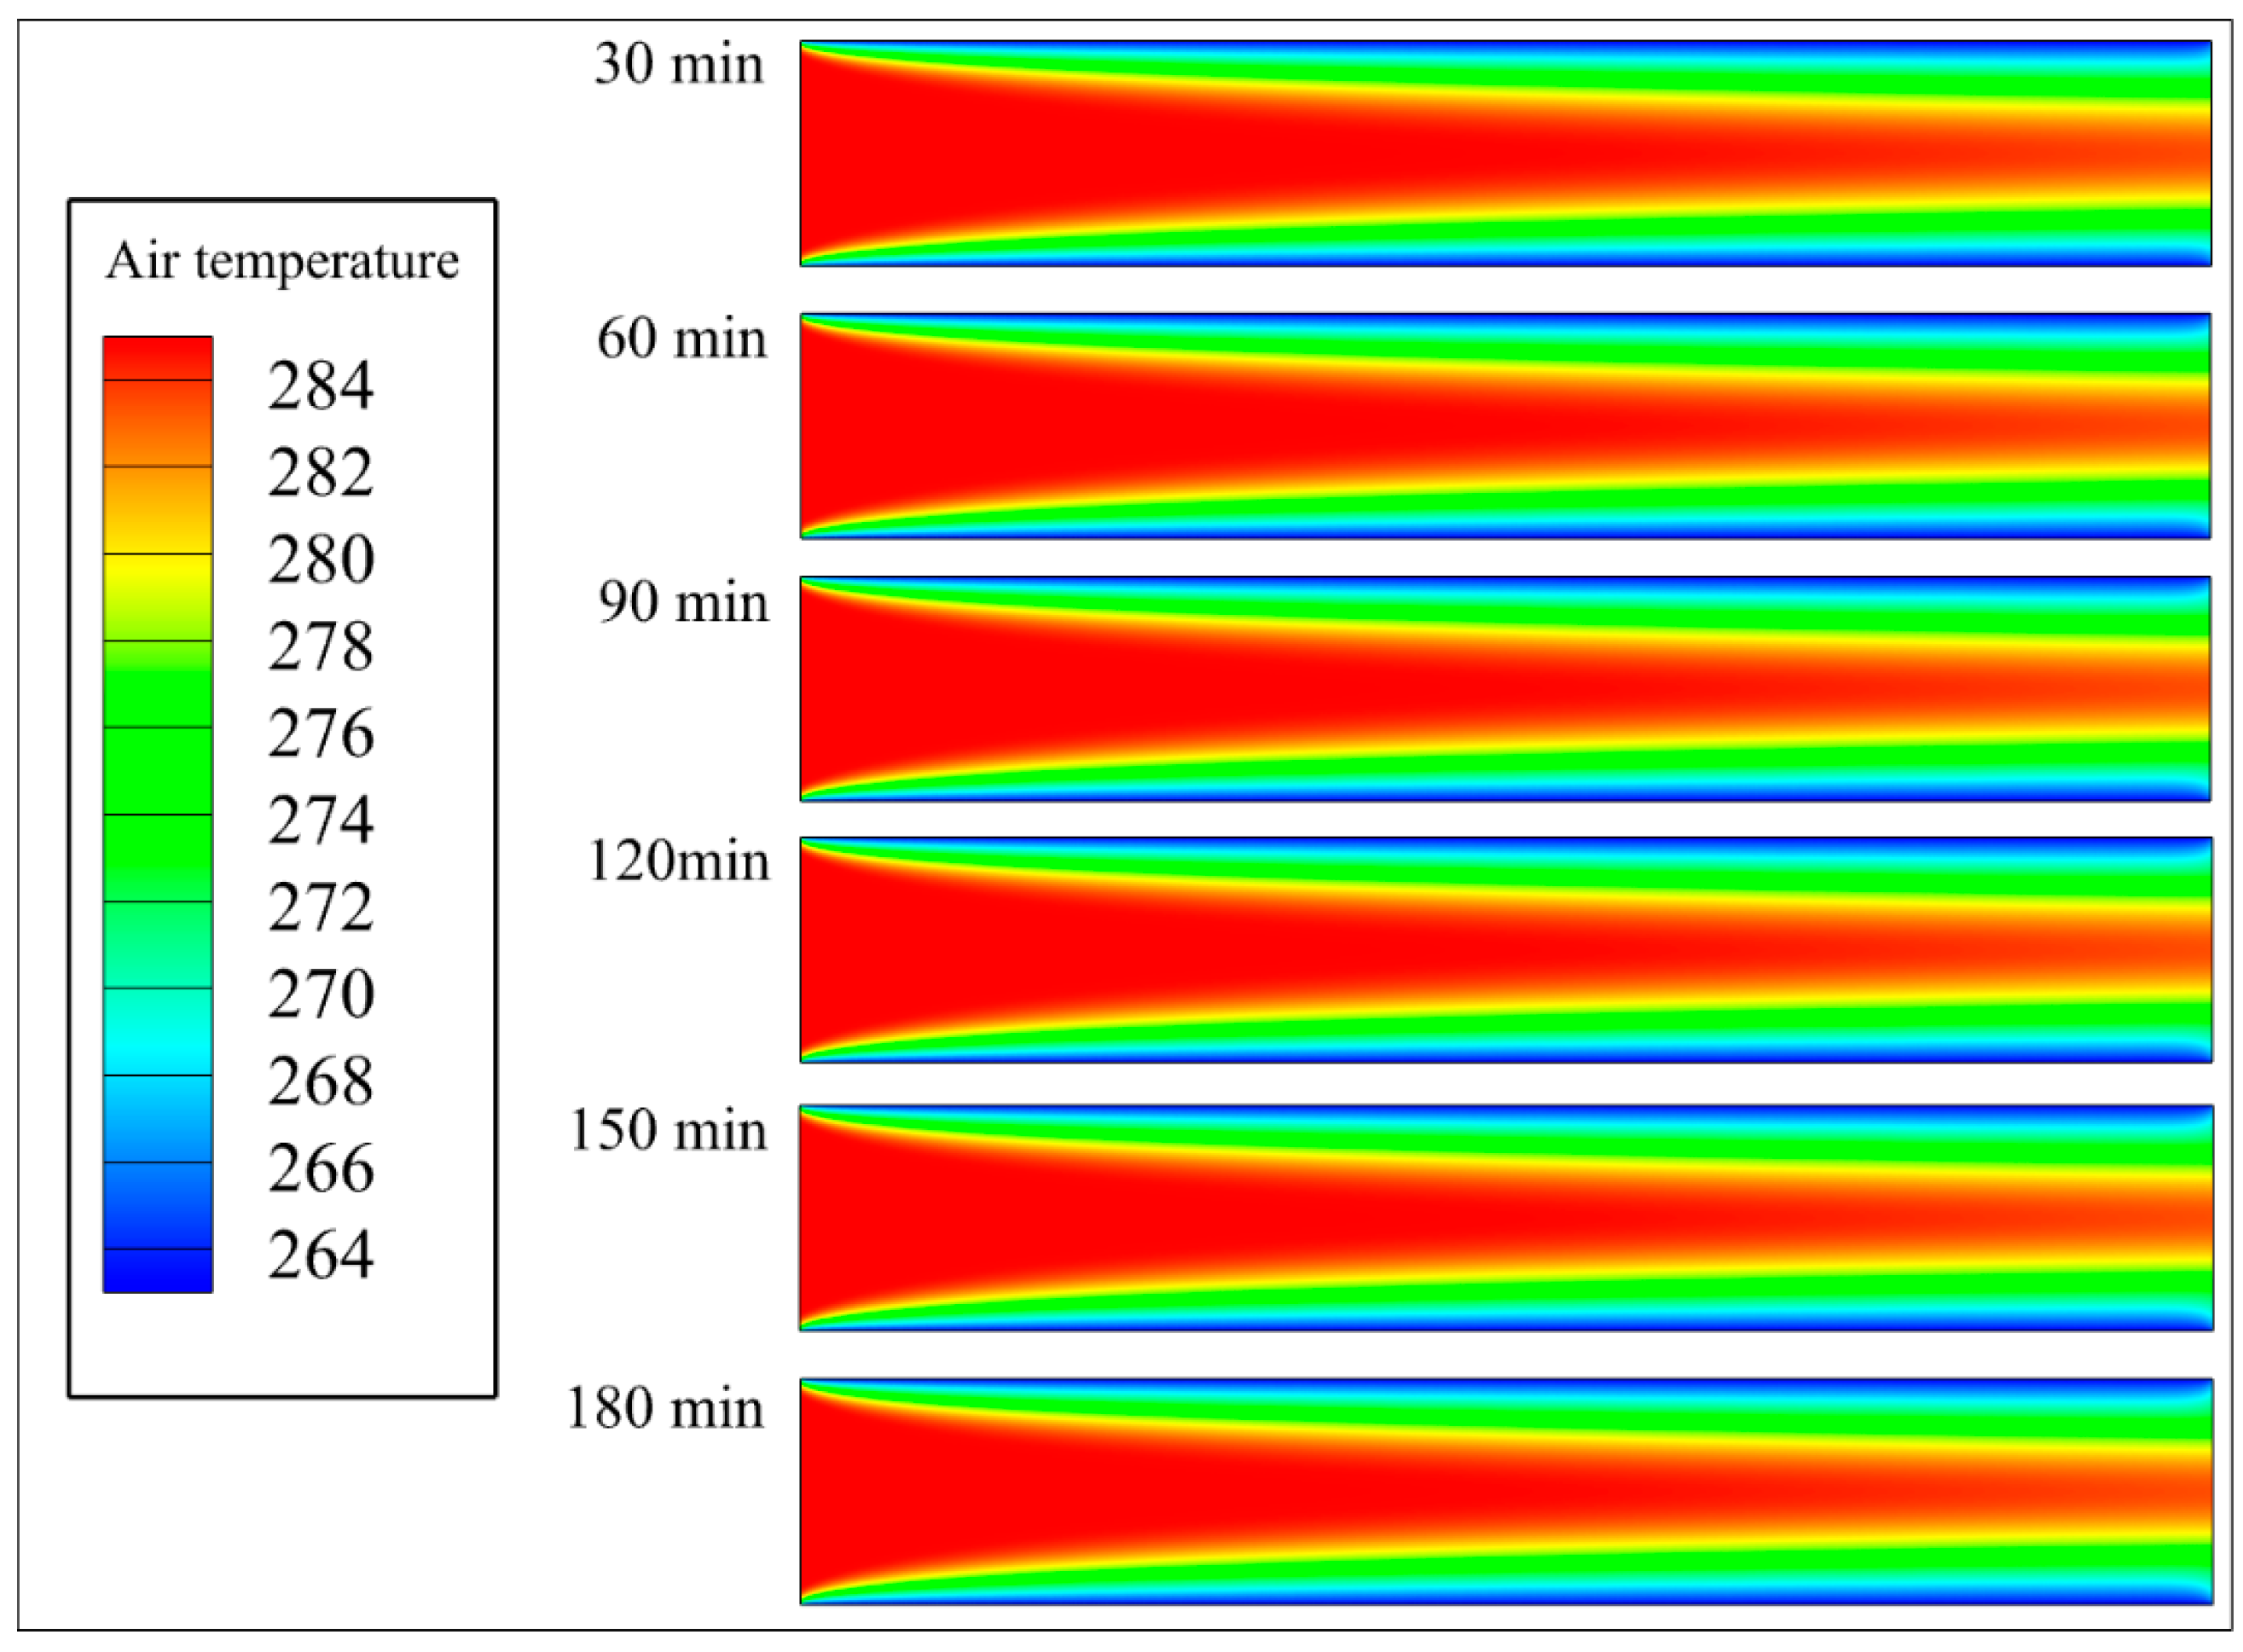
Figure 7: Distribution of air temperature with time (d = 8 mm, K).
3.4 Analysis of Frosting Characteristics Based on Evaluation Indicators
Frost mass, defined as the mass of frost accumulated on the cold fin surface at a specific time, serves as the most direct indicator for evaluating frost characteristics on finned cold surfaces. The temporal evolution of the frost mass over 0 to 180 min for different fin spacings (4, 6, 8, 10, and 12 mm) is shown in Fig. 8, whereas the corresponding curves of the frost mass growth rate versus time are shown in Fig. 9.
From 0 to 80 min, all fin spacings yielded rapid mass accumulation. Fins with larger spacings had steeper initial slopes in their frost mass curves, indicating higher initial frost deposition rates. Concurrently, the frost mass growth rate also continued to increase, signifying an acceleration in the rate of mass accumulation. From 80 to 120 min, the curves for all fin spacings approached an approximately linear trend, albeit with reduced slopes. This corresponds to a decrease in the frost mass growth rate, indicating that the speed of frost mass accumulation slowed, indicating the transition of the frost formation process into a stabilizing phase. During this stage, fins with larger spacings still maintained a higher level of accumulated frost mass. From 120 to 180 min, the frost mass continued to increase for all fin spacings, but the frost mass growth rate further decreased, leading to a deceleration in frost mass accumulation. Ultimately, a clear fin spacing dependence emerged: the final frost mass achieved on fins with larger spacings was significantly greater than that on fins with smaller spacings. A larger fin spacing promotes frost deposition, with the final frost mass of 12 mm spacing being approximately 71.8% greater than that at 4 mm spacing. These findings demonstrate that the fin spacing plays a critical role in driving the overall accumulation of frost mass. The analysis combined with velocity contours suggests that this phenomenon is likely related to the airflow velocity of moist air within the spacing and the total mass flow rate of moist air passing through the channel. The simulation results confirm the conclusion drawn by Zhang et al. [25] that frost accumulation (mass) increases with increasing fin spacing. Our study further elucidates the underlying mechanism: larger spacings accommodate a lower average airflow velocity and a higher total mass flow rate of moist air through the channel, providing more water vapor for deposition over a longer period before airflow suppression becomes dominant. This mechanistic explanation reinforces and increases the existing empirical understanding.
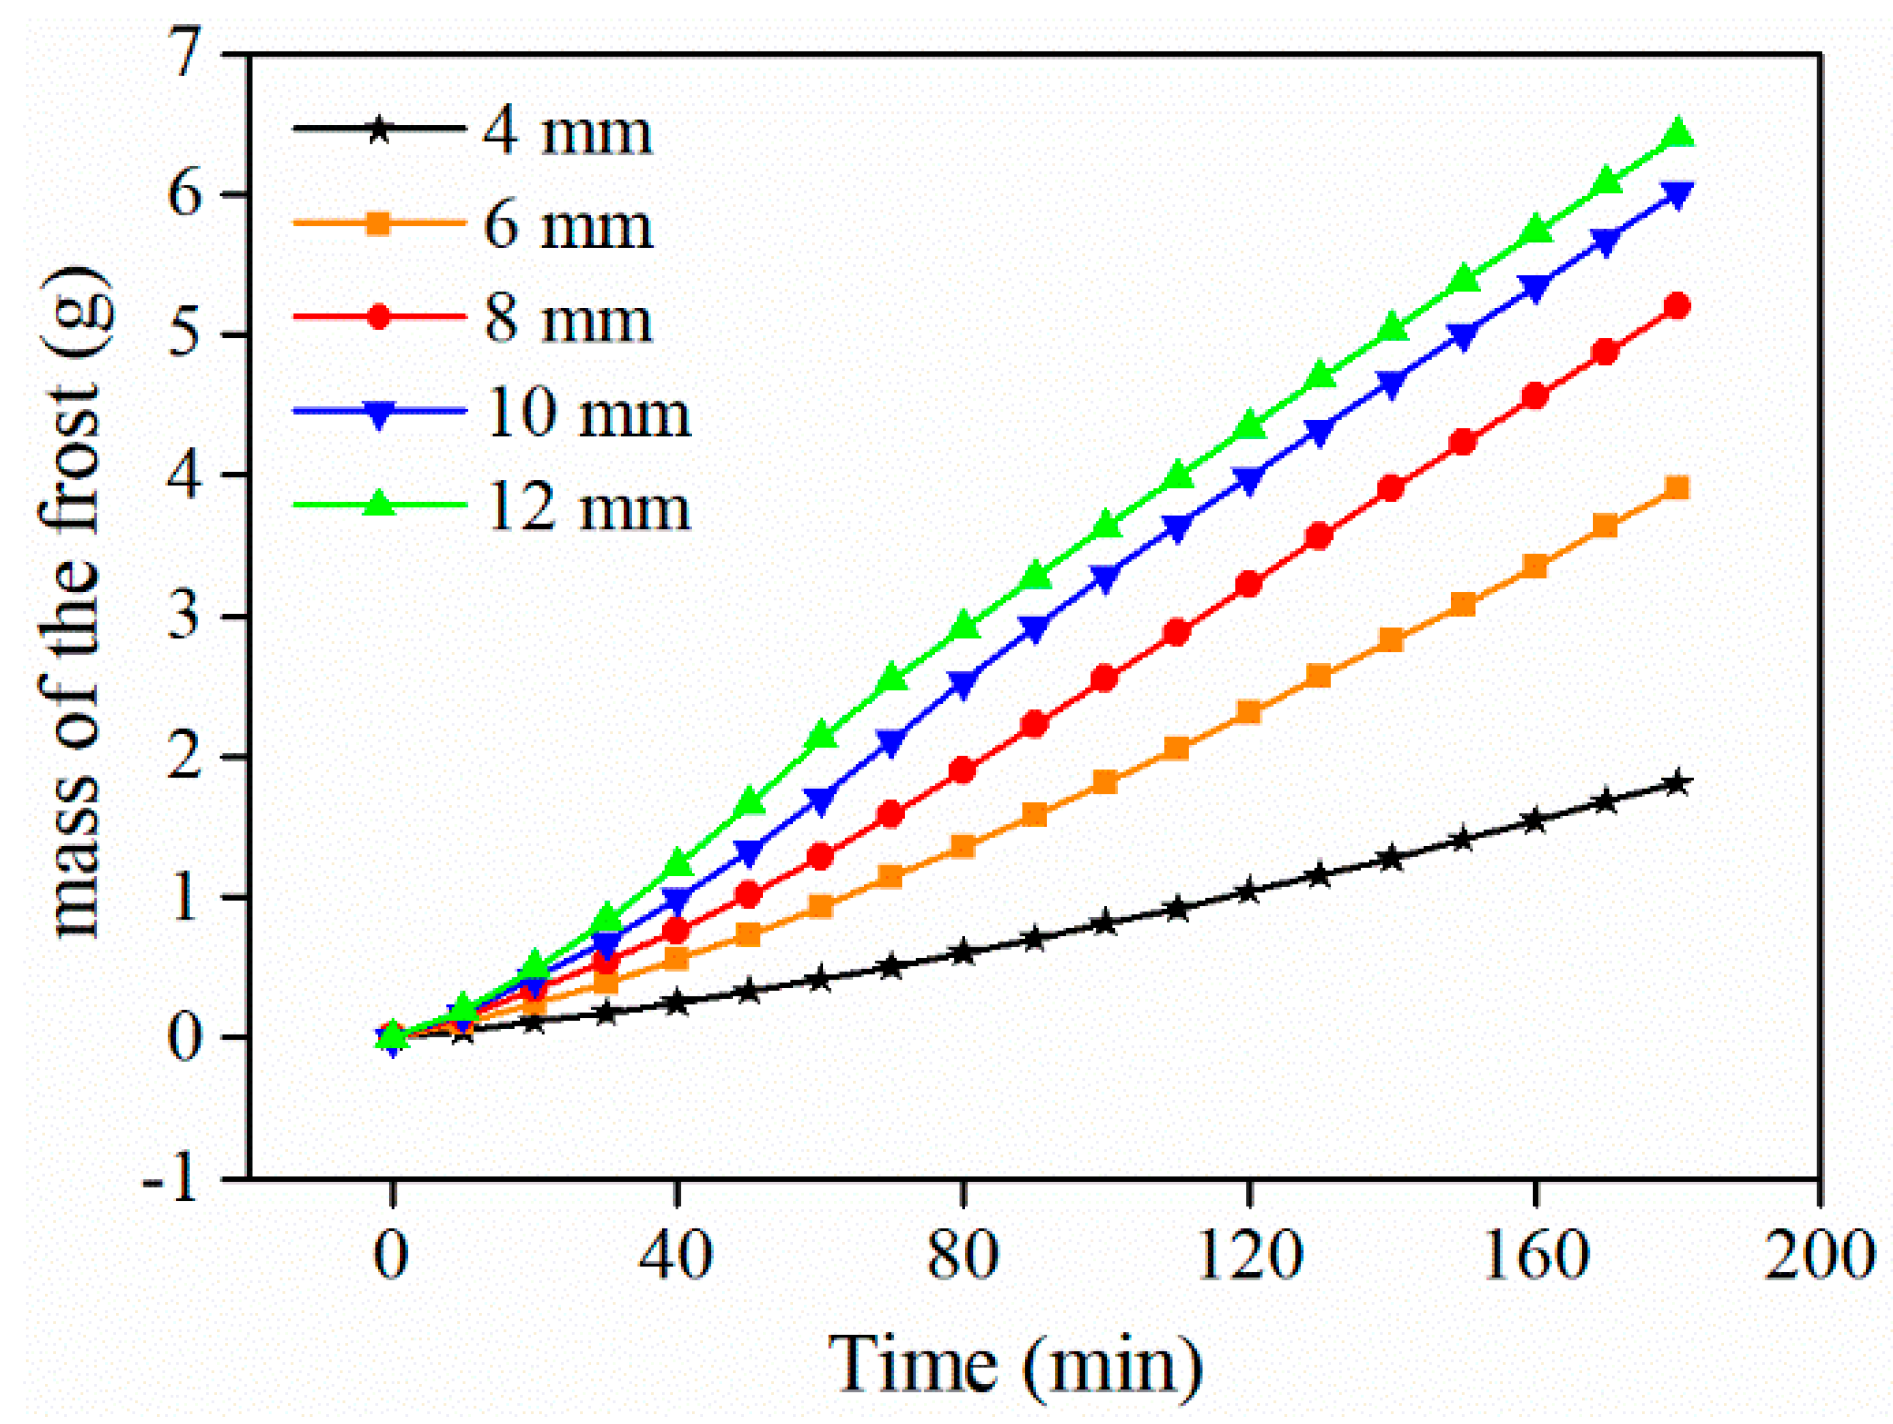
Figure 8: Variation curves of the frost mass with time for different fin spacings.

Figure 9: Curves showing changes in the frost layer mass growth rate over time.
Frost thickness, which represents the volume occupied by the frost layer within the fin gap, is a crucial parameter for evaluating frost characteristics on cold fin surfaces. The variations in the average frost thickness over 0~180 min for different fin spacings are shown in Fig. 10. The corresponding curves of the rate of increase in the frost thickness versus time, reflecting the increase in the speed of the frost layer height, are shown in Fig. 11. Quantitative calculations reveal that the increase in the frost layer thickness encompasses a distinct two-stage pattern, with the initial average rate (0~80 min) at 12 mm spacing reaching 0.021 mm/min, nearly 4.3 times that at 4 mm.
From 1 to 10 min, the frost layer thickness was initially small and did not significantly affect the airflow velocity within the fin gap, which remained relatively low. Consequently, rapid frost growth occurred across all fin spacings. As shown in the figures, the initial frost thickness growth rate increased with increasing fin spacing.
From 10 to 80 min, the frost layer reached a significant height, and the airflow within the fin gap began to influence frost growth. A comparison of the frost growth curves revealed that the impact of airflow on frost development increased as the fin spacing decreased. The frost thickness growth rate curves indicate a continuous decrease in growth speed during this stage. Notably, a reduction in the growth rate was more significant for larger fin spacings.
From 80 to 180 min, frost growth decelerated greatly for large fin spacings and even approached stagnation, whereas frost growth proceeded slowly for smaller fin spacings. During this phase, the frost thickness growth rate reached a minimum value or even approached zero, indicating significantly slowed growth.
An analysis of the velocity contours suggests that the increase in frost thickness alters the airflow characteristics within the fin gap. This altered flow state, in turn, exerts a feedback effect on the frost growth process. Furthermore, this interaction increases with decreasing fin spacing.
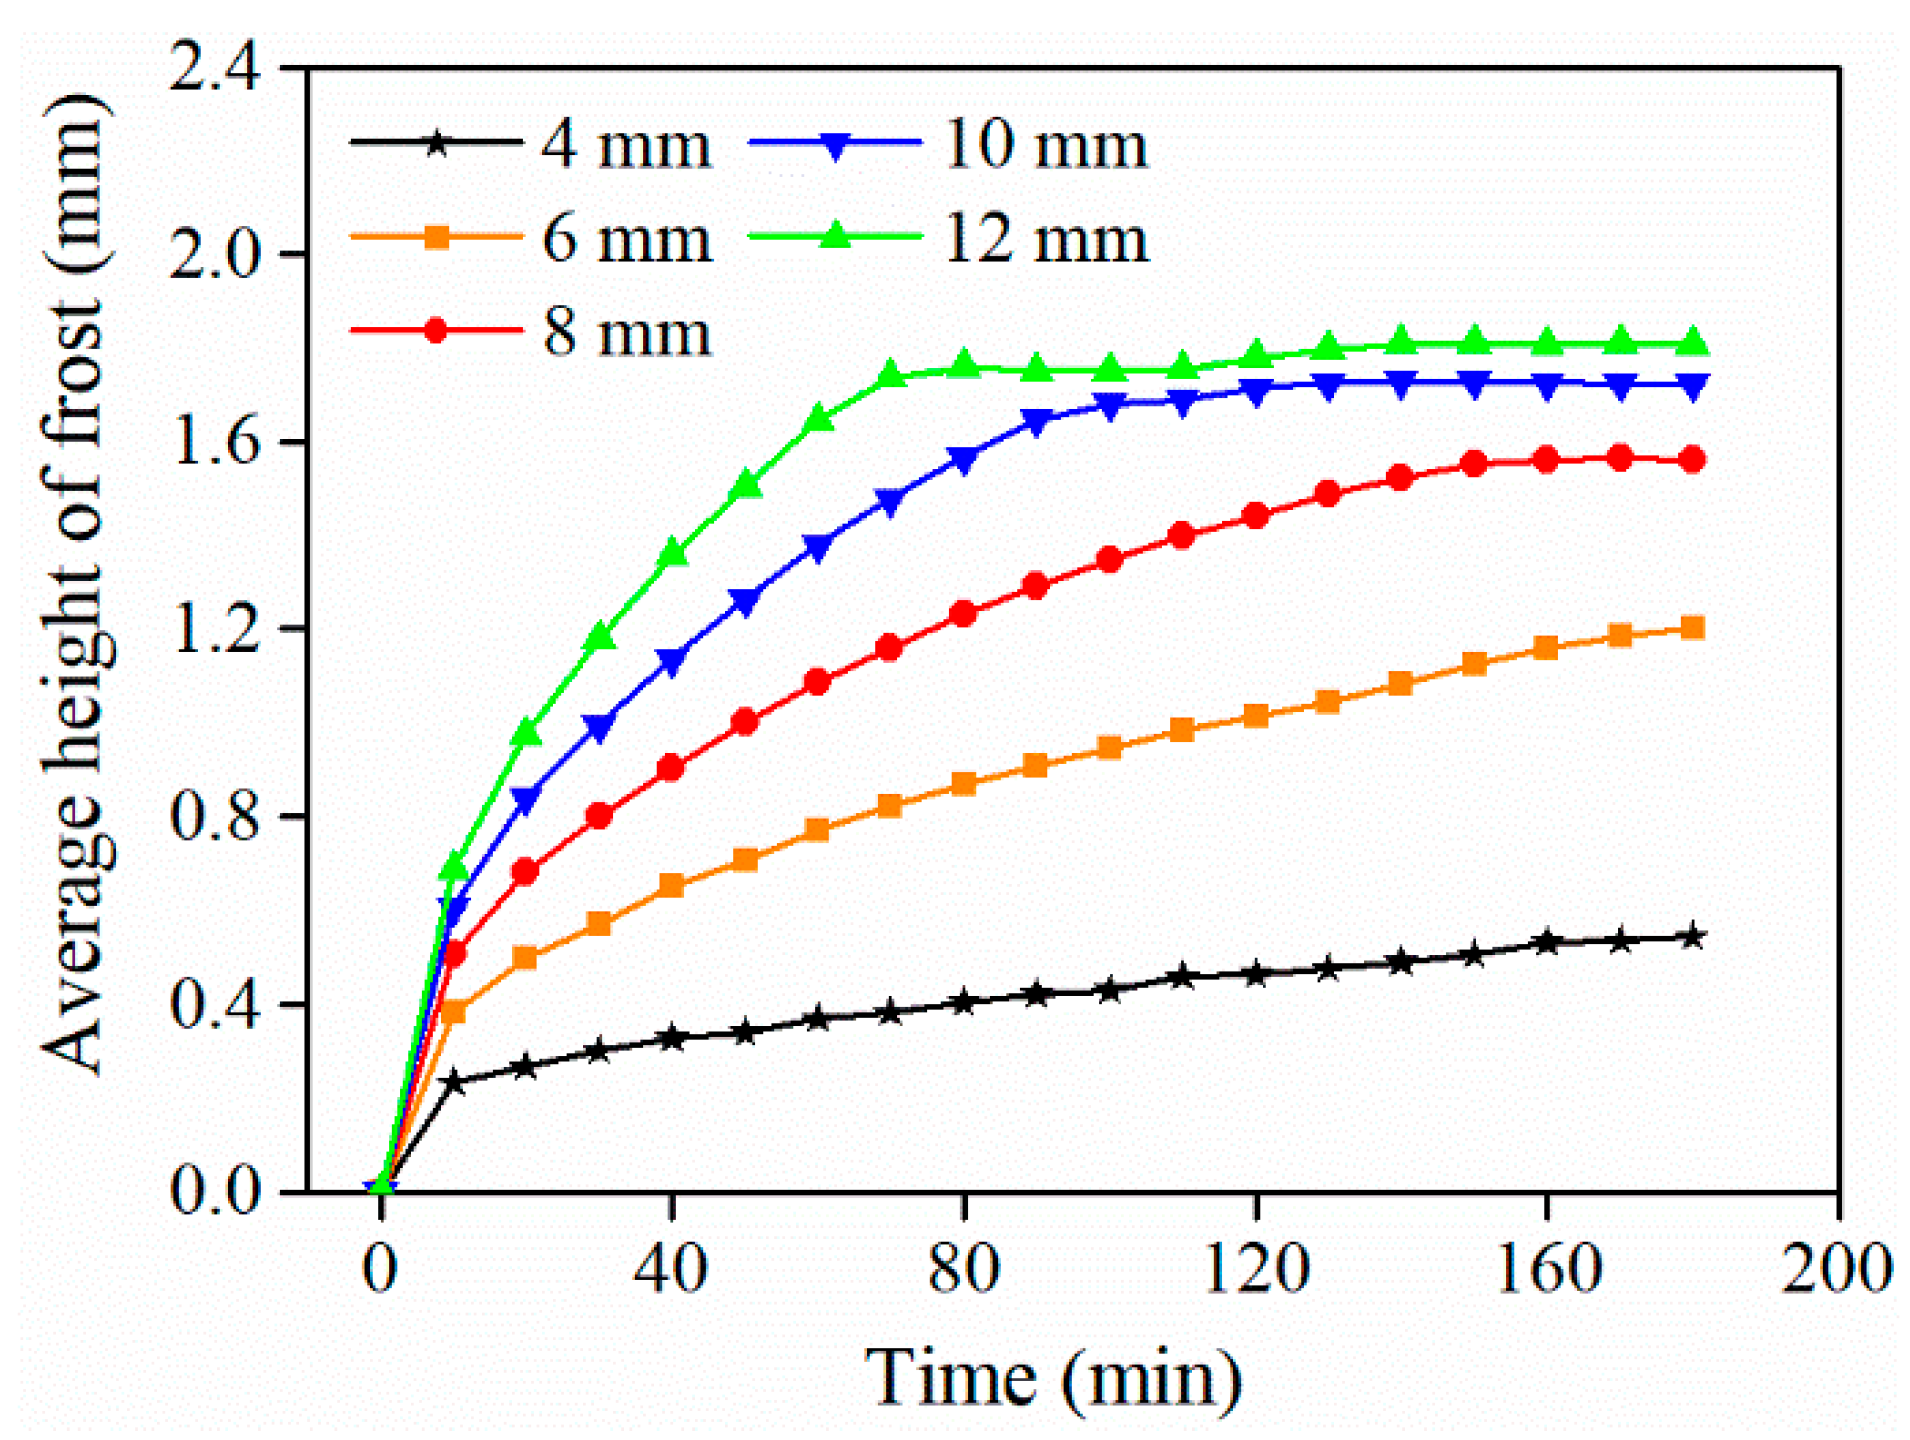
Figure 10: Curves showing changes in the average frost layer thickness over time.
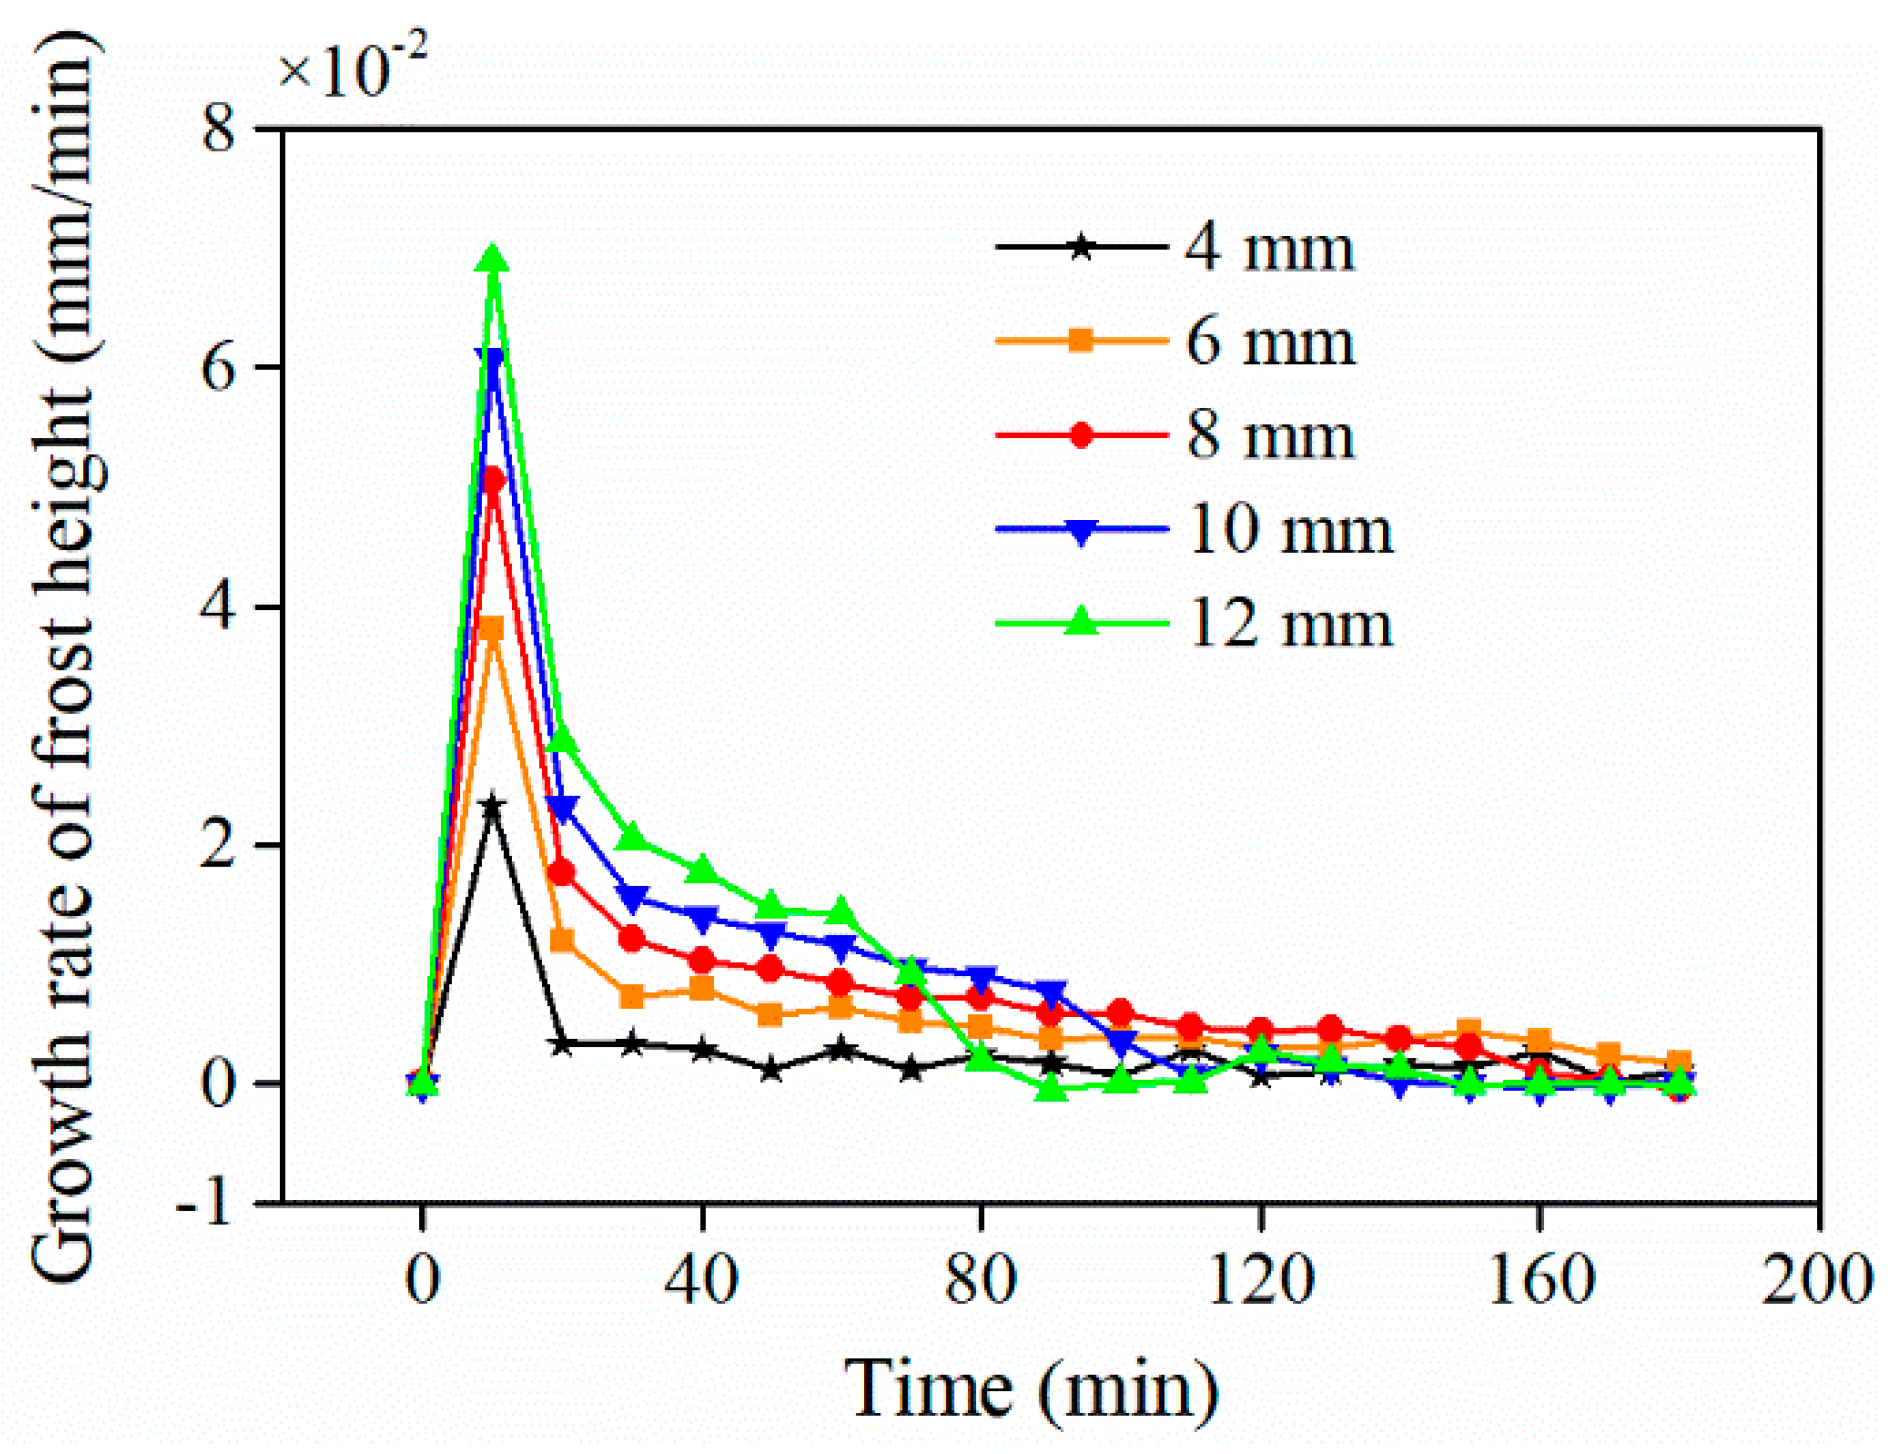
Figure 11: Curves showing changes in the frost layer height growth rate over time.
The temporal evolution of the average frost layer density for different fin spacings is shown in Fig. 12. Notably, the overall trend of frost density growth over time remains largely consistent across all fin spacings. At the early frosting stage, the growth rates of the average frost density are almost indistinguishable, indicating that the fin spacing negligibly influences the early densification of the frost layer. This can be attributed to the fact that, at the beginning of the frosting process, the fins are mostly free of frost, and the heat and mass transfer mechanisms are not yet significantly affected by the geometrical configuration.
As the frost layer continues to develop, minor variations in density increase. However, these differences remain relatively small throughout the simulation period. Even at the later stages of frosting, the divergence among the curves is limited, suggesting that the fin spacing has only a modest influence on the average density of the frost layer. These results suggest that although fin spacing affects the overall amount and distribution of frost, especially with respect to blockage and thermal resistance, it does not significantly alter the compactness or structure of the deposited frost, as reflected by the average density.
In summary, while the fin spacing may influence the total frost accumulation and airflow blockage within the fin array, its effect on the temporal evolution of the frost layer density is relatively minor. The frost layer develops with similar compactness across different fin spacings, indicating that density is governed primarily by local thermodynamic conditions rather than fin geometry.
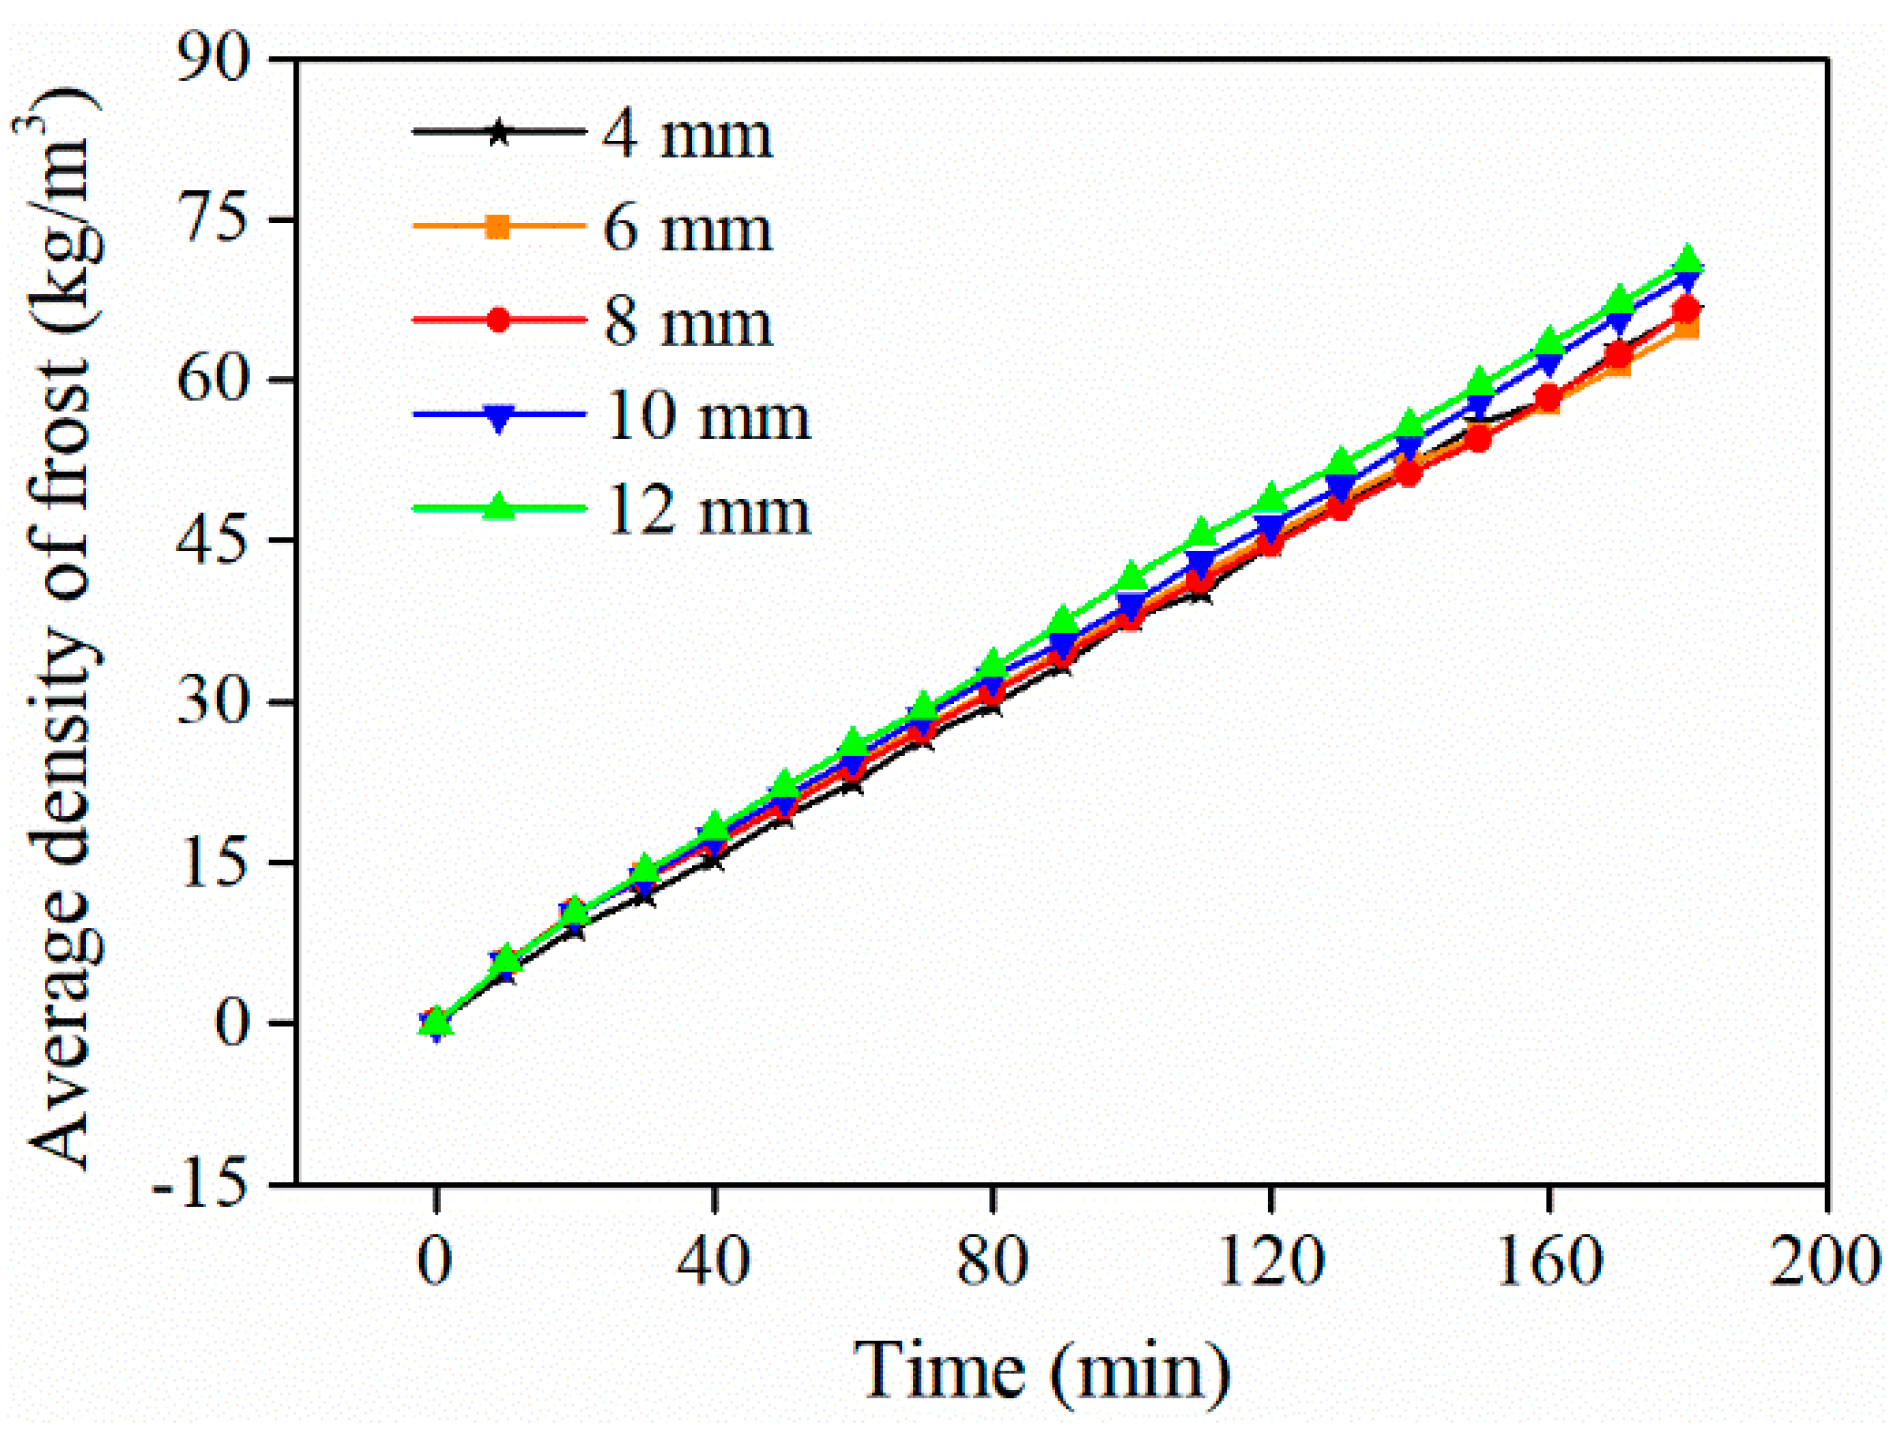
Figure 12: Changes in the average density of the frost layer over time.
Frost formation on the cold surfaces of ASHP evaporator fins is a critical factor affecting system performance. To investigate the mechanism of the influence exerted by fin spacing on the frosting characteristics of cold surfaces, a numerical model of the frosting process was developed and validated. In this study, the influence of fin spacing on the frosting characteristics of ASHP evaporator fins was analyzed systematically through numerical simulation. The results revealed that the frosting process involves a coupled evolution of frost thickness and density, which is significantly affected by the airflow and temperature field distributions within the fin channels. The fin spacing plays a critical role in determining the rate and extent of frost accumulation. At a spacing of 12 mm, the final frost mass was approximately 71.8% greater than that at a spacing of 4 mm, indicating that greater spacing promotes greater frost accumulation. In contrast, a smaller spacing enhances airflow-induced suppression of frost height growth, with the maximum frost thickness at a spacing of 4 mm being reduced by approximately 1.2 mm compared with that in the 12 mm case. The frost growth rate exhibited a two-stage pattern, with the initial average rate at 12 mm spacing reaching 0.021 mm/min, approximately 4.3 times that at 4 mm spacing, before slowing because of increasing flow resistance and thermal insulation effects. Additionally, although the initial trends in the frost density are similar, notable divergence occurs at the later stages, with a clear dependence on the fin spacing. These findings provide theoretical insight for optimizing the fin geometry to mitigate frosting and enhance the heat pump performance under frost-prone conditions. The proposed model and conclusions are applicable to parallel-fin evaporators operating under typical cold and humid conditions (air temperature 260–285 K; relative humidity 80%–90%). The results reveal mainly general trends in frost evolution with fin spacing; however, further investigation is needed for complex geometries such as wavy fins or multirow exchangers.
Acknowledgement:
Funding Statement: This paper is supported by the Shandong Provincial Natural Science Foundation (ZR2023QE325).
Author Contributions: The authors confirm contribution to the paper as follows: conceptualization, Zhengqing Zhang and Xiaojun Yuan; methodology, Zhengqing Zhang; software, Zhengqing Zhang; validation, Hui Wu; formal analysis, Hui Wu and Zhengqing Zhang; investigation, Zhengqing Zhang and Hui Wu; resources, Hui Wu and Xiaojun Yuan; data curation, Hui Wu; writing—original draft preparation, Zhengqing Zhang; writing—review and editing, Zhengqing Zhang; visualization, Zhengqing Zhang; supervision, Xiaojun Yuan; project administration, Xiaojun Yuan; funding acquisition, Xiaojun Yuan. All authors reviewed the results and approved the final version of the manuscript.
Availability of Data and Materials: The data that support the findings of this study are available from the corresponding author, upon reasonable request.
Ethics Approval: Not applicable.
Conflicts of Interest: The authors declare no conflicts of interest to report regarding the present study.
Nomenclature
| Roman Symbols | |
| B | Correction factor for mass transfer |
| Dh | Hydraulic diameter, m |
| Dva | Diffusion coefficient of water vapor, m2/s |
| h | Specific enthalpy, kJ/kg |
| l | Length of the fin channel, m |
| Mass transfer rate from moist air to ice phase, kg/(m3 s) | |
| Mass transfer rate from ice to moist air phase, kg/(m3 s) | |
| P | Pressure, Pa |
| Re | Reynolds number |
| S | Source term |
| T | Temperature, K |
| Yva | Mass fraction of water vapor in moist air |
| Greek Symbols | |
| α | Volume fraction |
| ρ | Density, kg/m3 |
| τ | Stress-strain tensor, Pa |
| Subscripts | |
| a | Moist air |
| ai | From moist air to ice |
| ia | From ice to moist air |
| Abbreviations | |
| ASHP | Air-Source Heat Pump |
| CFD | Computational Fluid Dynamics |
| UDF | User-Defined Function |
References
1. Huang S , Yu H , Zhang M , Qu H , Wang L , Zhang C , et al. Advances, challenges and outlooks in frost-free air-source heat pumps: a comprehensive review from materials, components to systems. Appl Therm Eng. 2023; 234: 121163. doi:10.1016/j.applthermaleng.2023.121163. [Google Scholar] [CrossRef]
2. Mete Ozturk M , Doğan B , Berrin Erbay L . Performance assessment of an air source heat pump water heater from exergy aspect. Sustain Energy Technol Assess. 2020; 42: 100809. doi:10.1016/j.seta.2020.100809. [Google Scholar] [CrossRef]
3. Bobbo S , Lombardo G , Menegazzo D , Vallese L , Fedele L . A technological update on heat pumps for industrial applications. Energies. 2024; 17( 19): 4942. doi:10.3390/en17194942. [Google Scholar] [CrossRef]
4. Wu S , Sun Y , Wang F , Ma Z , Zhao R , Huang D . A prediction model of air-source heat pump system performance with frost-retarded heater. Appl Therm Eng. 2024; 248: 123315. doi:10.1016/j.applthermaleng.2024.123315. [Google Scholar] [CrossRef]
5. Zhao B , Bi H , Wang H , Zhou Y . Experimental and numerical investigation on frosting of finned-tube heat exchanger considering droplet impingement. Appl Therm Eng. 2022; 216: 119134. doi:10.1016/j.applthermaleng.2022.119134. [Google Scholar] [CrossRef]
6. Afrasiabian E , Iliev O , Lazzari S , Isetti C . Numerical simulation of frost formation on a plate-fin evaporator. In: Proceedings of the World Congress on Momentum, Heat and Mass Transfer; 2018 Apr 12–14; Budapest, Hungary. p. 1395– 411. doi:10.11159/icmfht18.125. [Google Scholar] [CrossRef]
7. Ning Z , Zhang X , Ji J , Shi Y , Du F . Research progress of phase change thermal storage technology in air-source heat pump. J Energy Storage. 2023; 64: 107114. doi:10.1016/j.est.2023.107114. [Google Scholar] [CrossRef]
8. Gu Y , He G , Li S , Ding W , Li H , Duan J . Study on frost-suppression characteristics of superhydrophobic aluminum surface heat exchanger applied in air source heat pump. Sustainability. 2022; 14( 4): 1954. doi:10.3390/su14041954. [Google Scholar] [CrossRef]
9. Ye Z , Shi J , Chen J . Frosting behavior of louvered-fin and tube heat exchanger after surface treatment: experimental analysis. Appl Therm Eng. 2021; 194: 117066. doi:10.1016/j.applthermaleng.2021.117066. [Google Scholar] [CrossRef]
10. Wang F , Zhao R , Xu W , Huang D , Qu Z . A heater-assisted air source heat pump air conditioner to improve thermal comfort with frost-retarded heating and heat-uninterrupted defrosting. Energies. 2021; 14( 9): 2646. doi:10.3390/en14092646. [Google Scholar] [CrossRef]
11. Jia J , Si P , Rong X , Liu B , Xiang B , Shi L , et al. Experimental investigation on a screw-type air source heat pump system with air heat absorption defrosting. Appl Therm Eng. 2024; 241: 122412. doi:10.1016/j.applthermaleng.2024.122412. [Google Scholar] [CrossRef]
12. Ye Z , Wang W , Li X , Chen J . Review on anti-frost technology based on microchannel heat exchanger. J Shanghai Jiaotong Univ Sci. 2024; 29( 2): 161– 78. doi:10.1007/s12204-022-2539-x. [Google Scholar] [CrossRef]
13. Ma G , Lu T , Liu F , Niu J , Xu S . Experimental study on hot liquid subcooling defrosting of an air source heat pump with multi-connected outdoor units. Energy Build. 2023; 291: 113104. doi:10.1016/j.enbuild.2023.113104. [Google Scholar] [CrossRef]
14. Moallem E , Hong T , Cremaschi L , Fisher DE . Experimental investigation of adverse effect of frost formation on microchannel evaporators, part 1: effect of fin geometry and environmental effects. Int J Refrig. 2013; 36( 6): 1762– 75. doi:10.1016/j.ijrefrig.2012.09.009. [Google Scholar] [CrossRef]
15. Zhang Y , Zhang G , Zhou D , Zhang J , Qu X , Zhang Z , et al. Experimental study and performance evaluation of an air source heat pump (ASHP) system with a frost-free evaporator. J Clean Prod. 2024; 448: 141469. doi:10.1016/j.jclepro.2024.141469. [Google Scholar] [CrossRef]
16. Ma L , Sun Y , Wang F , Wang M , Zhang S , Wang Z . Advancements in anti-frosting and defrosting techniques for air source heat pumps: a comprehensive review of recent progress. Appl Energy. 2025; 377: 124358. doi:10.1016/j.apenergy.2024.124358. [Google Scholar] [CrossRef]
17. Yu S , Su Y , Cai W , Qiu G . Experimental investigation on an air source heat pump system with a novel anti-frosting evaporator. Appl Therm Eng. 2023; 221: 119910. doi:10.1016/j.applthermaleng.2022.119910. [Google Scholar] [CrossRef]
18. Kropas T , Streckienė G , Bielskus J . Experimental investigation of frost formation influence on an air source heat pump evaporator. Energies. 2021; 14( 18): 5737. doi:10.3390/en14185737. [Google Scholar] [CrossRef]
19. Zhong H , Zeng L , Long J , Xia K , Lu H , Yongga A . Anti-frosting operation and regulation technology of air-water dual-source heat pump evaporator. Energy. 2022; 254: 124393. doi:10.1016/j.energy.2022.124393. [Google Scholar] [CrossRef]
20. Li R , Wang Z , Zhang Y , Li Z , Luo X , Lu W , et al. Performance improvement of vapor compression heat pump with superhydrophobic finned-tube evaporator. J Build Eng. 2024; 87: 109013. doi:10.1016/j.jobe.2024.109013. [Google Scholar] [CrossRef]
21. Hu S . Experimental and numerical investigations of frost formation on complex surfaces. Beijing, China: Tsinghua University; 2014. (In Chinese). [Google Scholar]
22. Babadi MN , Cho Y , Kang S , Yeom E . Experimental and numerical analysis of frost formation in household refrigerators: evaluating the effects of fin removal in front of the return duct. Int J Heat Mass Transf. 2025; 250: 127293. doi:10.1016/j.ijheatmasstransfer.2025.127293. [Google Scholar] [CrossRef]
23. Jin W , Wang Y . Three-dimensional model construction of a frost-free air source heat pump evaporator and its performance analysis. Results Eng. 2024; 22: 102001. doi:10.1016/j.rineng.2024.102001. [Google Scholar] [CrossRef]
24. Popovac M , Emhofer J , Reichl C . Frosting in a heat pump evaporator part B: numerical analysis. Appl Therm Eng. 2021; 199: 117488. doi:10.1016/j.applthermaleng.2021.117488. [Google Scholar] [CrossRef]
25. Zhang L , Song M , Hosseini SH , Shen J , Jiang Y . A modeling study of spatial and temporal frost growth on the edge of windward fins for a tube-finned heat exchanger. Int J Heat Mass Transf. 2022; 183: 122093. doi:10.1016/j.ijheatmasstransfer.2021.122093. [Google Scholar] [CrossRef]
26. Lu Z , Huang R , Woods J . A review of modeling approaches for predicting frost growth and defrosting on tube-fin heat exchangers: preprint. In: Proceedings of the 20th International Refrigeration and Air Conditioning Conference; 2024 Jul 15–18; West Lafayette, IN, USA. [Google Scholar]
27. Tang J , Hu X , Herman C , Gong G . Computational modeling and prediction of the performance of air source heat pumps under frost prevention and retardation conditions. Energy Build. 2020; 224: 110264. doi:10.1016/j.enbuild.2020.110264. [Google Scholar] [CrossRef]
28. Lenic K , Trp A , Frankovic B . Transient two-dimensional model of frost formation on a fin-and-tube heat exchanger. Int J Heat Mass Transf. 2009; 52( 1–2): 22– 32. doi:10.1016/j.ijheatmasstransfer.2008.06.005. [Google Scholar] [CrossRef]
29. Qiu G , Li S , Shi Y , Fang X , Cai W . Development and validation of a numerical model for frost growth based on nucleation theory. Int J Heat Mass Transf. 2024; 221: 125137. doi:10.1016/j.ijheatmasstransfer.2023.125137. [Google Scholar] [CrossRef]
30. Zhang L , Jiang Y , Dong J , Yao Y , Deng S . An experimental study on the effects of frosting conditions on frost distribution and growth on finned tube heat exchangers. Int J Heat Mass Transf. 2019; 128: 748– 61. doi:10.1016/j.ijheatmasstransfer.2018.09.016. [Google Scholar] [CrossRef]
31. Zhang L , Jiang Y , Dong J , Yao Y , Deng S . An experimental study of frost distribution and growth on finned tube heat exchangers used in air source heat pump units. Appl Therm Eng. 2018; 132: 38– 51. doi:10.1016/j.applthermaleng.2017.12.047. [Google Scholar] [CrossRef]
Cite This Article
 Copyright © 2025 The Author(s). Published by Tech Science Press.
This work is licensed under a Creative Commons Attribution 4.0 International License , which permits unrestricted use, distribution, and reproduction in any medium, provided the original work is properly cited.
 Downloads
 Citation Tools