
 Submit a Paper
 Propose a Special lssue
 Open Access
ARTICLE

Time-Resolved Experimental Analysis of Granite–Mortar Interface Permeability under High-Temperature Conditions
School of Civil Engineering, Architecture and Environment, Hubei University of Technology, Wuhan, 430068, China
* Corresponding Author: Wei Chen. Email:
Fluid Dynamics & Materials Processing 2025, 21(12), 3033-3053. https://doi.org/10.32604/fdmp.2025.073778
Received 25 September 2025; Accepted 27 November 2025; Issue published 31 December 2025
 View Full Text
 Download PDF
Abstract
In deep underground engineering, geological disposal of nuclear waste, and geothermal development, the granite–mortar interface represents a critical weak zone that strongly influences sealing performance under high-temperature conditions. While previous studies have primarily focused on single materials, the dynamic evolution of interface permeability under thermal loading remains insufficiently understood. In this study, time-resolved gas permeability measurements under thermal cycling (20°C → 150°C → 20°C) were conducted, complemented by multi-scale microstructural characterization, to investigate the nonlinear evolution of permeability. Experimental results indicate that interface permeability at room temperature is approximately one order of magnitude higher than that of the mortar matrix. Heating to 100°C initially reduces permeability due to densification driven by thermal expansion, whereas further heating to 100–150°C induces C–S–H dehydration and thermal mismatch stresses, generating micro-cracks and reversing the permeability trend. During cooling, irreversible pore expansion further enhances permeability. After thermal cycling to 150°C, specimens with water–cement ratios of 0.3 and 0.5 exhibit permeability increases of 161.7% and 297.7%, respectively. Microstructural analysis further reveals that interface porosity increases by 73–79%, with dominant pore sizes expanding to 33–66 μm. Collectively, these findings identify 100°C as a critical threshold for abrupt permeability transitions and provide fundamental insights for optimizing the design and reliability of sealing systems in high-temperature rock engineering.Keywords
In major civil engineering projects such as deep underground construction, geological disposal of high-level nuclear waste, enhanced geothermal systems, and tunnel linings exposed to fire [1,2,3,4], man-made structures (e.g., concrete/mortar linings, grouting bodies, and buffer layers of nuclear waste canisters) are in long-term contact with the surrounding rock at interfaces, which are subjected to complex and harsh physicochemical environments. Among these, high temperature acts as an extreme environmental load and exerts a significant influence on the physical, mechanical, and seepage properties of geoengineering materials [5]. Granite, due to its high strength, low porosity, and excellent long-term stability, is widely used as host or foundation rock in such projects [6]. Mortar and concrete, as the most common construction materials, form interfaces with granite (hereinafter referred to as the granite–mortar interface), which are often the weak links of structures and potential seepage pathways. The influence of thermal damage on the structure and properties of this interface, particularly on permeability as a key hydraulic property, directly determines long-term service safety, sealing effectiveness, and post-disaster rehabilitation, which is of great theoretical significance and urgent engineering relevance.
Under high-temperature conditions, rocks and cement-based materials undergo complex physicochemical transformations. For granite, its constituent minerals such as quartz, feldspar, and mica have different thermal expansion coefficients and thermal stabilities [7]. During heating, differential thermal expansion, mineral dehydration, decomposition [8], and critical phase transitions (e.g., the α–β transition of quartz near 573°C accompanied by drastic volumetric expansion [9]) act together, leading to the initiation, propagation, and interconnection of microcracks, which significantly degrade mechanical strength while increasing porosity and permeability. Mortar, however, experiences even more severe changes under high temperature: dehydration and decomposition of hydration products sharply increase porosity and reduce strength [10]; the interfacial transition zone (ITZ) between aggregate and cement paste is more vulnerable to thermal mismatch [11]; in extreme cases, explosive spalling may occur [12]. Therefore, when granite and mortar, two materials with contrasting physical–mechanical properties and thermal effects, are bonded together to form an interface, thermal effects introduce unique complexities and potential hazards.
As a transitional region between two materials, the interface inherently differs in microstructure, mechanical performance, and hydraulic properties from either bulk material [13]. The weakness of the interface region is due to the combined effect of the high water-to-cement ratio in the microzone and the ‘wall effect’, which together lead to a significant reduction in the particle packing density near the granite surface. Cement particles cannot closely pack onto the granite surface, leaving a connected capillary pore network in this region after hardening. Furthermore, the coarse calcium hydroxide crystals formed chemically have much weaker crystallographic orientation and bonding strength with the C-S-H gel compared to the mechanical interlocking forces between the C-S-H gel phases in the bulk material. It generally exhibits higher porosity, more developed microcrack networks, and relatively lower mechanical strength. High temperature aggravates such differential damage: on the one hand, distinct thermal expansion/contraction between granite and mortar generates significant additional thermal stresses at the interface; on the other hand, pre-existing microdefects in the interfacial region tend to propagate into preferential seepage pathways under thermal stress. As a result, the granite–mortar interface subjected to heating is highly likely to evolve into a “fast channel” for fluid migration. The pronounced increase in interfacial permeability severely threatens surrounding rock stability in underground caverns, long-term sealing performance in nuclear waste repositories, exploitation efficiency in geothermal reservoirs, and waterproofing and durability of post-fire tunnel linings.
Previous research has accumulated substantial findings on the effects of high temperature on the physical, mechanical, and seepage properties of pure granite or pure mortar/concrete [14,15,16,17], and the mechanical behavior of rock–concrete interfaces at room temperature has also been partly explored. Dong et al. [18] used digital image correlation technology to study the fracture process of rock-concrete composite beams with different pre-crack positions under three-point bending. Based on the displacement field obtained from the experiments, the crack width and propagation length during the fracture process were derived, providing information on the evolution of the fracture process zone (FPZ). On this basis, Yuan et al. [19] found that the interface roughness significantly affects the fracture performance of rock-concrete interfaces. Jiang et al. [20] conducted shear tests on sandstone-concrete samples under loading conditions and found that the overall shear strength and residual strength of the rock-concrete interface are influenced by the concrete strength and normal load. Yang et al. [21] studied the damage mechanisms and shear failure modes of rock–cement composites before and after ultra-low-temperature treatment and found that such treatment significantly influenced the permeability of cement ring interfaces, weakened shear strength, and revealed material-dependent differences in permeability and confining pressure sensitivity, with the permeability ranking: granite > interface > magnesium phosphate cement > sandstone. Li et al. [22] observed the permeability of rock salt–cement ring specimens under cyclic confining pressure and found that the interface was the main pathway for gas leakage, while longer holding time and more cycles effectively improved pore structure and enhanced ring integrity. Wang et al. [23] employed X-ray computed tomography to investigate pores and cracks at rock–concrete interfaces of different roughness and found that after cyclic permeability testing, most interfacial cracks decreased in width and became more uniformly distributed along specimen length. Liu et al. [24] conducted water and gas permeability tests on granite and granite–bentonite specimens with smooth and grooved interfaces, and found that the breakthrough pressures of granite and granite–bentonite samples were significantly lower than that of pure bentonite, highlighting the existence of preferential gas migration pathways between rock and bentonite buffer zones. However, systematic experimental investigations specifically addressing the effect of thermal damage on the permeability of granite–mortar interfaces have not yet been conducted.
This study aims to design and implement a rigorous and controllable real-time high-temperature permeability testing scheme, in which a composite structure is constructed by combining granite with mortar of different water-to-cement ratios. Gas permeability tests were conducted on mortar, granite, and composite specimens under a thermal gradient of 20°C, 60°C, 100°C, 150°C, 100°C, 60°C, and 20°C. Microscopic characterization was carried out before and after testing to examine structural changes in real-time thermal conditions. The aim is to evaluate the effect of high temperature on the permeability of granite–mortar interfaces and to analyze the mechanisms of temperature-induced damage.
The experimental materials were granite and mortar. The granite was obtained from Hunan Province, and its main mineral components were quartz, mica, albite, and potassium feldspar. The mortar was prepared using P.O 42.5 ordinary Portland cement produced by Huaxin Cement Co., Ltd. (Ezhou, China), and natural river sand with a fineness modulus of 2.70 [25]. According to the standards of the International Society for Rock Mechanics (ISRM) [26], the granite samples were processed into cylindrical specimens with a size of Ф50 mm × 100 mm. For permeability testing, the granite cylinders were cut into three cylindrical specimens of Ф50 mm × 25 mm. The cut cylinders were divided into two groups, one of which was drilled to produce granite ring specimens with an outer diameter of 50 mm, an inner diameter of 25 mm, and a height of 25 mm, so that mortar could be cast into the rings to form composite specimens. Mortar with water–cement ratios of 0.3 and 0.5 was cast into the granite rings. The sand-to-cement ratio adopts European standards [27] with detailed mix proportions given in Table 1. At the same time, a batch of mortar specimens with water–cement ratios of 0.3 and 0.5 and a size of Ф50 mm × 100 mm was cast separately. After curing for three months, these mortar specimens were cut into cylinders of Ф50 mm × 25 mm. The study selected water-to-cement ratios of 0.3 and 0.5, mainly based on a comprehensive consideration of extensive mix ratio research data from previous studies, with a large database available as support and reference. According to the statistical results of earlier experiments, when the ratio was lower than 0.3, the mortar exhibited poor workability and difficulties in compaction; when the ratio exceeded 0.5, it led to a sharp increase in capillary pore systems, strength degradation, and overly fragile interface structures, resulting in lower compressive strength. Finally, the specimens were divided into five groups: granite, mortar with a water–cement ratio of 0.3, mortar with a water–cement ratio of 0.5, composite specimens with a water–cement ratio of 0.3, and composite specimens with a water–cement ratio of 0.5, as shown in Fig. 1. Each group consisted of ten specimens, of which five were tested for gas permeability at room temperature, while the other five were subjected to real-time high-temperature gas permeability tests.
Table 1: Mix proportion of mortar.
| Component | Cement | Sand | Water |
|---|---|---|---|
| Proportion | 1 | 2.5 | 0.5 |
| 1 | 2 | 0.3 |
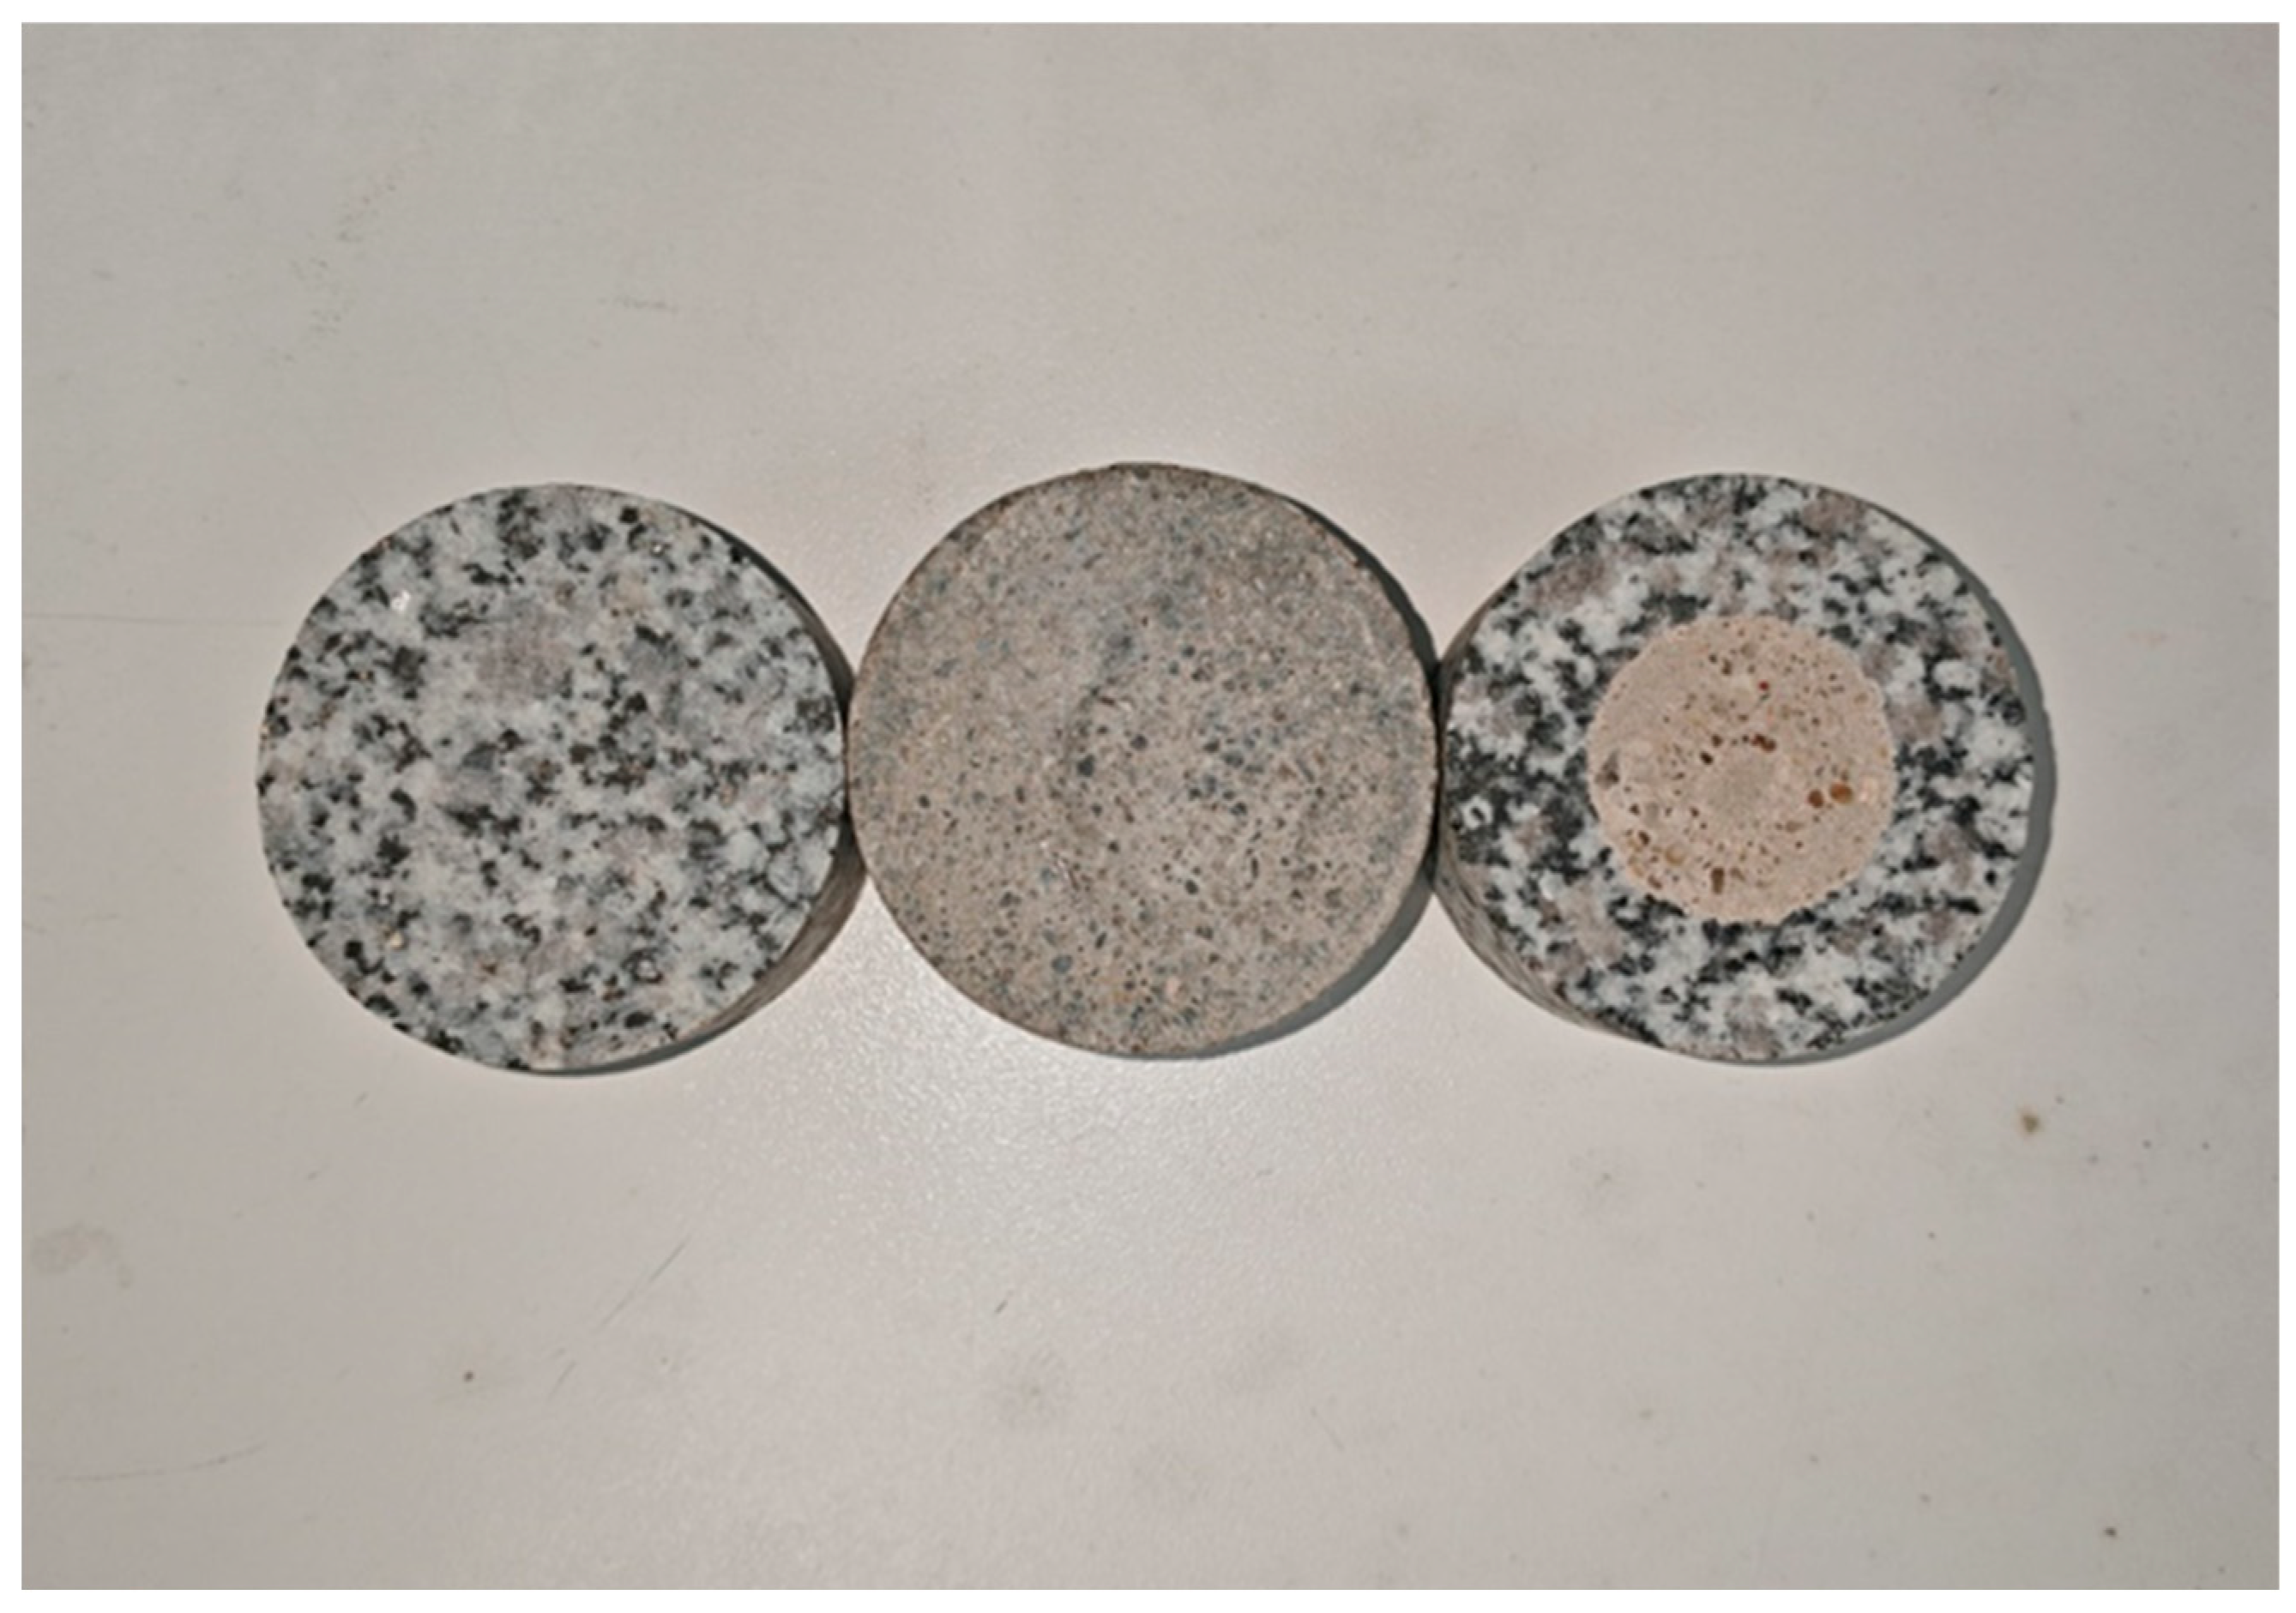
Figure 1: Granite, mortar, and composite specimens.
The high-level waste disposal repository currently employs a multi-barrier system, in which nuclear waste is stored in canisters, then wrapped in buffering materials such as concrete or bentonite on the outside, and finally placed inside the rock mass. During the geological disposal process of nuclear waste, radionuclides release heat, causing the surrounding rock mass temperature to rise. Based on the actual situation, this study designed a set of real-time temperature gradients (20°C, 60°C, 100°C, 150°C, 100°C, 60°C, 20°C) to observe the changes in permeability of the samples after exposure to high temperatures. In this experiment, a confining pressure of 3 MPa was applied using a servo-controlled loading system, and the specimens were tested for gas apparent permeability under three different inlet pressures (5 bar, 10 bar, and 15 bar), from which the intrinsic gas permeability under different confining pressures was derived. Under the original gas permeability experimental conditions, the pressure chamber was placed into an oven, where it was left for 12 h until the oven reached the set temperature, ensuring that the internal temperature of the pressure chamber stabilized before continuing with the gas permeability experiment. CT tests were conducted before and after the gas permeability tests to observe changes in the internal structure of the specimens.
In this experiment, the permeability of the specimens was studied by measuring the outlet flow rate method in the steady-state method. As shown in Fig. 2, a high-precision, highly sealed gas permeation system imported from France was used to conduct gas permeability experiments on five types of samples. Fig. 3 shows a simplified diagram of the experimental principle of this device. The instrument mainly consisted of a pressure chamber, a high-precision servo confining pressure loading device, a gas flow meter, a gas transmission control system, and a data acquisition system. The gas permeability measured by this instrument reached as low as 10−22 m2. The injected gas in this experiment was inert argon, whose viscosity coefficient was 2.25 × 10⁻⁵ Pa·s. The data acquisition system recorded the variation of gas pressure with time, and the gas flow meter displayed the real-time volumetric flow rate of the outlet gas.
The detailed testing procedure was as follows:
- (1)The specimen was placed at the center of the base of the pressure chamber. Gaskets were placed on the upper and lower surfaces, and the specimen was confined with a rubber sleeve and clamps. A sleeve was then fitted, hydraulic oil was poured into the chamber, and finally the top cover was installed, and the chamber was fixed with six bolts.
- (2)The confining pressure servo pump was started, the confining pressure was set to 3 MPa, and the rate was adjusted to 20 mL/min.
- (3)The pressure chamber was placed in an oven. After the confining pressure rose to the set value, the oven temperature was adjusted. The thermal gradient was sequentially set to 20°C, 60°C, 100°C, 150°C, 100°C, 60°C, and 20°C.
- (4)At each temperature, the apparent gas permeability of the specimen was tested under three different inlet pressures (5 bar, 10 bar, and 15 bar), from which the intrinsic gas permeability was derived.
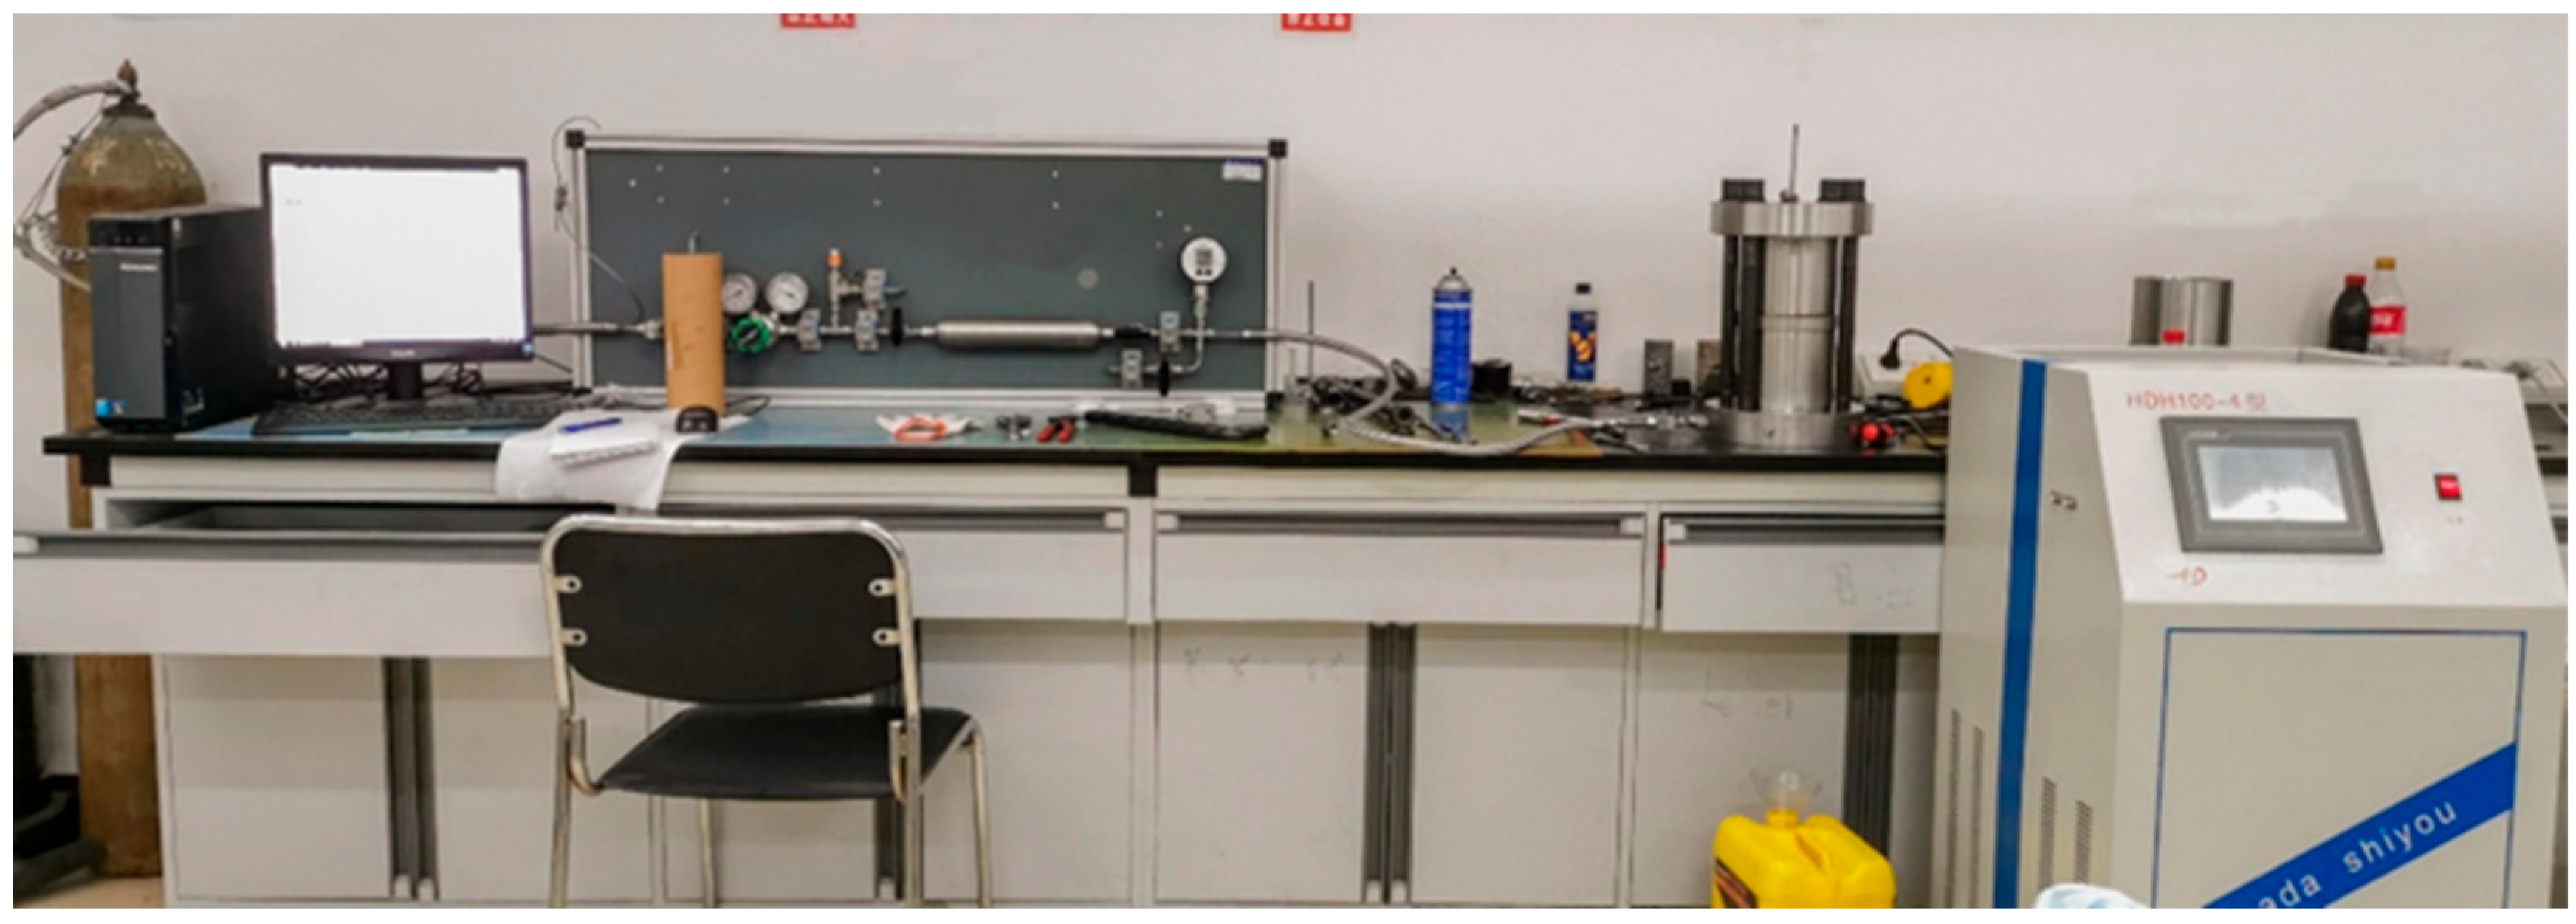
Figure 2: Gas permeation equipment.
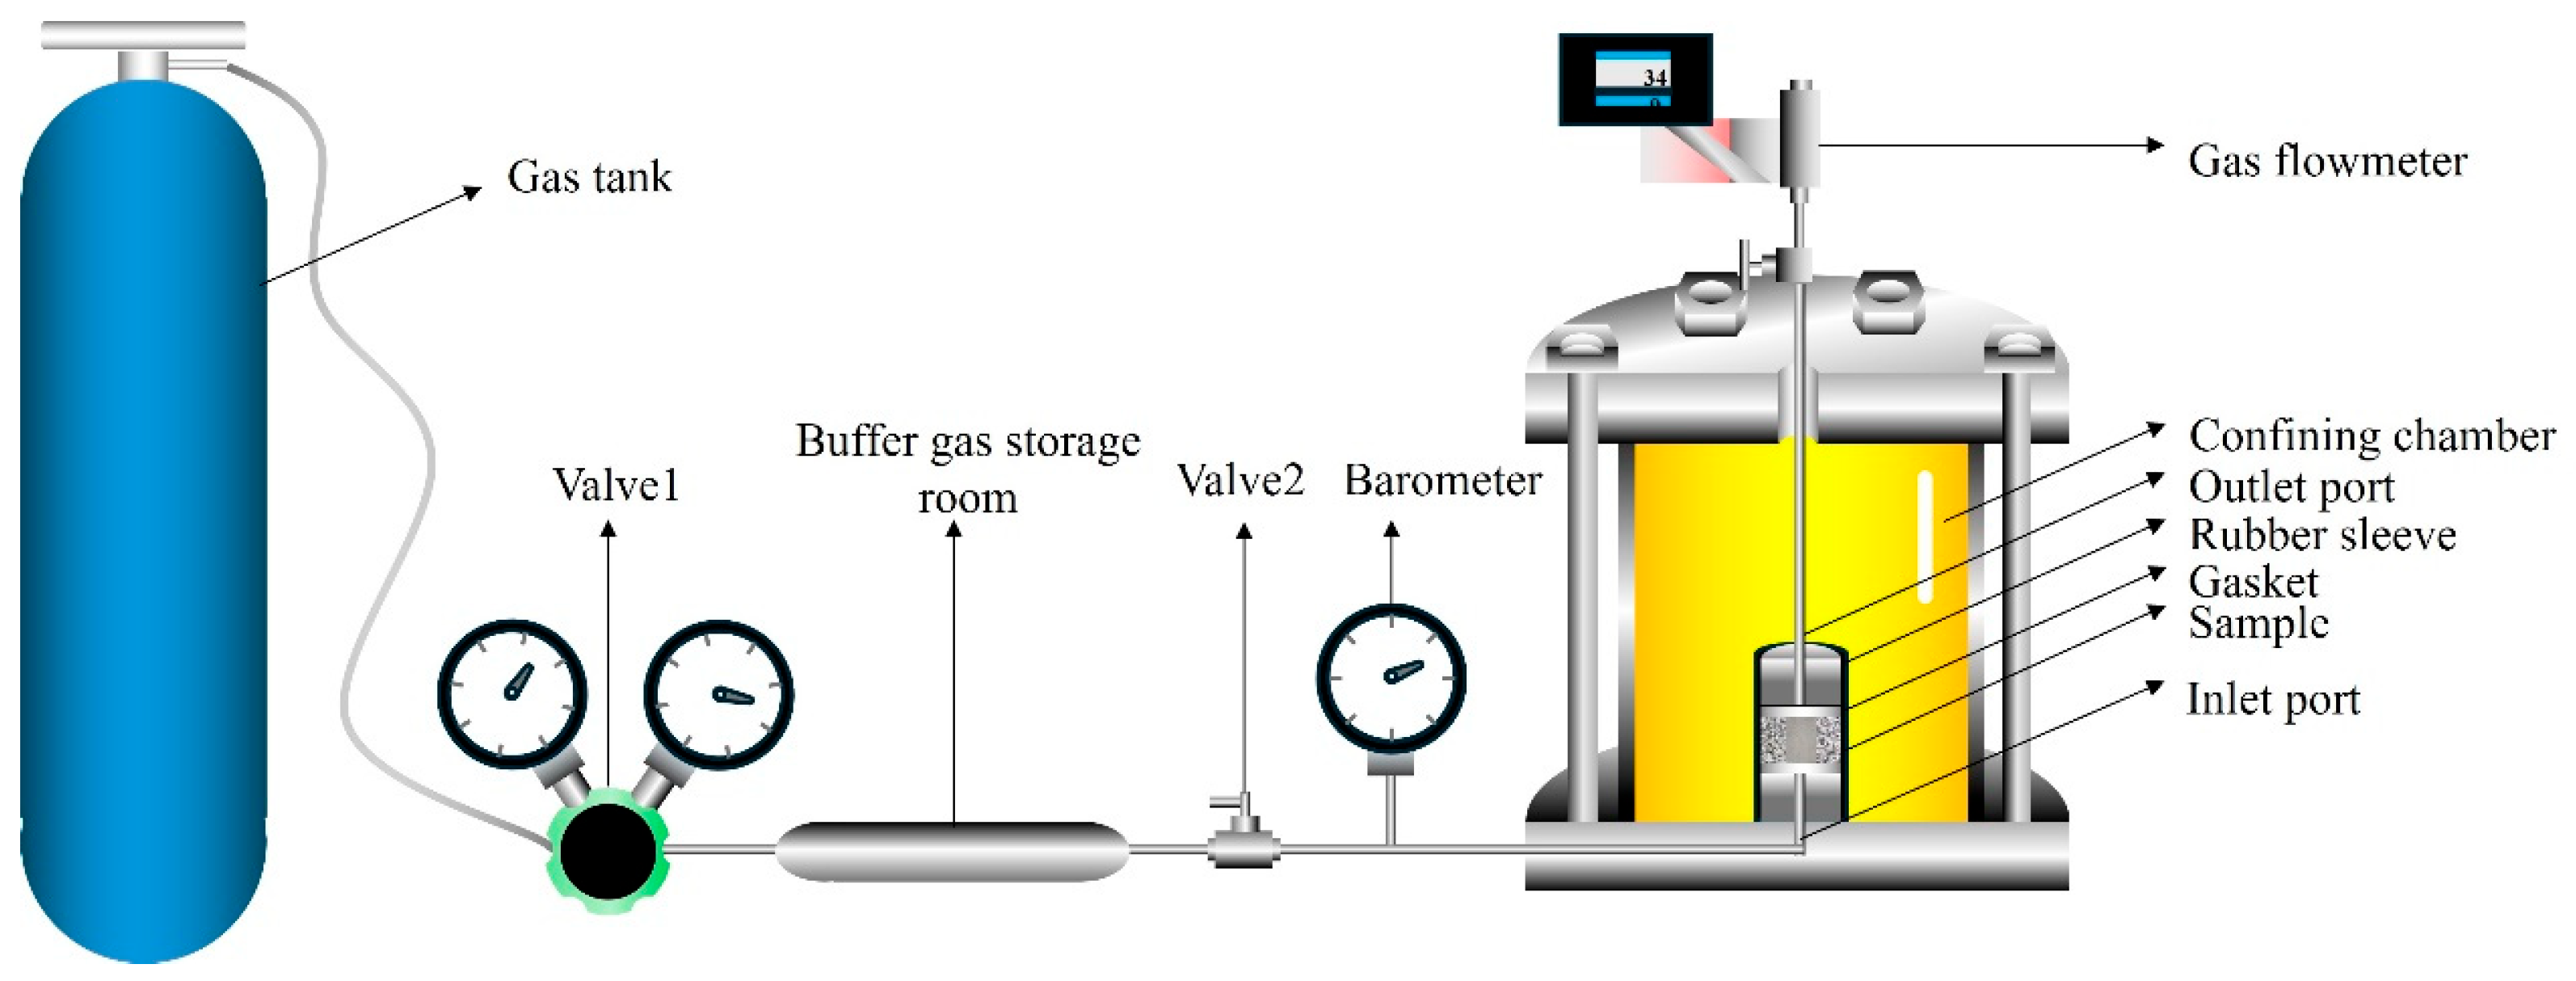
Figure 3: Schematic diagram of the experiment.
For measuring gas permeability, the steady-state flow approach based on Darcy’s law is used:
According to the study of Dana and Skoczylas [28], the distribution of compressible gas in porous media obeyed the following function:
In the equation, P(0, t) = Pini, which is the initial injection pressure at the inlet; P(h, t) = P0, which is the outlet pressure equal to the atmospheric pressure P0. By differentiating Eq. (2) and substituting x = h, one obtains:
By combining Eqs. (1) and (3), the permeability coefficient is calculated as follows:
In the formula, h is the height of the specimen; P0 is the air pressure.
According to classical fluid dynamics, the viscosity of a fluid near the pipe wall significantly influences flow behavior. Fluid velocity approaches zero at the pipe wall due to viscous shear, while it reaches a maximum at the center of the pipe. However, when the mean free path of gas molecules becomes comparable to or exceeds the characteristic pore size, the velocity distribution deviates from this classical profile. Unlike liquids, gas molecules do not form a thin adsorption layer along the pore walls, resulting in diminished velocity gradients across the flow field. To account for this phenomenon—commonly referred to as the gas slip effect—Klinkenberg et al. [29] introduced a slip correction factor, denoted as β. By incorporating this factor, Eq. (4) is modified to calculate the specimen’s intrinsic gas permeability, as follows:
2.2.2 Microscopic-Scale Detection
To evaluate the effect of real-time high temperature on the permeability of the granite–mortar interface, first, we used the TESCAN CLARA ultra-high-resolution field emission scanning electron microscope, produced by TESCAN (Brno, Czech Republic), to perform microstructural characterization of the samples before and after the experiment (Fig. 4a). Next, we used the MesoMR23-060H-I nuclear magnetic resonance imaging analyzer, produced by Niumag Corporation (Suzhou, China), is used to conduct low-field NMR tests to conduct low-field nuclear magnetic resonance tests on the specimens (Fig. 4b). Low-field NMR technology utilizes the resonance of hydrogen nuclei in water under a magnetic field and the resulting signal characteristics to detect their distribution as well as the physical properties of the medium. During the NMR process, the relaxation time reflected the pore size. Therefore, the transverse relaxation time (T2) spectrum was used to characterize the pore structure of the specimens. In addition, scanning electron microscopy (SEM) monitoring was carried out on the composite specimens after high-temperature experiments, and the results directly revealed the internal conditions of the samples. Furthermore, CT scanning was performed to analyze the failure mechanism and damage degradation mechanism of the specimens. The experiment used the nanoVoxel-5000 series dual X-ray source CT system, produced by Sanying Precision Instruments Co., Ltd. (Tianjin, China) (Fig. 4c). X-ray computed tomography (CT) technology realized three-dimensional visualization of the internal structure of the specimens. By acquiring the matrix of X-ray attenuation values at different projection angles, grayscale images reflecting the internal structure of the specimens were reconstructed [30]. The voxel resolution of the obtained CT images was 19.97 μm × 19.97 μm. The grayscale values of the images were positively correlated with the material density, where low-density areas (such as pores) appeared as black pixels and high-density areas (such as mineral phases) appeared as white pixels. Typical images showed that the granite region exhibited a homogeneous distribution of white pixels, indicating its highly compact structure; in the mortar region, a pronounced clustering of black pixels is observed, which suggests the presence of pores within the mortar matrix. The professional imaging software AVIZO was used to reconstruct three-dimensional digital models, which were further employed to quantitatively characterize the porosity and crack volume fraction in the granite–mortar interfacial region.
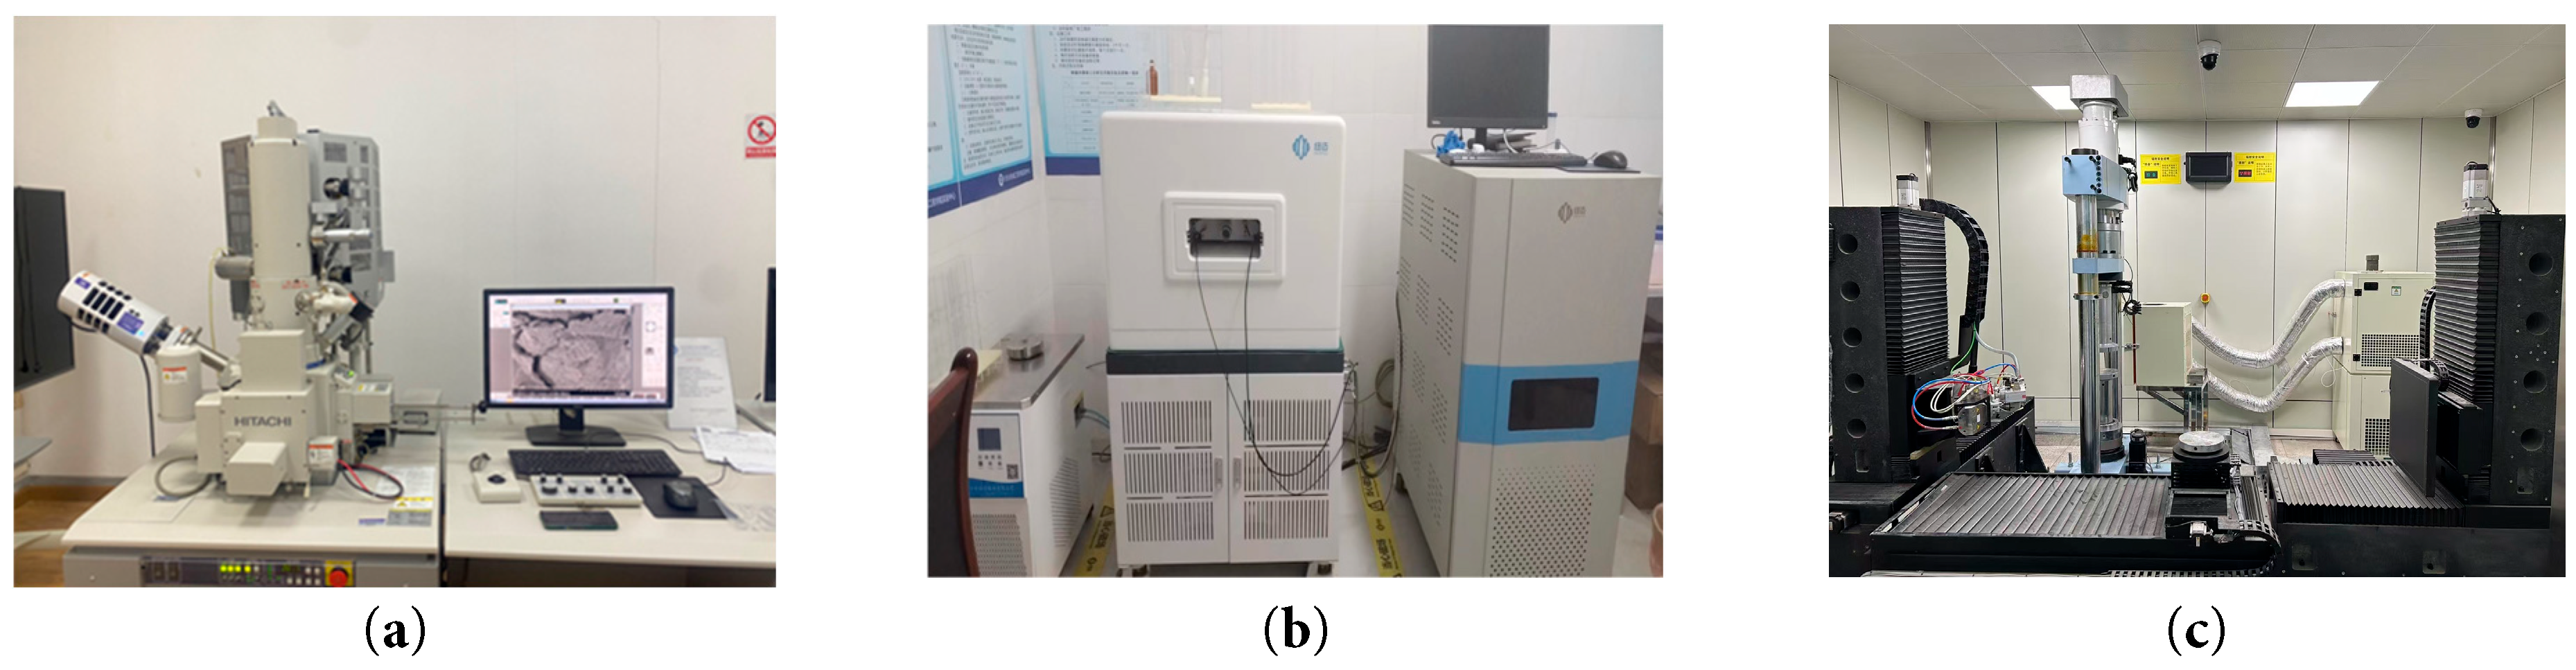
Figure 4: Microscopic experimental instruments: (a) SEM, (b) NMR, (c) CT.
3.1.1 Room-Temperature Permeability Results
First, gas permeability tests are conducted on five types of materials at room temperature, with three parallel specimens prepared for each material. Table 2 presents the permeability test results. The permeability of granite consistently remains at the order of 10−19 m2, nearly two orders of magnitude lower than that of the other materials, indicating that the gas permeability of granite is negligible compared with the others. At the same time, the dispersion of gas permeability in granite is small, reflecting a highly stable internal pore structure. In contrast, the intrinsic permeability of cement mortar and granite–mortar composite specimens exhibits significant dispersion, without the structural stability of granite; in some cases, the difference in intrinsic permeability among specimens is nearly one order of magnitude. This showed that mortar and composite specimens possessed more complex pore structures compared with granite specimens.
By comparing the permeability of cement mortars with different water–cement ratios (0.3 and 0.5), the permeability of the 0.5 water–cement ratio mortar is significantly higher than that of the 0.3 ratio mortar. This phenomenon was attributed to the higher water–cement ratio, which increased the porosity of mortar, provided more space for gas flow, and ultimately resulted in higher permeability [31]. However, for granite–mortar composite specimens, the difference in permeability between the two water–cement ratios (0.3 and 0.5) is less than one order of magnitude, indicating that the influence of the water–cement ratio on the gas permeability of composites at room temperature is relatively limited.
Furthermore, when comparing cement mortar specimens and composite specimens with the same water–cement ratio, the permeability of the composite specimens is consistently higher than that of the corresponding mortar specimens. This clearly revealed that preferential seepage channels existed in the granite–mortar interfacial region. Yang et al. [21] conducted gas permeability tests on sandstone, magnesium phosphate cement, and sandstone-cement composites at room temperature. They found that the overall permeability of the sandstone-cement composite exceeded that of both the intact sandstone and magnesium phosphate cement samples, indicating that gas tends to flow through the interface, which is consistent with the experimental results.
Table 2: Specimen permeability at room temperature.
| Types of Specimens | Apparent Permeability Coefficient (m2) | Inherent Permeability Coefficient (m2) | ||
|---|---|---|---|---|
| 5 bar | 10 bar | 15 bar | ||
| Granite | 4.91 × 10⁻¹⁹ | 3.86 × 10⁻¹⁹ | 3.29 × 10⁻¹⁹ | 2.51 × 10⁻¹⁹ |
| 4.54 × 10⁻¹⁹ | 3.45 × 10⁻¹⁹ | 3.11 × 10⁻¹⁹ | 2.32 × 10⁻¹⁹ | |
| 4.11 × 10⁻¹⁹ | 2.78 × 10⁻¹⁹ | 2.42 × 10⁻¹⁹ | 1.50 × 10⁻¹⁹ | |
| Mortar (w/c = 0.3) | 2.85 × 10⁻¹⁷ | 2.61 × 10⁻¹⁷ | 2.43 × 10⁻¹⁷ | 2.79 × 10⁻¹⁷ |
| 2.27 × 10⁻¹⁷ | 1.55 × 10⁻¹⁷ | 1.25 × 10⁻¹⁷ | 9.46 × 10⁻¹⁸ | |
| 1.23 × 10⁻¹⁷ | 8.93 × 10⁻¹⁸ | 6.22 × 10⁻¹⁸ | 4.66 × 10⁻¹⁸ | |
| Mortar (w/c = 0.5) | 2.45 × 10⁻¹⁷ | 2.08 × 10⁻¹⁷ | 1.71 × 10⁻¹⁷ | 1.22 × 10⁻¹⁷ |
| 2.26 × 10⁻¹⁷ | 1.87 × 10⁻¹⁷ | 1.72 × 10⁻¹⁷ | 1.37 × 10⁻¹⁷ | |
| 1.79 × 10⁻¹⁷ | 1.53 × 10⁻¹⁷ | 1.43 × 10⁻¹⁷ | 1.23 × 10⁻¹⁷ | |
| Composite (w/c = 0.3) | 9.57 × 10⁻¹⁷ | 8.12 × 10⁻¹⁷ | 7.31 × 10⁻¹⁷ | 6.37 × 10⁻¹⁷ |
| 8.59 × 10⁻¹⁷ | 7.49 × 10⁻¹⁷ | 7.01 × 10⁻¹⁷ | 6.34 × 10⁻¹⁷ | |
| 5.45 × 10⁻¹⁷ | 3.95 × 10⁻¹⁷ | 3.53 × 10⁻¹⁷ | 2.54 × 10⁻¹⁷ | |
| Composite (w/c = 0.5) | 1.66 × 10⁻¹⁶ | 1.51 × 10⁻¹⁶ | 1.43 × 10⁻¹⁶ | 1.33 × 10⁻¹⁶ |
| 1.36 × 10⁻¹⁶ | 1.14 × 10⁻¹⁶ | 1.20 × 10⁻¹⁶ | 1.07 × 10⁻¹⁶ | |
| 8.45 × 10⁻¹⁷ | 7.95 × 10⁻¹⁷ | 7.53 × 10⁻¹⁷ | 7.18 × 10⁻¹⁷ | |
3.1.2 Real-Time High-Temperature Permeability Results
Based on the intrinsic gas permeability data of the five materials measured under real-time temperature conditions, the evolution curves with temperature are plotted, as shown in Fig. 5. The permeability of granite fluctuates only slightly with temperature, and its value remains stable at the order of 10−19 m2, which indicates that within the temperature range of 20°C to 150°C, the permeability of granite does not reach the threshold temperature at which significant changes occur. This is because 150°C is well below the dehydration onset temperature of mica (200–300°C), the α-β phase transition of quartz (573°C), and large-scale lattice breakdown (above 600°C) for granite.
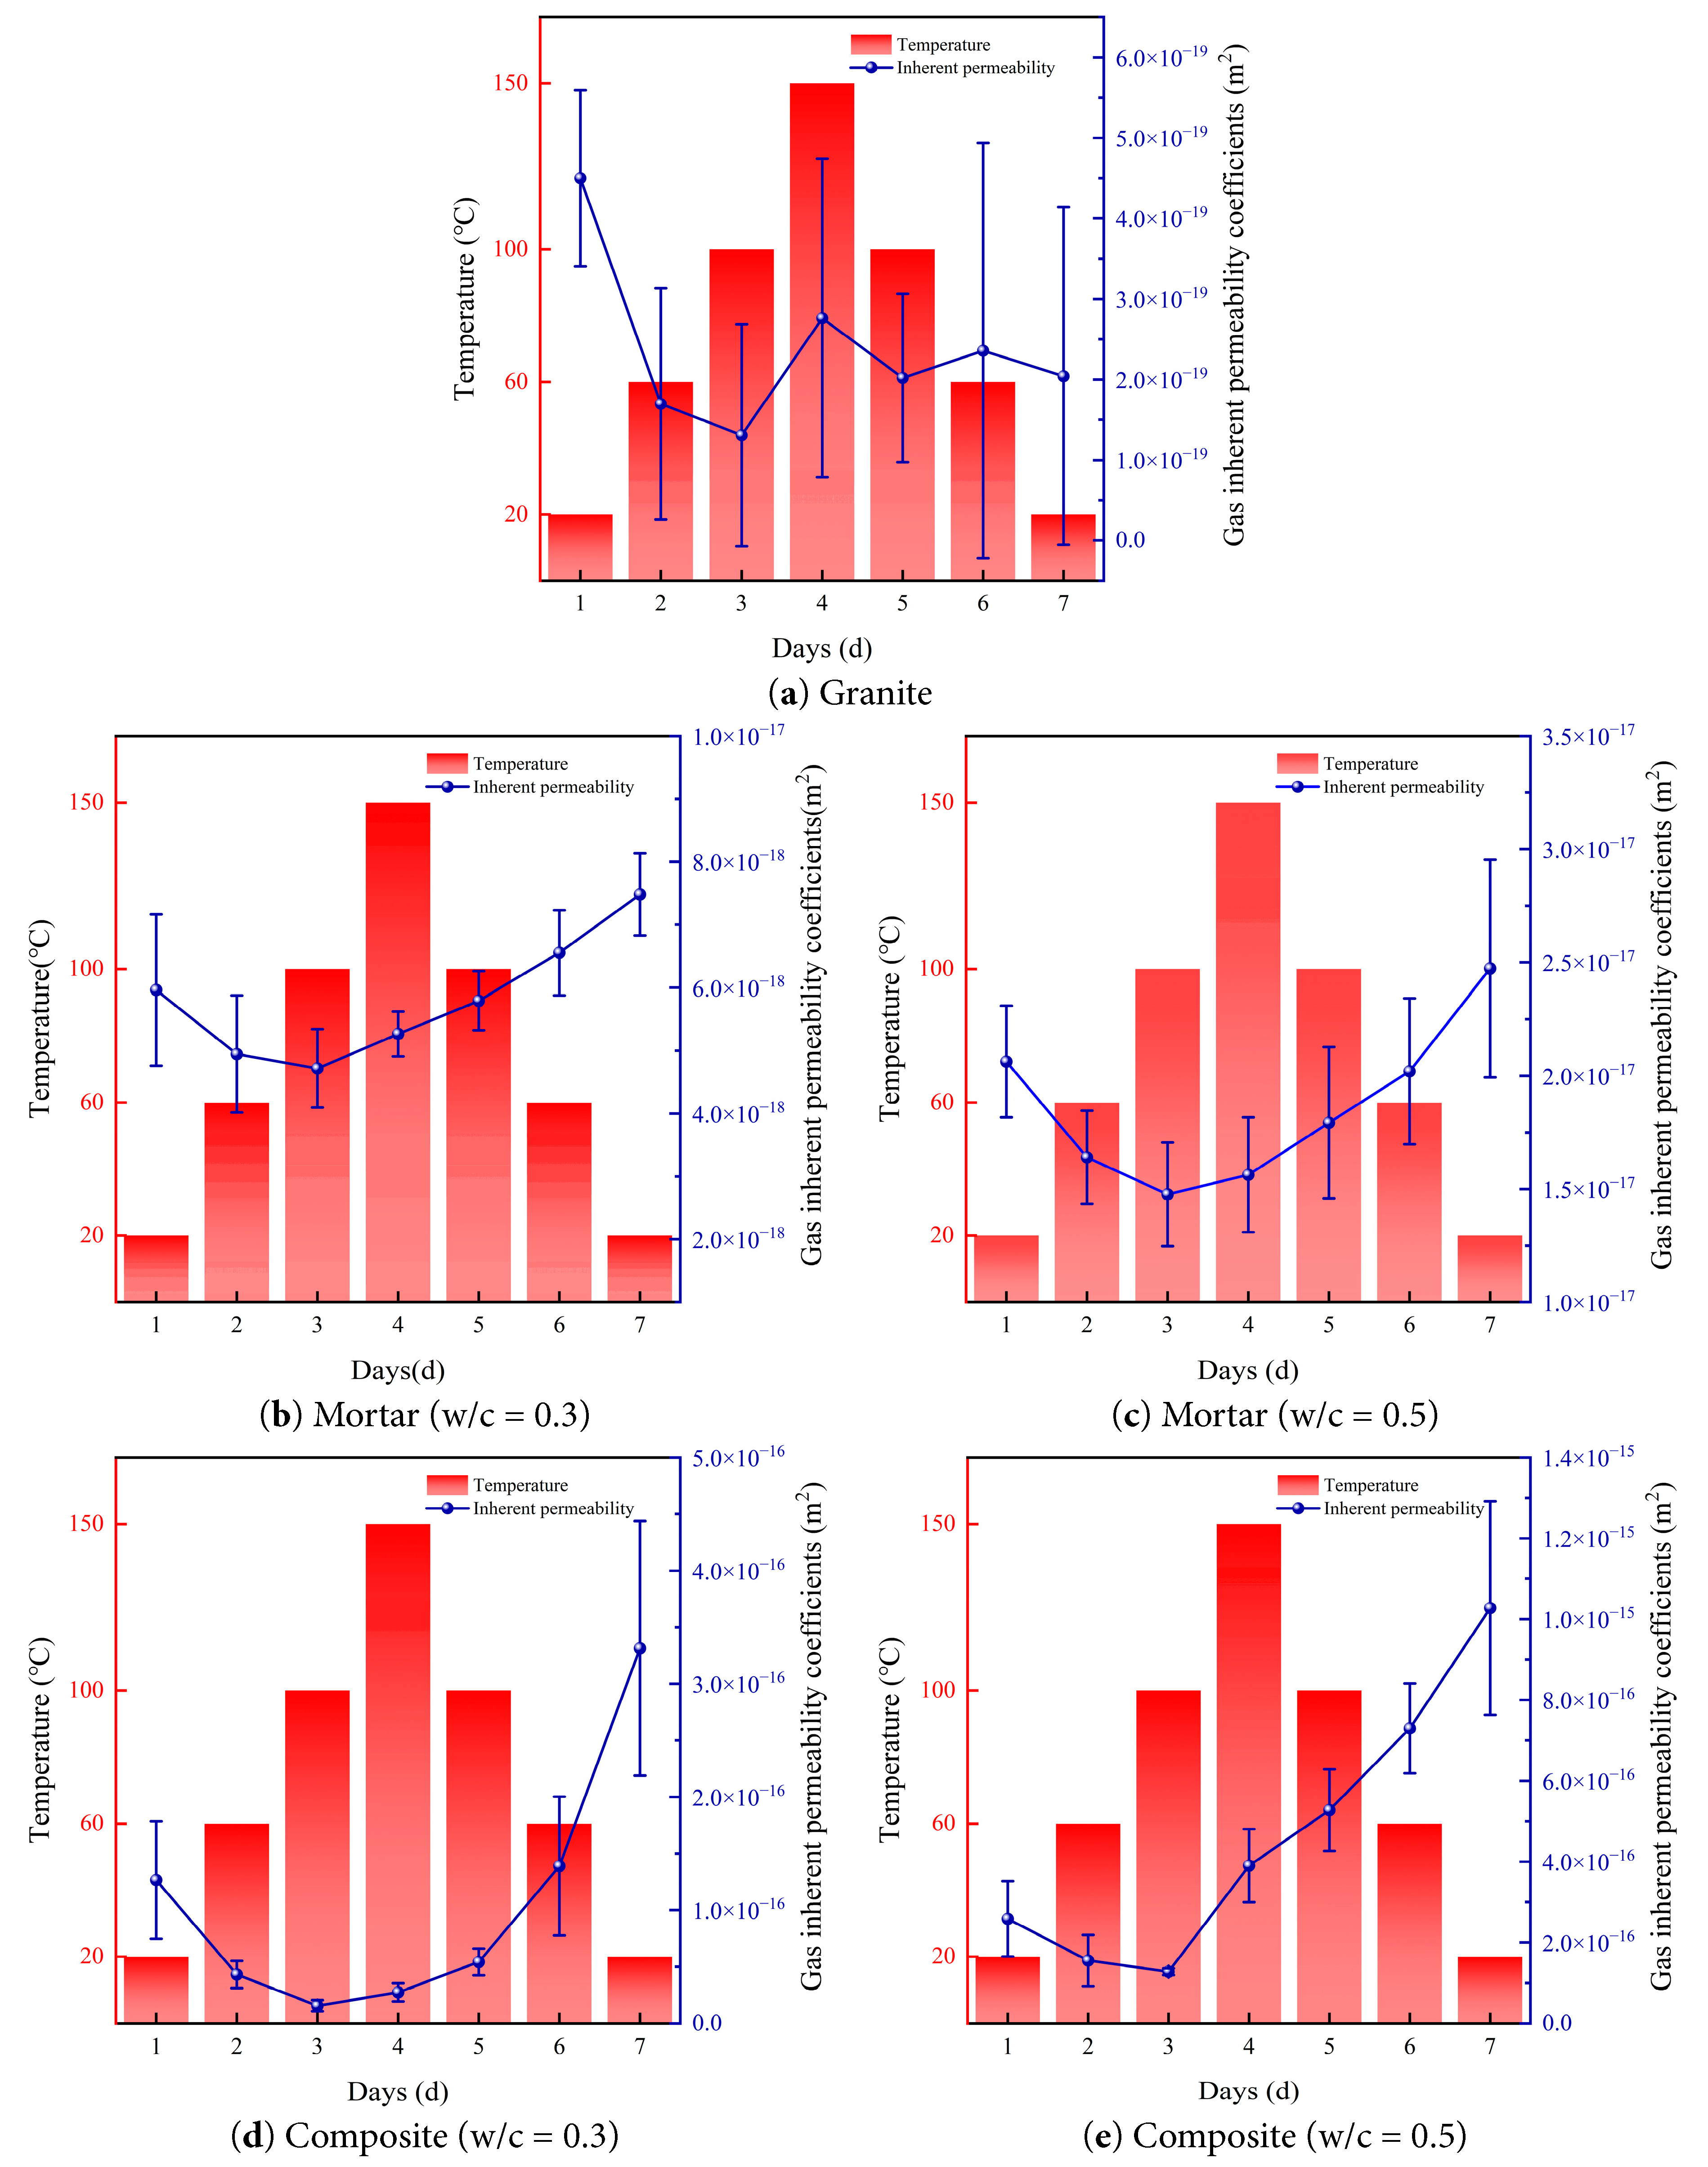
Figure 5: Relationship between intrinsic permeability and temperature.
For cement mortar specimens, the intrinsic gas permeability decreases as the temperature rises from 20°C to 100°C, and then increases as the temperature rises from 100°C to 150°C. When the temperature decreases from 150°C to 20°C, the permeability continues to increase. During the heating process, the permeability does not decrease monotonically but shows an obvious inflection point around 100°C, which indicates that 100°C constitutes a threshold temperature where the permeability behavior of mortar changes during heating.
As shown in Fig. 6, the permeability of mortars with different water–cement ratios differs under the same temperature. Specifically, the permeability of mortar with a water–cement ratio of 0.5 is greater than that of mortar with a ratio of 0.3, and the magnitude of increase and decrease between different temperatures for the 0.5 mortar is smaller than that of the 0.3 mortar. This was because, as the water–cement ratio increased at the same temperature, the porosity of mortar increased, which provided more space for thermal deformation of mortar. The permeability of mortar gradually decreases between 20°C and 100°C, increases between 100°C and 150°C, and continues to increase during cooling from 150°C back to room temperature. Between 20°C and 60°C, the permeability decreases significantly. This occurred because as the temperature increased, the mortar gradually expanded, particles squeezed each other, and pore radii decreased [32]. From 60°C to 100°C, the rate of decrease is smaller, which is because pore radii further decreased or even closed. Between 100°C and 150°C, the mortar continued to expand, mineral particles squeezed against each other and slipped, and cracks formed inside the mortar. At the same time, calcium silicate hydrate gel began to dehydrate, forming numerous micro-throats to facilitate gas flow [33,34]. During cooling from 150°C to room temperature, the mortar shrank, previously closed pores reopened, and microcracks that had formed increased porosity. As a result, the permeability of mortar upon returning to room temperature was greater than its initial value.
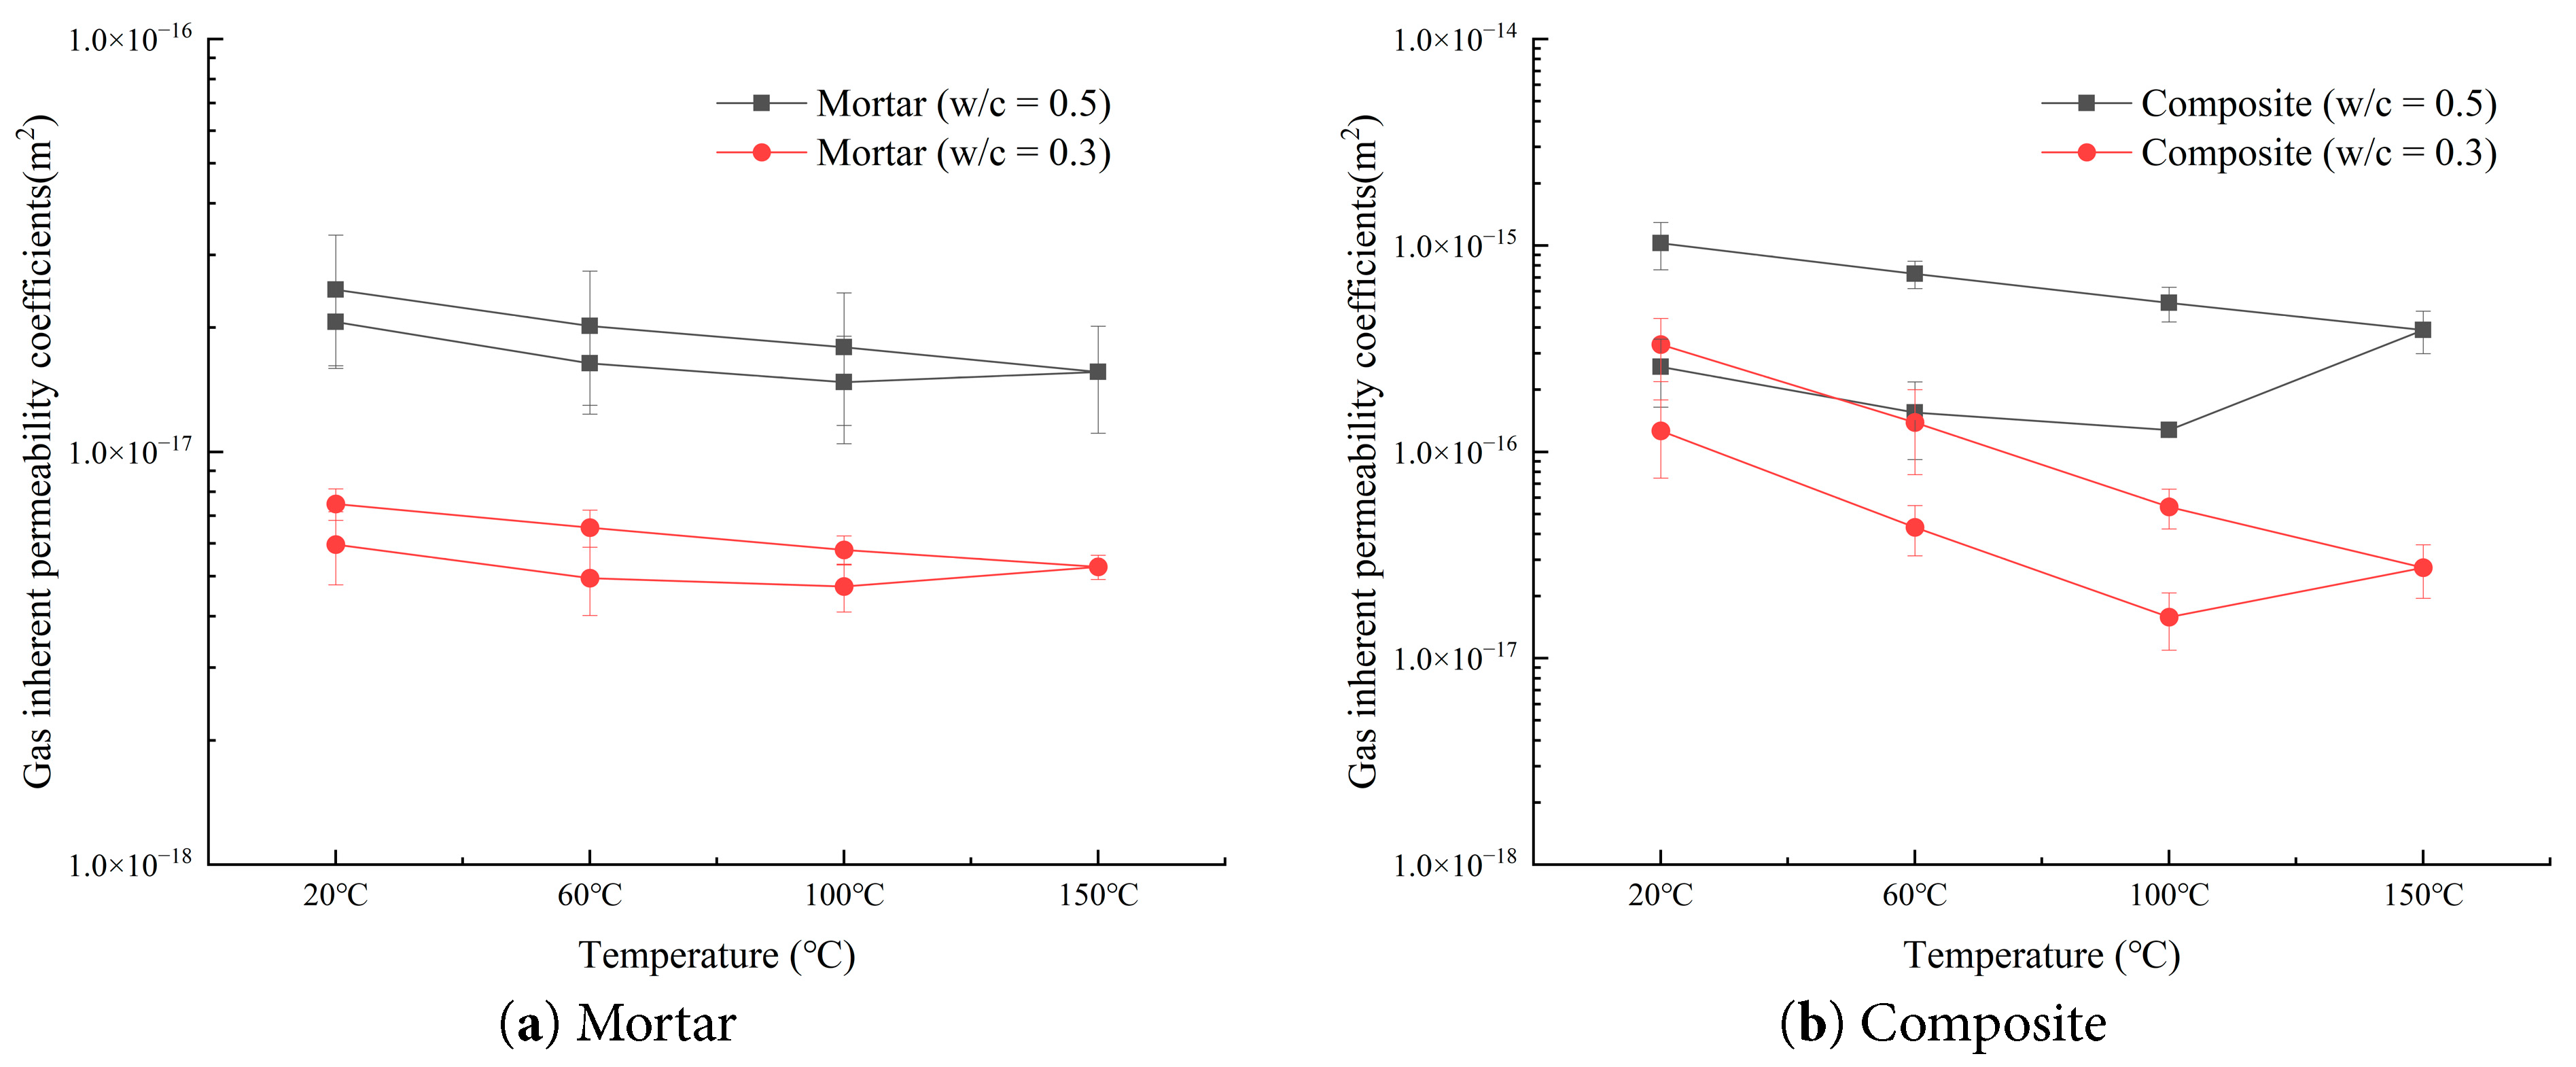
Figure 6: Comparison of intrinsic permeability of mortar and composite specimens with different water–cement ratios.
The intrinsic gas permeability of granite–mortar composite specimens shows the same overall trend as mortar specimens: it decreases from 20°C to 100°C, increases from 100°C to 150°C, and continues to increase from 150°C back to 20°C. After a complete thermal cycle, the intrinsic gas permeability of both mortar and composite specimens is higher than their initial values. The underlying mechanism was that under high temperature, thermal expansion of mineral particles in mortar generated significant tensile and compressive stresses. These stresses continuously acted on the walls of pores and microcracks, promoting their propagation, coalescence, and initiation. This caused structural deterioration inside the mortar, producing new microcracks and micropores, which significantly increased effective flow paths. At the macroscopic scale, this was reflected as an irreversible increase in intrinsic gas permeability [35].
The amplitude of permeability decrease and increase of composite specimens is larger than that of mortar specimens, particularly at 100°C during heating. Under the same water–cement ratio, the permeability variation values of 0.5 mortar at real-time temperatures of 20°C, 60°C, 100°C, 150°C, 100°C, 60°C, and 20°C are −20.52%, −9.96%, 5.87%, 14.71%, 12.64%, and 22.44%, respectively; while those of 0.5 composite specimens are −39.92%, −17.74%, 205.48%, 35.21%, 38.37%, and 40.79%, respectively. During cooling, the permeability is significantly higher than that at the corresponding points before heating. The figure also shows the influence of water–cement ratio on the thermally induced permeability change of composites. The intrinsic permeability of 0.3 composites is more sensitive to temperature, with variation values of −65.90%, −63.32%, 73.89%, 96.73%, 156.49%, and 138.48%, respectively. During heating, both mortar and composite specimens exhibit a very clear threshold effect at 100°C (a phenomenon where, once external conditions reach a critical value, the internal structure of the material undergoes abrupt damage, leading to nonlinear increases in properties). The inflection of permeability around 100°C is not coincidental, but rather the result of multiple mechanisms being triggered simultaneously: (1) the substantial release of bound water and capillary free water; (2) the onset of thermal expansion differences becoming dominant; (3) the merging of micropores and their transformation into connected pores, widening the flow paths. This indicated that in the heating process, the mortar part of the composites played a dominant role. From 20°C to 100°C, the decrease of composite permeability is greater than that of mortar, which indicates that the internal pore structure of composites was larger than that of mortar. Since the overall permeability of composites is greater than mortar, and granite’s permeability is two orders of magnitude lower and thus negligible, this further proved that the interface acted as the main gas flow channel, which was compressed in this stage. As heating continued to 150°C, due to different thermal expansion coefficients of granite and mortar [36,37,38], thermal stresses were generated at their interface, leading to cracks, increased porosity, and hence increased permeability of composites. During cooling to room temperature, both granite and mortar shrank, thermal stresses gradually dissipated, and interfacial cracks continued to propagate, which caused composite permeability to increase continuously. In the cooling process, the permeability of both mortar and composite specimens increases steadily without abrupt changes. Finally, when restored to 20°C, the increments of intrinsic permeability compared with the initial values are 25.43% for 0.3 mortar, 19.87% for 0.5 mortar, 161.72% for 0.3 composites, and 297.68% for 0.5 composites. This indicated that both mortar and composite specimens undergo irreversible permeability increases, and the increase for composites is much larger than that for mortars.
After high-temperature treatment, the minerals in mortar and granite undergo significant physical and chemical changes. Previous studies showed that biotite in granite starts to decompose at around 200°C, while C–S–H, Ca(OH)2, calcite, and ettringite in mortar decompose within different temperature ranges. Based on existing experience of thermal analysis of cement hydration products, it was generally considered that free water and evaporable water in cement-based materials were eliminated between 30–110°C [39,40]. C–S–H started to decompose at about 110°C; Ca(OH)2 decomposed between 400°C and 600°C, releasing water molecules; CaCO3 decomposed between 600°C and 800°C, producing CO2 molecules. When present in dry cement paste, ettringite started to decompose between 70°C and 75°C [41]. This led to the formation of monosulfoaluminate, which in turn led to the formation of hydrogarnet and anhydrite above 85–90°C [42,43].
Before the experiment, the composite specimens are dried at 60°C until mass stabilization, then they are ground into mortar and granite powders, and finally tested using a NETZSCH TG 309 Libra thermal analyzer. Fig. 7 shows the thermogravimetric (TG) and derivative thermogravimetric (DTG) curves of both materials. Granite only loses 0.58% of its mass throughout the process, indicating that it remains stable under high temperature. The TG–DTG curves of mortars with different water–cement ratios exhibit similar trends. When heated up to 1000°C, the mass loss of mortar mainly occurs in three stages, which is consistent with previous studies. The first stage occurs between 110°C and 200°C, during which the mortars lose 1.37% and 1.48% of their mass, which was attributed to the loss of bound water from hydration products such as C–S–H. The second stage occurs between 400°C and 500°C, during which the mortars lose 1.26% and 1.18% of their mass, which was attributed to the decomposition of Ca(OH)2. The third stage occurs within the range of 600–740°C, and the mass loss was considered to be caused by the decomposition of CaCO3 into CaO and CO2 at high temperature.
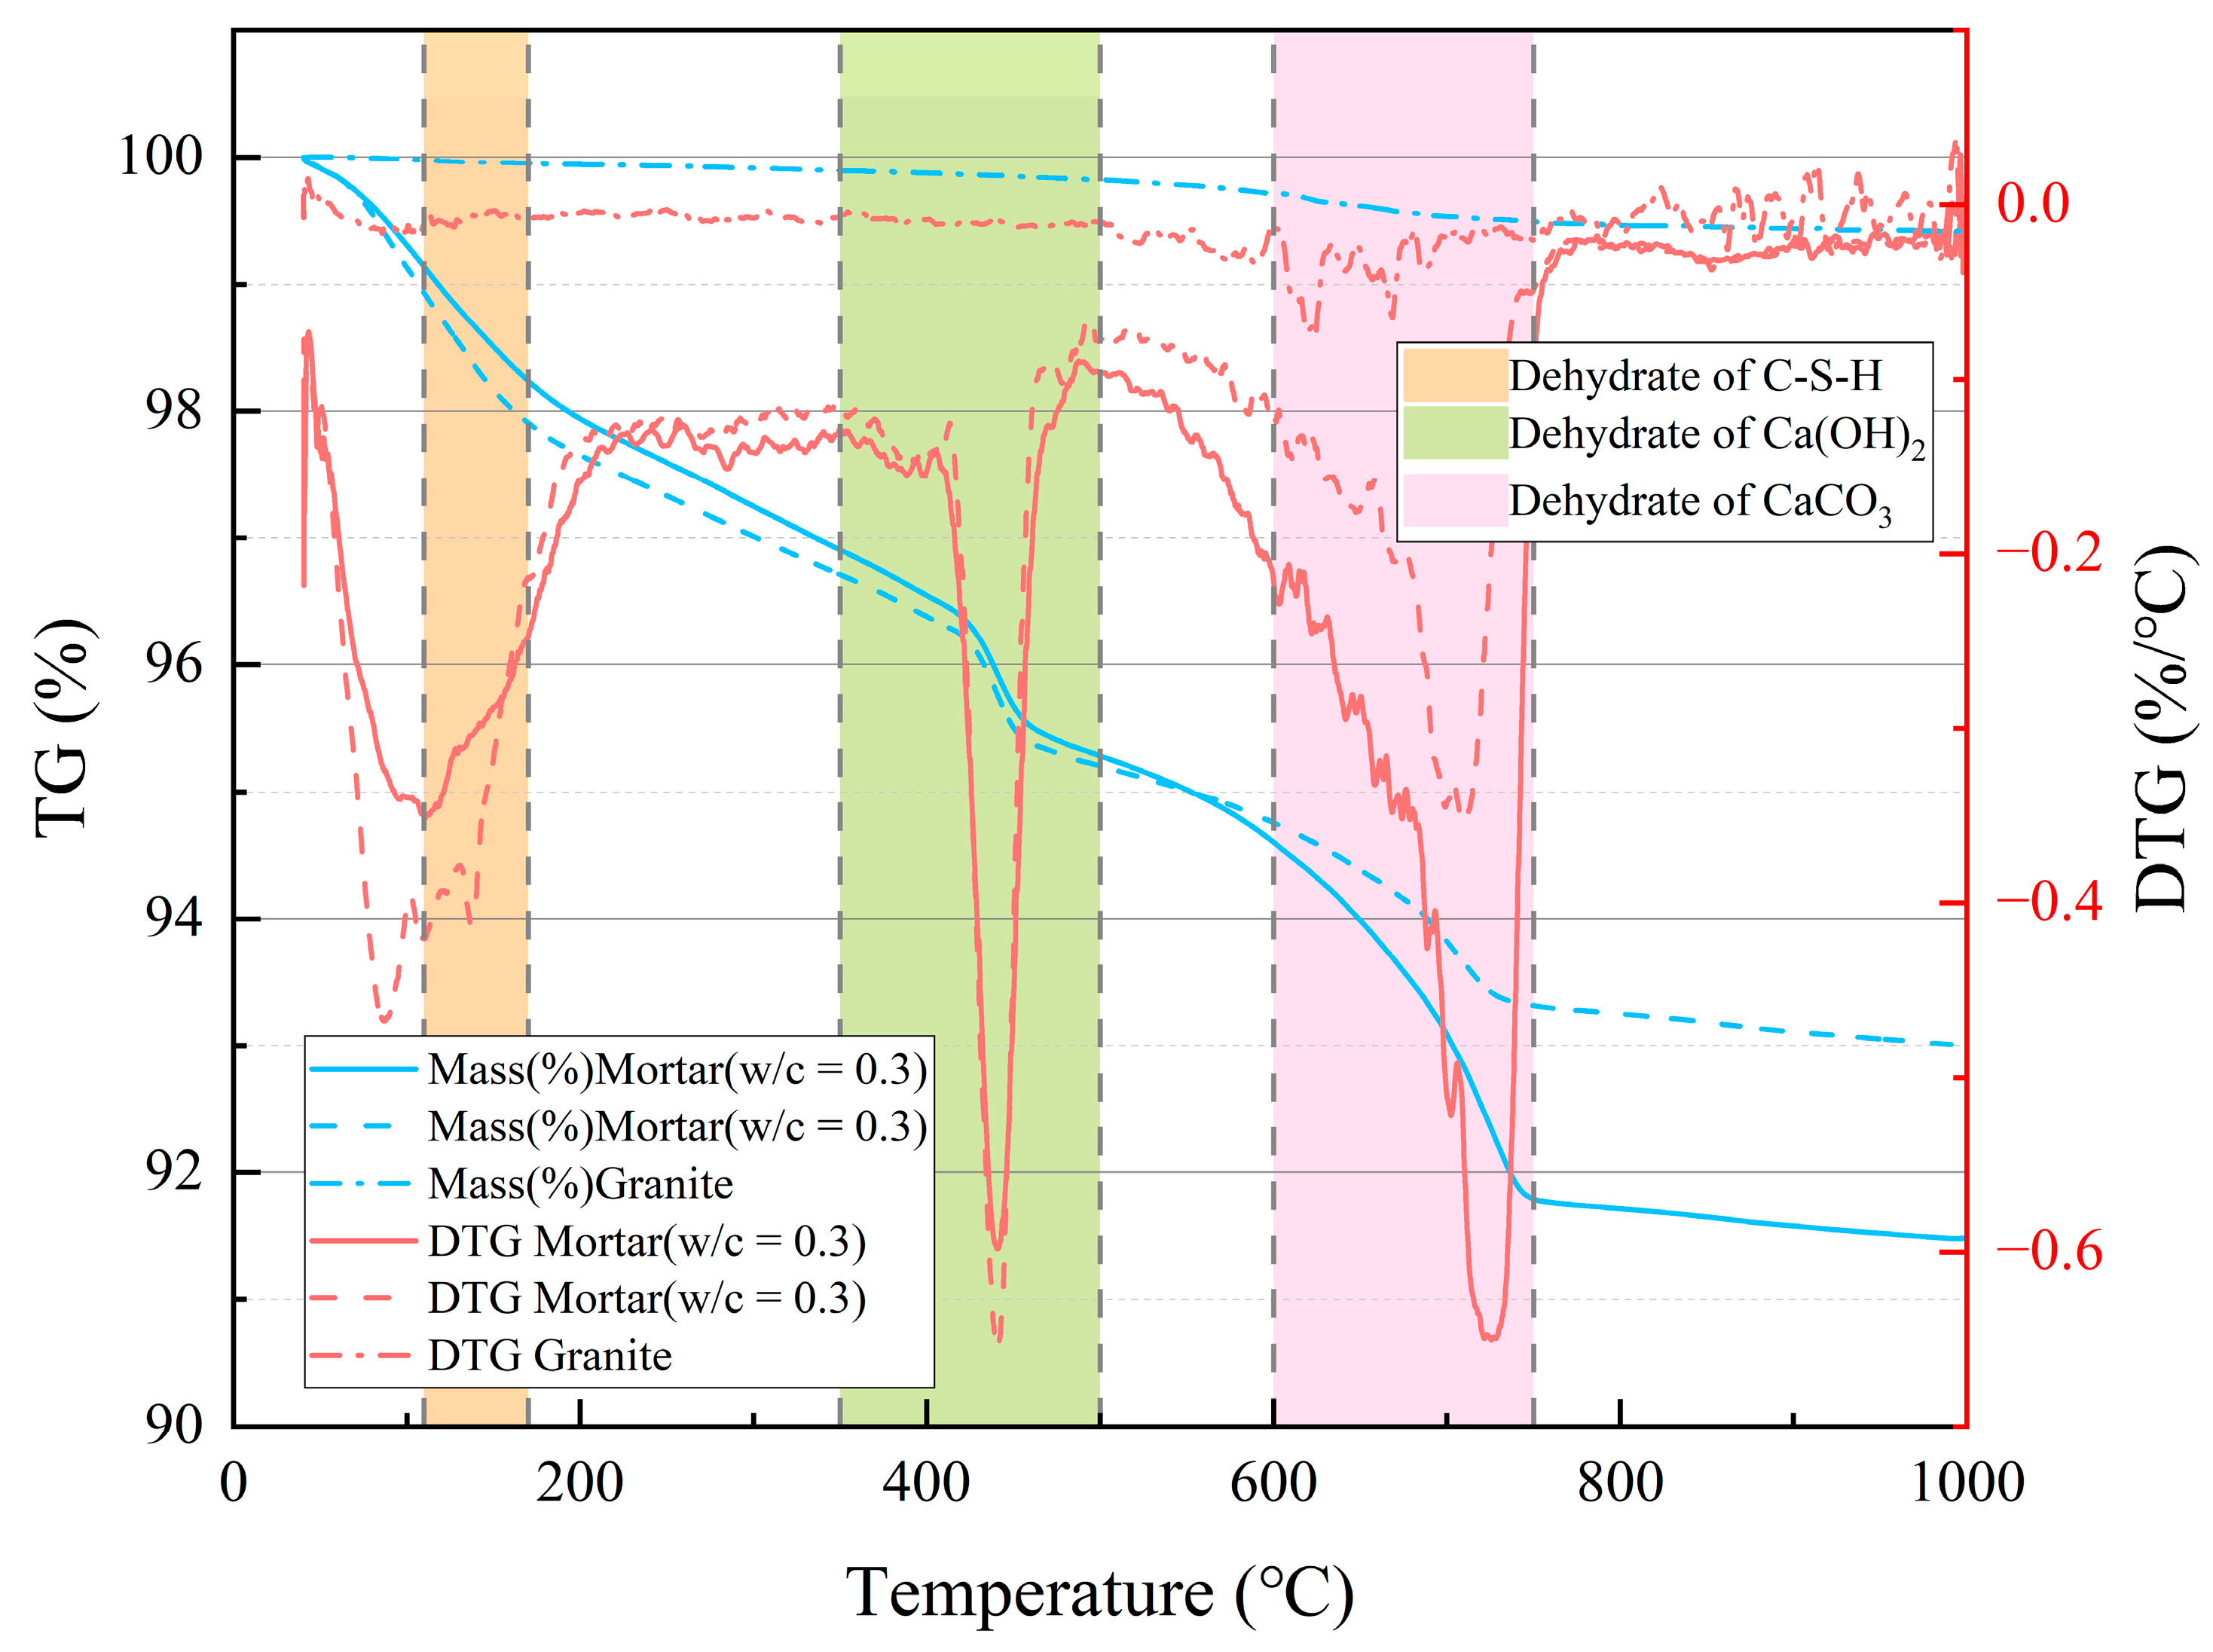
Figure 7: TG–DTG curves of mortar and granite.
To elucidate the mechanisms underlying the permeability evolution described in Section 3.1.2 and to clarify the microstructural degradation of the granite–mortar interface under real-time high temperatures, scanning electron microscopy (SEM) was performed on the composite specimens after the permeability tests. Due to space limitations, typical specimens with a water–cement ratio of 0.3 are selected for detailed analysis. Fig. 8 shows the SEM morphologies of the mortar matrix, granite aggregate, and the interfacial transition zone (ITZ) before testing. The mortar region exhibits a typical agglomerated particle structure of hydration products, while the granite shows a highly dense lattice configuration. The interface presents significant irregularities, directly reflecting the contact state and permeability-related bonding characteristics between aggregate and cement paste. In the ITZ, heterogeneous particle mixing can be observed, where the overall distribution appears relatively uniform, but locally enriched particle zones are also present. This phenomenon was attributed to the edge effect induced by concentration gradients of chemical elements in the interfacial region. This effect led to significantly higher porosity of the cement paste near the aggregate surface compared to the inner matrix, which facilitated the directional migration of Ca2+, Al3+, and SO42− ions during cement hydration and further induced the selective enrichment of calcium silicate hydrate (C-S-H) in the vicinity of the aggregate interface [44].
When the interface region is magnified to 5000×, irregular cluster-like C-S-H gels with sizes ranging from 1–5 μm can be identified [45]. According to the classical study by Scrivener et al. [46], the intrinsic morphology of C-S-H was nanoscale foil-like structures, which self-assembled and stacked to form submicron-scale lamellar particles. After exposure to high temperature (Fig. 9), the interfacial morphology shows significant changes. The originally diffuse and blurred boundary transforms into a distinct, elongated fissure, and the degree of material detachment intensifies. The mortar microstructure presents obvious phase transformation characteristics, as the decomposition of hydration products under high temperature induces the precipitation of newly formed micron-sized particulate phases. In the initial state, the main layers of C-S-H consist of two silicate tetrahedral layers, forming an interlayer structure with a CaO plane in between (Fig. 10). The stacking of these main layers creates an interlayer structure [47]. The interlayers of C-S-H usually contain a large amount of water, and the loss of interlayer water in C-S-H leads to a reduction in the interlayer spacing. According to the study by Ma et al. [48], during the process from 30°C to 100°C, the interlayer spacing of C-S-H continuously decreases, indicating significant water loss from the interlayers. When the temperature exceeds 150°C, further temperature increases have little effect on the interlayer spacing. The thermal damage process also promotes the evaporation and release of both physically adsorbed water and chemically bound water in mortar, which exposes the capillary pore network previously occupied by water molecules, forming more angular granular structures. On the granite aggregate surface, microcracks and pore proliferation appear. This was caused by a brittle fracture of the crystal lattice under thermal stress. Meanwhile, in certain local regions, mineral recrystallization at high temperature enhanced crystal packing density, which resulted in the formation of denser microstructural zones. Therefore, the more significant damage observed in the composite samples compared to the mortar can be attributed to the following reasons: (1) the original porosity of the ITZ (interfacial transition zone) is higher, which facilitates the connectivity of cracks; (2) the hydration products provide weak cementation, and C-S-H is more prone to dehydration shrinkage than the matrix; (3) stress transfer at the heterogeneous interface leads to geometric discontinuities.
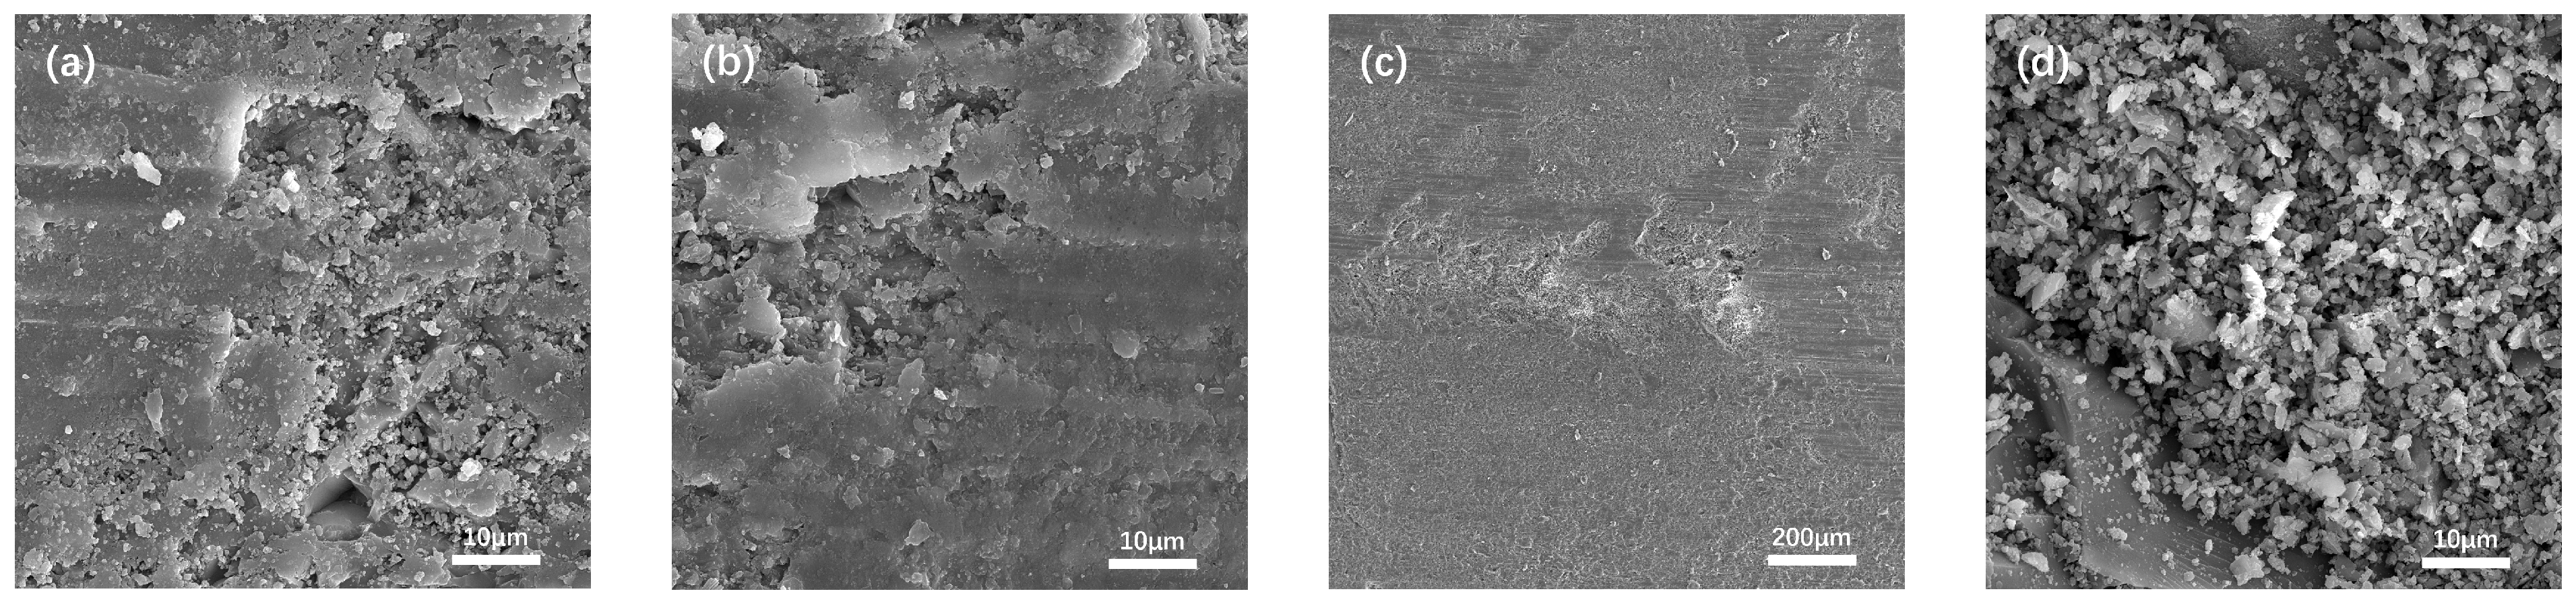
Figure 8: SEM images before high-temperature permeability test. (a) Mortar; (b) Granite; (c) Interface; (d) Interface at 5000× magnification.
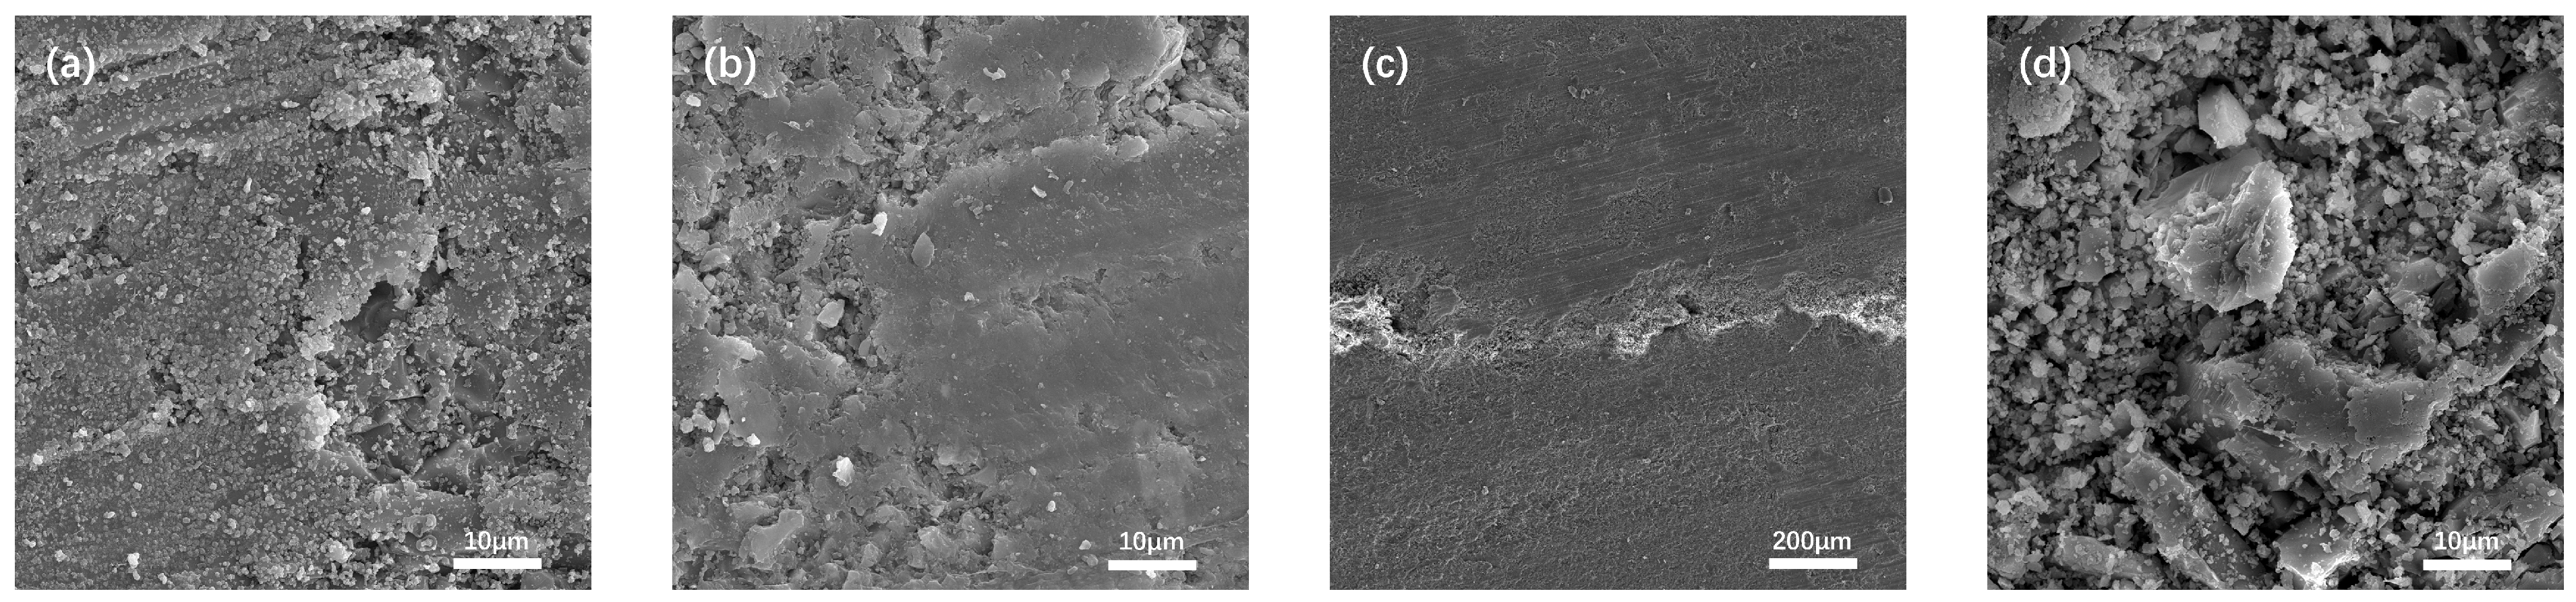
Figure 9: SEM images after high-temperature permeability test. (a) Mortar; (b) Granite; (c) Interface; (d) Interface at 5000× magnification.
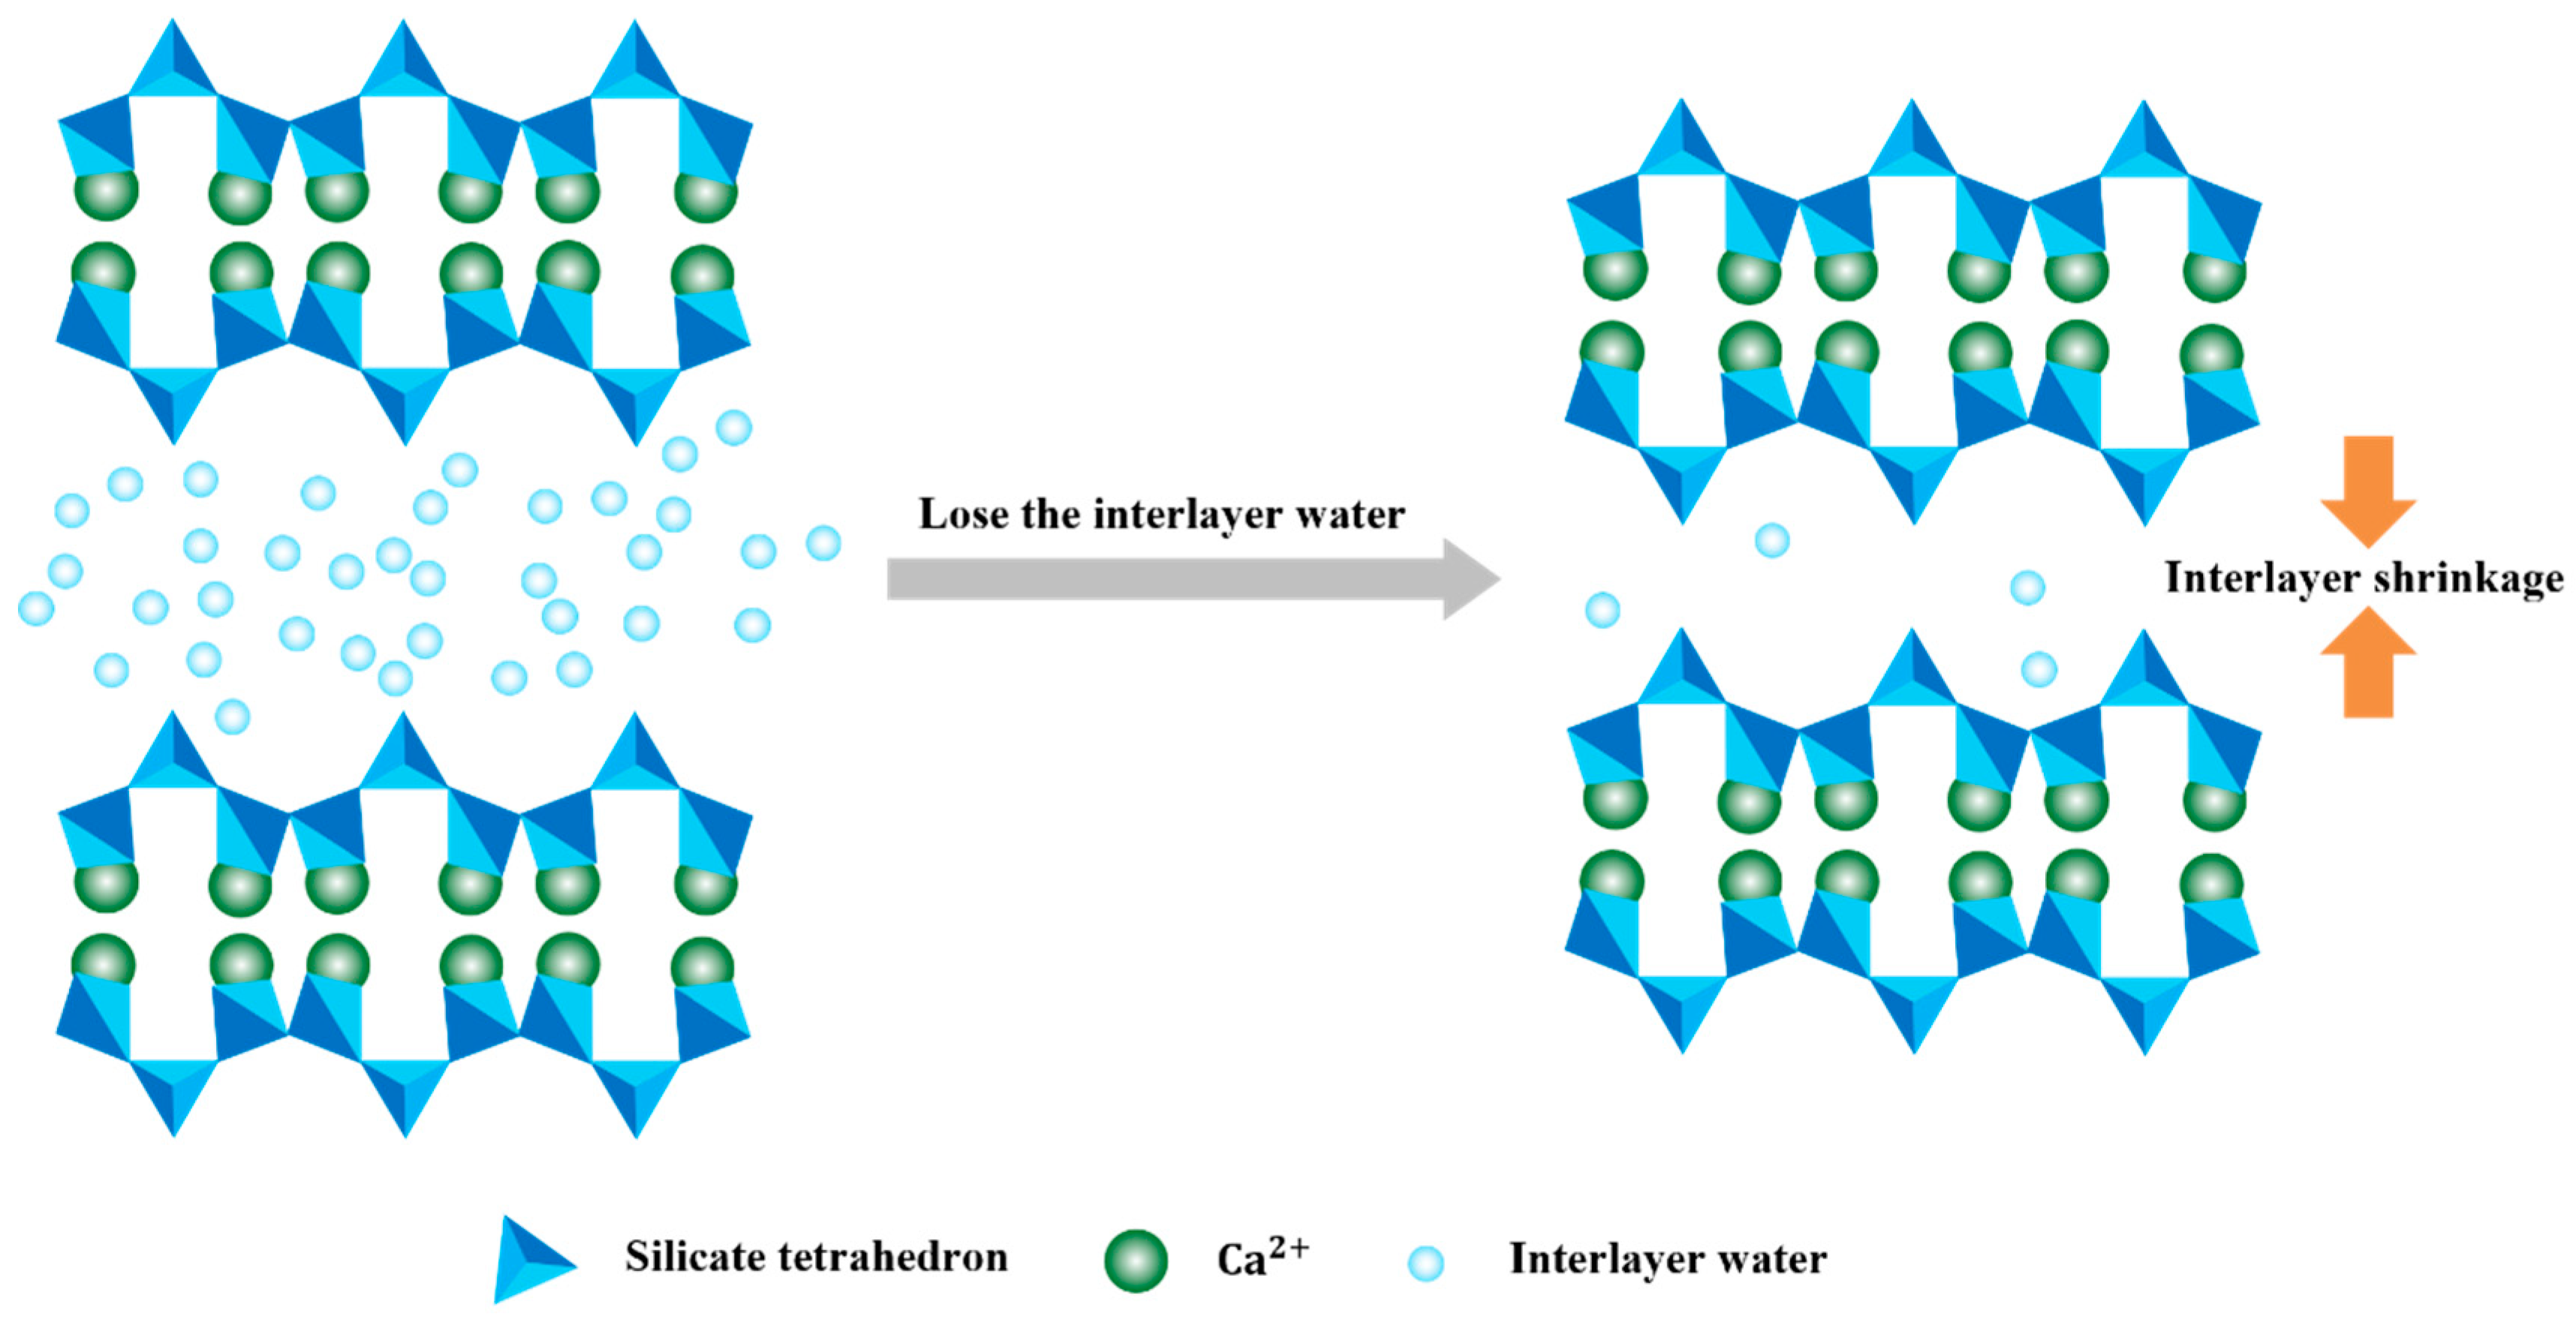
Figure 10: Schematic diagram of C-S-H interlayer shrinkage due to water loss.
3.4.1 Nuclear Magnetic T2 Spectrum
The T2 spectra distributions of the composite specimens are obtained, as shown in Fig. 11. The results show that the T2 values of the composite specimens range between 0.01 and 10,000 ms. For the composite specimen with a water–cement ratio of 0.3, the T2 spectra both before and after the experiment display four distinct peaks, denoted as P1, P2, P3, and P4. The leftmost peak has a much higher amplitude than the others. Before the experiment, the maximum amplitudes of the peaks were 99.3, 5.9, 7.6, and 13.1, while after the experiment, the maximum amplitudes were 120.3, 10.8, 7.5, and 12. For the composite specimen with a water–cement ratio of 0.5, four distinct peaks are observed before the experiment, with maximum amplitudes of 116.1, 5.9, 7.6, and 13.1. After the experiment, however, only three distinct peaks (P1, P2, and P3) are present, with maximum amplitudes of 130.1, 9.4, and 12. The total areas under the peaks of the T2 spectra for the 0.3 and 0.5 water–cement ratio composite specimens are 7439 and 3342 before the experiment, and 4824 and 4668 after the experiment, respectively.
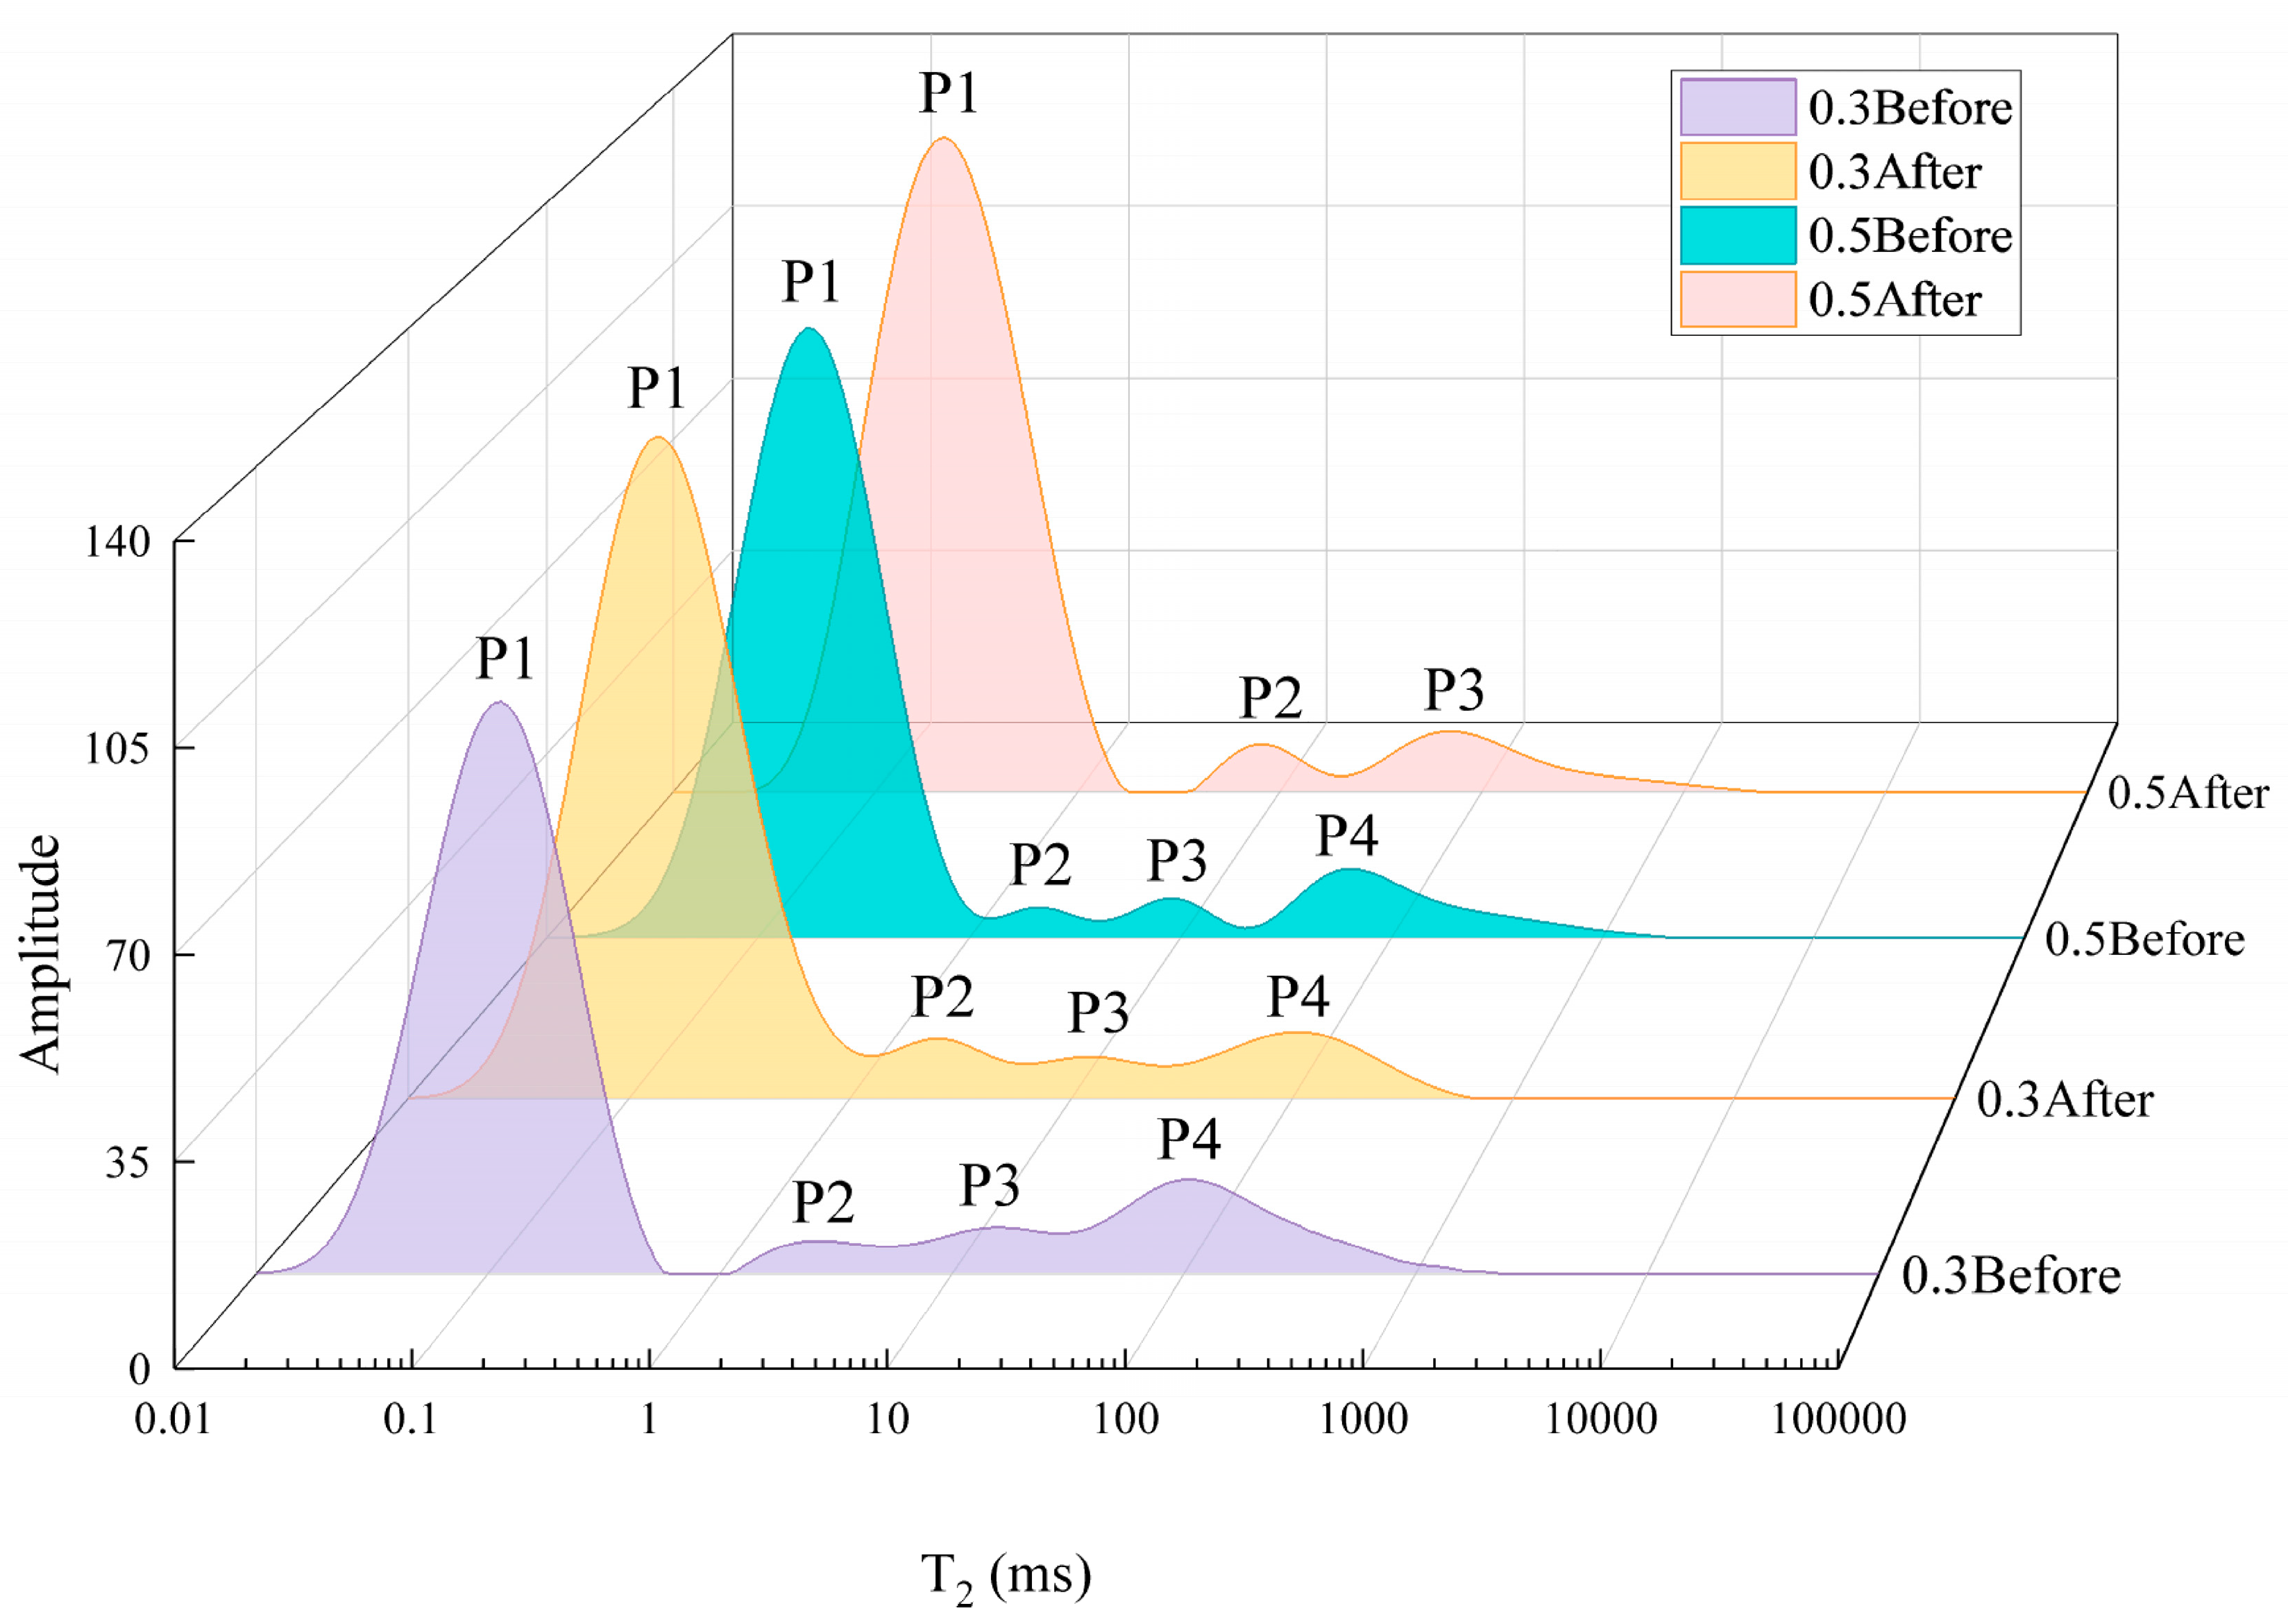
Figure 11: NMR T2 spectrum distribution of composite specimens before and after the experiment.
3.4.2 Nuclear Magnetic Resonance (NMR) Aperture Characteristics
Fig. 12 shows the pore size distribution characteristics of the composite specimens with water–cement ratios of 0.3 and 0.5 before and after the high-temperature gas permeability experiments. According to the Hodott pore classification standard, the pore sizes are divided into four categories: micropores (<10 nm), transition pores (10–100 nm), mesopores (100–1000 nm), and macropores (>1000 nm). The results show that the pore size distribution peaks of all specimens are concentrated in the range of 1–100 nm, indicating that micropores and transition pores constitute the main pore structures at the granite–mortar interface. Meanwhile, the initial porosity of the 0.5 water–cement ratio specimens is significantly higher than that of the 0.3 water–cement ratio specimens, which reflects the looser microstructure of high water–cement ratio materials. After the high-temperature experiments, the pore size distributions of both specimens change significantly, as evidenced by the increase in peak values and their rightward shift. The peak amplitude of the 0.5 water–cement ratio specimens increases by 30.4%, while that of the 0.3 water–cement ratio specimens increases by 14.1%. At the same time, the number of mesopores increases markedly and the average pore size becomes larger. These results indicated that, under high temperatures, micropores merged to form larger pores.
By combining the effect of temperature on permeability with the thermogravimetric analysis results, the underlying mechanisms of pore evolution can be better understood. At the stage of heating to 100°C, the difference in thermal expansion coefficients between granite and mortar caused compressive stress in the interface region, and some micropores closed due to particle compaction, which resulted in a reduction in permeability. When the temperature exceeded 100°C, the dehydration and shrinkage of C-S-H gels generated new micropores, while thermal stress promoted the transformation of transition pores into mesopores, which caused the permeability to increase. During the cooling stage back to room temperature, differential volume shrinkage induced interfacial tensile stress, which promoted the propagation of newly formed microcracks and created larger seepage channels. This process was reflected in the pore size distribution by a significant increase in the proportion of mesopores and macropores. In particular, in the 0.5 water–cement ratio specimens, the volume fraction of pores larger than 100 nm increased from 12% to 28%, which directly explained the 297.68% increase in permeability. These findings revealed, at the microscopic scale, the pore evolution mechanisms by which high-temperature damage led to deterioration of interfacial permeability.

Figure 12: Pore size distribution of composite specimens before and after real-time high-temperature treatment.
3.5.1 Pore Structure Obtained from X-CT
In order to investigate the evolution of the microstructure of the granite–mortar interface under real-time high temperatures, this study selects composite specimens with water–cement ratios of 0.3 and 0.5. Before extracting and quantifying the relevant microstructural parameters, the raw CT image datasets are enhanced through contrast stretching, filtering, and threshold segmentation (Fig. 13). Since the interface region cannot be independently separated, and no significant pores or cracks are observed inside the granite matrix, the analysis region is defined as the outer granite and the inner 1 mm range adjacent to the mortar.
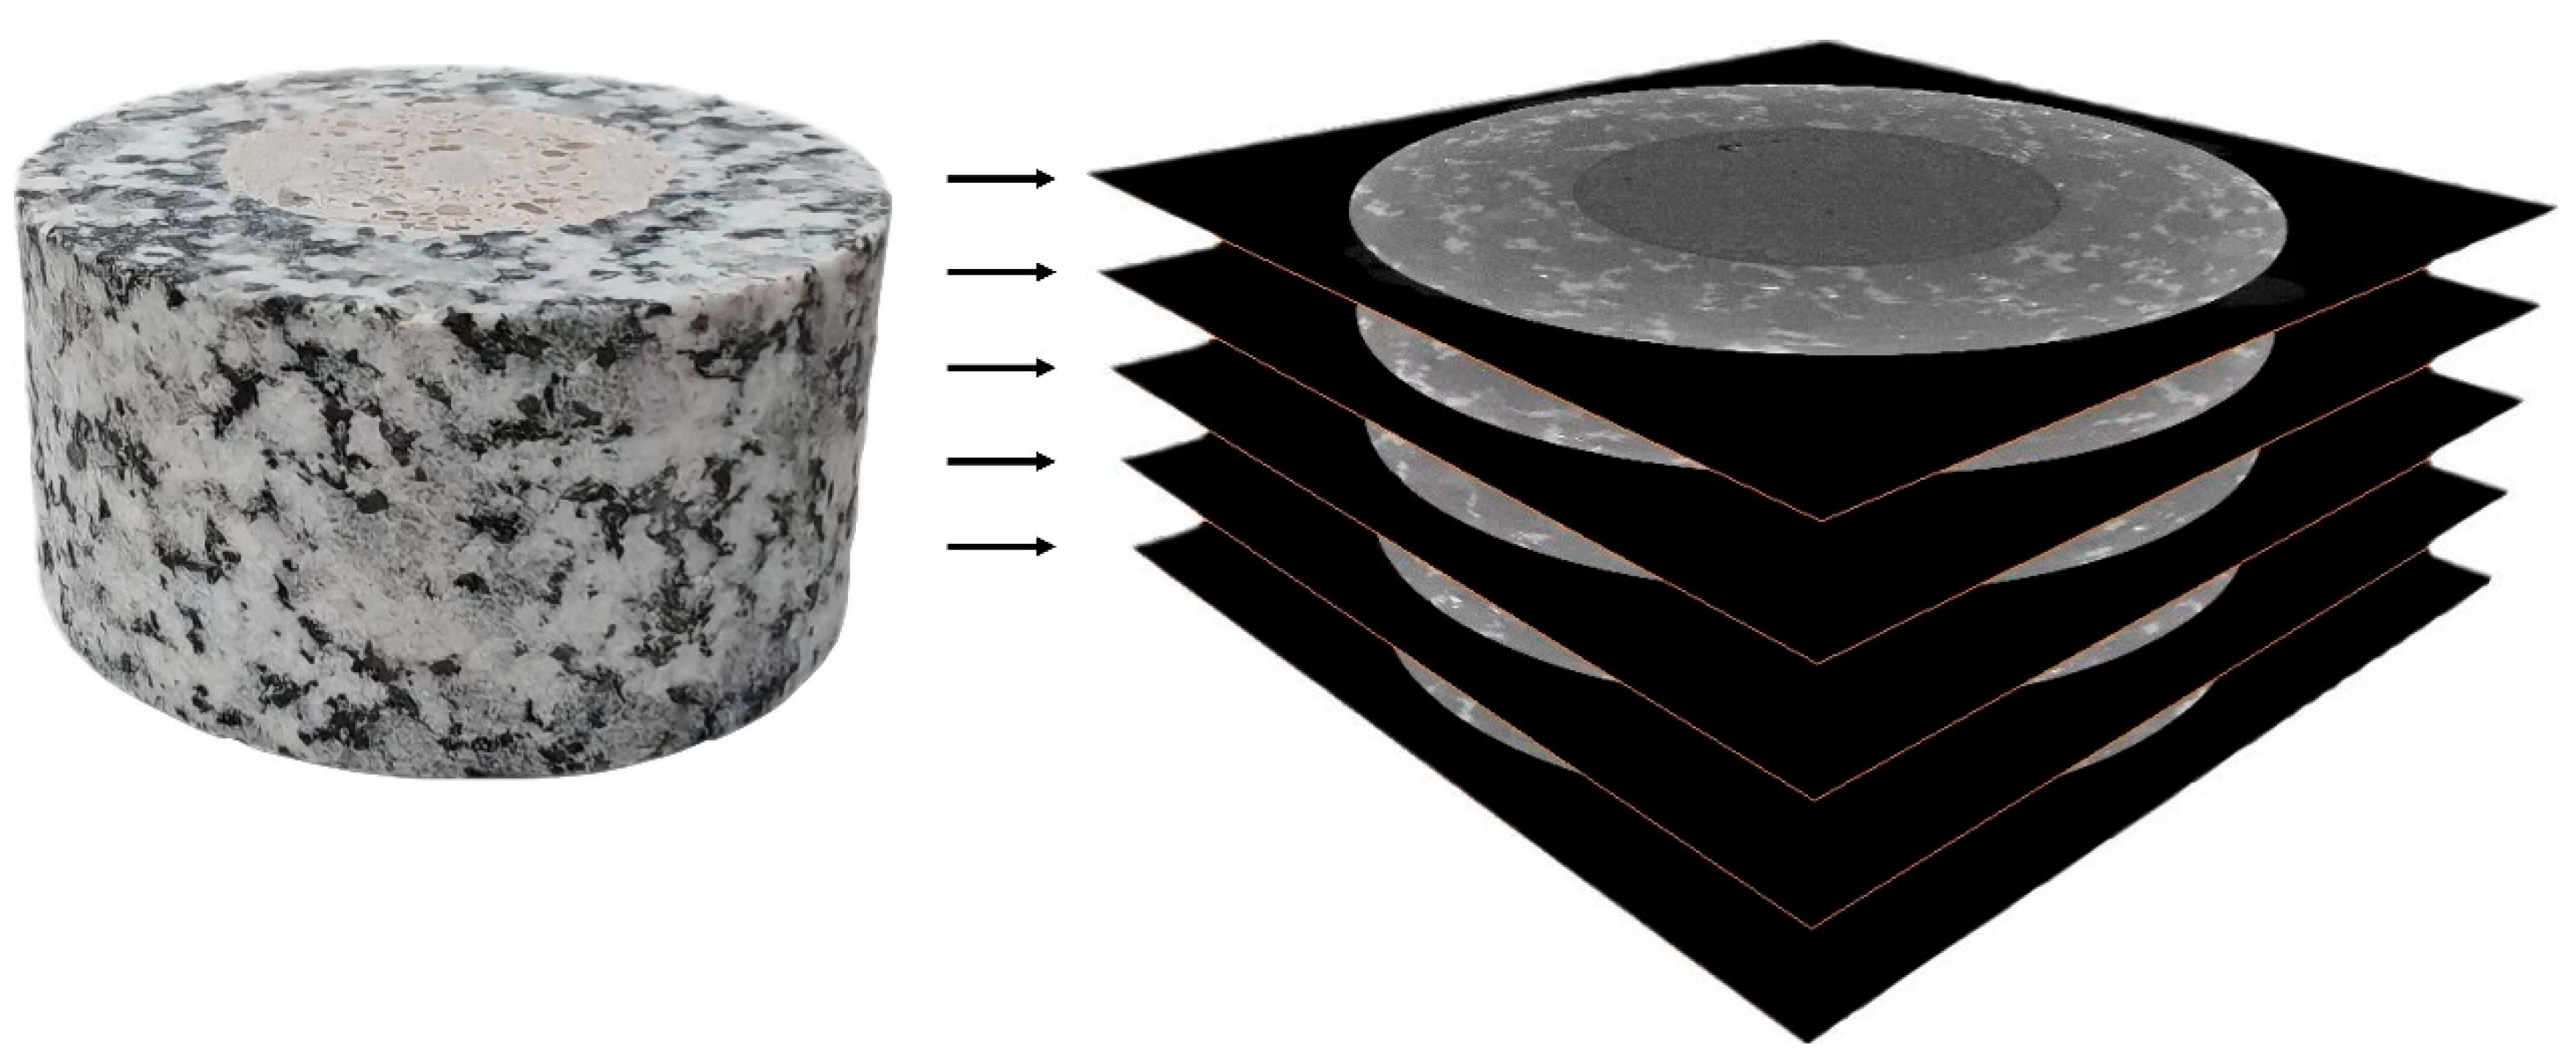
Figure 13: CT images.
Fig. 14 shows the extracted interface pores. The porosity after the test is greater than that before the test. During specimen preparation, granite and mortar bond together through mechanical interlocking and chemical bonding. The edge effect causes the porosity of the cement paste at the aggregate surface to be significantly higher than that within the matrix, resulting in lower interfacial bonding strength. For specimens with a water–cement ratio of 0.3, the interface porosity increases from 0.022% before the test to 0.039% after the test. For specimens with a water–cement ratio of 0.5, the interface porosity rises from 0.035% to 0.060%. The total porosity increases by 78.81% and 73.50%, respectively. The overall porosity increases significantly. This was attributed to two aspects: (1) microcracks were induced by the difference in thermal expansion coefficients between granite and cement; (2) chemical changes occurred due to the evaporation of chemically bound water. Previous studies showed that the thermal expansion coefficient of cement keeps increasing with temperature and reaches about 1.49 times that of granite at 125°C [49]. In addition, based on the thermogravimetric analysis of cement hydration products, free water in cement-based materials was eliminated in the range of 30–110°C, while chemically bound water was lost in the range of 110–600°C [50]. These changes in water content might have weakened the transition zone at the granite–mortar interface.
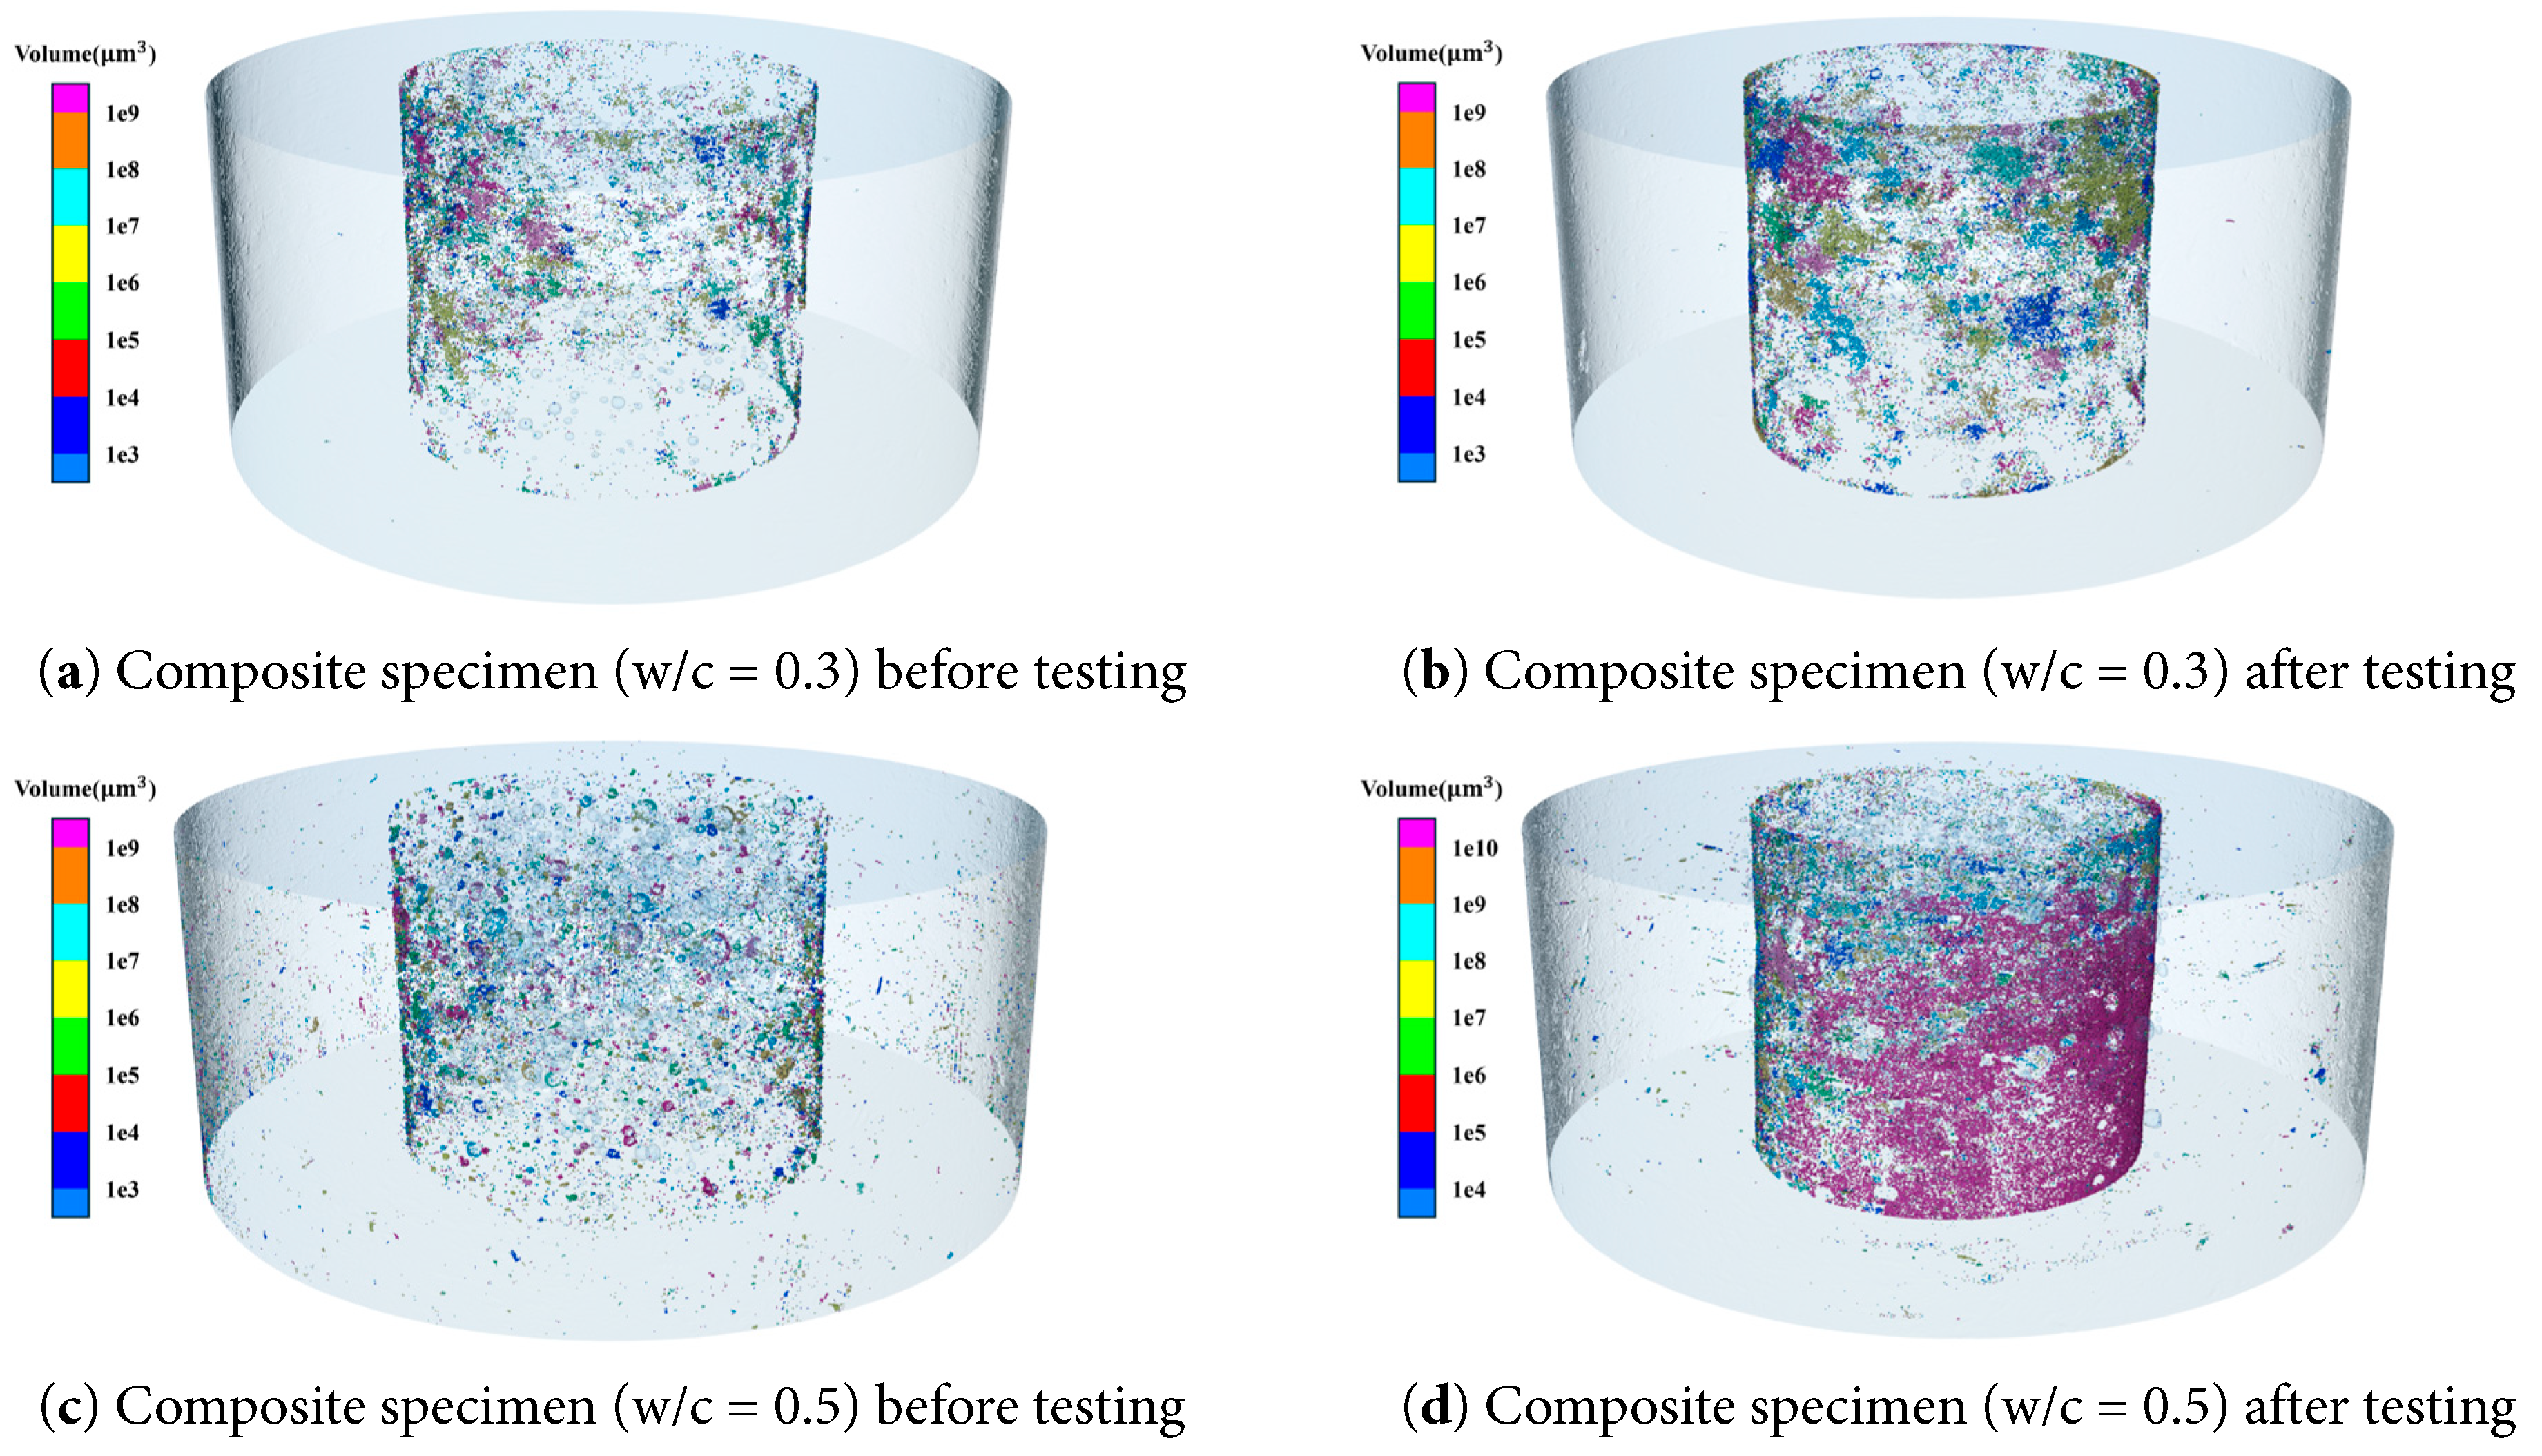
Figure 14: Three-dimensional pore structure of the composite specimen interface before and after high-temperature permeability testing.
3.5.2 X-CT Aperture Characteristics
The layer-by-layer porosity distribution based on CT tomography analysis (Fig. 15) shows that the porosity of the 0.3 water-to-cement ratio specimen ranges from 0.005% to 0.062% before the test and expands to 0.012% to 0.114% after the test. For the 0.5 water-to-cement ratio specimen, the porosity distribution is between 0.014% and 0.059% before the test and increases to 0.032% to 0.106% after the test. The data indicate that, under the same conditions, the two-dimensional sectional porosity of the 0.3 water-to-cement ratio specimen is generally lower than that of the 0.5 water-to-cement ratio specimen, and the porosity of both specimens increases systematically after high-temperature treatment. The porosity exhibits obvious non-uniformity along the specimen height, with significant differences observed in the end regions. In these regions, the two-dimensional sectional porosity increases considerably after the test, revealing the relative weakness of the interface at the surface. This phenomenon was consistent with the earlier SEM observations, which confirmed that the interface surface was more vulnerable to damage under high-temperature conditions. The damage mechanism was attributed to the evaporation of bound water from the C-S-H gel at the exposed interface, which caused delamination of the smooth interface accompanied by the generation of particulate matter.
Based on the equivalent pore diameter and pore volume obtained from X-CT analysis, the pore size distribution of the two specimens before and after the test can be determined (Fig. 16). For both specimens, the peak pore size distribution is located in the range of 33–66 μm before and after the test. A comparison of statistical results across different pore size ranges shows that no specific correlation exists between the number of pores and their corresponding volumetric proportion. For example, in the 0.3 water-to-cement ratio specimen, although the pore volume fraction in the 66–100 μm range decreases after the test, the number of pores in this range increases. Specifically, for the 0.3 water-to-cement ratio specimen, the number of pores in all pore size ranges increases after the test, and the total number of pores rises by 55.7%, clearly indicating that its interfacial structure suffers extensive damage under high-temperature permeability conditions. In contrast, in the 0.5 water-to-cement ratio specimen, only the number of large pores greater than 100 μm increases significantly. This difference was attributed to the fact that a higher water-to-cement ratio caused greater initial interfacial porosity. The high-temperature effect promoted the degradation of densely distributed micropore clusters, and the microcracks generated at the interface allowed small pores to interconnect and merge, eventually forming larger-scale pores.
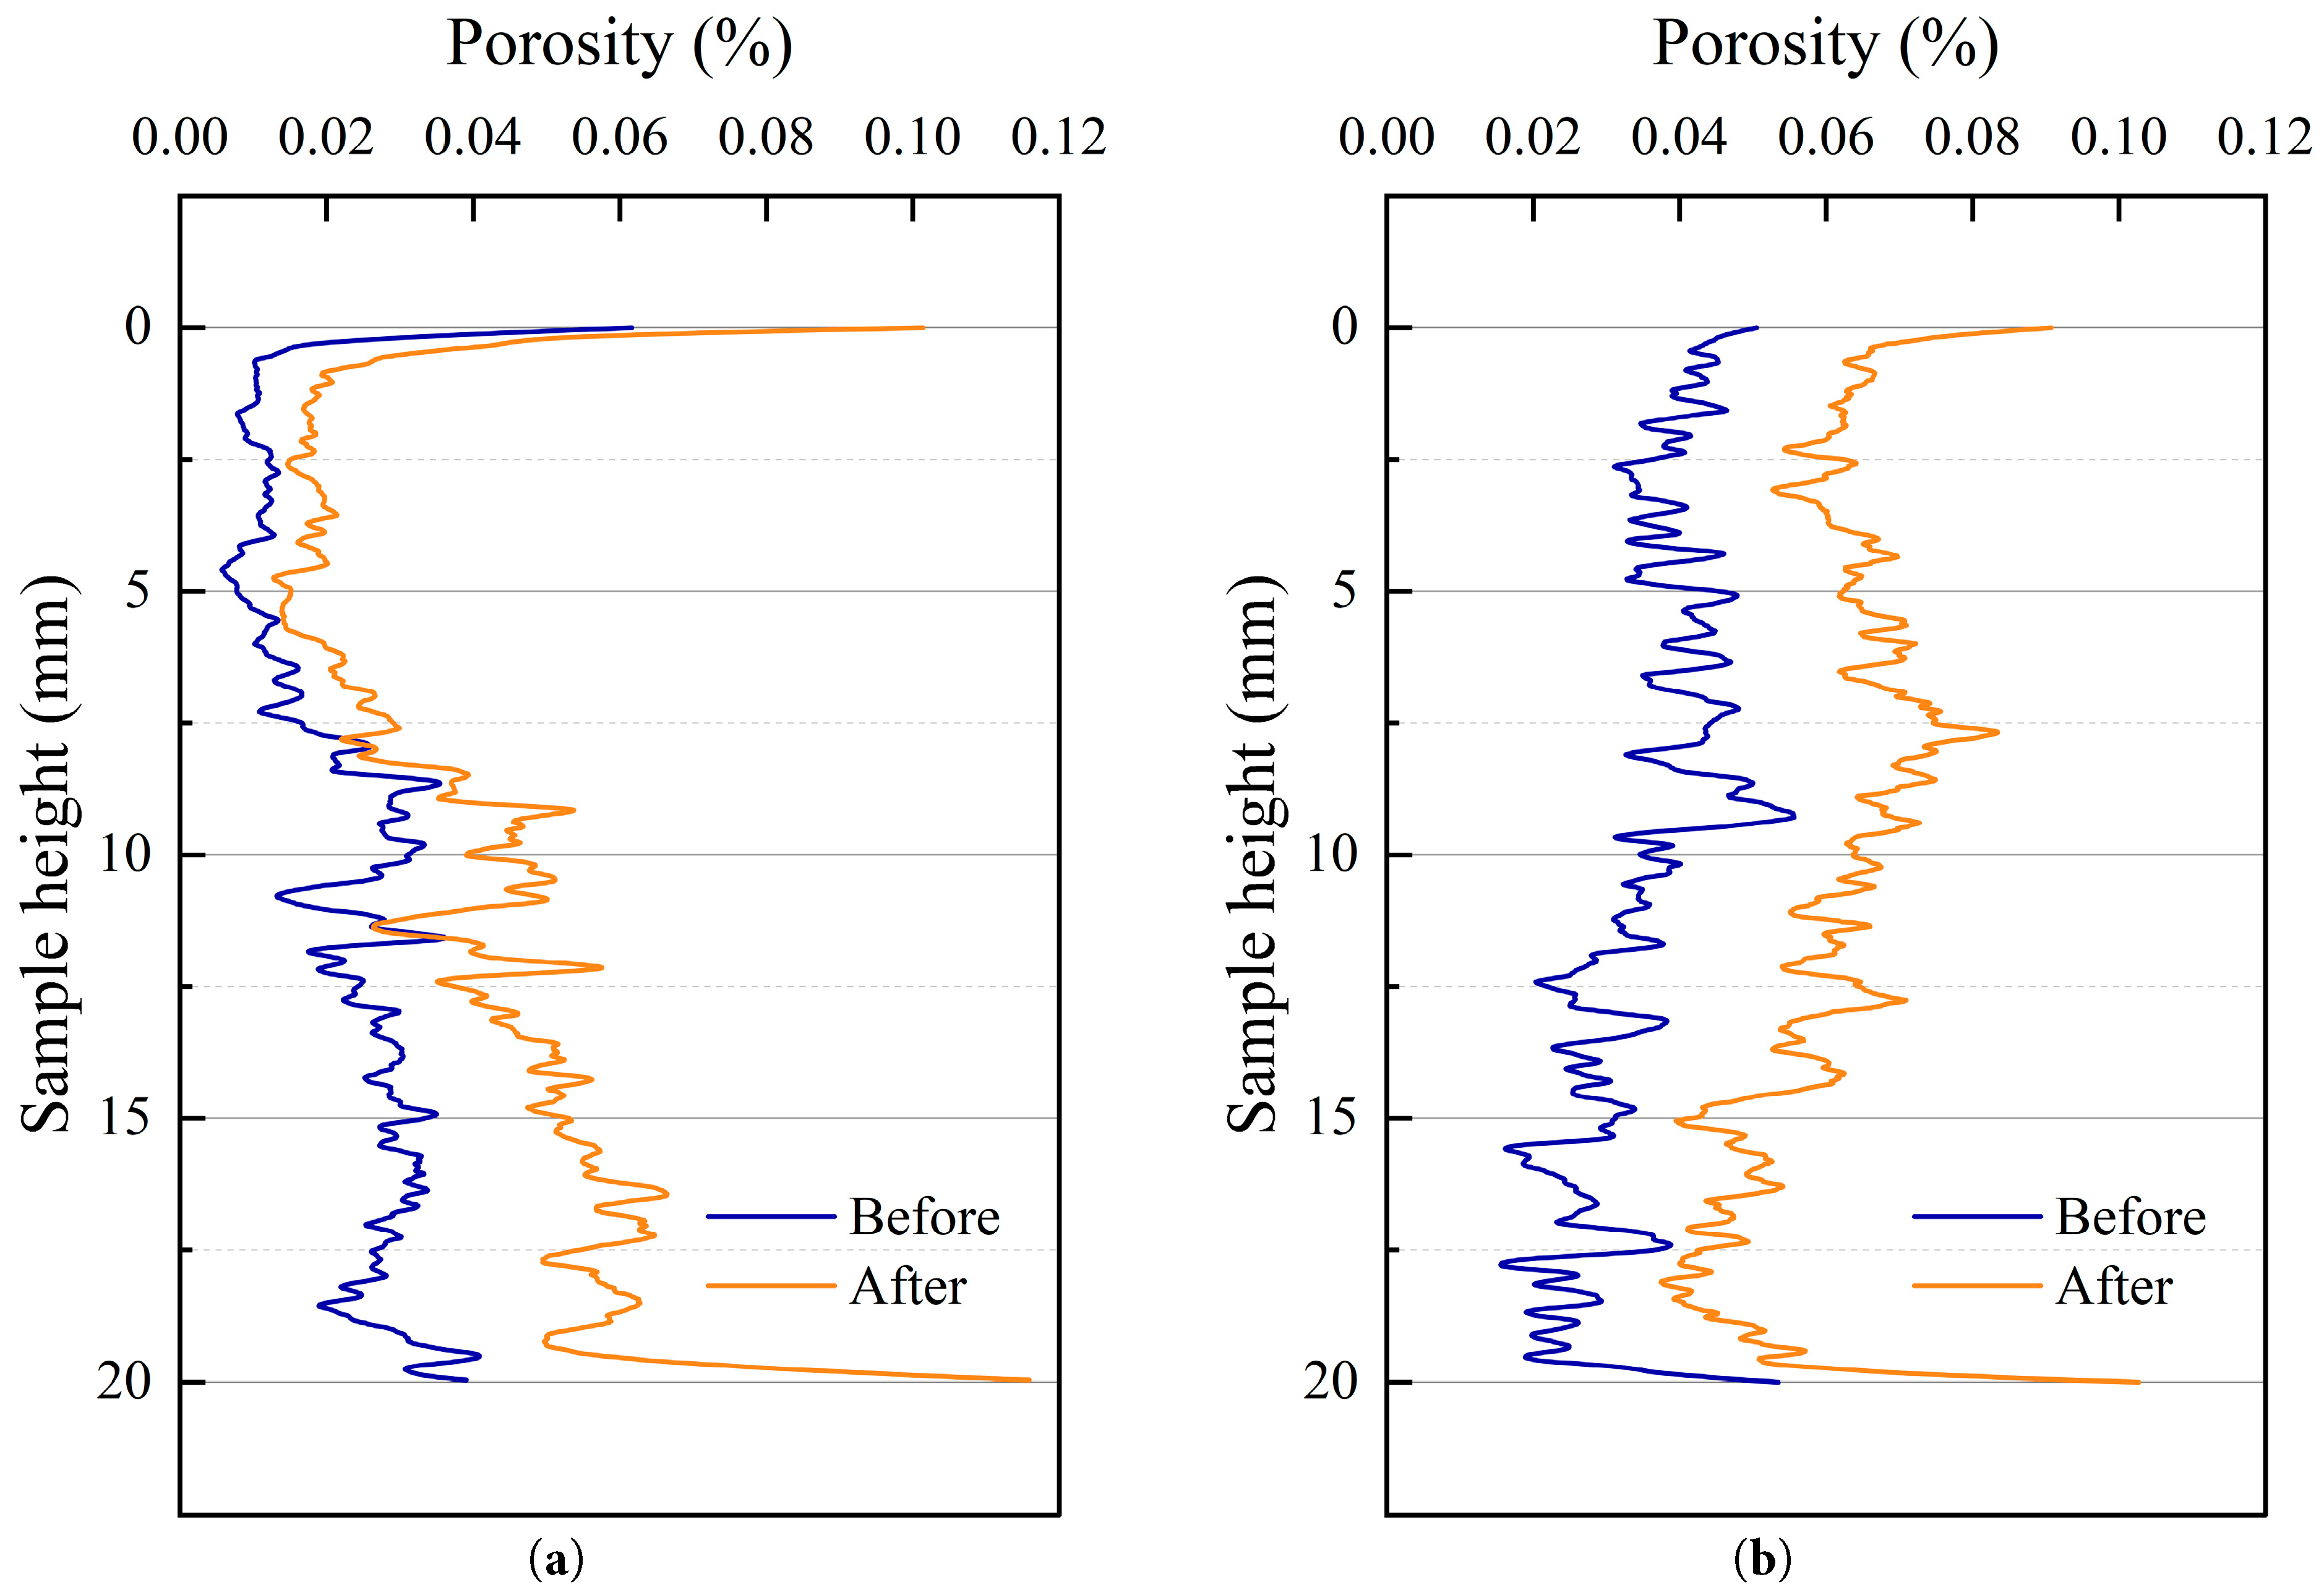
Figure 15: Porosity distribution of CT specimens at different heights. (a) Composite (w/c = 0.3); (b) Composite (w/c = 0.5).
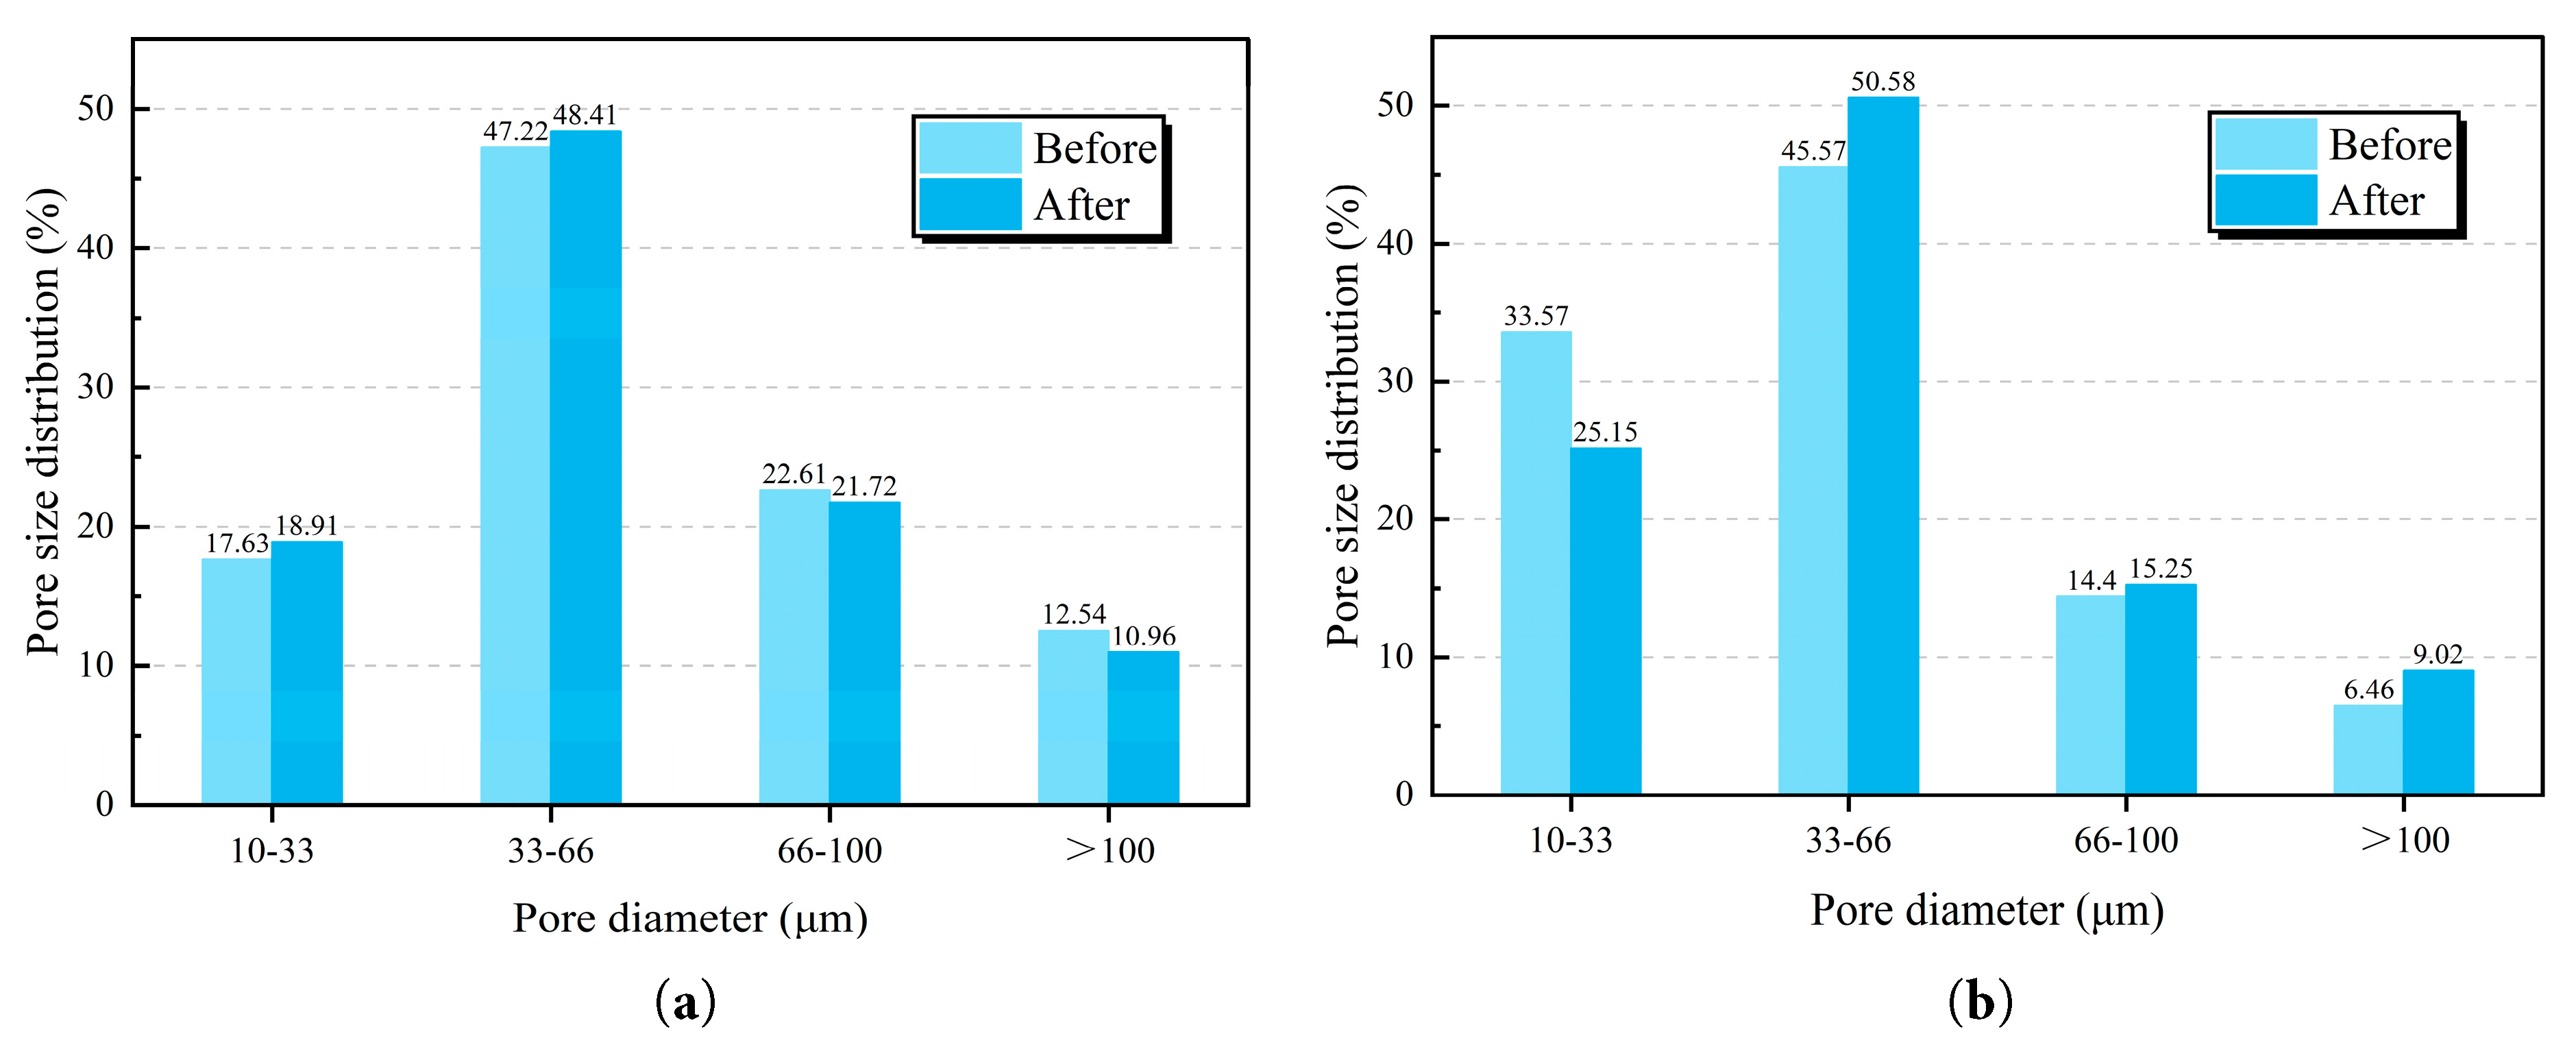
Figure 16: Pore size distribution obtained by X-CT of the studied samples. (a) Composite (w/c = 0.3); (b) Composite (w/c = 0.5).
This study constructed the mechanism of interfacial pore evolution under high-temperature conditions through multi-scale coupled characterization of permeability—TG-DTG—SEM—NMR—CT. The mechanism includes: in the initial stage, particle expansion leads to the closure of micropores; at 100°C, dehydration of C-S-H induces cracking; during the high-temperature stage, thermal expansion differences cause the extension of tensile cracks at the interface; in the cooling stage, thermal unloading induces opening effects, making microcracks irreversibly connect. This process is reflected in the pore size distribution as a significant increase in medium and large pores, which ultimately transform into dominant flow paths.
The objective of this study was to investigate the effect of real-time high temperature on the permeability of the granite–mortar interface. Permeability tests were carried out on granite specimens, mortar specimens, and composite specimens under a real-time temperature gradient. Scanning electron microscopy (SEM) and X-ray computed tomography (X-CT) were employed to observe the microstructure of the specimens before and after the tests. The main conclusions were as follows:
- 1.The granite–mortar interface exhibited a significant seepage advantage even at room temperature. Its intrinsic gas permeability was two orders of magnitude higher than that of the granite matrix and about one order of magnitude higher than that of mortar with the same water-to-cement ratio.
- 2.During the thermal cycle, the interfacial permeability followed a three-stage evolution. In the heating stage from 20°C to 100°C, mineral particle thermal expansion compressed pores, leading to a continuous decrease in permeability; at 100°C, the permeability of the 0.3 water-to-cement ratio interface decreased by 65.90%. In the high-temperature stage from 100°C to 150°C, dehydration and decomposition of C-S-H gel and thermal expansion mismatch between granite and mortar induced tensile cracks at the interface, resulting in a sharp increase in permeability; the 0.5 water-to-cement ratio specimen showed an increase of 205.48% at 150°C. In the cooling stage from 150°C back to 20°C, irreversible pore expansion caused permeability to continue increasing, and after one cycle, the total permeability increase reached 161.72% and 297.68% for the 0.3 and 0.5 water-to-cement ratio interfaces, respectively.
- 3.The effect of water-to-cement ratio on interfacial damage is limited: Although the 0.5 ratio mortar has smaller permeability fluctuations due to initial porosity buffering, the interface still shows significant degradation, with a 297.68% increase in permeability. This suggests that the mix ratio cannot effectively prevent interfacial damage.
- 4.Multi-scale characterization revealed the interfacial pore evolution: NMR showed the initial flow network had pores <100 nm; CT analysis indicated a 73–79% increase in porosity, with new pores having an average diameter of 33–66 μm; SEM images showed the interface transformed from a diffuse to distinct, elongated crack structure, with C-S-H gel forming 1–5 μm clusters.
- 5.The essence of damage evolution was the thermo–mechanical–chemical coupling effect: thermal expansion mismatch induced stress concentration at the interface, decomposition of C-S-H weakened interfacial bonding.
Acknowledgement:
Funding Statement: This work is supported by the National Natural Science Foundation of China (No. 51709097).
Author Contributions: The authors confirm contribution to the paper as follows: study conception and design: Wei Chen; data collection: Yuanteng Zhao; analysis and interpretation of results: Yue Liang; draft manuscript preparation: Wei Chen and Yuanteng Zhao. All authors reviewed the results and approved the final version of the manuscript.
Availability of Data and Materials: The data of this study are available on request from the corresponding author.
Ethics Approval: Not applicable.
Conflicts of Interest: The authors declare no conflicts of interest to report regarding the present study.
References
1. Lee EH , Christopoulos GI , Lu M , Heo MQ , Soh CK . Social aspects of working in underground spaces. Tunn Undergr Space Technol. 2016; 55: 135– 45. doi:10.1016/j.tust.2015.12.012. [Google Scholar] [CrossRef]
2. Ojovan MI , Steinmetz HJ . Approaches to disposal of nuclear waste. Energies. 2022; 15( 20): 7804. doi:10.3390/en15207804. [Google Scholar] [CrossRef]
3. Yuan Y , Zhang X , Yu H , Zhong C , Wang Y , Wen D , et al. Research progress and technical challenges of geothermal energy development from hot dry rock: a review. Energies. 2025; 18( 7): 1742. doi:10.3390/en18071742. [Google Scholar] [CrossRef]
4. Qiao R , Shao Z , Liu F , Wei W . Damage evolution and safety assessment of tunnel lining subjected to long-duration fire. Tunn Undergr Space Technol. 2019; 83: 354– 63. doi:10.1016/j.tust.2018.09.036. [Google Scholar] [CrossRef]
5. Kandalai S , John NJ , Patel A . Effects of climate change on geotechnical infrastructures—state of the art. Environ Sci Pollut Res Int. 2023; 30( 7): 16878– 904. doi:10.1007/s11356-022-24788-7. [Google Scholar] [CrossRef]
6. Ram BK , Das R , Mishra DA . Thermal treatment induced damage mechanism of rock materials and its influence on the physico-mechanical properties—a review. Environ Earth Sci. 2025; 84: 334. doi:10.1007/s12665-025-12300-6. [Google Scholar] [CrossRef]
7. Siegesmund S , Sousa L , Knell C . Thermal expansion of granitoids. Environ Earth Sci. 2018; 77: 41. doi:10.1007/s12665-017-7119-2. [Google Scholar] [CrossRef]
8. Shang X , Zhang Z , Xu X , Liu T , Xing Y . Mineral composition, pore structure, and mechanical characteristics of pyroxene granite exposed to heat treatments. Minerals. 2019; 9( 9): 553. doi:10.3390/min9090553. [Google Scholar] [CrossRef]
9. Karunadasa KSP , Manoratne CH , Pitawala HMTGA , Rajapakse RMG . The composition, unit cell parameters and microstructure of quartz during phase transformation from α to β as examined by in situ high-temperature X-ray powder diffraction. J Phys Chem Solids. 2018; 117: 131– 8. doi:10.1016/j.jpcs.2018.02.028. [Google Scholar] [CrossRef]
10. Tang S , Wang Y , Geng Z , Xu X , Yu W , Hubao A , et al. Structure, fractality, mechanics and durability of calcium silicate hydrates. Fractal Fract. 2021; 5( 2): 47. doi:10.3390/fractalfract5020047. [Google Scholar] [CrossRef]
11. Gao W , Jia S , Zhao T , Wang Z . Discrete element modelling of damage evolution of concrete considering meso-structure of ITZ. Comput Model Eng Sci. 2024; 139( 3): 3495– 511. doi:10.32604/cmes.2023.046188. [Google Scholar] [CrossRef]
12. Kuang F , Long Z , Kuang D , Guo R , Sun J . Experimental study on high temperatures performance of rubberized geopolymer mortar. J Build Eng. 2023; 76: 107091. doi:10.1016/j.jobe.2023.107091. [Google Scholar] [CrossRef]
13. Kashfipour MA , Mehra N , Zhu J . A review on the role of interface in mechanical, thermal, and electrical properties of polymer composites. Adv Compos Hybrid Mater. 2018; 1( 3): 415– 39. doi:10.1007/s42114-018-0022-9. [Google Scholar] [CrossRef]
14. Yin W , Feng Z , Zhao Y . Effect of grain size on the mechanical behaviour of granite under high temperature and triaxial stresses. Rock Mech Rock Eng. 2021; 54( 2): 745– 58. doi:10.1007/s00603-020-02303-z. [Google Scholar] [CrossRef]
15. Delhomme F , Ambroise J , Limam A . Effects of high temperatures on mortar specimens containing Portland cement and GGBFS. Mater Struct. 2012; 45( 11): 1685– 92. doi:10.1617/s11527-012-9865-7. [Google Scholar] [CrossRef]
16. Wang Z , Tian N , Wang J , Yang S , Liu G . Mechanical response and energy dissipation analysis of heat-treated granite under repeated impact loading. Comput Mater Contin. 2019; 59( 1): 275– 96. doi:10.32604/cmc.2019.04247. [Google Scholar] [CrossRef]
17. Reis JMLD . Effect of temperature on the mechanical properties of polymer mortars. Mat Res. 2012; 15( 4): 645– 9. doi:10.1590/S1516-14392012005000091. [Google Scholar] [CrossRef]
18. Dong W , Wu Z , Zhou X , Wang N , Kastiukas G . An experimental study on crack propagation at rock-concrete interface using digital image correlation technique. Eng Fract Mech. 2017; 171: 50– 63. doi:10.1016/j.engfracmech.2016.12.003. [Google Scholar] [CrossRef]
19. Yuan W , Dong W , Zhang B , Zhong H . Investigations on fracture properties and analytical solutions of fracture parameters at rock-concrete interface. Constr Build Mater. 2021; 300: 124040. doi:10.1016/j.conbuildmat.2021.124040. [Google Scholar] [CrossRef]
20. Jiang Q , Yang Y , Yan F , Zhou J , Li S , Yang B , et al. Deformation and failure behaviours of rock-concrete interfaces with natural morphology under shear testing. Constr Build Mater. 2021; 293: 123468. doi:10.1016/j.conbuildmat.2021.123468. [Google Scholar] [CrossRef]
21. Yang SQ , Song Y , Du SG , Huang YH , Zhu ZN . Experimental study on mechanical and permeability characteristics of rock-cement interface in ultra-low temperature environment. Constr Build Mater. 2024; 451: 138790. doi:10.1016/j.conbuildmat.2024.138790. [Google Scholar] [CrossRef]
22. Li J , Chen Y , Liang W , Zhang S , Qiu Y . Experimental investigation on permeability and mechanical properties of cement–salt rock interface subjected to cyclic loading. Rock Mech Rock Eng. 2023; 56( 10): 7281– 99. doi:10.1007/s00603-023-03434-9. [Google Scholar] [CrossRef]
23. Wang M , Chen B , Xu J , Gong YA , Gao X , Li X , et al. Permeability evolution of the rock–concrete interface in underground high-pressure gas storage. J Rock Mech Geotech Eng. 2025; 17( 7): 4539– 58. doi:10.1016/j.jrmge.2024.09.036. [Google Scholar] [CrossRef]
24. Liu J , Wang Z , Guo J , Jivkov A , Sedighi M , Shao J . Gas migration at the granite–bentonite interface under semirigid boundary conditions in the context of high-level radioactive waste disposal. Deep Undergr Sci Eng. 2025; 4( 3): 422– 36. doi:10.1002/dug2.12118. [Google Scholar] [CrossRef]
25. Popovics S . The use of the fineness modulus for the grading evaluation of aggregrates for concrete. Mag Concr Res. 1966; 18( 56): 131– 40. doi:10.1680/macr.1966.18.56.131. [Google Scholar] [CrossRef]
26. Ulusay R . The ISRM suggested methods for rock characterization, testing and monitoring: 2007–2014. Cham, Switzerland: Springer International Publishing; 2015. doi:10.1007/978-3-319-07713-0. [Google Scholar] [CrossRef]
27. EN196-1:2005. Methods of testing cement—part1: determination of strength. Madrid, Spain: AENOR; 2005. [Google Scholar]
28. Dana E , Skoczylas F . Gas relative permeability and pore structure of sandstones. Int J Rock Mech Min Sci. 1999; 36( 5): 613– 25. doi:10.1016/S0148-9062(99)00037-6. [Google Scholar] [CrossRef]
29. Klinkenberg LJ . The permeability of porous media to liquids and gases. Drill Prod Pract. 1941; 200– 13. [Google Scholar]
30. Deng SY , Jiang QH , Shang KW , Jing XY , Xiong F . Effect of high temperature on micro-structure and permeability of granite. Rock Soil Mech. 2021; 42( 6): 1601– 11. (In Chinese). doi:10.16285/j.rsm.2020.1515. [Google Scholar] [CrossRef]
31. Tracz T , Zdeb T . Effect of hydration and carbonation progress on the porosity and permeability of cement pastes. Materials. 2019; 12( 1): 192. doi:10.3390/ma12010192. [Google Scholar] [CrossRef]
32. Kong DLY , Sanjayan JG . Effect of elevated temperatures on geopolymer paste, mortar and concrete. Cem Concr Res. 2010; 40( 2): 334– 9. doi:10.1016/j.cemconres.2009.10.017. [Google Scholar] [CrossRef]
33. Liu B , Yang J , Li D , Xing F , Fang Y . Effect of a synthetic nano-CaO-Al2O3-SiO2-H2O gel on the early-stage shrinkage performance of alkali-activated slag mortars. Materials. 2018; 11( 7): 1128. doi:10.3390/ma11071128. [Google Scholar] [CrossRef]
34. Sugrañez R , Álvarez JI , Cruz-Yusta M , Mármol I , Morales J , Vila J , et al. Enhanced photocatalytic degradation of NOx gases by regulating the microstructure of mortar cement modified with titanium dioxide. Build Environ. 2013; 69: 55– 63. doi:10.1016/j.buildenv.2013.07.014. [Google Scholar] [CrossRef]
35. Chen W , Liu D , Liang Y . Influence of ultra fine glass powder on the properties and microstructure of mortars. Fluid Dyn Mater Process. 2024; 20( 5): 915– 38. doi:10.32604/fdmp.2024.046335. [Google Scholar] [CrossRef]
36. Sabih G , Rahman T , Tarefder RA . Quantifying the impact of coefficient of thermal expansion of overlay concrete on unbonded concrete overlay performance. Heliyon. 2018; 4( 10): e00855. doi:10.1016/j.heliyon.2018.e00855. [Google Scholar] [CrossRef]
37. Plevova E , Vaculikova L , Kozusnikova A , Ritz M , Simha Martynkova G . Thermal expansion behaviour of granites. J Therm Anal Calorim. 2016; 123( 2): 1555– 61. doi:10.1007/s10973-015-4996-z. [Google Scholar] [CrossRef]
38. Lion M , Skoczylas F , Ledésert B . Effects of heating on the hydraulic and poroelastic properties of Bourgogne limestone. Int J Rock Mech Min Sci. 2005; 42( 4): 508– 20. doi:10.1016/j.ijrmms.2005.01.005. [Google Scholar] [CrossRef]
39. Mondal SK , Okoronkwo MU . Seeding effects of submicron CaAl-NO3 LDH particles on the hydration and properties of Portland cement and sulfoaluminate cement pastes. Constr Build Mater. 2024; 423: 135870. doi:10.1016/j.conbuildmat.2024.135870. [Google Scholar] [CrossRef]
40. Zhu X , Qian C , He B , Chen Q , Jiang Z . Experimental study on the stability of C-S-H nanostructures with varying bulk CaO/SiO2 ratios under cryogenic attack. Cem Concr Res. 2020; 135: 106114. doi:10.1016/j.cemconres.2020.106114. [Google Scholar] [CrossRef]
41. Matschei T , Glasser FP . Thermal stability of thaumasite. Mater Struct. 2015; 48( 7): 2277– 89. doi:10.1617/s11527-014-0309-4. [Google Scholar] [CrossRef]
42. Clark BA , Brown PW . The formation of calcium sulfoaluminate hydrate compounds: part I. Cem Concr Res. 1999; 29( 12): 1943– 8. doi:10.1016/S0008-8846(99)00200-8. [Google Scholar] [CrossRef]
43. Clark BA , Brown PW . The formation of calcium sulfoaluminate hydrate compounds: part II. Cem Concr Res. 2000; 30( 2): 233– 40. doi:10.1016/S0008-8846(99)00234-3. [Google Scholar] [CrossRef]
44. Qiu H , Chen R , Wang Y , Liu R , Lai D , Liao F , et al. Experimental and numerical study of the dynamic crack propagation behavior of mortar-granite specimens with different inclination interfaces. Theor Appl Fract Mech. 2025; 136: 104831. doi:10.1016/j.tafmec.2024.104831. [Google Scholar] [CrossRef]
45. Zhang C , Wang J , Song W , Fu J . The bonding mechanism of rock and cement paste backfill interface under high temperature curing. Powder Technol. 2025; 453: 120680. doi:10.1016/j.powtec.2025.120680. [Google Scholar] [CrossRef]
46. Stroeven P , Stroeven M . Reconstructions by SPACE of the interfacial transition zone. Cem Concr Compos. 2001; 23( 2–3): 189– 200. doi:10.1016/S0958-9465(00)00076-7. [Google Scholar] [CrossRef]
47. Kumar A , Walder BJ , Kunhi Mohamed A , Hofstetter A , Srinivasan B , Rossini AJ , et al. The atomic-level structure of cementitious calcium silicate hydrate. J Phys Chem C. 2017; 121( 32): 17188– 96. doi:10.1021/acs.jpcc.7b02439. [Google Scholar] [CrossRef]
48. Ma Y , Jin M , Wang F , Jacques D , Shen X , Zhang J , et al. Heating-induced transformations in calcium silicate hydrate (C-S-H): in situ investigations of composition, structure, and morphology. Cem Concr Res. 2025; 190: 107819. doi:10.1016/j.cemconres.2025.107819. [Google Scholar] [CrossRef]
49. Geng S , Yu L , Wu D , Su H , Meng Q , Li W . Thermal effects on tensile behavior and failure characteristics of granite-concrete bi-materials with different loading directions. Constr Build Mater. 2023; 394: 132155. doi:10.1016/j.conbuildmat.2023.132155. [Google Scholar] [CrossRef]
50. Kim JJ , Foley EM , Reda Taha MM . Nano-mechanical characterization of synthetic calcium–silicate–hydrate (C–S–H) with varying CaO/SiO2 mixture ratios. Cem Concr Compos. 2013; 36: 65– 70. doi:10.1016/j.cemconcomp.2012.10.001. [Google Scholar] [CrossRef]
Cite This Article
 Copyright © 2025 The Author(s). Published by Tech Science Press.
This work is licensed under a Creative Commons Attribution 4.0 International License , which permits unrestricted use, distribution, and reproduction in any medium, provided the original work is properly cited.
 Downloads
 Citation Tools