
 Submit a Paper
 Propose a Special lssue
 Open Access
ARTICLE

Sand Production in Unconsolidated Sandstone: Experimental Analysis of Multiphase Flow During Cyclic Injection and Production
1 CNPC Engineering Technology R&D Company Limited, Beijing, 102206, China
2 National Engineering Research Center of Oil & Gas Drilling and Completion Technology, Beijing, 102206, China
3 School of Energy Resources, China University of Geoscience (Beijing), Beijing, 100083, China
* Corresponding Authors: Xiaoling Tang. Email: ; Jinghong Hu. Email:
(This article belongs to the Special Issue: Subsurface Fluid Flow Dynamics and Applications in Carbon Reduction Technologies)
Fluid Dynamics & Materials Processing 2025, 21(12), 2981-2995. https://doi.org/10.32604/fdmp.2025.073859
Received 27 September 2025; Accepted 12 December 2025; Issue published 31 December 2025
 View Full Text
 Download PDF
Abstract
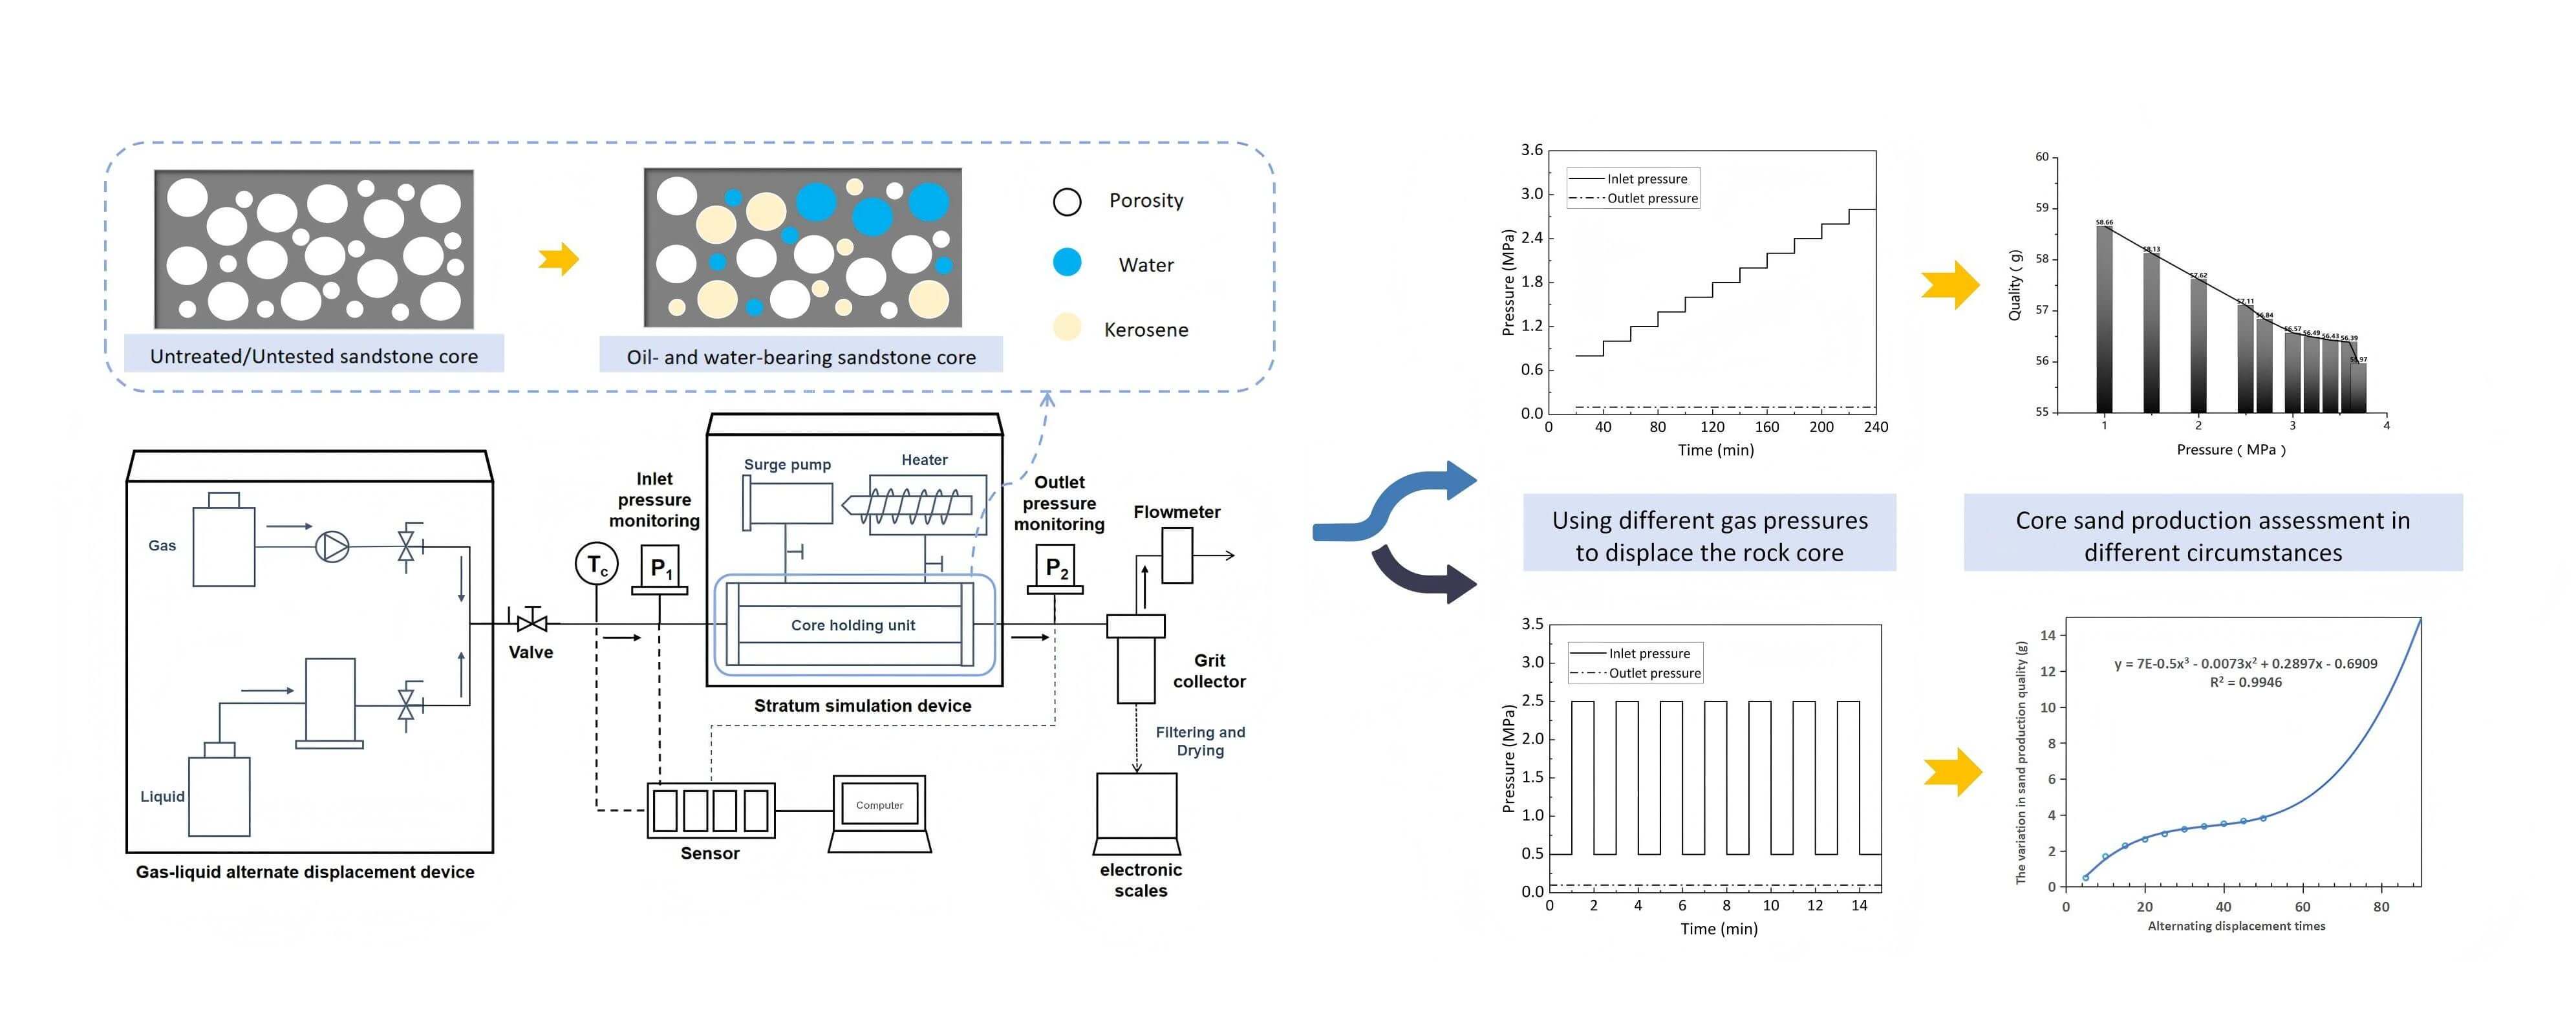
Many mature onshore oilfields have entered a high-water-cut stage, with reservoir recovery approaching economic limits. Converting these depleted or nearly depleted reservoirs into underground gas storage (UGS) facilities offers an efficient way to leverage their substantial storage potential. During cyclic gas injection and withdrawal, however, the reservoir experiences complex three-phase flow and repeated stress fluctuations, which can induce rock fatigue, inelastic deformation, and ultimately sand production. This study uses controlled physical experiments to simulate sand production in reservoir rocks subjected to alternating gas injection and production under three-phase conditions. After preparing oil-water-saturated cores through waterflooding, gas is introduced to perform repeated displacement cycles. Polynomial models relating core mass loss to water-oil ratio and cycle number are developed using the Newton interpolation method, enabling prediction of sand production under various operating conditions. Results show that, within the critical pressure-difference range for sand onset, permeability increases with water-oil ratio. When the water-oil ratio lies between 0.3 and 1, sand production decreases progressively; beyond a ratio of 1, sand production increases with further increases in water-oil ratio. The number of displacement cycles exerts a dominant influence: sand production remains relatively stable between 25 and 55 cycles but rises sharply thereafter. Average sand production during cycles 55–100 is 5.27 times higher than during cycles 5–55. These findings indicate that cumulative structural damage to the rock framework intensifies significantly with repeated cycling, making cycle number a critical factor governing sand production in UGS operations.Graphic Abstract
Keywords
Natural gas is a high-quality, efficient, green and clean low-carbon energy. To address the imbalance between the supply and demand of natural gas, a widely adopted solution is the construction of underground gas storage facilities. Such storage systems are artificial gas reservoirs created by injecting natural gas into suitable subsurface formations—such as depleted oil and gas fields, salt caverns, aquifers, or abandoned mines-which function as large-scale containment structures for gas storage. Compared with other types of gas storage, depleted reservoir gas storage has significant economic advantages. It can not only realize gas storage and peak shaving, but also improve oil recovery [1,2,3,4]. Most of the reservoirs consist of poorly consolidated or loose sandstone. Under high-intensity cyclic injection and production, this type of formation is highly prone to formation damage and sand production. At present, many mature oilfields have entered the ultra-high water-cut stage, with reservoir recovery rates approaching the economic limit. Converting them into underground gas storage facilities represents a feasible strategy for repurposing the subsurface space resources of such depleted reservoirs [5,6].
After depleted oil and gas reservoirs are repurposed into underground gas storage facilities, their core operational process involves cyclic injection and withdrawal of natural gas. A defining characteristic of this process is the high-intensity alternation between injection and production phases, which continuously alters the reservoir’s physical properties—such as porosity and permeability. These repeated fluctuations in pressure and fluid flow pose significant challenges to the mechanical stability of the reservoir rock, often leading to rock deformation and sand production [7,8,9]. The periodic injection-production characteristics of gas storage introduce new complex factors. Periodic pressure fluctuations and fluid displacement can induce elastic-plastic deformation of rock and lead to fatigue damage accumulation, thereby reducing the compressive strength and elastic modulus of rock [10]. At present, a large number of scholars have studied the damage mechanism of gas storage rock. Pijnenburg et al. [11] found that the decrease of pore pressure leads to elastic/plastic compaction of sandstone, which provides a theoretical basis for the study of alternating injection-production damage. Yang et al. [12] emphasized that rock mechanics is the core foundation for ensuring wellbore stability and sand control. Lu et al. [13] simulates and evaluates the impact of geological parameters such as permeability and porosity on hydrogen recovery and purity during hydrogen storage in depleted oil and gas reservoirs. Ayal et al. [14] analyzes the critical drawdown pressure in cased holes under different reservoir pressure depletion rates through a formation model to evaluate its impact on sand production. Tang et al. [15] clarified the influence mechanism of multi-cycle injection-production on gas storage capacity through displacement experiments. These studies have clarified the mechanism of reservoir rock damage and sand production under the action of three-phase fluid. It is believed that controlling rock damage is very important to ensure the long-term safe and efficient operation of gas storages reconstructed from water-depleted oil and gas reservoirs.
Beyond the mechanical response of the rock skeleton, the cyclic injection and production also induce complex multiphysical interactions between the resident fluids and the rock formation. After a depleted oil and gas reservoir is converted into an underground gas storage facility, its operation entails complex multiphase flow, phase changes, chemical reactions, and stress-field fluctuations—all resulting from the cyclic injection and production of a three-phase mixture of natural gas, residual oil, and formation water [16,17]. On the one hand, multiphase fluid flow can cause reservoir damage through various mechanisms. Song et al. [18] demonstrated that repeated injection-production cycles result in a gradual degradation of storage capacity. Geng et al. [19] simulated the multi-cycle injection and production processes in underground gas storage facilities reconstructed from depleted reservoirs under high-temperature and high-pressure conditions. Their study qualitatively investigated the impact of reservoir heterogeneity under multi-phase (gas, water, oil) seepage flow, which was shown to exacerbate the loss of storage capacity. Jiang et al. [20] studied the effects of long-term water flooding and multiple rounds of gas flooding on the storage capacity of gas storage through core displacement experiments and overburden pressure porosity and permeability experiments. He et al. [21] confirmed that the interaction between CO2, H2O and rock will lead to the decrease of rock mechanical properties and the damage of reservoir stability. Zhang et al. [22] pointed out that the increase of production pressure difference will aggravate the dissolution of tight sandstone.
On the other hand, the dynamic distribution and wettability alteration of the three-phase fluid influence effective stress transfer and the contact behavior between rock particles [23,24]. These factors govern both the distribution and flow dynamics of the multiphase fluid, ultimately leading to hydrodynamic damage within the reservoir rock. Omirbekov et al. [25] revealed the significant effect of fluid rheology on sand production, and proved that the scouring force of high viscosity fluid significantly induced sand production. Eyitayo et al. [26] found that the alternating injection of CO2-brine increased the porosity of the core by 7.8%, indicating that the microstructure of the reservoir rock changed. Cartagena-Pérez et al. [27] proposed that CO2 injection can re-activate reservoirs and inhibit sand production, providing new ideas for controlling reservoir rock damage and solving sand production problems. Rasmussen et al. [28] revealed that the reservoir wettability has dynamic evolution characteristics, and its change directly controls the fluid distribution in the pores, and significantly affects the sand production risk by changing the fluid-particle force. The interplay between three-phase fluid behavior and rock damage exhibits significant coupling, wherein fluid phase change, chemical reactions, and mechanical damage act in synergy, thereby jeopardizing the long-term operational safety of the gas storage. Previous research has summarized several key mechanisms under alternating injection-production conditions in three-phase systems, covering reservoir rock damage, the effects of cyclic injection and production, as well as multiphase fluid flow and sand production [29,30,31]. It is widely acknowledged that within a three-phase (gas, oil, water) system, chemical fluid-rock interactions significantly weaken the mechanical integrity of the rock, thereby elevating the risk of sand production [32,33]. Since most underground gas storage facilities currently in operation are repurposed from depleted reservoirs with high water cuts, their operation involves complex three-phase (oil-gas-water) flow.
Previous research has investigated the relationship between three-phase fluid behavior and rock damage. Nevertheless, how this relationship evolves systematically under cyclic injection-production conditions remains poorly understood. A more specific limitation is that existing research provides an insufficient explanation of how cyclic injection-production affects the evolutionary laws of rock damage under fluid phase change scenarios. This knowledge gap limits the applicability of existing models to practical scenarios, particularly in predicting sand production during cyclic injection-production operations in gas storage facilities converted from high-water-cut reservoirs. To address this, our study systematically investigates the impact of alternating injection and production under varying water-oil ratios through dedicated physical simulation experiments. We replicated the three-phase flow environment of a nearly depleted, high-water-cut reservoir and conducted a series of cyclic injection-production tests. Based on the experimental data, a polynomial model was established via regression analysis to quantify sand production in relation to key influencing factors. This work aims to provide a theoretical foundation and technical support for sand control strategies, ensuring the long-term safety and operational stability of underground gas storage facilities.
The experimental core was obtained from a gas storage layer characterized by a relatively simple broken-nose structure. The target layer consists of a braided-river delta front deposit, forming a sandstone reservoir with medium porosity and medium permeability. The average porosity of the core is 22.7%, the permeability is 167.7 × 10⁻³ μm2, and the buried depth of the reservoir is −2310~−2620 m. The specific data of the core are shown in Table 1.
Table 1: Core basic data.
| Well Number | Core Depth (m) | Number of Cores | Permeability Range before Experiment (10−3 μm2) |
|---|---|---|---|
| 13- | 2698.74 | 4 | 1.72~3.38 |
| 2839.06 | 5 | 102.54~139.19 | |
| 2700.92 | 5 | 80.76~89.63 | |
| 2824.87 | 5 | 120.38~197.79 | |
| 2832.37 | 4 | 30.00~39.26 |
Distilled water, kerosene, and nitrogen were employed in the experiment due to their highly stable properties. These substances were used to simulate the alternating injection and production processes in gas storage facilities. This approach was adopted to minimize interference from extraneous physicochemical properties and thus prevent reservoir damage or blockage caused by such factors. The experimental methodology involved altering only one parameter at a time to systematically assess its impact on the reservoir’s geological structure and physical properties. Key factors examined were the core water-oil ratio and the number of alternating injection-production cycles.
Fig. 1 is an experimental device for rock damage of gas storage, which can simulate the alternating injection and production process of gas storage under multiphase conditions. The experimental device can simulate the experimental conditions of single-phase, two-phase and three-phase. It can directly perform alternating gas displacement on the core in the oil-water mixed state without replacing the displacement equipment. The sensor is connected to the computer system to record the changes of key parameters such as core gas flow, pressure difference and flow rate at both ends in real time. Real-time monitoring of reservoir damage and sand production caused by actual alternating injection and production of gas storage with different water-oil ratios is realized. The experimental device includes a gas-liquid switching device, a pressurization device, a formation simulation device, a sensor acquisition device and a sampling device.
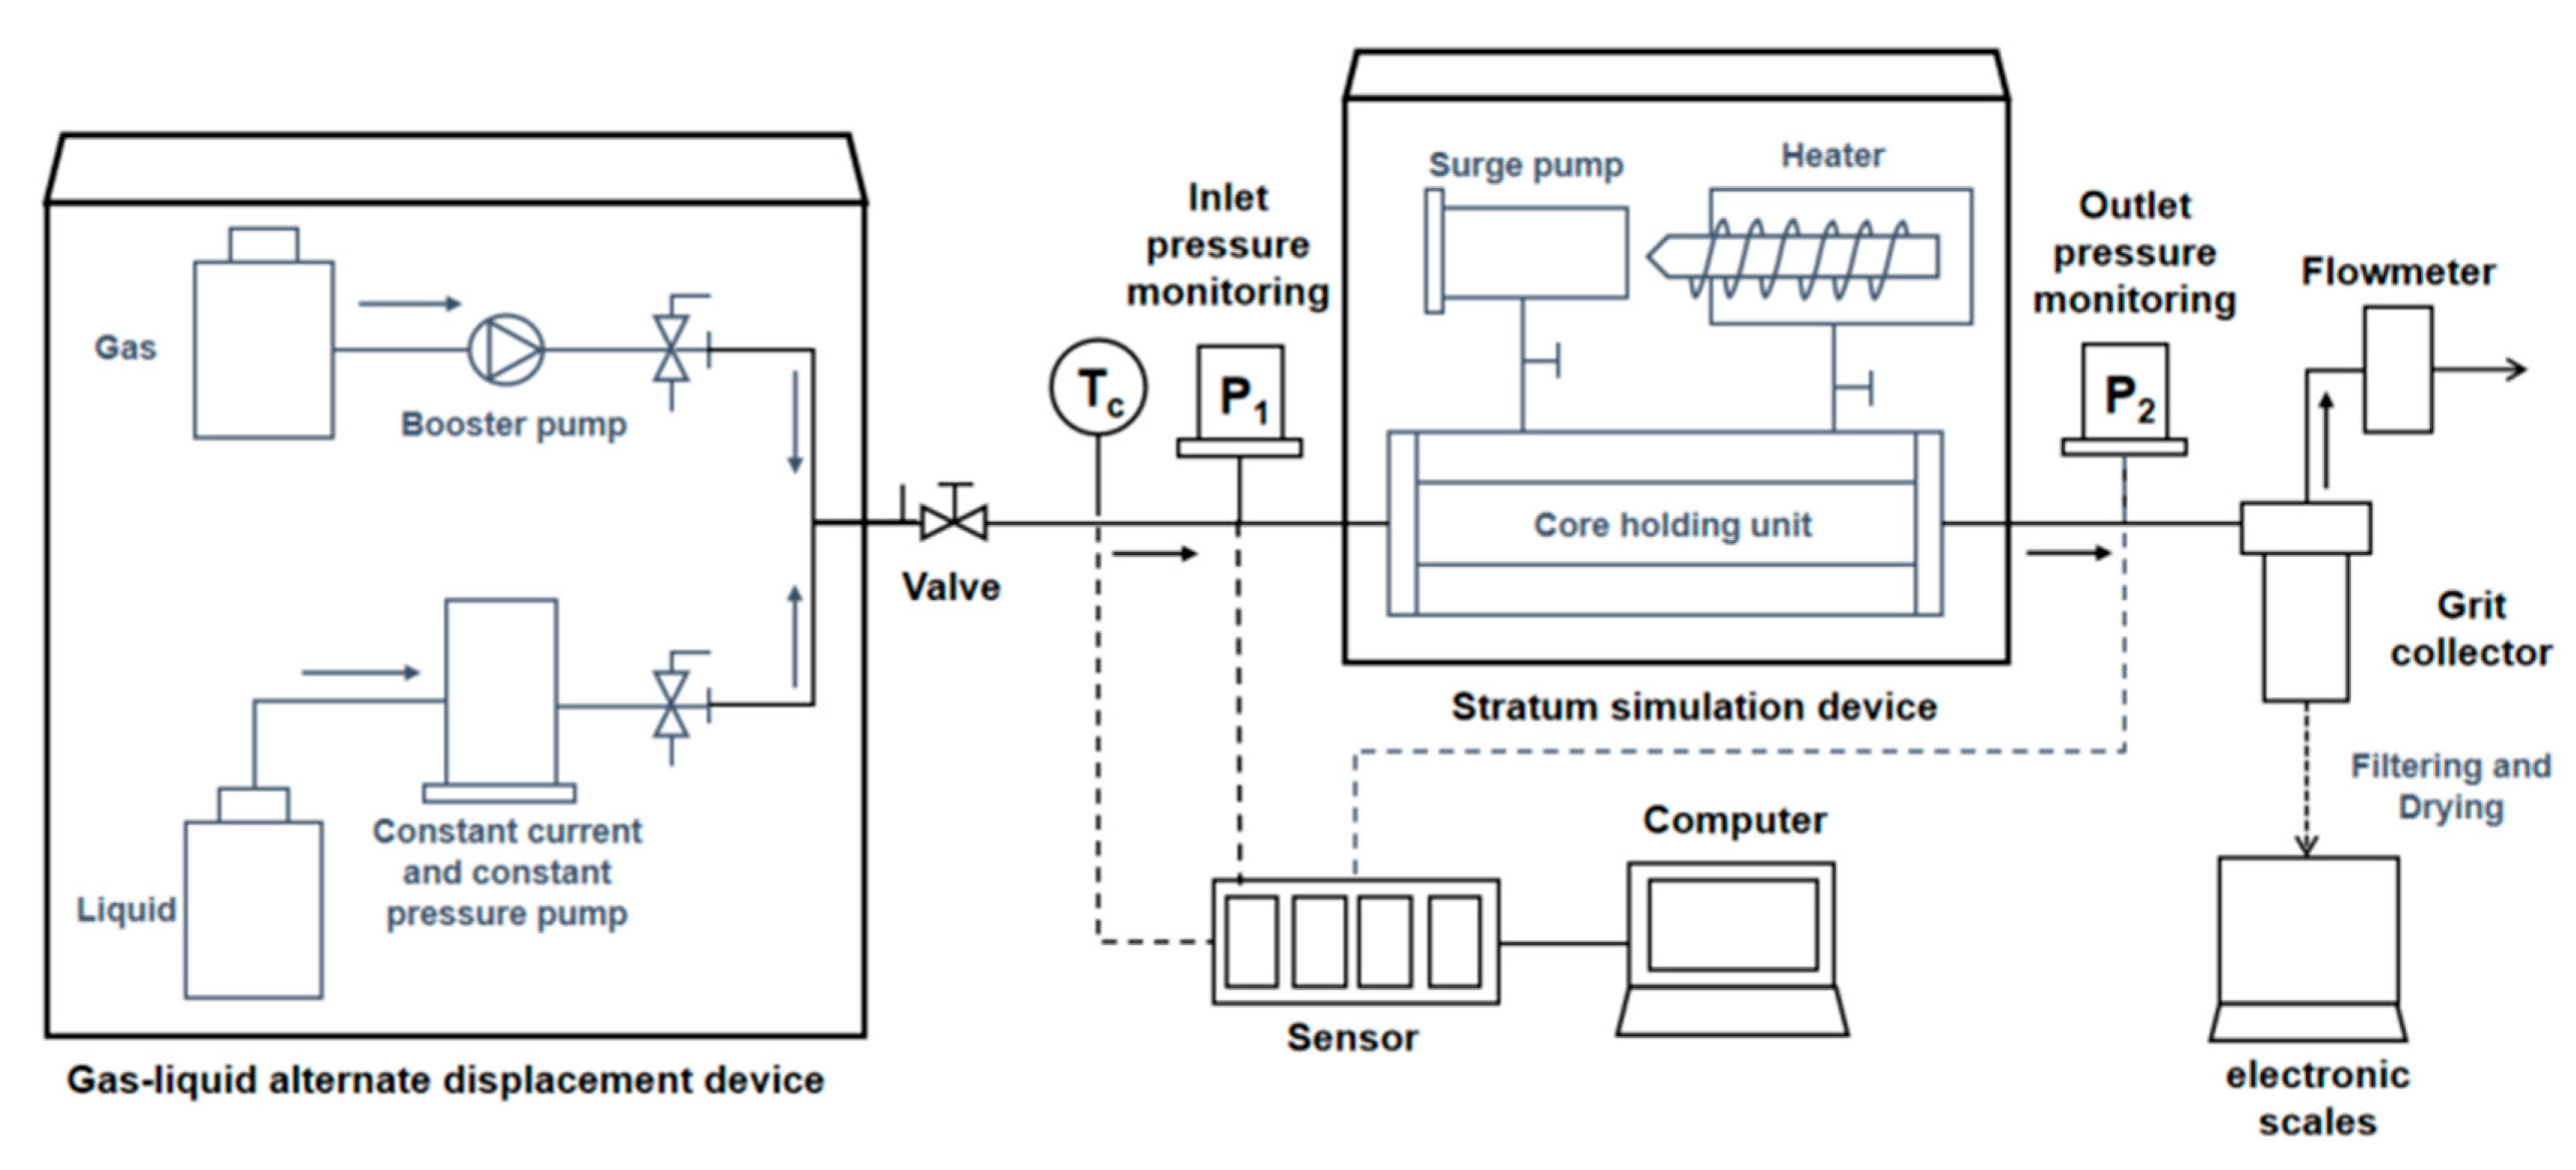
Figure 1: The figures of experiment installing.
- (1)The booster pump provides the inlet pressure required for the experiment by compressing the supply gas of the gas cylinder.
- (2)The constant flow constant pressure pump provides alternating pressure for the core fixing device to simulate the alternating injection and production situation.
- (3)The core holder is a core fixing device. After measuring the permeability of the core used in the experiment, it is placed in the core holder. The simulated formation temperature and pressure are loaded with confining pressure on the core and the core is heated to the simulated formation temperature. After setting the pressure difference at both ends of the core, the fluid is injected into the holder for the experiment.
- (4)The sensor acquisition device collects the data of inlet pressure, outlet pressure, confining pressure, inlet temperature, formation temperature and gas flowmeter, and transmits them to the computer for data processing, and generates a change curve to observe the core damage.
- (5)The collection device includes a liquid flowmeter and an effluent collection device, which is used to measure the flow rate of the fluid and collect the sand produced by the experiment. After filtration, the sand quality is obtained by weighing it with an electronic balance.
All experiments were conducted at a constant temperature of 80°C, with a confining pressure of 5 MPa, and nitrogen as the flowing phase. The outlet pore pressure was maintained at atmospheric pressure. It is important to note that the alternating pressure cycle was implemented by modulating the inlet pressure only, with no reversal of the flow direction. This approach enables the simulation of cyclic stresses on the reservoir rock framework during injection/production cycles without requiring the complexity of flow reversal.
The core of saturated oil is displaced by using water samples with different flow rates in a fixed time, so that the core is oil-water two-phase. The water-oil ratio within the core at this stage is calculated, and the critical pressure differential across the core under various water-oil ratios is analyzed. Subsequently, an alternating gas flooding experiment was conducted on the core saturated with oil and water, allowing the sand production behavior under different water-oil ratios to be observed.
3.1 Cores with Different Water-Oil Ratios Are Formed
To investigate sand production under varying water-oil ratios after alternating gas flooding, the core samples were first saturated with kerosene and then displaced with actual formation water. This process created an oil-water mixture within the core (the experimental schematic is shown in Fig. 2. By applying different displacement flow rates, various water-oil ratios were established inside the cores, enabling the observation of sand production across these different fluid saturation conditions.
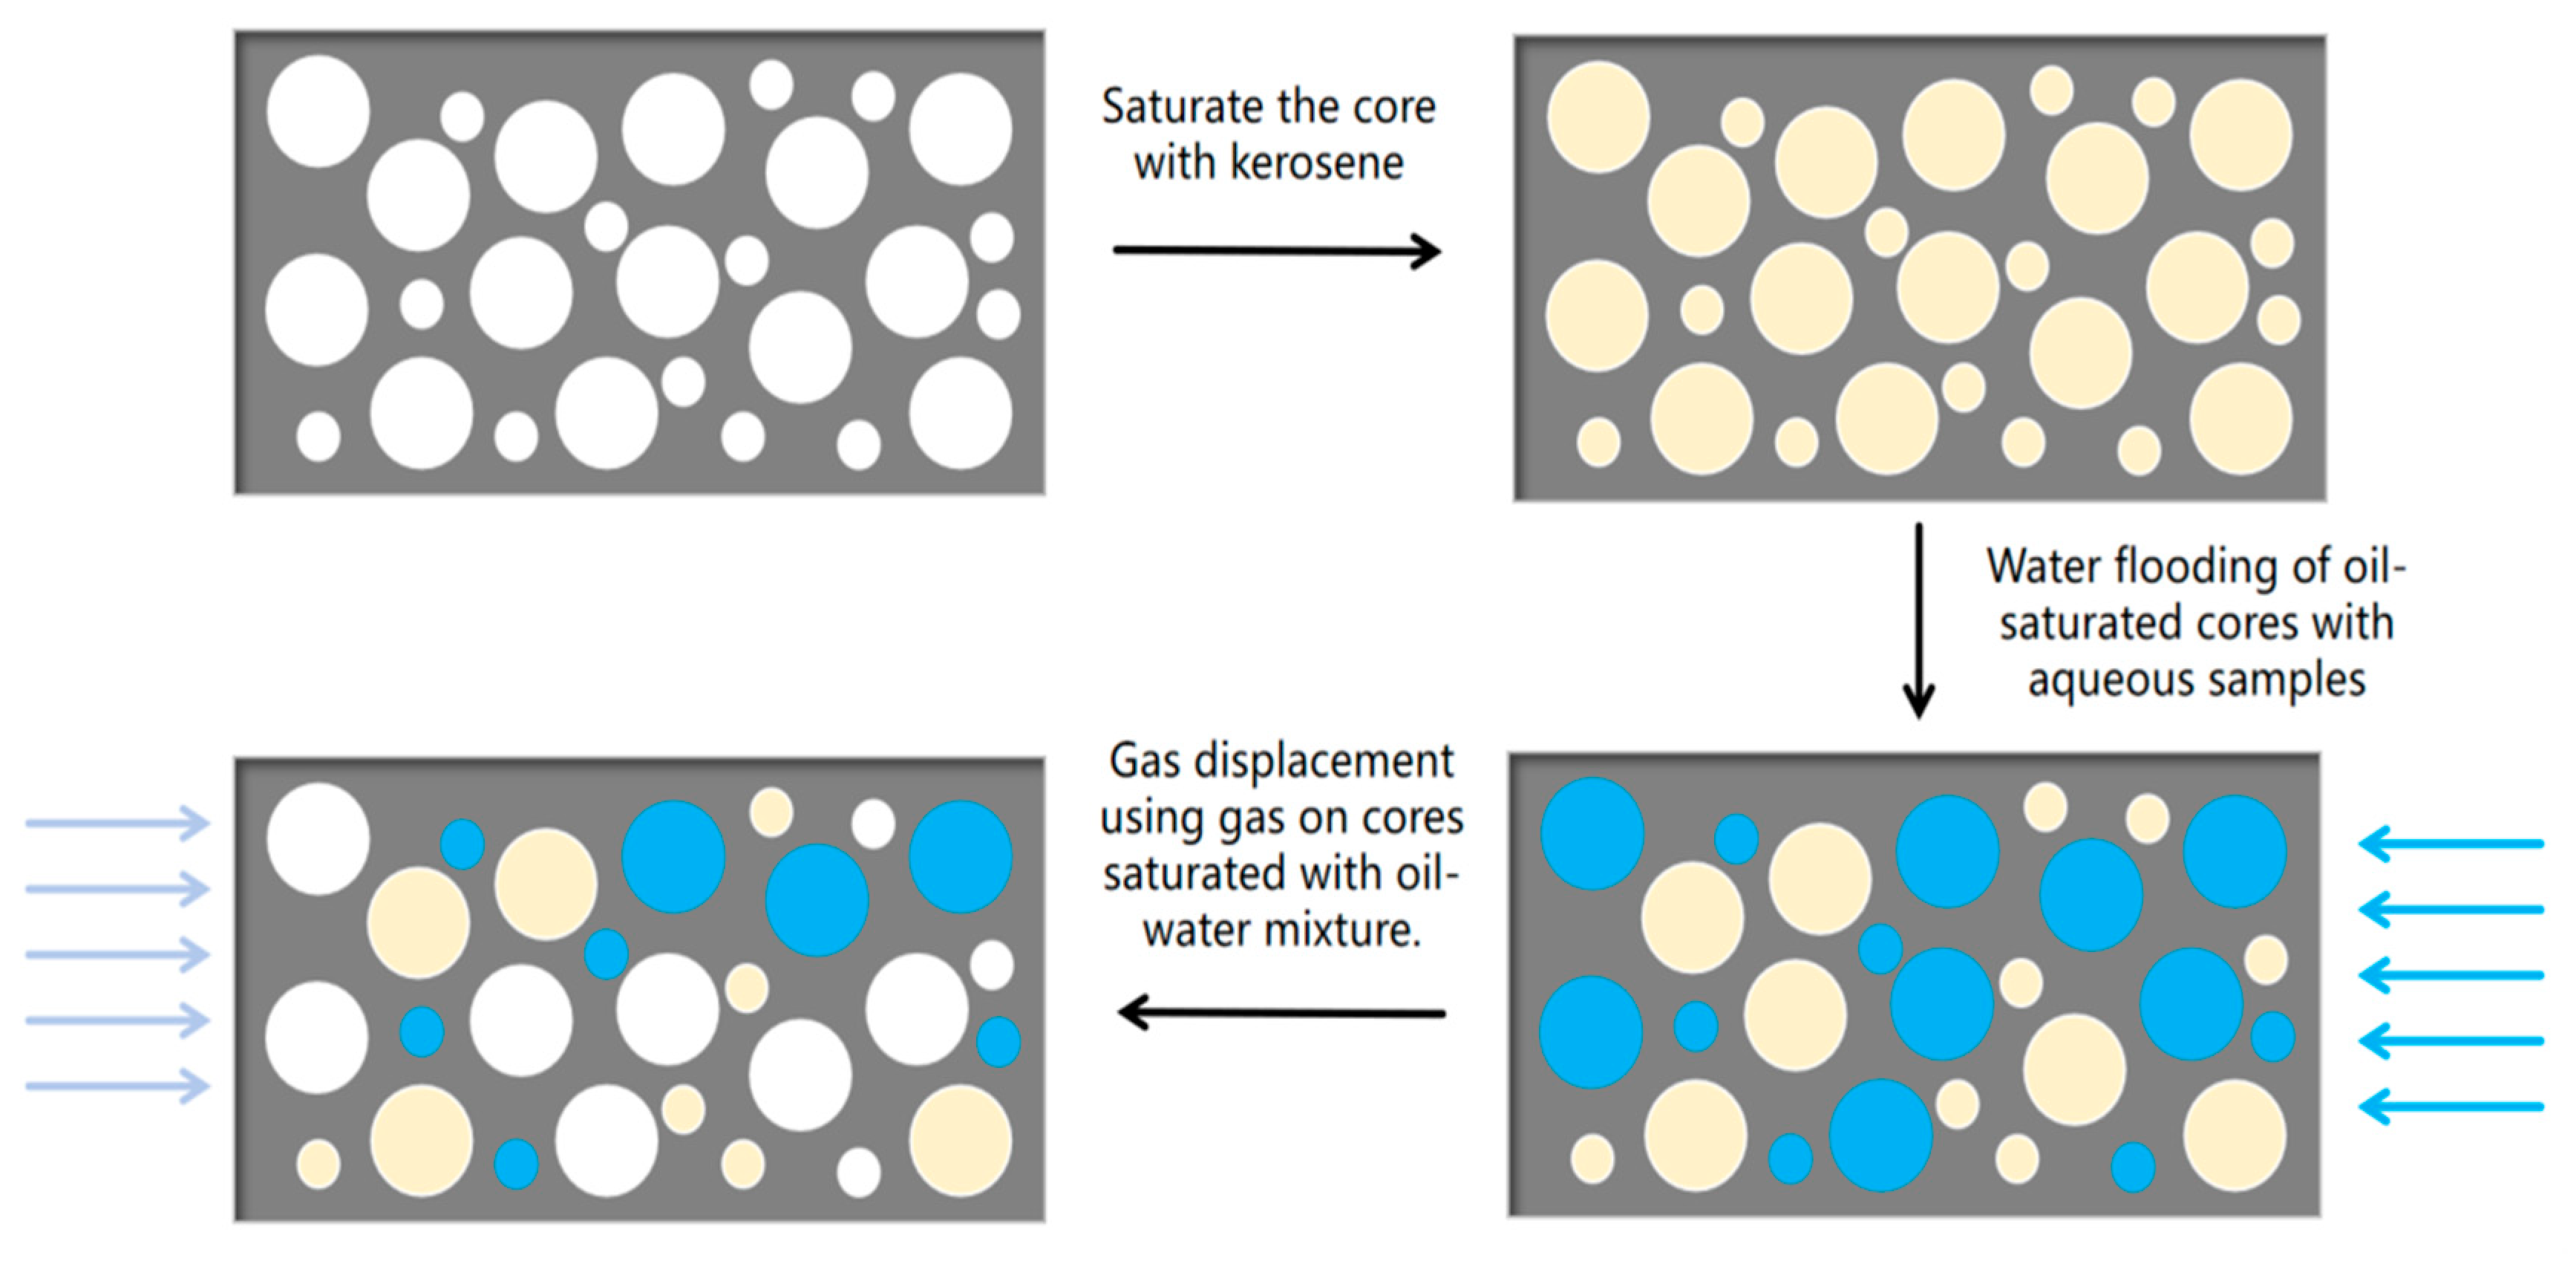
Figure 2: Experimental schematic diagram.
The water-oil ratio is the ratio of water-bearing volume to oil-bearing volume in the core. The pore volume of the core and the mass change before and after water flooding were measured experimentally. And the water-oil ratio after different flow displacement rates is calculated using Formula (1). The formula for determining the water-bearing volume of the core is provided as follows.
By adjusting the liquid displacement time and injection flow rate, the water-oil ratio of the core can be accurately controlled. The water-oil ratio is calculated from the measured water-bearing volume of the core, which serves as the basis for critical pressure difference and alternating displacement experiments.
3.2 Critical Pressure Difference of Cores with Different Water-Oil Ratios
The purpose of this experiment is to study the influence of different injection-production flow rates on fluid distribution and sand production behavior in cores. Specifically, by changing the fluid injection rate in the three-phase experiment, different water-oil ratio environments are formed in the core, and alternating injection-production experiments are carried out under these conditions. In the experiment, the system compares the corresponding liquid flow rate and sand production under different water-oil ratio conditions. The specific experimental steps are as follows:
- (1)First, the core is saturated with kerosene, and the porosity of the core is calculated by weighing the mass difference before and after.
- (2)The water samples with different flow rates (0.3, 0.4, 0.5, 0.6, 0.7 mL/min) were used to displace the core for a short time (5 min). The core was taken out and the water-oil ratio in the core was calculated according to Formula (1).
- (3)The displacement experiment is carried out on the core that has been mixed with water and oil, the displacement pressure difference is continuously increased, the sand production of the core is observed, and the critical pressure difference of the core is determined.
In the alternating gas flooding experiment, since the displacing gas is vented directly after passing through the apparatus, the outlet pressure is maintained at atmospheric pressure.
3.3 Effect of Alternating Injection-Production on Cores with Different Water-Oil Ratios
Following the critical pressure difference measurements at various water-oil ratios (Section 3.2), the five core samples were subsequently used for water flooding experiments. The core was first saturated with kerosene prior to water flooding. Water samples were used to displace sandstone at a rate of 0.3, 0.4, 0.5, 0.6, 0.7 mL/min, and the water-oil ratio formed in the core was calculated after water flooding. Subsequently, gas was injected to displace the oil-water saturated core in order to determine the critical sanding pressure differential. Following the procedures outlined in Table 2, alternating displacement experiments were conducted on cores with different water-oil ratios, during which sand production was monitored in real time.
Table 2: Experiment content.
| Core Number | Injection Rate (mL/min) | Experimentation |
|---|---|---|
| B-1 | 0.3 | Under the condition of stable confining pressure (5 MPa), the alternating experiment was carried out by alternately applying the inlet pressure. One alternating cycle is defined as a full pressure loop from the base differential pressure of 0.5 MPa up to 3.5 MPa and back again. After every five alternating cycles, the core was subjected to a gas flow measurement, during which its integrity was visually inspected and its mass change was recorded. |
| B-2 | 0.4 | |
| B-3 | 0.5 | |
| B-4 | 0.6 | |
| B-5 | 0.7 |
Because it is difficult to observe the sand production of the core during the actual experiment, the sand production of the core is judged by measuring the quality change of the core after displacement. Given the heterogeneity of the experimental core samples, a single representative core sample was used for each experimental condition (as detailed in Table 2) in this study. Firstly, all experiments were performed under rigorously identical and controlled conditions. Furthermore, the key trends observed were not only highly reproducible across the different experimental groups but also consistent with a clear physical mechanism. Therefore, we contend that the results provide a strong and representative characterization of the system’s behavior.
3.4 Sand Production Quantification and Uncertainty Analysis
The cumulative mass of sand produced during each experimental stage was determined using the mass difference method. For every measurement, the core was meticulously extracted from the core holder. The dry mass of the core sample was measured before the experiment and following each alternating cycle suite using a high-precision analytical balance (accuracy: ±0.1 mg). A strict cleaning and drying procedure are conducted prior to every mass measurement. This involves flushing with toluene and then vacuum-oven drying at 70°C until a constant mass is reached (change <0.01 mg per 2 h). These steps ensure that the measurement results are not influenced by residual fluids.
The most significant contribution to the measurement uncertainty stems from the balance accuracy. To mitigate this, all mass measurements were performed in triplicate, and the mean value was adopted to enhance reliability. The resulting standard uncertainty, calculated from the standard deviation of repeated measurements and balance specifications, was below ±0.5 mg. This value is considered insignificant as the measured sand production was consistently orders of magnitude larger (on the order of tens to hundreds of milligrams).
4.1 Obtain Cores with Different Water-Oil Ratios
In order to explore the sand production following alternating flooding under various water-oil ratios, the core sample was initially saturated with kerosene. Subsequently, displacement was performed using actual formation water. This process established an oil-water mixture within the core, thereby simulating reservoir fluid conditions. The experimental setup is illustrated schematically in Fig. 1. The displacement cores with different flow rates are used to form different water-oil ratios inside the cores, and the sand production of the cores under different water-oil ratios is observed.
The water-oil ratio after displacement at different flow rates was determined using Eq. (1), based on measurements of the core’s pore volume and mass change before and after water flooding. The calculated results are summarized in Table 3.
Table 3: Water-oil ratio of core after different flow displacement.
| Core Number | Injection Rate (mL/min) | Implantation Time (min) | Core Porosity (%) | Quality before Water Flooding (g) | Quality after Water Flooding (g) | Water-Oil Ratio |
|---|---|---|---|---|---|---|
| B-1 | 0.3 | 5 | 21.66 | 57.53 | 57.71 | 0.22 |
| B-2 | 0.4 | 5 | 21.23 | 60.22 | 60.43 | 0.25 |
| B-3 | 0.5 | 5 | 21.59 | 55.64 | 55.99 | 0.55 |
| B-4 | 0.6 | 5 | 21.02 | 62.51 | 62.93 | 0.63 |
| B-5 | 0.7 | 5 | 22.38 | 60 | 60.59 | 1.21 |
The core was displaced at flow rates of 0.3, 0.4, 0.5, 0.6, and 0.7 mL/min using formation water, with each rate maintained for 5 min. The resulting water-oil ratios after flooding were 0.22, 0.25, 0.55, 0.63, and 1.21, respectively. These results indicate that, under constant displacement time, higher injection rates lead to higher water-oil ratios in the core.
4.2 Critical Sanding Pressure Difference
Experimental investigations were conducted to evaluate the critical sand production behavior of core samples under varying water-oil ratios. Critical sanding pressure difference measurements were performed on cores with water-oil ratios of 0.22, 0.25, 0.55, 0.63, and 1.21. During the experiment, gas displacement was employed to incrementally or continuously increase the pressure differential across the core until the critical sanding threshold was attained. The mass change of the core was measured and recorded at each pressure differential level. The mass variation of each experimental core with displacement pressure differential is shown in Fig. 3.
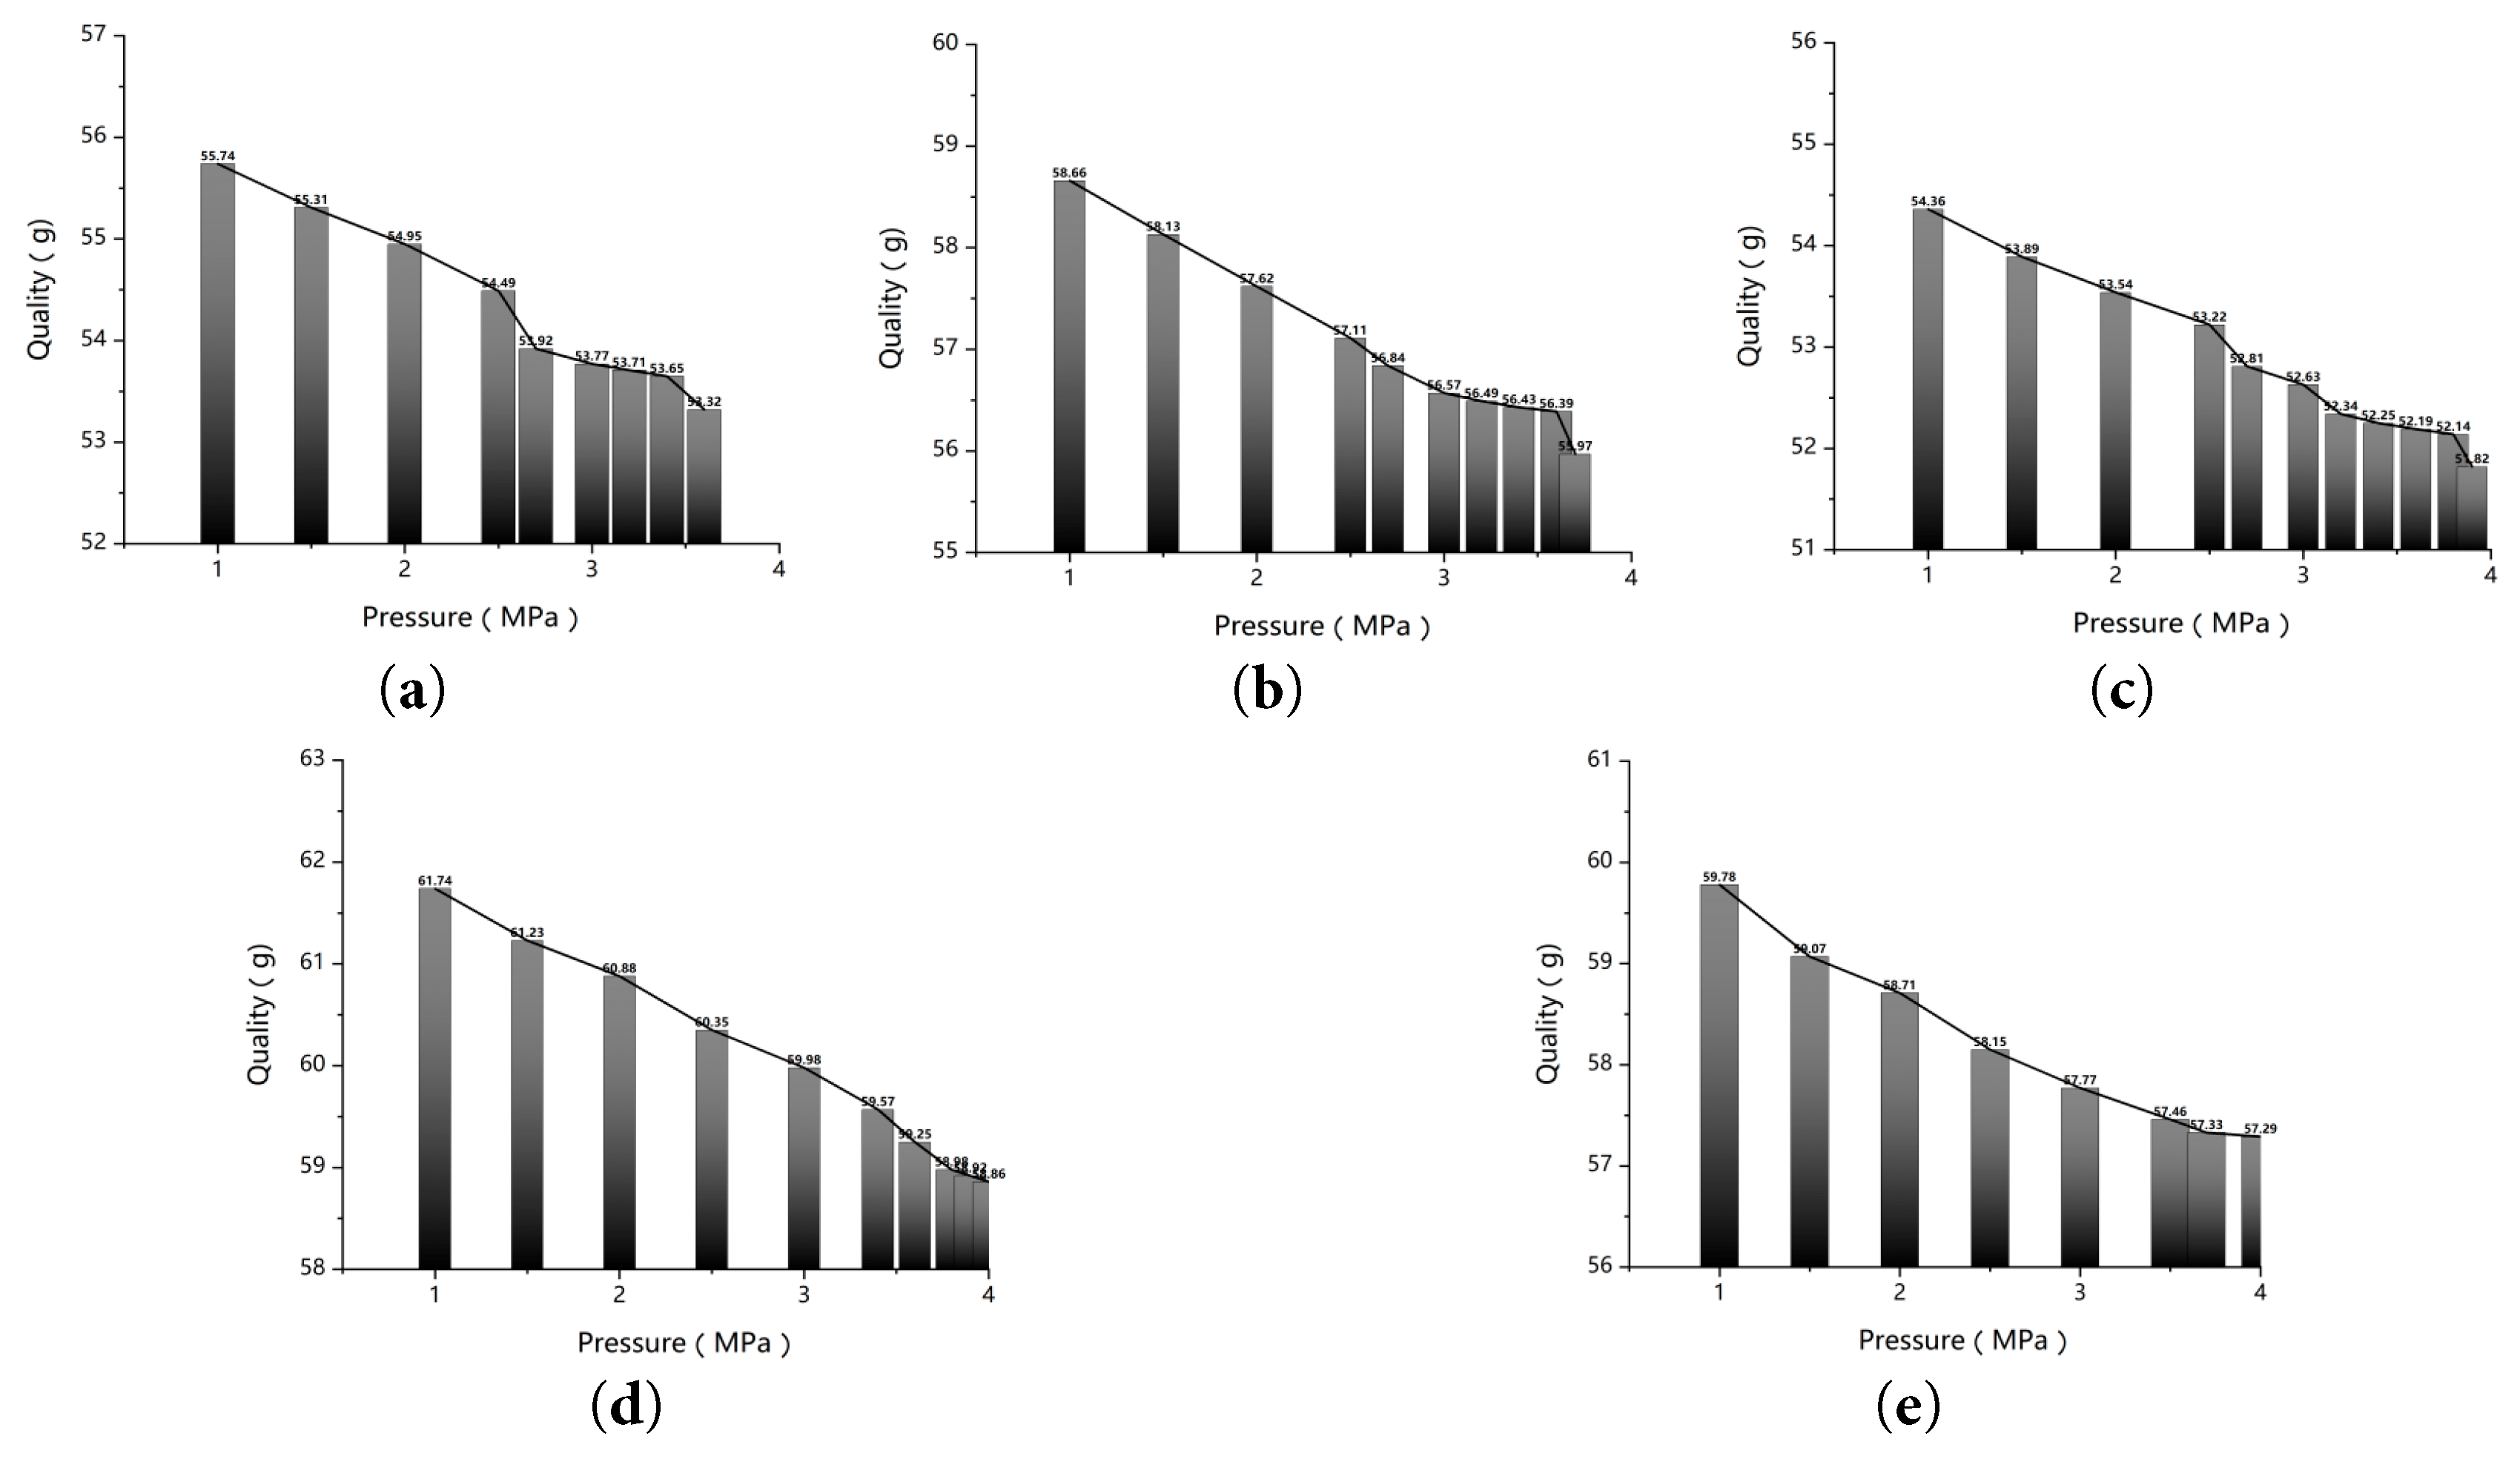
Figure 3: The change of core quality with different water-oil ratio in the process of displacement. (a) Water-oil ratio is 0.22. (b) Water-oil ratio is 0.25. (c) Water-oil ratio is 0.55. (d) Water-oil ratio is 0.63. (e) Water-oil ratio is 1.21.
Observation of mass variation in cores with different water-oil ratios under critical pressure differential—after accounting for mass loss during disassembly—revealed that core mass tended to stabilize once the displacement pressure differential reached a specific threshold. This indicates that the core attained a state of irreducible water saturation, at which the residual fluid could no longer be mobilized despite further increases in injection pressure. Following a period of stability, a pronounced inflection point was observed, coinciding with a marked reduction in core mass—signifying the initiation of sand production. The pressure differential at which this inflection occurred is defined as the critical sand production pressure differential.
The same experimental procedure was repeated for the remaining core samples. The results indicate that under water-oil ratios of 0.22, 0.25, 0.55, 0.63, and 1.21, the corresponding critical sanding pressure differences were 3.6, 3.7, 3.9, 4.1, and 4.4 MPa, respectively. These values demonstrate a clear trend of increasing critical sand production pressure difference with rising water-oil ratio.
4.3 The Influence of Alternating Times on Sand Production
The initial phase examined sand production under dry core conditions. A series of five identical alternating displacement experiments were performed, with mean sand production values serving as the basis for analyzing cyclical correlations. The primary objective of this work is to examine the correlation between sand production and displacement cycles using regression analysis. The experimental dataset is limited in size but high in measurement precision. Therefore, Newton’s interpolation method was selected for polynomial modeling. A key advantage of this method is that it ensures the fitting curve passes exactly through every data point. This property provides an accurate representation of the experimental trend. Consequently, the approach is well-aligned with the research objectives of interpolation and trend analysis. Compared to the least-squares method—which is more appropriate for extrapolation and prediction—Newton’s interpolation offers more intuitive and precise analytical outcomes for the intended scope of this work.
A polynomial model was established using Newton’s interpolation method to correlate core mass loss with the number of cycles. This model enables the prediction of sand production under various cycling conditions. Furthermore, the trend of sand production versus the number of cycles is shown in Fig. 4.
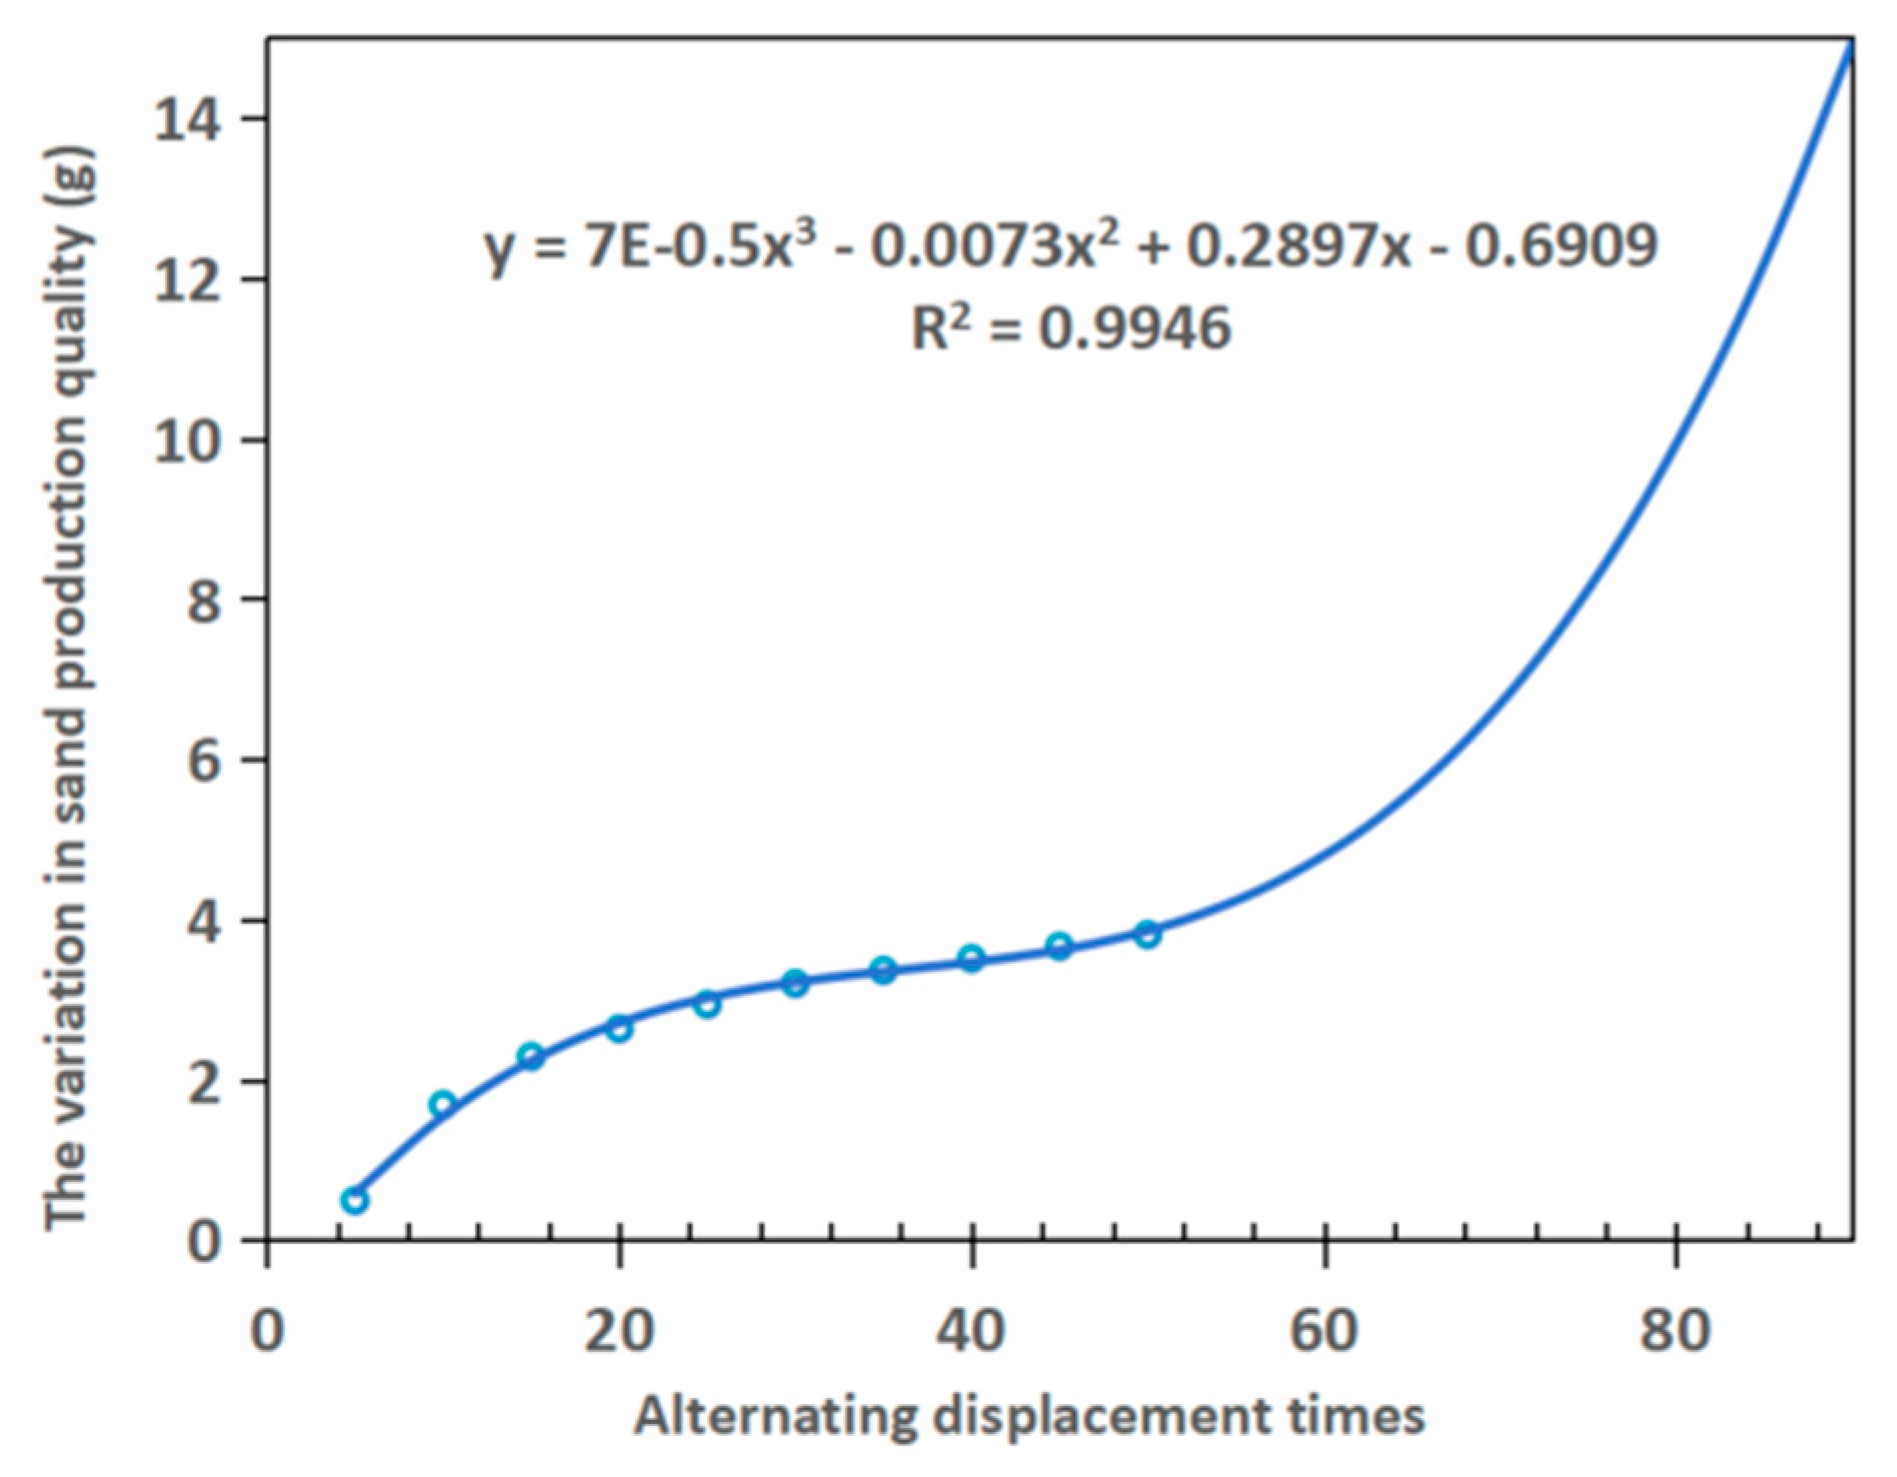
Figure 4: Core quality change diagram under alternating injection-production conditions.
As shown in Fig. 4, the core sand production rate exhibits three distinct phases in response to the increasing number of alternating cycles: an initial increase, followed by a stabilization period, and then a final phase of significant acceleration. The trend of sand production shows a period of stability between 25 and 55 alternating cycles, after which the rate climbs markedly with further cycles. The established polynomial model was used to calculate the average sand production rates during cycles 5–55 (phase I) and cycles 55–100 (phase II), which were determined to be 0.086 g/cycle and 0.455 g/cycle, respectively. The average sand production during the phase II of alternating displacement was 5.27 times higher than that in the phase I. Concurrent visual observations confirmed that sand production from the core became progressively more severe as the number of cycles increased.
Following the investigation into the relationship between alternating displacement cycles and sand production, the influence of the core water-oil ratio on sand production was examined. According to the results of Experiment 4.2, the critical pressure difference of the core sample was measured to be 3.6, 3.7, 3.9, 4.1, and 4.4 MPa corresponding to water-oil ratios of 0.22, 0.25, 0.55, 0.63, and 1.21, respectively. A gas pressure alternating displacement experiment was conducted on cores with different water-oil ratios using a pressure alternation interval of 0.5 MPa and 3.5 MPa. The changes in core mass during the alternating process and the variation in gas flow through the core under constant pressure are presented in Fig. 5.
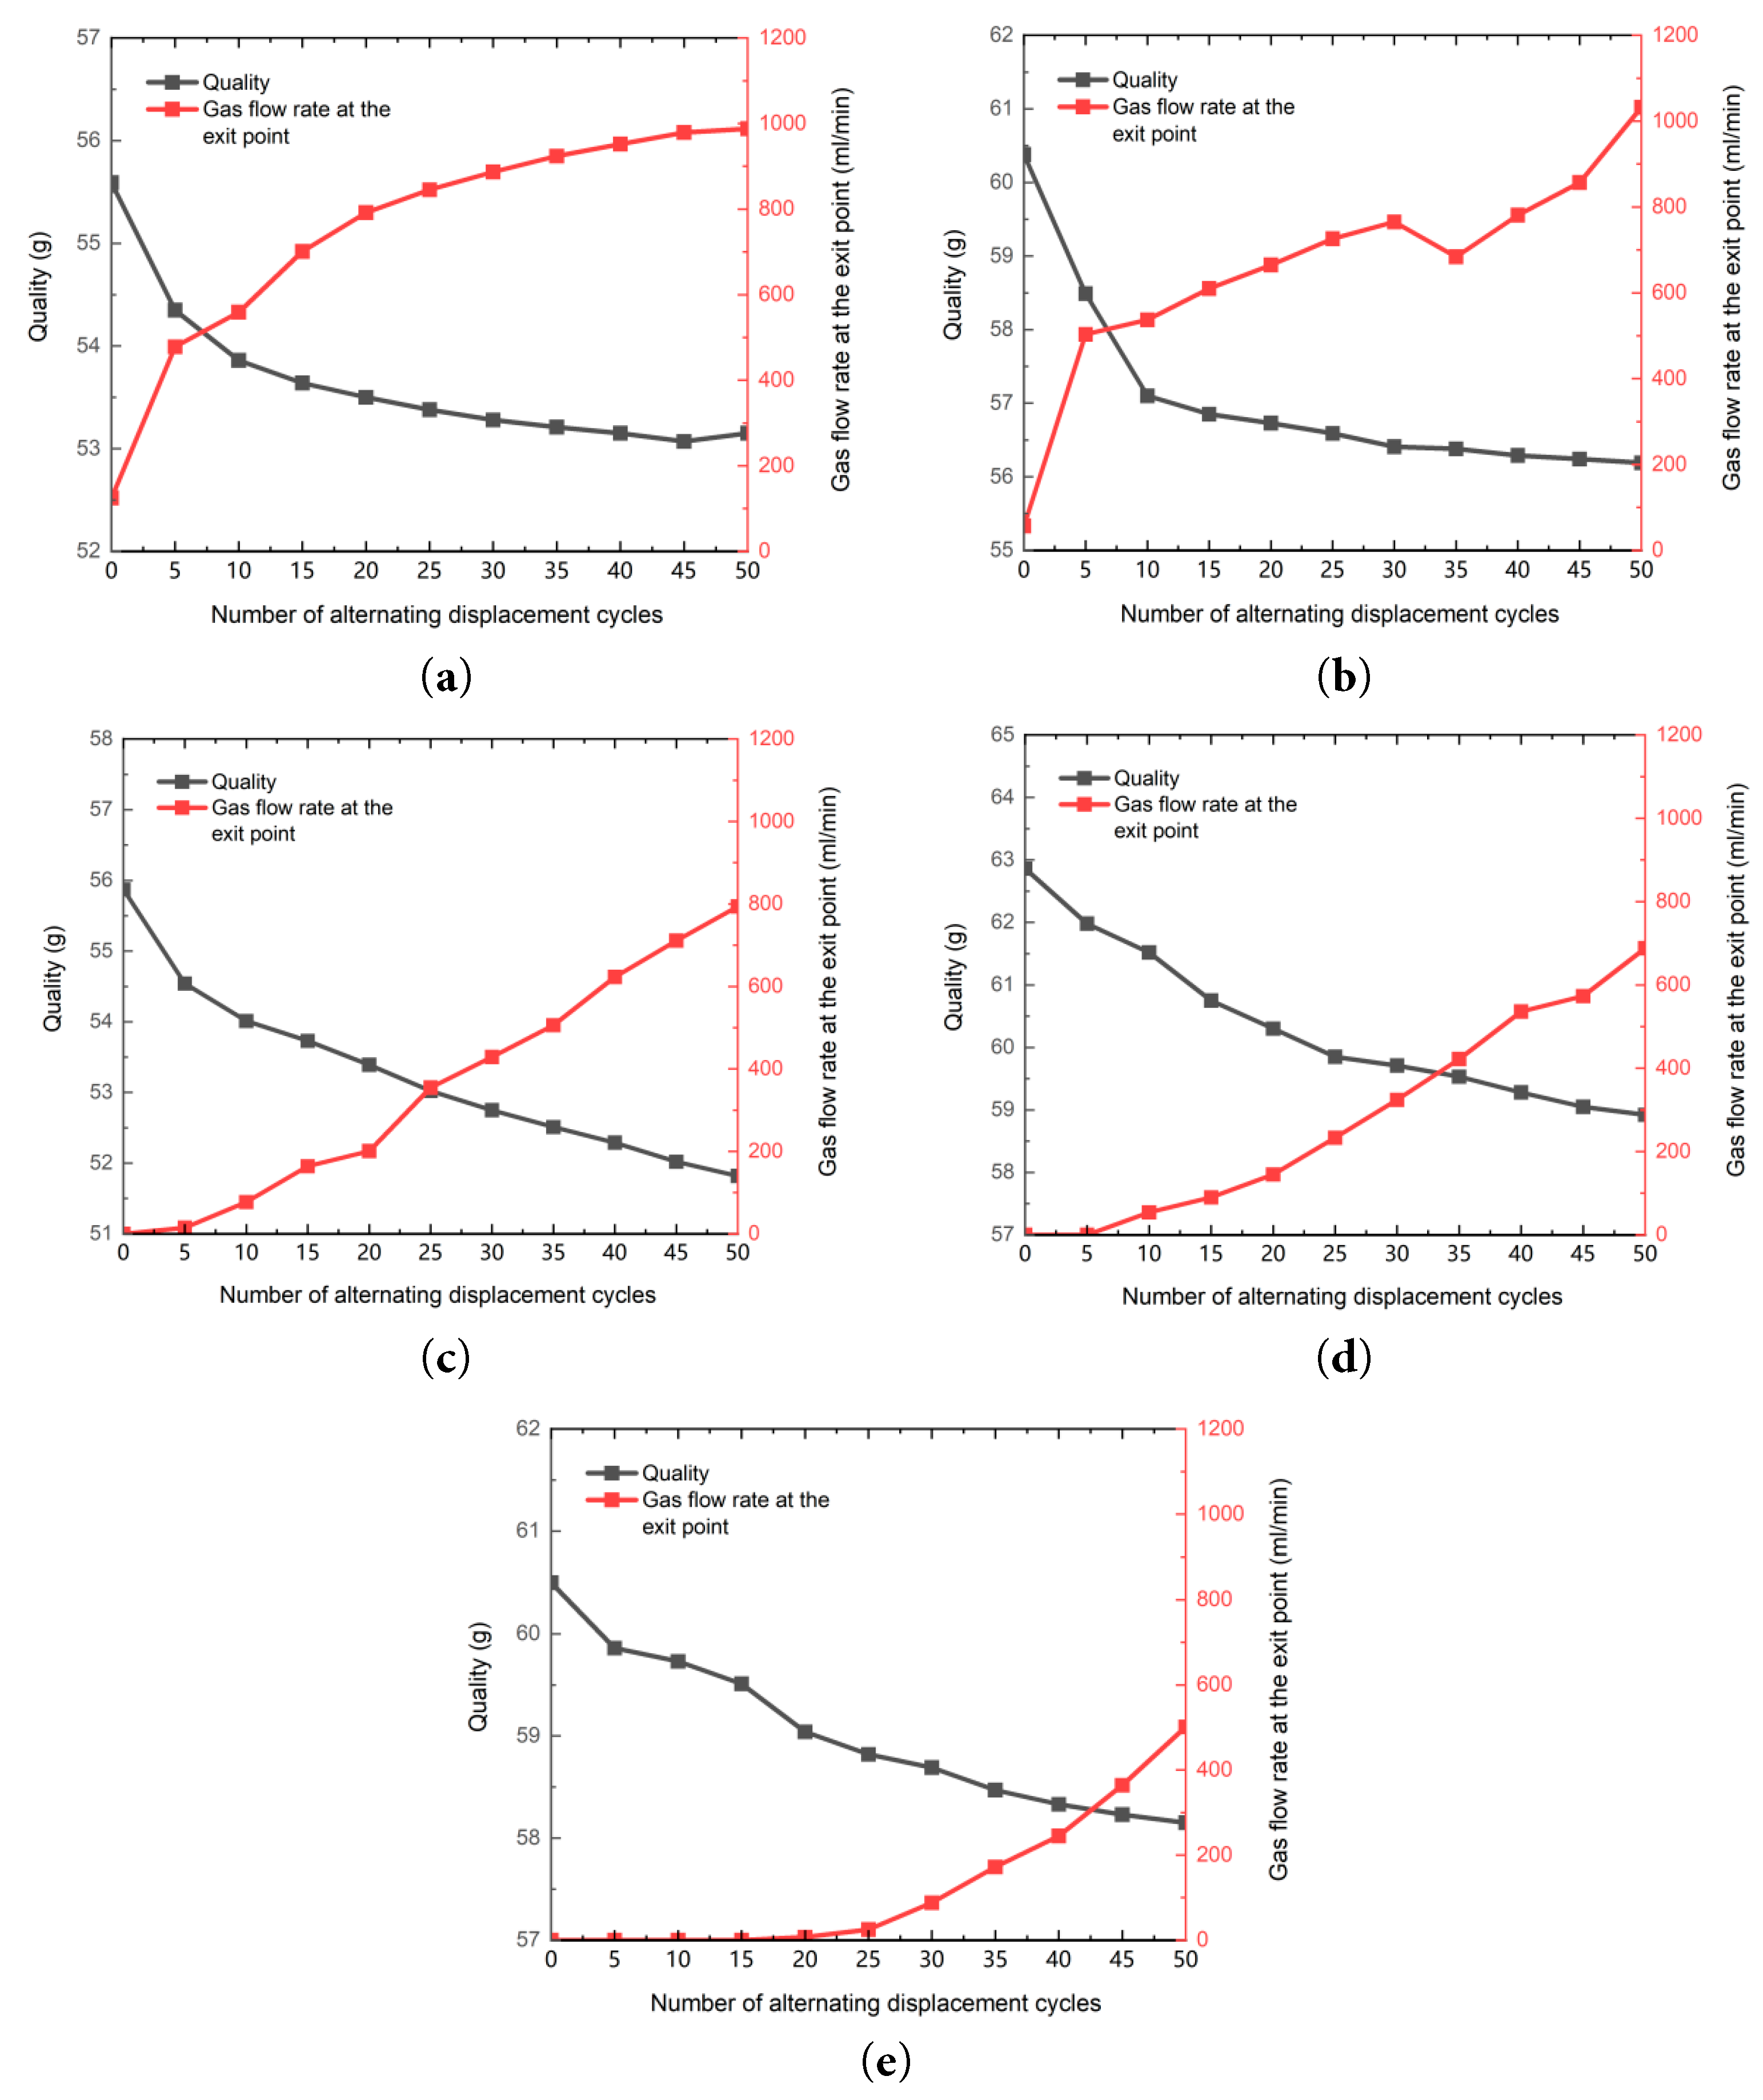
Figure 5: Alternating injection-production variation diagram of cores with different water-oil ratios. (a) Water-oil ratio is 0.22. (b) Water-oil ratio is 0.25. (c) Water-oil ratio is 0.55. (d) Water-oil ratio is 0.63. (e) Water-oil ratio is 1.21.
Fig. 5 shows that the lower the water-oil ratio of the core (i.e., the higher the oil content), the more efficient the gas displacement is in draining liquid from the core. The early stage of displacement is characterized by a rapid decline in core mass and high liquid production, which later stabilizes. Additionally, a higher water-oil ratio correlates with a lower initial gas flow rate and a more gradual increase in gas flow. Therefore, it can be concluded that when the core exhibits a high water-oil ratio, indicating high water content in the reservoir, liquids become more difficult to displace from the core. This will further complicate the injection and production operations in gas storage facilities. The core was dried and characterized for mass and permeability after the alternating displacement experiment to evaluate its internal structural changes. The corresponding data are summarized in Table 4.
Table 4: Changes of cores with different water-oil ratios before and after alternating displacement.
| Core Number | Quality before Experiment (g) | Permeability before Experiment (mD) | Water Flooding Velocity (mL/min) | Initial Water-Oil Ratio | Core Quality after 50 Times of Alternation (g) | Quality after Drying (g) | Permeability after Drying (g) | Poor Quality before and after the Experiment (g) | Permeability Variation |
|---|---|---|---|---|---|---|---|---|---|
| B-1 | 52.89 | 141.14 | 0.3 | 0.22 | 53.07 | 52.67 | 153.03 | 0.22 | 8.42% |
| B-2 | 55.42 | 171.40 | 0.4 | 0.25 | 56.19 | 55.23 | 185.51 | 0.19 | 8.23% |
| B-3 | 51.10 | 149.01 | 0.5 | 0.55 | 51.82 | 50.97 | 168.09 | 0.13 | 12.80% |
| B-4 | 57.51 | 167.86 | 0.6 | 0.63 | 58.92 | 57.39 | 191.43 | 0.12 | 14.04% |
| B-5 | 55.03 | 155.78 | 0.7 | 1.21 | 58.15 | 54.95 | 177.98 | 0.08 | 19.83% |
Changes in core mass and permeability were observed before and after the experiment under various water-oil ratios. The mass difference before and after the experiment was considered as the sand production. A polynomial model relating sand production, permeability change, and water-oil ratio was established using Newton’s interpolation method. The polynomial models established in this study are based on the current experimental dataset and are primarily intended to reveal variation trends among the parameters. The resulting trends are presented in Fig. 6.
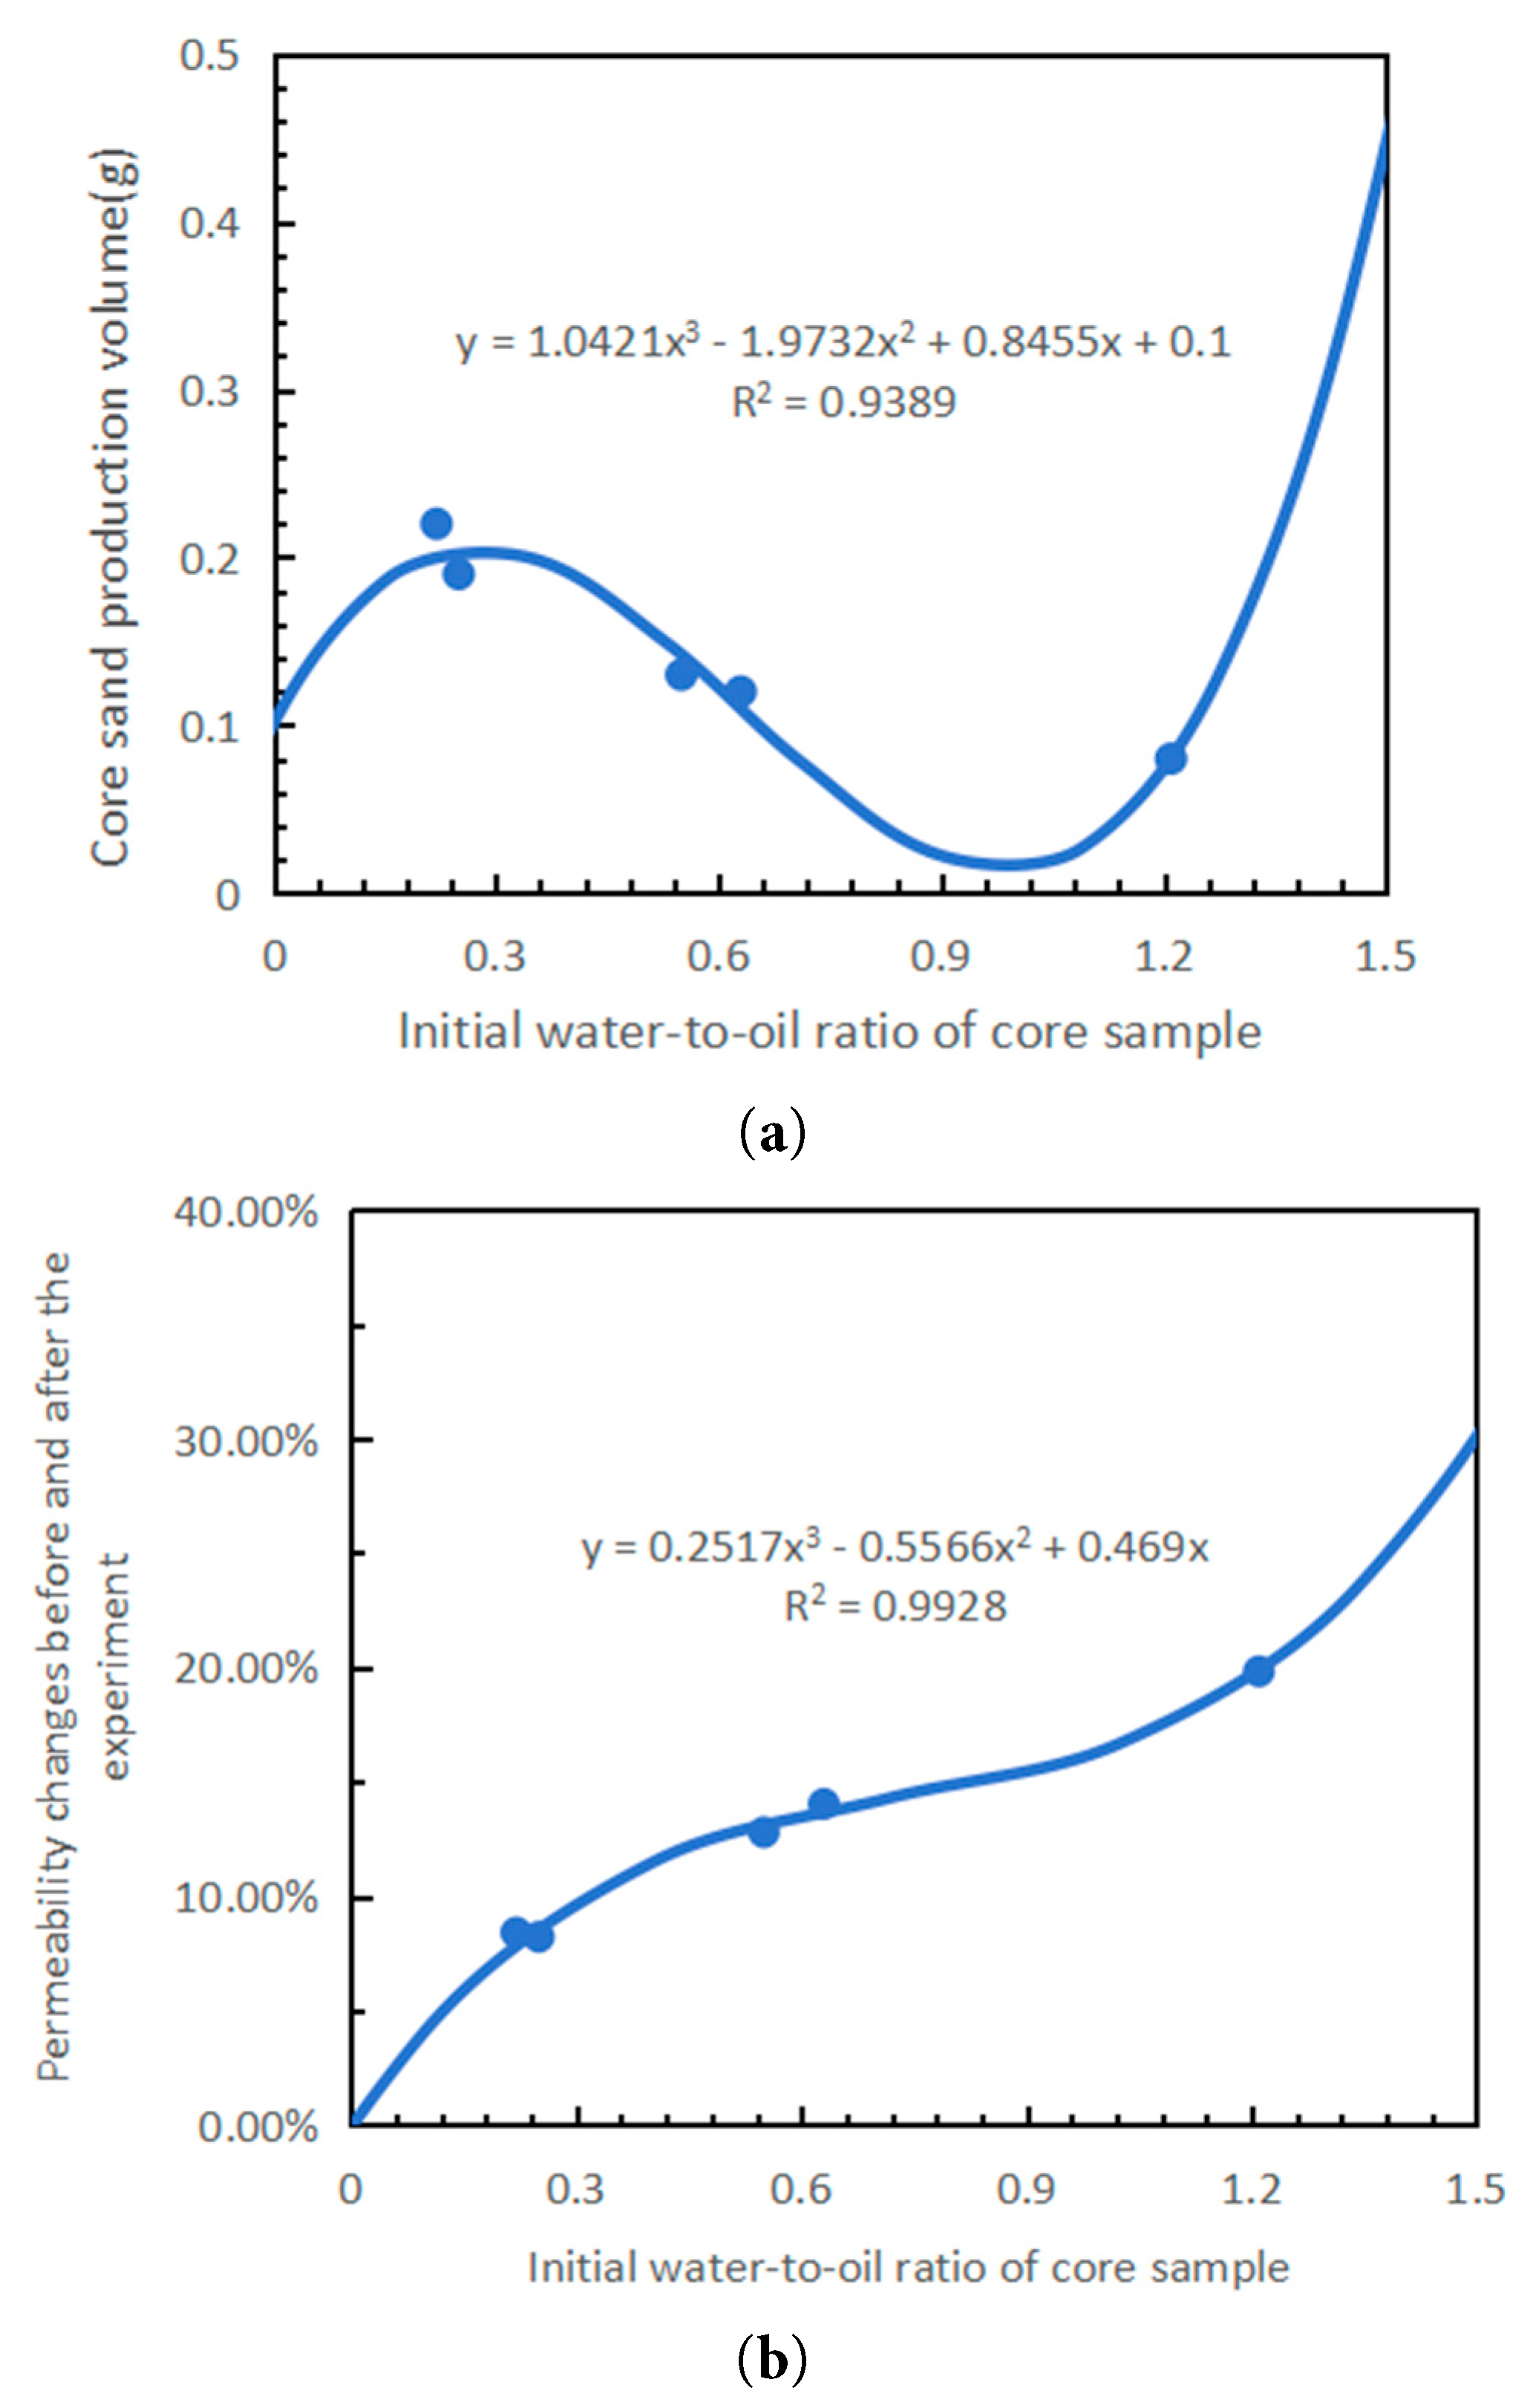
Figure 6: Core quality and permeability variation before and after the experiment. (a) The relationship between the water-oil ratio and sand production fits a third-order polynomial model (R2 = 0.9389). (b) The relationship between the water-oil ratio and the permeability alteration after the experiment fits a third-order polynomial model (R2 = 0.9928).
As shown in Fig. 6, the sand production of the core exhibits a non-monotonic relationship with the water-oil ratio, characterized by an initial increase, followed by a decrease, and a subsequent rebound. Within the water-oil ratio range of 0.3 to 1, a gradual reduction in sand production is observed. The observed reduction in sand production at this stage is attributed to the increased water-oil ratio. This increase enhances water erosion and, more importantly, strengthens the stabilizing effect of the water film. Under cyclic stress loading, the core framework undergoes progressive fatigue damage. This process begins with the detachment of weakly cemented particles. Once mobilized, these particles are transported by the flowing gas phase. They can then form bridge blockages at pore throats, which intensifies localized damage and alters flow pathways. Throughout this process, the residual water films coating sand and gravel surfaces contribute critical cohesive strength via capillary forces, significantly influencing particle mobilization and retention. To isolate these physical mechanisms from complex chemical interactions, inert fluids (kerosene, distilled water, and dry nitrogen) were deliberately employed as displacement media. This experimental design effectively excludes confounding factors such as mineral dissolution/precipitation and formation water evaporation. Consequently, observed particle adhesion behaviors and mobilization resistance can be attributed more conclusively to the physical role of water films rather than active chemical processes. Simultaneously, particles are immobilized through physicochemical adsorption, collectively forming a retention mechanism that suppresses sand production.
The relationship curve in Fig. 6a indicates an increasing trend in sand production as the the water-oil ratio exceeded 1. However, due to the limited sample size under high water-oil ratio conditions. The universality of this trend and its quantitative relationship require further validation with more samples in the future. As shown in Fig. 6, the model exhibits excellent goodness-of-fit, with R2 values of 0.9389 and 0.9928 for the two relationships, both indicating outstanding performance within the observed data range.
The degree of permeability changes in the core before and after the experiment was observed to increase continuously with higher water-oil ratios. A positive correlation was identified, wherein a higher initial water-oil ratio resulted in a more significant alteration in permeability. The post-experimental rise in core permeability is interpreted as being principally caused by grain migration induced by internal rock damage. The proposed mechanism is twofold. Firstly, alternating stress initiates the detachment and migration of weakly cemented skeleton particles. These mobilized particles subsequently form bridge blockages at pore throats, representing a form of macroscopic internal damage. Although such damage does not immediately lead to significant sand production, it considerably influences the core’s seepage capacity. This is evidenced by the observed increase in core permeability post-experiment. Concurrently, particle migration scours and widens the original pore channels, potentially creating new micro-fractures or pore-throat networks. The resulting reorganization of the pore microstructure effectively expands fluid flow pathways and inherently enhances porosity. While wettability changes could influence permeability, their role is considered minor in this inert fluid (kerosene, nitrogen) displacement system. Consequently, the marked permeability improvement is predominantly ascribed to the augmented porosity and enhanced connectivity arising from grain migration.
This study focused on the investigation of an unconsolidated sandstone gas storage reservoir. Sand production experiments under alternating displacement conditions were conducted on sandstone cores with varying water-oil ratios. The sand production behavior under different ratios was systematically compared and analyzed. Furthermore, the effect of alternating displacement cycles on sand production was examined. Based on the experimental results, the following main conclusions are drawn:
- (1)The critical sand production pressure difference was found to increase with the water-oil ratio. Experiments conducted by progressively increasing the displacement pressure showed that at water-oil ratios of 0.22, 0.25, 0.55, 0.63, and 1.21, the corresponding critical pressure differences were 3.6, 3.7, 3.9, 4.1, and 4.4 MPa, respectively. These results indicate a positive correlation between the water-oil ratio and the critical sand production pressure difference.
- (2)During alternating displacement, a decrease in core mass was observed with increasing number of cycles, indicating a corresponding rise in sand production. Analysis of the sand production trend revealed that the rate remained relatively stable between 25 and 55 cycles, beyond which a significant increase occurred with further cycling.
- (3)Changes in dry mass and permeability before and after the experiments were compared across various water–oil ratios. A non-monotonic trend in sand production was observed: it initially increased, then decreased, and subsequently increased again with rising water–oil ratio. Within the water–oil ratio range of 0.3 to 1, sand production gradually decreased. This reduction is principally caused by the adhesive property of the water film. It retains particles via physical adsorption, consequently suppressing sand production. Beyond a water–oil ratio of 1, sand production increased significantly with further ratio elevation.
- (4)The permeability of the core after alternation increases with the increase of water-oil ratio. This suggests that internal structural damage occurred due to water erosion. Although such damage does not immediately result in substantial sand production, it exerts a more pronounced influence on permeability, as evidenced by the elevated permeability measured after the experiment.
Acknowledgement:
Funding Statement: National Science and Technology Major Project (2025ZD1406805) “Key Technology for Efficient Construction of New Underground Gas Storage”, Research Project of CNPC (2023DJ8308) “Research on Wellbore Treatment and Rapid Construction Method of Oil and Gas Reservoir and Thin Salt Layer Storage” and National Key Research and Development Program of China (Grant No. 2025ZD1406805 and Grant No. 2025ZD1011105).
Author Contributions: The authors confirm their contributions to the paper as follows: Research conception and design, initial draft preparation: Tianen Liu; results analysis: Kun Dai; Interpretation: Shiju Ren; data collection: Chuanxiang Zhang; conception: Yidong Cai; resources: Jun Lu; review and editing: Xiaoling Tang; supervision: Jinghong Hu. All authors reviewed the results and approved the final version of the manuscript.
Availability of Data and Materials: The data that support the findings of this study are available from the corresponding author upon reasonable request.
Ethics Approval: Not applicable.
Conflicts of Interest: The authors declare no conflicts of interest to report regarding the present study.
References
1. Dharmananda K , Kingsbury N , Singh H . Underground gas storage: issues beneath the surface. In: Proceedings of the SPE Asia Pacific Oil and Gas Conference and Exhibition; 2004 Oct 18–20; Perth, Australia. doi:10.2118/88491-ms. [Google Scholar] [CrossRef]
2. Hamade YT . Experimental study of formation behavior in underground storage. In: Proceedings of the SPE Gas Technology Symposium; 1978 Jun 7–9; Omaha, NE, USA. doi:10.2118/7164-ms. [Google Scholar] [CrossRef]
3. Chen Z , Liao X , Zhao X , Chen C , Zhu L , Zhang F , et al. Optimization of injection and production parameters for sour gas storages: a case study. In: Proceedings of the Offshore Technology Conference Asia; 2016 Mar 22–25; Kuala Lumpur, Malaysia. doi:10.4043/26686-ms. [Google Scholar] [CrossRef]
4. Wan J , Sun Y , He Y , Ji W , Li J , Jiang L , et al. Development and technology status of energy storage in depleted gas reservoirs. Int J Coal Sci Technol. 2024; 11( 1): 29. doi:10.1007/s40789-024-00676-y. [Google Scholar] [CrossRef]
5. Gonzalez A , Heidari Z , Lopez O . Integration of 3D volumetric computed tomography scan image data with conventional well logs for detection of petrophysical rock classes. SPE Reserv Eval Eng. 2022; 25( 2): 146– 62. doi:10.2118/208605-PA. [Google Scholar] [CrossRef]
6. Priolo E , Zinno I , Guidarelli M , Romanelli M , Lanari R , Sandron D , et al. The birth of an underground gas storage in a depleted gas reservoir—results from integrated seismic and ground deformation monitoring. Earth Space Sci. 2024; 11( 11): e2023EA003275. doi:10.1029/2023ea003275. [Google Scholar] [CrossRef]
7. Lankof L , Tarkowski R . GIS-based analysis of rock salt deposits’ suitability for underground hydrogen storage. Int J Hydrogen Energy. 2023; 48( 71): 27748– 65. doi:10.1016/j.ijhydene.2023.03.415. [Google Scholar] [CrossRef]
8. Naderloo M , Ramesh Kumar K , Hernandez E , Hajibeygi H , Barnhoorn A . Experimental and numerical investigation of sandstone deformation under cycling loading relevant for underground energy storage. J Energy Storage. 2023; 64: 107198. doi:10.1016/j.est.2023.107198. [Google Scholar] [CrossRef]
9. Xia D , Liu H , Liu J , Guo Y , Liu M , Qiu X , et al. Study on the evolution of mechanical properties and acoustic emission of medium-permeability sandstone under multi-level cyclic loading stress paths. Processes. 2024; 12( 8): 1773. doi:10.3390/pr12081773. [Google Scholar] [CrossRef]
10. Geranmayeh Vaneghi R , Thoeni K , Dyskin AV , Sharifzadeh M , Sarmadivaleh M . Fatigue damage response of typical crystalline and granular rocks to uniaxial cyclic compression. Int J Fatigue. 2020; 138: 105667. doi:10.1016/j.ijfatigue.2020.105667. [Google Scholar] [CrossRef]
11. Pijnenburg RPJ , Verberne BA , Hangx SJT , Spiers CJ . Deformation behavior of sandstones from the seismogenic Groningen gas field: role of inelastic versus elastic mechanisms. JGR Solid Earth. 2018; 123( 7): 5532– 58. doi:10.1029/2018jb015673. [Google Scholar] [CrossRef]
12. Yang C , Liu J . Petroleum rock mechanics: an area worthy of focus in geo-energy research. Adv Geo-Energy Res. 2021; 5( 4): 351– 2. doi:10.46690/ager.2021.04.01. [Google Scholar] [CrossRef]
13. Lu J , Muhammed NS , Okolie JA , Epelle EI . A sensitivity study of hydrogen mixing with cushion gases for effective storage in porous media. Sustainable Energy Fuels. 2025; 9( 5): 1353– 70. doi:10.1039/d4se01400f. [Google Scholar] [CrossRef]
14. Ayal AM , Sadeq DJ . Sand production prediction and management using a one-dimensional geomechanical model: a case study in NahrUmr Formation, subba oil field. Iraqi Geol J. 2024; 57: 64– 83. doi:10.46717/igj.57.2c.6ms-2024-9-14. [Google Scholar] [CrossRef]
15. Tang Y , Zheng P , Tang Z , Cheng M , Wang Y . Research on multi-cycle injection–production displacement characteristics and factors influencing storage capacity in oil reservoir-based underground gas storage. Energies. 2025; 18( 13): 3330. doi:10.3390/en18133330. [Google Scholar] [CrossRef]
16. Aziz PA , Marhaendrajana T , Siagian UWR . Sanding phenomena vulnerability observations due to CO2 injection at the Air Benakat reservoir in South Sumatera. J Phys Conf Ser. 2024; 2734( 1): 012015. doi:10.1088/1742-6596/2734/1/012015. [Google Scholar] [CrossRef]
17. Abdul Aziz P , Siagian UWR . Time-dependent CO2-brine-rock interaction effect on sand onset prediction: a case study of dolomite-rich sandstone in air benakat formation, south Sumatra, Indonesia. ACS Omega. 2025; 10( 15): 14787– 804. doi:10.1021/acsomega.4c09499. [Google Scholar] [CrossRef]
18. Song J , Yu H , Han X , Wang X , Feng J , Liu L , et al. Oil displacement and CO2 storage mechanisms of impure CO2 flooding in tight reservoirs: insights from microfluidic experiments and numerical simulations. Fuel. 2025; 393: 134934. doi:10.1016/j.fuel.2025.134934. [Google Scholar] [CrossRef]
19. Geng J , Zhang H , Yue P , Qu S , Wang M , Chen B . Experimental and numerical simulation studies on the synergistic design of gas injection and extraction reservoirs of condensate gas reservoir-based underground gas storage. Processes. 2024; 12( 12): 2668. doi:10.3390/pr12122668. [Google Scholar] [CrossRef]
20. Jiang T , Wang Z , Wang J . Integrated construction technology for natural gas gravity drive and underground gas storage. Petrol Explor Dev. 2021; 48( 5): 1227– 36. doi:10.1016/s1876-3804(21)60105-2. [Google Scholar] [CrossRef]
21. He Y , Liu Y , Wang J , Li J , Zhang B , Chai R , et al. Stability study of tight sandstone reservoirs during CO2 dynamic storage process. In: Proceedings of the 58th U.S. Rock Mechanics/Geomechanics Symposium; 2024 Jun 23–26; Golden, CO, USA. doi:10.56952/arma-2024-0142. [Google Scholar] [CrossRef]
22. Zhang Y . CO2 research in dense sandstone storage sets. Appl Sci Innov Res. 2024; 9( 1): 89– 99. doi:10.22158/asir.v9n1p89. [Google Scholar] [CrossRef]
23. Al-Yaari A , Ching DLC , Sakidin H , Muthuvalu MS , Zafar M , Alyousifi Y , et al. Thermophysical properties of nanofluid in two-phase fluid flow through a porous rectangular medium for enhanced oil recovery. Nanomaterials. 2022; 12( 6): 1011. doi:10.3390/nano12061011. [Google Scholar] [CrossRef]
24. Al-Yaari A , Ching DLC , Sakidin H , Muthuvalu MS , Zafar M , Haruna A , et al. The effects of nanofluid thermophysical properties on enhanced oil recovery in a heterogenous porous media. Case Stud Chem Environ Eng. 2024; 9: 100556. doi:10.1016/j.cscee.2023.100556. [Google Scholar] [CrossRef]
25. Omirbekov S , Zhaidarbek B , Amanbek Y . Effect of fluid rheology on sand production: comprehensive study. In: Proceedings of the 58th U.S. Rock Mechanics/Geomechanics Symposium; 2024 Jun 23–26; Golden, CO, USA. doi:10.56952/arma-2024-1021. [Google Scholar] [CrossRef]
26. Eyitayo S , Watson M , Ispas I , Kolawole O , Moronkeji D . Experimental investigation of CO2-brine simultaneous and alternate injection: implications for geomechanics and CO2 storage capacity. In: Proceedings of the 58th U.S. Rock Mechanics/Geomechanics Symposium; 2024 Jun 23–26; Golden, CO, USA. doi:10.56952/arma-2024-0593. [Google Scholar] [CrossRef]
27. Cartagena-Pérez D , Rangriz Shokri A , Chalaturnyk R . Recent developments in the CO2-cyclic solvent injection process to improve oil recovery from poorly cemented heavy oil reservoirs: the case of Canadian Reservoirs. Energies. 2025; 18( 11): 2728. doi:10.3390/en18112728. [Google Scholar] [CrossRef]
28. Rasmussen L , Fan T , Rinehart A , Luhmann A , Ampomah W , Dewers T , et al. Carbon storage and enhanced oil recovery in Pennsylvanian morrow formation clastic reservoirs: controls on oil–brine and oil–CO2 relative permeability from diagenetic heterogeneity and evolving wettability. Energies. 2019; 12( 19): 3663. doi:10.3390/en12193663. [Google Scholar] [CrossRef]
29. Mohamad-Hussein A , Ni Q . Numerical modeling of onset and rate of sand production in perforated wells. J Petrol Explor Prod Technol. 2018; 8( 4): 1255– 71. doi:10.1007/s13202-018-0443-6. [Google Scholar] [CrossRef]
30. Nouri A , Vaziri H , Kuru E , Islam R . A comparison of two sanding criteria in physical and numerical modeling of sand production. J Petrol Sci Eng. 2006; 50( 1): 55– 70. doi:10.1016/j.petrol.2005.10.003. [Google Scholar] [CrossRef]
31. Climent N , Arroyo M , Gens A , O’Sullivan C . Fluid effects in sand production simulations coupling DEM with CFD. In: Numerical methods in geotechnical engineering. Boca Raton, FL, USA: CRC Press; 2014. p. 351– 6. doi:10.1201/b17017-64. [Google Scholar] [CrossRef]
32. Sorgun M , Osgouei RE , Ozbayoglu ME , Ozbayoglu AM . An experimental and numerical study of two-phase flow in horizontal eccentric annuli. Energy Sources Part A Recovery Util Environ Eff. 2013; 35( 10): 891– 9. doi:10.1080/15567036.2011.559524. [Google Scholar] [CrossRef]
33. He Y , Liu Y , Zhang B , Wang J , Chai R , Xue L . Molecular dynamics simulation of coupled effects of CO2 injection on wettability changes in crude oil-adsorbed sandstone. Fuel. 2026; 404: 136308. doi:10.1016/j.fuel.2025.136308. [Google Scholar] [CrossRef]
Cite This Article
 Copyright © 2025 The Author(s). Published by Tech Science Press.
This work is licensed under a Creative Commons Attribution 4.0 International License , which permits unrestricted use, distribution, and reproduction in any medium, provided the original work is properly cited.
 Downloads
 Citation Tools