
 Submit a Paper
 Propose a Special lssue
 Open Access
ARTICLE

Experimental Acoustic Analysis of Cavitation in a Centrifugal Pump
1 School of Energy and Power Engineering, Lanzhou University of Technology, Lanzhou, 730050, China
2 Chongqing Water Pump Factory Co., Ltd., Chongqing, 400000, China
* Corresponding Author: Dongwei Wang. Email:
Fluid Dynamics & Materials Processing 2025, 21(4), 877-890. https://doi.org/10.32604/fdmp.2024.055220
Received 20 June 2024; Accepted 20 November 2024; Issue published 06 May 2025
 View Full Text
 Download PDF
Abstract
Cavitation is an unavoidable phenomenon in the operation of centrifugal pumps. Prolonged cavitation can cause significant damage to the components of the flow channel, and in severe cases, it may even interfere with the normal energy exchange processes within the pump. Therefore, effective monitoring of cavitation in centrifugal pumps is crucial. This article presents a study that approaches the issue from an acoustic perspective, using experimental methods to gather and analyze acoustic data at the inlet and outlet of centrifugal pumps across various flow rates, with hydrophones as the primary measuring instruments. Results show that flow rate significantly affects noise levels in both non-cavitation and mild cavitation stages, with noise increasing as the flow rate rises. As the cavitation margin (NPSHa) decreases, inlet and outlet noise trends diverge: inlet noise drops sharply, while outlet noise initially increases before sharply decreasing. Both exhibit a distinct zone of abrupt change, where NPSHa values offer earlier cavitation detection than traditional methods. The noise at the pump’s inlet and outlet primarily consists of discrete and broadband noise, with most energy concentrated at discrete frequencies—shaft frequency (24 Hz), blade frequency (144 Hz), and their harmonics. As NPSHa decreases, the inlet’s discrete and broadband noise frequencies decline, while they increase at the outlet. Monitoring changes in these spectrum characteristics provides an additional means of predicting cavitation onset.Keywords
Centrifugal pumps are extensively utilized across various fields and play a pivotal role in sectors such as defense, aerospace, energy, water resource management, and hydropower projects [1–3]. The phenomenon of cavitation, which refers to the vaporization of liquid in hydraulic machinery, is widely observed. The rupture of bubbles during this process can cause cavitation damage. The energy exchange of fluid in the flow channel will be impeded by the generation of a significant quantity of bubbles, thereby substantially diminishing the operational efficiency of hydraulic machinery. Cavitation is the main cause of energy loss, and safe operation of pump units [4,5], and is therefore known as the cancer of the hydraulic industry [6–8]. Therefore, it is necessary to study the development process of cavitation in centrifugal pumps.
Cavitation noise represents the most salient characteristic of cavitation phenomena, arising during the entire process encompassing cavitation inception, growth, and collapse. The noise generated by individual bubbles or groups of bubbles has been extensively studied [9–12]. The research on cavitation noise of hydraulic machinery primarily focuses on propeller cavitation in the context of ships and underwater vehicles [13–16]. The research shows that propeller cavitation is the main noise source of underwater vehicles.
With the advancement of centrifugal pumps towards higher speeds and power capacities, high cavitation performance has become an important criterion of centrifugal pumps. Consequently, many scholars have conducted extensive research on centrifugal pump cavitation through various methods, primarily focusing on the following aspects: (1) Improve cavitation performance. Cavitation performance is improved to a certain extent by incorporating special structures on the surface of the blades, such as adding obstacles to the suction surface, arranging coarse strips on the suction side, placing small blades, and implementing splitter blades or slotted blades [17–20]. (2) Relationship between geometrical parameters of impeller and cavitation performance. Such as inlet diameter, impeller outlet width and blade number and other parameters [21–25]. (3) The unsteady and mechanical characteristics of the cavitation flow field. The relationship between the development of bubbles in the impeller and volute at different stages, as well as the flow field structure, was studied through numerical calculations and experimental methods [26–30]. The above research comprehensively explores the evolution of the structure of the cavitation flow field, the coupling effect between pump structural parameters and the cavitation flow field, and methods for improving cavitation performance. It has significant guiding implications for optimizing centrifugal pump structures and enhancing cavitation performance.
However, eliminating cavitation inside centrifugal pumps fundamentally is extremely difficult. Therefore, to ensure stable operation of the centrifugal pump, it is necessary to monitor the occurrence of cavitation. Currently, The commonly used methods for monitoring cavitation include the head method, high-speed photography method, noise method, and vibration method [31,32]. The head method is based on the percentage of head drop. However, the unsteady fluctuations in the flow field subsequent to cavitation will be exacerbated, leading to amplified instantaneous head fluctuations and introducing substantial inaccuracies in this approach. The visualization system of high-speed photography is utilized for monitoring cavitation, enabling the observation of its occurrence. High-speed photography has been established as a direct and effective approach to capturing cavitation phenomena. However, it necessitates the design of a transparent structure for centrifugal pumps. Presently, this method primarily finds application in scientific research and has yielded favorable outcomes; nevertheless, from an engineering standpoint, its practicality remains limited [33,34]. The vibration method involves the direct installation of an accelerometer on the pump body to capture the vibration signal, enabling determination of cavitation occurrence based on this signal [35,36]. However, it should be noted that the accuracy of cavitation identification is directly influenced by both the location and number of monitoring points. The noise method utilizes acoustic instruments to collect acoustic information from centrifugal pumps during operation, enabling the diagnosis of cavitation occurrence through changes in acoustic characteristics. Č udina and Prezelj discovered in their study that specific frequencies within the noise spectrum are closely associated with pump cavitation phenomenon, surpassing traditional head methods in terms of accuracy [37,38]. Currently, the primary focus of cavitation noise research lies in investigating its mechanism [39–41], while some scholars have also explored the correlation between centrifugal pump cavitation and acoustic characteristics, albeit mostly under rated operating conditions [42–44]. Among the aforementioned methods for monitoring cavitation, the acoustic approach enables direct measurement of acoustic information at the inlet or outlet of the centrifugal pump, offering fewer interference factors and higher accuracy. Therefore, conducting comprehensive research and enhancing monitoring techniques based on acoustic features hold significant engineering importance for ensuring their safe and stable operation.
This article employs experimental methodologies to investigate the cavitation noise within the inlet and outlet of centrifugal pumps at various flow rates, while analyzing alterations in the Overall Sound Pressure Level and frequency spectrum of the inlet and outlet noise throughout different stages of cavitation development. A more robust monitoring approach based on cavitation noise has been established, offering a valuable reference for monitoring cavitation in centrifugal pumps and other hydraulic machinery.
2 Experimental Devices and Principles
2.1 Test Rig and Measuring Devices
The cavitation test is typically conducted in a closed experimental setup, as illustrated in Fig. 1. The inlet and outlet pipes are connected to the corresponding buffer tanks 9 and 13. The steam-water separator 10 and vacuum pump 11 form an inlet pressure control system, which adjusts the inlet vacuum level of the test pump. After each experiment, open the steam-water separation to replenish air and restore the system to its initial state.
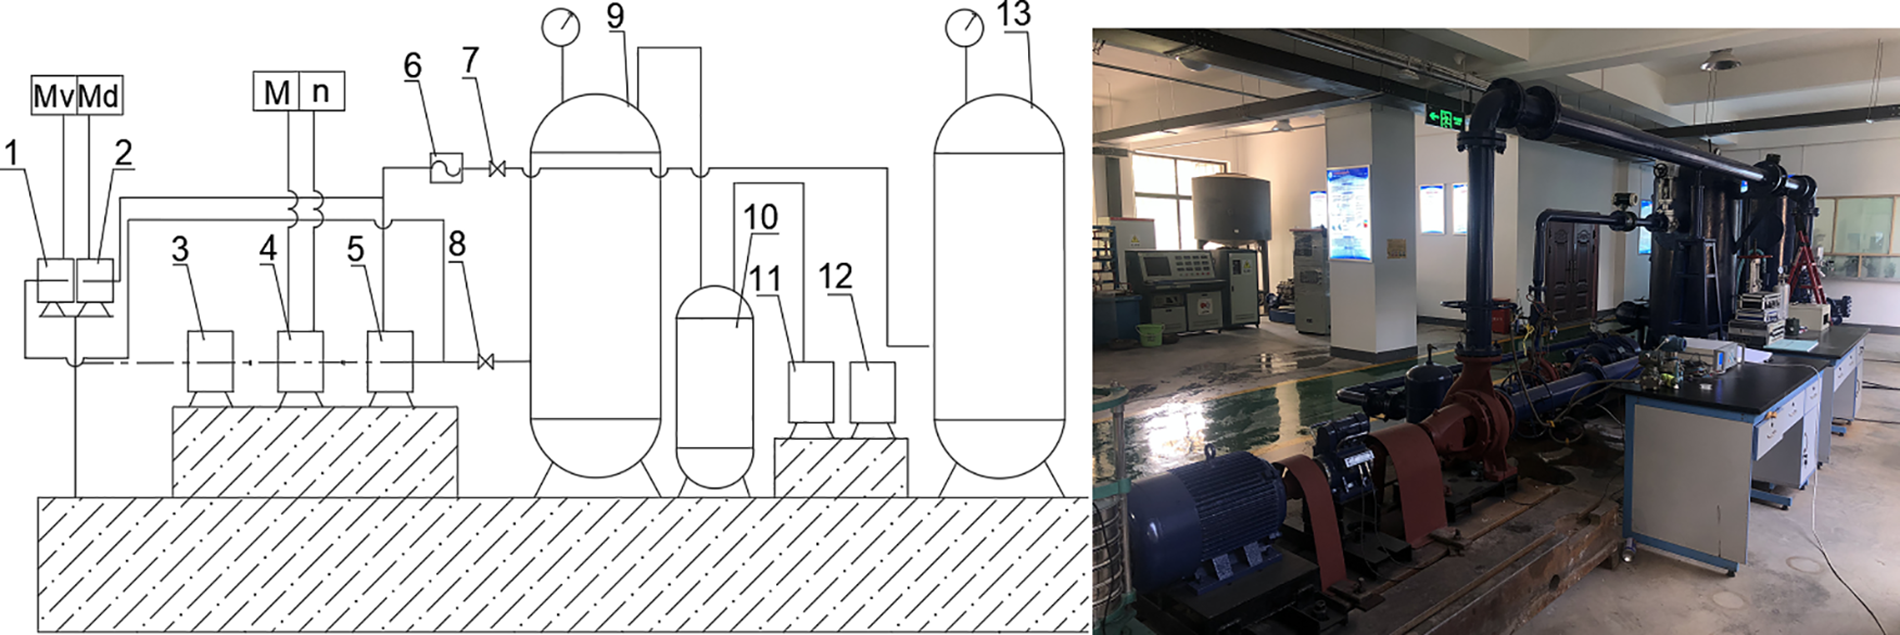
Figure 1: The experimental equipment. 1. Vacuum gauge, 2. Pressure gauge, 3. Motor, 4. Torque speed instrument, 5. Test pump, 6. Flowmeter, 7. Flow regulating valve, 8. Sluice valve, 9 Inlet buffer tank, 10. Steam water separator, 11. Sliding vane vacuum pump, 12. Motor, 13. Outlet buffer tank
The primary sensors employed are as follows: An inlet vacuum gauge with an accuracy of 0.2 and a range of ±0.1 MPa is used for measuring the inlet vacuum, while an outlet pressure sensor with an accuracy of 0.2 and a range of 0 to 1 MPa is used for measuring the outlet pressure. He flowmeter model is LW-DN250 with an accuracy class of 0.2. The speed and torque are measured using NJ1 speed and torque sensors, which have a working range of 0 to 200 Nm and an accuracy of 0.2.
The experimental pump depicted in Fig. 2. The test pump parameter are as follows: rated flow Qd = 200 m3/h, head He = 20 m, speed
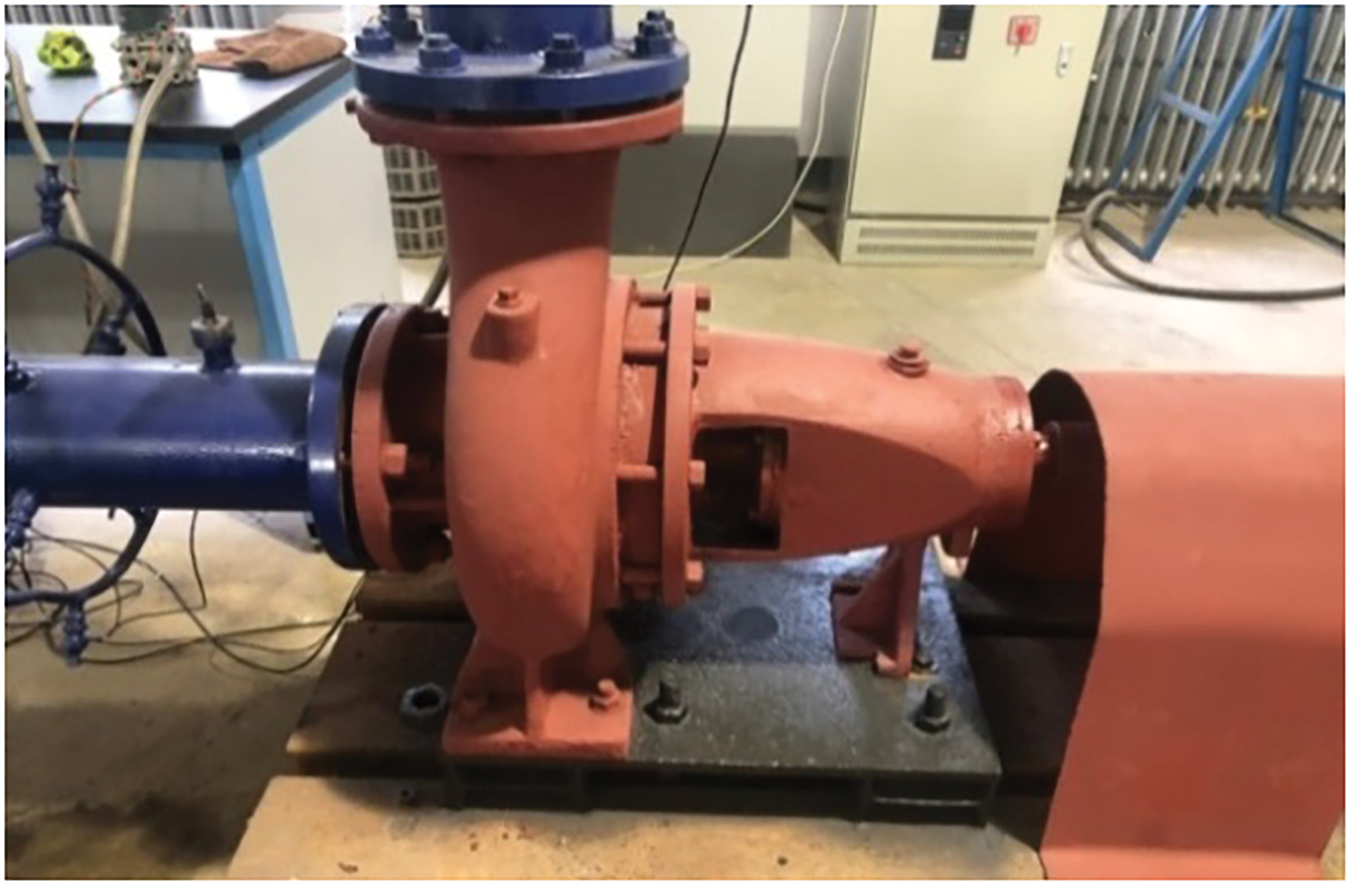
Figure 2: Test pump
The hydrophone model used in this study is RHC-10, which has a frequency range of 20 Hz to 100 kHz and a linear frequency range of 20 Hz to 63 kHz. The low-frequency receiving sensitivity exceeds −207 dB (with a 10 m cable). As depicted in Fig. 3, the installation position is twice the diameter of the inlet and outlet pipes. The hydrophone is flush with the inner wall of the pipe, effectively eliminating the interference of the hydrophone on flow field.
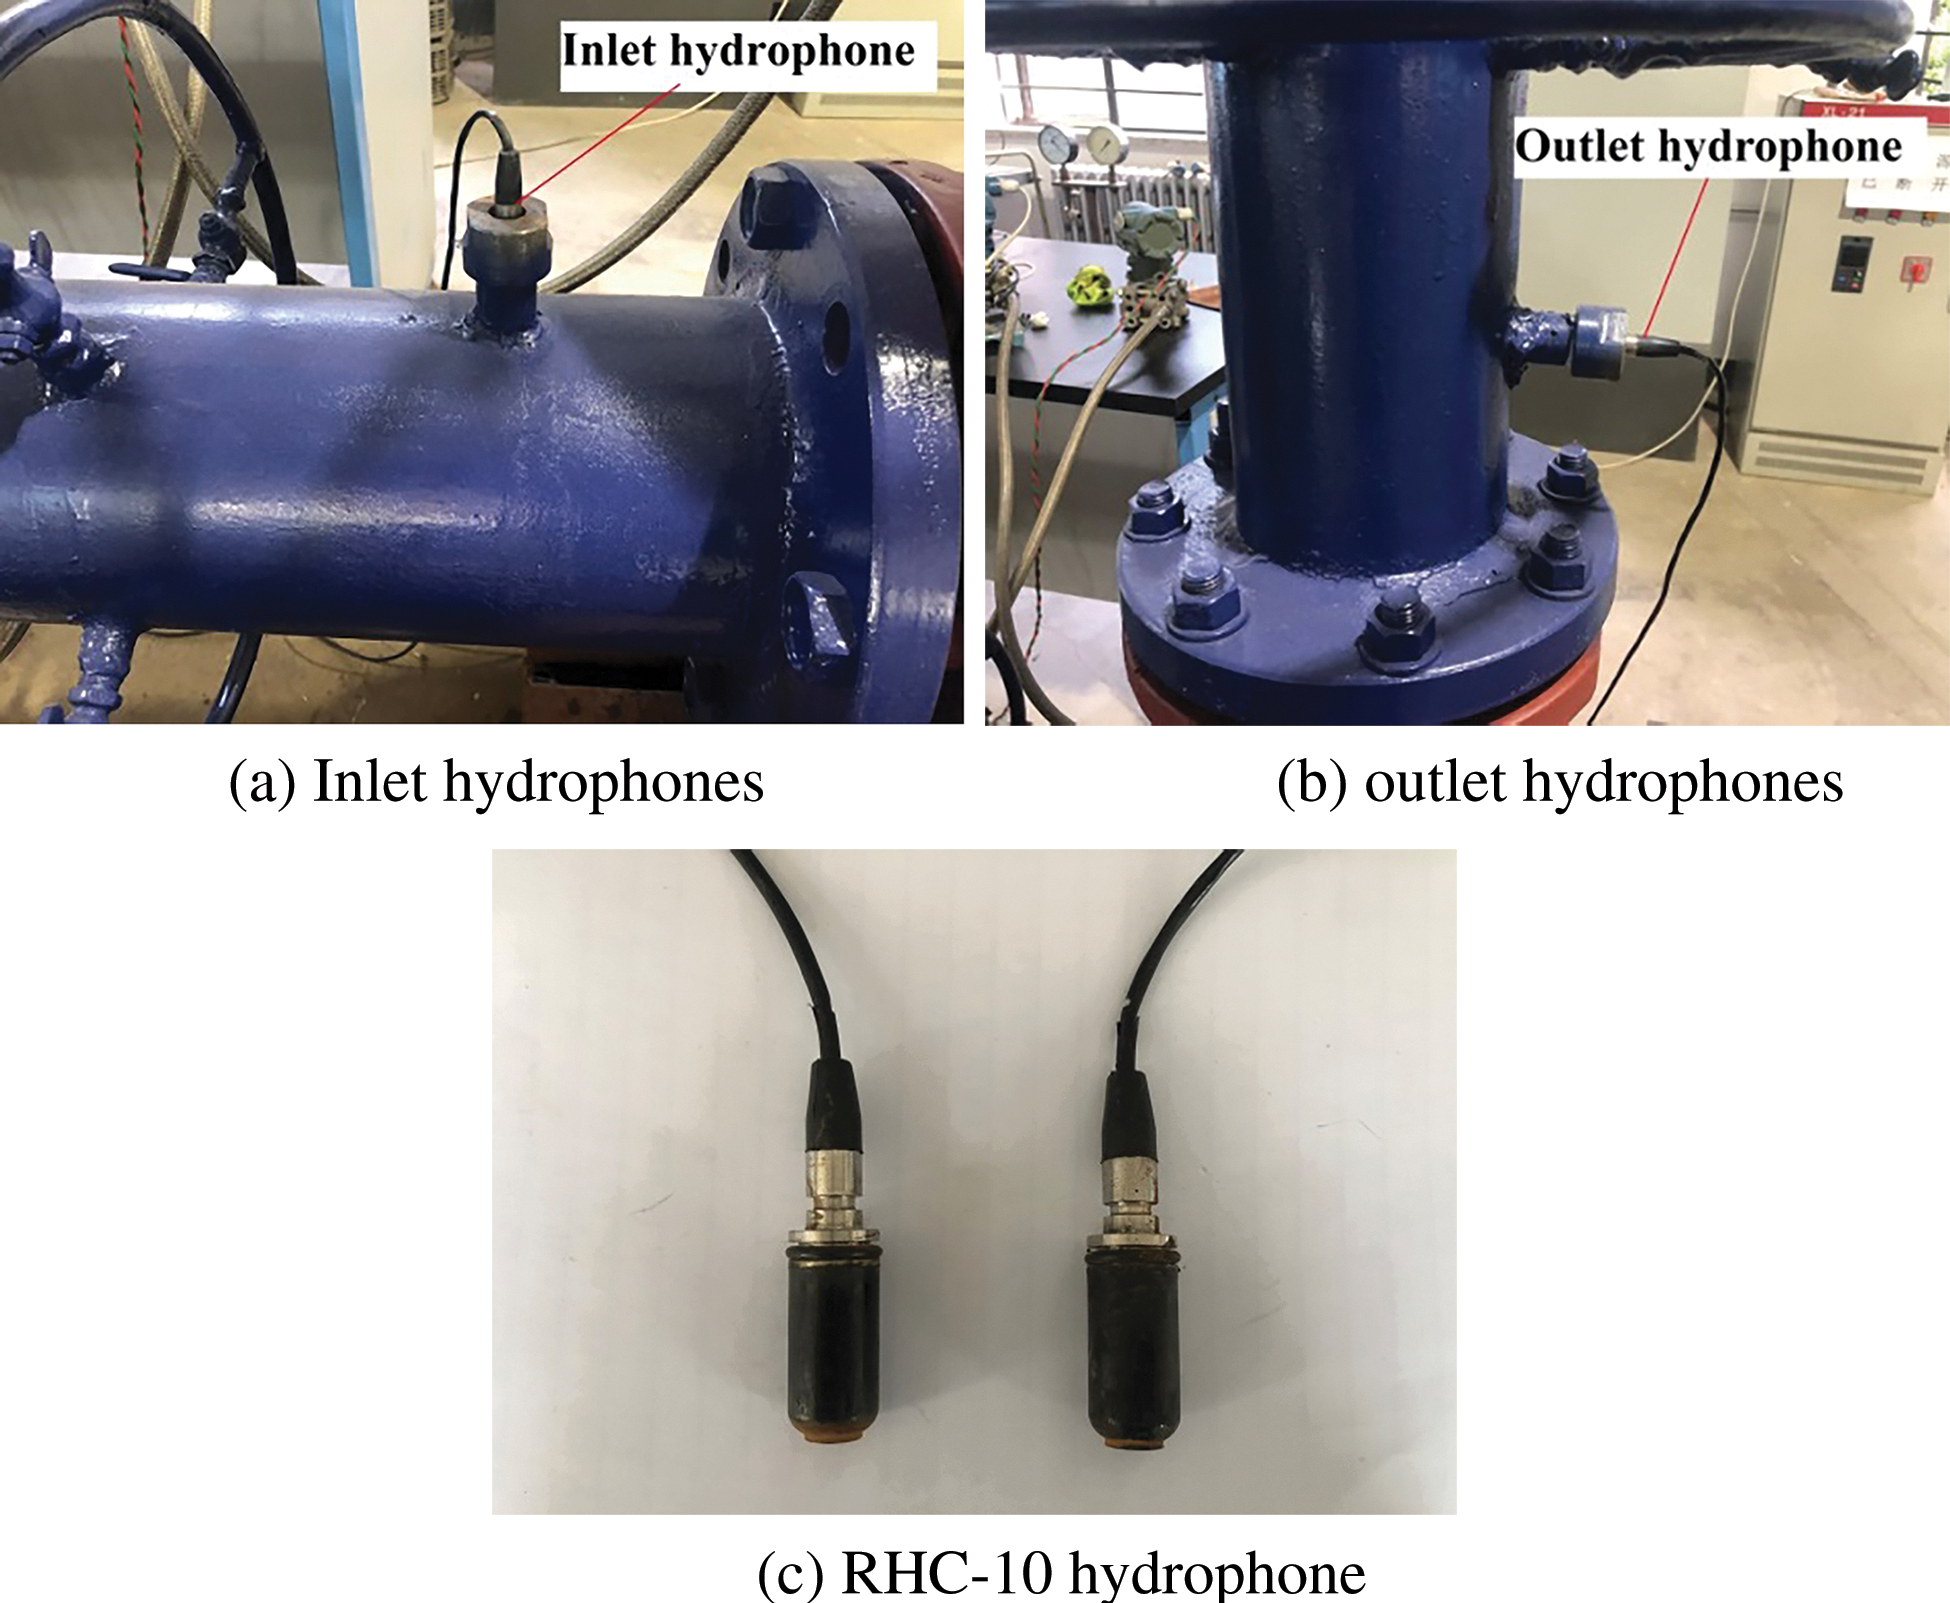
Figure 3: Hydrophone arrangement
2.3 Analysis of Measurement Interference
During the experiment, the sources of interference noise are from the inlet and outlet valves, buffer tanks, bends, and motors. During the testing process, inlet valve 8 is fully opened without generating any interference noise. The noise generated by flowmeter 6 and regulating valve 7 in the outlet pipeline mainly propagates downstream along the fluid, while the noise propagating upstream is relatively small and basically attenuates after a certain distance of propagation. Therefore, there is almost no interference noise from the outlet. The liquid that flows out of the outlet passes through buffer tanks 13 and 9 before entering the inlet of the pump. After entering the buffer tank, the flow gradually stabilizes due to the decrease in liquid velocity. The interference noise generated upstream is absorbed in the buffer tank, so the interference noise is eliminated. Meanwhile, by filling the buffer tank with water, the noise caused by the liquid hitting the tank wall is avoided. During the propagation process, motor noise attenuates through three mediums: air, solid walls, and liquid.
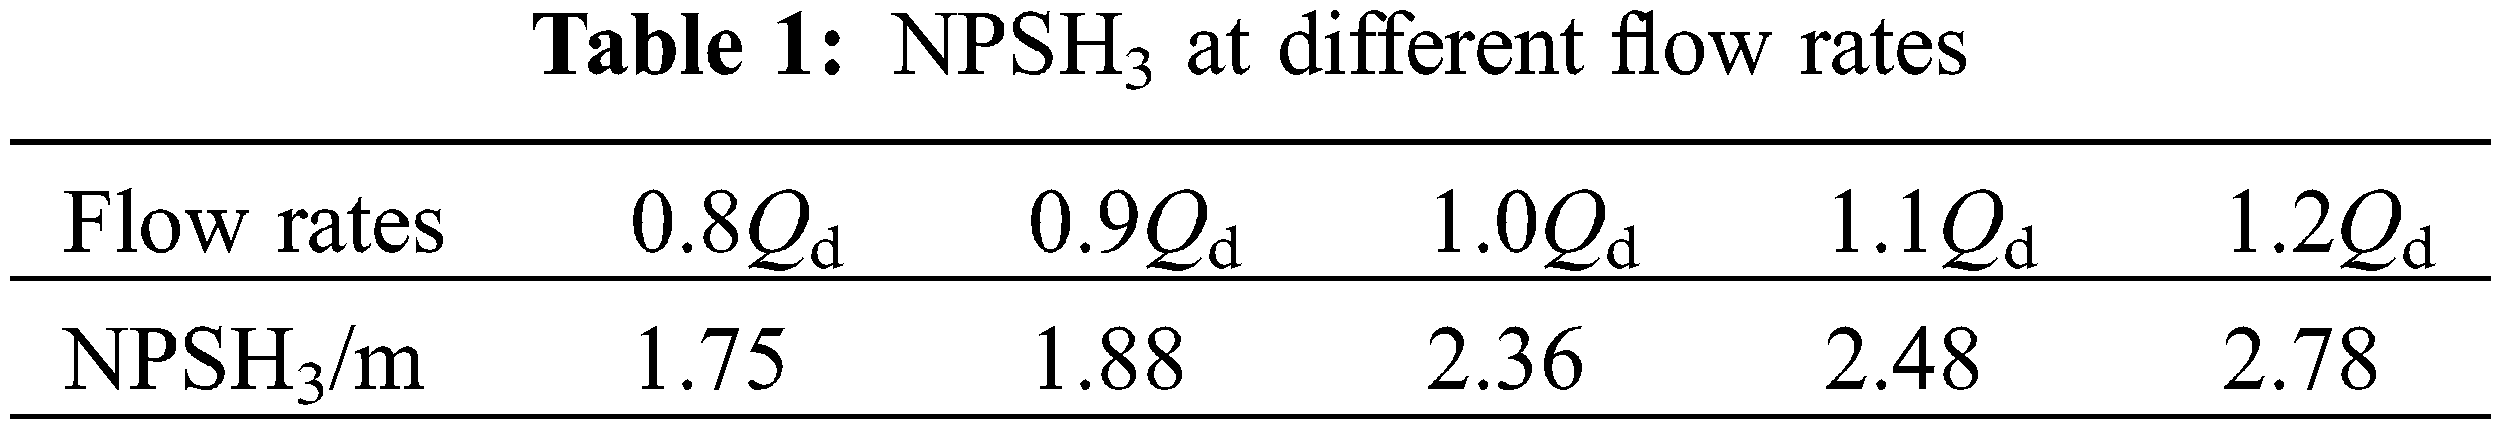
The energy characteristic curve is shown in Fig. 4a. The head curve of the test pump decreases monotonically without any hump phenomenon, and the efficiency reaches its maximum at the rated operating point. The cavitation noise test is conducted within the reasonable operating range, with flow rates at 0.8Qd, 0.9Qd, 1.0Qd, 1.1Qd, and 1.2Qd. The cavitation performance curves at five flow rates of 0.8Qd, 0.9Qd, 1.0Qd, 1.1Qd, and 1.2Qd are depicted in Fig. 4b. As the flow rate increases, the cavitation performance curve gradually decreases, and the NPSHa value corresponding to the sudden drop in head gradually increases. And the cavitation curve exhibits a small protrusion before it decreases at the 1.1Qd operating condition. This phenomenon is common in the cavitation curve of the centrifugal pumps. Head protrusion is caused by bubbles on the surface of the blades, especially when centrifugal pumps operate at high flow rates, the stability of the internal flow field and cavitation performance deteriorate. The stability of bubbles deteriorates after cavitation, which affects the supercavitation coefficient. In some cases, when the cavitation number approaches the critical value, there is a slight increase in the supercavitation coefficient, manifested as a hump on the cavitation performance curve [45]. The NPSHa corresponding to a 3% decrease in the head is called critical cavitation allowance (NPSH3), and the NPSH3 corresponding to each flow rates are shown in Table 1. The NPSHa is calculated as follows [46,47]:
where
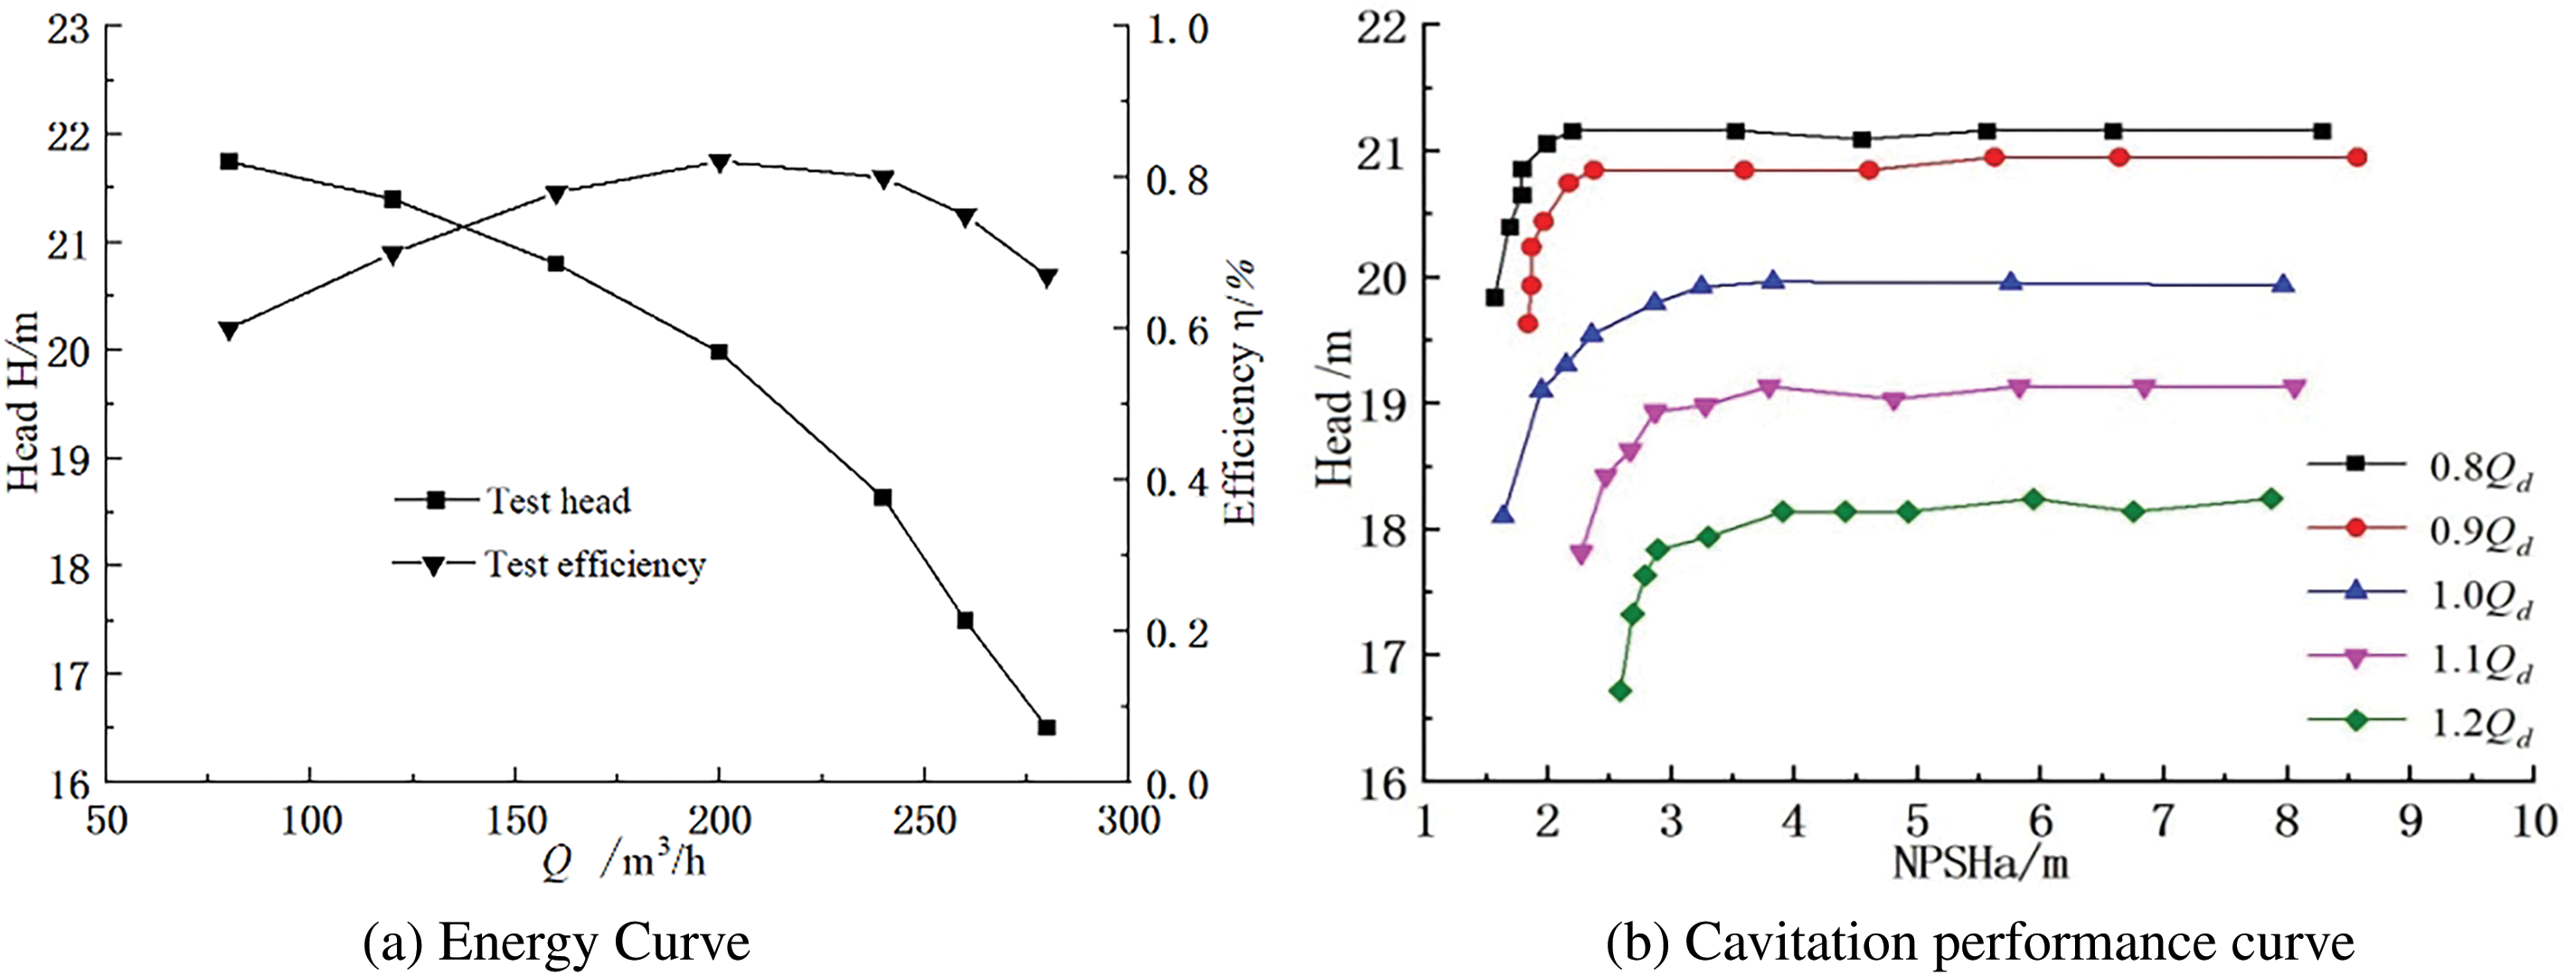
Figure 4: Performance curve
3.2 Acoustic Characteristics of Different Cavitation Stages
Select 11 cavitation allowance points on each characteristic curve for cavitation noise testing. Among them, 6 points are selected during the cavitation development stage. At the same time, select three corresponding cavitation allowance points when the head decreases by 1%, 2%, and 3%. In the severe cavitation stage, select 2 cavitation allowance points.
During the noise testing, the sampling frequency and analysis frequency should satisfy Shannon’s theorem, as shown in Eq. (2). Additionally, to prevent signal aliasing during sampling, the sampling frequency and analysis frequency should also meet Eq. (3) [48,49].
where
The sampling frequency of cavitation noise in this experiment is 20,000 Hz, and the actual analysis frequency is 6000 Hz, which meets the requirements of Eqs. (1) and (2). To reduce measurement errors, the full-frequency linear averaging method is used to analyze frequency domain information.
Fig. 5 is a three-dimensional surface diagram of the relationship between the Overall Sound Pressure Level (OSPL) at the inlet and NPSHa under flow rates of 0.8Qd, 0.9Qd, 1.0Qd, 1.1Qd, and 1.2Qd. From the figure, it can be seen that the OSPL at the inlet exhibits a clear regularity throughout the entire cavitation process. The OSPL shows a decreasing trend as NPSHa decreases at 5 operating conditions. At the slight stage of cavitation, the OSPL increases with the increase of flow rates. But in the later stage of cavitation, the OSPL significantly decreases and a boundary area appears. The corresponding NPSHa in this area is between 3 and 4 m, and the OSPL has decreased by about 5 dB. When NPSHa is below this threshold, the OSPL decreases by about 10 dB. This phenomenon is mainly due to the limited cavitation effect in the initial stage of cavitation development, resulting in fewer bubbles and only slight disturbances to the flow field. Under low flow conditions, the inlet velocity is the smallest, the flow field is relatively stable, and the fluctuations is weak. However, as the flow rate increases, the inlet velocity also increases accordingly, exacerbating the fluctuations in the flow field at the inlet and leading to an increase in hydraulic noise level. In the middle and later stages of cavitation development, the inlet cavitation of centrifugal pumps intensifies, leading to the generation of more bubbles. The compressibility of bubbles effectively attenuates the pressure waves generated by unstable flow at the inlet and absorbs the energy of noise to a certain extent, thereby reducing flow noise. Therefore, the cavitation noise is significantly reduced. The NPSHsound corresponding to the median values in the boundary area at different flow rates and the NPSH3 obtained from experiments are shown in Table 2. By comparing the NPSHsound and NPSH3 values in Table 2, it can be found that compared with conventional methods, the change in the OSPL at the inlet can predict the occurrence of cavitation in centrifugal pump earlier.
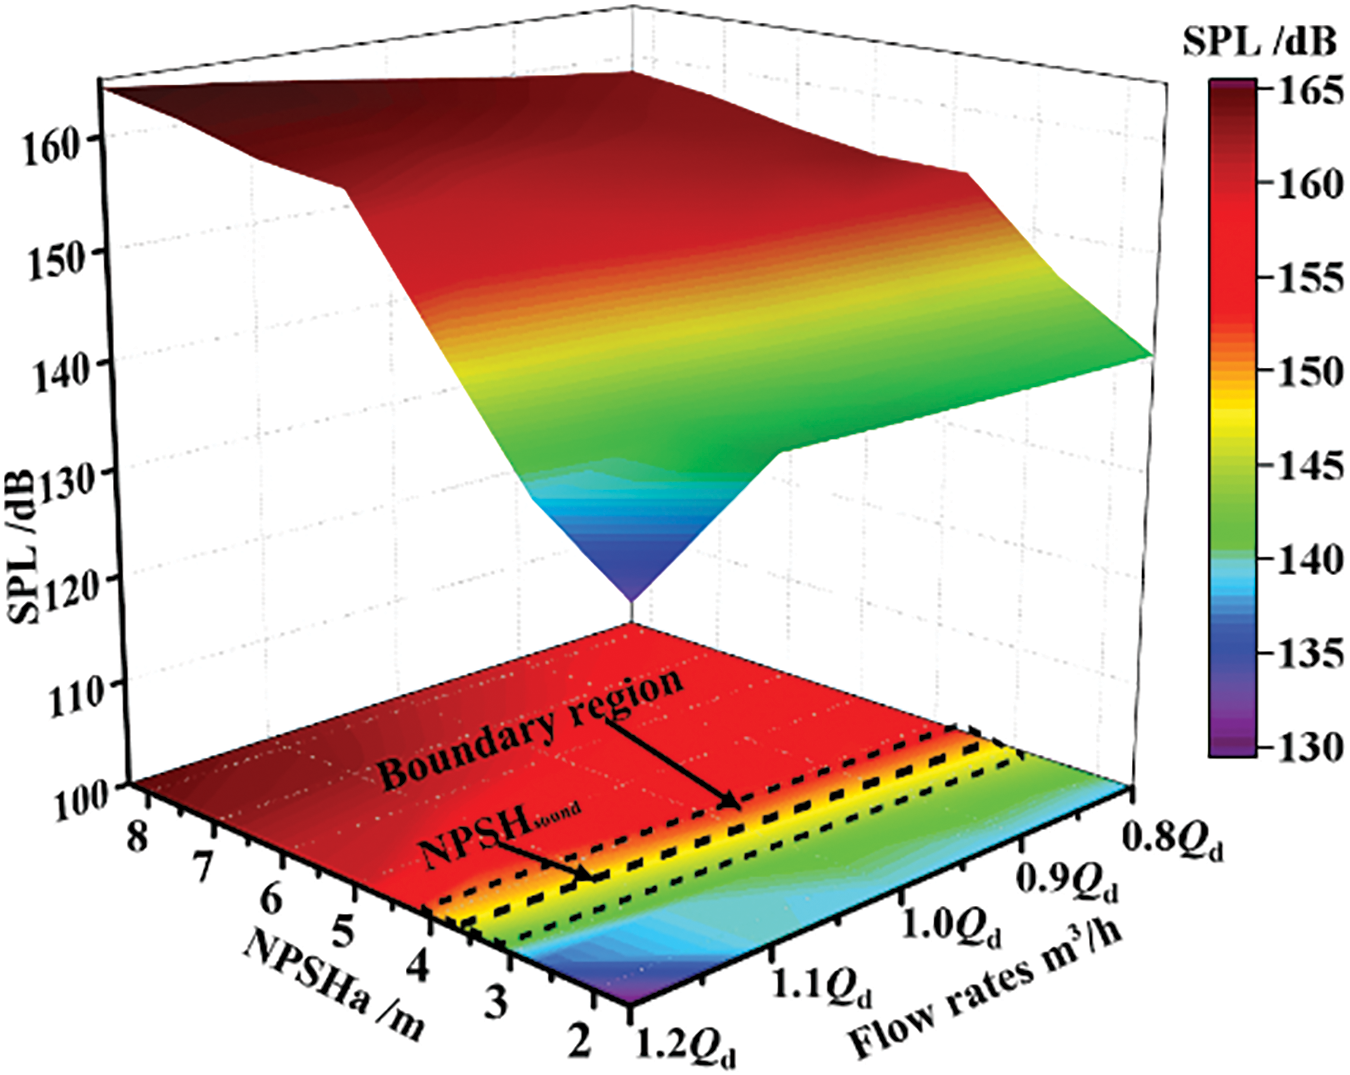
Figure 5: Relationship between inlet OSPL and NPSHa

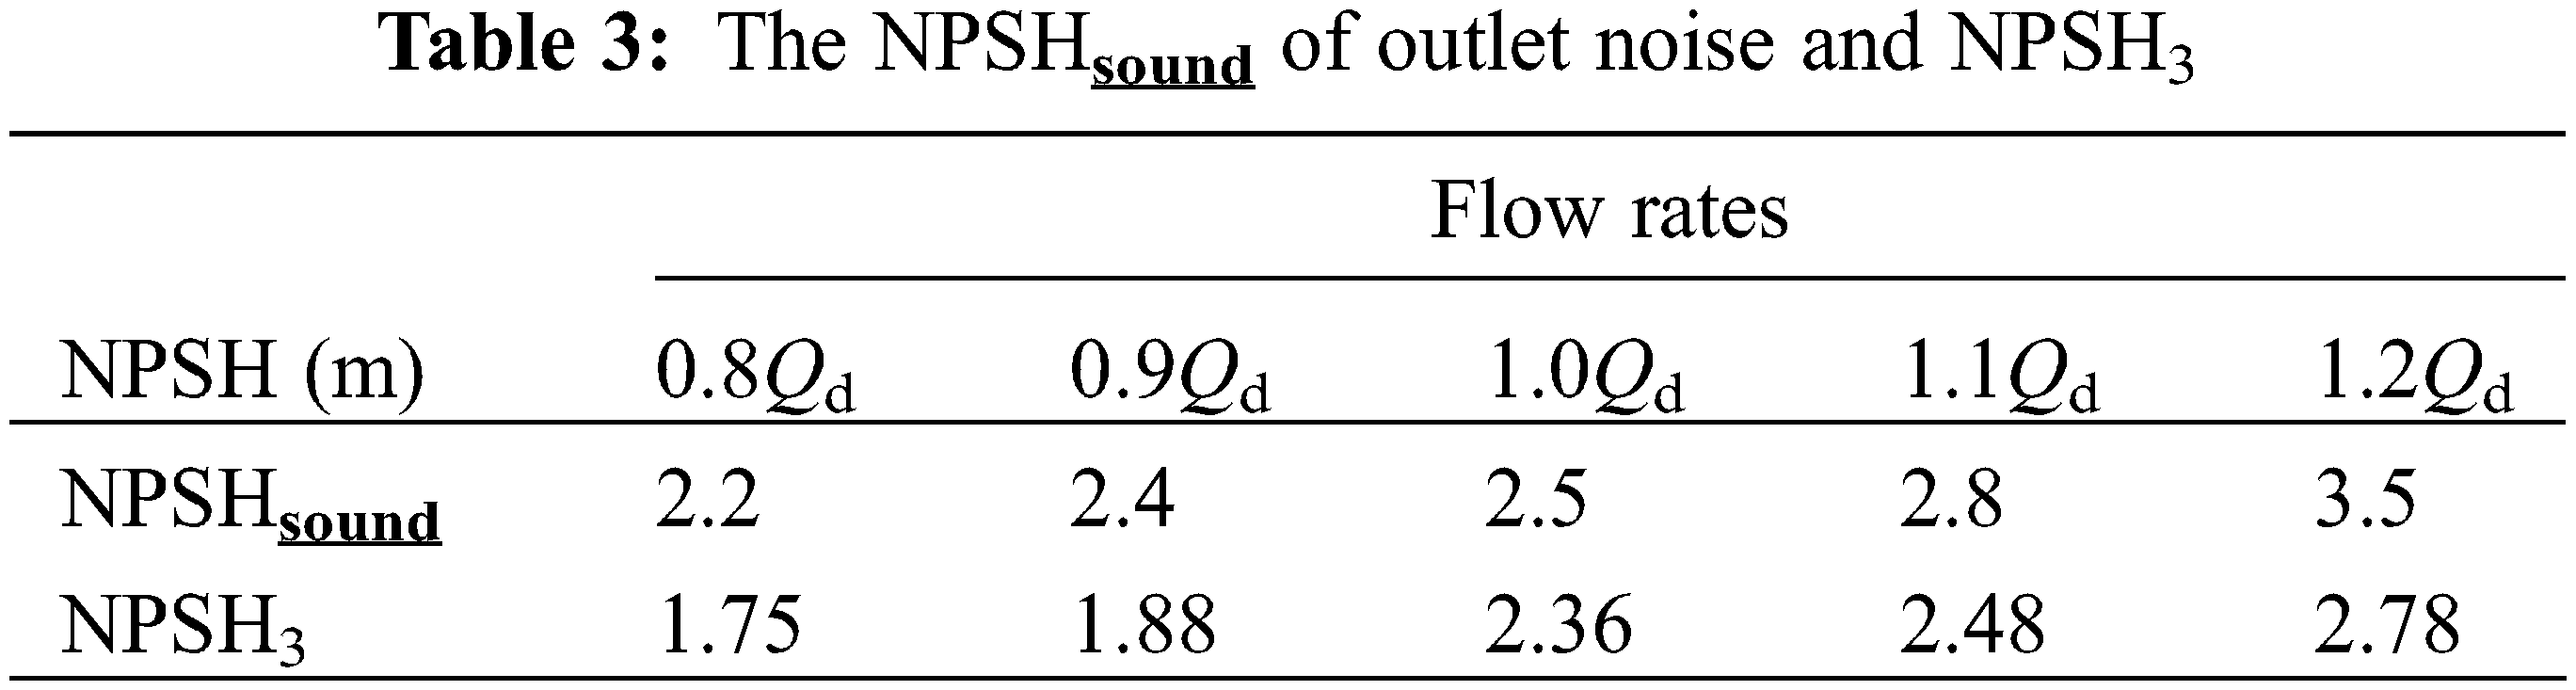
Fig. 6 shows the three-dimensional surface of the relationship between the OSPL at the outlet of the centrifugal pump and NPSHa at flow rates of 0.8Qd, 0.9Qd, 1.0Qd, 1.1Qd and 1.2Qd. The trend of change in OSPL is opposite to that of inlet. At each flow rate, the OSPL gradually increases as NPSHa decreases. The degree of increase depends on the traffic, ranging from 10 to 15 db. However, when NPSHa decreases to a certain value, the OSPL decreases. For the same NPSHa, the OSPL at high flow rate is higher than that at low flow rates. The difference in OSPL between high and low flow rates is about 5 dB, indicating that as the flow rate increases, the OSPL increases significantly. At the same NPSHa, the OSPL at the outlet is greater than that at the inlet. The reasons are as follows: Firstly, during the cavitation process, bubbles separate from the impeller and rupture in the high-pressure region. Therefore, only a small amount of bubbles remain inside the volute. So the noise energy cannot be effectively absorbed or attenuated. Secondly, after the bubble ruptures, it will generate severe radiation noise and propagate downstream along the liquid. In addition, with the development and rupture of bubbles, severe unstable vortices will form in the cavitation area and downstream. This results in strong vortex induced noise. In addition, strong pressure pulsation is generated under the dynamic and static interference between the impeller and the volute, resulting in hydrodynamic noise. As previously mentioned, when the NPSHa continues to decrease, the OSPL of the outlet noise increases to a certain extent, and there is also a sudden change zone. As shown in Fig. 6, the corresponding NPSHa value in this area is between 2.0 and 3.5 m, and the OSPL has increased by about 5 dB. The region is wider at large flow and shrinks with the decrease of flow. The NPSHsound corresponding to the median in this area, as well as the NPSH3 obtained from the experiment, are shown in Table 3. By comparing the values of NPSHsound and NPSH3 in Table 3, it can be seen that predicting cavitation occurrence in the pump earlier is also possible by analyzing changes in OSPL of outlet noise. Moreover, Figs. 5 and 6 demonstrate that predicting cavitation effects of centrifugal pumps through sudden changes in OSPL of inlet noise is more effective than using outlet noise.
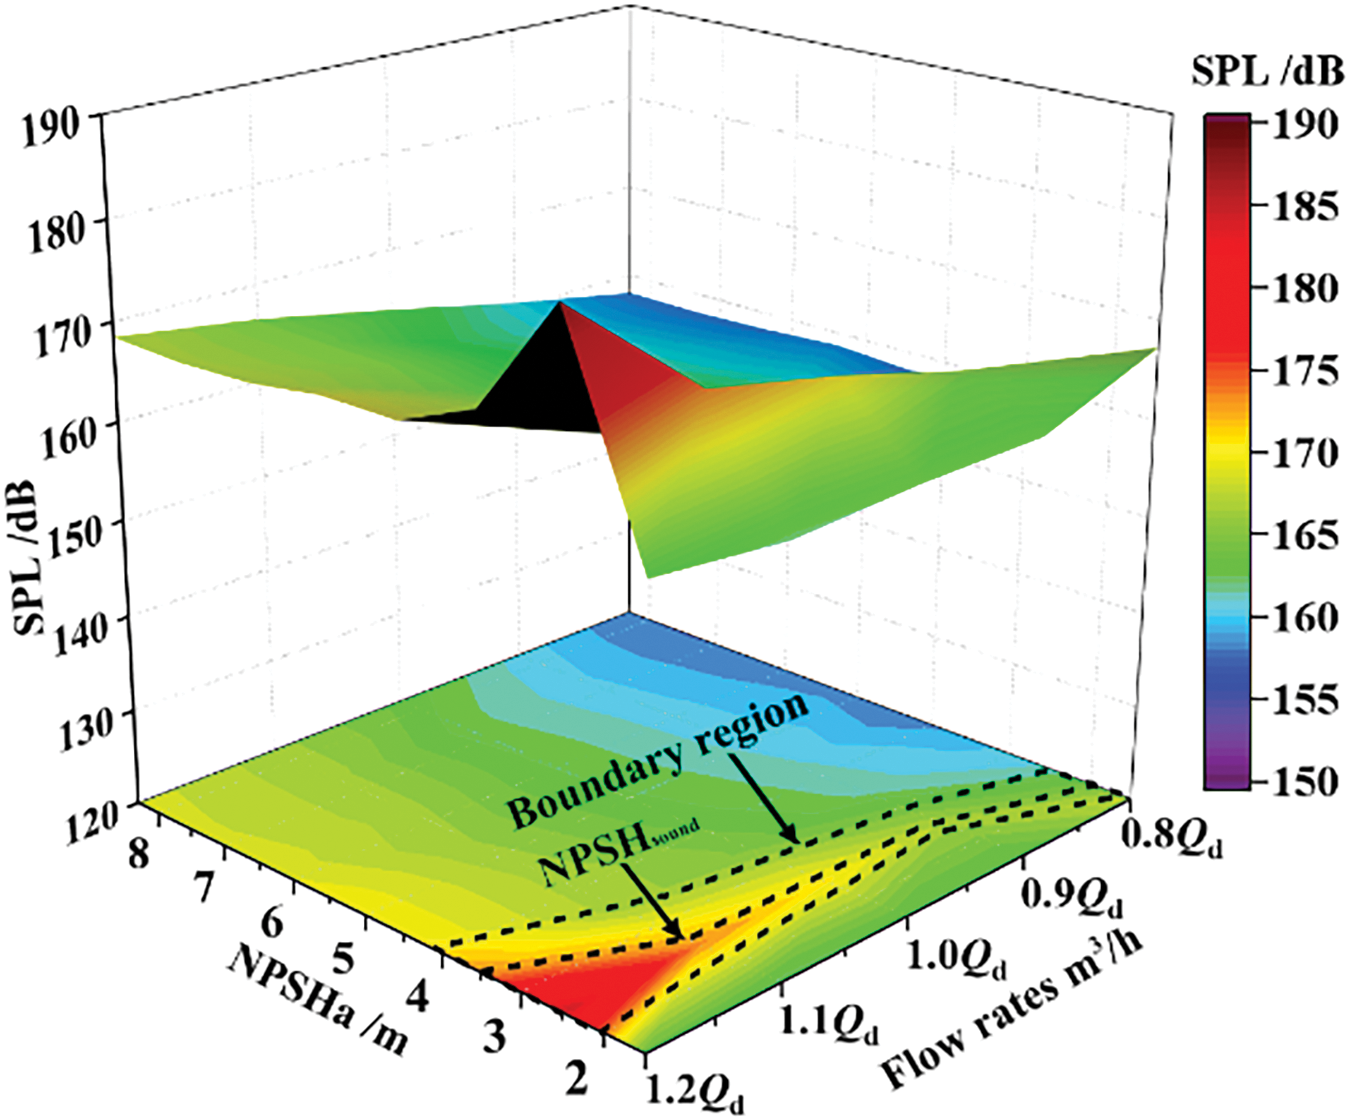
Figure 6: Relationship between overall sound pressure level at outlet and NPSHa
3.3 Spectrum Characteristics of Cavitation Noise at the Inlet
The cavitation flow field is characterized by phase transition, highly unsteady flow, and multidimensional turbulence. In complex flow field conditions, the cavitation noise inside the centrifugal will inevitably exhibit significant spectrum characteristics and energy changes compared to normal conditions.
Figs. 7 to 9 illustrate the frequency spectrum distribution of the noise at the inlet of the centrifugal pump at 0.8Qd, 1.0Qd, and 1.2Qd. It can be observed that when the flow rates are 0.8Qd, 1.0Qd, and 1.2Qd, corresponding to NPSHa of 8.30, 7.66, and 7.88 m, the maximum sound pressure amplitudes are about 1400, 2400, and 3000 Pa, as shown in Figs. 7a, 8a and 9a. This indicates that in the absence of cavitation, the inlet noise pressure amplitude gradually increases with the increase of flow rates. The main reason for this is that sound energy is closely related to the variation of velocity and pressure intensity of flow field. At low flow rates, the intensity of velocity fluctuations decreases due to the reduction in liquid velocity. According to the Bernoulli equation, when the velocity remain stable, the pressure fluctuations also remain correspondingly stable, resulting in a smaller amplitude of noise pressure. An increase in flow leads to a corresponding increase in inlet velocity. Meanwhile, due to the disturbance caused by the impeller, the intensity of velocity fluctuations at the inlet increases, resulting in increased pressure fluctuations and an increase in sound pressure level.
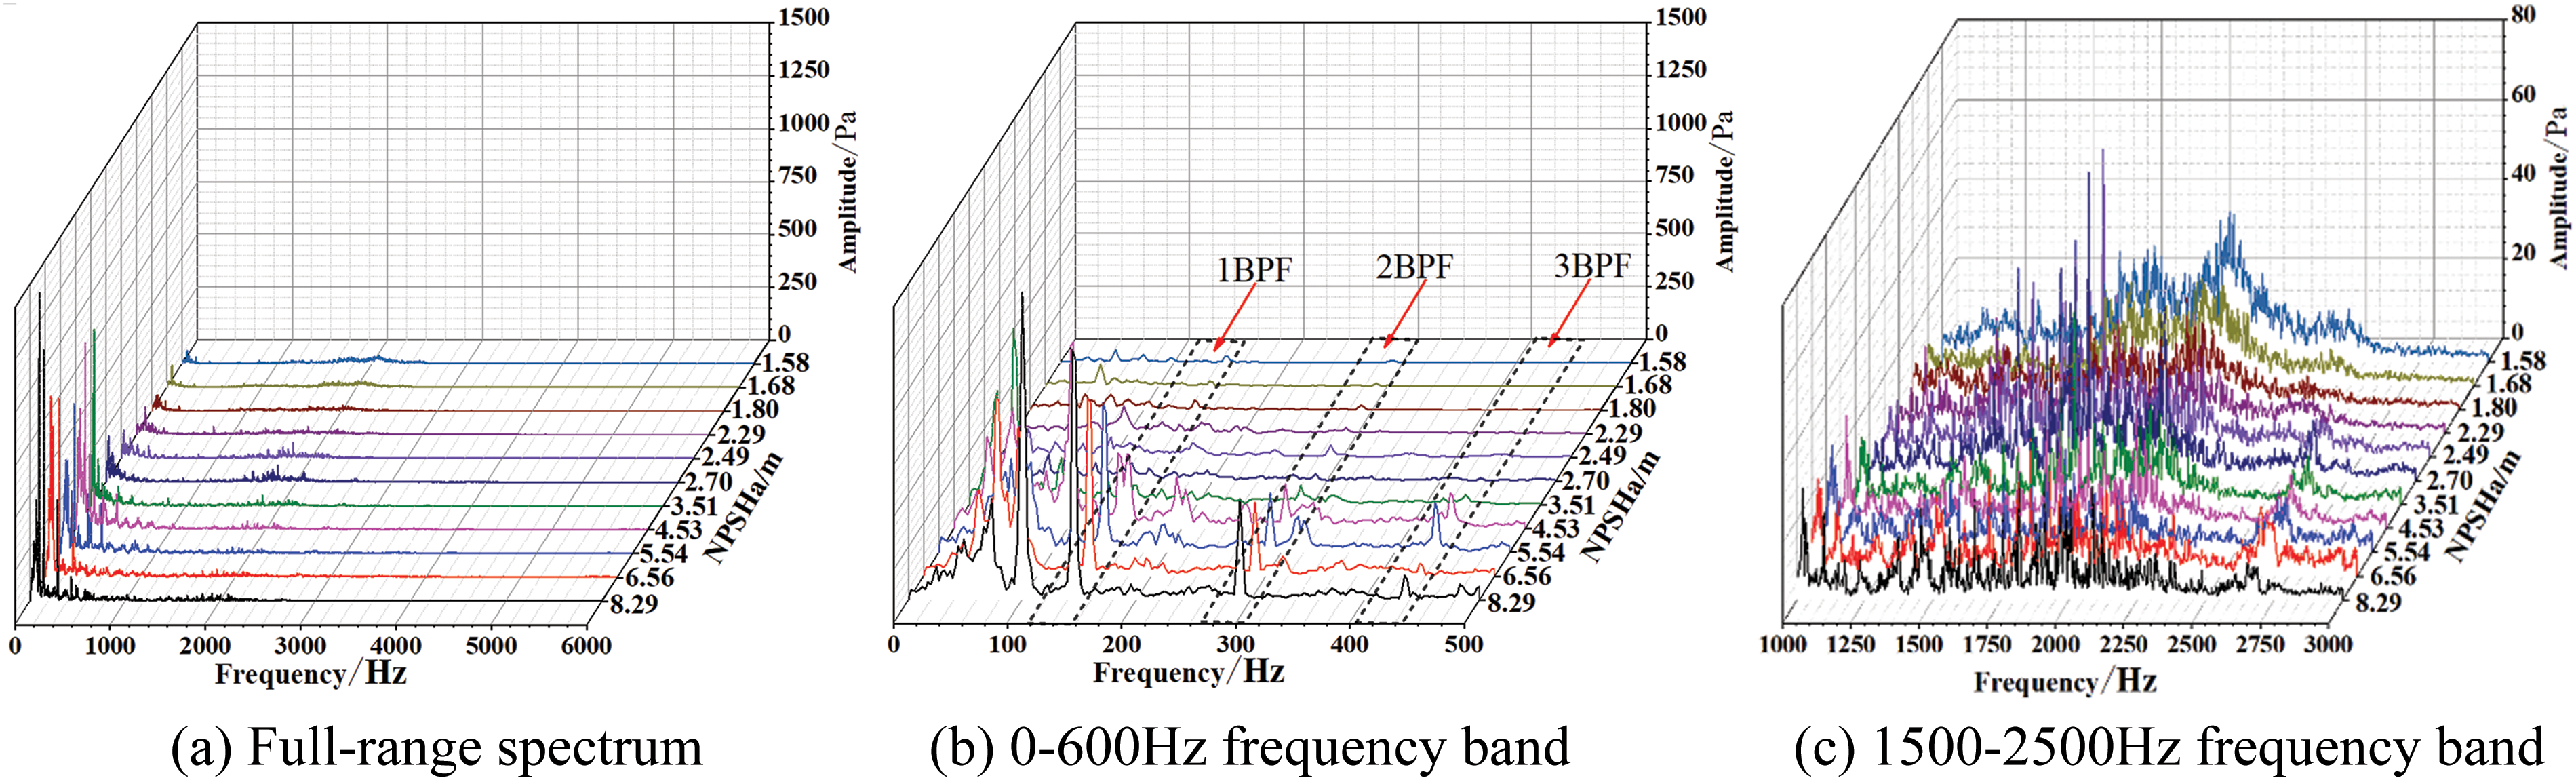
Figure 7: Spectrum characteristics of the inlet cavitation noise at 0.8Qd flow rate
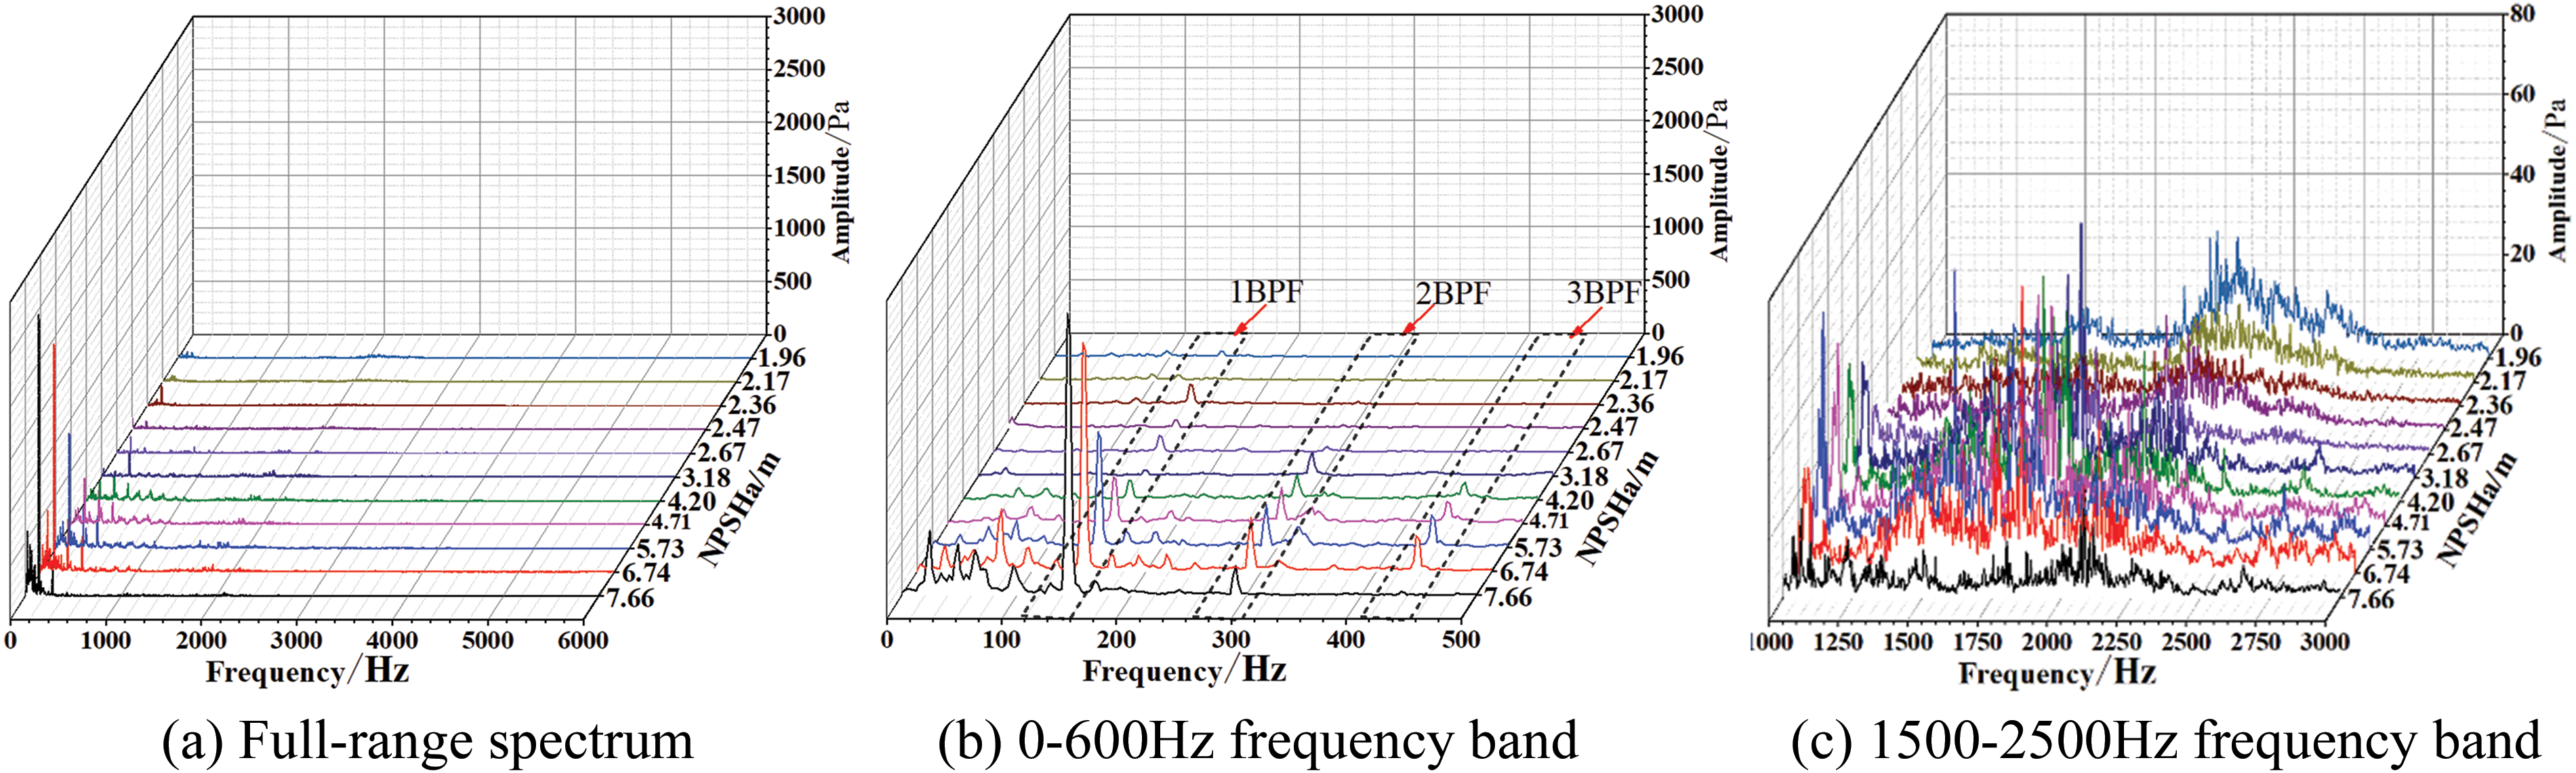
Figure 8: Spectrum characteristics of the inlet cavitation noise at 1.0Qd flow rate
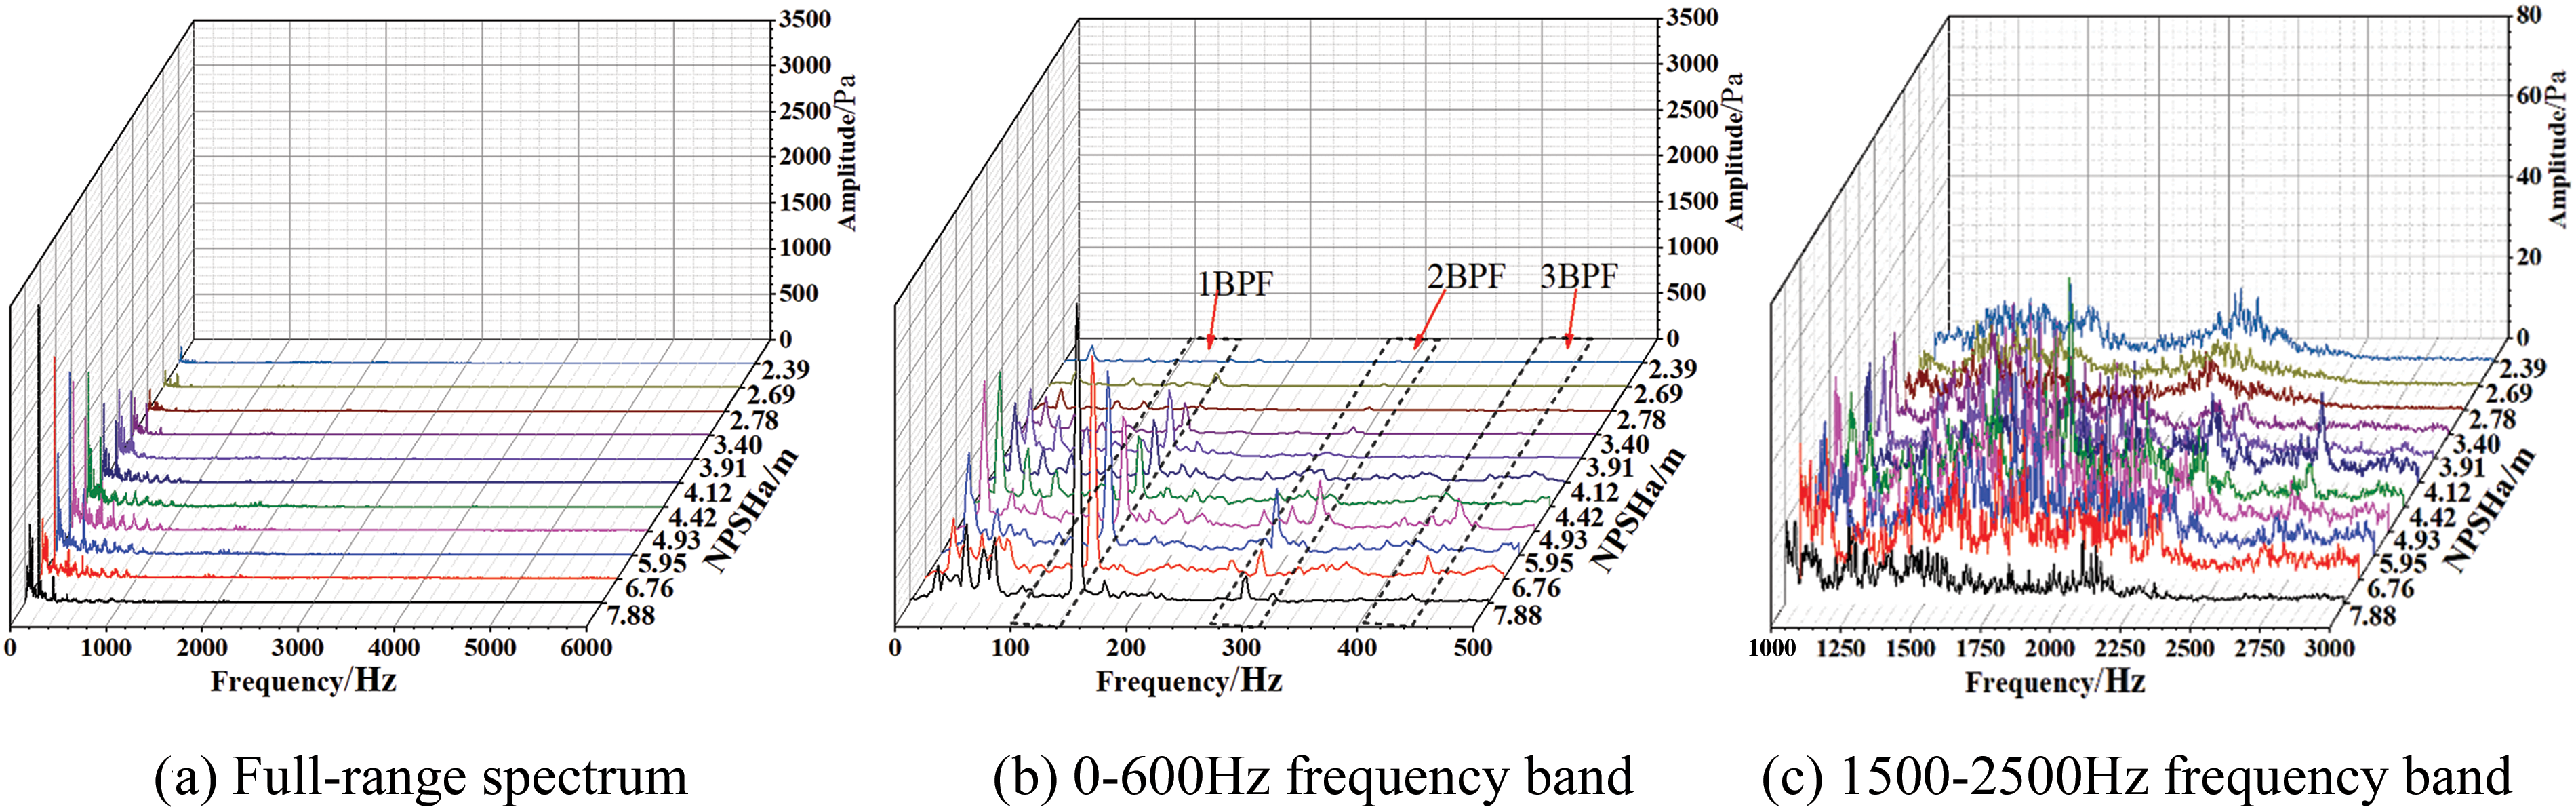
Figure 9: Spectrum characteristics of the inlet cavitation noise at 1.2Qd flow rate
In the development stage of cavitation, the amplitude fluctuation frequency band of the cavitation noise signal at the inlet is concentrated in the range of 0–3000 Hz, which composed of discrete noise and broadband noise. The discrete noise consists of axis-passing frequency (APF) at 24 Hz, blade-passing frequency (BPF) at 144 Hz, and their respective harmonics. The noise energy is concentrated in the band of 0 to 600 Hz, and at 144 Hz showing the highest amplitude, as shown in Figs. 7b, 8b to 9b. In addition, there are relatively small amplitude noise signals in the frequency range of 1500 to 3000 Hz, as shown in Figs. 7c, 8c and 9c. At the same flow rate, as the NPSHa decreases, the sound pressure amplitude of the inlet noise sharply decreases. When the flow rates are 0.8Qd, 1.0Qd, and 1.2Qd, corresponding to NPSHa of 2.7, 3.18, and 3.4 m, the low-frequency amplitudes from 0 to 600 Hz decrease from around 1400, 2400, and 3000 Pa to around 200, 120, and 500 Pa, respectively. The noise amplitude increases and then decreases in the frequency band of 1500 to 2500 Hz. The development of cavitation leads to a continuous increase in the volume of bubbles at the inlet, exacerbating flow field fluctuations and vortex noise. Meanwhile, in severe cavitation conditions, a large number of bubbles will be generated, hindering the transmission of noise from the impeller inlet to the upstream area. In addition, due to the compressibility characteristics exhibited by cavitation bubbles, a portion of the noise energy is also absorbed.
3.4 Spectrum Characteristics of Cavitation Noise at the Outlet
Figs. 10–12 illustrate the frequency spectrum distribution of the noise at the outlet of the centrifugal pump at flow rates of 0.8Qd, 1.0Qd, and 1.2Qd. It can be observed that, When cavitation does not occur, the maximum sound pressure amplitudes at flow rates of 0.8Qd, 1.0Qd, and 1.2Qd are approximately 1280, 3000, and 5400 Pa, respectively. Approximately 1280, 3000, and 5400 Pa, respectively. The corresponding NPSHa values are 8.29, 7.66, and 7.88 m, as shown in Figs. 10a, 11a and 12a. And the amplitude of the outlet sound pressure increases with the increase of flow rate. Compared to inlet, the oulet noise exhibits higher sound pressure values at corresponding flow rates. The main reasons are the disturbance of the wake at the impeller outlet and the dynamic and static interaction between the volute tongue and the blade, which lead to the flow field pressure fluctuation and significant sound pressure fluctuation.
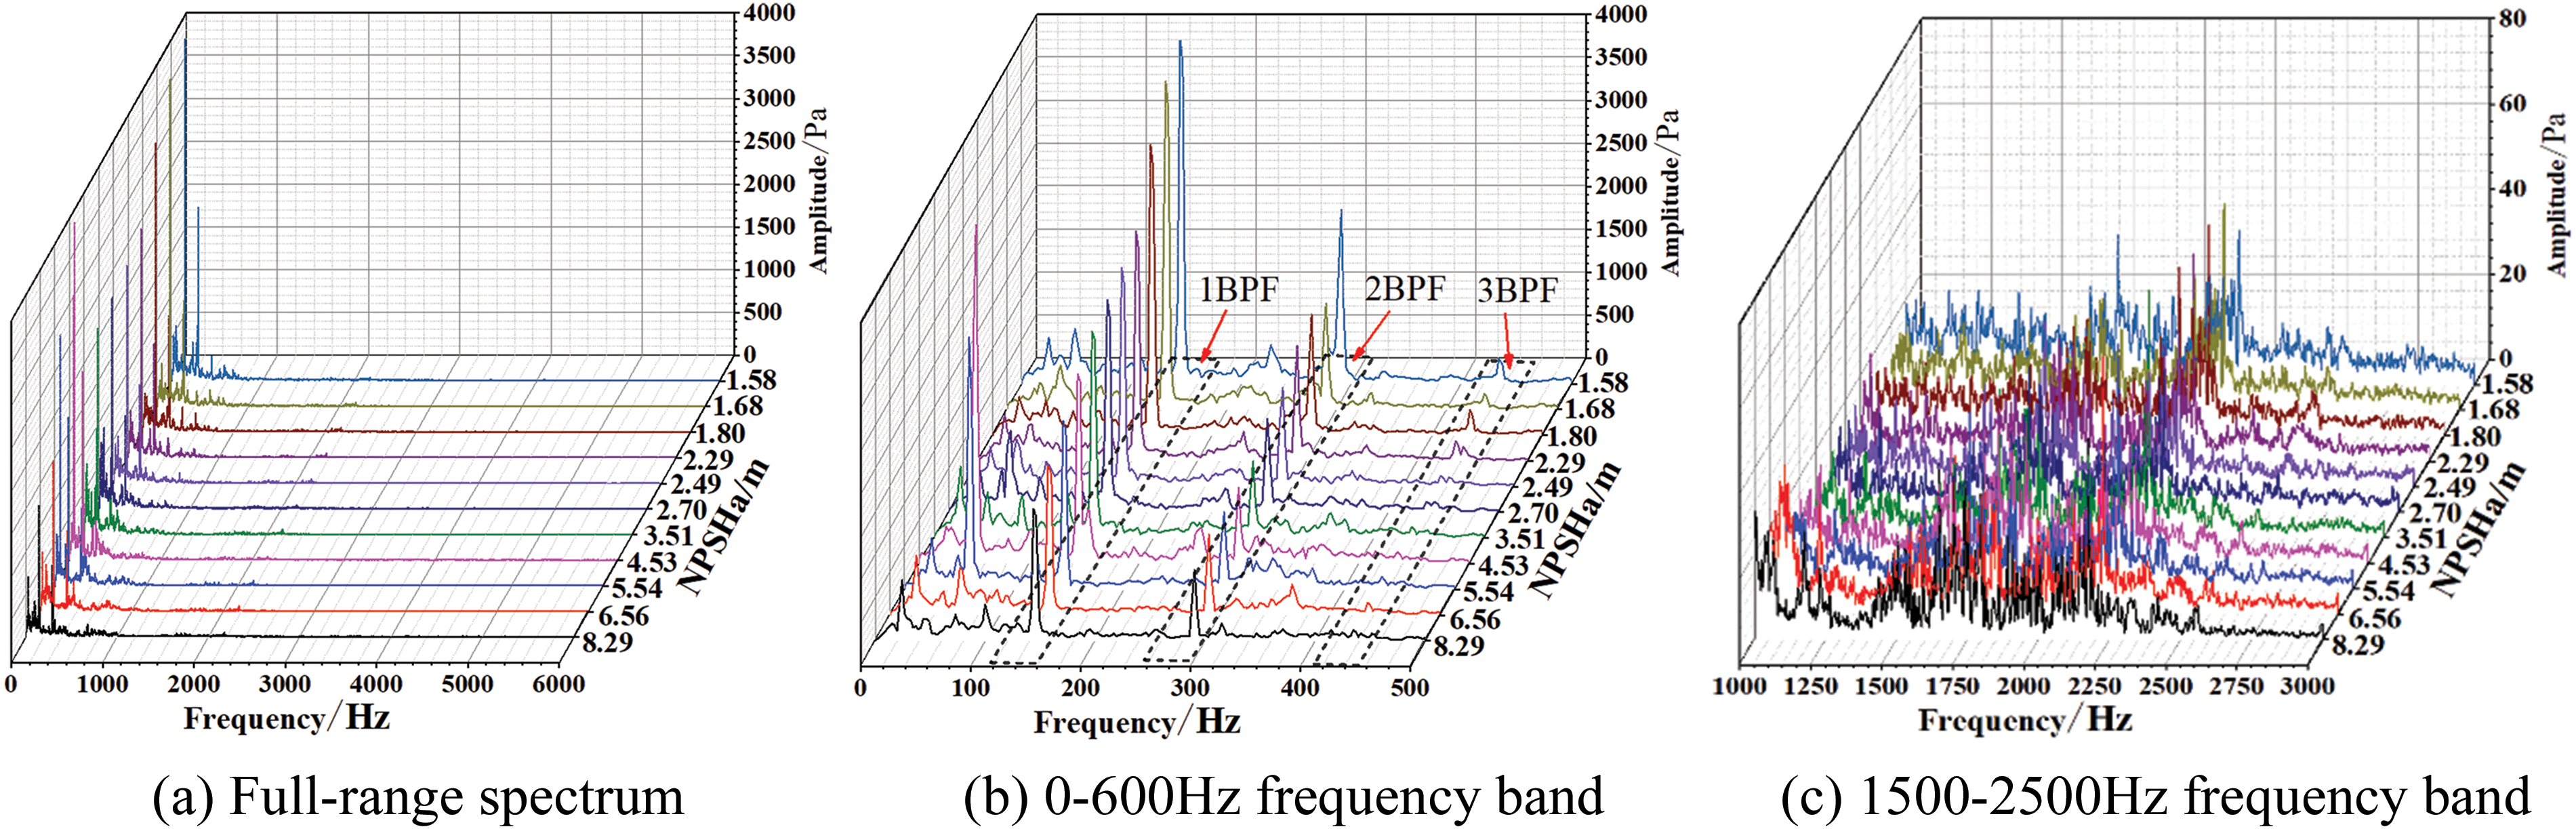
Figure 10: Spectrum characteristics of the outlet cavitation noise at 0.8Qd flow rate
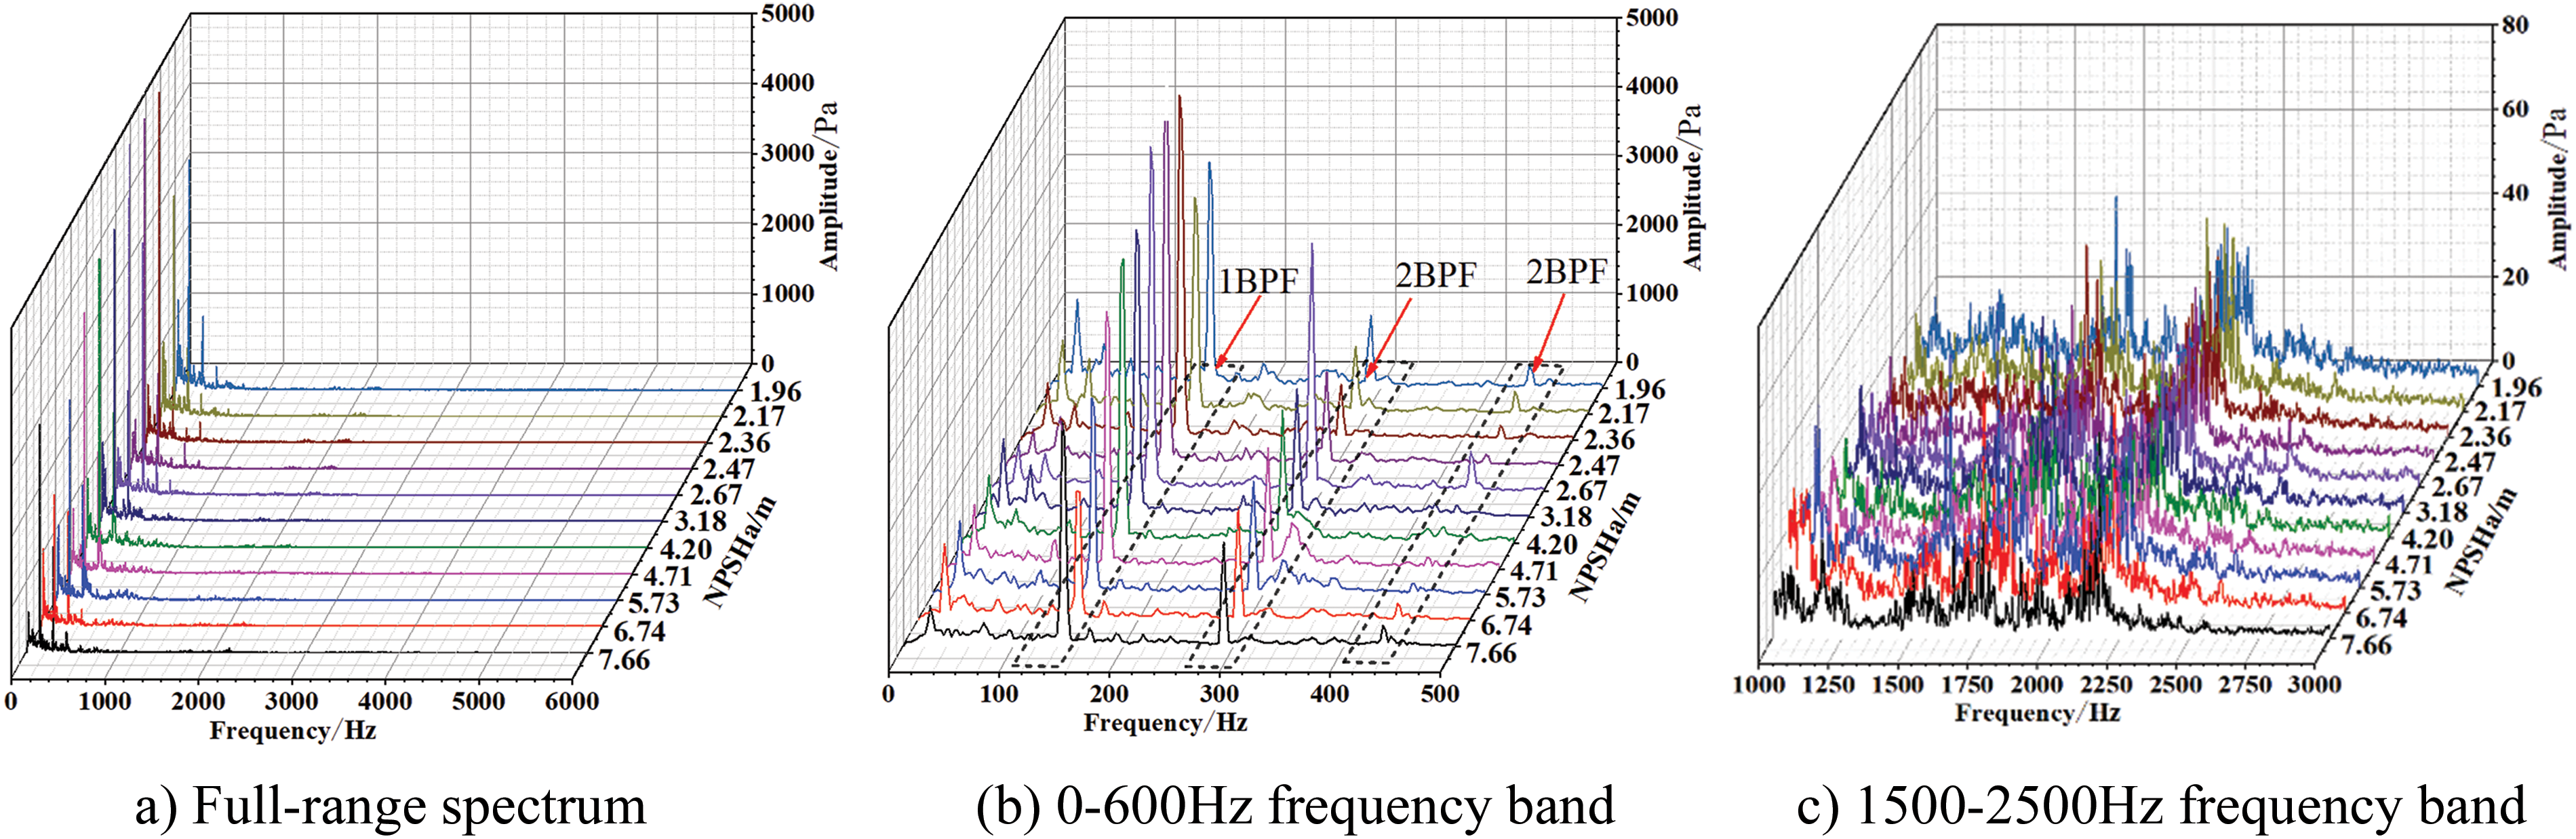
Figure 11: Spectrum characteristics of the outlet cavitation noise at 1.0Qd flow rate
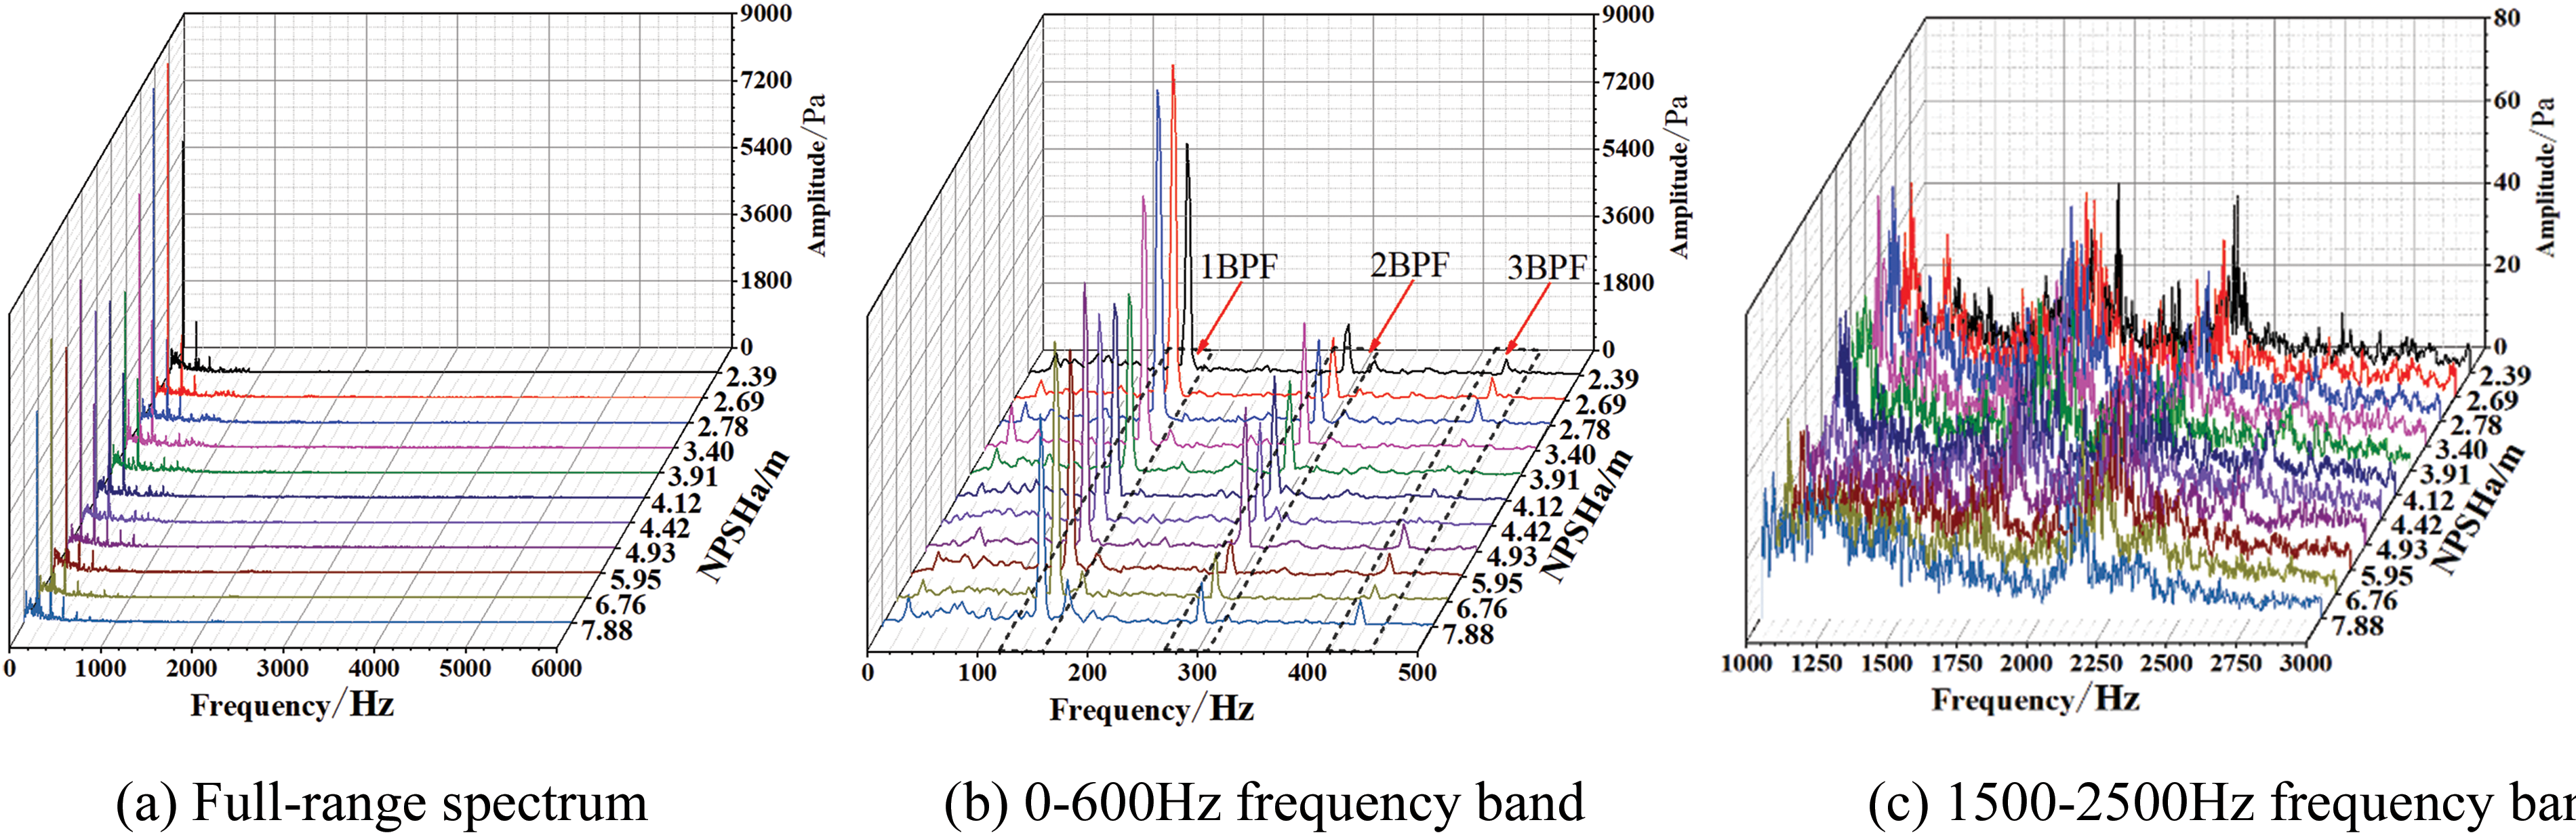
Figure 12: Spectrum characteristics of the outlet cavitation noise at 1.2Qd flow rate
During the development of cavitation, the outlet noise signal fluctuates the most in the range of 0–3000 Hz, mainly composed of discrete and broadband noise components. The discrete noise consists of axis-passing frequency (APF) at 24 Hz and blade-passing frequency (BPF) at 144 Hz, and their respective harmonics. The amplitude of the sound pressure increases at all three flow rates, with the most significant changes observed at blade frequency and twice blade frequency, as shown in Figs. 10b, 11b and 12b. As NPSHa decreases, the maximum amplitude gradually increases. In the frequency range of 1500 to 2500 Hz, as shown in Figs. 10c, 11c and 12c, significant pulsations are observed throughout the entire cavitation process.
In summary, with the development of cavitation, the noise energy of the inlet and outlet is obviously different at various flow rates. From Figs. 5 and 6, it can be observed that when the flow rate exceeds 0.9Qd and NPSHa is above 4 m, there is an approximate increase of 10 dB in the outlet OSPL compared to the inlet OSPL. When the flow rate is less than 0.9Qd and NPSHa is greater than 4 m, the difference in OSPL between the inlet and outlet noise becomes extremely small. This is mainly due to the reduced flow rate, which weakens the effect of the flow field on noise propagation and results in an increase in the intensity of noise transfer from downstream to upstream. When NPSHa is less than 4 m, there is a significant difference of about 20 dB between the inlet and outlet cavitation noise. Meanwhile, Figs. 7 to 12 indicate that as the NPSHa decreases at three flow rates, the amplitude of inlet noise significantly decreases. The maximum amplitude during cavitation development and severe stages is below 500 Pa. And the amplitude of the export noise significantly increased. The output noise amplitude during the cavitation development stage and severe stage both exceed 3000 Pa, with significant differences. The above phenomenon indicates that cavitation and flow velocity have significant effects on the propagation of internal noise in centrifugal pumps.
The closed test system and acoustic test system are used in the paper to collect cavitation noise in the inlet and outlet of the centrifugal pump. The inlet and outlet noise signals under different cavitation development stages at different flow rates are obtained. Detailed analysis is conducted on the variation law and spectrum characteristics of the inlet and outlet noise with the development of cavitation. The conclusions are as follows:
(1) The flow rate has a significant effect on the acoustic characteristics of centrifugal pumps. The OSPL of inlet and outlet increases with the increase of flow rates. The amplitude of the inlet sound pressure is about 10 dB smaller than that of the outlet. The OSPL of the inlet decreases sharply with the decrease of NPSHa, while the OSPL of the outlet first increases and then decreases with the decrease of NPSHa. In contrast, the OSPL of imported noise exhibits higher sensitivity to the occurrence of cavitation. Compared with traditional pressure reduction methods, detecting cavitation earlier can be achieved by measuring the NPSHa values during sudden changes in inlet and outlet OSPL.
(2) The spectrum characteristics show that the noise at the inlet and outlet is mainly composed of discrete and broadband components. The discrete component comprises APF (24 Hz), BPF (144 Hz), and their harmonics, and the noise energy is mainly concentrated in this region. The spectrum variation of the inlet noise is concentrated in the frequency range of 0–3000 Hz. As NPSHa decreases, the spectrum amplitude sharply decreases at various flow rates. The spectrum of outlet noise mainly varies in the range of 0–2500 Hz. The spectrum variation of the outlet noise is mainly in the range of 0–2500 Hz. At all flow rates, the spectrum amplitude trend of the outlet noise shows an increasing and then decreasing trend.
(3) Compared with the outlet spectrum characteristics, the energy of the inlet noise spectrum at all flow rates shows a more obvious trend of change with the development of cavitation. This is similar to the change rule of the inlet OSPL. By analyzing the changes in OSPL and spectrum characteristics at the inlet and outlet of centrifugal pumps, cavitation can be detected earlier than traditional head methods. And detecting cavitation based on changes at inlet cavitation noise is more pronounced.
The research results of this article illustrate the changes in acoustic characteristics during the whole process of cavitation in centrifugal pumps. Furthermore, other hydraulic machinery, such as multi-stage pumps and mixed flow pumps, also have similar mechanical and flow structures. Therefore, the results of this study can also provide reference for cavitation monitoring of other hydraulic machinery.
Acknowledgement: The authors acknowledge the support of the National Natural Science Foundation of China for this project. The study is supported by the National Natural Science Foundation of China (Research Project No. 52169018).
Funding Statement: The study is supported by the National Natural Science Foundation of China (Research Project No. 52169018).
Author Contributions: The authors confirm contribution to the paper as follows: study conception and design: Weiguo Zhao, Wensheng Ma; data collection: Rui Cao; analysis and interpretation of results: Dongwei Wang, Youchao Yang; draft manuscript preparation: Dongwei Wang. All authors reviewed the results and approved the final version of the manuscript.
Availability of Data and Materials: The datasets generated and/or analyzed during the current study are not publicly available due to the data and research results in the paper have not been published and need to be kept confidential, but are available from the corresponding author on reasonable request.
Ethics Approval: Not applicable.
Conflicts of Interest: The authors declare no conflicts of interest to report regarding the present study.
References
1. Shi X, Lu J, Zhao L. Investigations on the influence of tandem blades on inner flow and performance characteristics of centrifugal pump. Proc Instit Mech Eng Part E: J Process Mech Eng. 2020;234(1):46–55. doi:10.1177/0954408919883730. [Google Scholar] [CrossRef]
2. Fu Q, Zhang F, Zhu R, He B. A systematic investigation on flow characteristics of impellerpassage in a nuclear centrifugal pump under cavitation state. Ann Nucl Energy. 2016;97(4):190–7. doi:10.1016/j.anucene.2016.07.011. [Google Scholar] [CrossRef]
3. Duplaa S, Coutier-Delgosha O, Dazin A, Roussette O, Caignaert G. Experimental study of a cavitating centrifugal pump during fast startups. J Fluid Eng. 2010;132(2):021301. doi:10.1115/1.4000845. [Google Scholar] [CrossRef]
4. Gong J, Luo W-Z, Wu T-C, Zhang Z-Y. Numerical analysis of vortex and cavitation dynamics of an axialflow pump. Eng Appl Comput Fluid Mech. 2022;16(1):1921–38. doi:10.1080/19942060.2022.2122570. [Google Scholar] [CrossRef]
5. Wu S, Wu Y, Tian J, Ouyang H. On the cavitationinduced collapse erosion of a turbofan fuel pump. Eng Appl Comput Fluid Mech. 2022;16(1):1048–63. doi:10.1080/19942060.2022.2067243. [Google Scholar] [CrossRef]
6. Wang G, Senocak I, Shyy W, Ikohagi T, Cao S. Dynamics of attached turbulent cavitating flows. Prog Aerosp Sci. 2001;37(6):551–81. doi:10.1016/S0376-0421(01)00014-8. [Google Scholar] [CrossRef]
7. Brennen CE. Fundamentals of multiphase flow. UK: Cambridge University Press; 2005. [Google Scholar]
8. Binama M, Muhirwa A, Bisengimana E. Cavitation effects in centrifugal pumps-a review. Int J Eng Res Appl. 2016;6(5):52–6. [Google Scholar]
9. Harrison M. An experimental study of single bubble cavitation noise. J Acoust Soc Am. 1952;24(6):776–82. doi:10.1121/1.1906978. [Google Scholar] [CrossRef]
10. Bark G, Berlekom WBV. Experimental investigationns of cavitation dynamics and cavitation noise. Eksperimentalna Meditsina I Morfologiia. 1979;25(4):50–4. doi:10.1111/j.1439-0310.2007.01433.x. [Google Scholar] [CrossRef]
11. Cramer E. The dynamics and acoustic emission of bubbles driven by a sound field. In: Cavitation and in homogeneities in underwater acoustic. Berlin, Heidelberg: Springer Berlin Heidelberg; 1980. p. 54–63. [Google Scholar]
12. Wu K, Cai H, Zhang Z, Wang P, Wang L, Cao L, et al. Experimental investigation of tip vortex cavitation noise under static and dynamic states. Phys Fluids. 2024;36(7):65. doi:10.1063/5.0217994. [Google Scholar] [CrossRef]
13. Park C, Do Kim G, Yim GT, Park Y, Moon I. A validation study of the model test method for propeller cavitation noise prediction. Ocean Eng. 2020;213(1):107655. doi:10.1016/j.oceaneng.2020.107655. [Google Scholar] [CrossRef]
14. Ebrahimi A, Razaghian AH, Tootian A, Seif MS. An experimental investigation of hydrodynamic performance, cavitation, and noise of a normal skew B-series marine propeller in the cavitation tunnel. Ocean Eng. 2021;238(2):109739. doi:10.1016/j.oceaneng.2021.109739. [Google Scholar] [CrossRef]
15. Ku G, Cho J, Cheong C, Seol H. Numerical investigation of tip-vortex cavitation noise of submarine propellers using hybrid computational hydro-acoustic approach. Ocean Eng. 2021;238(3):109693. doi:10.1016/j.oceaneng.2021.109693. [Google Scholar] [CrossRef]
16. Tomy JP, Gosda R, Berger S, Bingham HB, Andersen P, Abdel-Maksoud M. Modelling the acoustic radiation of propeller tip vortex cavitation in potential flow simulations. Ocean Eng. 2024;311(1):118732. doi:10.1016/j.oceaneng.2024.118732. [Google Scholar] [CrossRef]
17. Zhao W, Li Q, Kang Y. Effect of suppressing cavitation of rough zone on suction surface of centrifugal pump blade. Trans Chin Soc Agricult Mach. 2021;6:169–76. [Google Scholar]
18. Zhao WG, Zhai LJ, Xia T, Li S. Numerical simulation of slotted blade in centrifugal pump on cavitation suppression. Trans Chin Soc Agricult Mach. 2018;49(12):150–7. [Google Scholar]
19. Zhao WG, Kang YD, Li QH, Xue Z. Effects of different structures of blade suction surface on cavitation initiation of centrifugal pump. J Vibrat Shock. 2022;41(7):23–30. [Google Scholar]
20. Mou JG, Shi ZZ, Gu YQ, Wang H, Zhao L, Jian J. Influence of blade wrap angle on cavitation performance of centrifugal pump. J Zhejiang Univ Technol. 2019;47(1):24–8. [Google Scholar]
21. Mousmoulis G, Kassanos I, Aggidis G, Anagnostopoulos I. Numerical simulation of the performance of a centrifugal pump with a semi-open impeller under normal and cavitating conditions. Appl Math Model. 2021;89(3):1814–34. doi:10.1016/j.apm.2020.08.074. [Google Scholar] [CrossRef]
22. Fu YX, Yuan SQ, Yuan JP, Zhou BL, Wang P. Effect of blade numbers on cavitating flow of centrifugal pump under low flow rates. Trans Chin Soc Agricult Mach. 2015;46(4):21–8. [Google Scholar]
23. Wang Y, Liu H, Yuan S, Wang J, Liu D. Effects of the blade number on cavitation-induced vibration and noise of centrifugal pumps. J Harb Eng Univ. 2012;33(11):1405–9 (In Chinese). [Google Scholar]
24. Kang JJ, Zhu RS, Wang XL. Effects of impeller geometry parameters on fracture cavitation performance of centrifugal pump. J Drainag Irrigat Mach Eng. 2018;36(2):111–7. [Google Scholar]
25. Cao R, Yuan J, Deng F, Wang L. Numerical method to predict vibration characteristics induced by cavitation in centrifugal pumps. Meas Sci Technol. 2021;32(11):115109. doi:10.1088/1361-6501/ac1181. [Google Scholar] [CrossRef]
26. Dönmez AH, Yumurtacı Z, Kavurmacıoğlu L. The effect of inlet blade angle variation on cavitation performance of a centrifugal pump: a parametric study. J Fluid Eng. 2019;141(2):021101. [Google Scholar]
27. Zhang N, Gao B, Li Z, Jiang Q. Cavitating flow-induced unsteady pressure pulsations in a low specific speed centrifugal pump. R Soc Open Sci. 2018;5(7):180408. [Google Scholar] [PubMed]
28. Rakibuzzaman M, Kim K, Suh SH. Numerical and experimental investigation of cavitation flows in a multistage centrifugal pump. J Mech Sci Technol. 2018;32(3):1071–8. [Google Scholar]
29. Lu J, Gong Y, Li L, Liu X, Kan N, Zhang F, et al. Research of the vibration induced by cavitation in a centrifugal pump under part load condition. Phys Fluids. 2023;35(4):108582. doi:10.1063/5.0150364. [Google Scholar] [CrossRef]
30. Orlandi F, Montorsi L, Milani M. Cavitation analysis through CFD in industrial pumps: a review. Int J Thermofluids. 2023;20:100506. [Google Scholar]
31. Guan XF. Morden pumps theory and design. China: China Aerospace Publishing House; 2011. [Google Scholar]
32. Yokoi T, Kang D, Nohmi M, Tsuneda T, Okajima J, Iga Y. Visualization of rotating cavitation in a centrifugal pump. J Phys: Conf Series. 2022;2217(1):012019. doi:10.1088/1742-6596/2217/1/012019. [Google Scholar] [CrossRef]
33. Xu Z, Kong F, Zhang H, Zhang K, Wang J, Qiu N. Research on visualization of inducer cavitation of high-speed centrifugal pump in low flow conditions. J Mar Sci Eng. 2021;9(11):1240. doi:10.3390/jmse9111240. [Google Scholar] [CrossRef]
34. Cui Y, Cheng B, Ding Q, Li X, Zhao M. Study on cavitation bubble characteristics in centrifugal pump based on image recognition. Processes. 2023;11(12):3314. doi:10.3390/pr11123314. [Google Scholar] [CrossRef]
35. Mousmoulis G, Anagnostopoulos I, Aggidis G, Gryllias K. Emphasizing on the envelope spectra of hydraulic turbomachinery vibration response towards cavitation diagnosis. Measurement. 2025;241:115733. [Google Scholar]
36. Stephen C, Basu B, McNabola A. Detection of cavitation in a centrifugal pump-as-turbine using time-domain-based analysis of vibration signals. Energies. 2024;17(11):2598. doi:10.3390/en17112598. [Google Scholar] [CrossRef]
37. Mousmoulis G, Yiakopoulos C, Aggidis G, Antoniadis I, Anagnostopoulos I. Application of Spectral Kurtosis on vibration signals for the detection of cavitation in centrifugal pumps. Appl Acoust. 2021;182:108289. [Google Scholar]
38. Čudina M. Detection of cavitation phenomenon in a centrifugal pump using audible sound. Mech Syst Signal Process. 2003;17(6):1335–47. [Google Scholar]
39. Cudina M, Prezelj J. Detection of cavitation in situ operation of kinetic pumps: effect of cavitation on the characteristic dis-crete frequency component. Appl Acoust. 2009;70(9):1175–82. [Google Scholar]
40. Reisman GE, Wang YC, Brennen CE. Observations of shock waves in cloud cavitation. J Fluid Mech. 1998;355:255–83. doi:10.1017/S0022112097007830. [Google Scholar] [CrossRef]
41. Callenaere M, Franc JP, Michel JM, Riondet M. The cavitation instability induced by the development of a reentrant jet. J Fluid Mech. 2001;444(1):223–56. doi:10.1017/S0022112001005420. [Google Scholar] [CrossRef]
42. Stephen C, Arumugam D, Kumaraswamy S. Assessment of noise signature for a cavitating centrifugal pump. ASME J Energy Resour Technol. 2022;144(4):042105. doi:10.1115/1.4052618. [Google Scholar] [CrossRef]
43. Liu T, Zhu J, Wang Z, Geng H, Zhu H. Experimental study on cavitation noise characteristics of a hydraulic model of mixed-flow pump. IEEE Access. 2023;11:111274–80. doi:10.1109/ACCESS.2023.3312725. [Google Scholar] [CrossRef]
44. Tao L, Jiawei Z, Keqiang C, Chen Z, Dong L. Research on cavitation state identification of centrifugal pump based on RNN and CEEMDAN algorithm. Chin Journal of Hydrodynamics. 2023;38(4):629–36. doi:10.16076/j.cnki.cjhd.04.015. [Google Scholar] [CrossRef]
45. Pan ZY, Yuan SQ. Fundamentals of cavitation in pumps. China: Jiangsu University Press; 2013. p. 69–71. [Google Scholar]
46. Gülich JF. Centrifugal pumps. Berlin: Springer; 2008. vol. 2. [Google Scholar]
47. Schiavello B, Visser FC. Pump cavitation—various NPSHR criteria, NPSHA margins, and impeller life expectancy. In: International Pump Users Symposium, 2009; Texas A&M University. Turbomachinery Laboratories; p. 113–43. doi:10.21423/R1XM30. [Google Scholar] [CrossRef]
48. Por E, Kooten M, Sarkovic V. Nyquist–Shannon sampling theorem. The Netherlands: Leiden University; 2019. p. 1–4. [Google Scholar]
49. Huo HY, Sun WC. Average sampling theorem. Sci Sin Math. 2015;45(9):1403–22. doi:10.1360/N012015-00026. [Google Scholar] [CrossRef]
Cite This Article
 Copyright © 2025 The Author(s). Published by Tech Science Press.
This work is licensed under a Creative Commons Attribution 4.0 International License , which permits unrestricted use, distribution, and reproduction in any medium, provided the original work is properly cited.
 Downloads
 Citation Tools