
 Submit a Paper
 Propose a Special lssue
 Open Access
ARTICLE

Separation and Transport of Sediment Particles Due to the Erosion of Sand-Covered Slopes
1 Collaborative Innovation Center for Water Pollution Control and Water Safety in Karst Areas, Guilin University of Technology, Guilin, 541004, China
2 College of Environmental Science and Engineering, Guilin University of Technology, Guilin, 541004, China
3 State Key Laboratory of Eco-Hydraulics in Northwest Arid Region of China, Xi’an University of Technology, Xi’an, 710048, China
4 State Key Laboratory of Soil Erosion and Dry-Land Farming on the Loess Plateau, Institute of Soil and Water Conservation, Chinese Academy of Sciences and Ministry of Water Resources, Yangling, 712100, China
* Corresponding Author: Shanshan Tang. Email:
Fluid Dynamics & Materials Processing 2025, 21(4), 819-831. https://doi.org/10.32604/fdmp.2025.057605
Received 22 August 2024; Accepted 20 December 2024; Issue published 06 May 2025
 View Full Text
 Download PDF
Abstract
The particle size distribution plays a crucial role in the transportation and deposition of eroded sediments. Gaining insights into the related sorting mechanism can significantly enhance our understanding of such processes. In this study, sand-covered slopes were examined. A controlled indoor rainfall simulation was conducted on loess slopes with a 12° incline and a rainfall intensity of 1.5 mm/min. These slopes were then covered with sand layers of varying thicknesses—0.5, 1.0, and 1.5 cm—to observe their effects. The findings have revealed that as the thickness of the sand cover increases, the content of sediment particles smaller than 0.054 mm decreases. In contrast, the content of particles larger than 0.054 mm increases after the sixth minute of runoff. The eroded sediment was predominantly composed of silt. During the inter-rill erosion stage, runoff primarily transported particles larger than 0.054 mm. However, in the subsequent rill erosion and combined rill and inter-rill erosion stages, the runoff predominantly carried finer particles, smaller than 0.054 mm. Moreover, the presence of the sand layer significantly influenced the size and form of the eroded sediment particles. Initially, during the first 10 min of runoff, the eroded particles were predominantly larger than 0.054 mm. After this period, however, the particle size shifted, with the majority of particles being smaller than 0.054 mm. This study highlights the intricate relationship between sediment sorting, the thickness of sand covers, and the dynamics of sediment transport under rainfall-induced erosion.Keywords
Soil erosion on inclined surfaces can occur under the scouring action of runoff, transportation, separation, and subsequent deposition of soil particles, all of which are influenced by rainfall [1]. The size distribution of sediment particles is of significant importance in developing predictive models for soil erosion dynamics, since it partially determines erosion characteristics [2]. Rill and inter-rill erosion processes are typically considered in the classification of soil erosion [3,4]. Erosion-driven sediments primarily consisted of the original components of soil aggregates and agglomerates, including clay, silt, and sand [5]. Typically, transportation of fine sediment particles is facilitated by the rill erosion process until runoff shear stress reaches a critical threshold [6,7]. Due to its inherent inability to effectively transport coarse particles, rill erosion is primarily responsible for the transportation of fine particles [8]. However, sediments transported by inter-rill erosion are typically coarser than those transported by rill erosion or undisturbed soil [9–11]. Previous research works have revealed fluctuations in sediment particle size distribution throughout the water erosion process [12]. The distribution of clay particles in eroded sediments exhibits high similarity to that observed in undisturbed soils. Furthermore, an increase in rainfall duration results in coarsening and enhanced stability of the eroded sediment particles. Particle size distribution of the eroded sediment was found to be consistent with that of undisturbed soil [2,13] and displayed a bimodal pattern which was attributed to the contrasting kinetic energies of suspended particles compared to saltated and rolled ones [14]. Different factors such as precipitation type, soil characteristics, vegetation cover amount, runoff type (sheet flow or rill flow) and slope steepness play roles in determining particle size distribution within eroded sediments [10,11,15].
Most previous studies on the impacts of various factors on sediment particle size distribution have focused on specific variables such as rainfall intensity, terrain gradient, sediment yield, and surface runoff [16,17]. However, some research works have investigated the properties of granular loose soils containing significant amounts of coarse sediments. This research investigated the sand effect on sediment sorting characteristics under simulated rainfall conditions. We also explored the effects of sand-covered slopes. The main objective of this research was to determine the factors involved in erosion and examine the interrelationship between the sand layer and underlying soil.
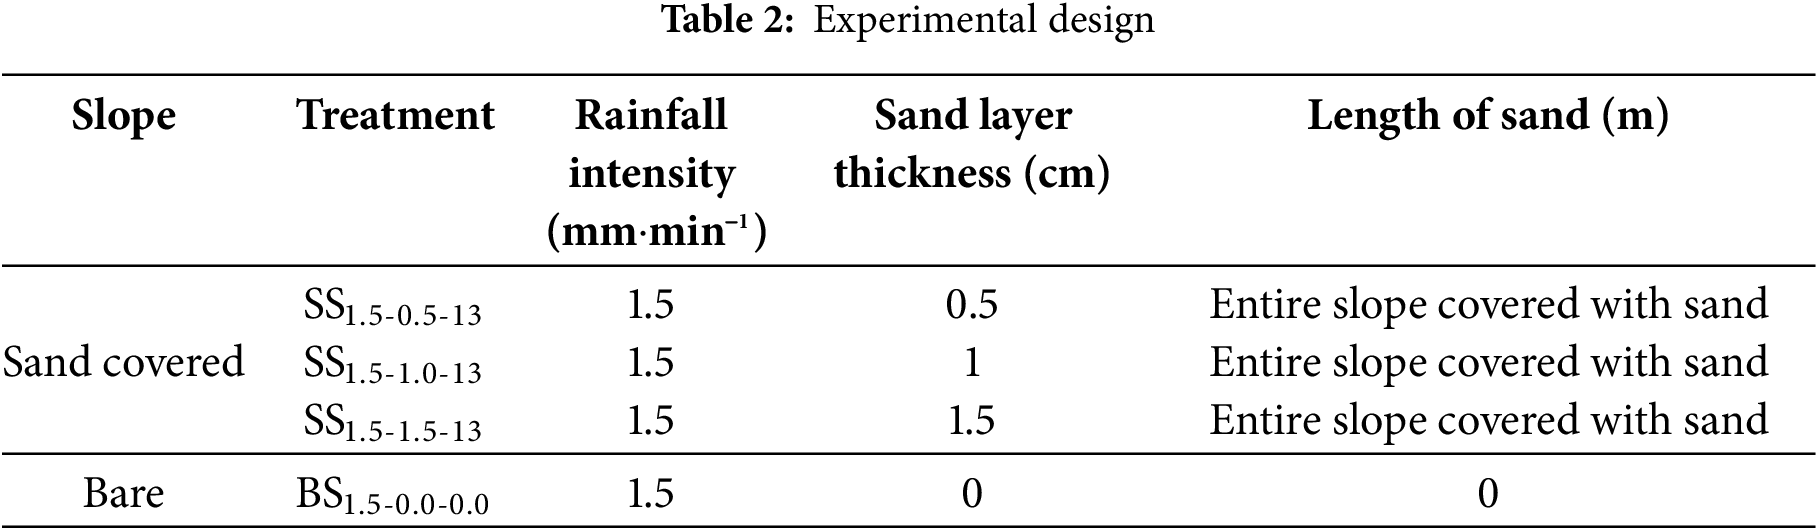
Rainfall simulation experiments were performed at State Key Laboratory for Eco-Hydraulic Engineering at Xi’an University of Technology in China. The device applied to generate artificial rainfall comprised lateral sprinklers, which were designed to produce raindrops with terminal velocity of over 90% of that observed in natural precipitation. Soil-testing flume was 13 m long and 1 m wide, with a 12-degree slope gradient. Modifications to water supply head generated a wide range of precipitation intensities from 0.5 to 3.5 mm·min−1. The generated rainfall exhibited a uniformity degree of over 85%, with a voltage regulator to ensure consistent stability in case of intense precipitation events. A system was installed at the flume downstream end to collect suspended solids and runoff, as presented in Fig. 1.
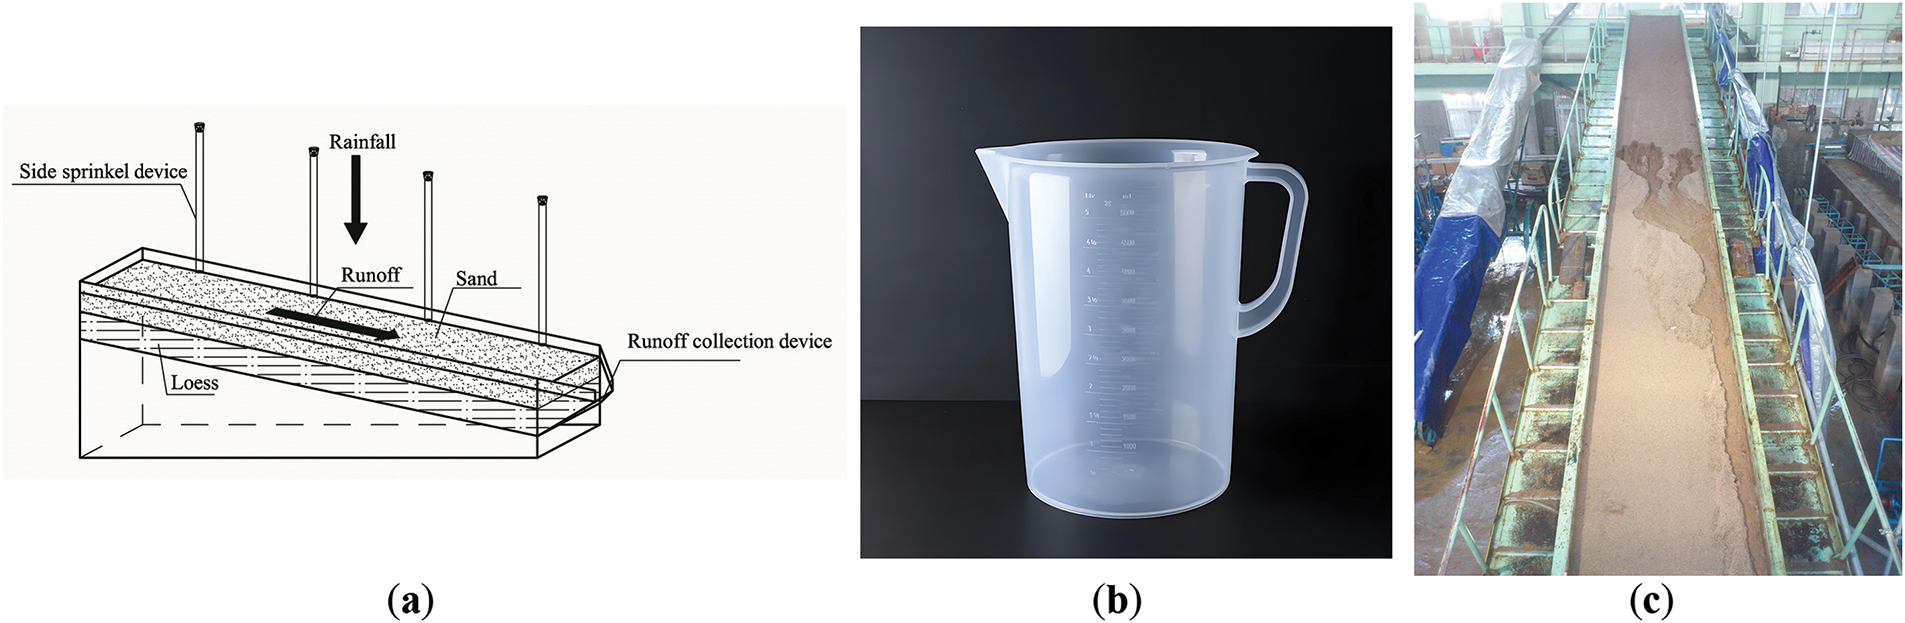
Figure 1: Rainfall simulation system setup (a–c). (a) Schematic diagram of experimental setup; (b) Runoff measurement device; (c) Experimental soil tank
Loess was considered as test soil (Table 1) and was sieved using a 10-mm mesh. Flume bed was covered by a gauze layer, followed by a 5 cm-layer of sand and five layers of loess (5 cm each). The top of each loess layer was modified to eliminate vertical stratification among layers. At the beginning of the experiment, initial soil moisture content was about 20%, while the average bulk density of loess was 1.3 g·cm−3. After evenly distributing water onto soil surface, a 24-h delay was considered before starting simulated rainfall, which continued for a period of 30 min. Both runoff and sediments were collected at 1 min intervals for subsequent analysis.
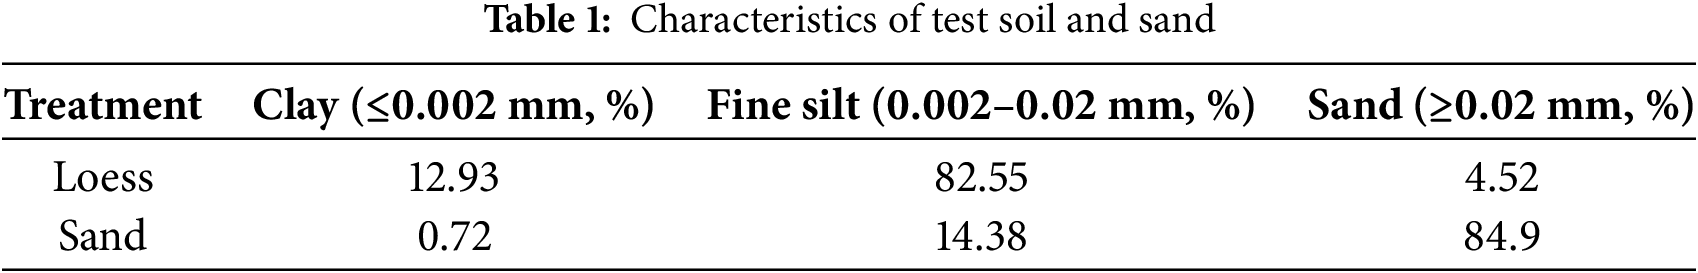
A conical flask with a predetermined volume was used to collect sediment-containing water samples at 1-min intervals, while runoff sediment samples were collected using a 5 L bucket. After each rainfall test, sediment accumulation depth in samples was determined and volume-depth relationship was used to calculate runoff volume. Sediment samples in conical flasks were allowed to settle and the upper layer of water was carefully collected and transferred to a pre-weighed lunchbox. Then, sediment sample was precipitated in a conical flask and the upper water layer was poured off and transferred to a previously weighted oven-dried lunch box. The sample was then placed in an oven at 105°C for drying. The mass of dried sediment was used to calculate the content and yield of sand. Then, a dried sediment sample was sieved through a 2 mm sieve. K2MnO4 was used to ensure water flow velocity on slope by aligning measurement timing with runoff sediment sample collection. A 3D laser scanner was applied to scan slope morphology before and after the rainfall event.
To replicate the environmental conditions of East Willow Ditch Basin in Inner Mongolia, the effect of sand layer thickness (0.0, 0.5, 1.0, and 1.5 cm) was evaluated at rainfall intensity of 1.5 mm·min−1 (Table 2).
Runoff volume for each precipitation event was recorded at 1 min intervals. To ensure sediment concentration and yield, the collected samples were subjected to a series of experiments. First, settlement was induced and then, aqueous phase was removed from the samples. Then, sediments were dried to a constant weight using a forced-air oven at 105°C. To explore particle size distribution, desiccated sediments were sieved through a 2 mm mesh using a Mastersizer 2000 instrument (Malvern, UK).
Particle size was classified into ten groups, each comprising an equal mass fraction. The classes were then applied to ensure fraction for each particle size class in outflow silt for each test sample proposed by Luo et al. [1]. In addition, sediment concentration was calculated for each specific particle size category by multiplying the comprehensive sediment concentration by the proportion of that particular size class.
Particle size gradation within the sediment was represented by mean weighted diameter (MWD), which was calculated using the following equation [18]:
where i is one of the ten size classes being analyzed, xi is the mean diameter of size class i, and ωi is weight-based proportion of particles within size class i.
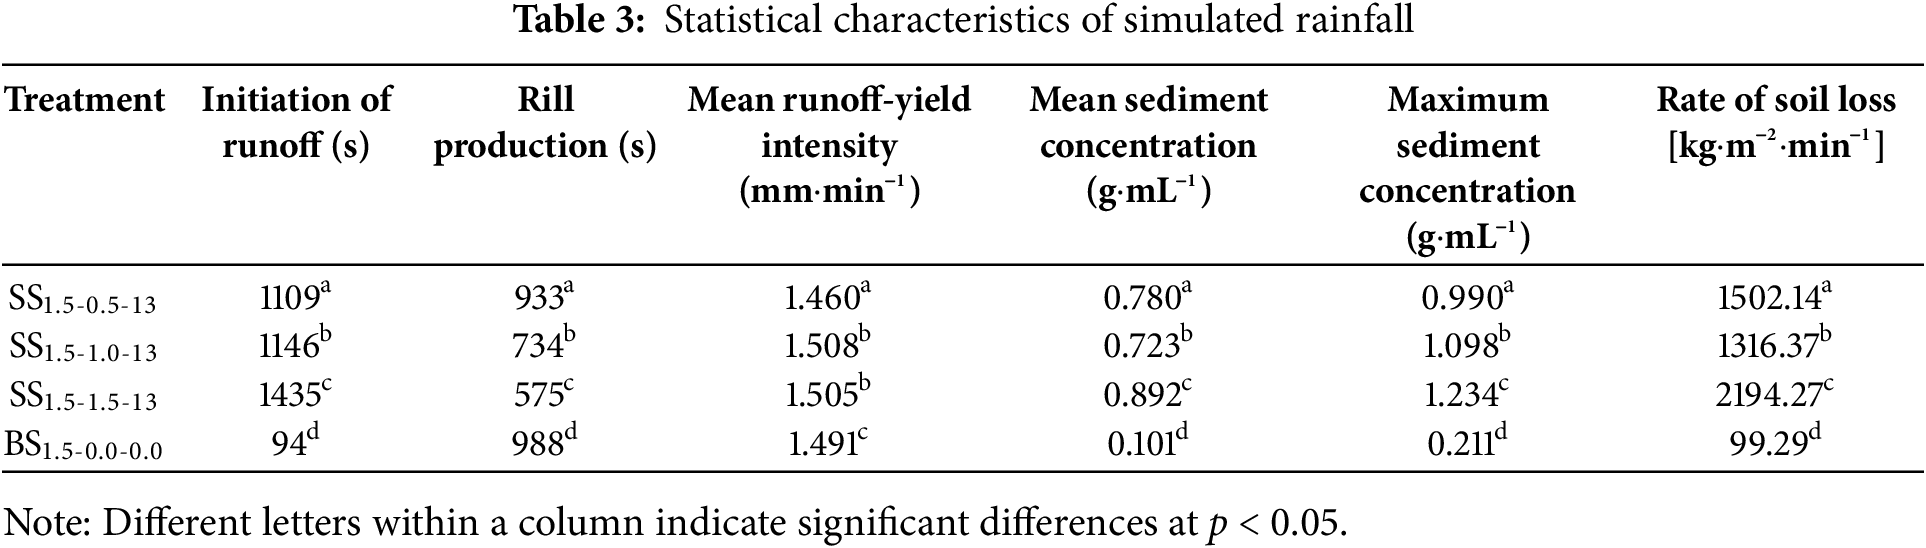
The results obtained from experiments with different sand layer thicknesses are summarized in Table 3. The times at which runoff commenced exhibited significant variations by changing sand layer thickness, indicating that increase of sand layer thickness increased the time required for runoff commencement. A significant delay was witnessed in the onset of runoff in sand-covered slope (SS) compared to bare slope (BS), with initiation rates of about 11–15 times slower. Furthermore, soil loss rate was significantly affected by sand layer thickness. BS presented longer times for rill erosion compared to that observed for the other three sand layer thicknesses. The average and maximal sediment concentrations in SS exceeded those in BS.
To gain an understanding of soil erosion dynamics, it is essential to investigate temporal changes in runoff rate and sediment concentration, as illustrated in Fig. 2. Within 10 min of the runoff process, runoff volume was significantly increased and reached a constant value. Only minor variations were observed in discharge due to the presence of sand layer, while considerable discrepancies were witnessed in sediment concentration across distinct treatment methods. In addition, samples with distinct sand layer thicknesses exhibited comparable temporal patterns in sediment concentration. Concentration of sedimentary material in sand-covered slopes was first increased significantly and then gradually decreased. The initial rainfall phase elevated sediment concentrations, indicating that sediment movement was a limiting factor in erosion processes. Therefore, sediment transportation was found to be limited by the capacity of raindrops themselves, as reported in [19]. However, transition from inter-rill to rill erosion was determined by the combined effect of sediment concentration and erosion rate. Rill development was accompanied by remarkable increases in both sediment concentration and runoff rate across all treatments. Sediment concentration at any given time during rainfall event was the highest in BS treatment, which was similar to the findings of Xu et al. [20] and Zhang et al. [21]. Thicker sand layers permitted water table formation through seepage or subsurface flow. Enhanced water retention capacity of the sand layer was verified by research indicating that water was discharged from the downstream end of the sand layer after reaching the critical gradient for hydraulics.
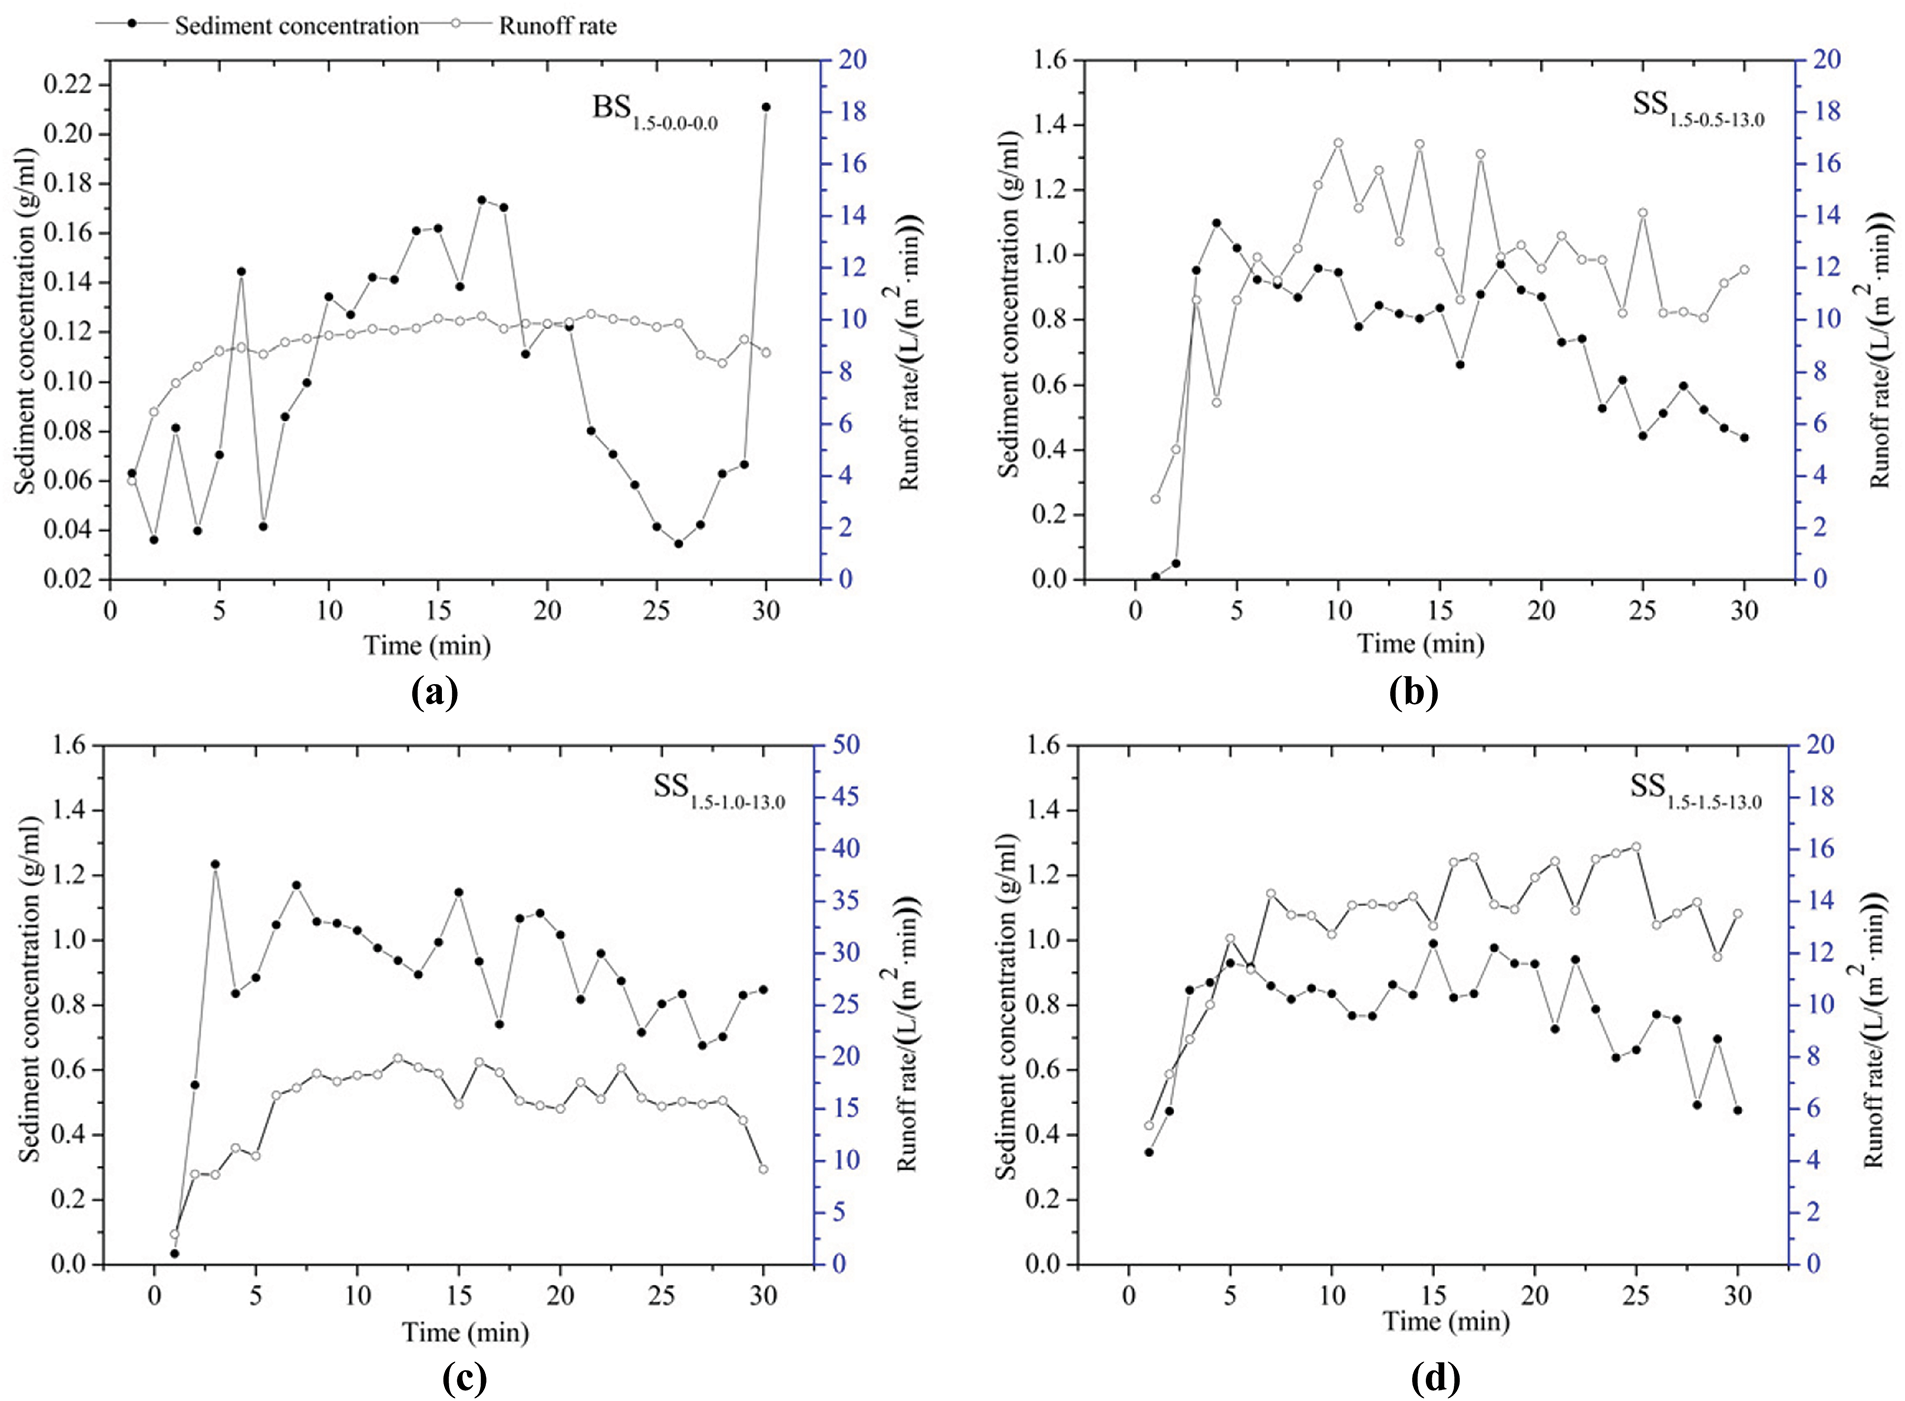
Figure 2: Temporal variations in sediment concentrations and runoff rates for (a) BS1.5-0.0-0.0, (b) SS1.5-0.5-13, (c) SS1.5-1.0-13, and (d) SS1.5-1.5-13
3.2 Particle Composition of Eroded Sediment
Temporal sediment size variations observed during SS experiments are presented in Fig. 3. Sediment size was classified into discrete categories, including clay particles (<0.002 mm), fine silt (0.002–0.02 mm), coarse silt (0.02–0.05 mm), fine sand (0.05–0.25 mm), and coarse sand (>0.25 mm). Size fraction concentrations were found to be significantly affected by rill development in most simulations with this pattern becoming more pronounced by increasing sand layer thickness.
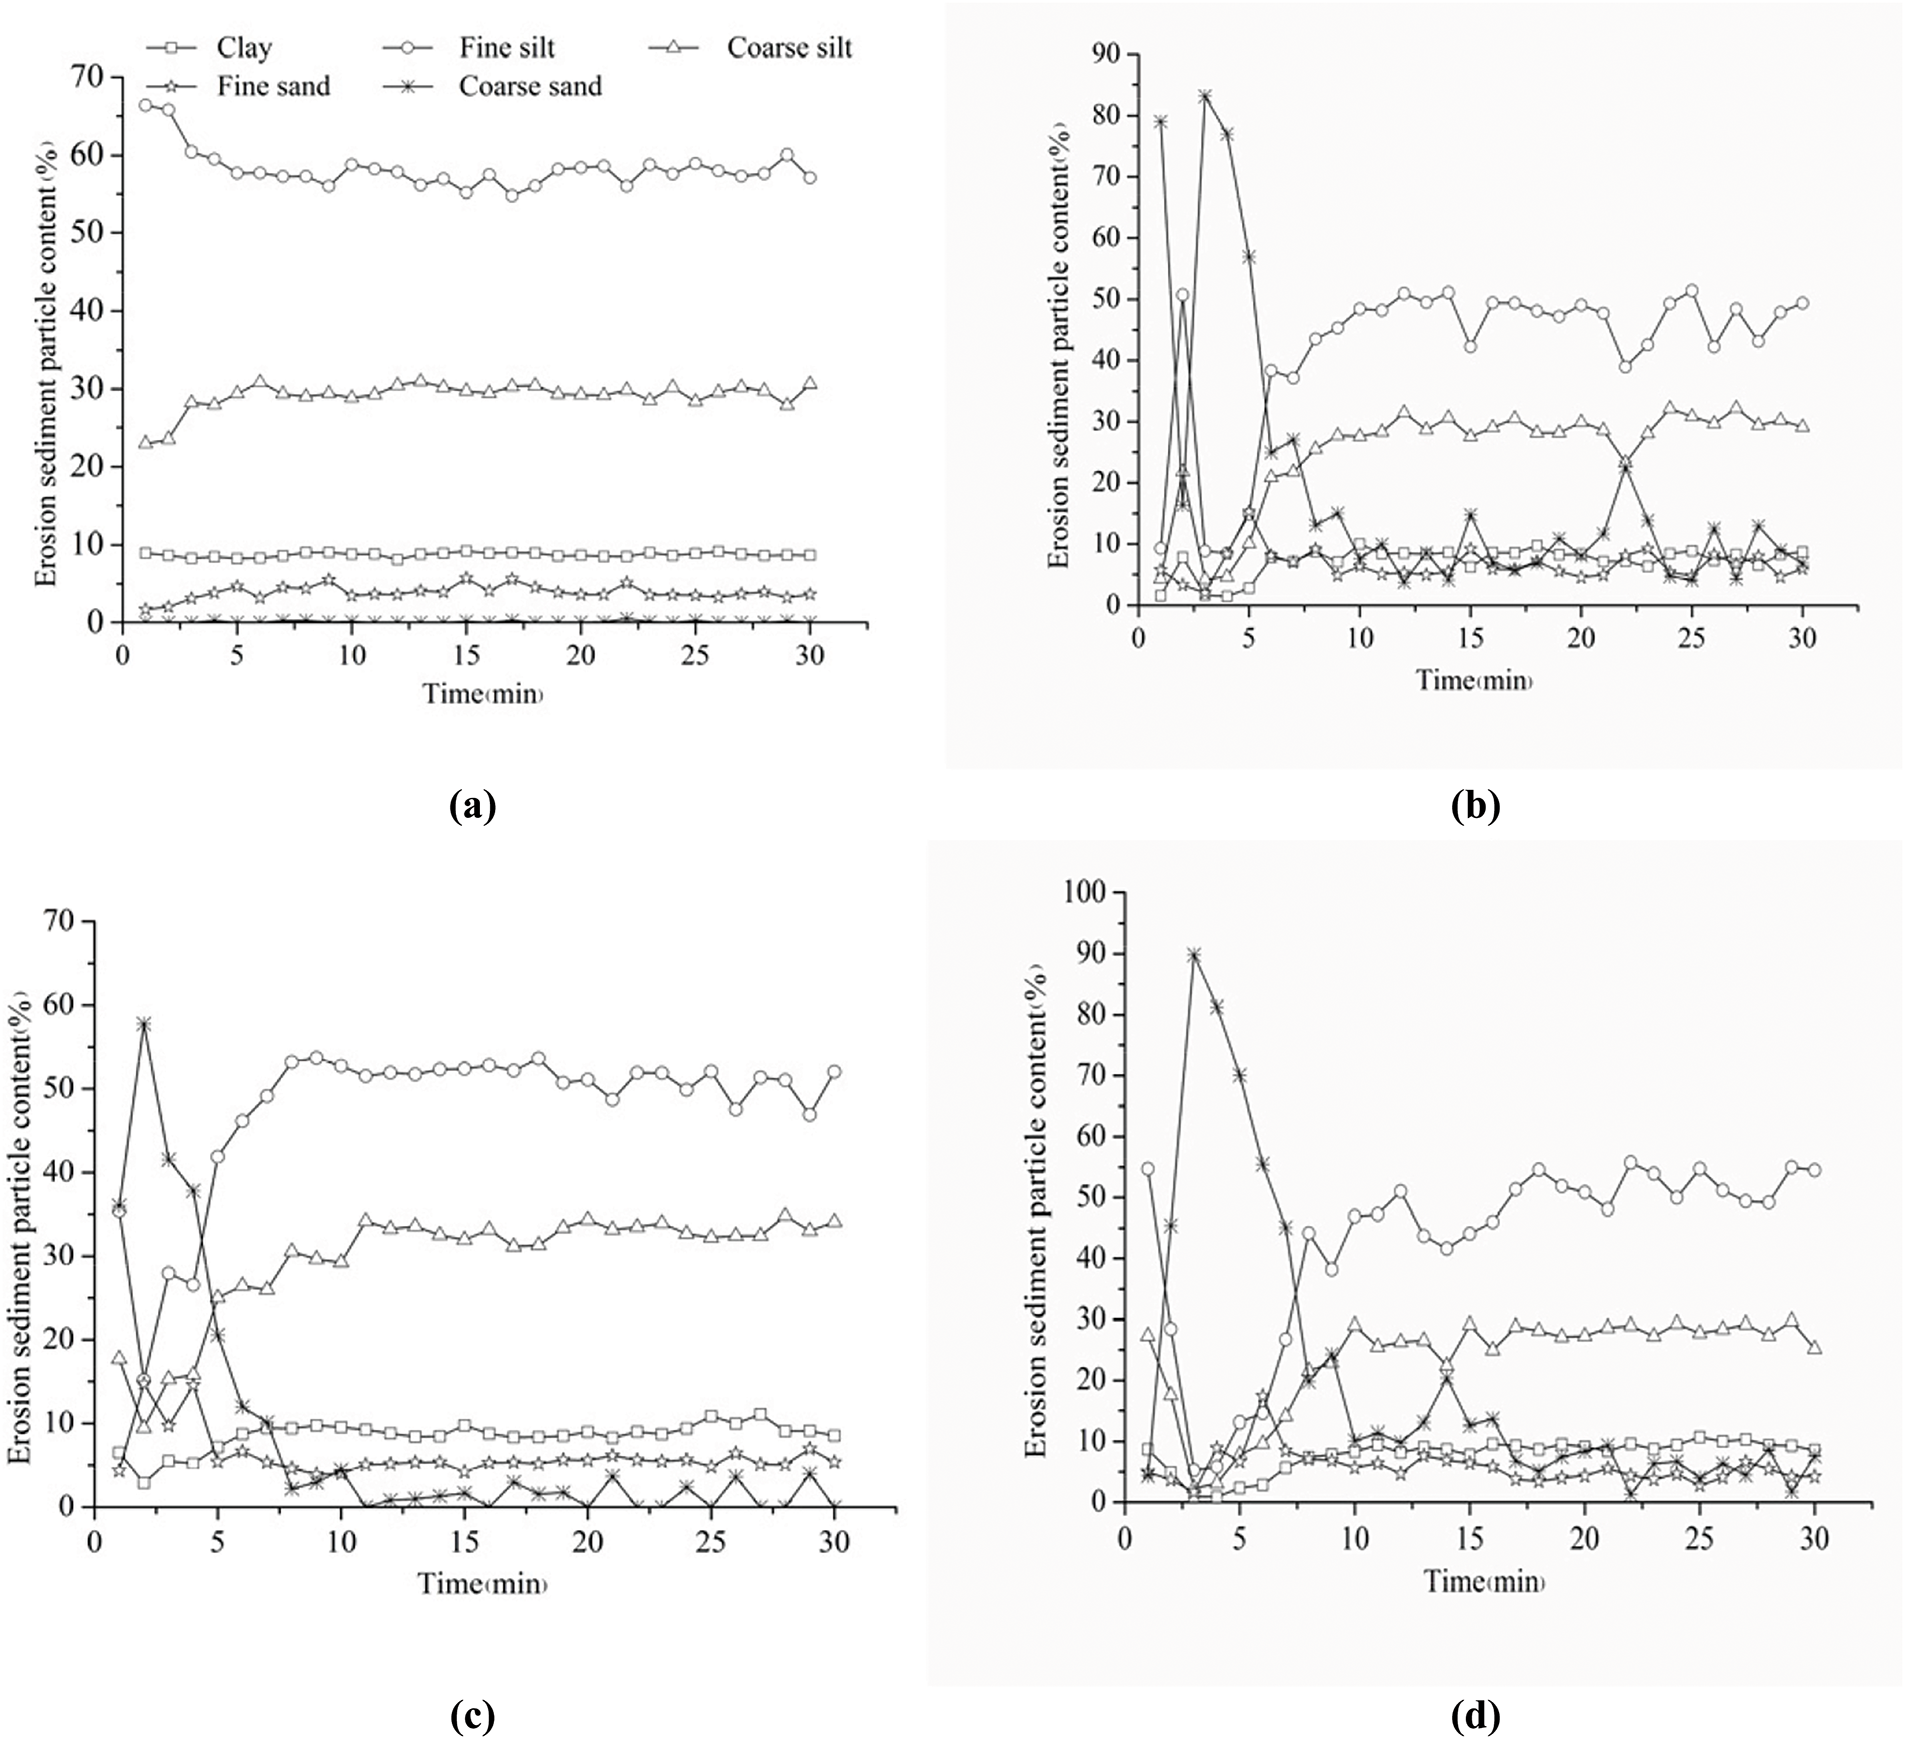
Figure 3: Variations of sediment particle contents over time for (a) BS1.5-0.0-0.0, (b) SS1.5-0.5-13, (c) SS1.5-1.0-13, and (d) SS1.5-1.5-13
Clay particle dimensions were associated with aggregate rearrangement and flocculation [22]. Loess’ sample contained 12.93% clay and 0.72% sand. The total content of 0.002 mm sediment fraction ranged from 0% to 12% (with the average value of 9% and typical range of 8%–10%). This indicated that a minor amount of clay was dispersed, with most of the clay being present in sediment as aggregates. The concentration of sediment fraction with size of smaller than 0.002 mm in runoff demonstrated the dynamics involved in aggregate disintegration and transportation under the effects of various forces [23]. The sediment fraction with the particle size of smaller than 0.002 mm presented consistent stability throughout the rainfall events in all treatments. This observation indicated no discernible increase in clay particle dispersion within sheet flow that eventually reached the rills during subsequent transport. This observation provided further evidence that soil dispersion within rills was not caused by the rills themselves, but rather by raindrops, which subsequently transported soil to the rills.
The sediment primarily consisted of silt particles ranging from 0.002 to 0.05 mm in size, accounting for 66% to 88% of the total sediment load (Fig. 3). Experiment results indicated a gradual decline in the proportion of silt, with a reduction of about 5%–10% over time. During SS tests, the proportion of fine sand exhibited minimal variations, remaining within a narrow range of 10%–20%. In all experiments, a notable temporal increase was observed in coarse sand amount, accompanied by significant variations with sand layer thickness during initial runoff phase. The variation coefficients of BS1.5-0.0-0.0, SS1.5-0.5-13, SS1.5-1.0-13, and SS1.5-1.5-13 samples were 122.79%, 86.39%, 76.33%, and 66.85%, respectively.
To describe erosion processes, the mass fractions of 10 size classes in outflow were presented for three distinct time intervals. The first interval was 0–5 min after runoff initiation and represented inter-rill erosion (Fig. 4a), the second interval was 6–10 min after runoff initiation and depicted rill erosion, and the third interval was 11–30 min after runoff initiation and signified a combination of rill and inter-rill erosion. In loess samples, the above mentioned 10 size classes exhibited identical mass fractions with uniform distributions at 10% in each size class. Therefore, silt particles with mass fractions exceeding 10% were deemed to be preferentially transported.
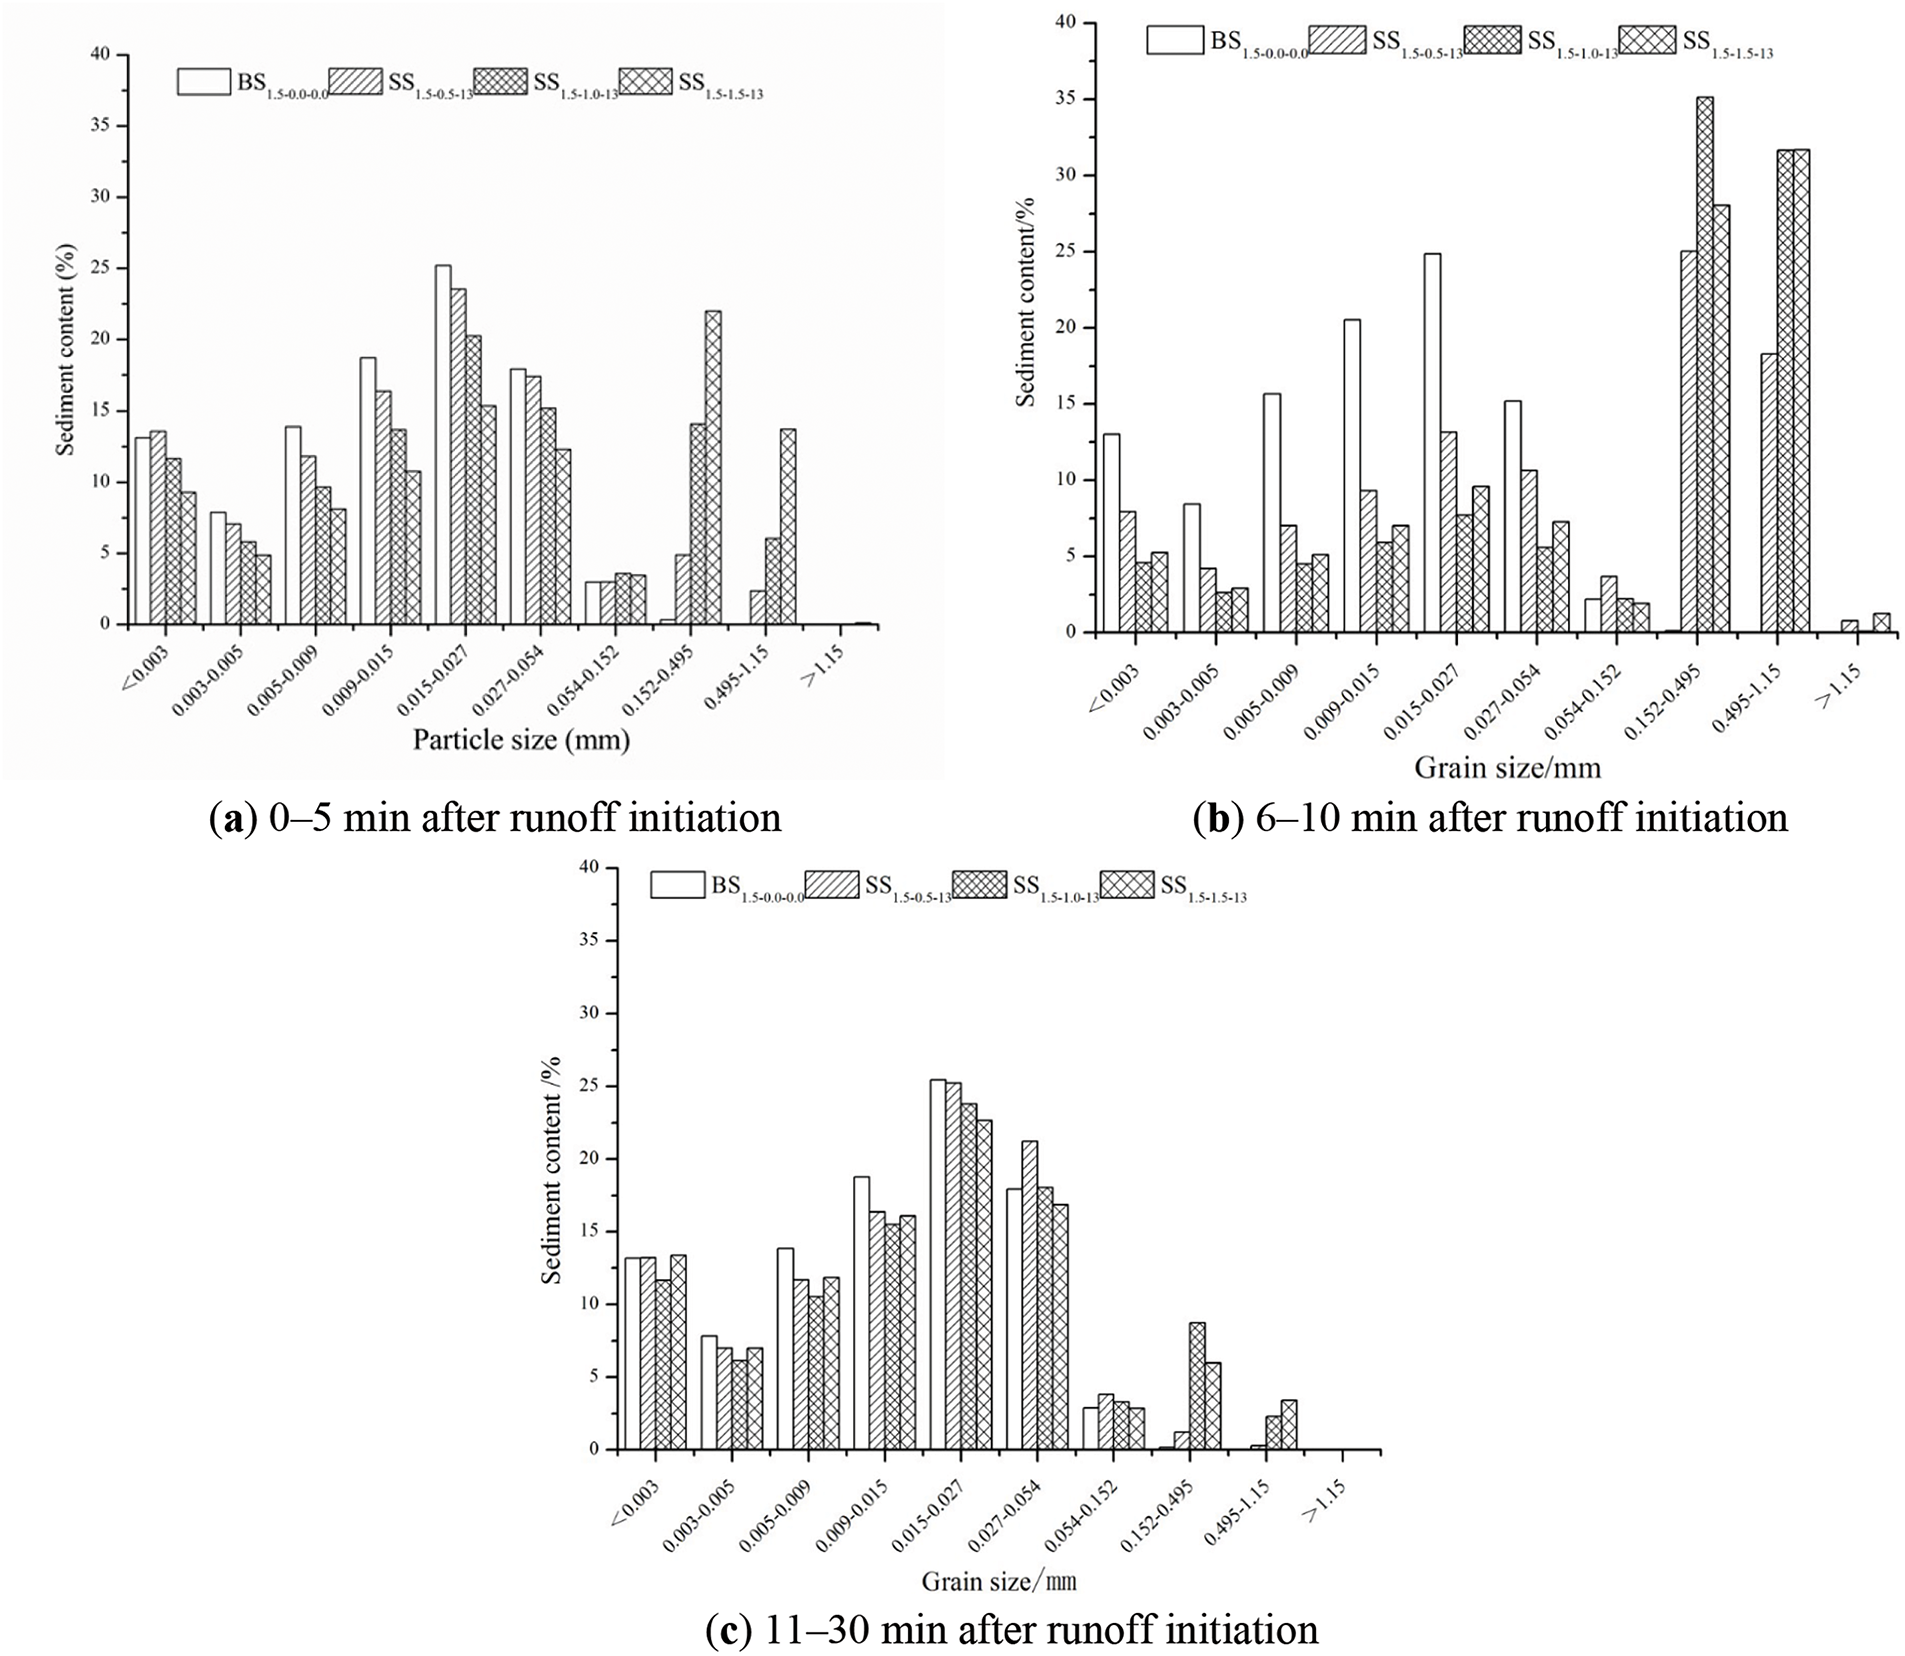
Figure 4: Distribution of eroded sediment particle size classes (a) 0–5, (b) 6–10, and (c) 11–30 min after runoff initiation
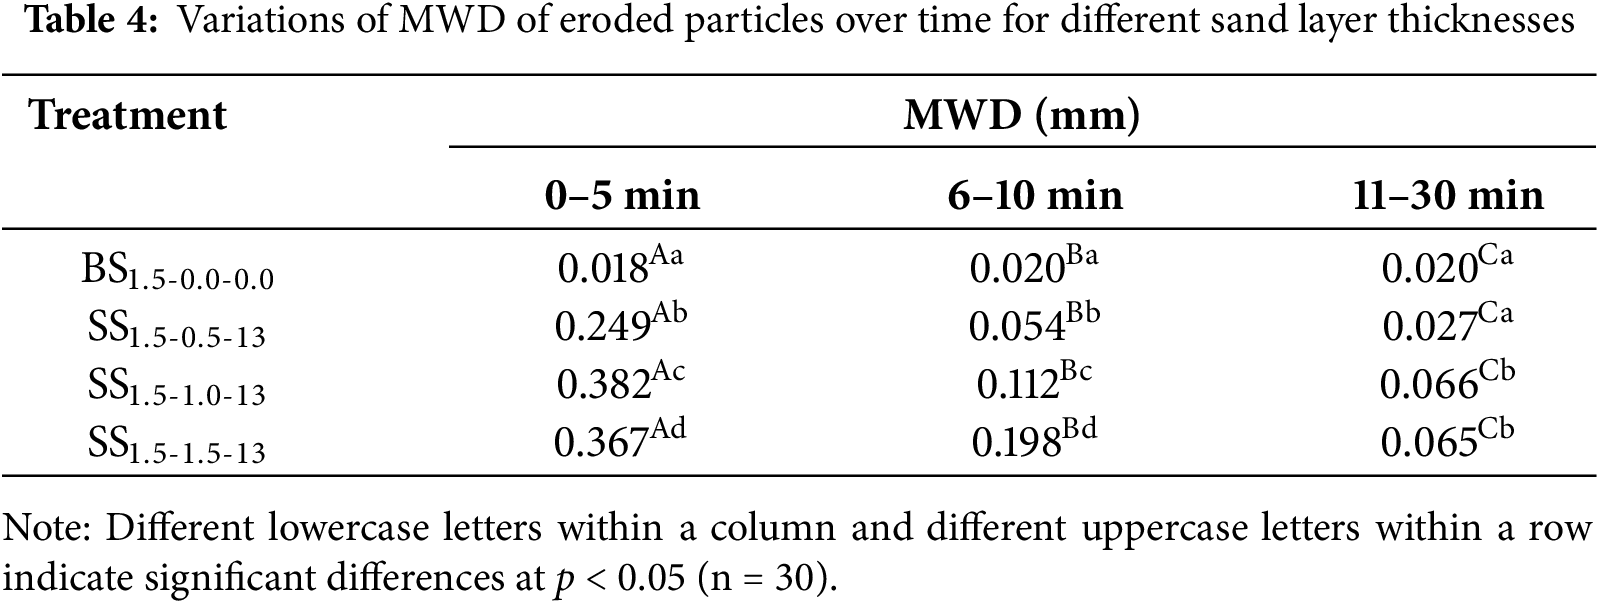
Sediment composition was characterized by the presence of particles with diameters of over 0.054 mm, accounting for 47% to 70% of the total sediment. However, particles smaller than 0.054 mm constituted less than 53% in various sand layer thicknesses during the initial rainfall period (0–5 min, Fig. 4a). At a 6–11 min interval, the total sediment loss was composed of particles measuring between 0.054 mm and 60%–90% for all sand layer thickness values. The proportion of particles belonging to size classes of greater than 0.054 mm accounted for less than 40% (Fig. 4b). Following rill development, the percentage of particles smaller than 0.054 mm in diameter was decreased to 48%–71%. The sediments exhibited a multi-modal particle size distribution, with minimum values of 0.003–0.005 mm and greater than 0.054 mm (Fig. 4c). Median weight diameter (MWD) of eroded sediment during distinct flow production periods exhibited notable variations (p < 0.05), with sediment particles becoming progressively finer along with fine gully formation (Fig. 4). Furthermore, MWD was increased concurrently by increasing overlying sand layer thickness during the periods of fine gully development (6–10 min) and alternating fine gully erosion and inter-fine gully erosion (11–30 min) (Table 4).
3.4 Sediment-Transport Mechanisms
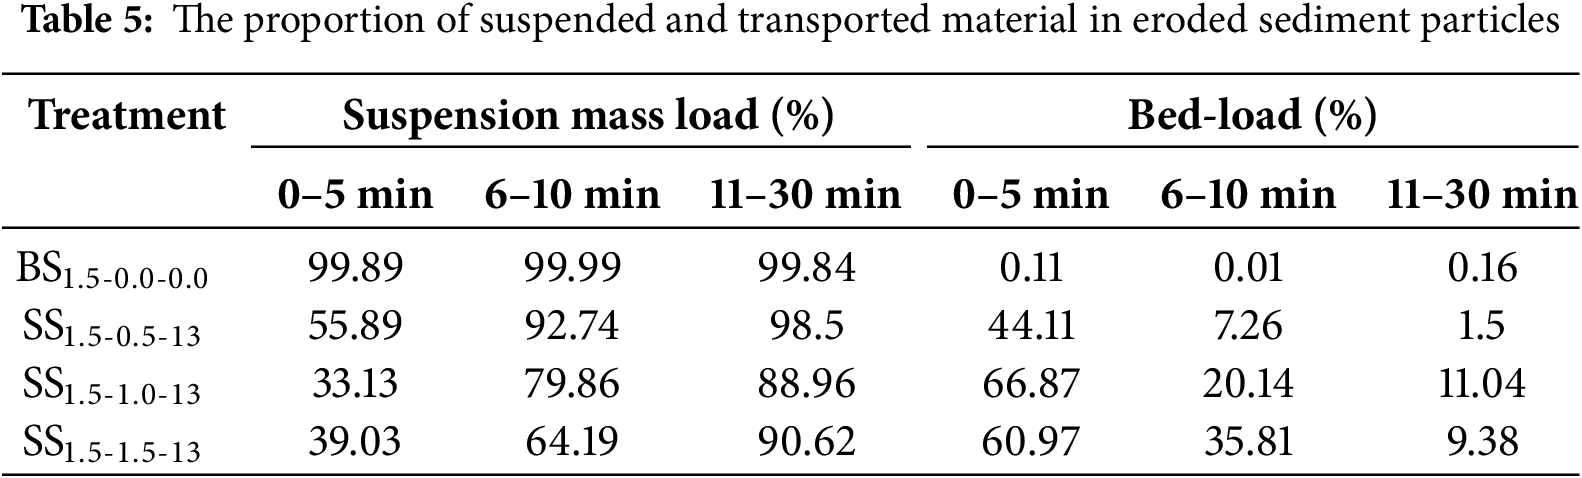
Research findings indicated that bed-load transportation was a strong supplementary particle transportation mechanism, ranging from 0.054 to 0.152 mm in size (Fig. 4).
The initial 5 min of inter-rill erosion revealed that over 40% of soil particles were transported via bed-load, indicating that sand cover on loess could change sediment transportation mechanisms (Table 5). However, during the subsequent 6–10 min of rill erosion, the suspended mass sorting mechanism was responsible for the transportation of over 60% of soil particles. Furthermore, during the combined rill and inter-rill erosion period (11–30 min) and specific rill erosion period (6–10 min), the suspended mass sorting process was responsible for transporting over 88% of the particles. Size fraction ratios related to rolling motion frequently exhibited fluctuations over a relatively short period of time, demonstrating that the erosion of coarse particles occurred in the initial 5 min (Fig. 3). However, most sediments observed at subsequent rainfall stages were fine particles. By increasing sand layer thickness, a notable escalation was observed in the importance of suspended mass sorting, accompanied by a decrease in the significance of bed-load transport. Hence, sediment particles exhibited a distinctive bimodal dispersion pattern.
Sediment particle size distribution might be affected by (a) particle size distribution of the original soil, (b) aggregate decomposition during erosion, and (c) settling velocities of different size classes of particles or aggregates [10,14,24–26]. Since the same soil was applied in all experiments, this did not necessarily explain particle size differences in the original soil. The main aggregate decomposition mechanisms during water erosion included sliding due to rapid wetting and mechanical decomposition under the effect of raindrops [9]. In all experiments, the soil bed was pre-saturated. Aggregate fragmentation due to raindrop impact could be the main factor affecting particle size distribution during experiments. Asadi et al. [2], Shi et al. [10], and Sirjani et al. [27] focused on the relationships of overland flow and transport mechanisms and showed that the relative contribution of SS to total sediment load was decreased with the increase of stream power. The milling process involved a more concentrated water flow, which could strip soil from depths of up to 10 cm, where raindrops had no direct effect on them. Many experimental results have shown that early sediments were enriched in finer particles during rainfall-driven erosion [28–30]. One erosion process theory has suggested that soil structure was not disrupted during rainfall-driven erosion and therefore, particle size distribution in steady state was the same as that in the original soil [31].
The nature of the particle composition of soil is a key factor affecting its resistance to erosion. Decrease of soil particle size resulted in stronger cohesion and therefore, soil formed a doughnut-shaped structural body increasing its impact resistance [32]. Dispersion resistance of wet soil layers was significantly increased with the increase of clay particle content. Soils with clay particle contents of above 30%–50% had greater cohesion and formed a stable soil agglomerate structure, which had greater resistance to splash erosion by raindrop impact [33] and was less likely to be dispersed and transported. When powder particle content of the soil was greater than 33%, the eroded sediment was also dominated by powder particles.
When the powder particle content of soil exceeded 33%, the majority of eroded sediment particles were also powder particles (20–35 μm in size). Particles with size range of 20–200 μm were easily eroded, whether in the form of single particles or agglomerates, and those with sizes of greater than 200 μm were not easily transported due to the limitation of their own gravity. Finally, particles with sizes of less than 20 μm were difficult to separate and transport due to large inter-particle binding forces [30]. It was seen that soil texture was the main factor affecting the size distribution of eroded particles. During the rainfall process, clay particle content was not changed with time, i.e., clay particle content was not changed much before and after the formation of fine furrows. The breaking of agglomerates mainly occurred among fine furrows where runoff depth was low and raindrops could penetrate thin water flow layers to break the agglomerates, therefore releasing sticky particles and increasing sticky particle content.
During water erosion, primary agglomerate fragmentation mechanisms were dissipation and mechanical fragmentation [9,34]. Since the soil was subjected to water saturation before rainfall, dissipative effect was negligible. Hence, the primary agglomerate fragmentation mechanism in this test was mechanical fragmentation caused by raindrop strikes and this was the main factor affecting the size distribution of eroded sediment particles. Sand layer enhanced surface roughness and friction, attenuating the impact of raindrop splash on erosion processes. However, sand grains exhibited low bonding strength and elevated disaggregation degrees, which intensified the erosion of inter-fine gullies [35,36]. After sand-covered, soil texture became coarser, slope permeability was increased, and infiltration ability of slope was enhanced. Therefore, a large amount of water before runoff production was stored, increasing runoff scouring ability [37,38] as well as the content of large particles in the eroded sediment (Figs. 4a and 5). Fine gully erosion stage was due to the fact that most of the sandy material on slope surface was washed away by runoff and as rainfall continued, slope surface gradually achieved a stable infiltration, the majority of rainfall became runoff, slope surface began to appear crust, friction was decreased, and raindrop splash effect was enhanced. At the same time, after the generation of fine gullies, the erosion power of fine gully flow was stronger [10,39], the ability of the surface to hold sand was enhanced, more fine particles could be held, and thus the fine particles in the eroded sediment were increased in the middle and late stages of rainfall (Figs. 4b,c and 5).
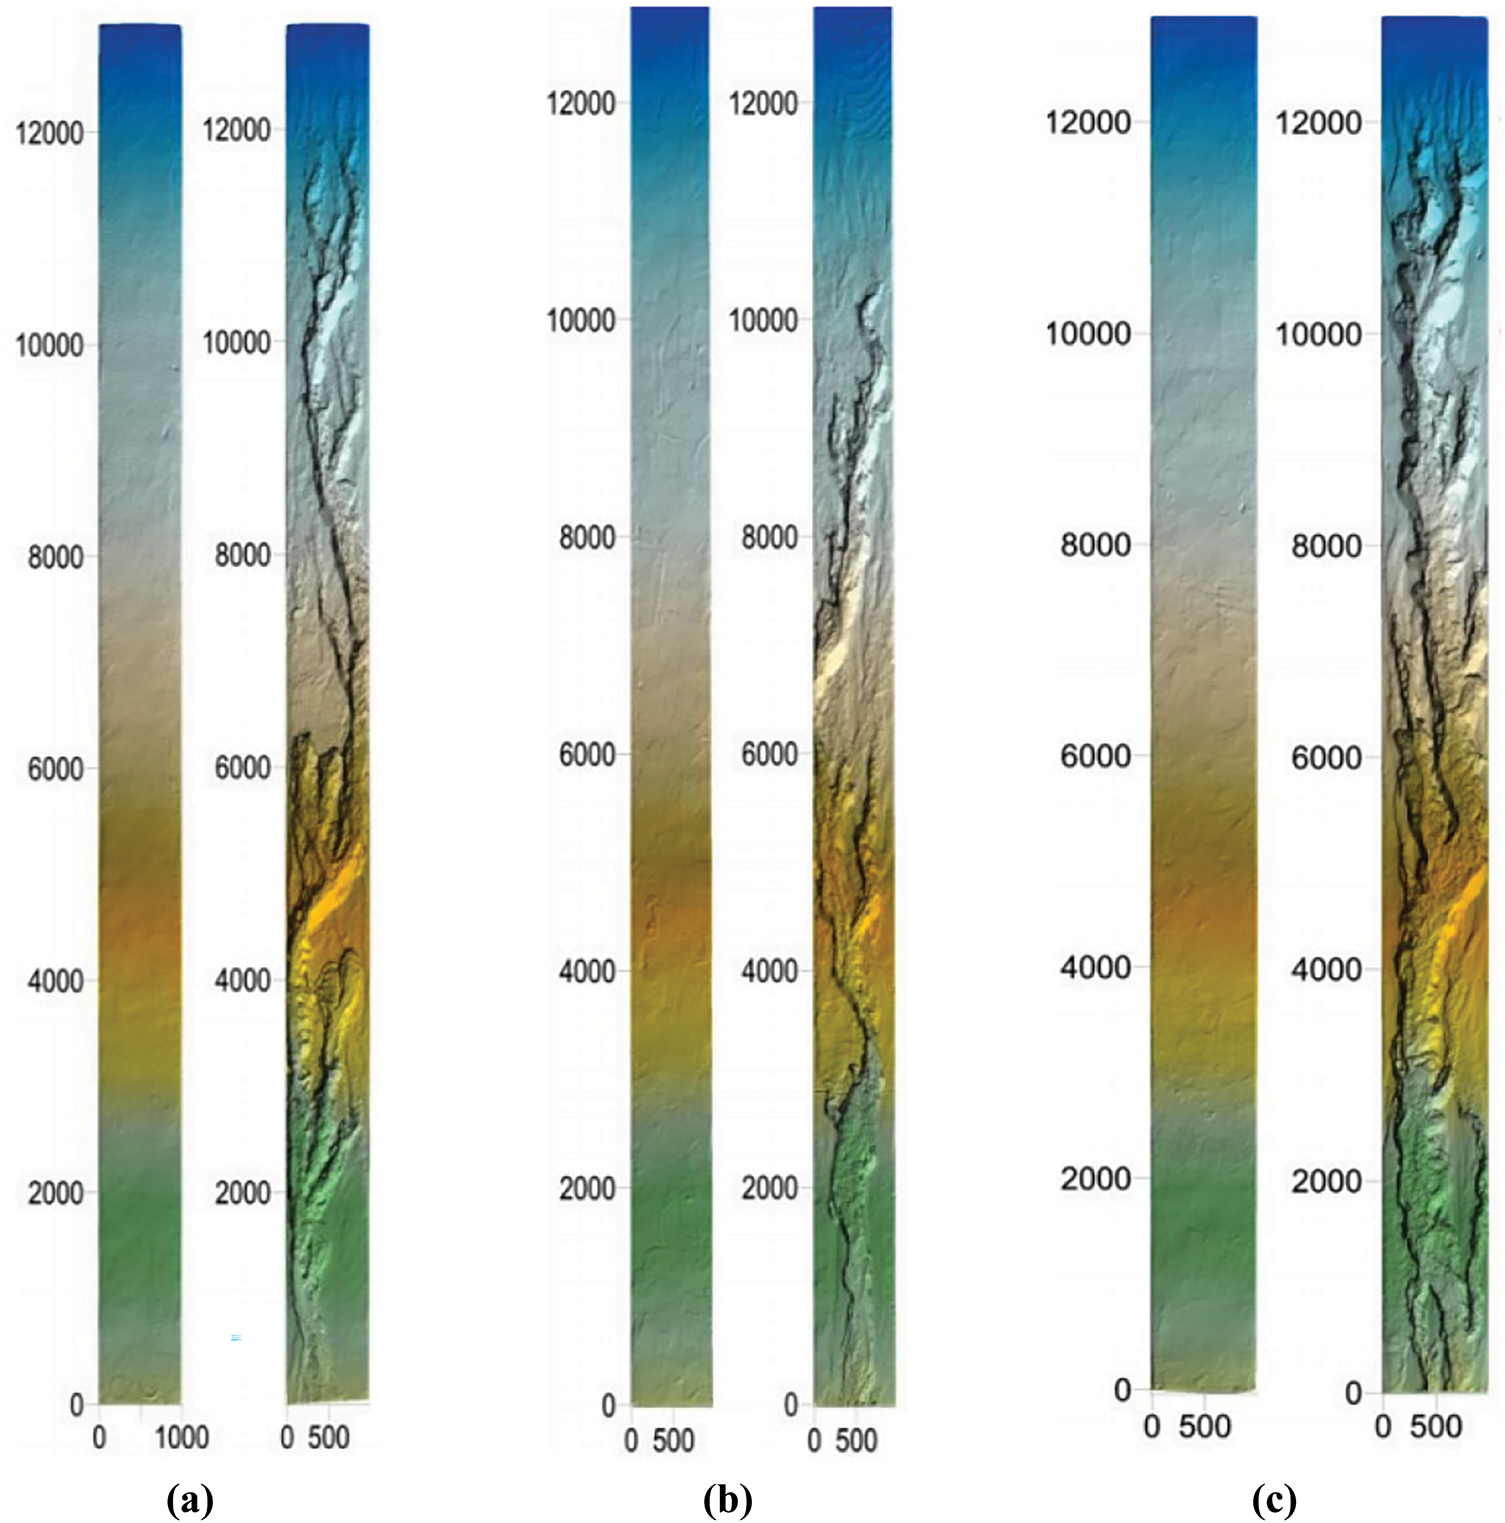
Figure 5: Variations of DEM of different sand-covered conditions under continuous rainfall. (a) SS1.5-0.5-13.0; (b) SS1.5-1.0-13.0; (c) SS1.5-1.5-13.0. Note: Horizontal and vertical coordinates are presented in terms of mm
The objective of this research was to analyze the particle-sorting characteristics of eroded sediments on sand-covered loess slopes with different sand layer thicknesses under indoor simulated rainfall conditions. Research findings revealed that the initiation of flow on sand-covered slopes was delayed by about 11 to 15 times compared to bare slopes. The sediment primarily consisted of silt particles with size ranges of 0.002 to 0.05 mm, which accounted for 66% to 88% of the total sediment load.
Sediment composition was characterized by the presence of particles with diameters exceeding 0.054 mm, accounting for 47% to 70% of the total sediment. Bed-load transportation mechanism was found to be a significant supplementary means of transportation for particles with diameters ranging from 0.054 and 0.152 mm. MWD was increased during the periods of fine gully development (6–10 min) and alternating fine gully erosion and inter-fine gully erosion (11–30 min), which coincided with the increase of the thickness of the overlying sand layer.
These findings contributed to our understanding of the fundamental mechanisms governing soil detachment and transportation during rainfall, as well as strategies for mitigating soil erosion. Classification of soil loss into its constituent elements is of vital importance for data interpretation and future predictions. Further investigations are required to quantify the effects of dynamic particle size distribution on soil erosion, considering different rainfall intensities and slope gradients.
Acknowledgement: Not applicable.
Funding Statement: This research was funded by multiple sources, including the Guangxi Natural Science Foundation of Youth Fund (2020GXNSFBA159004), the National Natural Science Foundation Project of China (51779204), and the Guilin University of Technology High-Level Talent Research Startup Project (GUTQDJJ2018069).
Author Contributions: Shanshan Tang: Experimentation, Writing—original draft, Methodology, Investigation, Formal analysis, Data curation. Zhanbin Li: Writing—review & editing, Funding acquisition, Conceptualization. Xubin Zhu: Experimentation, Formal analysis, Data curation. Peng Li: Writing—review & editing, Methodology. Zhaoyang Feng: Experimentation, Formal analysis, Data curation. Guoliang Yang: Experimentation, Formal analysis, Data curation. Huake Chang: Experimentation, Formal analysis, Data curation. Zefeng Che: Experimentation, Formal analysis, Data curation. All authors reviewed the results and approved the final version of the manuscript.
Availability of Data and Materials: Some or all data, models, or code that support the findings of this study are available from the corresponding author upon reasonable request (list items).
Ethics Approval: Not applicable.
Conflicts of Interest: The authors declare no conflicts of interest to report regarding the present study.
References
1. Luo M, Pan C, Cui Y, Wu Y, Liu C. Sediment particle selectivity and its response to overland flow hydraulics within grass strips. Hydrol Process. 2020;34(26):5528–42. doi:10.1002/hyp.13964. [Google Scholar] [CrossRef]
2. Asadi H, Moussavi A, Ghadiri H, Rose CW. Flow-driven soil erosion processes and the size selectivity of sediment. J Hydrol. 2011;406(1–2):73–81. doi:10.1016/j.jhydrol.2011.06.010. [Google Scholar] [CrossRef]
3. de Santana FB, Hall RL, Lowe V, Browne MA, Grunsky EC, Fitzsimons MM, et al. A systematic approach to predicting and mapping soil particle size distribution from unknown samples using large mid-infrared spectral libraries covering large-scale heterogeneous areas. Geoderma. 2023;434(5):116491. doi:10.1016/j.geoderma.2023.116491. [Google Scholar] [CrossRef]
4. Qi K, Al-Asadi K, Duan JG. Modeling runoff and sediment load using the HEC-HMS model in an arid watershed. J Hydrol Eng. 2024;29(3):05024005. doi:10.1061/JHYEFF.HEENG-6070. [Google Scholar] [CrossRef]
5. Andros C, Chappell M, Rowland W, Young C, Norris A, Kocar B. A new algorithmic approach for predicting the particle size distribution of dispersed soil suspensions using an automated optical settling column. Geoderma. 2024;441(4):116747. doi:10.1016/j.geoderma.2023.116747. [Google Scholar] [CrossRef]
6. Messing I, Mingot Soriano AM, Nimblad Svensson D, Barron J. Variability and compatibility in determining soil particle size distribution by sieving, sedimentation and laser diffraction methods. Soil Tillage Res. 2024;238(2):105987. doi:10.1016/j.still.2023.105987. [Google Scholar] [CrossRef]
7. Prokop P. Preliminary assessment of the suspended sediment dynamics in the Sikkim-Darjeeling Himalayan river. Int J Sediment Res. 2024;39(2):184–93. doi:10.1016/j.ijsrc.2023.08.005. [Google Scholar] [CrossRef]
8. Schaper JL, Cirpka OA, Lewandowski J, Zarfl C. Electrical conductivity fluctuations as a tracer to determine time-dependent transport characteristics in hyporheic sediments. J Hydrol. 2024;643(1):131914. doi:10.1016/j.jhydrol.2024.131914. [Google Scholar] [CrossRef]
9. Shi ZH, Yan FL, Li L, Li ZX, Cai CF. Interrill erosion from disturbed and undisturbed samples in relation to topsoil aggregate stability in red soils from subtropical China. CATENA. 2010;81(3):240–8. doi:10.1016/j.catena.2010.04.007. [Google Scholar] [CrossRef]
10. Shi ZH, Fang NF, Wu FZ, Wang L, Yue BJ, Wu GL. Soil erosion processes and sediment sorting associated with transport mechanisms on steep slopes. J Hydrol. 2012;454(754–758):123–30. doi:10.1016/j.jhydrol.2012.06.004. [Google Scholar] [CrossRef]
11. Wang L, Shi ZH, Wang J, Fang NF, Wu GL, Zhang HY. Rainfall kinetic energy controlling erosion processes and sediment sorting on steep hillslopes: a case study of clay loam soil from the Loess Plateau. China J Hydrol. 2014;512:168–76. doi:10.1016/j.jhydrol.2014.02.066. [Google Scholar] [CrossRef]
12. Donnelly JP, Hawkes AD, Lane P, MacDonald D, Shuman BN, Toomey MR, et al. Climate forcing of unprecedented intense-hurricane activity in the last 2000 years. Earth’s Future. 2015;3(2):49–65. doi:10.1002/2014EF000274. [Google Scholar] [CrossRef]
13. Zhang P, Yao W, Liu G, Xiao P, Sun W. Experimental study of sediment transport processes and size selectivity of eroded sediment on steep Pisha sandstone slopes. Geomorphology. 2020;363(1–2):107211. doi:10.1016/j.geomorph.2020.107211. [Google Scholar] [CrossRef]
14. Asadi H, Ghadiri H, Rose CW, Rouhipour H. Interrill soil erosion processes and their interaction on low slopes. Earth Surf Processes Landf. 2007;32(5):711–24. doi:10.1002/esp.1426. [Google Scholar] [CrossRef]
15. Wei H, Lundy L, Muthanna TM, Viklander M. Influence of seasonal activities and traffic conditions on the accumulation and particle size distribution of gully pot sediments. J Environ Manage. 2023;348:119336. doi:10.1016/j.jenvman.2023.119336. [Google Scholar] [PubMed] [CrossRef]
16. Berger C, Schulze M, Rieke-Zapp D, Schlunegger F. Rill development and soil erosion: a laboratory study of slope and rainfall intensity. Earth Surf Processes Landf. 2010;35(12):1456–67. doi:10.1002/esp.1989. [Google Scholar] [CrossRef]
17. Sun L, Wang C. Effects of the extreme rainfall events on particle size selectivity on the simulated Gobi surface using indoor rainfall experiments. Catena. 2023;220:106716. doi:10.1016/j.catena.2022.106716. [Google Scholar] [CrossRef]
18. Mina M, Rezaei M, Sameni A, Riksen MJPM, Ritsema C. Estimating the indices of soil erodibility to wind erosion using pedo-and spectro-transfer functions in calcareous soils. Geoderma. 2023;438(2/3):116612. doi:10.1016/j.geoderma.2023.116612. [Google Scholar] [CrossRef]
19. Zhang XJ. Roles of raindrop impact in detachment and transport processes of interrill soil erosion. Int Soil Water Conserv Res. 2023;11(4):592–601. doi:10.1016/j.iswcr.2022.11.001. [Google Scholar] [CrossRef]
20. Xu G, Tang S, Lu K, Li P, Li Z, Gao H, et al. Runoff and sediment yield under simulated rainfall on sand-covered slopes in a region subject to wind-water erosion. Environ Earth Sci. 2015;74(3):2523–30. doi:10.1007/s12665-015-4266-1. [Google Scholar] [CrossRef]
21. Zhang FB, Bai YJ, Xie LY, Yang MY, Li ZB, Wu XR. Runoff and soil loss characteristics on loess slopes covered with aeolian sand layers of different thicknesses under simulated rainfall. J Hydrol. 2017;549:244–51. doi:10.1016/j.jhydrol.2017.04.002. [Google Scholar] [CrossRef]
22. Qasim M, Park S, Kim JO. A model to determine the drag coefficient of aggregated nonspherical flocs in the ballasted flocculation. J Water Process Eng. 2021;44(2):102409. doi:10.1016/j.jwpe.2021.102409. [Google Scholar] [CrossRef]
23. Li T, Zhang W, Yang L, Guo S, Wang R. Differentiation of prokaryotic community composition in suspended sediment size-fractionation in a small loess watershed. CATENA. 2024;237:107806. doi:10.1016/j.catena.2024.107806. [Google Scholar] [CrossRef]
24. Liu X, Jia G, Yu X. Effects of the uncompounded layer and semi-decomposed layer of Quercus varia-bilis litter on the soil erosion process and the eroded sediment particle size distribution. Hydrol Processes. 2021;35(5):e14195. doi:10.1002/hyp.14195. [Google Scholar] [CrossRef]
25. Sekloka HGR, Yabi CP, Cloots R, Gibigaye M. Elaboration of a road material based on clayey soil and crushed sand. Fluid Dyn Mater Process. 2022;18(6):1595–605. doi:10.32604/fdmp.2022.022434. [Google Scholar] [CrossRef]
26. Koti J, Yabi CP, Gibigaye M, Millien A, Petit C. Analysis of lateritic soil reinforced with palm kernel shells for use as a sub-base layer for low-traffic roads. Fluid Dyn Mater Process. 2022;18(5):1469–82. doi:10.32604/fdmp.2022.021902. [Google Scholar] [CrossRef]
27. Sirjani E, Mahmoodabadi M, Cerdà A. Sediment transport mechanisms and selective removal of soil particles under unsteady-state conditions in a sheet erosion system. Int J Sediment Res. 2022;37(2):151–61. doi:10.1016/j.ijsrc.2021.09.006. [Google Scholar] [CrossRef]
28. Sun L, Zhou JL, Cai Q. Impacts of soil properties on flow velocity under rainfall events: evidence from soils across the Loess Plateau. CATENA. 2020;194:104704. doi:10.1016/j.catena.2020.104704. [Google Scholar] [CrossRef]
29. Kinnell PIA. Insights into the sediment transport processes operating in rain-impacted flows. CATENA. 2022;217(4):106452. doi:10.1016/j.catena.2022.106452. [Google Scholar] [CrossRef]
30. Kiani-Harchegani M, Sadeghi SH, Asadi H. Comparing grain size distribution of sediment and original soil under raindrop detachment and raindrop-induced and flow transport mechanism. Hydrol Sci J. 2018;63(2):312–23. doi:10.1080/02626667.2017.1414218. [Google Scholar] [CrossRef]
31. Li P, Zhang K, Wang J, Feng D. Response of interrill erosion to flow parameters of sand loess in regions with high and coarse sediment yields. J Hydrol. 2021;592(2):125786. doi:10.1016/j.jhydrol.2020.125786. [Google Scholar] [CrossRef]
32. Liu G, Dabney SM, Yoder DC, Wells RR, Vieira DAN. Modeling land management effects on the size distribution of eroded sediment. Soil Tillage Res. 2019;192(6):121–33. doi:10.1016/j.still.2019.04.012. [Google Scholar] [CrossRef]
33. Ran Q, Su D, Li P, He Z. Experimental study of the impact of rainfall characteristics on runoff generation and soil erosion. J Hydrol. 2012;424(2):99–111. doi:10.1016/j.jhydrol.2011.12.035. [Google Scholar] [CrossRef]
34. Assouline S, Ben-Hur M. Effects of rainfall intensity and slope gradient on the dynamics of interrill erosion during soil surface sealing. CATENA. 2006;66(3):211–20. doi:10.1016/j.catena.2006.02.005. [Google Scholar] [CrossRef]
35. Le Bissonnais Y. Aggregate stability and assessment of soil crustability and erodibility: I. Theory and methodology. Eur J Soil Sci. 2016;67(1):11–21. doi:10.1111/ejss.4_12311. [Google Scholar] [CrossRef]
36. Wu B, Li L, Xu L, Li X. Modelling sheet erosion on steep slopes of clay loess soil using a rainfall simulator. Biosyst Eng. 2022;216(2):1–12. doi:10.1016/j.biosystemseng.2022.01.017. [Google Scholar] [CrossRef]
37. Wu X, Wei Y, Wang J, Xia J, Cai C, Wei Z. Effects of soil type and rainfall intensity on sheet erosion processes and sediment characteristics along the climatic gradient in central-South China. Sci Total Environ. 2018;621(1):54–66. doi:10.1016/j.scitotenv.2017.11.202. [Google Scholar] [PubMed] [CrossRef]
38. Lv Y, Yang F, Wei ZA, Lu Q. Numerical analysis of the erosion mechanism inside the tube sockets of main steam thermometers in a coal-fired power plant. Fluid Dyn Mater Process. 2023;19(2):379–97. doi:10.32604/fdmp.2022.020373. [Google Scholar] [CrossRef]
39. Cao X, Xiong N, Li J, Xie Z, Zang X, Bian J. Experimental study on the erosion of pipelines under different load conditions. Fluid Dyn Mater Process. 2022;18(2):233–41. doi:10.32604/fdmp.2022.018505. [Google Scholar] [CrossRef]
Cite This Article
 Copyright © 2025 The Author(s). Published by Tech Science Press.
This work is licensed under a Creative Commons Attribution 4.0 International License , which permits unrestricted use, distribution, and reproduction in any medium, provided the original work is properly cited.
 Downloads
 Citation Tools