
 Submit a Paper
 Propose a Special lssue
 Open Access
ARTICLE

Relevant Fluid Dynamics Aspects of the Internal Ballistics in a Small-Scale Hybrid Thruster
1 Department of Industrial Engineering, University of Naples Federico II, Piazzale Tecchio, 80, Naples, 80125, Italy
2 Cosmology, Space Science & Space Technology, Scuola Superiore Meridionale, Via Mezzocannone, 4, Naples, 80134, Italy
3 Sezione di Napoli, Istituto Nazionale di Fisica Nucleare, Via Cintia, Naples, 80126, Italy
* Corresponding Author: Riccardo Guida. Email:
(This article belongs to the Special Issue: High-speed, High-enthalpy and Reacting Flows and Related Material Science)
Fluid Dynamics & Materials Processing 2025, 21(6), 1299-1337. https://doi.org/10.32604/fdmp.2025.065605
Received 18 March 2025; Accepted 21 May 2025; Issue published 30 June 2025
 View Full Text
 Download PDF
Abstract
Robust numerical tools are essential for enabling the use of hybrid rocket engines (HREs) in future space applications. In this context, Computational Fluid Dynamics (CFD) transient simulations can be employed to analyse and predict relevant fluid dynamics phenomena within the thrust chamber of small-scale HREs. This work applies such techniques to investigate two unexpected behaviours observed in a 10 N-class hydrogen peroxide-based hybrid thruster: an uneven regression rate during High-Density Polyethylene (HDPE) and Acrylonitrile Butadiene Styrene (ABS) fuel tests, and non-negligible axial consumption in the ABS test case. The present study seeks to identify their fluid-dynamic origins by analysing key aspects of the thruster’s internal ballistics. The impact of recirculation zones and mixing on regression rates is quantified, as is the effect of grain heating on performance. Although already known in the present scientific literature, these phenomena prove to become particularly relevant for small-scale engines. Furthermore, the study demonstrates how appropriate numerical tools can replicate experimental findings, helping to foresee and mitigate undesirable behaviours in the design phases of future HRE propulsion systems. CFD results match the final HDPE grain geometry, reproducing the uneven port diameters with a maximum error below 9%. For ABS, axial regression is accurately captured, confirming the model’s reliability. Furthermore, average regression rates differ by only 1.60% and 1.20% for HDPE and ABS, respectively, while mass consumption is reproduced within 1.70% for HDPE and 3.01% for ABS. Overall, the results of the work demonstrate the reliability of the numerical approach adopted. This enriches the analysis capabilities devoted to 10 N-class engines, provides an additional tool for simulating the internal ballistics of small-scale hybrid thrusters, and integrates the existing literature with new insights into their fluid dynamics.Keywords
Supplementary Material
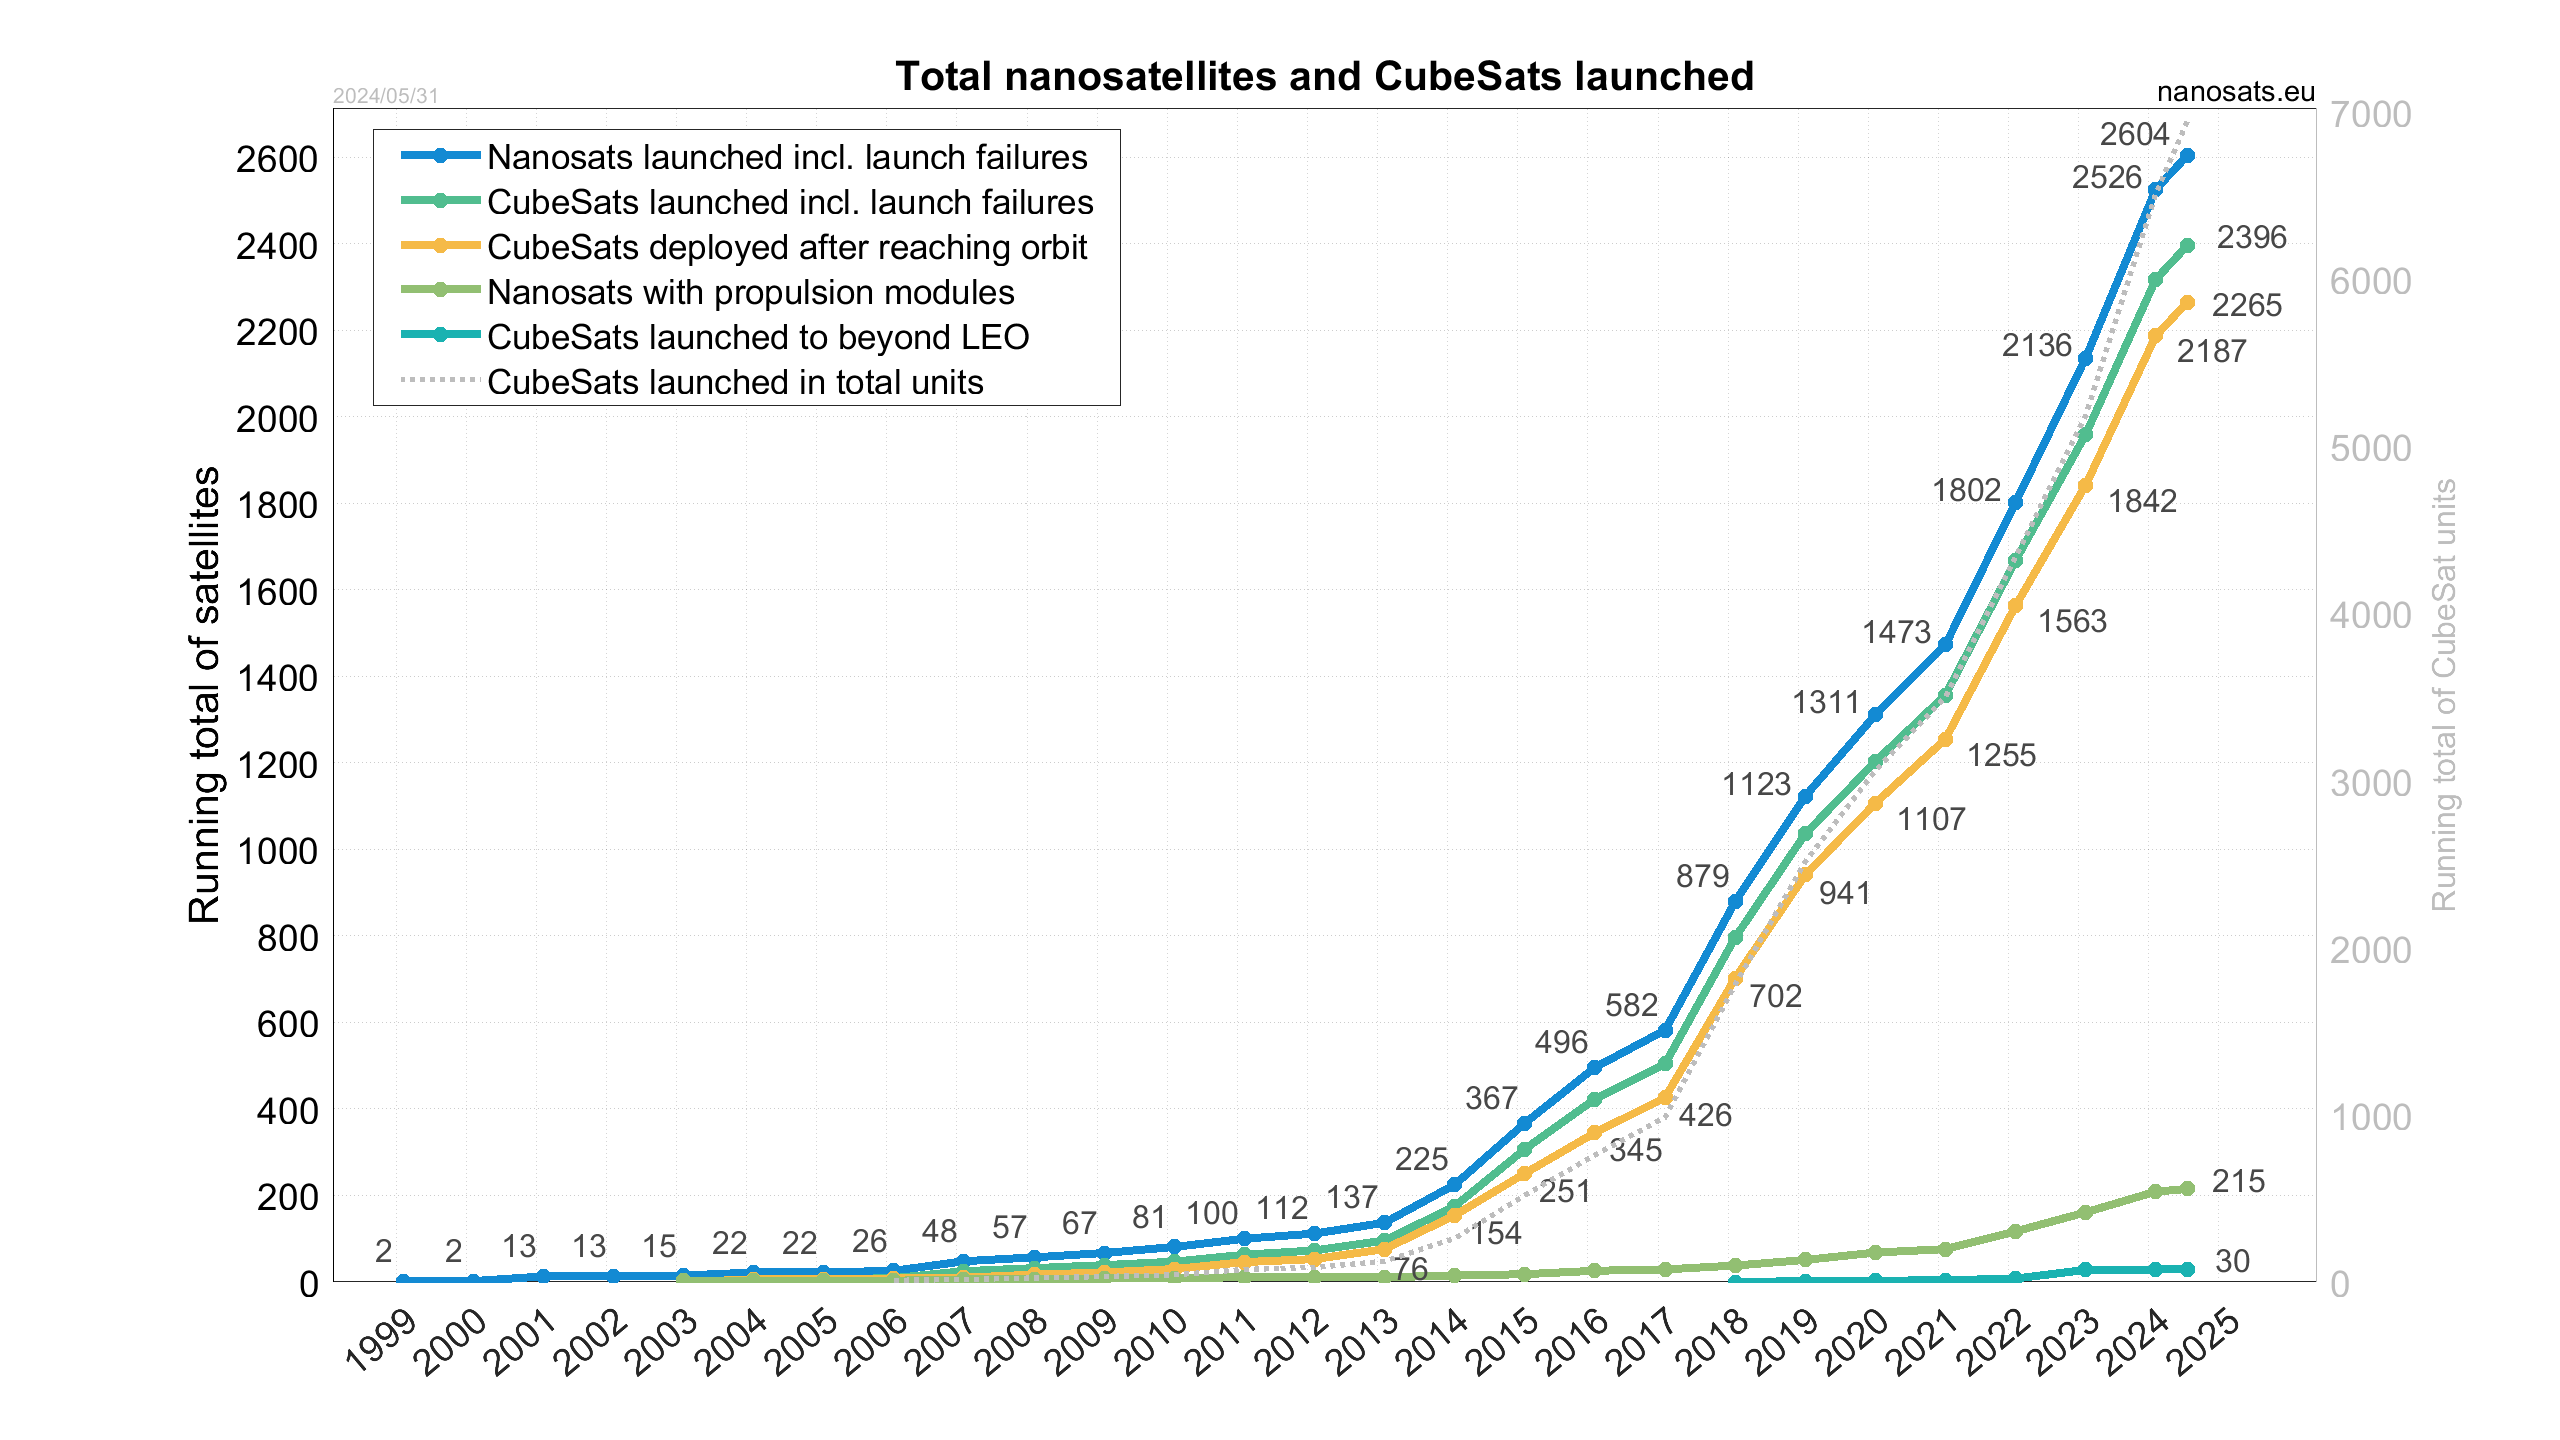
Supplementary Material FileThe space sector has undergone significant transformations since the beginning of its history, largely due to the continuous advancement of technology and scientific knowledge. In the past two decades, small satellites and nanosatellites have gained an increasingly significant role in this domain, with market shares rising to an estimated 2.1 billion $ by 2021 [1]. A considerable percentage of these spacecraft is constituted by CubeSat platforms, a standard that was developed in 1999 by researchers at California Polytechnic State University and Stanford [2]. The basic element is the CubeSat unit (namely 1U), which is defined as a 10 cm square cube [3]. These platforms may comprise a single unit or a combination of standard units, resulting in different form factors (3U, 6U, 12U, for instance). CubeSats were initially conceived by academic institutions for educational purposes, with the potential for scientific and commercial applications being quite limited at that stage [4]. However, the subsequent development of miniaturized payloads, coupled with significant technical advances, has resulted in a considerable expansion of their scope [5]. In this context, the mission scope has significantly enlarged, modifying the mission requirements at both system and subsystem levels. The development of innovative technologies to meet these renewed needs has been prompted, requiring notable modifications such as the introduction of propulsion systems. Until May 2024, more than 200 nanosatellites have been equipped with thrusters to enable maneuvering capabilities [5]. This share, which to date represents about 10% of the total 2604 nanosat launch attempts, marks an emerging trend in the space community.
Among numerous available technologies, the research group in Aerothermochemistry, Microgravity and Space Propulsion at the University of Naples Federico II has focused its work on the development, design, and testing of monopropellant and hybrid propellant thrusters of different scales. These classes of chemical engines were selected for nanosatellite applications because they combine the main advantages of solid and liquid propulsion systems [6]. They are able to provide thrust in the order of tens of Newtons with low power consumption, enabling orbital maneuvering, formation reconfiguration, and de-orbit capabilities. Limited geometrical envelope and low system complexity ensure that the stringent mass and volumetric requirements typical of CubeSat platforms are met. Moreover, hybrid propellant thrusters are characterized by re-ignition and thrust regulation capabilities. These features, typical of liquid propellant rocket engines [7], are crucial to broaden the range of mission profiles that may be achieved through hybrid rocket engines. Another main advantage is represented by the intrinsic safety guaranteed by this technology since the liquid (or gaseous) oxidizer cannot accidentally encounter the solid fuel grain. Moreover, hybrid rocket thrusters enable the employment of environmentally friendly and non-toxic propellants such as hydrogen peroxide, standing as a viable alternative to hydrazine-based systems, currently in phase-out for future space missions. A major disadvantage lies in their low technology level, with a Technology Readiness Level (TRL) of 6 for small-scale systems [8]. Furthermore, system scalability is typically complex, and an accurate performance prediction is more challenging compared to solid and liquid thrusters, for which a broader literature is available. The lower specific impulse values with respect to electric or chemical liquid propellant systems require a careful selection of propellant pairs to be used. In addition, lower average regression rates with respect to comparable solid rocket motors [9,10] imply reduced thrust levels.
This work aims to address some of the aforementioned issues by investigating typical aspects of small-scale hybrid propulsion to improve understanding and facilitate future operational use. The present study complements various previously published works. Rampazzo and Barato [11] have addressed numerical methodologies for the simulation of the regression rate under varying heat fluxes. An in-depth analysis of the CFD assessment of HDPE firing test performed with a 1 kN-class hybrid rocket is performed by Bianchi et al. in [12]. Tian et al. [13] have presented an extensive discussion of injection pattern effects in hybrid engines [13]. Meng et al. [14] have discussed a three-dimensional numerical model based on dynamic mesh techniques. In all cited cases, the discussions and analyses concern larger-scale engines than the one of interest, with thrusts from 1 kN upwards. The present work aims to supplement the pre-existing literature with information on a smaller scale, which is necessary given the difficulties of scalability for hybrid rocket thrusters. Numerous studies carried out by the authors have demonstrated a higher regression rate in comparison with larger engines using comparable propellant pairs [15,16] and a greater impact of the thermal characteristics on the fluid-dynamic behavior of the thruster [17]. These analyses are crucial for a complete understanding of small-scale hybrid thruster internal ballistics since scarce data are currently available for this class of engine. The limited information available in the literature, coupled with the difficulties of scaling down the inferred relations and phenomena analyzed for larger thrusters, requires a dedicated study for smaller hybrid rocket engines. Specifically, the present study proposes an experimental characterization and numerical assessment of a hydrogen peroxide-based hybrid micro-thruster employing a polymeric fuel grain. This work is focused on the numerical investigation of two peculiar behaviors recorded during an experimental campaign. Exploiting transient Computational Fluid Dynamics (CFD) simulations, the objective is to properly reproduce these experimental findings through the numerical model employed. A proper matching between empirical and numerical data could enhance the reliability of the results deduced from CFD analyses, increasing reconstruction capabilities. Furthermore, a solid numerical method could be exploited to thoroughly investigate fluid dynamic phenomena determining thruster performance. Section 1 has described the general context in which the engine was developed, summarizing the state of the art and the challenges to be faced. Section 2 will discuss the experimental setup, the engine configuration, and its design process. An overview of the experimental data post-processing technique and the numerical models employed will be reported in Section 3. In addition to this, computational grid information and convergence analysis will be provided. In Section 4, experimental results of the HDPE and ABS-like firing test will be discussed, in combination with a brief assessment of the thrust chamber thermal behavior. Section 5 will present the main results of the extensive numerical analyses performed, while conclusions of the work will be presented in Section 6.
2 Laboratory Setup, Engine Design and Configuration
The experimental data used for the present study were collected during a firing test campaign conducted exploiting dedicated experimental facilities equipped with an instrumented test bench. The empirical investigation of small-scale monopropellant and hybrid thrusters employs a dedicated hydrogen peroxide feed line, shown in Fig. 1. The 87.5% concentrated H2O2 (namely High-Test Peroxide, HTP) is stored in a 2 L stainless steel tank and pressurised with nitrogen gas. N2 pressure is controlled through a regulator to attain the required values. A manual shut-off valve is placed on the oxidizer feed line for safety. Downstream, a Bronkhorst Cori-Flow M45 flow meter is used to perform both mass flow-regulated and pressure-regulated tests. For this work, the instrument is employed exclusively to measure the mass flow rate of hydrogen peroxide, with an accuracy of 0.2% on the estimated values, as per catalogue [18]. The last element on the feed line is a Parker Miniature Calibrant Valve Series 9 solenoid valve, which controls the oxidizer flow to the thruster injector. It is electronically controlled, and it can be used to operate the engine in pulsed or continuous mode, as studied in [19]. Hybrid and monopropellant thrusters are tested on an instrumented test bench, which allows temperature, pressure and thrust measurements to be recorded by means of dedicated sensors installed on the engine. Table 1 summarises the sensors used during the experimental campaign. Their location will be specified in the following section, where the thruster design is discussed. The signals are routed via a National Instruments PXI 1082e acquisition system to the control computer, where they are managed and stored.
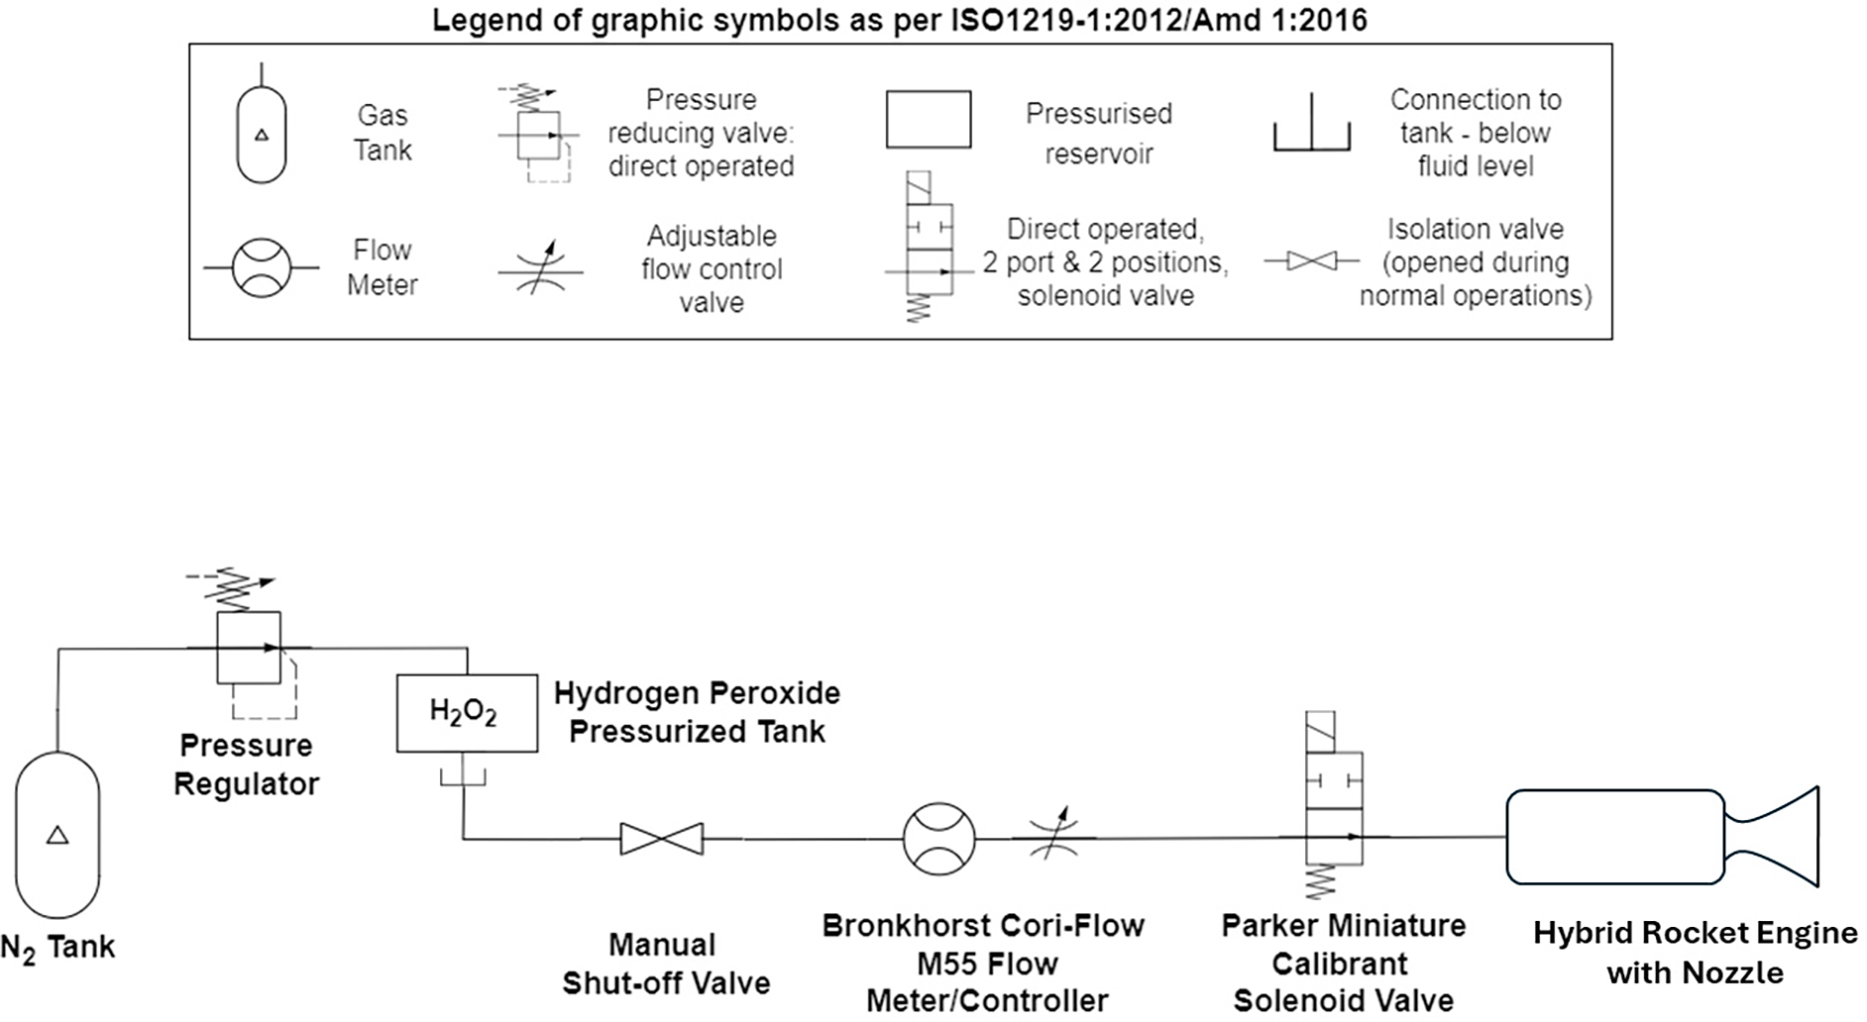
Figure 1: Hydrogen peroxide feed line. The graphic symbols adopted are in accordance with International Standard Organisation ISO 1219-1:2012/Amd 1:2016 [20]
The hybrid propellant rocket engine studied in this work is schematically represented in Fig. 2. Detailed technical drawings are reported in the Supplementary Materials to provide precise information regarding the technical specifications and geometrical dimensions of the elements constituting the tested assembly. The thruster is connected to the hydrogen peroxide feed line through a dedicated channel of the support flange, which also acts as the mechanical interface with the test bench (Fig. S1). The liquid injection plate (Fig. S2) delivers the oxidiser through three 0.3 mm diameter holes into the decomposition chamber. It consists of a 44 mm long cylinder, with an inner diameter of 20 mm. All the relevant dimensions are reported in Fig. S3. The inner volume is filled with inert alumina pellets mixed with a disposable catalyst. It consists of a MnOx-based powder that is interposed between two layers of porous pellets, which mainly serve a structural function by holding the compound in place. The decomposition process is monitored through a pressure sensor and a thermocouple situated at a distance of 13 mm from the inlet in the axial direction. The thermocouple is placed at a radial distance of 2 mm from the periphery of the internal wall. The technical specifications of the sensors, as well as the instruments in the combustion chamber, can be found in Table 1. A drilled retaining plate (Fig. S4) serves as a physical barrier to avoid accidental occlusion of the 2 mm throat convergent nozzle. Hydrogen peroxide decomposition follows the reaction scheme reported in Eq. (1). It is triggered by the combined action of two mechanisms: chemical interaction with catalysts and to a minor degree thermal decomposition due to the high temperatures reached in the chamber [21]. Using disposable MnOx-based powder drastically increases the reactivity of the system and ensures high decomposition efficiency, as detailed below. This allowed hybrid tests to be carried out without requiring pre-heating stages, reducing the fuel grain heating prior to ignition [16]. To assess decomposition performance, a monopropellant version of the thruster under investigation (i.e., a configuration of the same engine without the combustion chamber) was tested before the hybrid rocket experimental campaign. Fig. 3 displays pressure and temperature measurements acquired in the catalytic chamber during a 14 s long monopropellant firing test. The oxidizer mass flow rate was set to 5 g/s. The temperature profile over time shows that the catalytic system employed was able to guarantee the satisfying decomposition of hydrogen peroxide in a short amount of time. The maximum recorded temperature of approximately 945 K corresponds almost exactly with the 959.65 K value, which is representative of the adiabatic decomposition temperature for 87.5 wt% H2O2 [22]. In addition to this, an estimation of the decomposition efficiency was derived from the pressure data by comparing the theoretical characteristic velocity with the experimental one, obtaining a value of around 92%. The decomposition performance reported above were also found to be representative of the subsequent hybrid tests studied in this work.
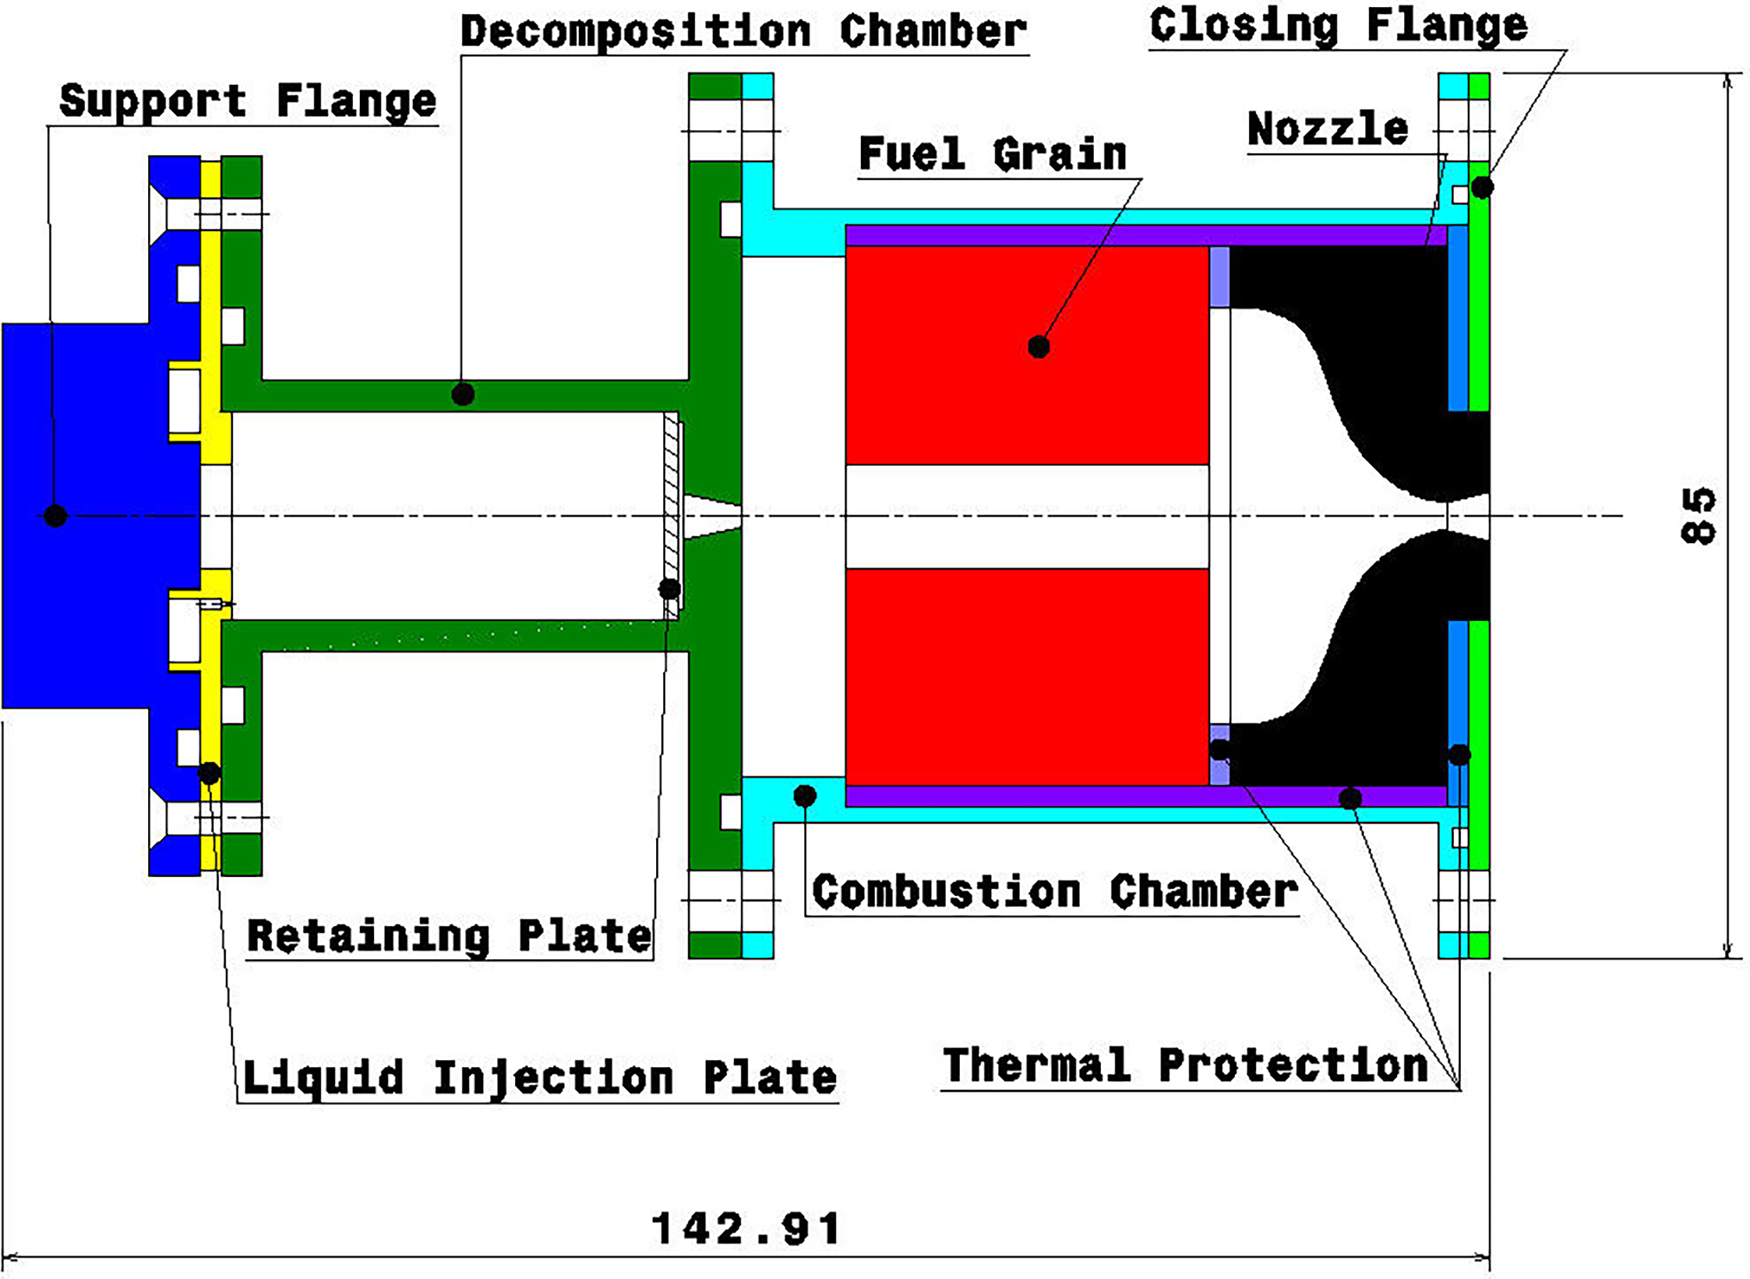
Figure 2: Cross section of the small-scale hybrid propellants rocket engine. Overall dimensions are reported in [mm]
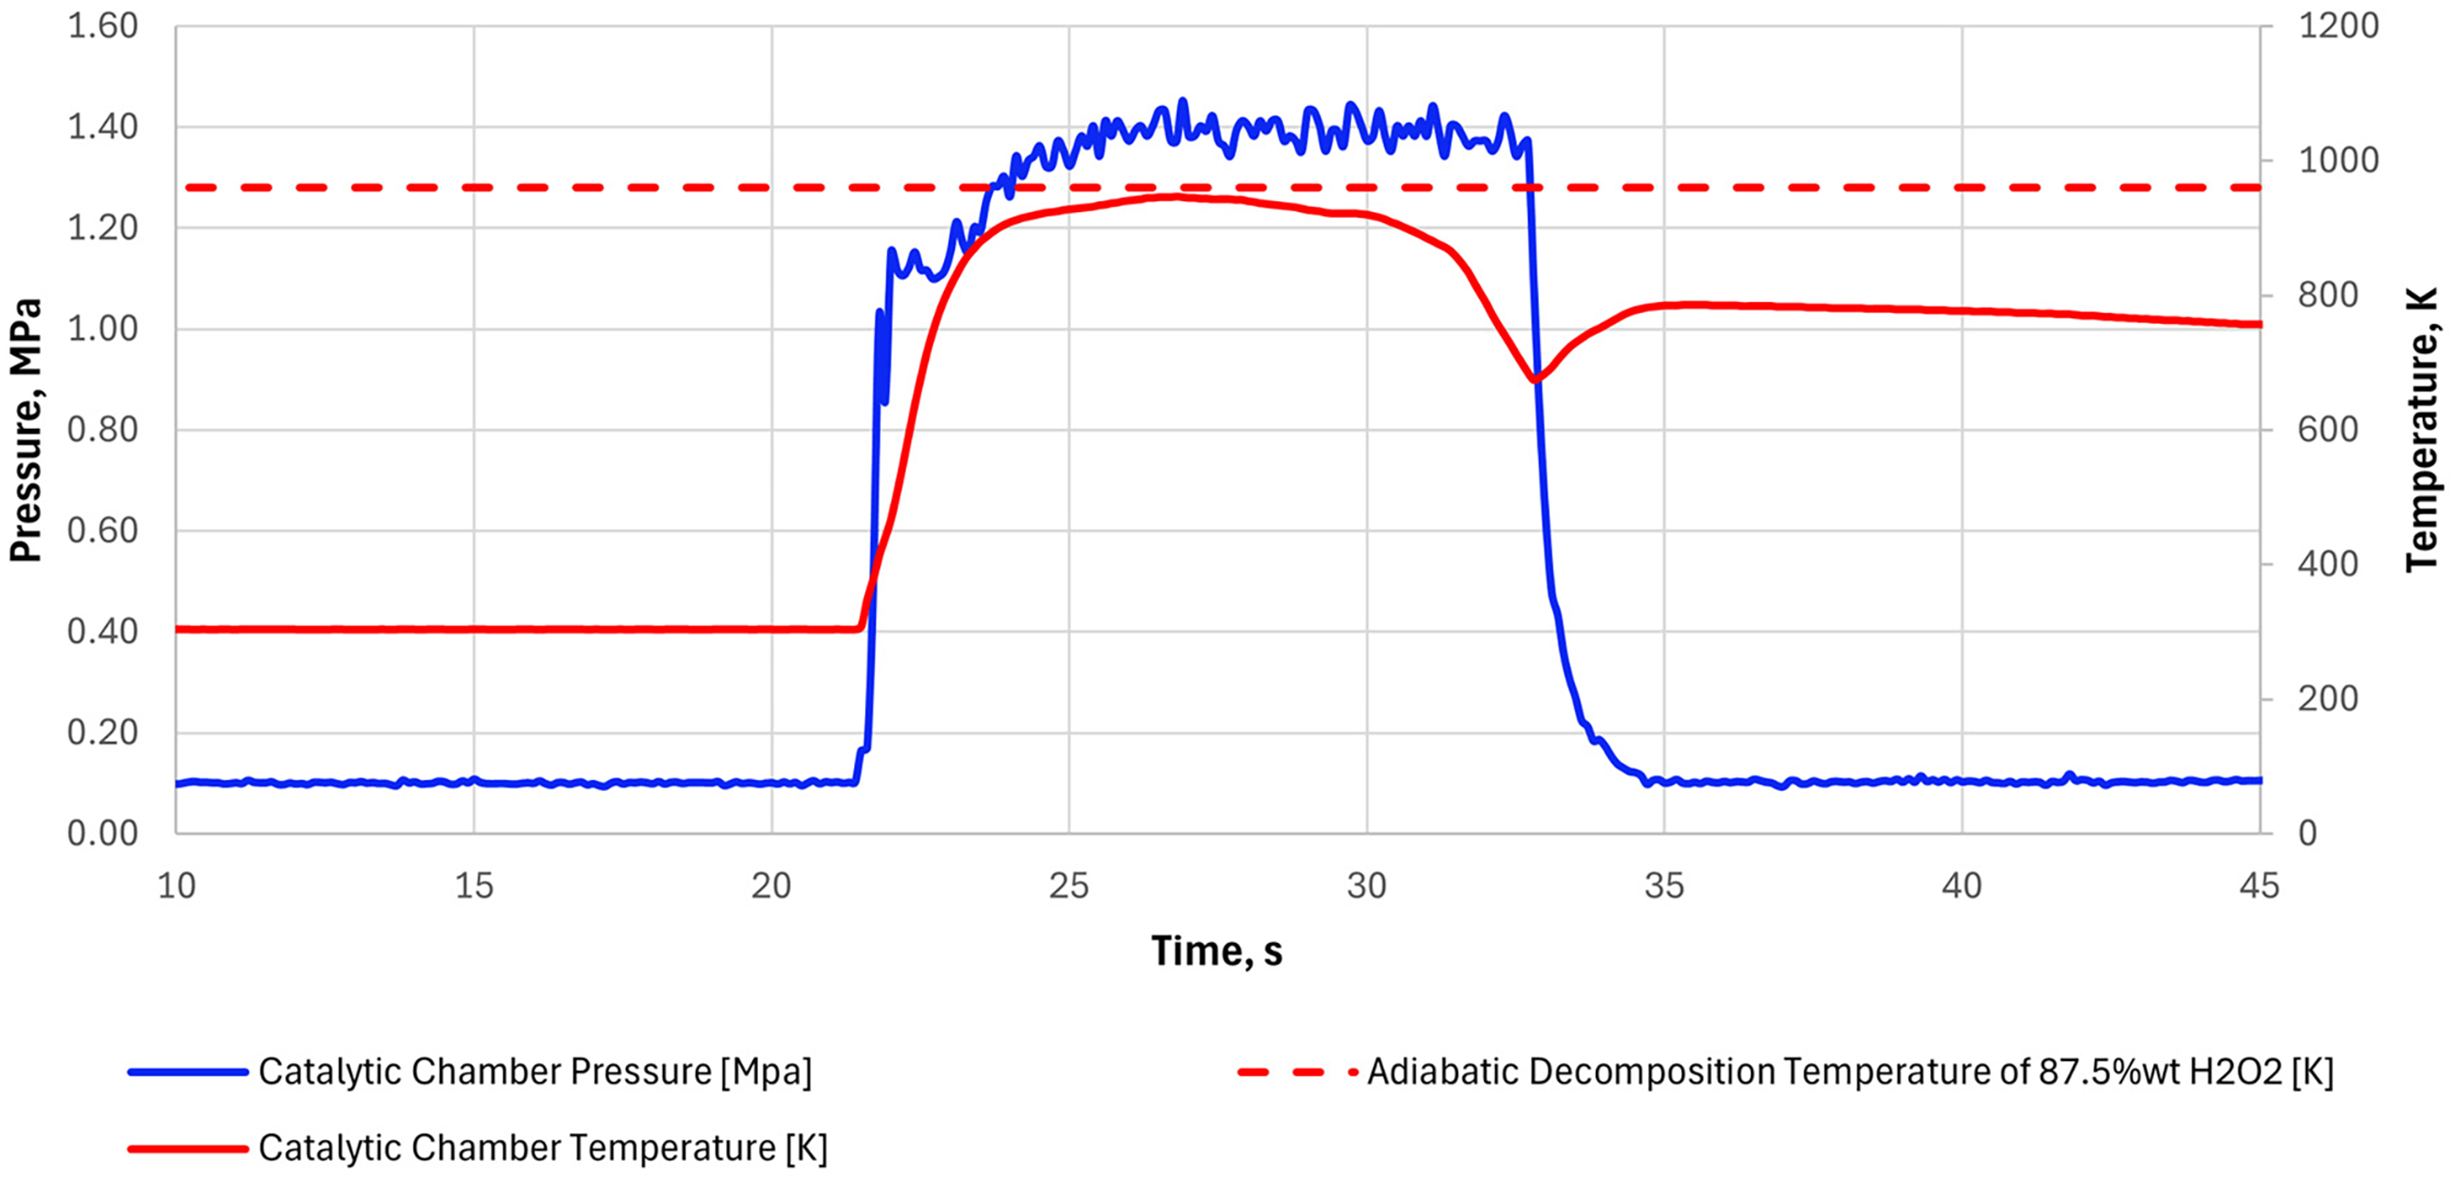
Figure 3: Pressure and temperature signals acquired in the catalytic chamber during a 14 s long monopropellant test, performed to assess decomposition performance
The decomposition products are injected into the combustion chamber, detailed in Fig. S5, which comprises a 10 mm long pre-chamber to facilitate the generation of a recirculation zone. The goal is to enhance the mixing process between the oxidizer and the fuel, increasing the engine’s combustion efficiency. An HDPE (High-Density Polyethylene) and an ABS (Acrylonitrile Butadiene Styrene)-like cylinder with an external diameter of 56 mm and a cylindrical port of 10 mm are employed as fuel for the combustion reaction. The fuel grain is thermally insulated from the combustion chamber wall and the nozzle thanks to thermal protections interposed between the elements. This decreases the conductive heat flow to the grain and avoids excessive temperature increase, thus preventing unwanted melting phenomena. The graphite converging-diverging nozzle (Fig. S6) incorporates a 10 mm long post-chamber conceived to increase the residence time of the combustion products. The nozzle is characterized by a throat diameter of 2.6 mm and an expansion ratio of 3.4, which is relatively low considering its employment for ground tests. A closing flange (Fig. S7) is mounted to allow the full assembly of the thruster and its proper sealing. An additional thermal protection is inserted between the closing flange and the nozzle to prevent overheating of the external case. The combustion chamber assembly is equipped with a pressure transducer and a thermocouple in the pre-chamber to monitor the combustion process. Three further thermocouples are mounted on grooves on its outer wall to acquire data of the case heating during the firing test, at respectively 8, 33.96, and 61.41 mm from the combustion chamber inlet section.
The engine configuration presented in the previous section is derived directly from a redesign process of the hybrid mini-thruster shown in Fig. 4, which has been extensively investigated in previous experimental campaigns [15].
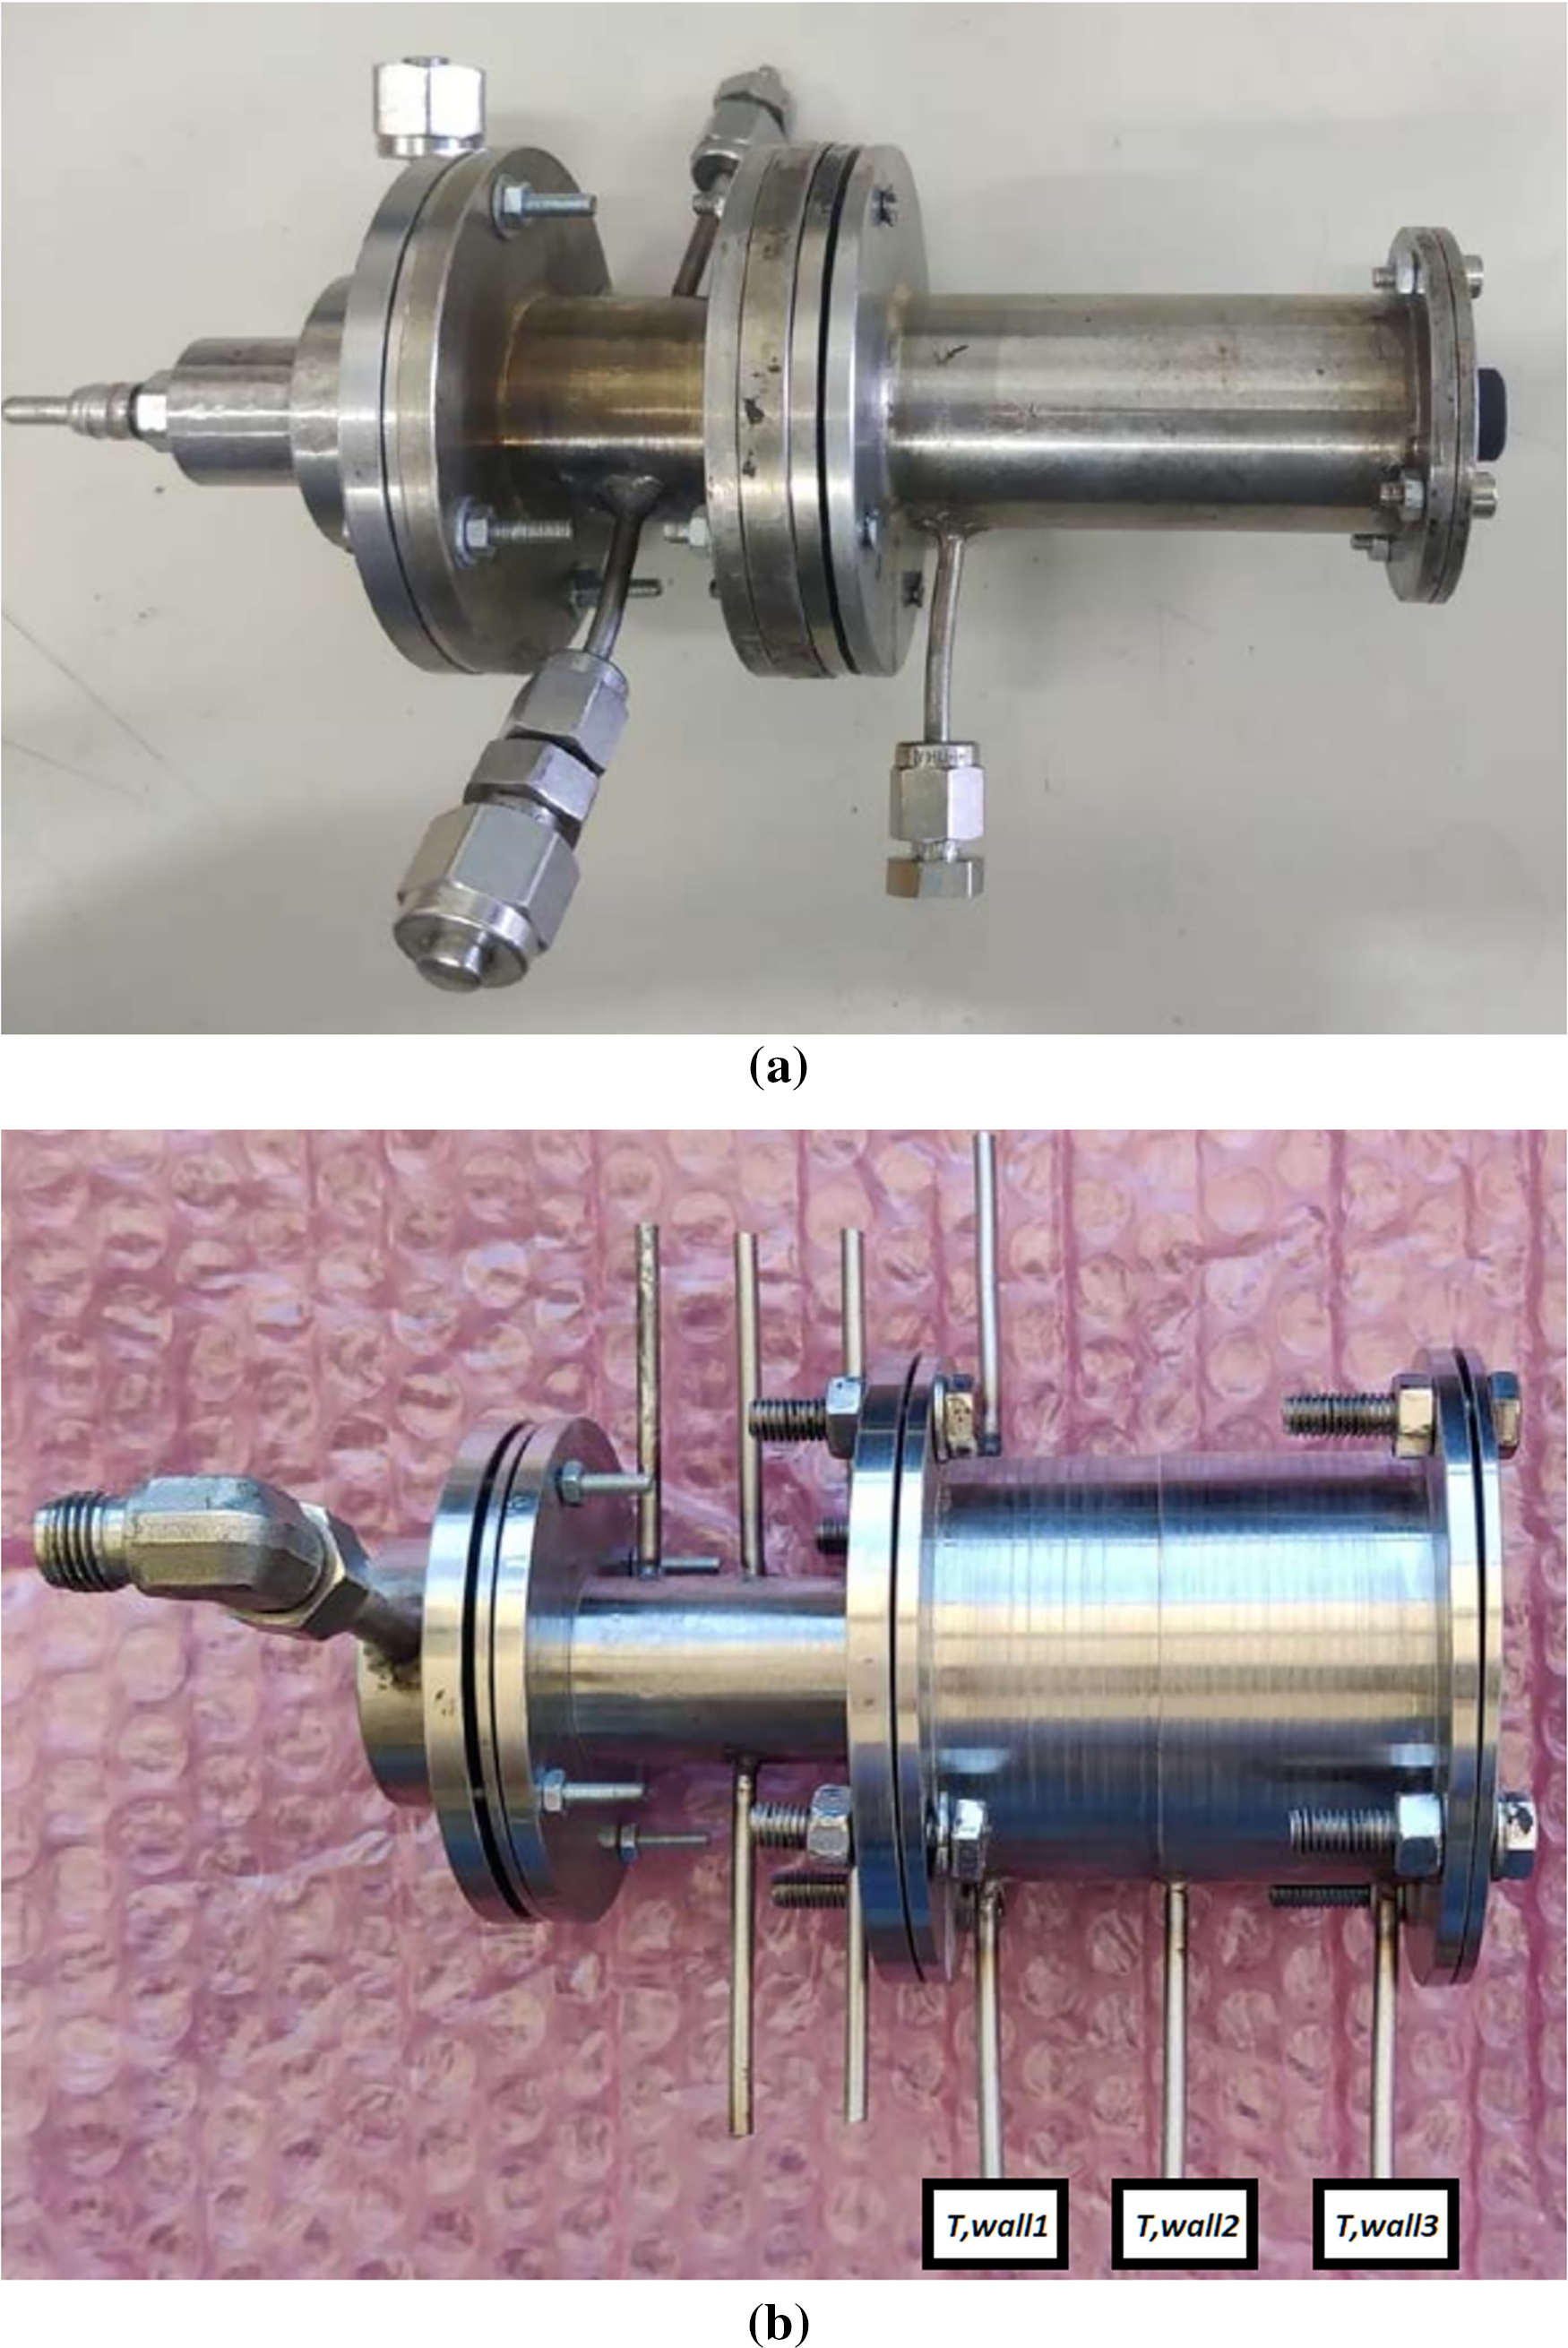
Figure 4: Old configuration (a) and new configuration (b) of the H2O2-based hybrid rocket engine. Labels display the position and designation of the thermocouples on the combustion chamber
The new setup was designed to meet the requirements of a space-based remote sensing mission in which the research group was involved. The objective was the development of a hybrid propulsion system for in-orbit demonstration of the technology. During phase 0/A (as defined by the European Space Agency ESA [23]), initial requirements for the mission were established in terms of thrust and chamber pressure ranges,
• Oxidizer mass flow rate
• Nozzle expansion ratio
• Different fuel compositions and corresponding regression laws.
To account for the effect of different fuels during the preliminary design phase, two regression laws were considered. Specifically, two experimental
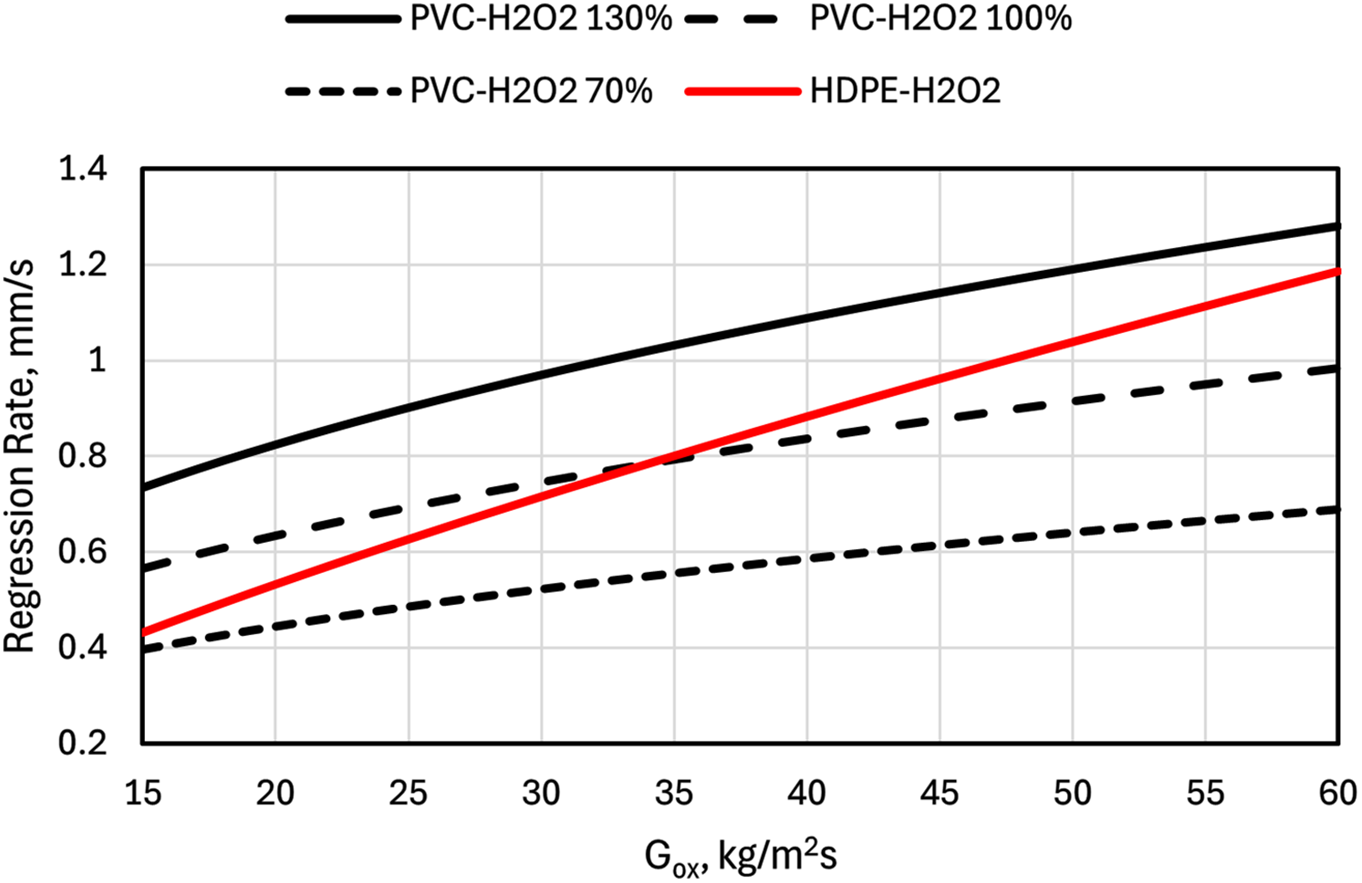
Figure 5: Regression laws used for the iterative design process
A performance analysis was carried out for each combination of variables, using the desired total impulse value as the target parameter (as represented in Fig. 6). Numerous designs varying in grain length, diameter and composition were collected and compared. Among the several alternatives, the setup characterised by the maximum diameter was chosen for simulation, production and testing. Indeed, it constitutes the worst-case scenario both from the point of view of the geometrical envelope, since the thruster shall be contained entirely within a volume of 1.5 CubeSat Units (comprising fluidic feed lines and tanks), and from the fluid-dynamic point of view since a lower length-to-diameter ratio could affect sensibly the internal ballistic with respect to what is already known in the case of the previous setup. Moreover, this configuration attained three objectives. First, a larger diameter for the combustion chamber could enable an extension of the burning time, typically limited to less than 10 s for the previous configuration. Furthermore, adopting a larger fuel grain allowed for the study of a wider oxidizer mass flow rate (Gox) range, thus enabling the assessment of any effect that the progressive widening of the burning area might have on the fluid dynamic field and propulsive performance. The third objective was to evaluate the impact of thermal behavior on the regression rate. As observed in [15,17], this class of engine exhibits a higher
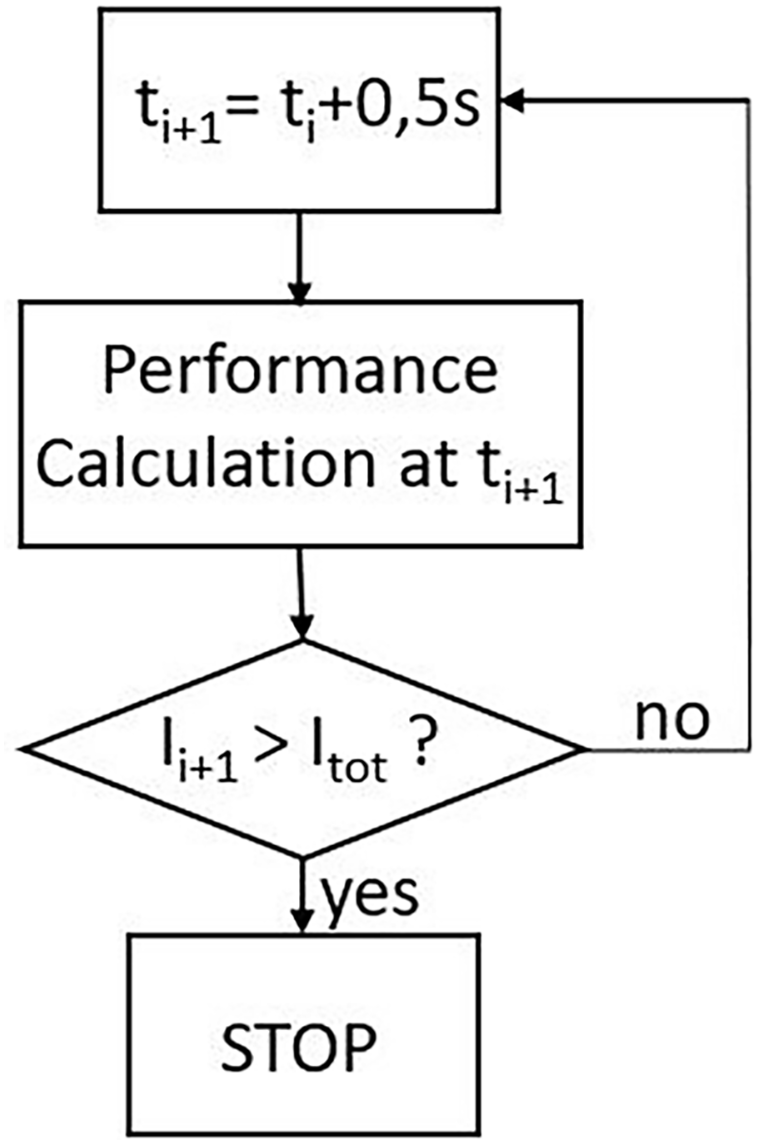
Figure 6: Conceptual scheme of the iteration logic employed for the design process
Once the new combustion chamber diameter was determined, preliminary analyses were carried out to obtain a theoretical and approximate estimate of the expected engine performance. This allowed to evaluate the updated configuration during the design phase before the procurement of the required elements. The preliminary assessment was performed through an in-house MATLAB code for the experimental data prediction, implementing simplified analytical equations based on the Rocket Propulsion Analysis (RPA) open software to model the thermo-fluid-dynamic condition of the combustion mixture, as described in [16]. The initial assumptions underlying this internal ballistic model include:
• Ideal gas;
• Homogeneous mixture;
• Complete and adiabatic combustion;
• Steady-state flow in the combustion chamber;
• One-dimensional and iso-entropic flow in the nozzle;
• Chemical Equilibrium in the nozzle;
• Null temperature and velocity gradients between gaseous and condensed chemical species.
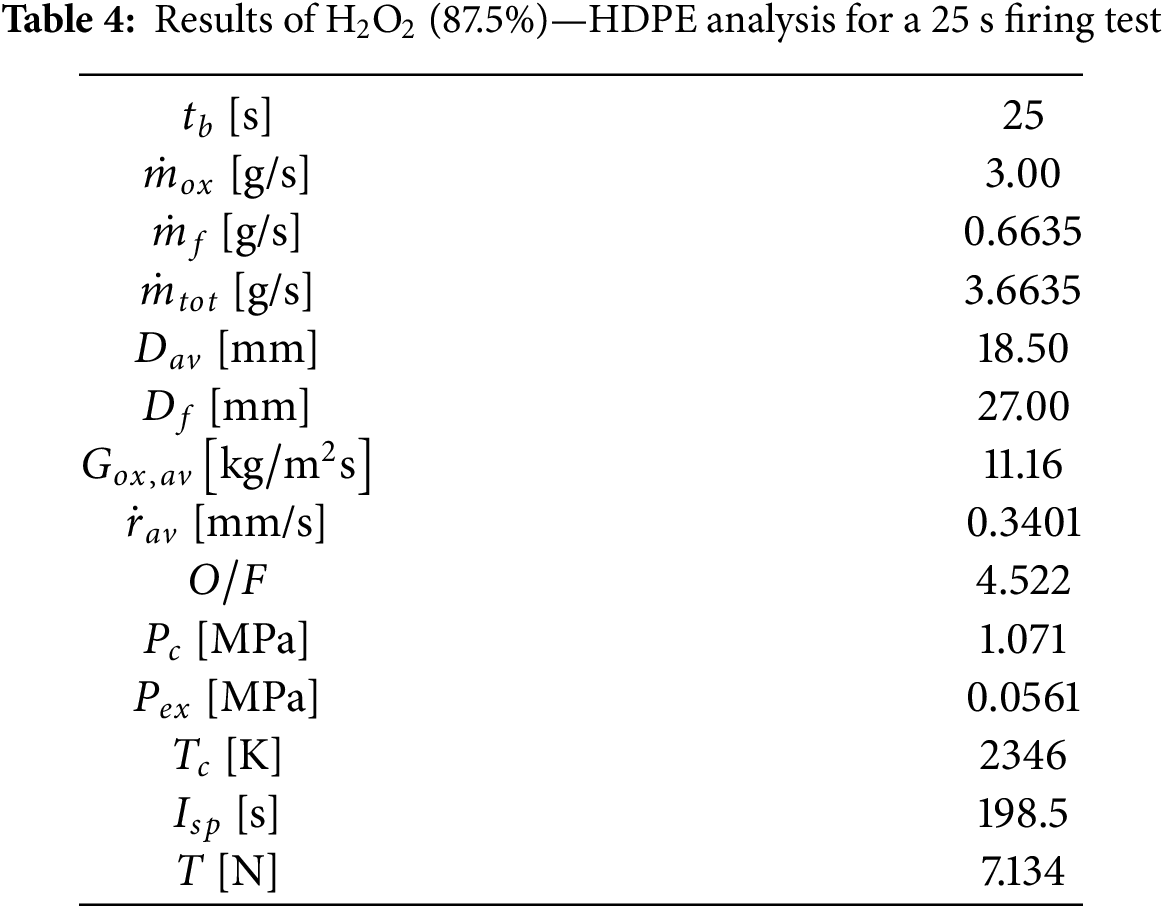
Considering 87.5 wt% hydrogen peroxide and HDPE as propellant pair and employing preliminarily the experimental regression law obtained with the previous configuration of the thruster, it is possible to estimate the propulsive performance from the initial data presented in Table 3.
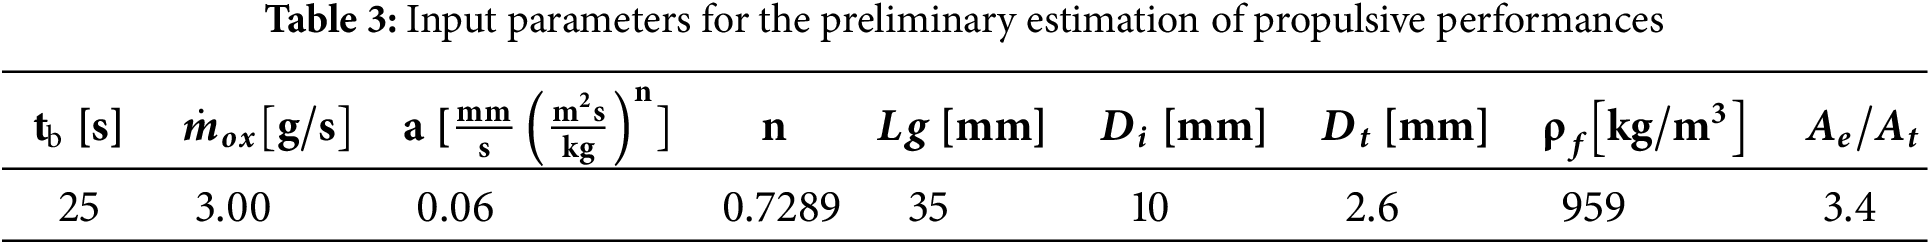
The results of a 25-s firing test simulation are reported in Table 4. The simulation predicts a large grain consumption due to the relatively high burning time, with the port diameter increasing up to 27 mm. Consequently, a sensible oxidizer-to-fuel ratio (O/F) shift is expected during the test. The oxidizer mass flux
3 Data Post-Processing Technique and Numerical Modelling
3.1 Measured Data Reduction Technique
Each firing test allows the acquisition of experimental data sets obtained through sensor measurements (as shown in Table 1) and post-test grain evaluation. These direct measurements can be either instantaneous values recorded over time or time-averaged data and comprise important parameters such as oxidizer mass flow rate
where
The space-averaged final port diameter
where
The time-averaged oxidiser mass flux
Eq. (8) describes the time-averaged oxidiser-to-fuel ratio O/F during the test:
Once the measured and estimated quantities have been collected, a comprehensive characterization of the thruster behavior during the test may be performed. The analysis of error propagation for quantities estimated as products or ratios of other quantities was carried out based on the measurement instrument errors listed in Table 1, following the formulas provided in [25]. The estimated error values have been reported in Tables 6 and 9.
Computational Fluid Dynamics simulations were performed as a support tool for experimental results. The use of models that reproduce realistically the rocket engine’s internal ballistics allows an in-depth study of the physical phenomena at play. To properly capture the relevant fluid-dynamic features, a commercially available software employing a pressure-based algorithm and a control volume approach is used to solve the Raynolds-Averaged Navier-Stokes (RANS) equations, specified for the case of turbulent single-phase multicomponent flows [26]. The Shear Stress Transport (SST)
3.3 Computational Domain and Boundary Conditions
The numerical calculations are performed employing two-dimensional structured grids, which represent the internal volume of the pre-chamber, the fuel grain port, the post-chamber and the nozzle. In Fig. 7, a typical computational grid is represented.
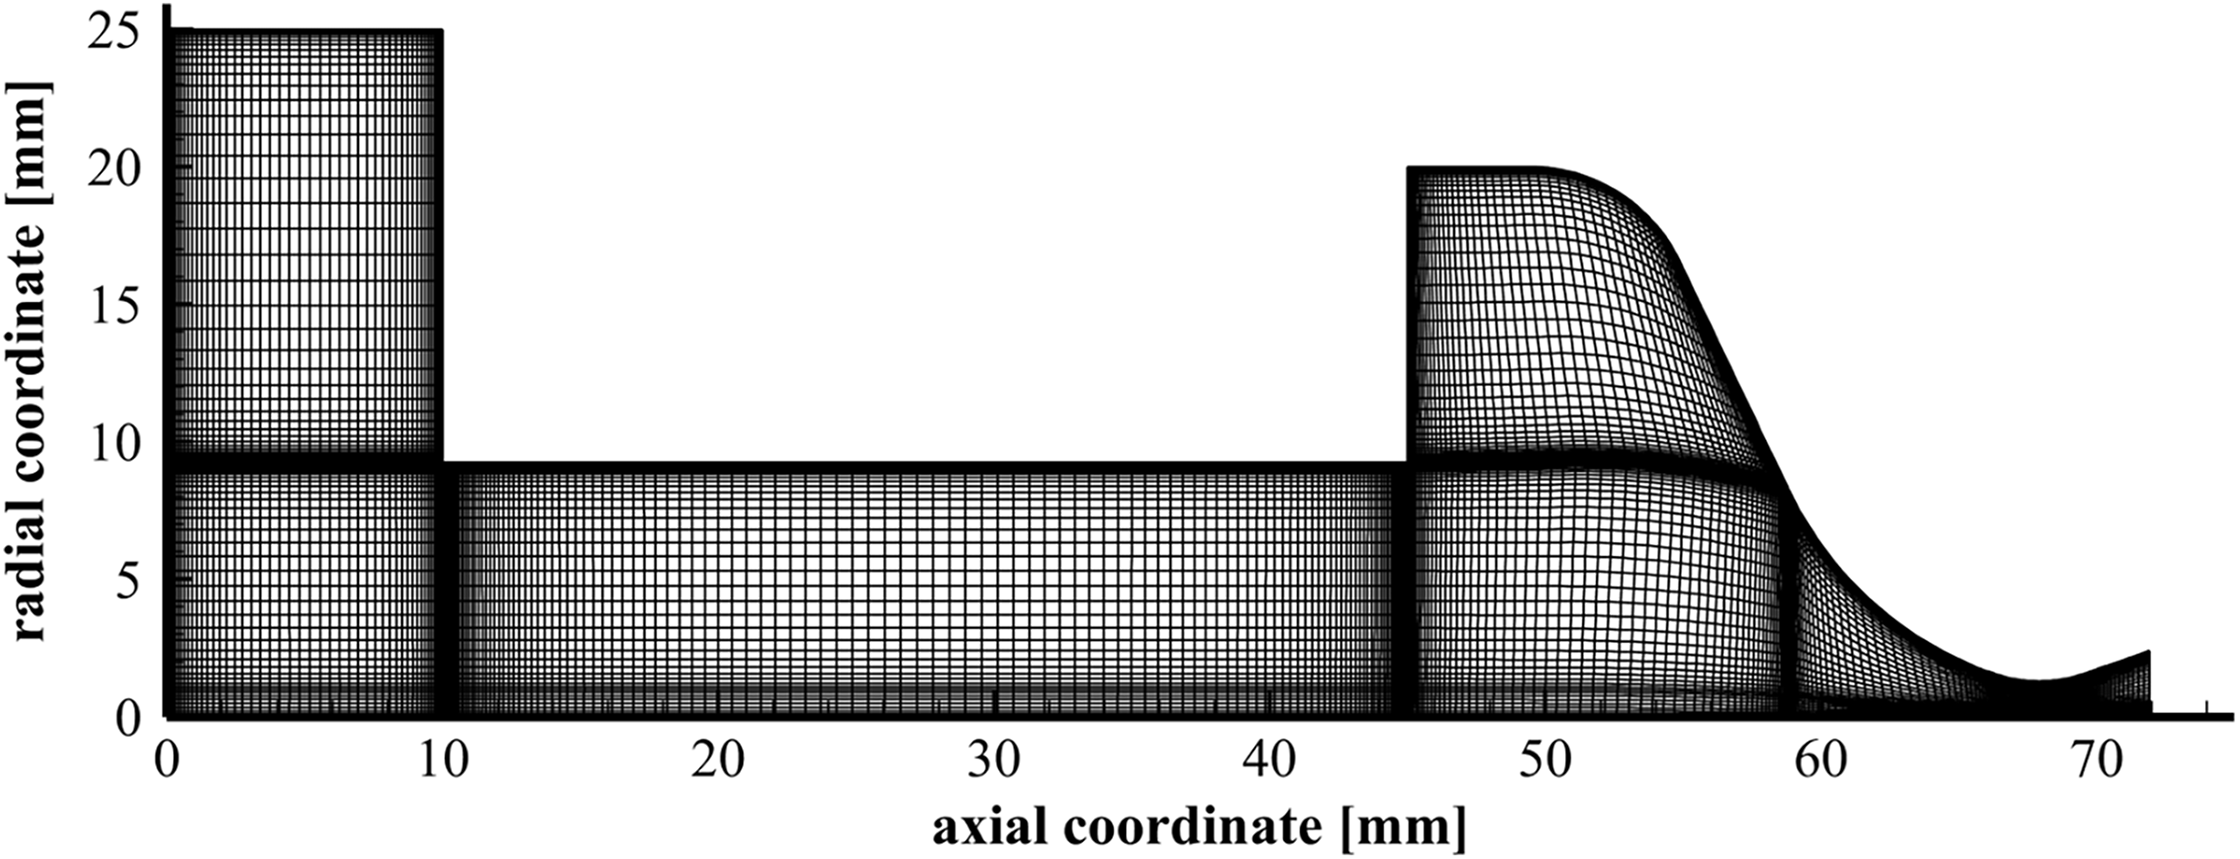
Figure 7: Representative axisymmetric two-dimensional computational grid for numerical simulation of the hybrid mini-thruster internal ballistics
It should be noted that this is an illustrative example, as the grain length and port diameter vary in accordance with the different cases under analysis. As shown in Fig. 7, cells are clustered in proximity to the grain wall, ensuring that the y+ maximum value is approximately between 2 and 3 in the cells adjacent to the wall along the entire grain length for all test cases considered. Furthermore, additional mesh refinement is performed in the regions proximate to the inlet and outlet sections of the grain and for the inner surfaces of the pre-chamber, post-chamber, and nozzle. Following the naming scheme reported in Fig. 8, boundary conditions are applied for each inner surface of the thruster. No-slip and adiabatic conditions are imposed on the surface of both the pre-and post-chamber, as well as on the nozzle wall. A mass flow inlet condition is prescribed for the injector, assigning appropriate values for the injection temperature (900 K), oxidizer mass fraction and turbulent quantities. The pressure outlet boundary condition is set to the nozzle exit.
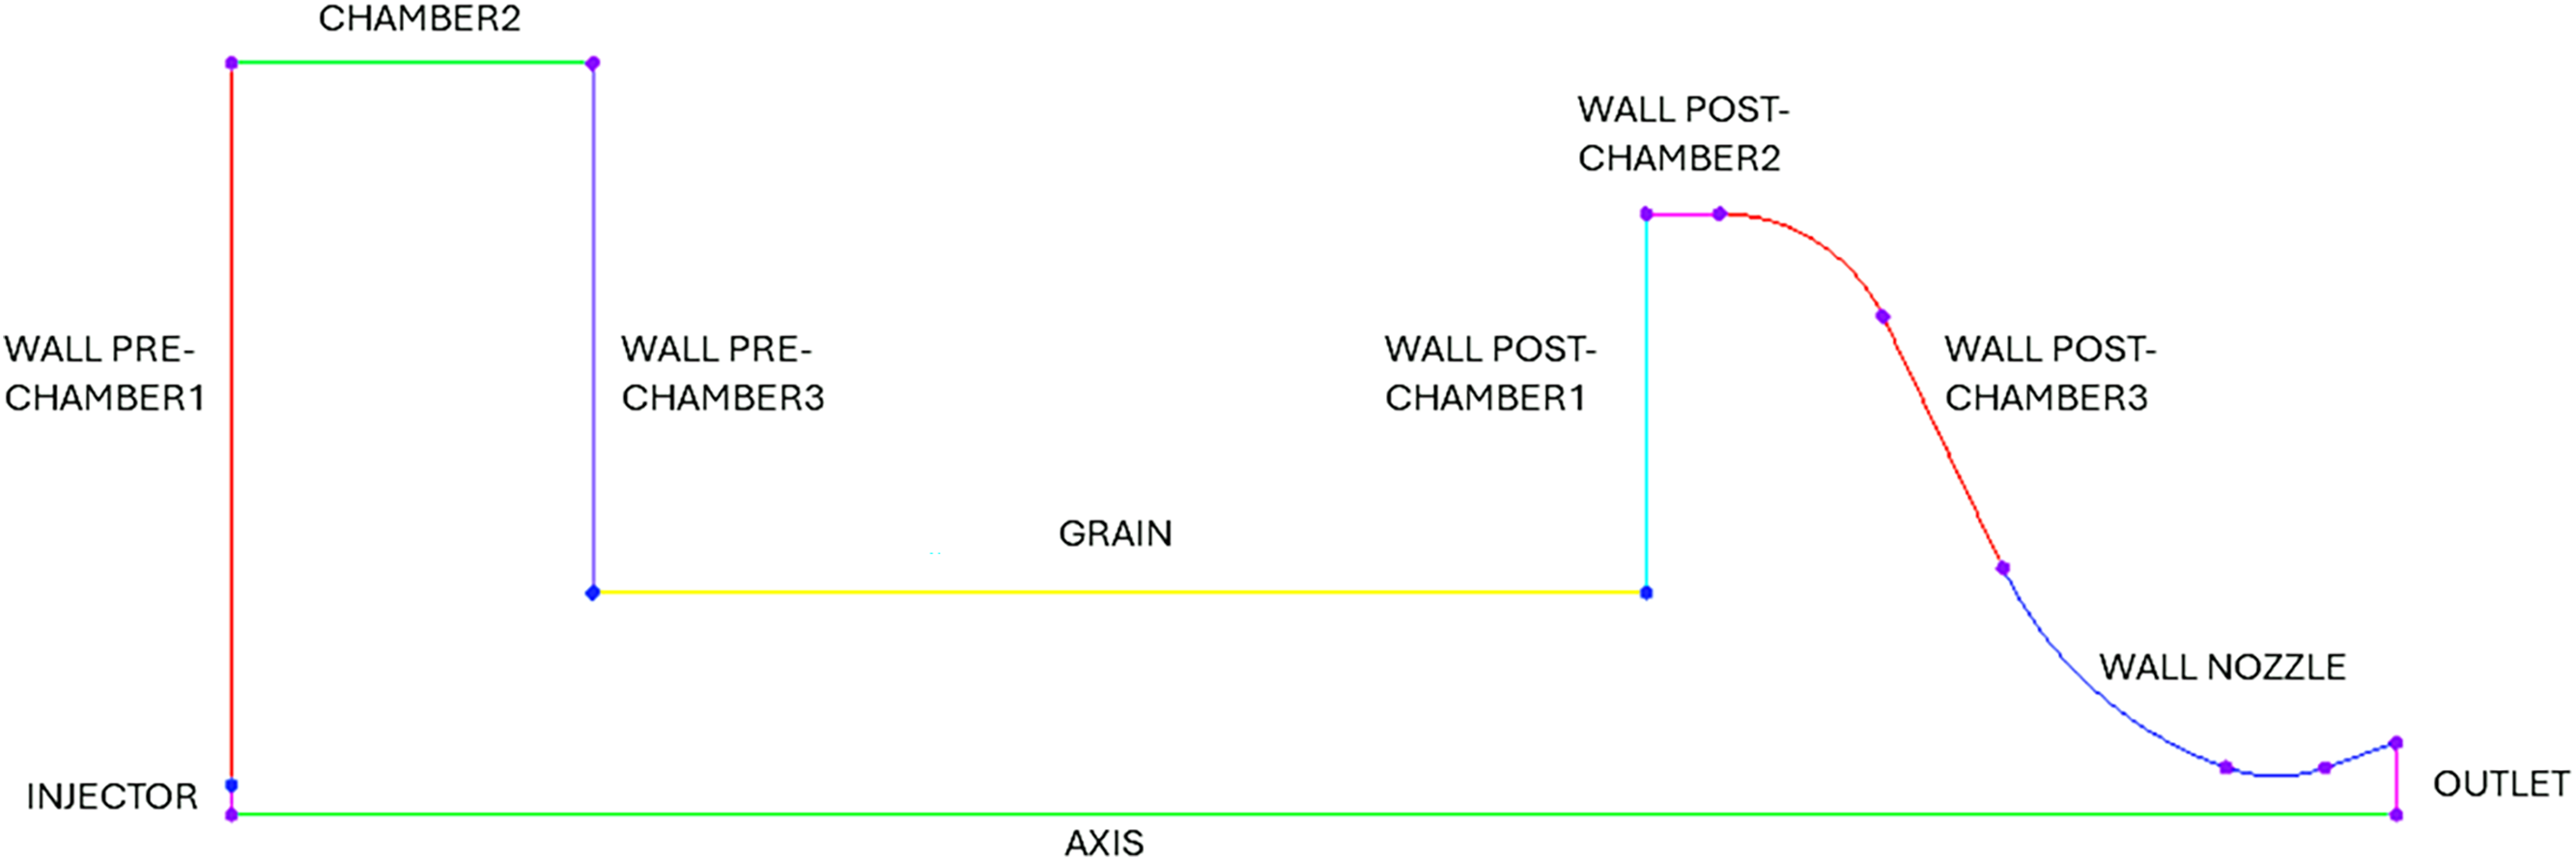
Figure 8: Naming scheme applied for the computational grid boundary conditions
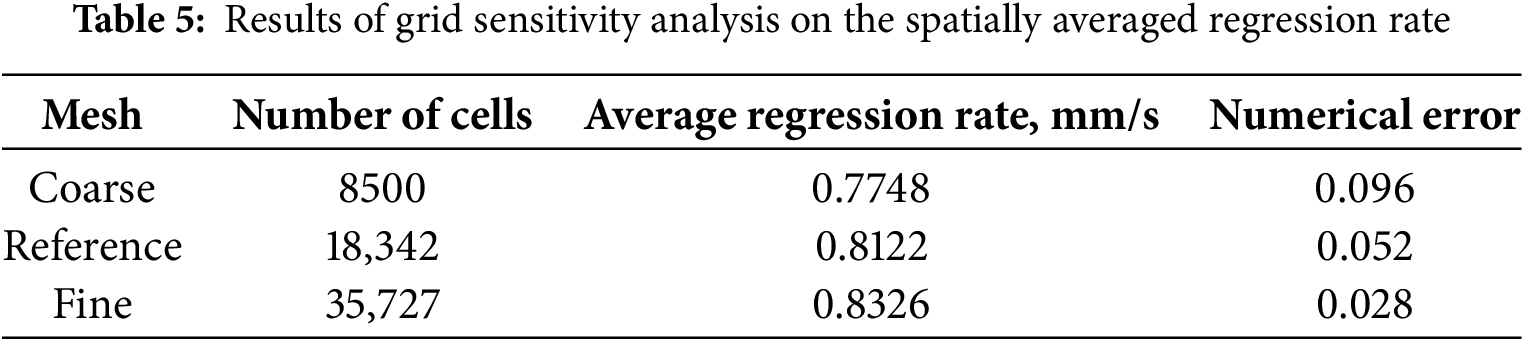
To evaluate the numerical results presented in the subsequent sections, a grid sensitivity analysis is conducted using three levels of mesh refinement. The coarser mesh is created by doubling the cell size in both the axial and radial directions compared to the reference mesh, while the finer mesh is produced by halving the cell size in both directions. Fig. 9 displays the axial profiles of the regression rate computed with the different meshes.
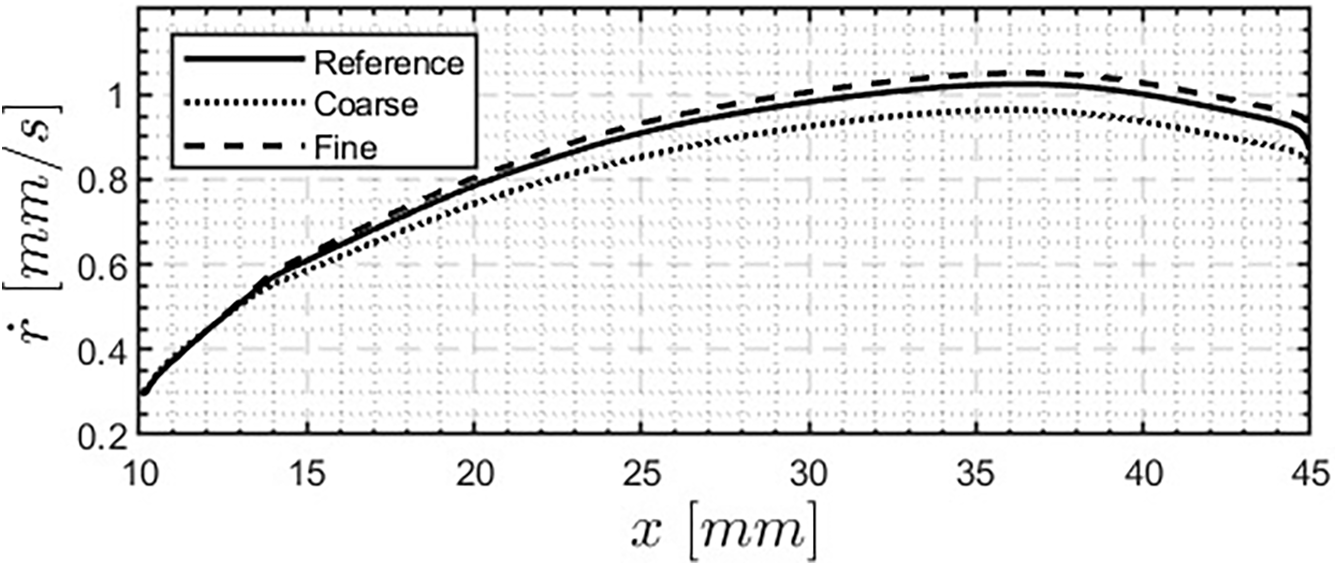
Figure 9: Numerical regression rate profiles calculated with different refined computational grids
Table 5 presents the averaged regression rates calculated using the different meshes, along with the associated numerical errors. These errors are determined using the methods outlined in [29], where the exact value of the asymptotic value
where
and
3.5 Grain Geometry Update Technique
Numerical analyses of hybrid rocket engines are typically performed by conducting a single CFD simulation based on an appropriate geometry capable of properly reproducing the fluid dynamics phenomena involved. As shown in [30], an estimation of the
An iterative process based on a sequence of stationary CFD simulations with a forward integration scheme is employed to update the grain geometry during the firing test simulation. Starting from the prior knowledge of the local regression rate
where
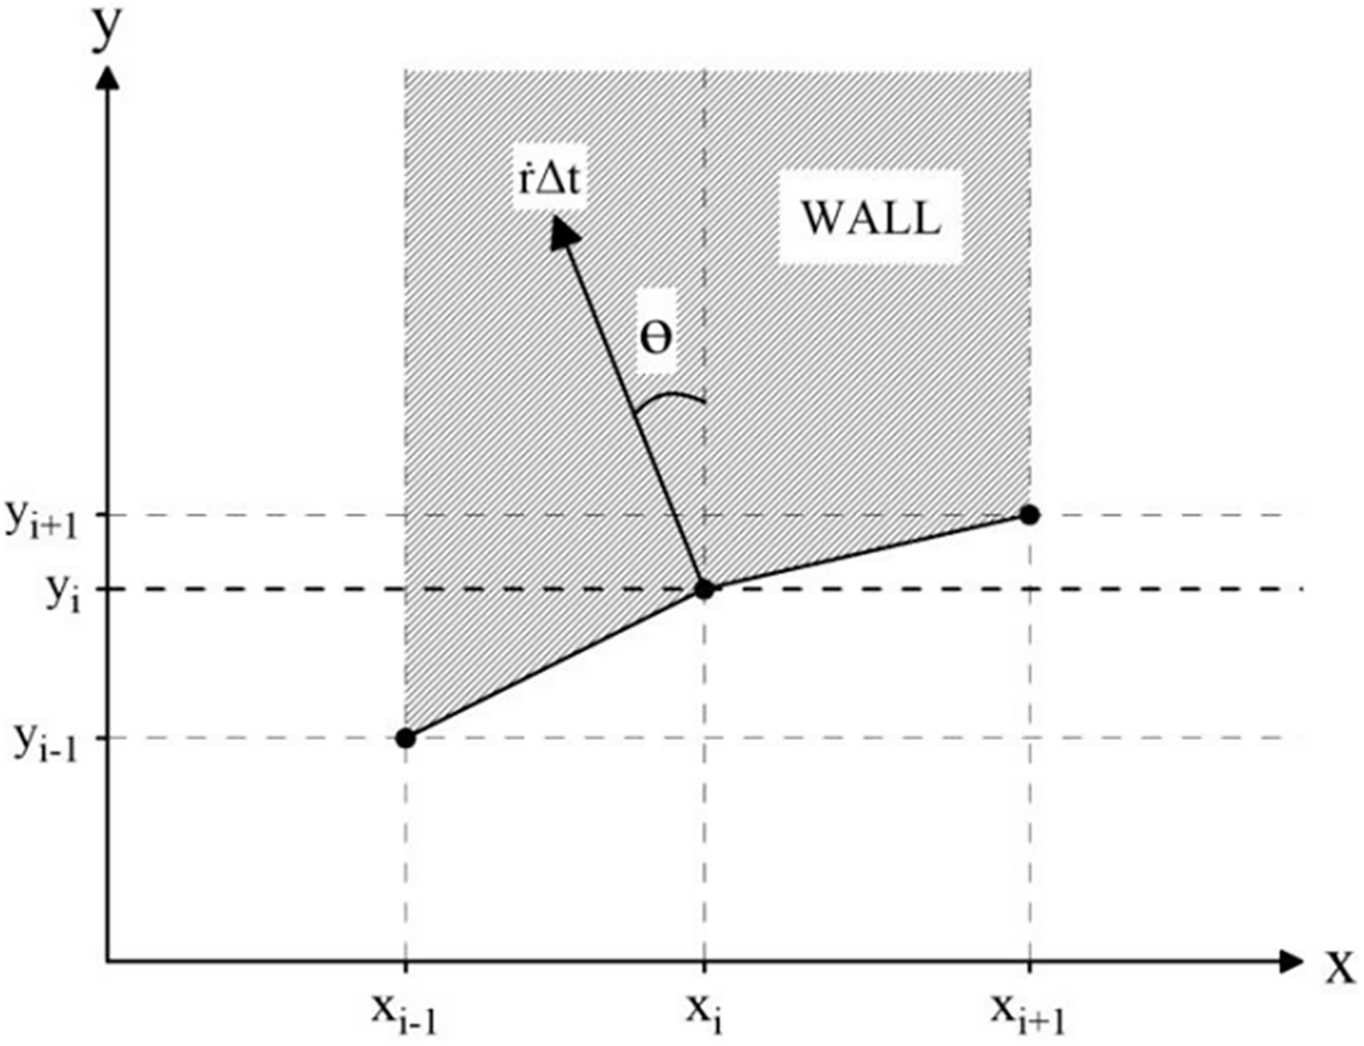
Figure 10: Schematic of node displacement for the i-th node. Reprinted from Reference [32]. 2023, The Combustion Institute
Once the nodes position at time instant
where N represents the number of stations considered,
Figure 11: Volumetric loss calculation scheme
This section will present the experimental results of two test cases performed with the thruster configuration described in Section 2.2. Since the main objective of the present work is the numerical simulation of the engine internal ballistics on the basis of experimental firing tests, two different materials were employed as fuels for the combustion reaction. This approach allowed to assess the fidelity of the CFD model under investigation while considering variable material properties and fluid dynamics behaviours. Specifically, Section 4.1 will consider a firing test carried out with a HDPE fuel grain coupled with 87.5% concentrated High Test Peroxide (HTP), with an average oxidizer flow rate of 7.2 g/s and a burning time of approximately 6.5 s. Section 4.2 will show the results of an experimental test employing ABS-like and 87.5 wt% HTP as propellant pair, with a time-averaged
4.1 Performance Analysis and Experimental Findings for the HDPE Test Case
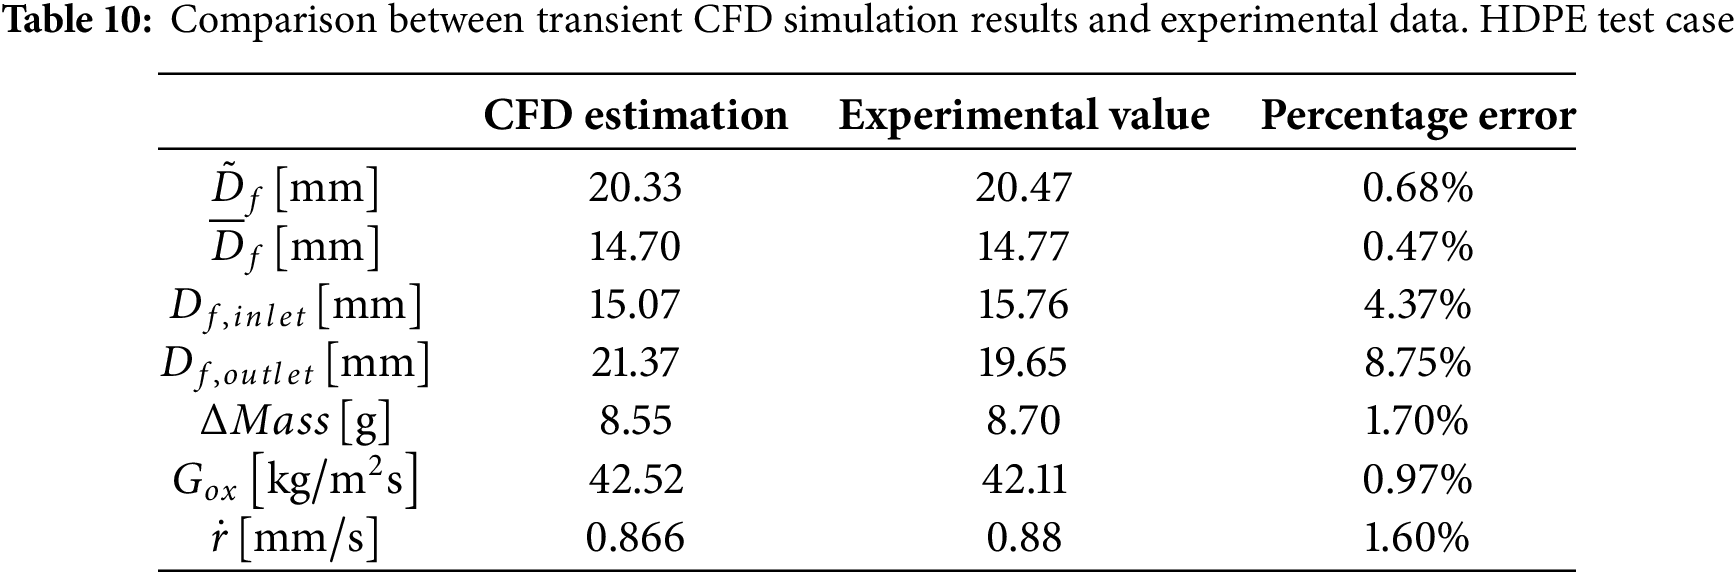
The experimental results and the main performance parameters for the firing test conducted with an HDPE fuel grain are reported in Table 6, where both measured and estimated quantities are shown. The latter were obtained following the procedure described in Section 3.1. Two different regression rate estimates are shown in Table 6. The first one is calculated using the mass loss method, as detailed in Section 3.5, while the second is derived from the inner port diameters measured at the end of the test. Among them, the value of 0.88 mm/s is considered more reliable, as it is obtained from a global measurement that takes into account the mass consumption of the entire grain. It is also based on a measurement that is less affected by errors and uncertainties, providing a more effective evaluation. For these reasons, in the following analyses, the reference value for the HDPE test will be the one calculated using the mass loss technique.
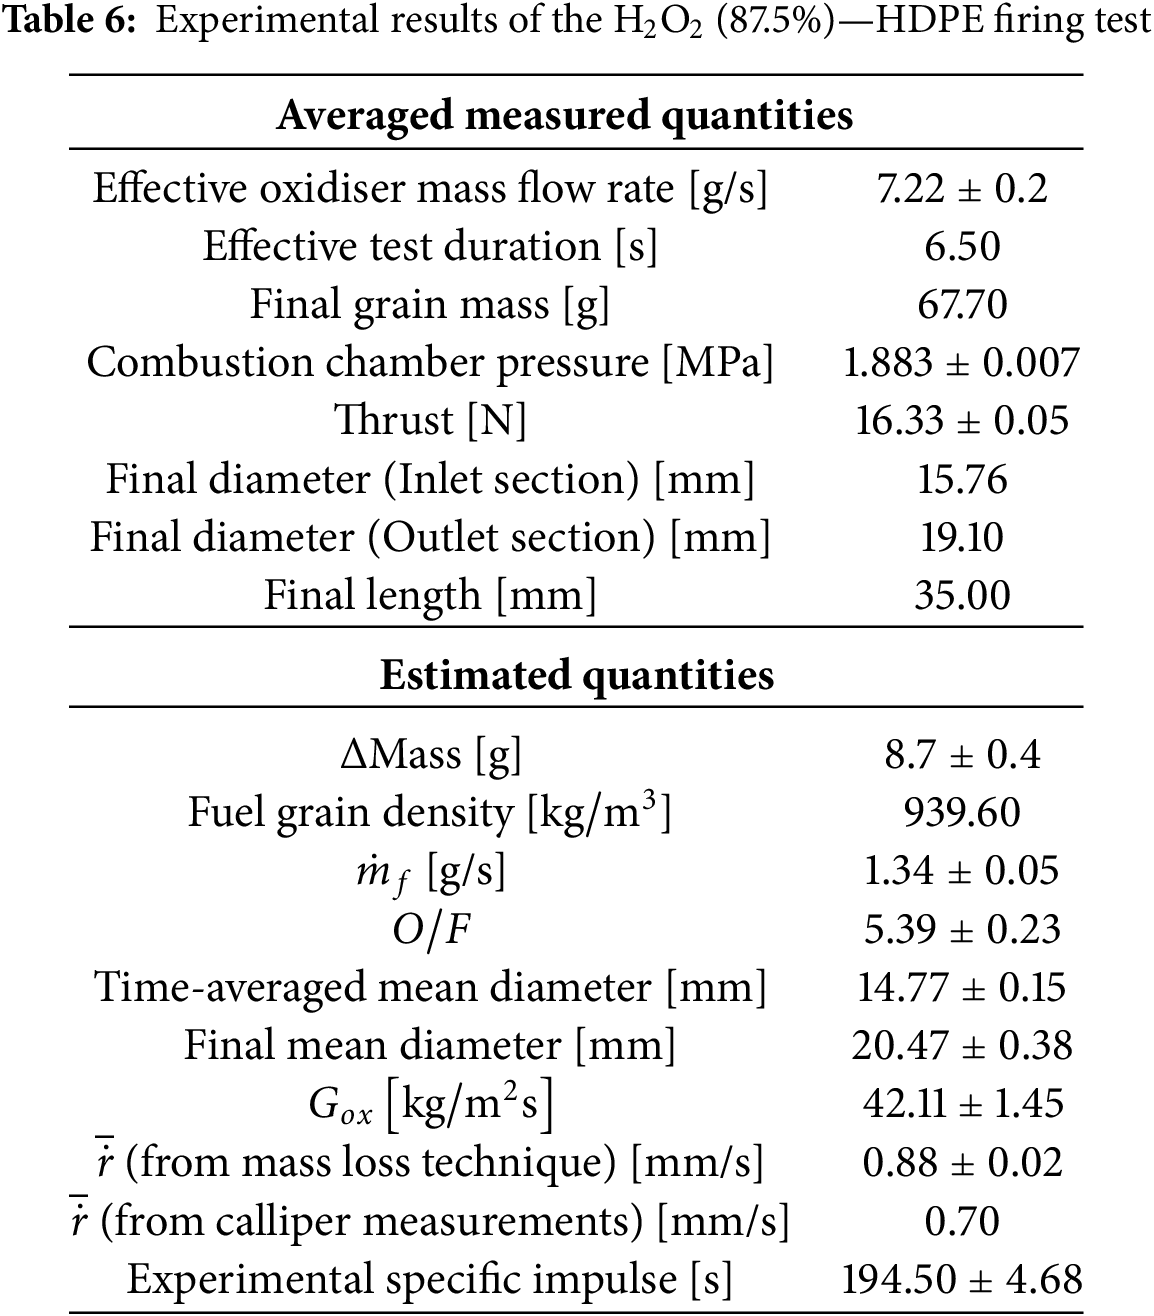
By analysing these data, the thruster performance can be assessed by considering important propulsion parameters such as thrust, chamber pressure, specific impulse, average regression rate and oxidiser-to-fuel ratio O/F. Starting from the experimental data, an additional analysis can be carried out by comparing the actual performance against that obtained using a one-dimensional code that estimates the operating conditions in the combustion chamber using data from NASA’s Chemical Equilibrium with Applications (CEA) software, as detailed in [16]. Using as input parameters a burning time and an oxidiser mass flow rate equal to the average experimental values, results listed in Table 7 were obtained. Burning time and oxidiser mass flow rate were selected to be to the average experimental values, and a regression law derived empirically with the same propellants pair and similar thruster configuration was used. Table 7 summarise the main results.
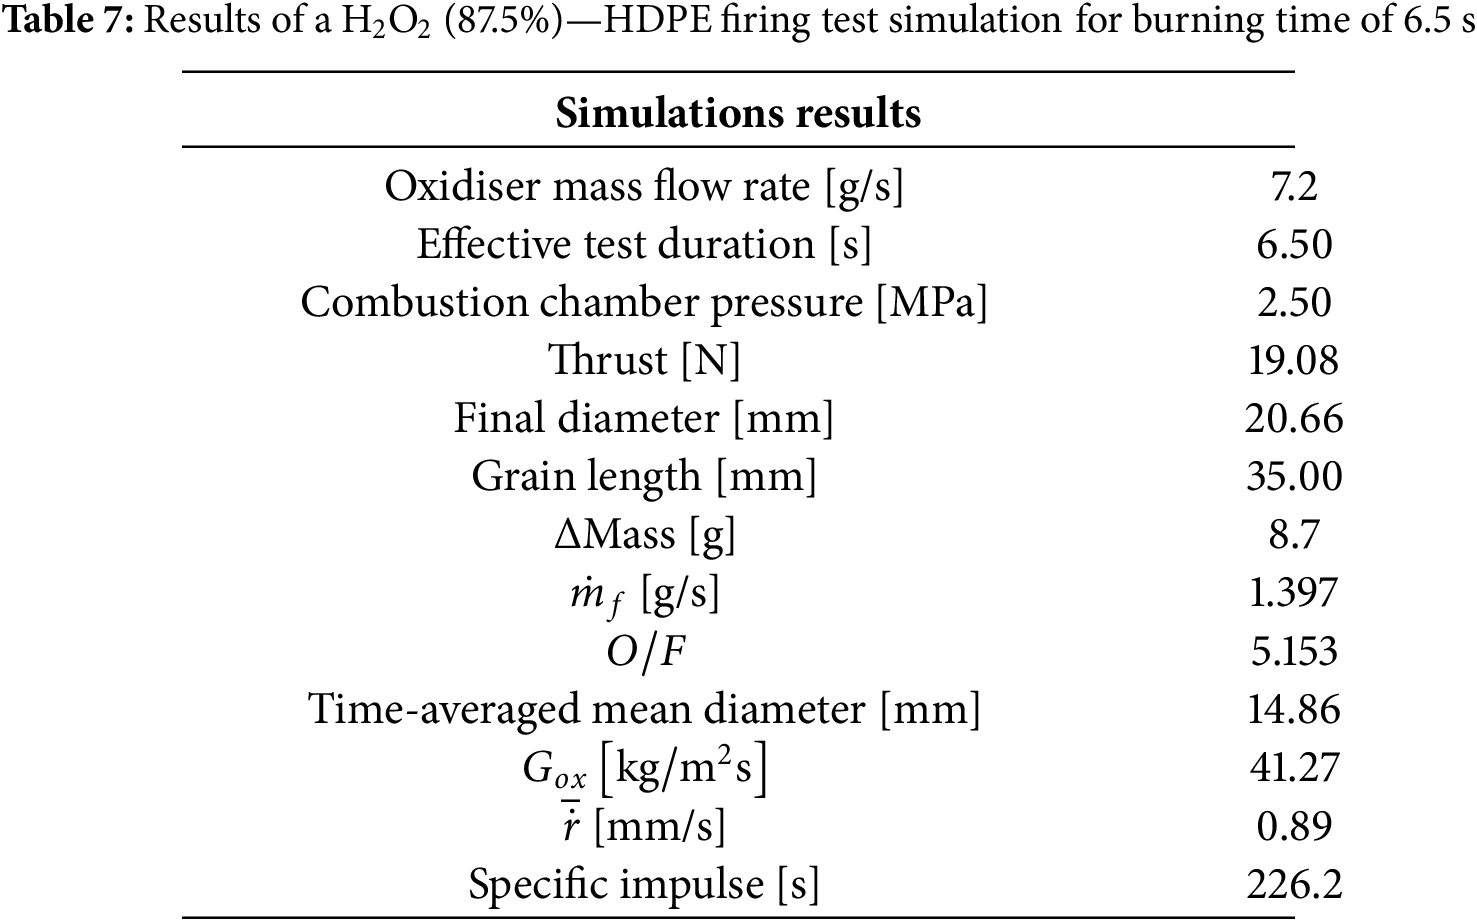
Combining experimental data with mono-dimensional simulation results, some similarities and some differences can be noted. The estimated average regression rate was very similar for both cases, if considering the experimental value computed through the mass loss technique. This implies comparable
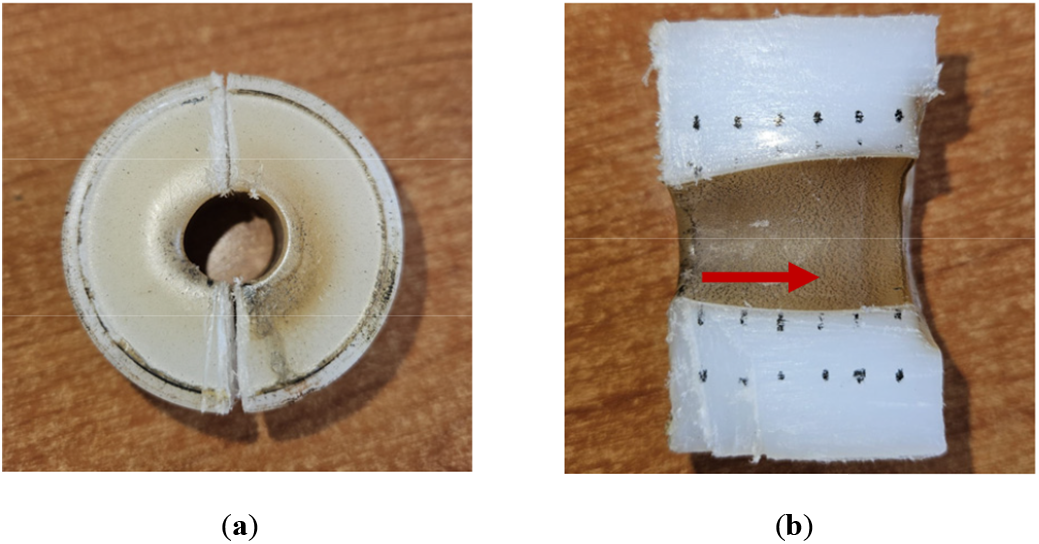
Figure 12: Front view (a) and cross-section (b) of the HDPE grain after the firing test. Red arrow: flow direction
4.2 Performance Analysis and Experimental Findings for the ABS-Like Test Case
As anticipated, an additional test was carried out with an ABS-like grain to complement the experimental and numerical analyses performed with HDPE. The fuel cylinder has the same geometrical characteristics as the previous one. However, it was produced employing the stereolithography additive manufacturing technique, using an ABS-like commercial resin polymerized with 405 nm UV light. The test results, conducted with the same setup, test duration and feed pressure as in the HDPE case study, are summarised in Table 9. Fig. 13 shows the set of signals acquired through the measuring equipment described in Section 2.1 during the 8.8 s firing test. The test duration is estimated considering the time interval between half the rise of the combustion chamber pressure signal and half the descent at the end of the experiment. A time lag can be observed between the pressure signal recorded in the catalytic chamber and the one in the combustion chamber, due to the ignition delay of the fuel grain. The thrust and pressure transducer measurements were fairly constant throughout the test. The oxidiser Mass Flow Rate (MFR) undergoes an initial decrease, then stabilises at a value corresponding to the experimental mean value in Table 9.
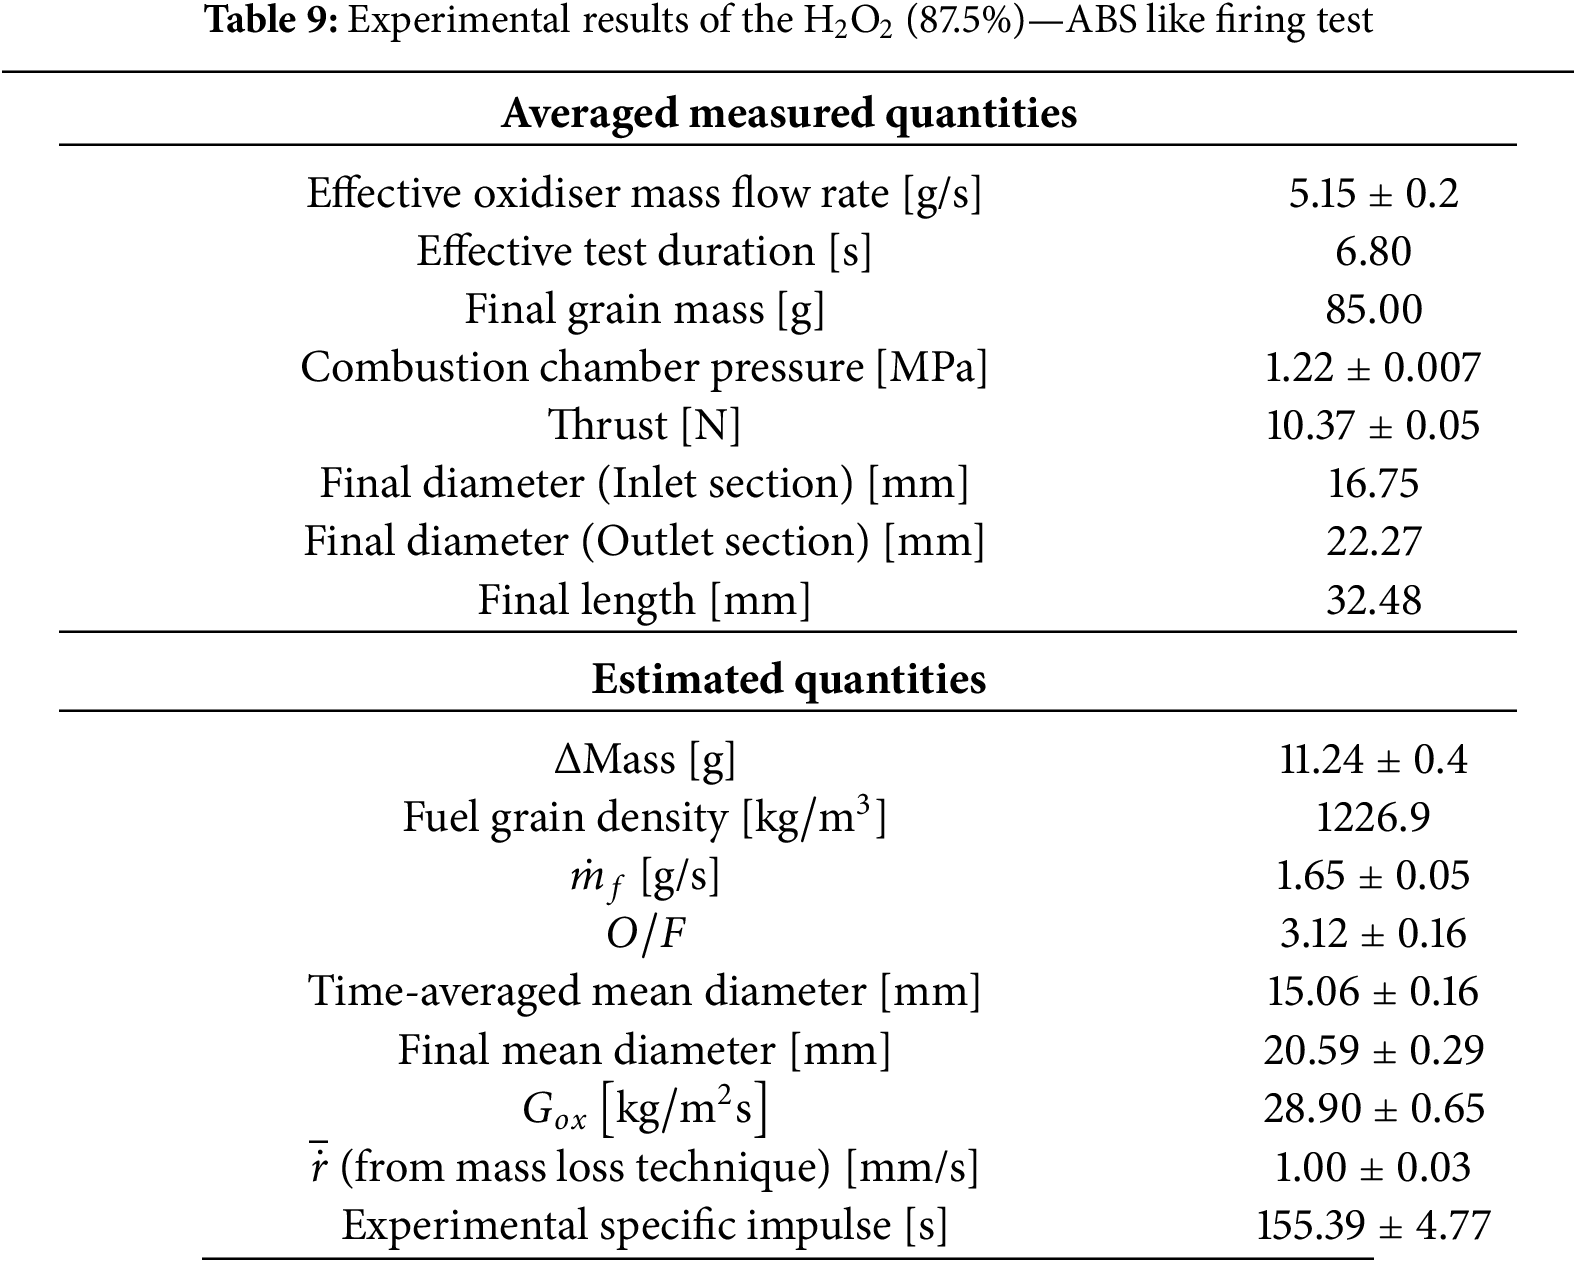
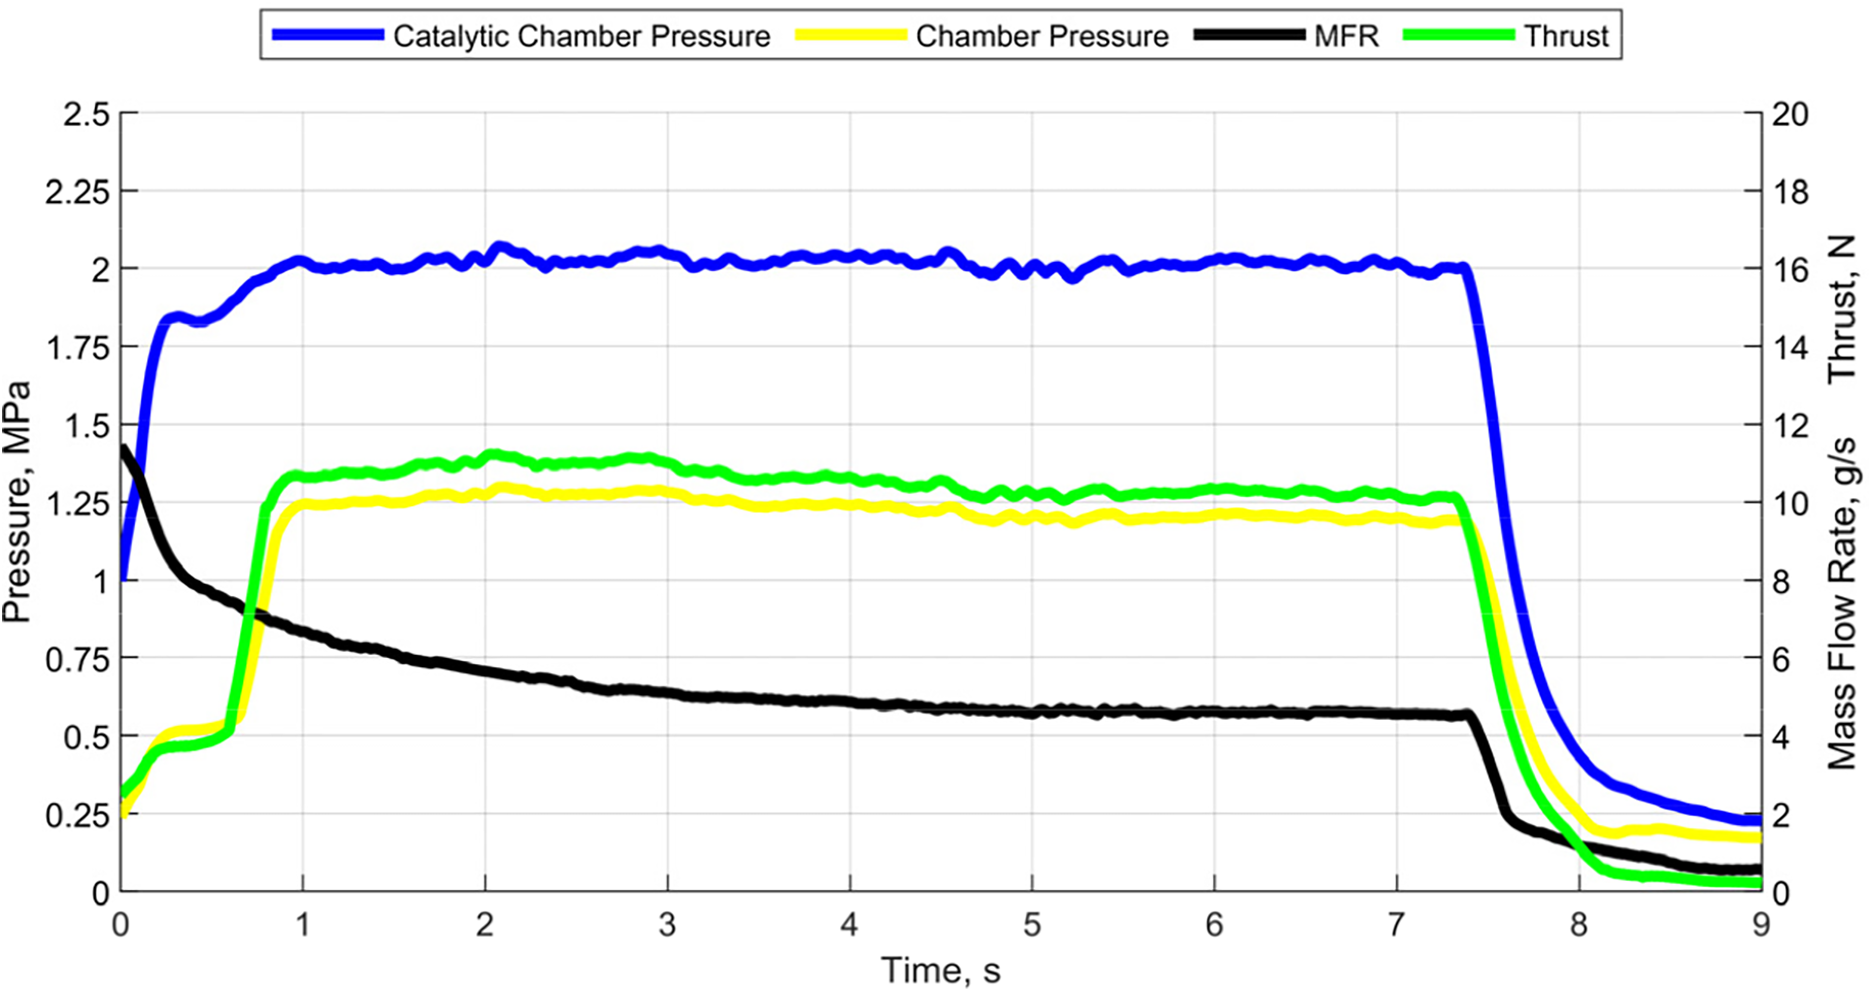
Figure 13: Mass Flow Rate (MFR), chamber pressures and thrust signals acquired during the ABS-like firing test
From the comparison of data reported in Tables 6 and 9, some differences might be noticed. The ABS-like average regression rate is sensibly higher than the previous experiment, reflecting the different combustion characteristics of the two materials. The numerical value is slightly overestimated for reasons that will be shown shortly, but the result is in line with what was already found for tests carried out with the same propellants and with the propeller in its previous configuration. The higher
4.3 Thermal Behaviour Experimental Assessment
As discussed in Section 2.3, one of the primary objectives of the redesign process that led to the definition of the upgraded thruster under investigation was the improvement of the engine thermal management during extended firing tests. This section will address the rationale behind this requirement and the evaluation of the thruster’s thermal behavior. As discussed in [17], the previous configuration (Fig. 4a) suffered a discrepancy in terms of regression rate when comparing experimental and numerical
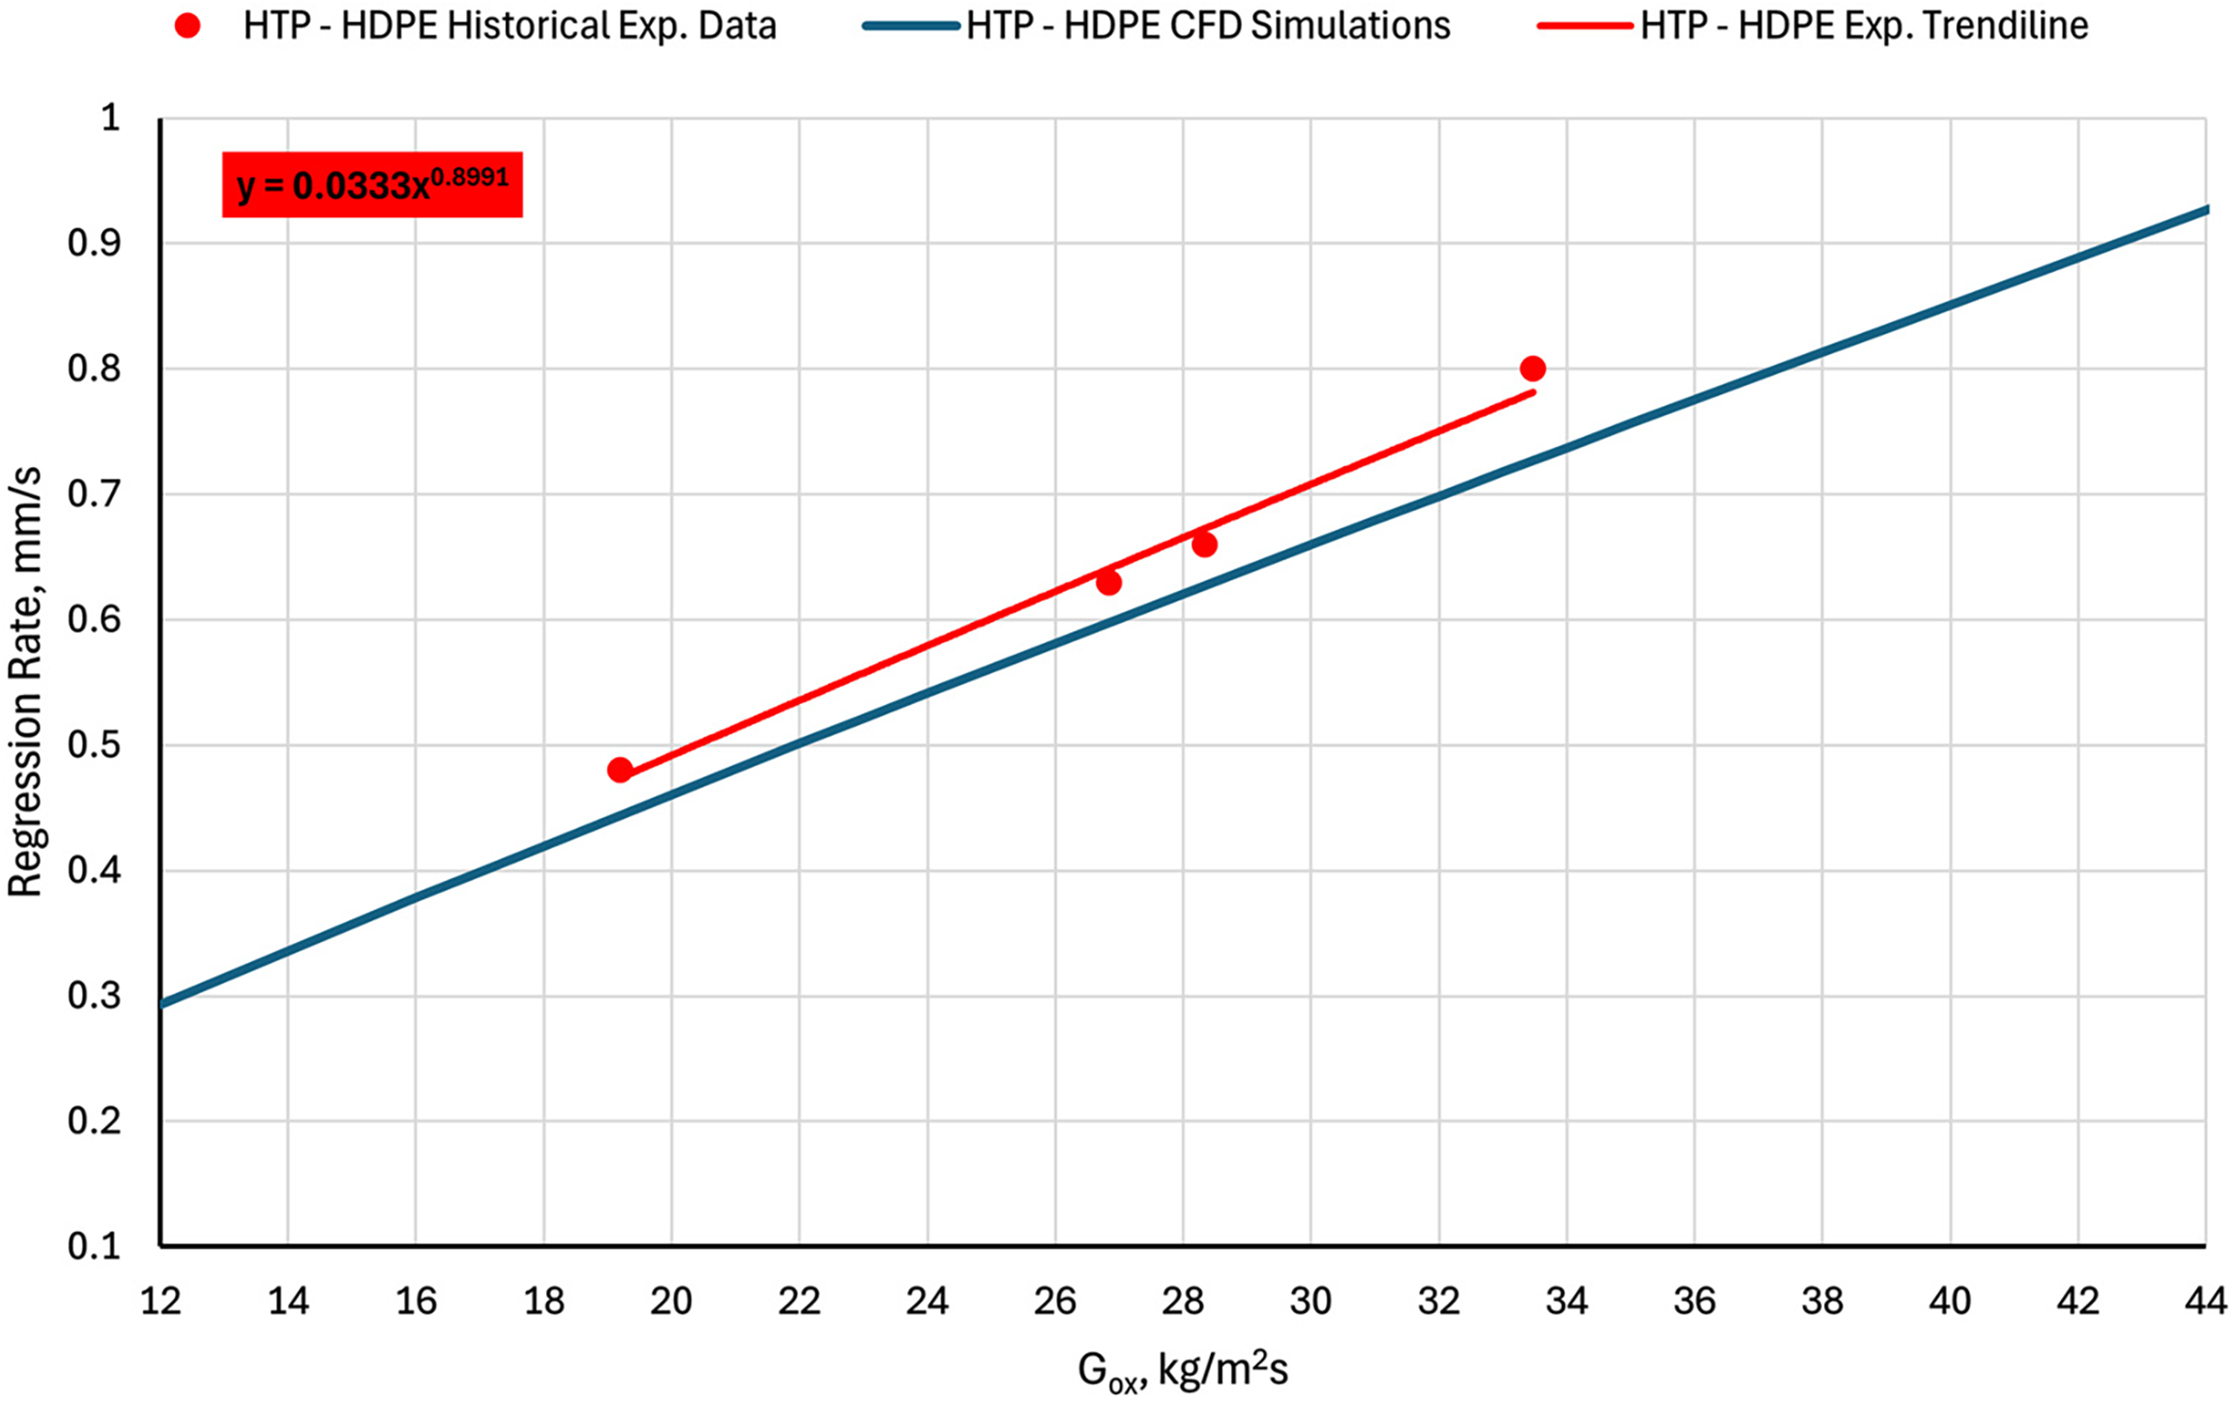
Figure 14: Numerical and experimental regression rates as a function of oxidizer mass flux for the previous engine configuration [17]. Reprinted from Reference [17]. 2024, the International Astronautical Federation (IAF)
The thermal behavior of the upgraded configuration was assessed by collecting temperature measurements via the three thermocouples mounted on the combustion chamber case. As an example, Fig. 15 plots the signals acquired during the experimental test with HDPE grain. The results obtained are fully comparable with those recorded in the ABS-like case, which will therefore not be shown for brevity’s sake. Temperatures were measured at three different locations on the stainless-steel case: the first thermocouple was placed near the pre-chamber, the second was located about halfway along the grain length, and the last was positioned in correspondence with the post-chamber. They are respectively named
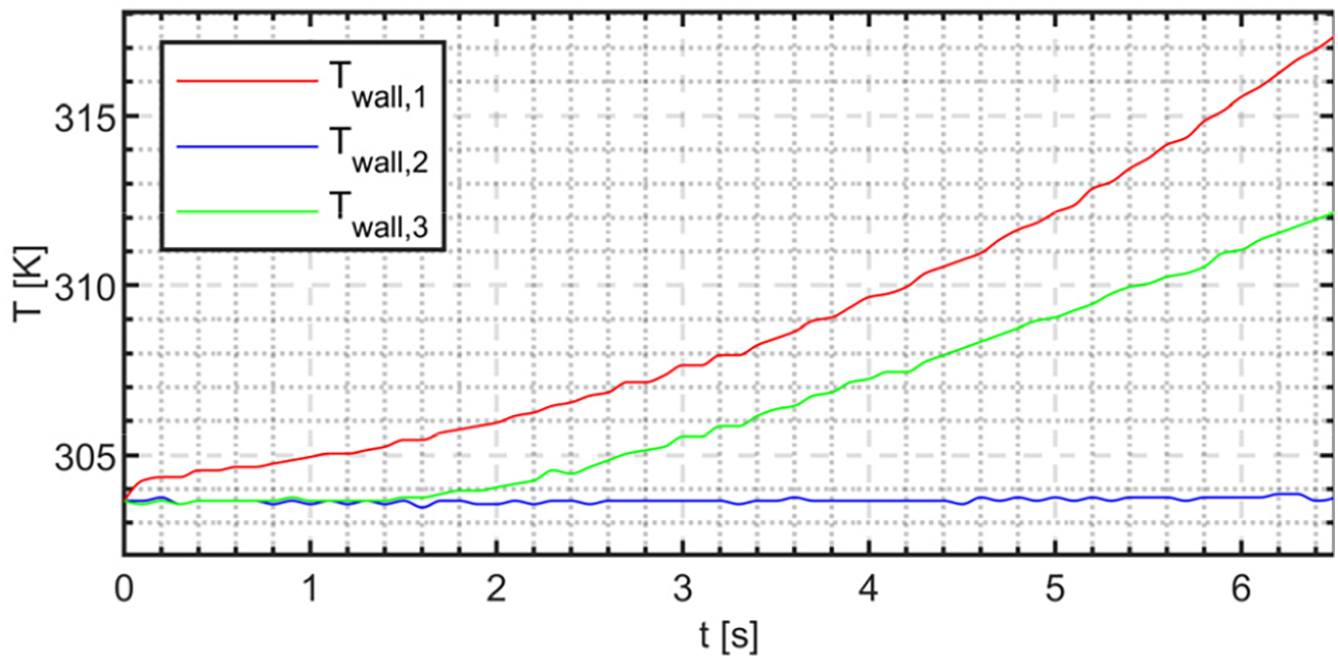
Figure 15: Temperature distribution recorded at three different locations during the HDPE-HTP (87.5%) firing test
5 CFD Analyses of Experimental Findings
The two experimental firing tests described in Section 4 provided important insights into peculiar behaviors exhibited during the combustion process. The objective is now to employ CFD simulations to achieve a dual purpose. Firstly, these simulations enable a comprehensive investigation into the internal ballistics of the thruster, thus aiding the analysis of the physical phenomena underlying off-nominal characteristics such as uneven regression rate distribution and axial grain consumption. Furthermore, the development of models capable of reproducing these behaviors could contribute to mitigating their impact during the design of future small-scale hybrid thrusters with similar configurations. Some limitations arise from the use of numerical analyses. The CFD model applied for the simulation of ABS test cases involves the exclusive use of butadiene, which is only one of the three monomers constituting the entire molecule. This is clearly an approximation, and consequently, the chemical characteristics are slightly different from the experimental case. With regard to the oxidizer, a complete decomposition of the hydrogen peroxide is assumed, which may not always be verified in practical tests. Another aspect to consider is the lack of coupling in the numerical model between axial and radial regression. Moreover, transient CFD simulations do not manage to reproduce unsteady phenomena, which may play a significant role in the ignition phase. The grain heating before ignition and the consequent softening of the material are other features that are not faithfully reproduced and can have a non-negligible impact on performance. All these aspects were taken into account when analyzing the results of the numerical simulations. Despite the inherent limitations of the model, this chapter will show that the results obtained are an effective approximation of the real case, providing important insights into the physical processes at work during the firing tests and their consequences.
5.1 Comparison between Experimental Data and CFD Simulation Results
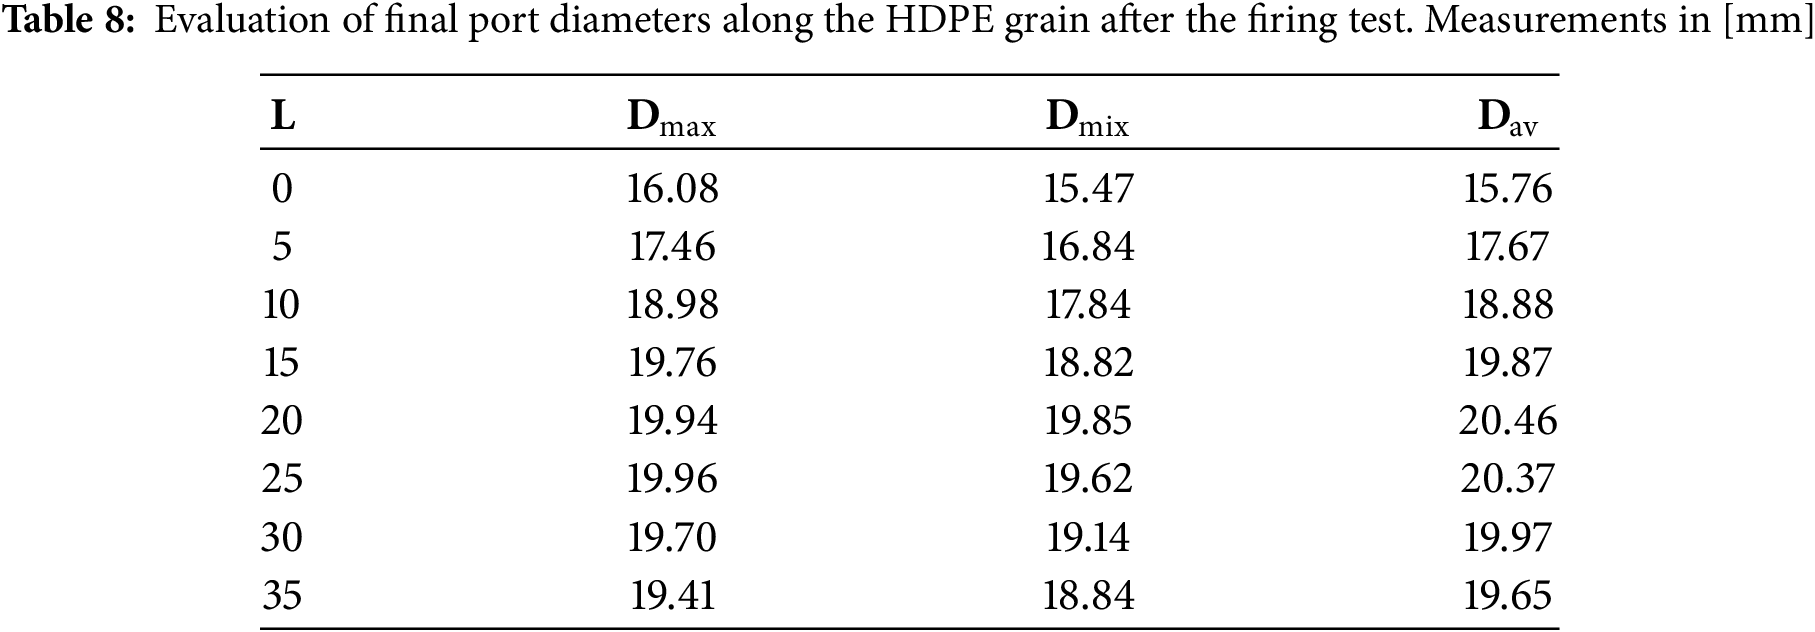
The first step of the numerical investigation was performed through transient CFD simulations. Following the methodology shown in Section 3.5, an assessment of the thruster internal ballistic was realized at different time instants, with a timestep of 1 s. The results are presented in Sections 5.1 and 5.2, where they will be discussed in detail. To assess the ability of reproducing numerically the experimental distribution of port diameters along the grain, a direct comparison of the two quantities of interest is given in Fig. 16, where results of the HDPE firing test and the corresponding numerical analyses are reported.
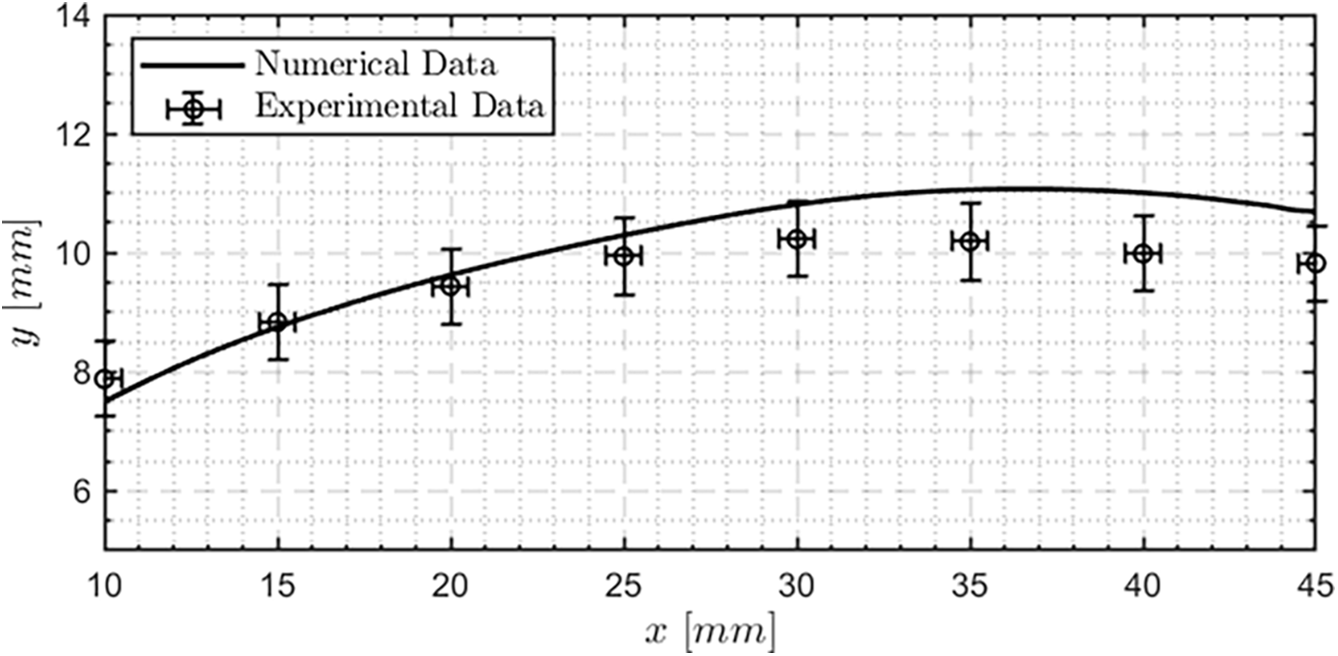
Figure 16: Comparison of port radius distribution along the grain between CFD simulations and experimental results for the HDPE test case. The x-coordinate represents the distance from the injector, which is separated from the grain by a 10 mm long pre-chamber
The black line represents the predicted grain configuration at the end of a 6.5 s firing test, as computed by transient CFD analyses. Experimental data are reported as points whose position depended on the average experimental value measured at each station, as listed in Table 8. Each point is provided with error bars for both x- and y-coordinates. Uncertainties in the x-direction are due to potential inaccuracies in the positioning of measurement stations, estimated as
5.2 Numerical Analysis of the HDPE Firing Test
So far, transient CFD models have shown a reasonable degree of reliability when employed as numerical simulation tools for reproducing peculiar experimental findings. Once their effectiveness was established, they could be exploited to investigate in detail the physical phenomena that cause unexpected behaviors, such as uneven regression rate distribution and axial grain consumption. The HDPE test case was studied through a sequence of stationary numerical simulations employing the grain geometry update technique reported in Section 3.5. The results obtained for each 1-s timestep are summarised in Fig. 17, where temperature contours in the thruster combustion chamber and flow streamlines are shown. Additional information regarding the temporal evolution of grain port diameter and
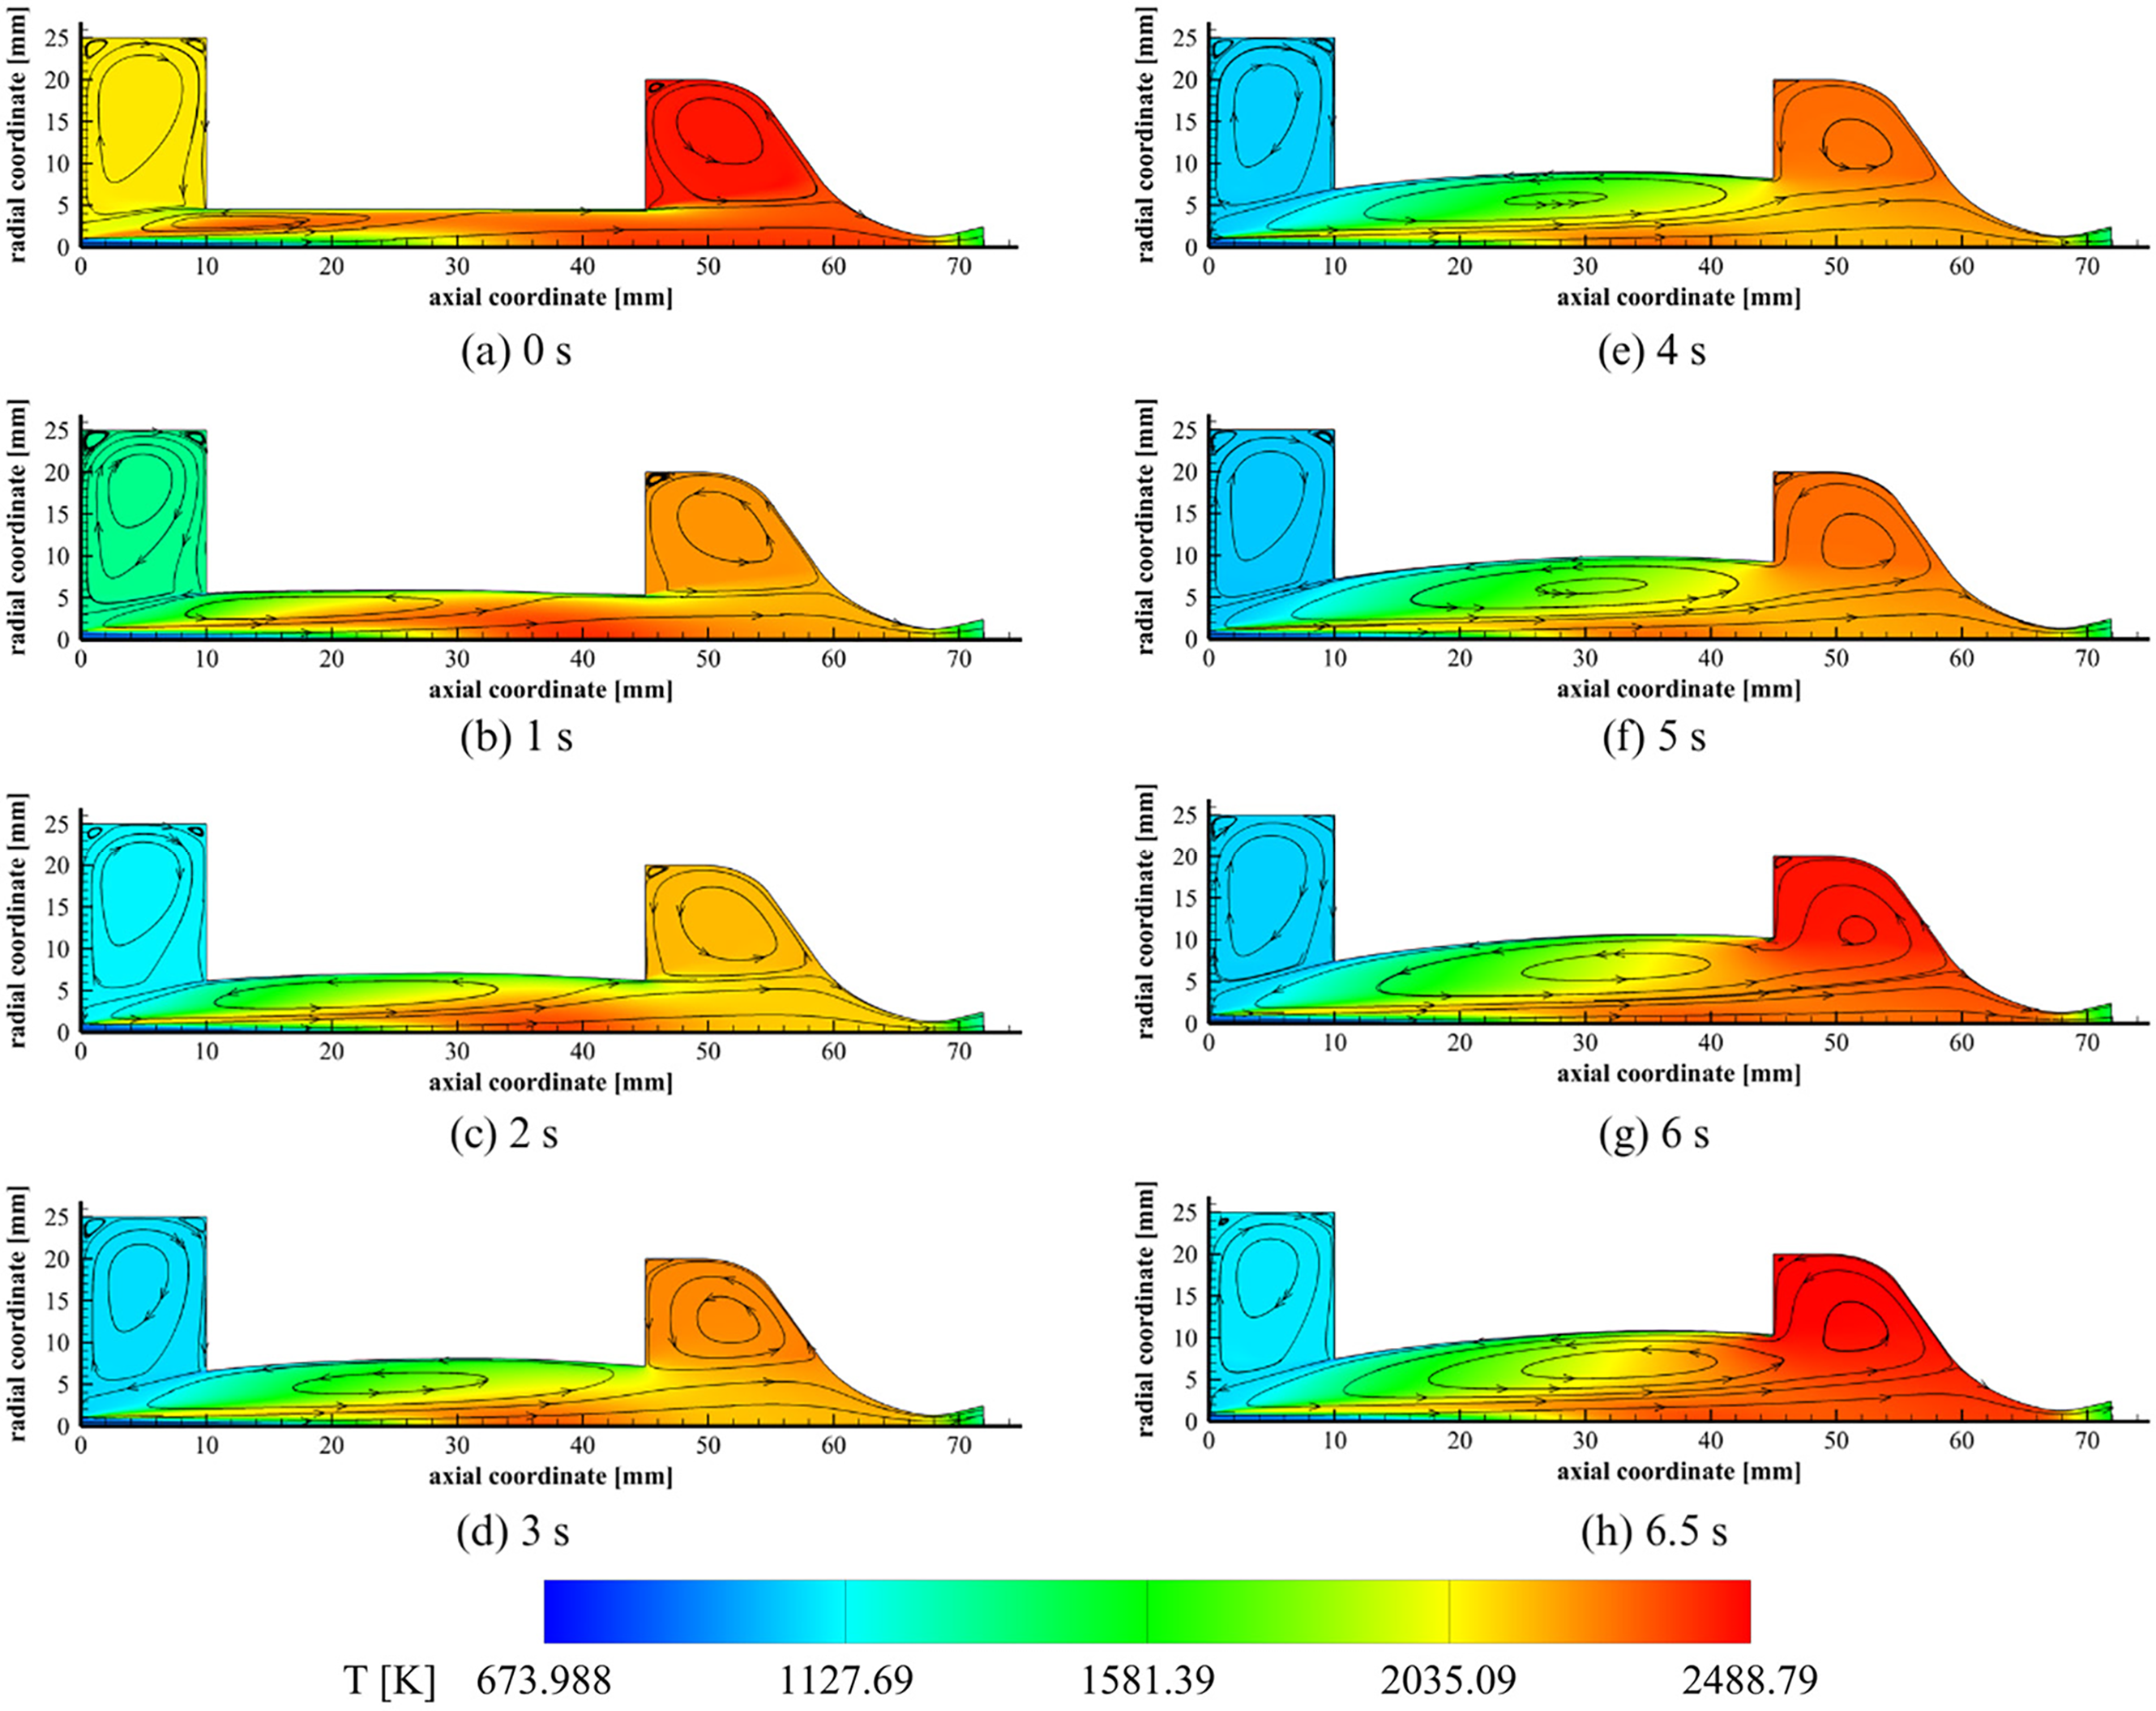
Figure 17: Evolution in time of temperature contours and streamlines of the HDPE firing test exploiting transient CFD simulations
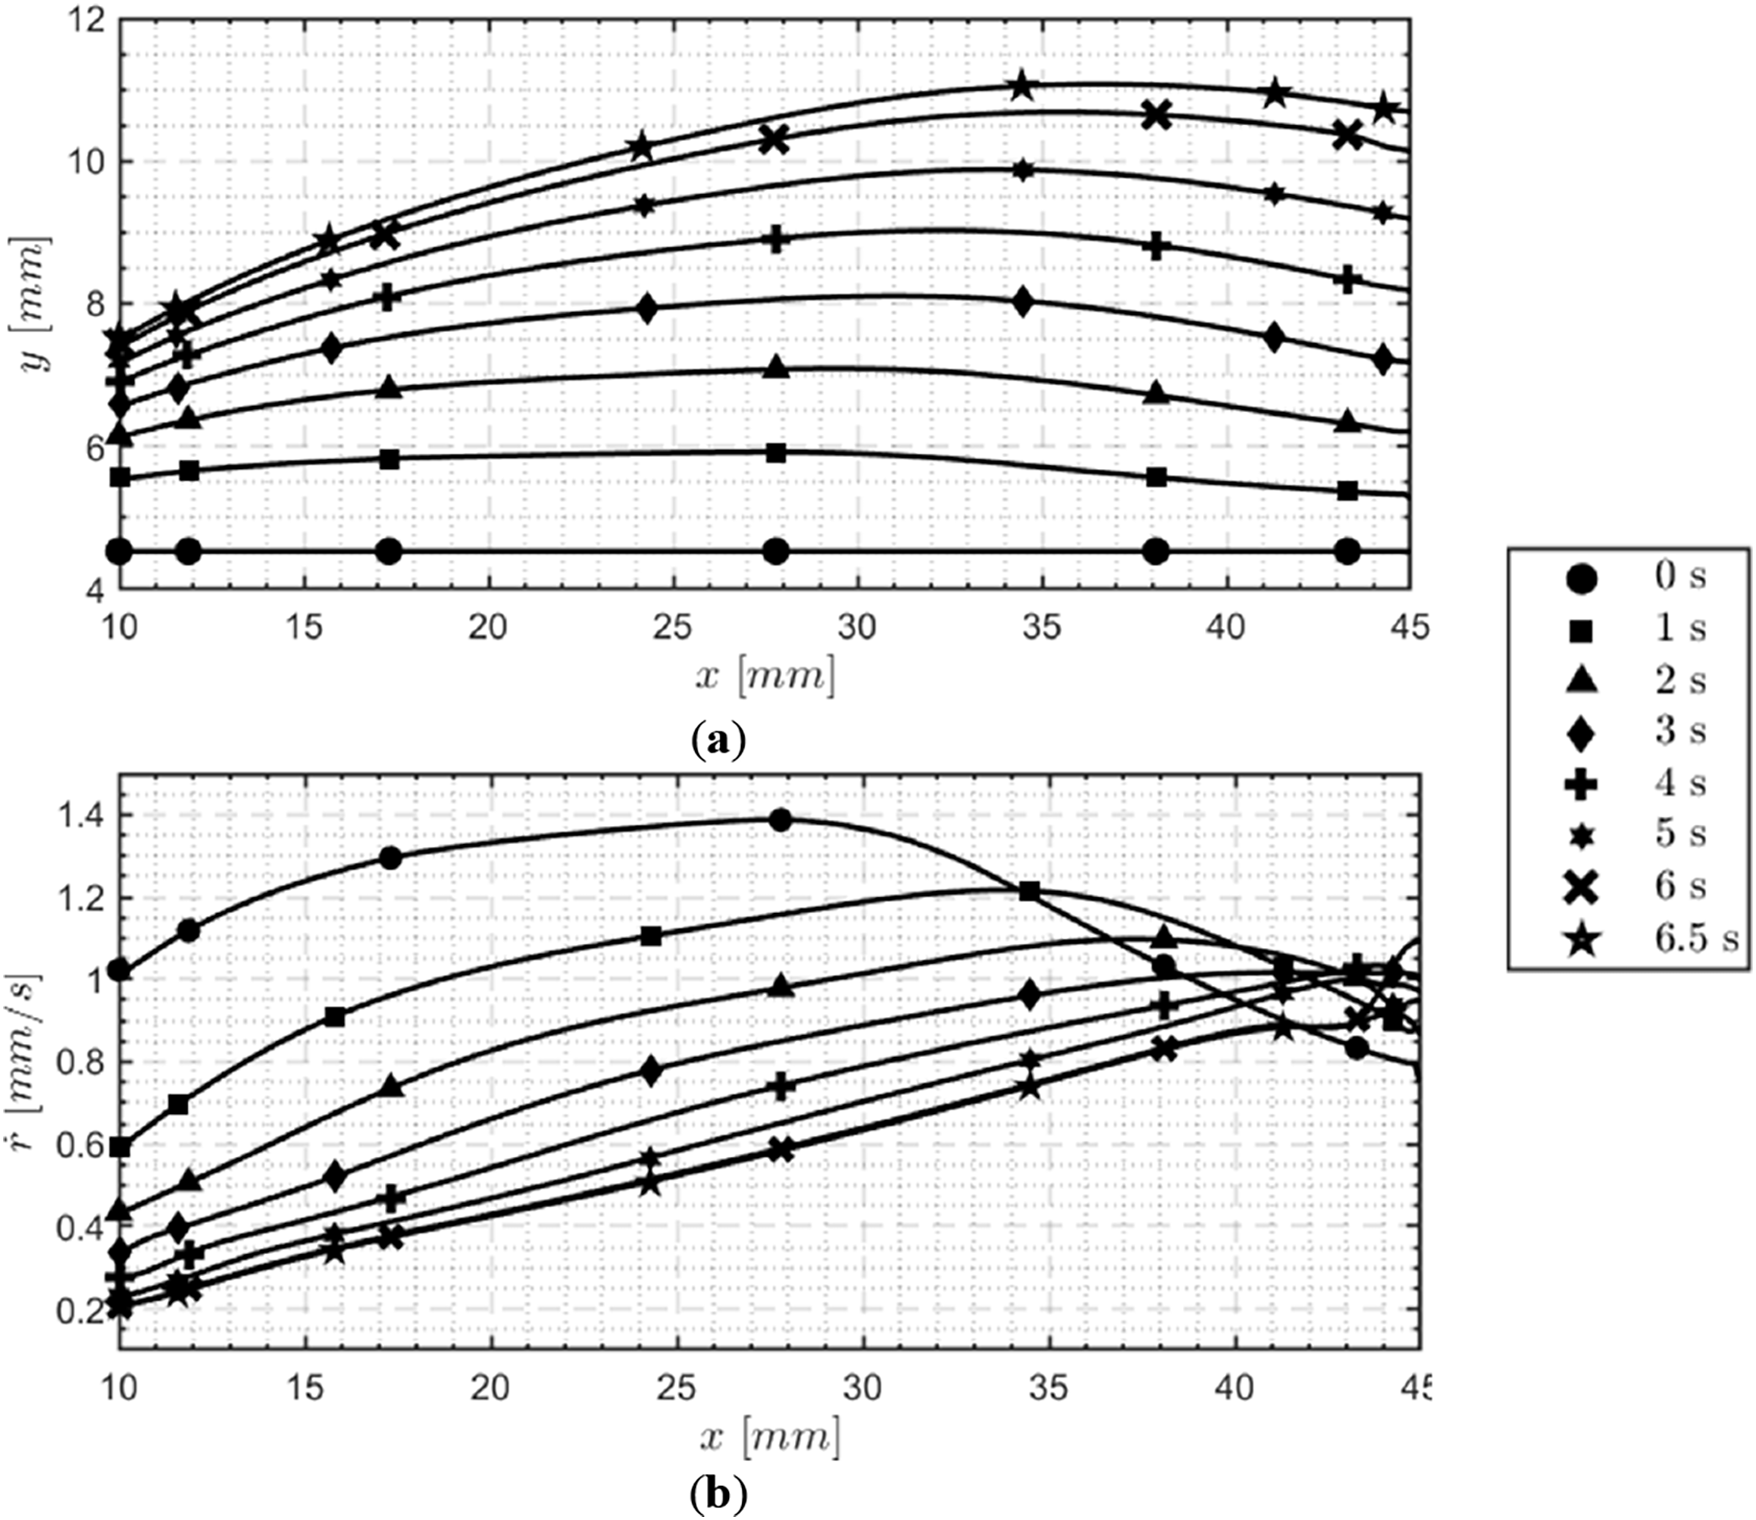
Figure 18: Simulation of the temporal evolution of grain port diameters (a) and local regression rates (b) during the HDPE firing test
From the combined analysis of the simulation data collected, some interesting fluid-dynamic aspects could be examined. At
Fig. 17 exhibits another interesting fluid dynamics feature of the thruster. The temperature distribution within the combustion chamber evolves significantly during the burning time. At the beginning of the simulated firing test, a high-temperature zone develops not only along the grain surface but also in the post-chamber. This phenomenon can be explained by the elevated regression rate observed for t = 0 s, as illustrated in Fig. 18, which is caused by the high instantaneous value of
To complement these analyses, Fig. 19 reports the oxidizer-to-fuel ratio computed through CFD transient simulations at different time steps during the burning time. Starting from a value of 6.4, the space-averaged numerical O/F decreases rapidly in the first 2 s as an effect of the relatively high regression rates. The progressive
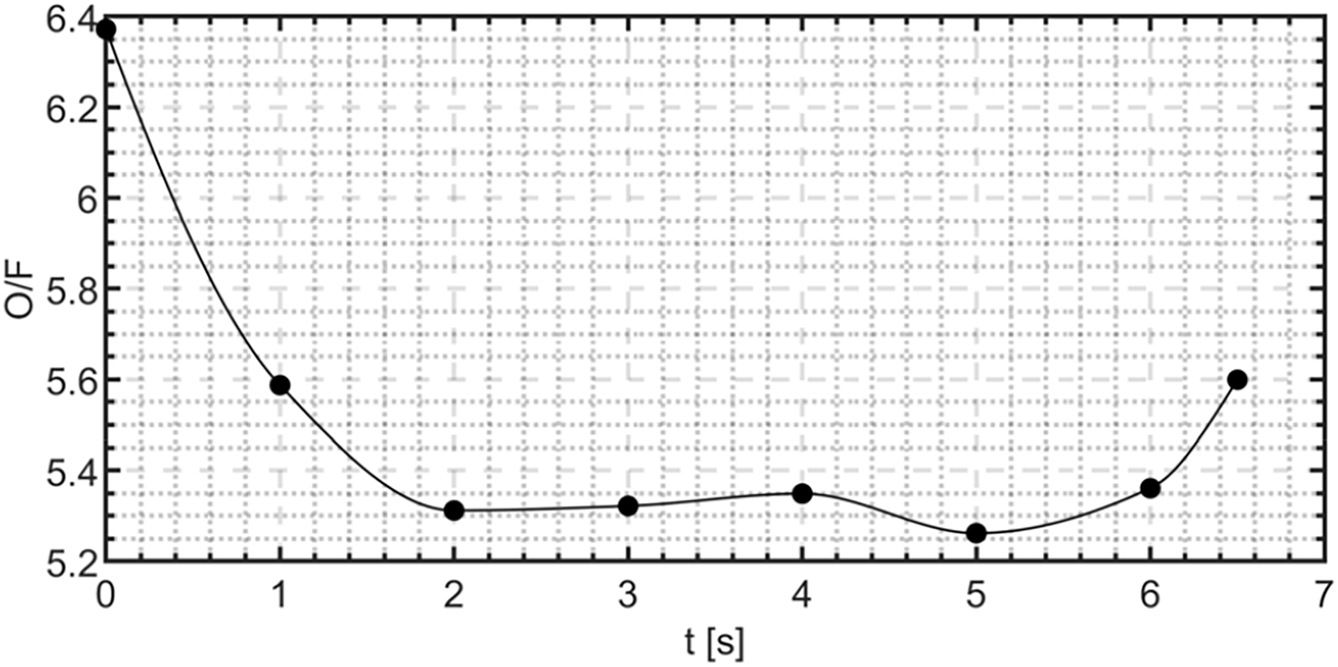
Figure 19: Average oxidizer-to-fuel ratio computed through numerical simulations as a function of time. HDPE test case
The thruster internal ballistic, detailed in Fig. 17, can also be interpreted in light of two further propulsive parameters: the characteristic velocity
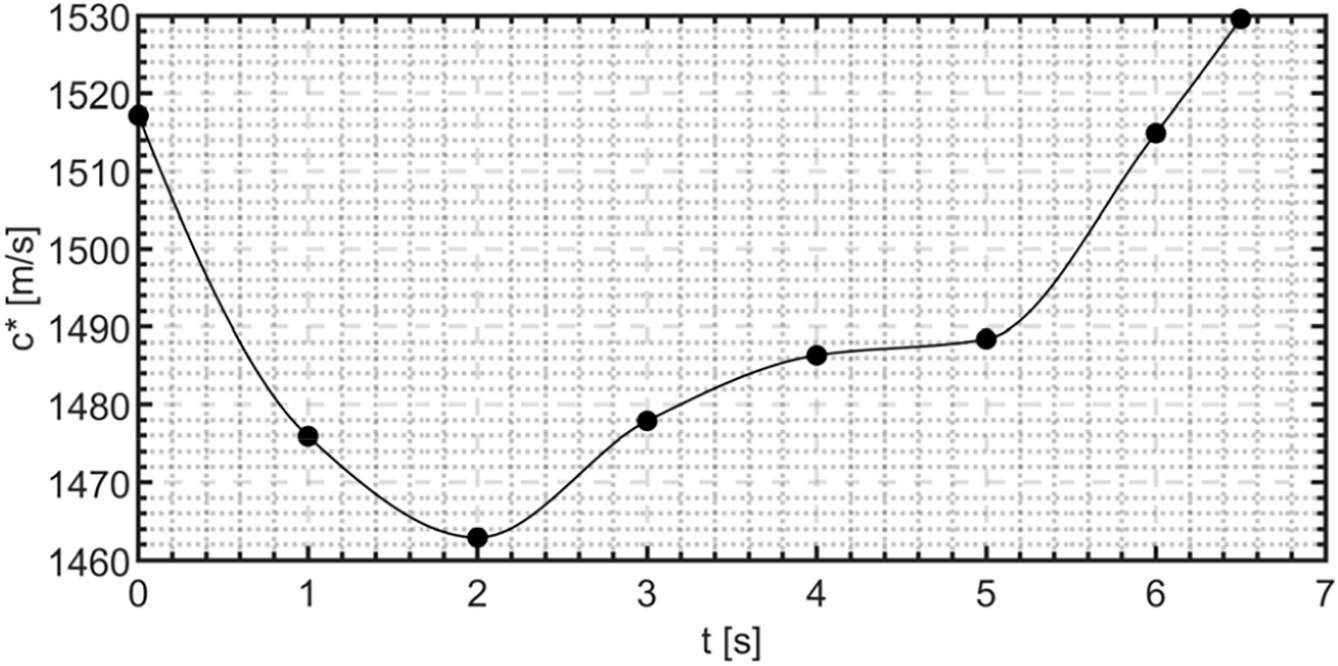
Figure 20: Characteristic velocity as a function of time, as estimated through transient CFD simulations. HDPE test case
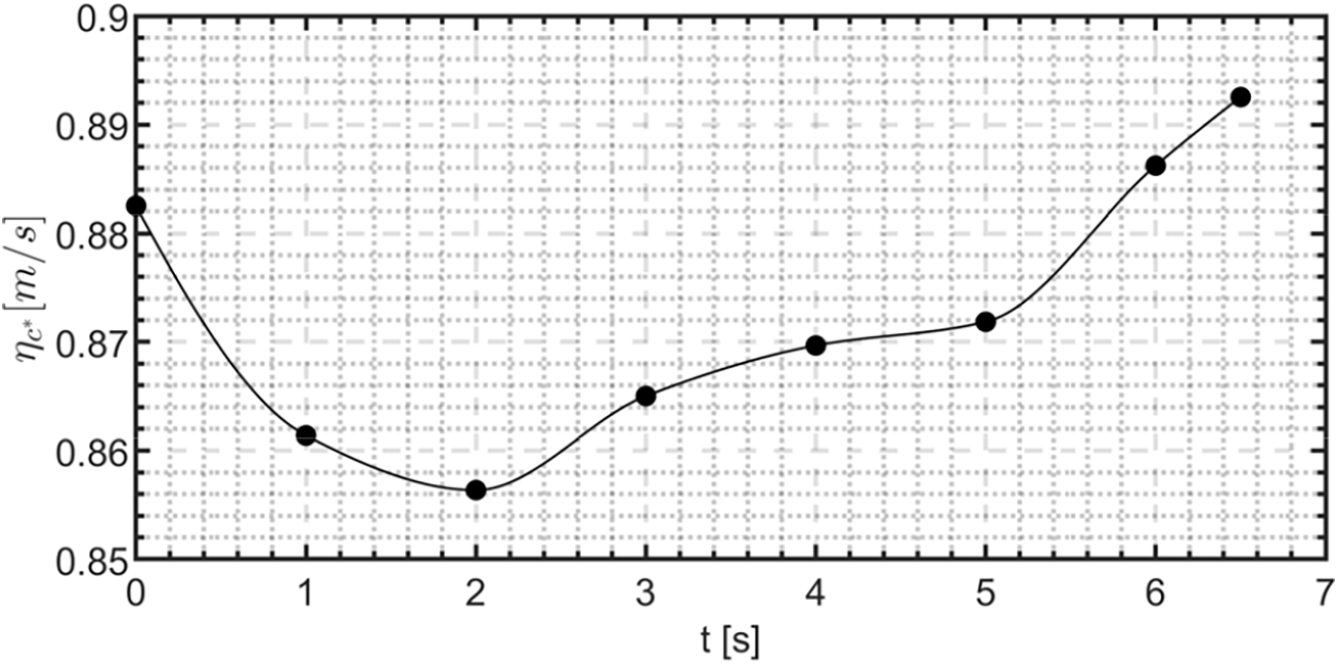
Figure 21: Numerical estimation of the engine combustion efficiency for the HDPE test case
The
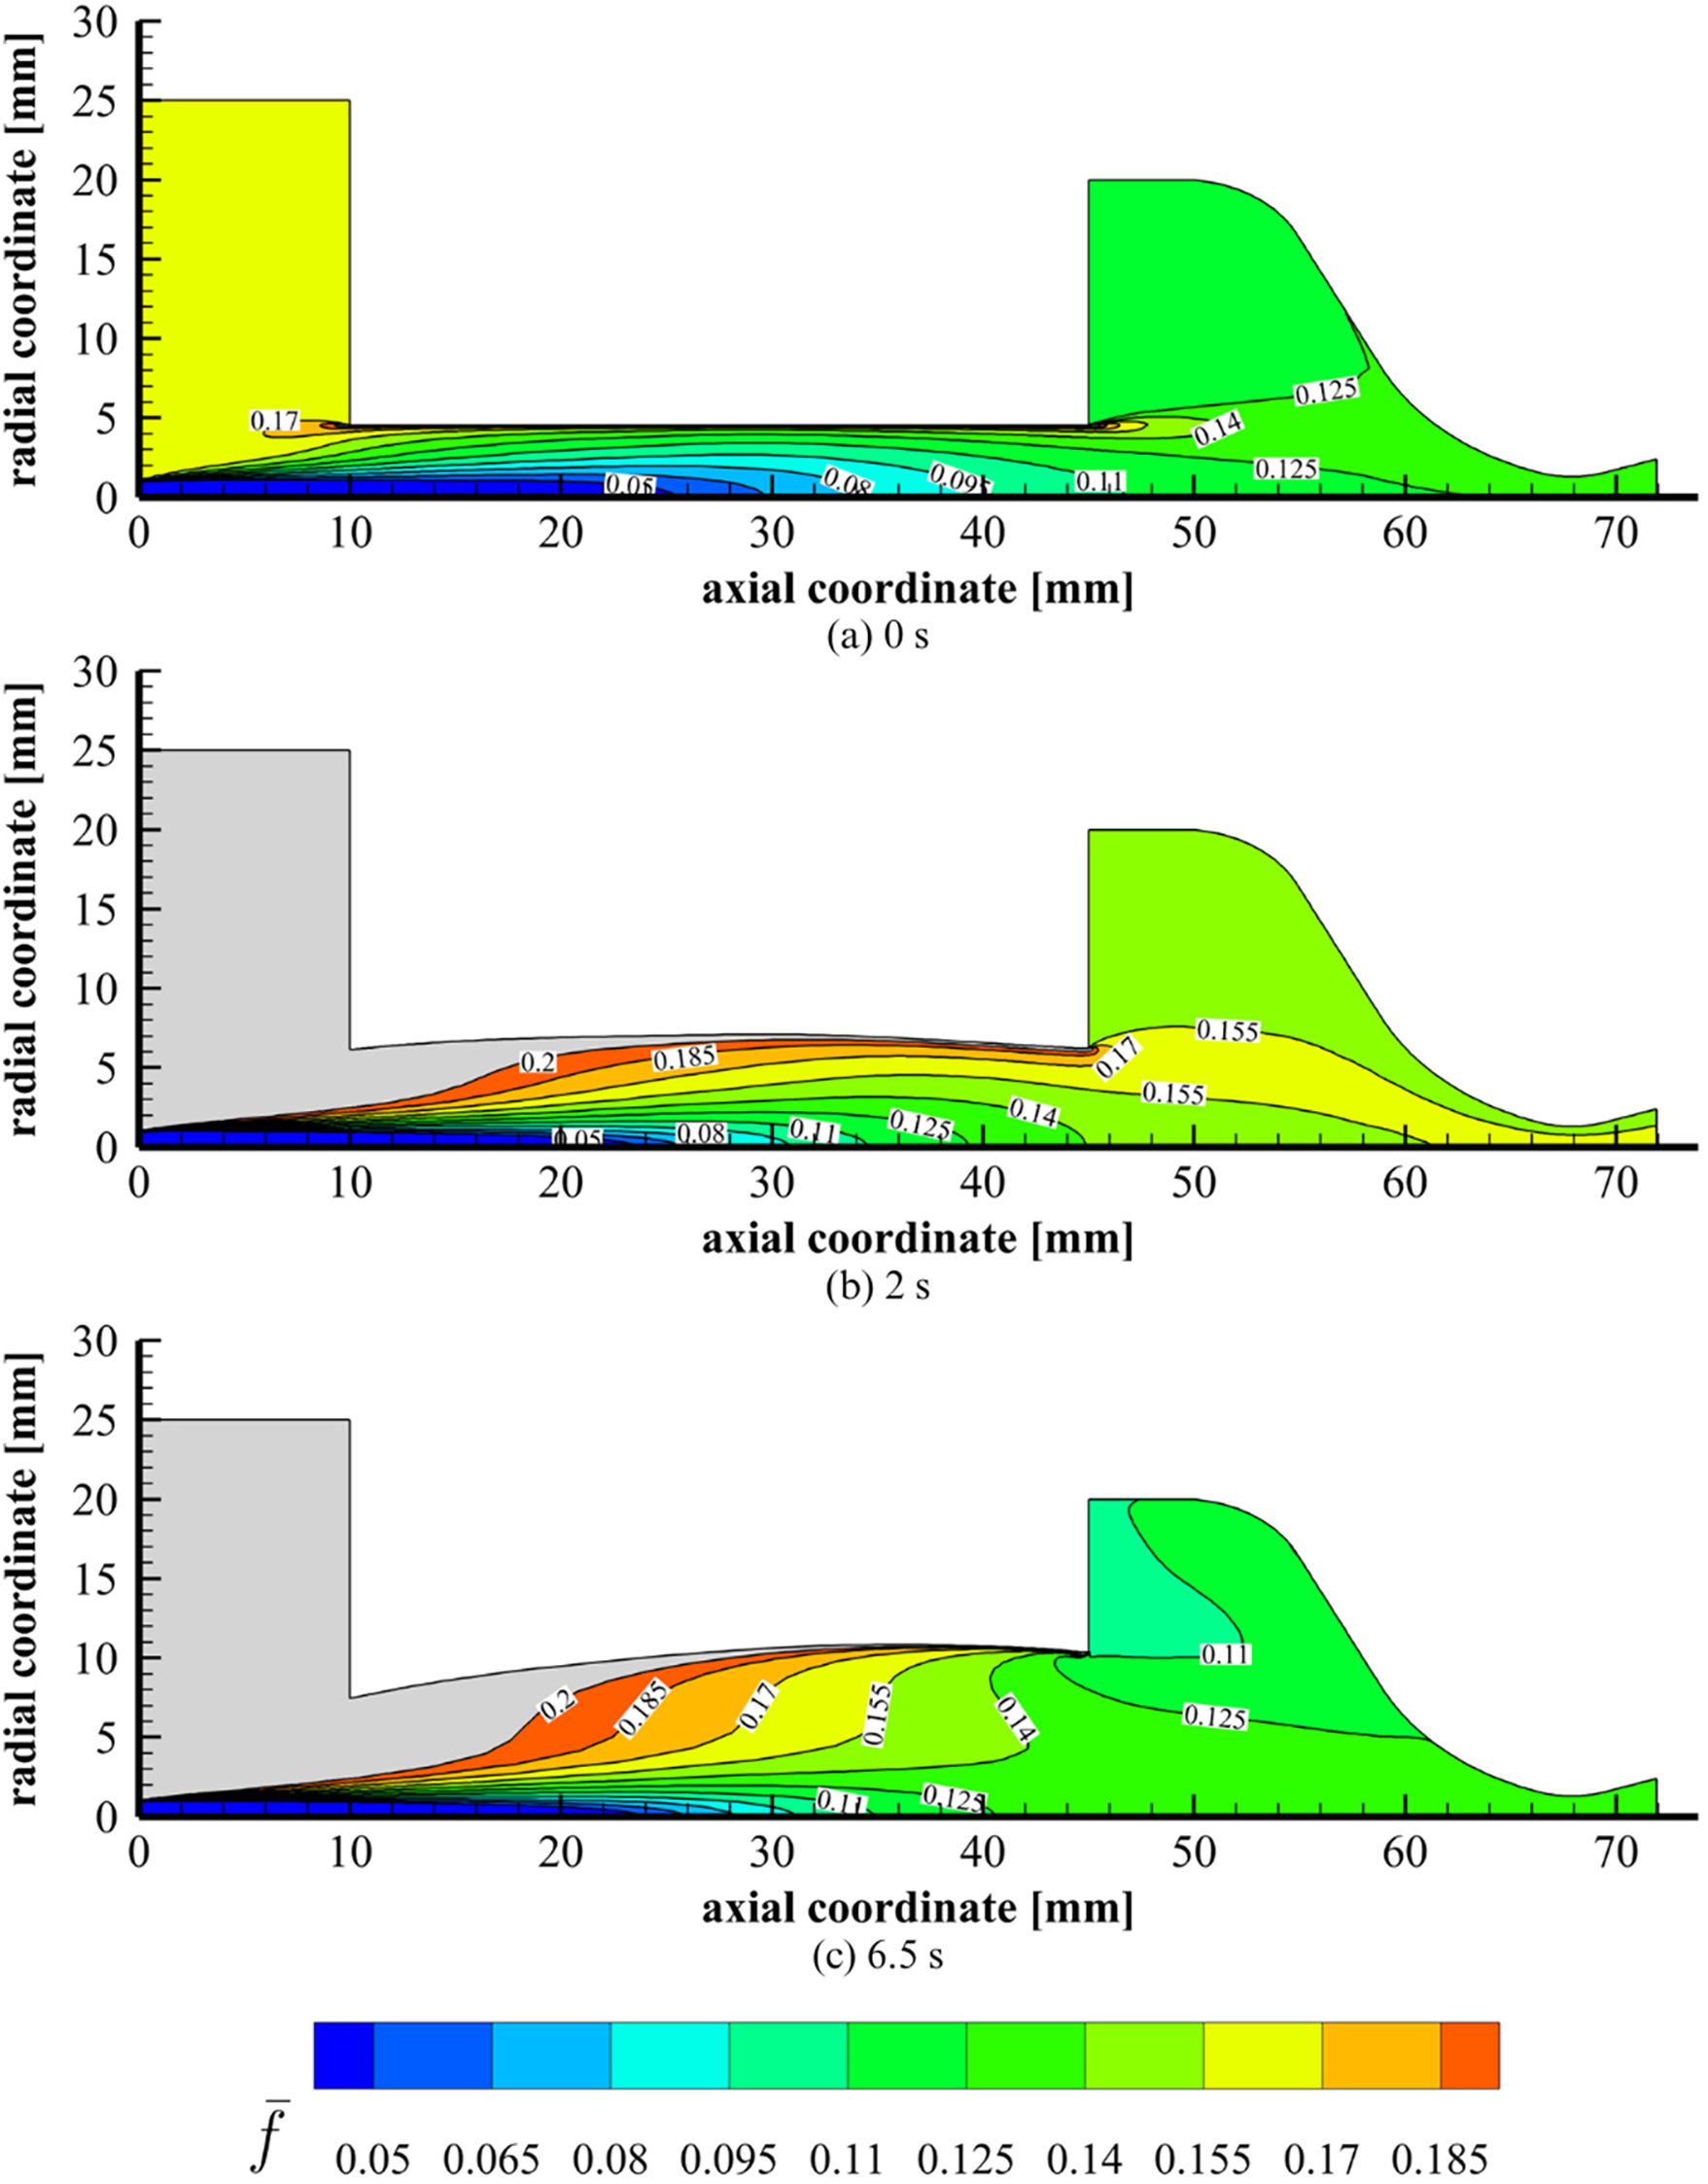
Figure 22: Mean mixture fraction contours in the hybrid rocket thrust chamber at t = 0 s (a), t = 2 s (b) and t = 6.5 s (c). Isolines are labelled with their numerical values. HDPE test case
Coupling oxidiser-to-fuel ratios and
As anticipated, the last step of the present analyses involved the study of combustion efficiency, defined as in Eq. (17). In order to compute that, the theoretical characteristic velocity was evaluated through NASA’s CEA software, using as input the CFD chamber pressure at the given time instant, the O/F estimation and the propellant pair properties, considering HDPE and 87.5% HTP. The result is presented in Fig. 21.
From a comparison between Figs. 20 and 21, it is possible to state that the behavior of the combustion efficiency is dominated by the variations in terms of
The set of data described in this section is helpful in obtaining a complete fluid-dynamic characterization of the engine, which can support the design of future propulsion systems belonging to this category. The numerical CFD modeling employed enables the estimation of important performance parameters (such as O/F,
5.3 Numerical Analysis of the ABS-Like Firing Test
Transient CFD simulations were employed to investigate the evolution of the thruster internal ballistic during the ABS-like firing test, following the approach adopted for the HDPE test case described in Section 5.2. To properly model the axial regression mechanism whose effects were detected experimentally, the boundary condition applied to the surface adjacent to the post-chamber (namely Wall Post-Chamber 1, as in Fig. 8) was modified, enabling an axial fuel consumption typically neglected. Results are summarized in Figs. 23 and 24.
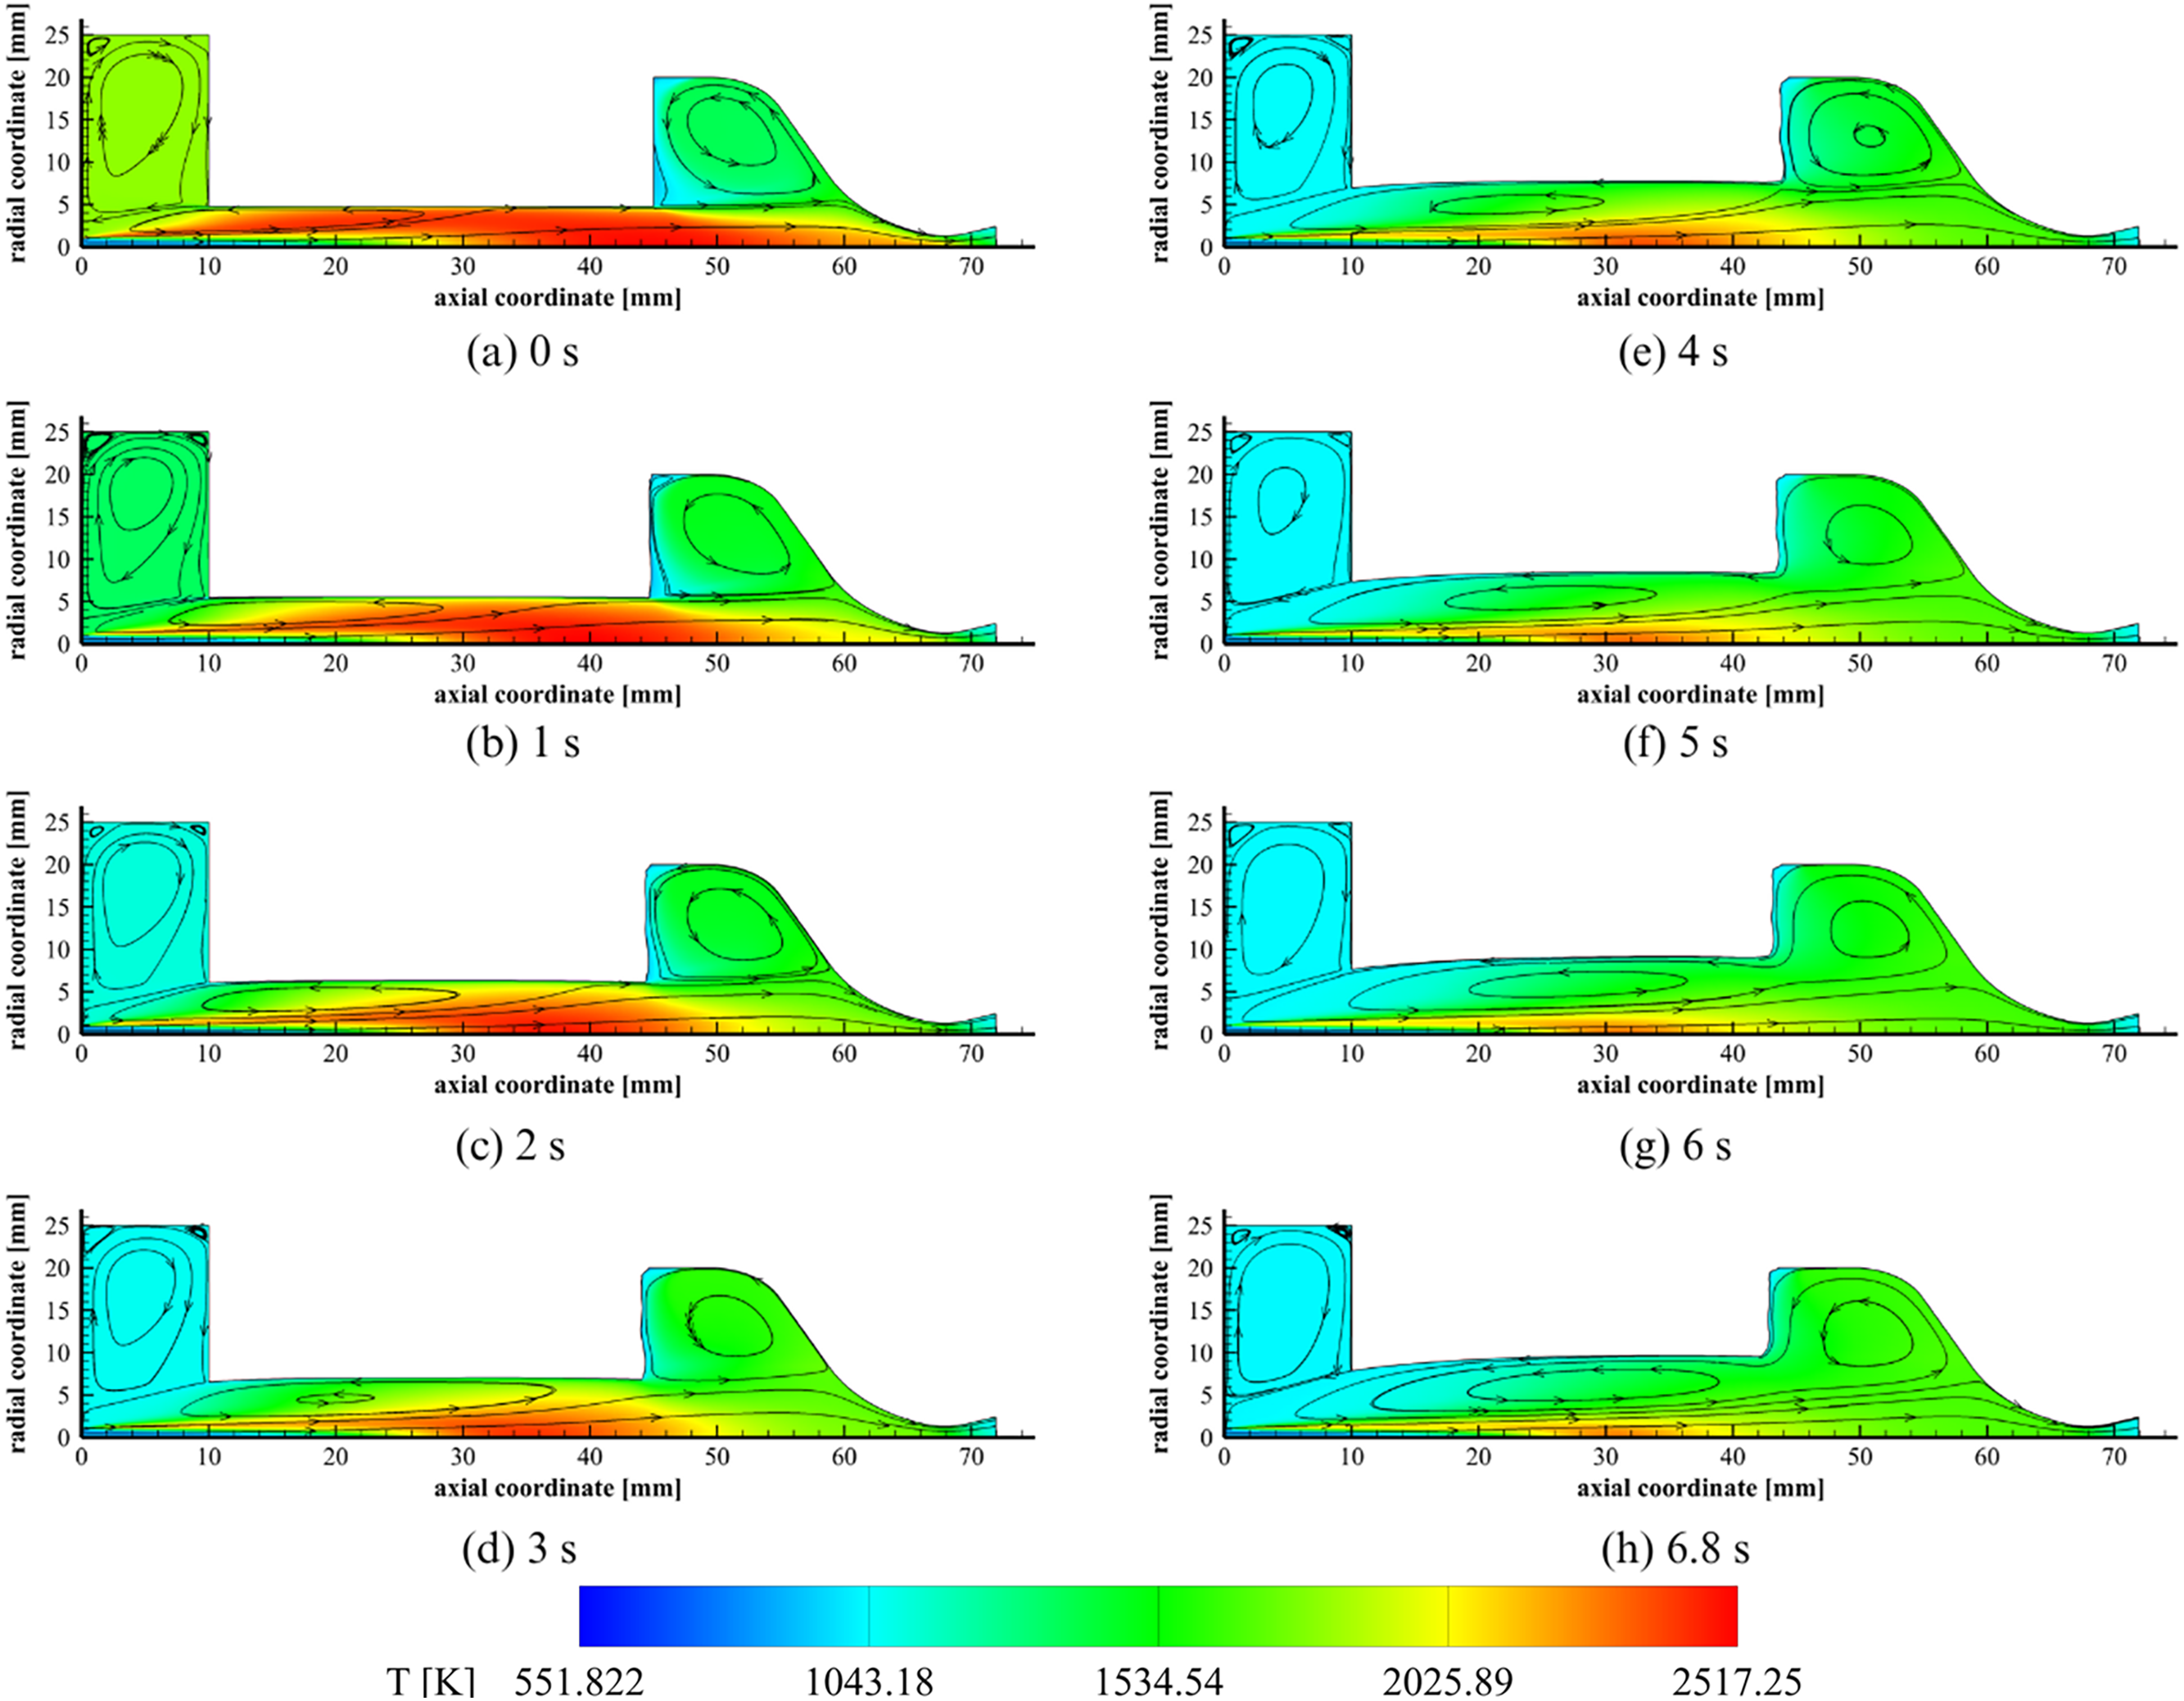
Figure 23: Evolution in time of temperature contours and streamlines of the ABS-like firing test exploiting transient CFD simulations
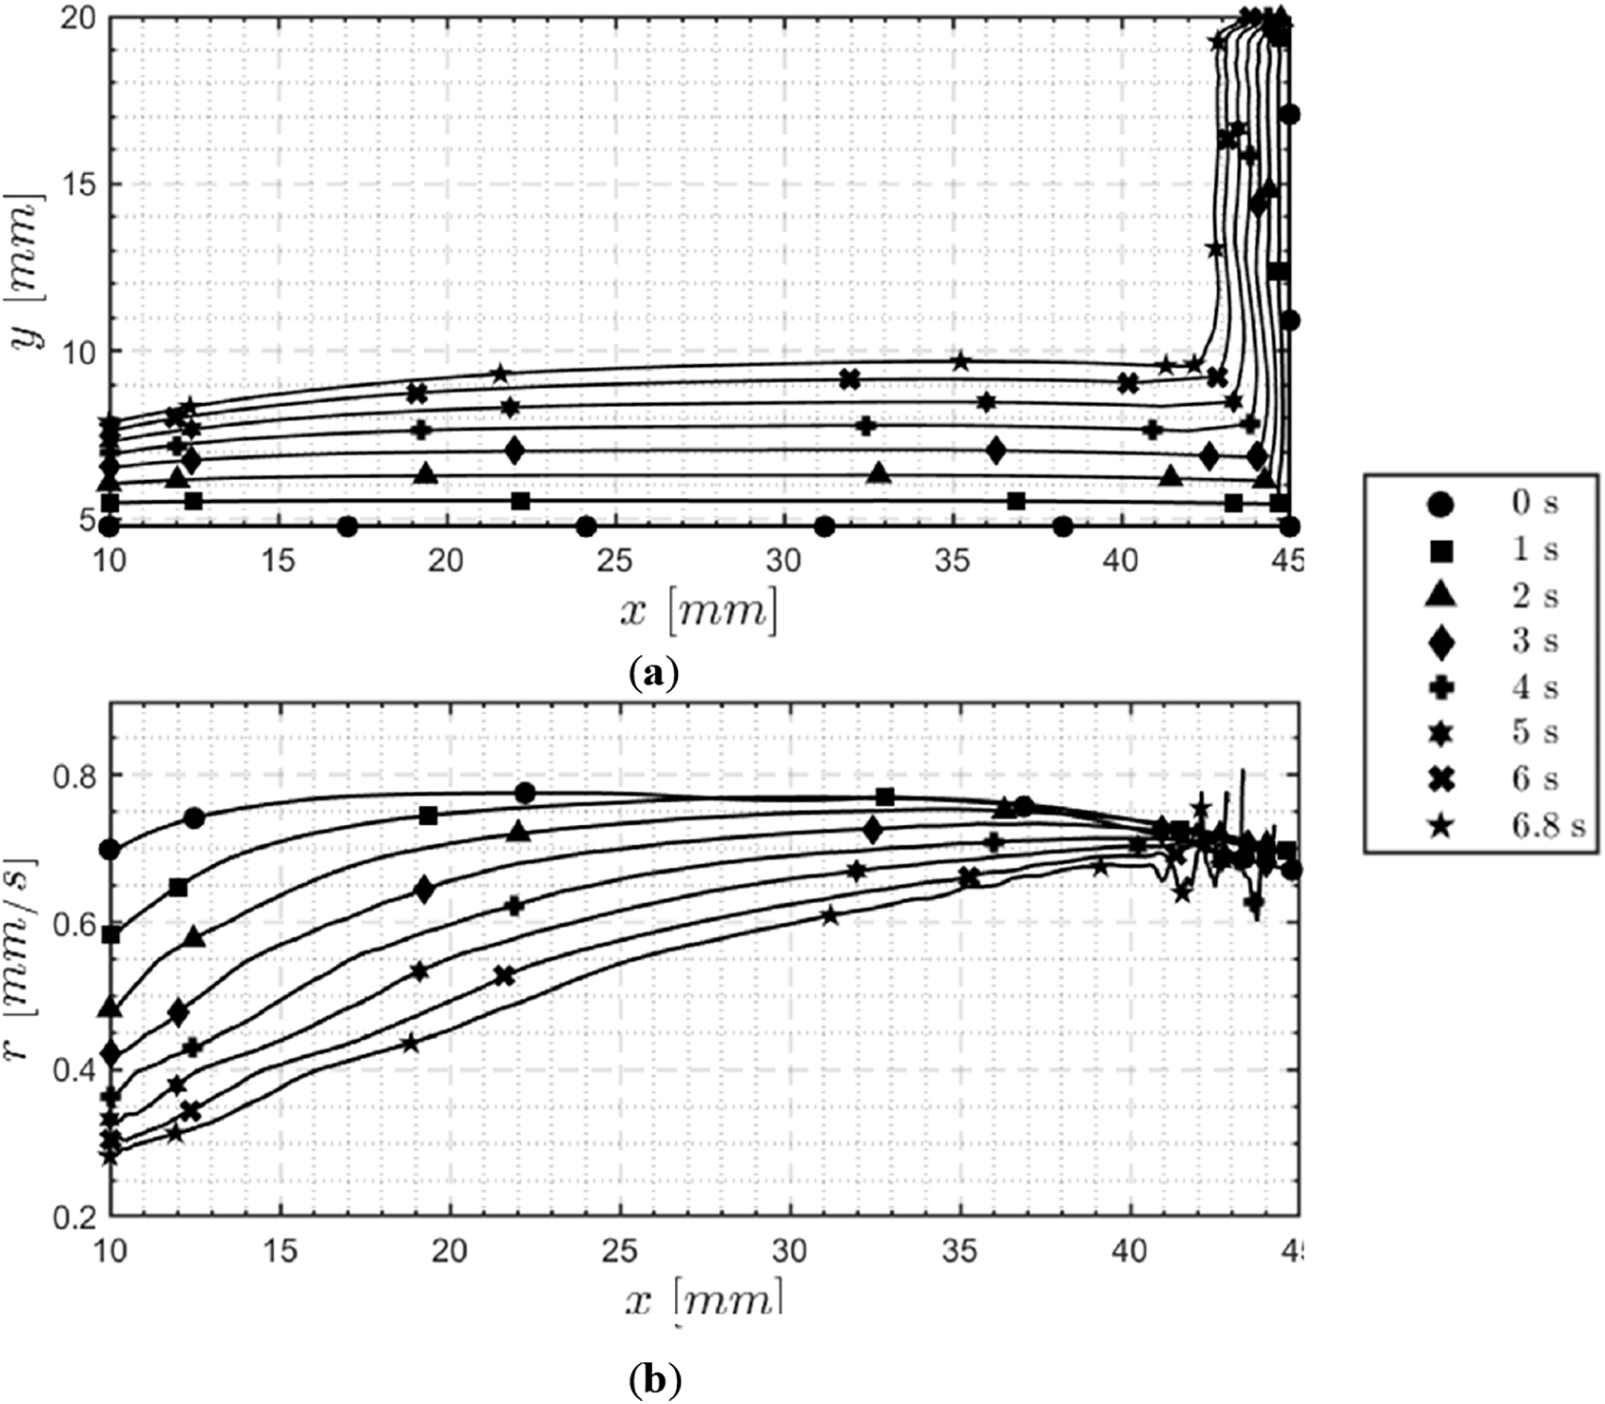
Figure 24: Simulation of the temporal evolution of grain port diameters (a) and local regression rates (b) during the ABS-like firing test
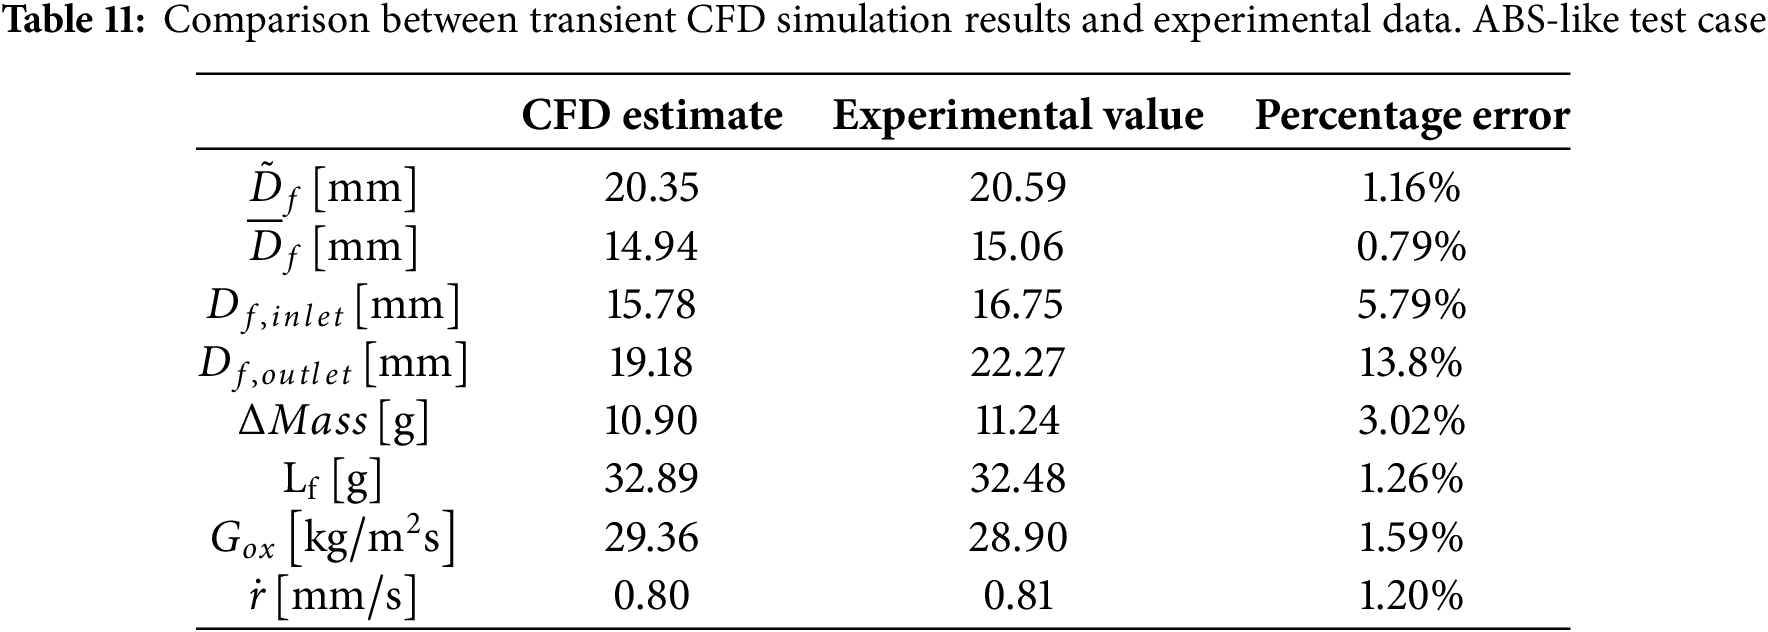
The temporal evolution of the thruster’s internal ballistic for the ABS-like test case mainly overlaps with the HDPE numerical investigations described in Section 5.2. The grain recirculation zone, which is initially established next to the inlet section (Fig. 23a), develops over time increasing in size and moving towards the outlet (Fig. 23b–d). After 4 s, it merges with the recirculation zone in the post-chamber, strongly altering the combustion chamber fluid dynamics field. The regression rate along the grain shows a decreasing trend during the simulated firing test, with its maximum shifting towards the outlet as time increases. The additional turbulence acting in sections close to the nozzle implies a local increase in radial consumption. In addition to this, the fuel grain undergoes progressive axial regression, with a longitudinal grain consumption of 2.52 mm. As reported in Table 11, the final length estimated by CFD transient simulations matches the experimental measurement with an error of 1.26%. The estimates in terms of mass consumption, regression rate,
An additional insight attained through CFD transient simulation for the ABS-like test case concerns the temperature distributions within the mini-thruster combustion chamber. As shown in Fig. 23a, the high-temperature zone is initially extended over the entire grain length of the grain. In the final phase of the firing test, the regions exhibiting temperatures close to 2500 K become almost absent, with a prevalence of values around 2000 K near the longitudinal axis (Fig. 23f–h). The temporal evolution of the temperature distribution results as rather different in the firing test with ABS-like when compared to what has already been discussed for HDPE. To properly understand the physical phenomena causing these different behaviors, an analysis of O/F,
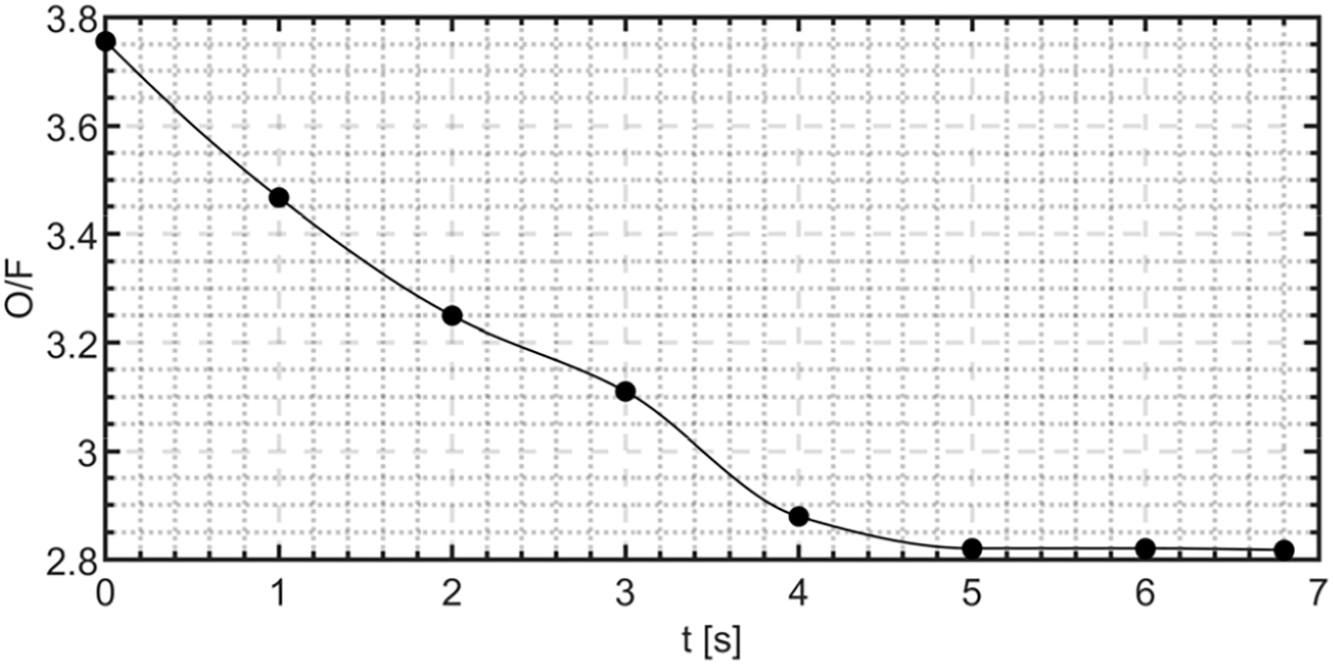
Figure 25: Average oxidizer-to-fuel ratio computed through numerical simulations as a function of time. ABS-like test case
As an effect of the progressive O/F shift towards reducing values, the less effective combustion causes a decreasing trend of the characteristic velocity with small fluctuations, as represented in Fig. 26. In contrast to the observations made in Section 5.2, the merging of the recirculation zones does not result in a substantial alteration of the mixing process. A mean mixture fraction analysis was conducted at different time instants to investigate this behavior. Fig. 27 represents the
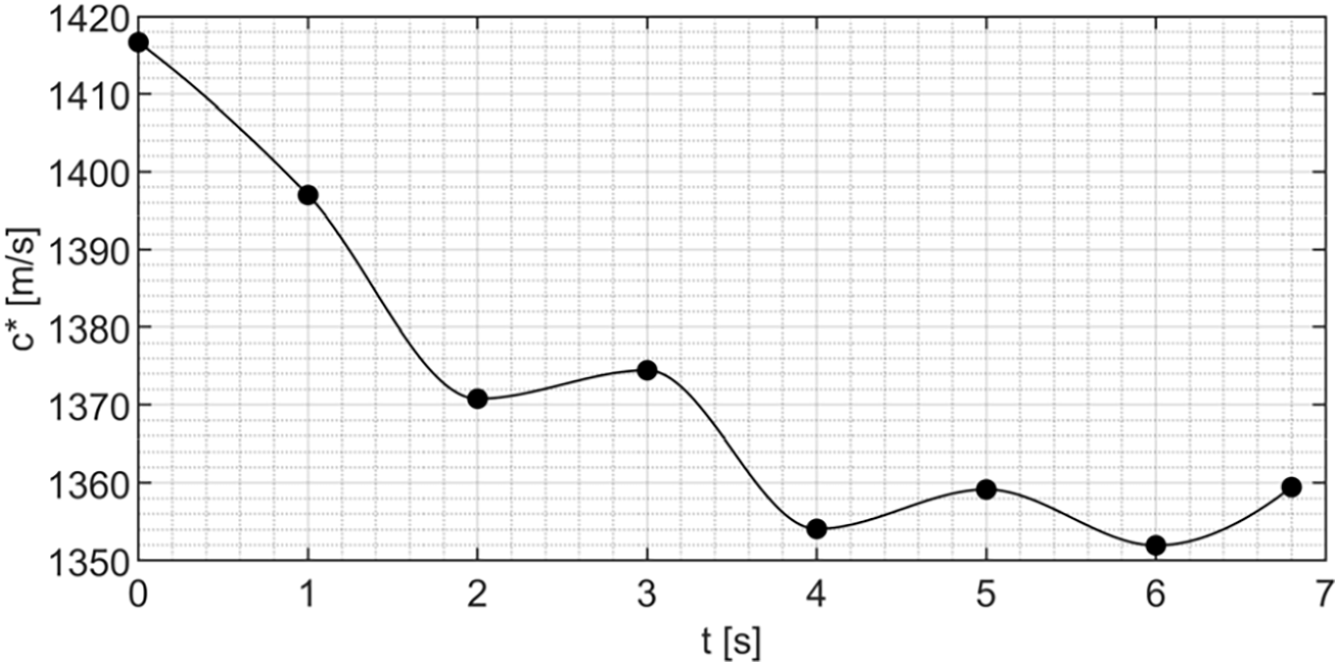
Figure 26: Characteristic velocity as a function of time, as estimated through transient CFD simulations. ABS-like test case
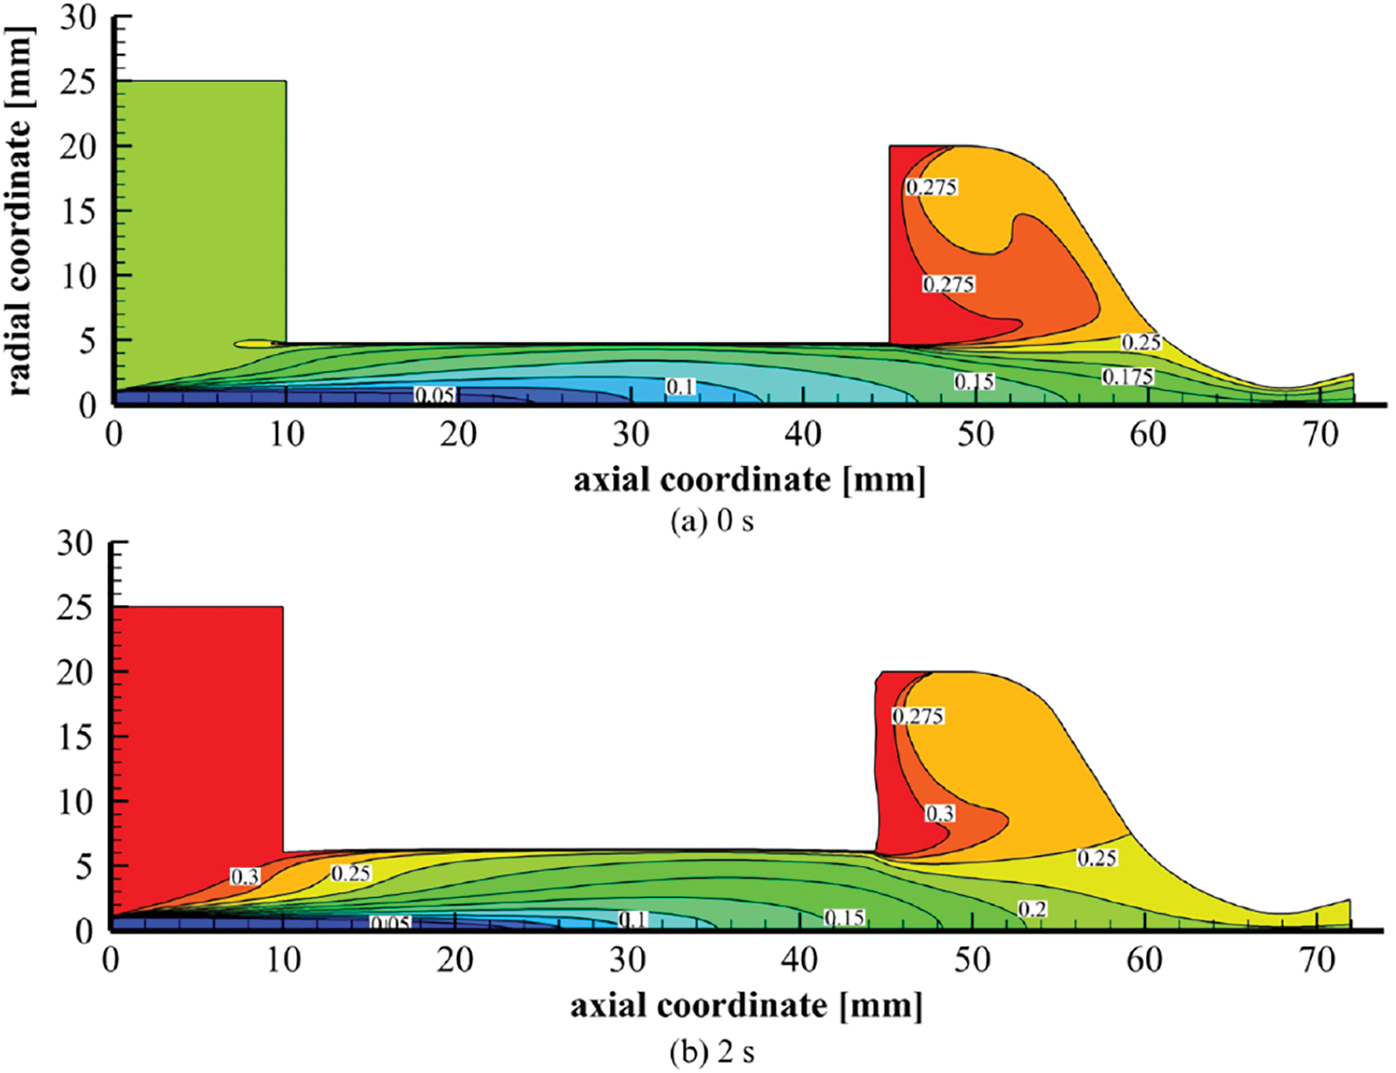
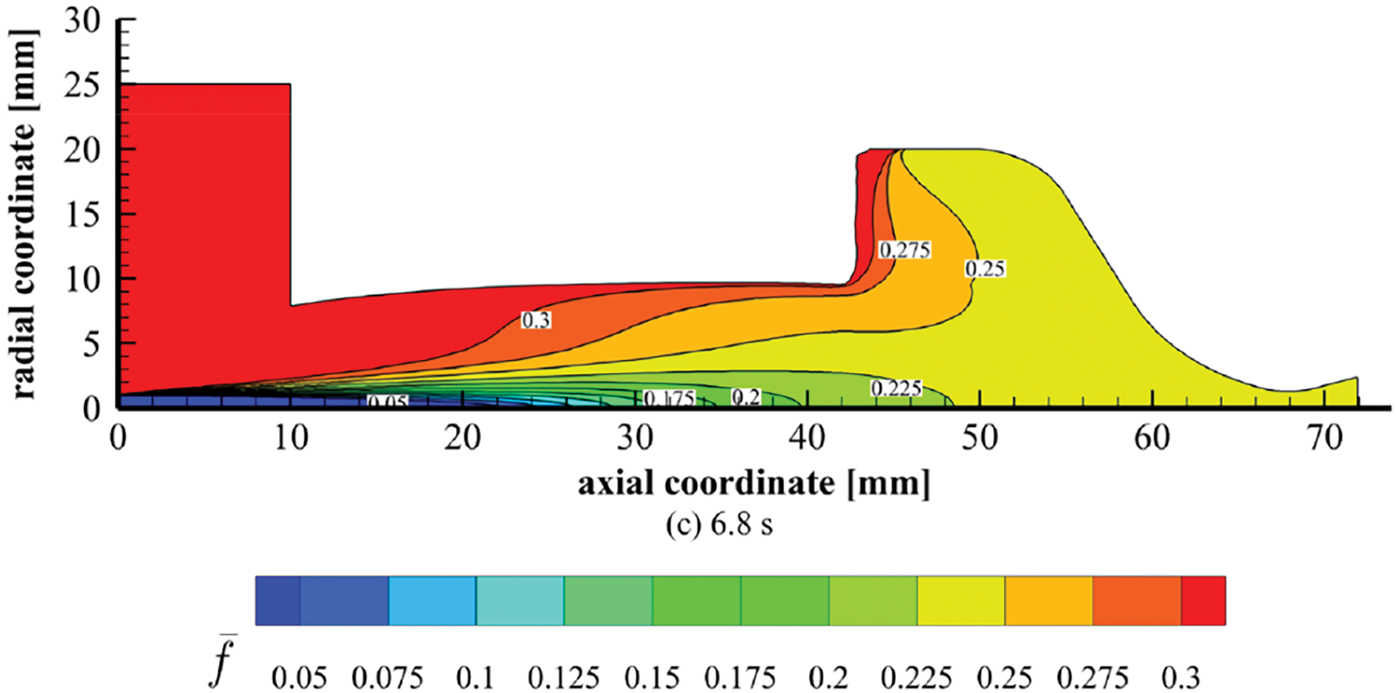
Figure 27: Mean mixture fraction contours in the hybrid rocket thrust chamber at t = 0 s (a), t = 2 s (b) and t = 6.8 s (c). Isolines are labelled with their numerical values. ABS-like test case
Despite the decreasing trend of
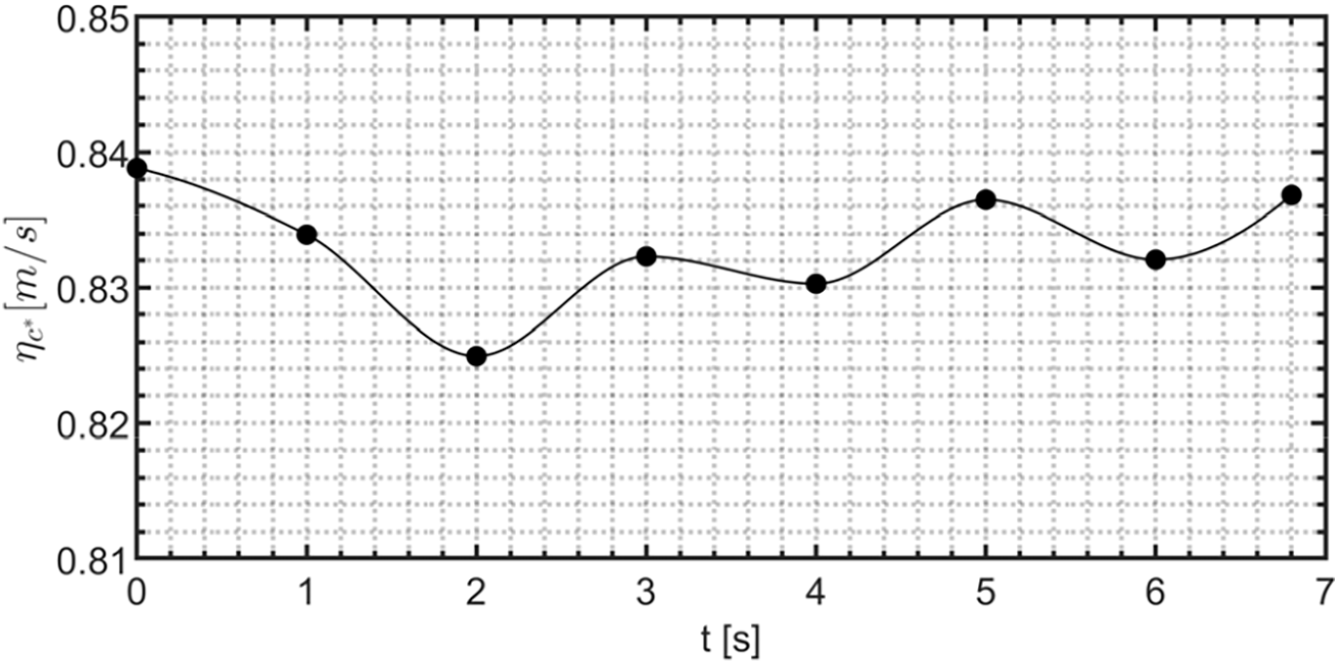
Figure 28: Numerical estimation of the engine combustion efficiency for the ABS-like test case
This work presented the results of a numerical and experimental investigation of a 10 N-class hydrogen peroxide-based hybrid thruster. The upgraded configuration proved satisfying propulsive capabilities, in line with theoretical predictions. Moreover, the additional thermal insulation layers showed better performance in terms of reduction of conductive heat transfer, which conveys thermal energy from the graphite nozzle to the polymeric fuel grain. Temperature monitoring on the combustion chamber case confirmed that the heat flux was mitigated, keeping the grain temperature practically unchanged. This will allow longer tests to be carried out, preventing the detrimental effects of heating that have been proven crucial in hybrid rocket engines of this scale. In addition, proper thermal insulation of the fuel cylinder will enable the evaluation of re-ignition capabilities, preventing the melting phenomena of the polymeric material. The implementation of enhanced control mechanisms pertaining to the thruster’s internal thermal processes was demonstrated to effectively mitigate a significant source of variability that is commonly encountered in numerical simulation methodologies. This enhancement facilitates the execution of numerical CFD analyses, ensuring more reliable results and a higher degree of fidelity with experimental results.
The comprehensive analysis of experimental results pointed out two unexpected features of the fuel grain at the end of the firing tests. An uneven port diameter distribution along the grain length was recorded for both HDPE and ABS-like materials, while a non-negligible axial burning was noted for the ABS-like fuel grain. An extensive numerical investigation was performed to investigate the physical phenomena underlying these off-nominal behaviors. Transient CFD simulations performed with a 1-s timestep revealed that the geometrical configuration of the engine caused the establishment of a larger recirculation zone. During the firing test, this zone shifted towards the outlet section and was progressively enlarged until it merged with the recirculation zone located in the thruster post-chamber. The resulting fluid dynamics field generated an increased wall turbulence toward the nozzle, enhancing the regression rate in the sections close to the outlet. A comparison between port grain distribution resulting from CFD simulations and experimental measurements was performed, proving a satisfying capability of reconstructing empirical behaviors. The effect of the O/F shift and the mixing was investigated in relation to propulsive performances. The numerical modeling technique employed provided reliable results in simulating the axial regression for the ABS-like test case, with mass loss estimation, grain length variation, and regression rate in accordance with experimental findings.
In conclusion, the transient CFD simulations proved to be a valuable tool for identifying complex physical phenomena beyond the reach of classical CFD or purely experimental methods. Their ability to reproduce experimental results and explain underlying mechanisms was demonstrated, highlighting key design challenges. These insights can guide both the analysis of existing thrusters and the early-stage design of future configurations, helping to mitigate unwanted fluid-dynamic effects.
Acknowledgement: This study was carried out within the Space It Up project funded by the Italian Space Agency, ASI, and the Ministry of University and Research, MUR, under contract no. 2024-5-E.0-CUP no. I53D24000060005.
Funding Statement: The authors received no specific funding for this study.
Author Contributions: The authors confirm contribution to the paper as follows: Conceptualization, Sergio Cassese; Methodology, Sergio Cassese and Stefano Mungiguerra; Software, Sergio Cassese, Riccardo Guida, and Daniele Trincone; Validation, Sergio Cassese, Riccardo Guida, and Stefano Mungiguerra; Formal analysis, Sergio Cassese, Riccardo Guida, and Daniele Trincone; Investigation, Sergio Cassese and Riccardo Guida; Resources, Raffaele Savino; Data curation, Sergio Cassese, Riccardo Guida, and Daniele Trincone; Writing—original draft preparation, Sergio Cassese and Riccardo Guida; Writing—review and editing, Sergio Cassese, Riccardo Guida, and Stefano Mungiguerra; Visualization, Sergio Cassese, Riccardo Guida, and Daniele Trincone; Supervision, Stefano Mungiguerra and Raffaele Savino; Project administration, Raffaele Savino; Funding acquisition, Raffaele Savino. All authors reviewed the results and approved the final version of the manuscript.
Availability of Data and Materials: The data that support the findings of this study are available from the corresponding author, Riccardo Guida, upon reasonable request.
Ethics Approval: Not applicable.
Conflicts of Interest: The authors declare no conflicts of interest to report regarding the present study.
Supplementary Materials: The supplementary material is available online at https://www.techscience.com/doi/10.32604/fdmp.2025.065605/s1.
Glossary
| A | Area, mm2 |
| a | Marxman Law Pre-Multiplication Parameter, |
| ABS | Acrylonitrile Butadiene Styrene |
| c* | Characteristic Velocity, m/s |
| D | Diameter, mm |
| f | Average Mixture Fraction |
| Mixture Fraction Variance | |
| G | Mass Flux, kg/m2 s |
| HDPE | High-Density Polyethylene |
| Specific Impulse, s | |
| In-Space Specific Impulse, s | |
| k | Turbulent Kinetic Energy, m2/s2 |
| Mass Flow Rate, g/s | |
| ΔM | Mass Consumption, g |
| n | Marxman Law Exponent |
| P | Pressure, MPa |
| PVC | Polyvinyl Chloride |
| Heat Flux, W/m2 | |
| Regression Rate, mm/s | |
| R | Ideal Gas Constant, J/mol K |
| t | Time, s |
| T | Temperature, K |
| V | Gas Velocity, m/s |
| ΔV | Orbital Velocity Differential, m/s |
| x | Generic Coordinate, m |
| y | Distance from the Wall, m |
| Greek Symbols | |
| γ | Isentropic Exponent |
| η | Efficiency |
| μ | Viscosity, Ns/m2 |
| ρ | Density, kg/m3 |
| θ | Fuel Surface Inclination, deg |
| Superscripts | |
| - | Time Average |
| ~ | Space Average |
| Subscripts | |
| as | Asymptotic |
| av | Average |
| b | Burning |
| c | Chamber |
| cr | Critical |
| e | Exit |
| ex | External |
| exp | Experimental |
| f | Fuel |
| g | Grain |
| i | i-th timestep/initial |
| inj | Injector |
| max | Maximum Value |
| min | Minimum Value |
| Ox | Oxidizer |
| p | Port |
| p,i | Initial port |
| p,f | Final port |
| pre | Pre-chamber |
| ref | Reference |
| s | Solid |
| t | Throat |
| th | Theoretical |
| tot | Total |
| w | Wall |
References
1. Leccese G. Propulsion systems trends in Italian Space Agency ALCOR program. [cited 2024 Jul 24]. Available from: https://www.asi.it/wp-content/uploads/2024/07/Leccese_Workshop_CubeSat_2024.pdf. [Google Scholar]
2. Puig-Suari J, Schoos J, Turner C, Wagner T, Connolly R, Block RP. CubeSat developments at Cal Poly: the standard deployer and PolySat. Small Payloads Space. 2000;4136:72–8. doi:10.1109/aero.2001.931726. [Google Scholar] [CrossRef]
3. Lan W. CubeSat design specification Rev. 13. San Luis Obispo, CA, USA: California Polytechnic State University; 2014. [Google Scholar]
4. Poghosyan A, Golkar A. CubeSat evolution: analyzing CubeSat capabilities for conducting science missions. Prog Aerosp Sci. 2017;88:59–83. doi:10.1016/j.paerosci.2016.11.002. [Google Scholar] [CrossRef]
5. Total nanosatellites and CubeSats launched [Internet]. [cited 2024 Sep 24]. Available from: https://www.nanosats.eu/img/fig/Nanosats_total_2024-05-31_large.png. [Google Scholar]
6. Sutton GP, Biblarz O. Rocket propulsion elements. 9th ed. Hoboken, NJ, USA: John Wiley & Sons; 2017. [Google Scholar]
7. Casiano MJ, Hulka JR, Yang V. Liquid-propellant rocket engine throttling: a comprehensive review. J Propuls Power. 2010;26(5):897–923. doi:10.2514/1.49791. [Google Scholar] [CrossRef]
8. ESA—technology readiness levels (TRL) [Internet]. [cited 2024 Aug 23]. Available from: https://www.esa.int/Enabling_Support/Space_Engineering_Technology/Shaping_the_Future/Technology_Readiness_Levels_TRL. [Google Scholar]
9. Lysien K, Stolarczyk A, Jarosz T. Solid propellant formulations: a review of recent progress and utilized components. Materials. 2021;14(21):6657. doi:10.3390/ma14216657. [Google Scholar] [PubMed] [CrossRef]
10. Yilmaz N, Donaldson B, Gill W, Erikson W. Solid propellant burning rate from strand burner pressure measurement. Propellants Explos Pyrotech. 2008;33(2):109–17. doi:10.1002/prep.200800216. [Google Scholar] [CrossRef]
11. Rampazzo A, Barato F. Modeling and CFD simulation of regression rate in hybrid rocket motors. Fire. 2023;6(3):100. doi:10.3390/fire6030100. [Google Scholar] [CrossRef]
12. Bianchi D, Leccese G, Nasuti F, Onofri M, Carmicino C. Modeling of high density polyethylene regression rate in the simulation of hybrid rocket flowfields. Aerospace. 2019;6(8):88. doi:10.3390/aerospace6080088. [Google Scholar] [CrossRef]
13. Tian H, Jiang X, Yu R, Zhu H, Zhang Y, Cai G. Numerical analysis of the hybrid rocket motor with axial injection based on oxidizer flow distribution. Acta Astronaut. 2022;192:245–57. doi:10.1016/j.actaastro.2021.12.025. [Google Scholar] [CrossRef]
14. Meng X, Tian H, Yu R, Lu Y, Gu X, Tan G, et al. Three-dimensional numerical simulation of hybrid rocket motor based on dynamic mesh technology. Aerosp Sci Technol. 2023;141:108573. doi:10.1016/j.ast.2023.108573. [Google Scholar] [CrossRef]
15. Cassese S, Mungiguerra S, Guida R, Cecere A, Savino R. Regression rate and performance analysis via ballistic reconstruction of a small-scale H2O2-based hybrid rocket fuelled by Polyvinyl Chloride. Aerosp Sci Technol. 2024;146(4):108911. doi:10.1016/j.ast.2024.108911. [Google Scholar] [CrossRef]
16. Cassese S, Capone VM, Guida R, Mungiguerra S, Savino R. Properties and behavior of 3D-printed ABS fuel in a 10 N hybrid rocket: experimental and numerical insights. Aerospace. 2025;12(4):291. doi:10.3390/aerospace12040291. [Google Scholar] [CrossRef]
17. Cassese S, Guida R, Mungiguerra S, Savino R. Fuel characterization, performance assessment and thermal analysis of a hydrogen peroxide-based hybrid thruster for CubeSats. In: 75th International Astronautical Congress (IAC); 2024 Oct 14–18; Milan, Italy. [Google Scholar]
18. Datasheet M54 CORI-FLOWTM M54 low flow coriolis mass flow meter/controller. [cited 2024 Mar 25]. Available from: https://www.wagner-msr.de/files/wagner-mess-regeltechnik/Downloads/Datenblaetter/Cori-Flow/m54%20cori-flow_reva.pdf. [Google Scholar]
19. Cassese S, Mungiguerra S, Capone VM, Guida R, Cecere A, Savino R. Fuel ignition in HTP hybrid rockets at very low mass fluxes: challenges and pulsed preheating techniques using palladium-coated catalysts. Aerospace. 2024;11(11):884. doi:10.3390/aerospace11110884. [Google Scholar] [CrossRef]
20. ISO 1219-1:2012/Amd 1:2016. Fluid power systems and components—graphical symbols and circuit diagrams—part 1: graphical symbols for conventional use and data-processing applications. 3rd ed. Geneva, Switzerland: International Organization for Standardization (ISO); 2016. [Google Scholar]
21. Mezyk L, Gut Z, Mohan K, Kindracki J, Rarata G. Initial research on thermal decomposition of 98% concentrated hydrogen peroxide in thruster-like conditions. Eng Sci Technol. 2022;31(1):101054. doi:10.1016/j.jestch.2021.08.011. [Google Scholar] [CrossRef]
22. Williams GC, Satterfield CN, Isbin HS. Calculation of adiabatic decomposition temperatures of aqueous hydrogen peroxide solutions. J Am Rocket Soc. 1952;22(2):70–7. doi:10.2514/8.4427. [Google Scholar] [CrossRef]
23. Wertz JR, Everett DF, Puschell JJ. Space mission engineering: the new space mission analysis and design. 3rd ed. Vol. 28. Portland, OR, USA: Microcosm Press, Space Technology Library; 2011. [Google Scholar]
24. Paravan C, Hashish A, Santolini V. Test activities on hybrid rocket engines: combustion analyses and green storable oxidizers—a short review. Aerospace. 2023;10(7):572. doi:10.3390/aerospace10070572. [Google Scholar] [CrossRef]
25. Ku HH. Notes on the use of propagation of error formulas. J Res Natl Bur Stand Sect C Eng Instrum. 1966;70C(4):263. [cited 2024 Apr 25]. Available from: https://nistdigitalarchives.contentdm.oclc.org/digital/collection/p16009coll6/id/99848. [Google Scholar]
26. Chorin AJ. Numerical solution of the navier-stokes equations. Math Comput. 1968;22(104):745–62. doi:10.1090/s0025-5718-1968-0242392-2. [Google Scholar] [CrossRef]
27. Menter FR. Two-equation eddy-viscosity turbulence models for engineering applications. AIAA J. 1994;32(8):1598–605. doi:10.2514/3.12149. [Google Scholar] [CrossRef]
28. Gordon S, Cleveland A, Mcbride BJ. Computer program for calculation of complex chemical equilibrium compositions and applications. Part 1: analysis. In: NASA Reference Publication 1311. Cleveland, OH, USA: Office of Management, NASA Scientific and Technical Information Program; 1994. [Google Scholar]
29. Roache PJ. Verification of codes and calculations. AIAA J. 1998;36(5):696–702. doi:10.2514/2.457. [Google Scholar] [CrossRef]
30. Bianchi D, Betti B, Nasuti F, Carmicino C. Simulation of gaseous oxygen/hydroxyl-terminated polybutadiene hybrid rocket flowfields and comparison with experiments. J Propuls Power. 2015;2015(3):919–29. doi:10.2514/1.B35587. [Google Scholar] [CrossRef]
31. Di Martino GD, Carmicino C, Savino R. Transient computational thermofluid-dynamic simulation of hybrid rocket internal ballistics. J Propuls Power. 2017;33(6):1395–409. doi:10.2514/1.b36425. [Google Scholar] [CrossRef]
32. Gallo G, Kamps L, Hirai S, Carmicino C, Harunori N. Prediction of the fuel regression-rate in a HDPE single port hybrid rocket fed by liquid nitrous oxide. Combust Flame. 2024;259(1):113160. doi:10.1016/j.combustflame.2023.113160. [Google Scholar] [CrossRef]
33. Ansys Inc. Ansys fluent theory guide. Canonsburg, PA, USA: Ansys Inc.; 2013. p. 724–46. [Google Scholar]
34. Sivathanu YR, Faeth GM. Generalized state relationships for scalar properties in nonpremixed hydrocarbon/air flames. Combust Flame. 1990;82(2):211–30. doi:10.1016/0010-2180(90)90099-d. [Google Scholar] [CrossRef]
Cite This Article
 Copyright © 2025 The Author(s). Published by Tech Science Press.
This work is licensed under a Creative Commons Attribution 4.0 International License , which permits unrestricted use, distribution, and reproduction in any medium, provided the original work is properly cited.
 Downloads
 Citation Tools