
 Submit a Paper
 Propose a Special lssue
 Open Access
ARTICLE

Entropy Production and Energy Loss in Supercritical CO2 Centrifugal Compressor
1 School of Energy and Power Engineering, Lanzhou University of Technology, Lanzhou, 730050, China
2 Laboratory of Power Station Energy Transfer Conversion and System of Ministry of Education, North China Electric Power University, Beijing, 102206, China
* Corresponding Authors: Senchun Miao. Email: ; Xiaoze Du. Email:
Fluid Dynamics & Materials Processing 2025, 21(7), 1711-1735. https://doi.org/10.32604/fdmp.2025.062239
Received 13 December 2024; Accepted 25 April 2025; Issue published 31 July 2025
 View Full Text
 Download PDF
Abstract
In Brayton cycle energy storage systems powered by supercritical carbon dioxide (sCO2), compressors are among the most critical components. Understanding their internal flow loss characteristics is, therefore, essential for enhancing the performance of such systems. This study examines the main sCO2 compressor from Sandia Laboratory, utilizing entropy production theory to elucidate the sources and distribution of energy losses both across the entire machine and within its key flow components. The findings reveal that turbulent viscous dissipation is the predominant contributor to total entropy production. Interestingly, while the relative importance of the entropy produced by various sources as the mass flow rate rises remains essentially unchanged, the total entropy production exhibits a non-monotonic trend, first decreasing and then increasing with the mass flow rate. High entropy production in the impeller is primarily concentrated in the clearance region and along the rear cover of the impeller tip. In the diffuser, it is most pronounced on the front and rear plates and within the central flow path. Meanwhile, in the volute, the highest entropy production occurs around the diffuser outlet and along the outer region of the volute’s centerline.Keywords
As new energy technologies advance, renewable sources like wind and solar power are making up a growing share of energy mix. However, the intermittent and volatile nature of wind and photovoltaic power generation poses significant challenges to the stable operation of electrical grids [1]. To tackle these issues, closed-loop Brayton cycle systems using supercritical CO2 as the circulating fluid offer an efficient energy storage solution [2]. This technology is characterized by its lack of geographical constraints and its superior performance [3]. The performance of sCO2 compressor has crucial impact on the efficient operation of the entire supercritical carbon dioxide Brayton system [4–6]. Research on the internal flow of sCO2 compressor is essential for elucidating the fluid motion patterns within the compressor and for uncovering the mechanisms underlying energy losses. This research is crucial for improving supercritical CO2 compressor design theories and boosting their efficiency.
In recent years, extensive research has been conducted on the internal flow dynamics of sCO2 compressors. Bao et al. [7] studied supercritical CO2 compressors and discovered flow distortions in downstream areas. These distortions are caused by the two-phase zone, dominant flow structure in the impeller, and changes in inlet temperature. Their findings revealed that a reduction in the total inlet temperature led to an enhancement of a counterclockwise vortex, thereby deteriorating impeller discharge uniformity and exacerbating losses. Moreover, Liu [8] found that higher inlet pressure creates swirling zones in the impeller. These zones block incoming flow, causing unstable pressure changes at the compressor’s intake. Kumar [9] investigated the impact of varying mass flow rates on flow distribution characteristics near abrupt density variation regions in sCO2 centrifugal compressors, highlighting significant alterations in static pressure distribution near the blade leading edge due to thermodynamic property fluctuations. Liu et al. [10] observed that the efficiency at the best efficiency point decreases with increasing rotational speed. Raman et al. [11] examined the effects of tip clearance and diffuser configurations on internal compressor flow characteristics, and found that aerodynamic losses from tip leakage flow considerably impacted isentropic efficiency. Du et al. [12] demonstrated that wedge diffusers promoted higher flow velocities and more uniform flow fields compared to circular or airfoil-shaped diffusers. Shi et al. [13] managed to reduce diffuser losses by altering the blade profile of the vane diffuser. Saravi et al. [14] revealed that decreasing the blade count enhanced aerodynamic stability, whereas a higher number of blades induced unsteady flow phenomena and elevated pressure losses in the diffuser throat section. Pei et al. [15] found that an increase in the absolute value of the pre-swirl angle exacerbated flow separation on the suction surface of guide vanes, particularly noting the occurrence of two-phase flow under high mass flow conditions with large positive pre-swirl angles. Romei et al. [16] observed that the loss within the impeller and vaned diffuser was mostly independent of pre-swirl. In the impeller, the primary sources of loss stemmed from flow separation on the suction side and tip clearance, while in the vaned diffuser, the primary loss source was the wake downstream of the trailing edge. Cao et al. [17] investigated how tip clearance leakage flow affected separated vortices in sCO2 centrifugal compressors, while Dong [18] similarly noted that regional impeller loss was predominantly linked to flow separation phenomena. Zhu [19] conducted a comparative analysis between sCO2 centrifugal compressors and conventional centrifugal compressors, revealing analogous secondary flow structures within the impeller flow domain. In summary, existing literature on the internal flow characteristics of sCO2 centrifugal compressors predominantly focuses on compressor performance and internal flow features under varying operational and geometrical parameters. Notably, there remains a gap in research methodologies that directly quantify aerodynamic loss distribution mechanisms within the three-dimensional flow domain of sCO2 centrifugal compressors.
The application of the entropy production theory in fluid machinery has unveiled a pioneering approach to uncovering the origins of flow loss. The entropy production theory has emerged as an effective tool in identifying and quantifying the extent of losses in various equipment such as pumps, hydraulic turbines, gas turbines, and compressors. In the realm of pump research, Ren et al. [20] conducted a quantitative analysis of flow loss in centrifugal pumps by utilizing entropy production theory. Meanwhile, Meng et al. [21] evaluated the location and primary sources of energy loss in multi-stage pumps based on the same theory. Likewise, within the domain of wind turbine research, Li et al. [22] analyzed the relationships among entropy production and unstable flow for each component, all through the lens of entropy production theory. Wang [23] further honed and applied entropy production analysis for loss diagnostics, successfully pinpointing high-loss areas and quantifying localized losses. In a comparative analysis of energy dissipation mechanisms in pump-mode vs. turbine-mode operations, Wang et al. [24] employed entropy production theory to precisely localize loss regions and identify dominant loss sources in radial inflow turbines, demonstrating its superiority over conventional pressure-drop-based methods. Miao et al. [25] explored internal energy loss mechanisms and energy dissipation characteristics of double suction pumps under forward and reverse operating conditions using the entropy production theory. In the context of compressor research, Li et al. [26] identified the source and distribution characteristics of loss in high-load centrifugal impellers based on entropy production theory. Yang et al. [27] applied entropy production theory to analyze entropy production distributions within the impeller region of an sCO2 compressor, and compared variations under different mass flow rates and inlet temperatures. Applying entropy production theory, Zhang et al. [28] analyzed aerodynamic loss mechanisms in an axial-flow compressor and precisely localized high-loss regions within the internal flow domain. Furthermore, Yang et al. [29] compared compressor performance when using sCO2 vs. two other working fluids, examining aerodynamic loss distribution characteristics within the impeller region. In summary, entropy production theory not only enables quantification of loss sources but also facilitates high-loss region identification; it thus serves as a powerful tool to elucidate energy dissipation mechanisms in fluid machinery. Current research on sCO2 centrifugal compressors have predominantly focused on loss distribution within the impeller region, but studies addressing system-wide loss mechanisms across the entire compressor assembly are notably scarce.
This study offers a systematic examination of flow loss phenomena occurring in a sCO2 centrifugal compressor using entropy production theory. The methodology enables a comprehensive analysis of energy dissipation mechanisms both at the overall compressor and within individual components. The primary aims of this investigation are to pinpoint the principal sources of energy loss and to delineate the spatial distribution of regions characterized by substantial energy dissipation within the sCO2 compression process. The findings derived from this study yield invaluable insights that are essential for informing the design and optimizing the performance of centrifugal compressors operating with sCO2.
2 Methodologies for Entropy Production Analysis
According to entropy production theory, the total entropy production within a compressor can be decomposed into two components: firstly, the generation of entropy through viscous dissipation resulting from velocity gradients, and secondly, the generation of thermal entropy due to temperature gradients.
As fluid engages in turbulent motion with a high Reynolds number, recirculation zones and vortical structures within turbulent regions lead to the emergence of turbulent velocity fluctuations, a consequence of the inherent stochastic unsteadiness and spatiotemporal disorder of the fluid. Consequently, the variables in the governing equations can be bifurcated into Reynolds-averaged mean components and fluctuating components.
The first term in the equation corresponds to the direct rate of viscous dissipation entropy production, stemming from the dissipation of viscous effects within the mean flow field, denoted as
where
As the Reynolds-average method faces limitations in directly evaluating the turbulent dissipation term, this study proposes, based on the insights from Kock and Herwig’s work and the turbulence model selected for numerical simulations, the entropy production rate due to turbulent viscous dissipation is given by:
where β is the empirical constant of the SST k-ω turbulence model, with a typical value of 0.09; ω is the turbulent eddy frequency, expressed in s−1; and k is the turbulent kinetic energy, expressed in m2/s2.
The third component under consideration is the mean temperature gradient entropy production rate, denoted as W/(m3 K):
where μt is the eddy viscosity, expressed in Pa s; cp is the specific heat capacity at constant pressure, denoted by J/(kg K); and Prt is the turbulent Prandtl number.
By integrating the entropy production rate according to the formulas above, we can obtain the following components: direct viscous dissipation entropy production, the turbulent viscous dissipation entropy production, the mean temperature gradient entropy production, and the entropy production by fluctuating temperature, as stated below:
where V represents the volume of the fluid, expressed in m3.
The total entropy production and the irreversible energy loss within a compressor can be quantified using the following equations:
where T is the temperature of the fluid, K;
3 Research Object and Numerical Simulation
The present investigation focuses on the sCO2 centrifugal compressor, which was sourced from Sandia National Laboratories, as the subject of study [30]. Design parameters of the impeller and diffuser are meticulously detailed in Tables 1 and 2. The impeller is equipped with a 1:1 configuration of main blades and splitter blades, culminating in a total of 12 blades. The computational model was constructed utilizing CF turbo software, with extended domains added at both the impeller inlet and the volute outlet. The three-dimensional geometry of the compressor, as constructed, is graphically represented in Fig. 1.
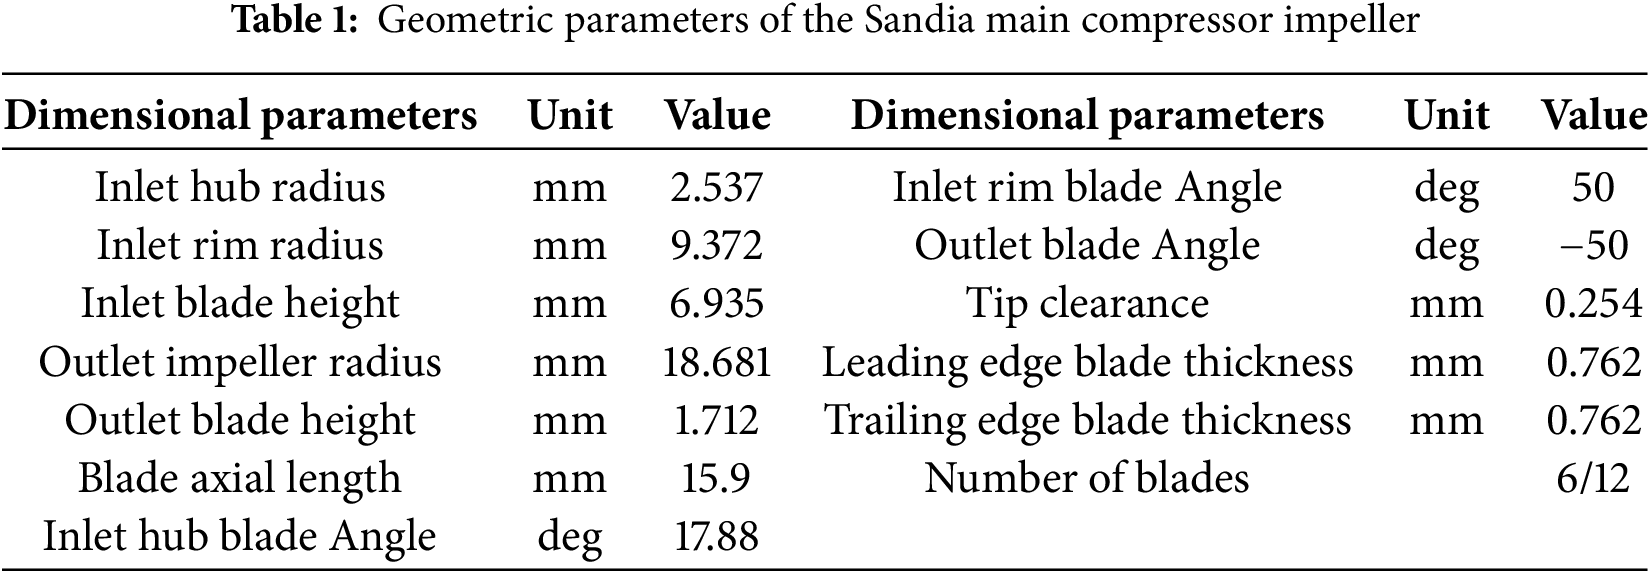
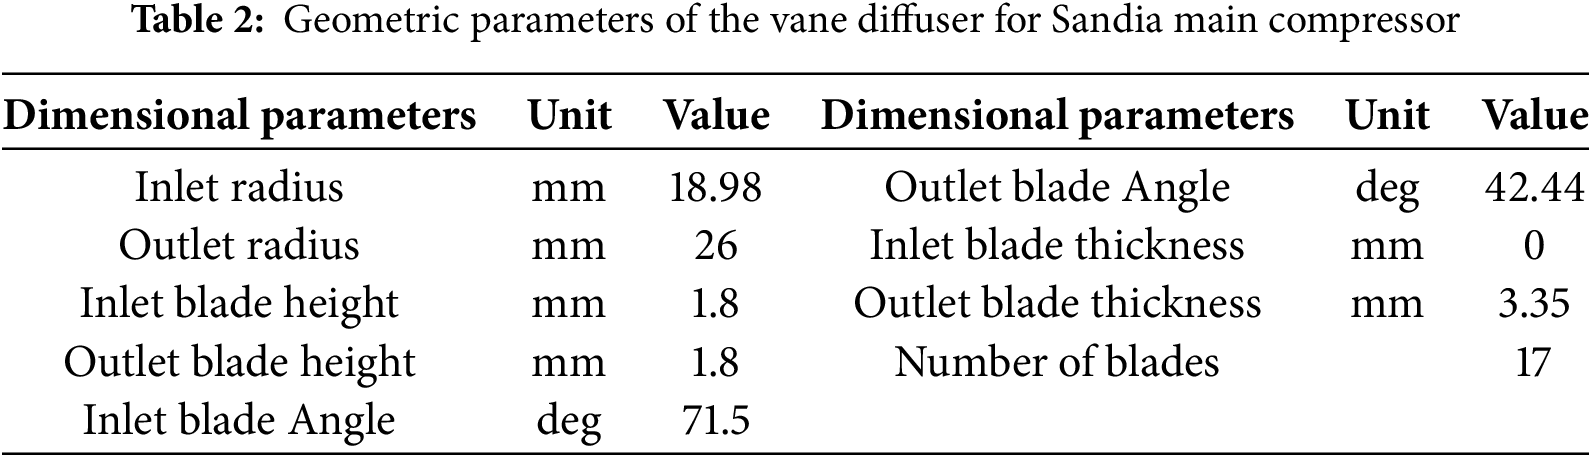
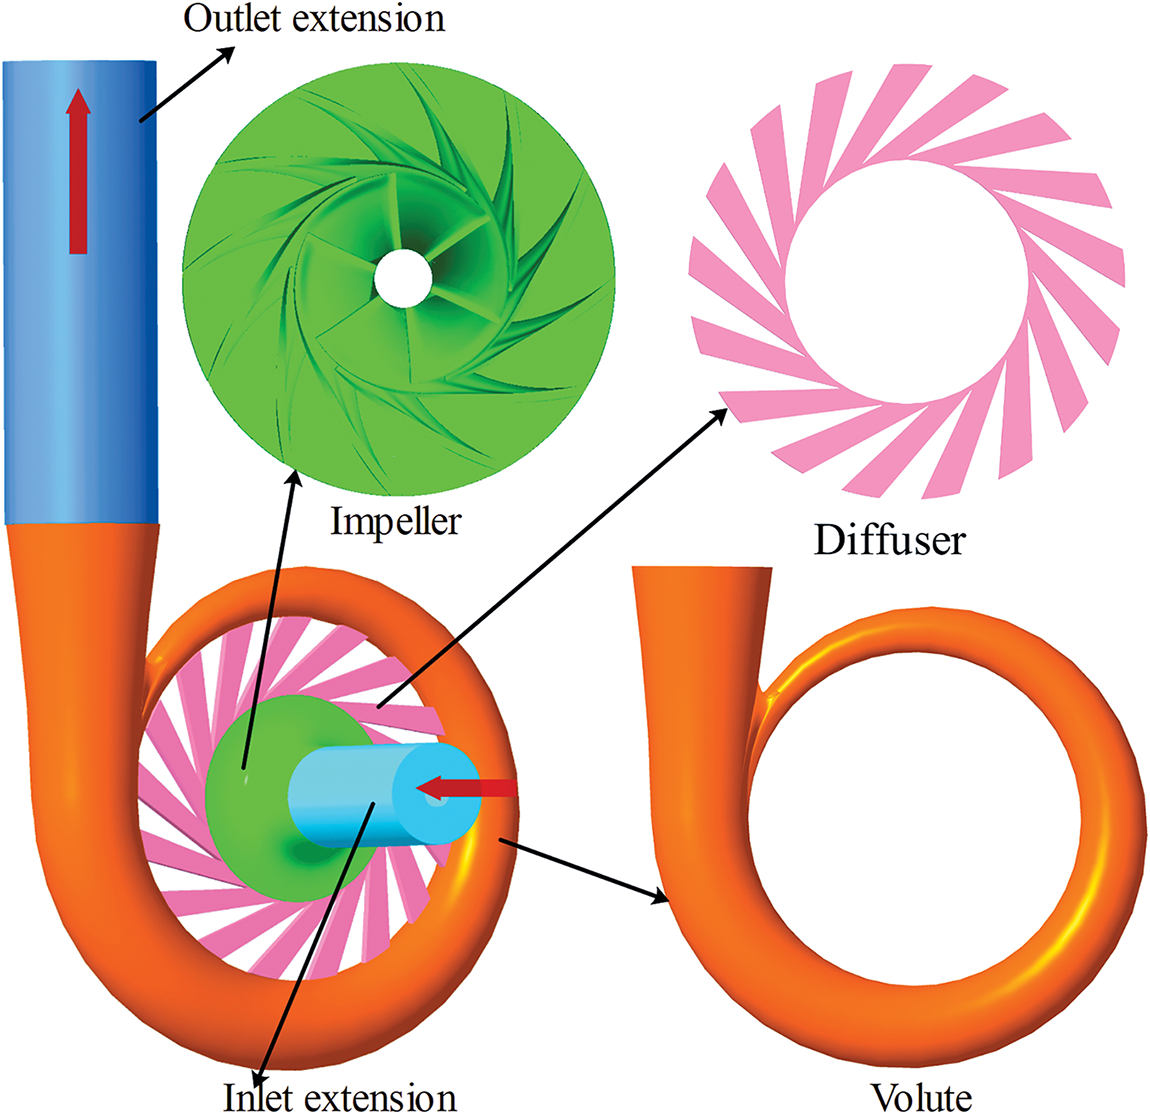
Figure 1: Three-dimensional model of computational domain
Fluid flow dynamics are governed by the foundational conservation laws of physics—mass, energy, and momentum—which rigorously dictate the permissible states of motion. The governing equations reflecting these constraints can be expressed as:
(1) Mass conservation equation
Mass conservation is a fundamental law governing any fluid flow problem. The mass conservation equation can be formulated as:
In Formula (13), ρ represents density; t denotes time; and ui are the xi components of the velocity vector u, respectively.
(2) Momentum conservation equation
Furthermore, adherence to momentum conservation is imperative for all fluid systems. This principle dictates that the temporal variation of momentum within a defined control volume equates to the resultant external force vector acting upon it. As a direct manifestation of Newtonian mechanics, the governing equations for momentum conservation along each coordinate axis are formulated as follows:
In the formula group (14), p is the pressure on the fluid element;
(3) Energy conservation equation
The energy equation states that the temporal energy accumulation in a differential control volume balances the net heat transfer through its boundaries and the work performed by external force fields. The energy conservation equation can be formulated as:
In Eq. (15), htot is the total specific enthalpy; T represents temperature; keff is the effective thermal conductivity coefficient of the fluid; τij is the component of the viscous stress τ on the surface of the microelement due to the molecular viscosity action.
The computational domain was delineated into five distinct segments: the inlet, impeller, vaned diffuser, volute, and outlet. The mesh generation was performed using ANSYS ICEM CFD, which facilitated the creation of unstructured grids with localized refinement at the blade leading edges and the volute tongue region. This refinement was imperative due to the high Reynolds number flow characteristics inherent to the sCO2 centrifugal compressor. To align with the demands of the turbulence model concerning the y+ parameter, the boundary layer meshes were partitioned into near-wall regions. The first layer of the boundary layer mesh was set to a thickness of 0.0003 mm, with a layer growth ratio of 1.2, and the total number of layers was determined to be 25. The outcomes of the meshing process are graphically represented in Fig. 2. A mesh sensitivity analysis was meticulously conducted employing six systematically refined mesh configurations, with the isentropic efficiency serving as the pivotal convergence criterion, as depicted in Fig. 3. It was observed that once the mesh count surpassed 10.5 million elements (10,501,697), the deviation in isentropic efficiency was maintained below 0.1%. Striking a balance between computational precision and resource limitations, the mesh comprising 10.5 million elements was deemed optimal for subsequent simulation endeavors.
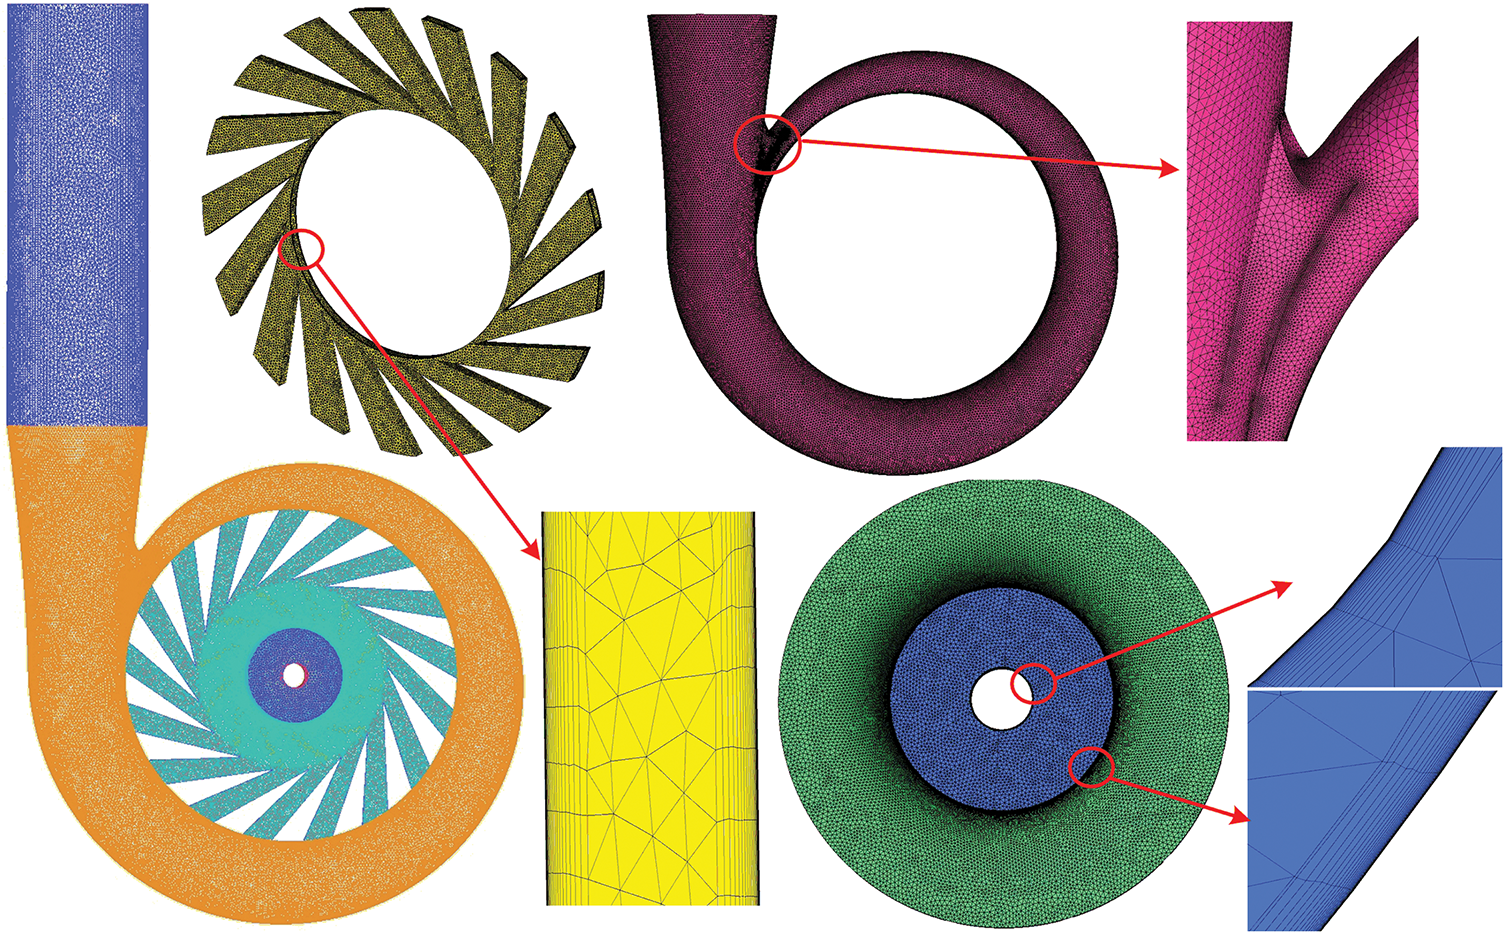
Figure 2: Mesh display of computational domain
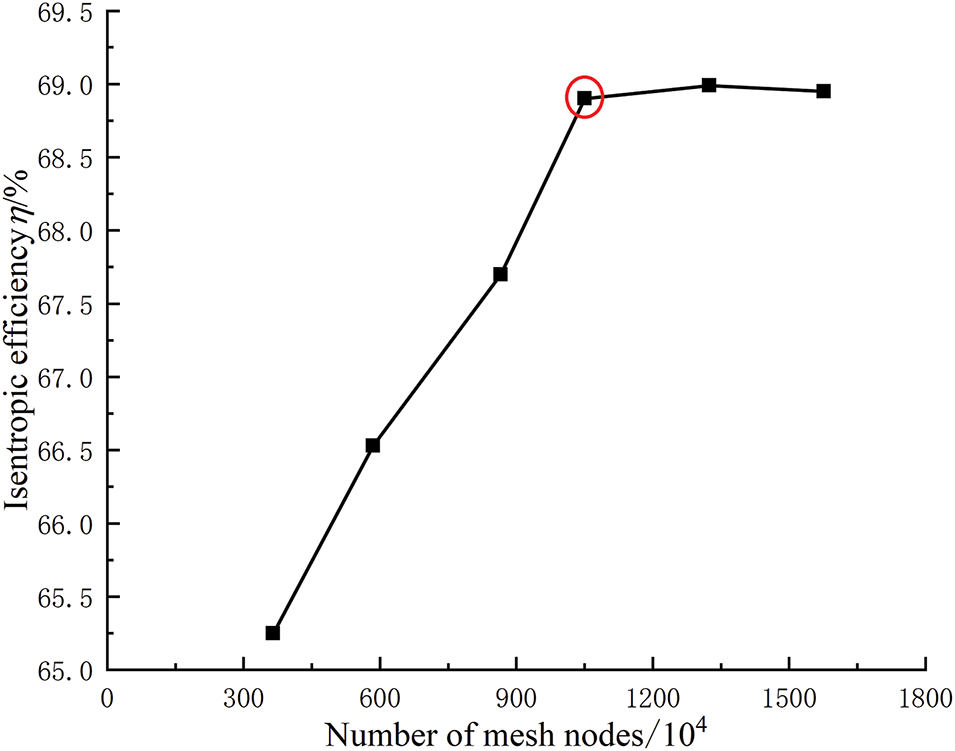
Figure 3: Mesh independence verification of centrifugal compressor
In this study, the simulation software ANSYS CFX was used for steady-state numerical calculation of sCO2 centrifugal compressor. The advection term was discretized using the High-Resolution Scheme (automatic blending of first- and second-order accuracy). Fluid time control was implemented using a physical timescale of 0.0002 s [31]. By inputting the thermophysical properties of carbon dioxide as a real gas sourced from the NIST REFPROP software, Real Gas Property (RGP) files were produced and integrated into the CFX platform for the computational process. The RGP data set utilized herein was refined to a resolution of 301 by 301 [29]. Specific operational parameters were prescribed as follows: total temperature inlet 306.4 K, total pressure inlet 7.69 MPa, speed 55,000 r/min, mass flow inlet 2.5 kg/s, turbulence model SST k-ω, and reference pressure 0 MPa. The impeller was designated as the rotating domain, while the remaining components were characterized as the stationary domain. The interface between rotating and stationary domains was configured using the frozen rotor approach; conversely, the interface between stationary elements utilized the mixing plane methodology. All boundary surfaces were set as adiabatic non-slip walls. Convergence criteria were stipulated with a residual target of 10−4, and real-time monitoring of inlet and outlet temperatures and flow rates was conducted. Convergence was deemed achieved when residual values fell below 10−4 when alterations in inlet-outlet parameters were less than 0.5%, indicating reliable computational outcomes.
To validate both the fidelity of the reconstructed model in comparison to the original design and the robustness of the numerical methodology, the computed results for varying mass flow rates of the centrifugal compressor were juxtaposed with experimental data from prior research studies, under the operating conditions of 55,000 revolutions per minute, 306.4 K, and 7.89 MPa. As depicted in Fig. 4, the numerical simulations exhibited a strong concordance with the experimental findings, showcasing a mean absolute percentage error of 3.76% for isentropic efficiency and a 7.20% deviation in specific enthalpy rise. These deviations fall within acceptable engineering tolerances, affirming the credibility of the reconstructed model and the numerical simulation methodology for further exploration into sCO2 centrifugal compressors.
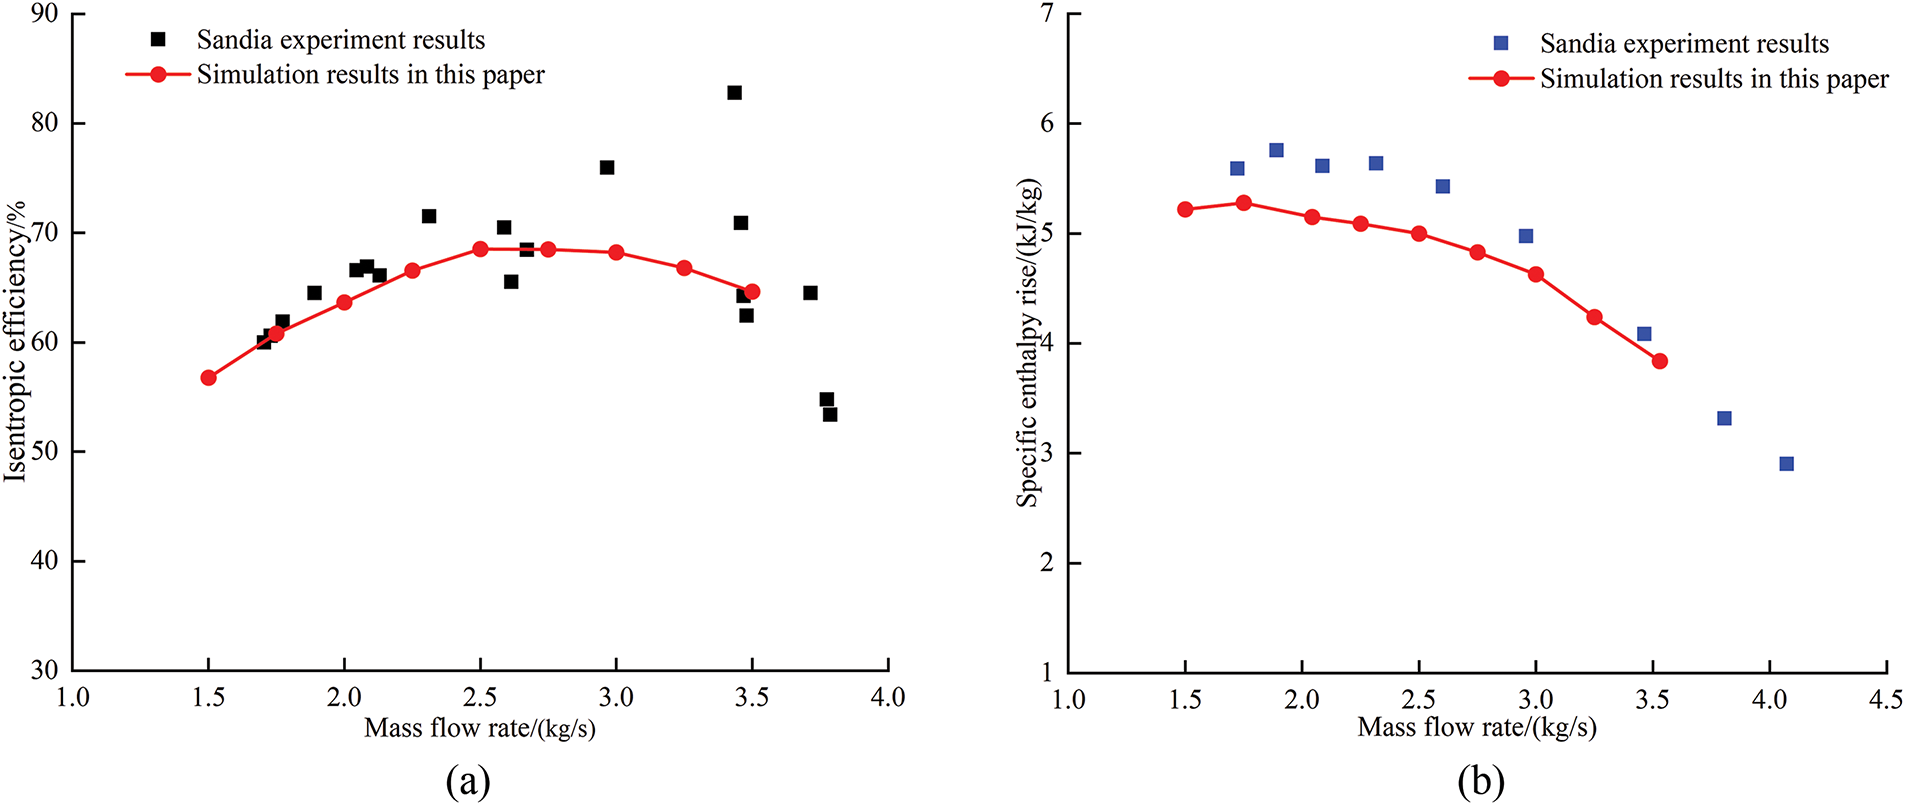
Figure 4: Comparison between numerical simulation results and experimental data (a, b)
4.1 Analysis of Entropy Production Loss of Compressors
4.1.1 Analysis of Different Types of Compressors’ Entropy Production Loss
The entropy generation characteristics of compressors under diverse mass flow conditions were quantitatively analyzed using entropy production theory. Fig. 5 illustrates the variation in entropy production losses across the entire fluid domain at various mass flow rates.
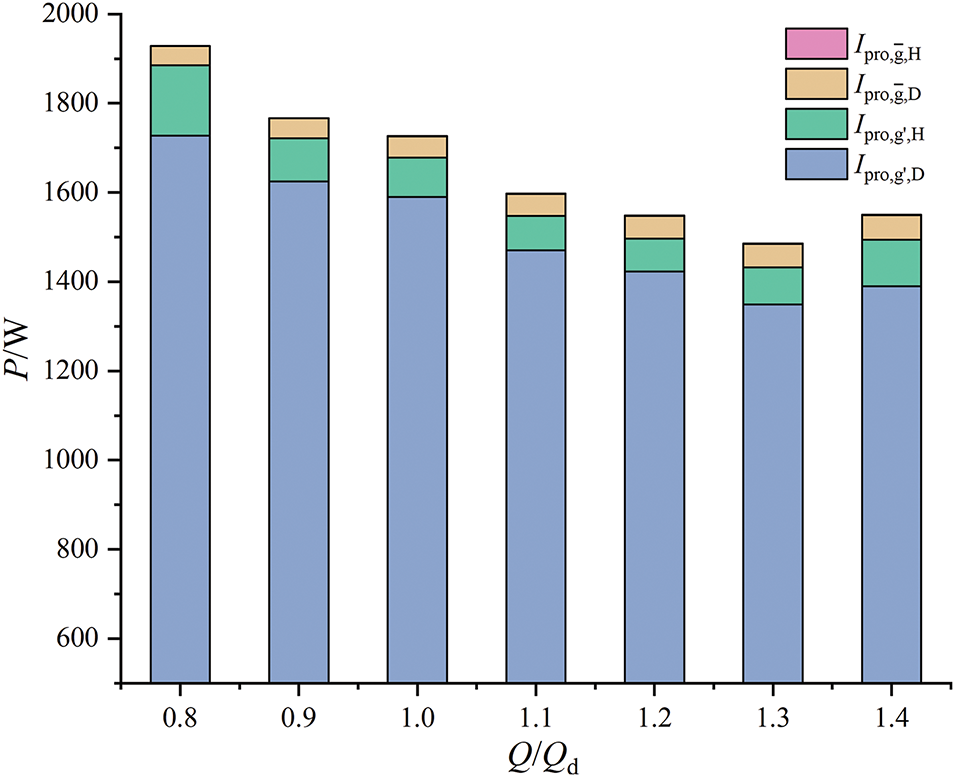
Figure 5: Change of entropy production loss under different flow rates
Fig. 5 illustrates the entropy production losses from four distinct sources at varied mass flow rates. The contributions are as follows: turbulent viscous dissipation entropy production loss at approximately 91.54%, entropy production loss due to fluctuating temperature at approximately 5.91%, direct viscous dissipation entropy production loss at approximately 2.53%, and mean temperature gradient entropy production loss at approximately 0.02%. Remarkably, these fluctuating components, constituting a total of 97.45% of the losses, reflecting the flow instability characteristics. Conversely, the time-averaged components, encompassing direct viscous and mean temperature gradient effects, contribute merely 2.55%. Specifically, the turbulent viscous dissipation contributes significantly more than all other loss combined, solidifying turbulence viscous dissipation as the primary source of loss in this centrifugal compressor. Significantly, the total entropy production loss decreases first and then increases with the increase of mass flow rate, achieving its nadir at a level of 1485.68 W under the 1.3Qd condition. Although the proportional contributions of the four entropy production sources to the total losses remain relatively stable across varying mass flow rates, a detailed investigation into the entropy production distribution among individual components at different mass flow rates is necessary.
4.1.2 Investigation of the Entropy Production Loss of Various Compressor Throughflow Components
The entropy production loss for each flow component at various mass flow rates is displayed in Fig. 6, which shows that the entropy production loss in the diffuser exhibits a consistent decline, while the volute’s entropy production loss consistently rises. Notably, the entropy loss of the impeller exhibits a trend of first decreasing and then increasing with the rising mass flow rate. As the mass flow rate escalates, the entropy production loss within the impeller region initially diminishes from 892.46 W at 0.8Qd to 601.65 W at 1.2Qd, and subsequently ascends to 652.23 W at 1.4Qd. The entropy production loss in the impeller region accounts for an average of 42% of the total loss. The loss of the diffuser decreases with the increase of flow rate, the entropy production loss descends from 851.77 W at 0.8Qd to 503.91 W at 1.4Qd. The average entropy production loss in the diffuser area accounts for 40% of the total compressor loss. Conversely, the volute’s entropy production loss escalates from 161.26 W at 0.8Qd to 353.02 W at 1.4Qd. The average entropy production loss in the volute region is about 18% of the total loss. In conclusion, the entropy production loss across the impeller, diffuser, and volute regions exhibits diverse trends with the increase in mass flow rate. A comprehensive analysis of each component, in conjunction with the compressor’s internal flow, is presented in the subsequent sections.
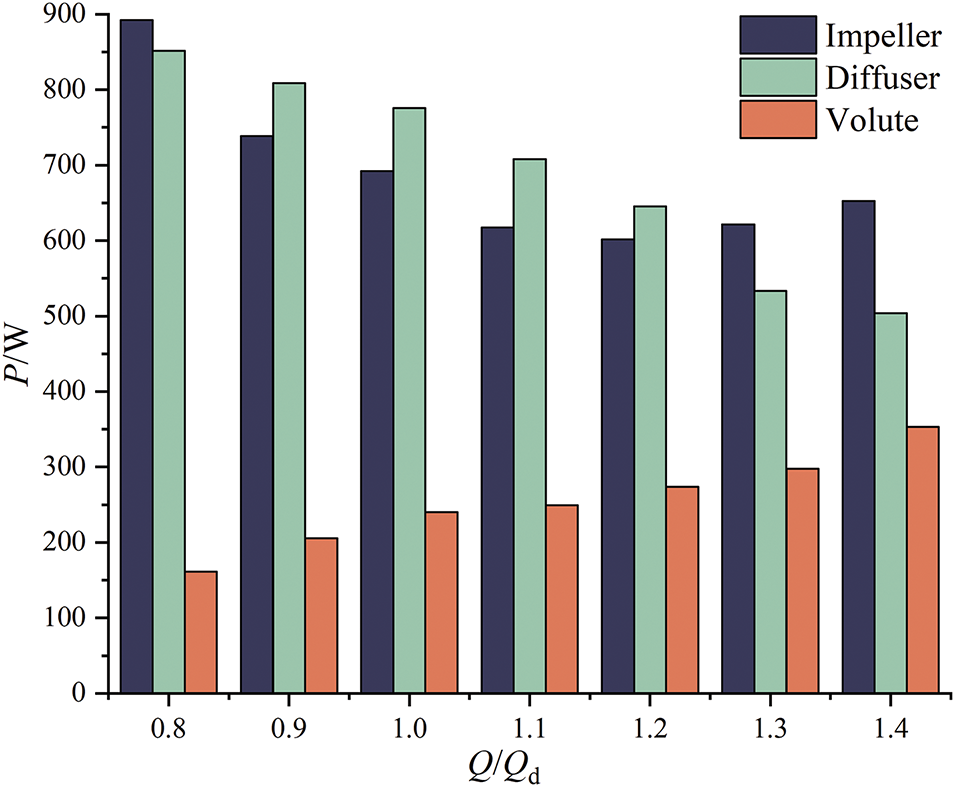
Figure 6: Entropy production loss of each component under different flow rates
4.2 Analysis of Entropy Production of Compressor Throughflow Components
4.2.1 Analysis of Compressor Impeller Entropy Production
During the operation of a compressor, significant variations in entropy production losses were observed among its components. Particularly, the impeller was identified as the primary contributor to entropy production, accounting for an average of 42% of the total losses under all operational conditions. This finding underscores the pivotal role of the impeller in the mechanisms of loss generation. Fig. 7 illustrates the distribution of local entropy production rate on the meridional plane of the impeller at various mass flow rates, and it clearly demonstrates that the distribution in entropy production rate within the impeller region remains consistent. Two distinct regions with high entropy production rates were identified: one concentrated in the clearance area near the impeller tip, and the other located in the hub-side region of the impeller. With an increment in the mass flow rate, the high entropy production rate zone in the tip clearance area constricted, while the corresponding region in the hub-side area expanded.
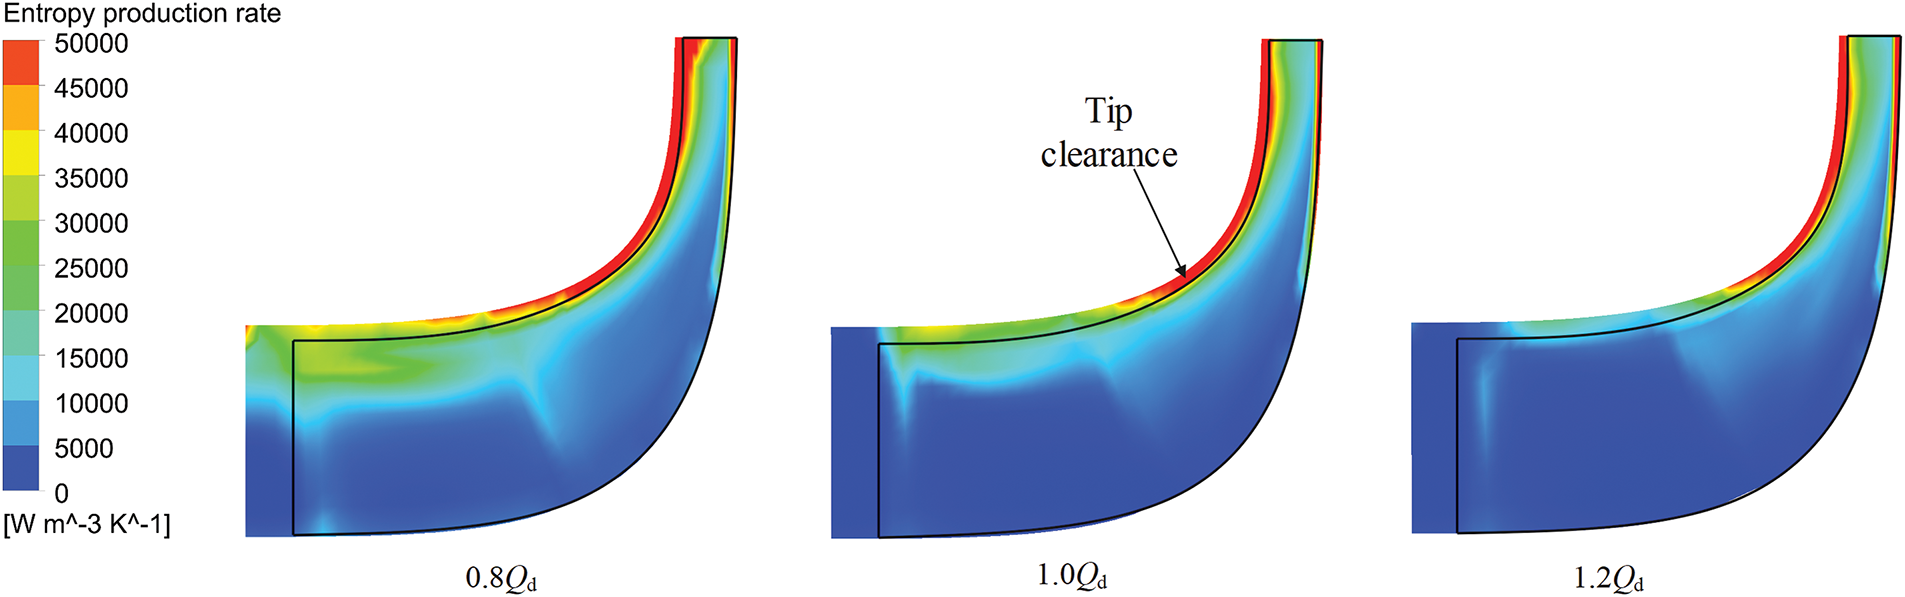
Figure 7: Distribution of local entropy production rate on the meridian plane of impeller
To investigate the entropy production rates in the impeller region and understand the energy loss mechanisms, we conducted a detailed analysis of three different cross sections (Span0.1, Span0.5, and Span0.9), as shown in Fig. 8. The span value represents the non-dimensional distance extending from the shroud to the hub. Span0.1 is positioned near the hub, Span0.5 at the mid-span of the impeller, and Span0.9 within the tip clearance region. Additionally, to pinpoint the areas of losses accurately, the critical positions of the impeller are labeled in Fig. 9.
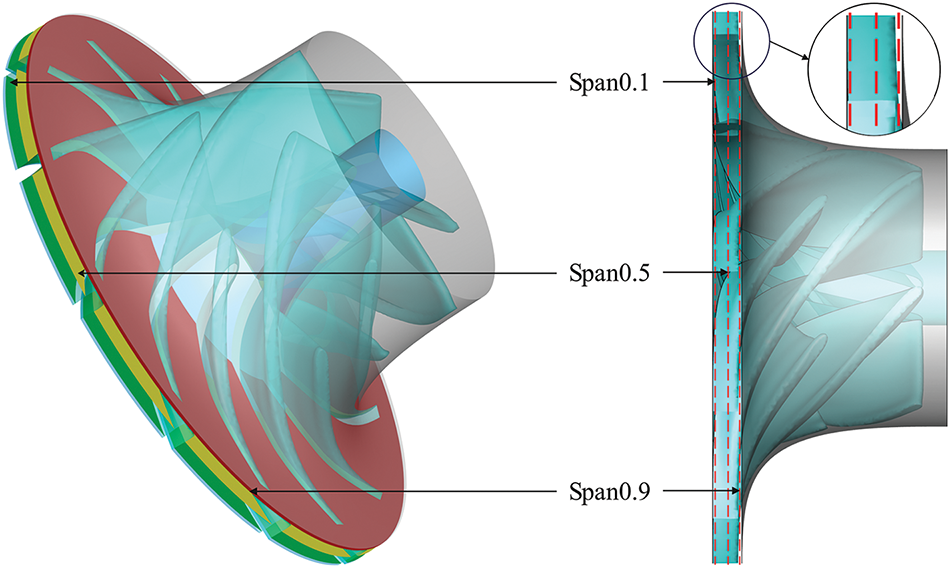
Figure 8: Diagram of different sections of the impeller
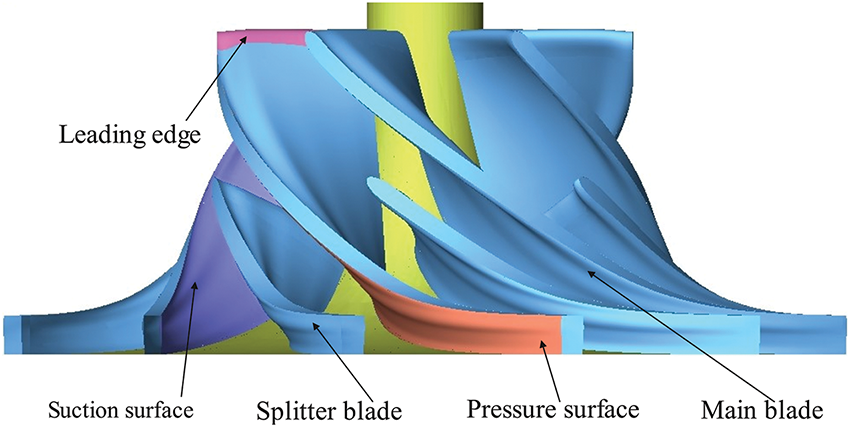
Figure 9: Diagram of local positions of the impeller
Fig. 10 shows the variation in local entropy production rates across the impeller at various mass flow rates and cross sections. It can be observed that regions B1, B2, and B3 exhibit higher entropy production rate. As shown in Fig. 10, B1 corresponds to the high entropy production rate region near the hub side of the impeller in the Span0.1 section, while B2 and B3 represent the distribution of high entropy production rates within the tip clearance region at Span0.5 and Span0.9, respectively. Notably, with rising mass flow rates, the spatial coverage of elevated entropy generation zones (B2 and B3) contracts progressively. This trend further demonstrates that the spatial distribution of high entropy production rates within the tip clearance region decreases with rising mass flow rates. Based on the quantitative analysis in Section 4.1.1, turbulent viscous dissipation is identified as the predominant source of entropy production loss. This study employs the calculation formula for turbulent dissipation entropy production (i.e., Eq. (4)) as a basis for analyzing local entropy production within the impeller region. The turbulent kinetic energy (k) and turbulent eddy frequency (ω) are the key parameters governing turbulent entropy production. Figs. 11 and 12 illustrate the distributions of turbulent eddy frequency and turbulent kinetic energy. Comparing with Fig. 10, a strong correlation is observed between the high entropy production rate region B1 and turbulent eddy frequency. This suggests that the elevated entropy production rate in B1 is primarily caused by an increase in turbulent eddy frequency. Likewise, the formation of high entropy production rate regions B2 and B3 is mainly driven by the intensification of turbulent kinetic energy. To further explain the energy loss mechanism inside the impeller, we analyzed the velocity streamline distribution at different mass flow rates and cross sections.

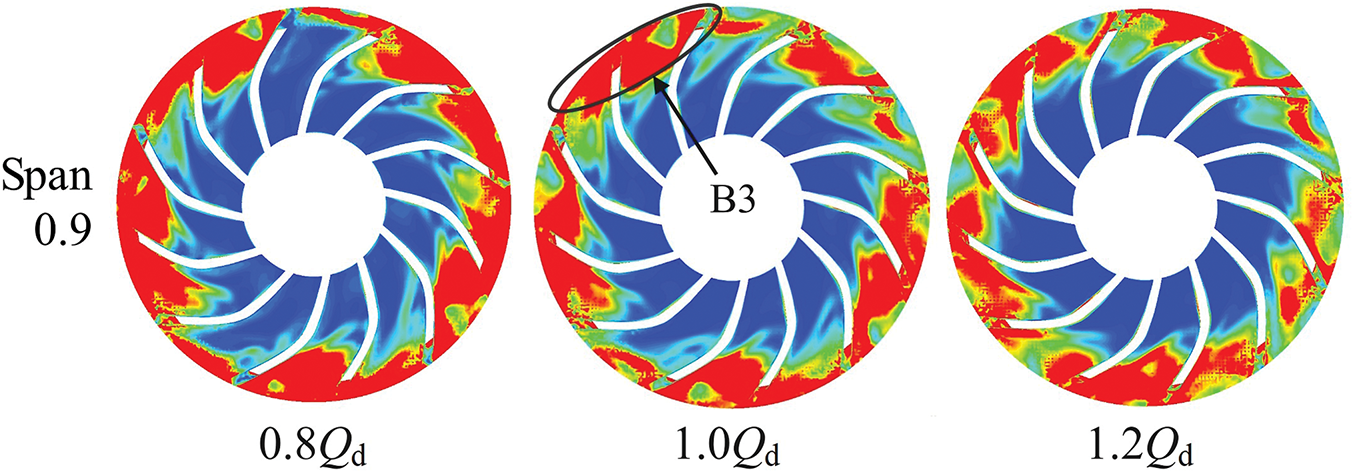
Figure 10: Distribution of local entropy production rate of impeller
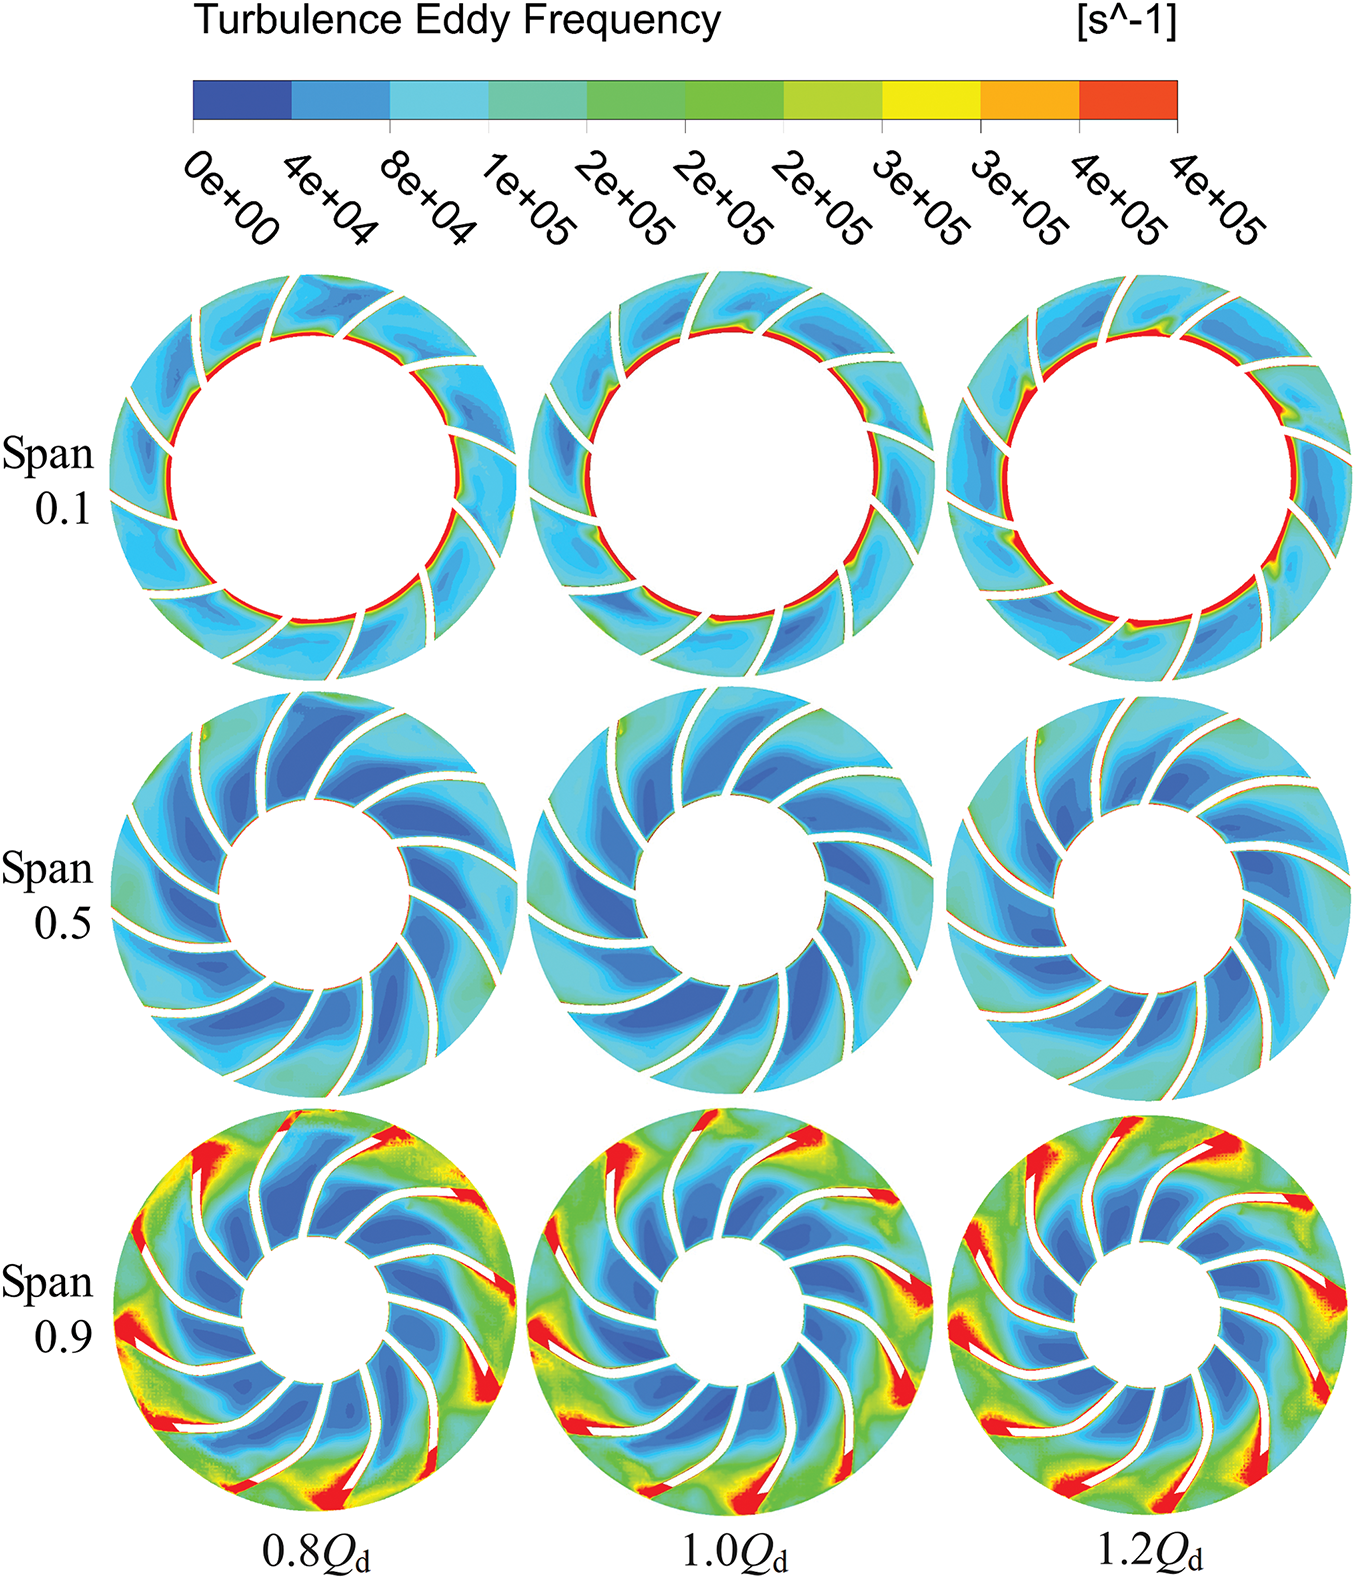
Figure 11: Turbulence eddy frequency distribution of impeller
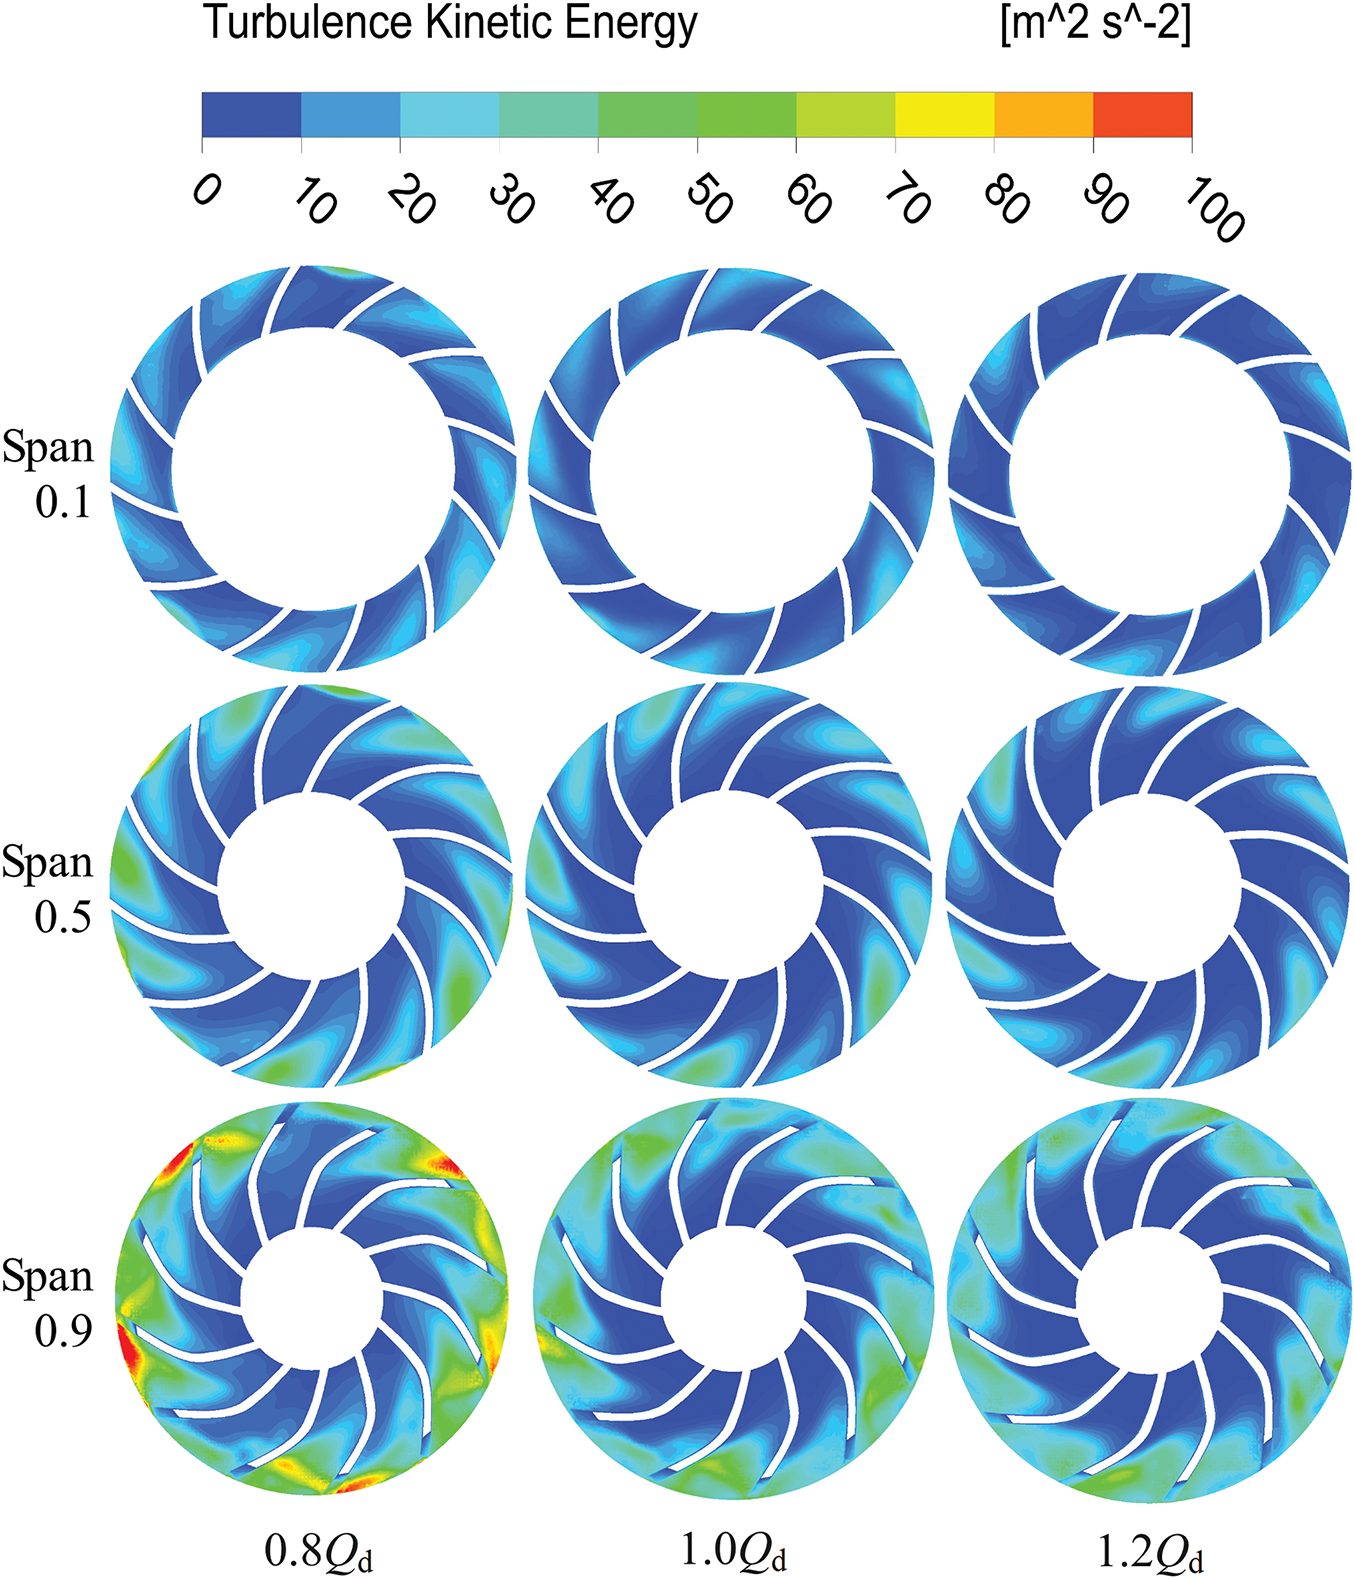
Figure 12: Turbulent kinetic energy distribution of impeller
As seen in Fig. 6, region B1 is located near the impeller’s hub-side and close to the outlet. Within this locale, a prominent interaction between the blade and the hub is discernible. Consequently, as the fluid progresses through this specific domain, there is a notable expansion in the flow area. This expansion engenders a pronounced adverse pressure gradient, instigating flow complexity and an escalation in the frequency of turbulent eddies. Therefore, the production rate of entropy in this region rises. Moreover, as the mass flow rate increases, the shear and viscous forces acting upon the hub-side wall are heightened. This enhancement leads to a sustained increase in the entropy generation rate within region B1.
The B2 and B3 regions represent high entropy production areas within the tip clearance region of impeller on the Span0.5 and Span0.9 cross sections. Fig. 13 reveals that the flow in the span 0.9 section exhibits complexity, characterized by numerous low-velocity regions and vortices. The presence of these flow structures reduces the flow passage capacity, induces flow non-uniformity, compromises flow stability, and increases the turbulent eddy frequency within the region. The underlying reason for these results, as illustrated in Fig. 14, is attributed to the tip clearance that induces leakage flow across the blade surfaces due to the pressure differential. These leakage flows rapidly expand along the tip clearance and merge with the main flow, resulting in chaotic flows in the region and a subsequent increase in turbulent kinetic energy. Consequently, the entropy production rate is enhanced.
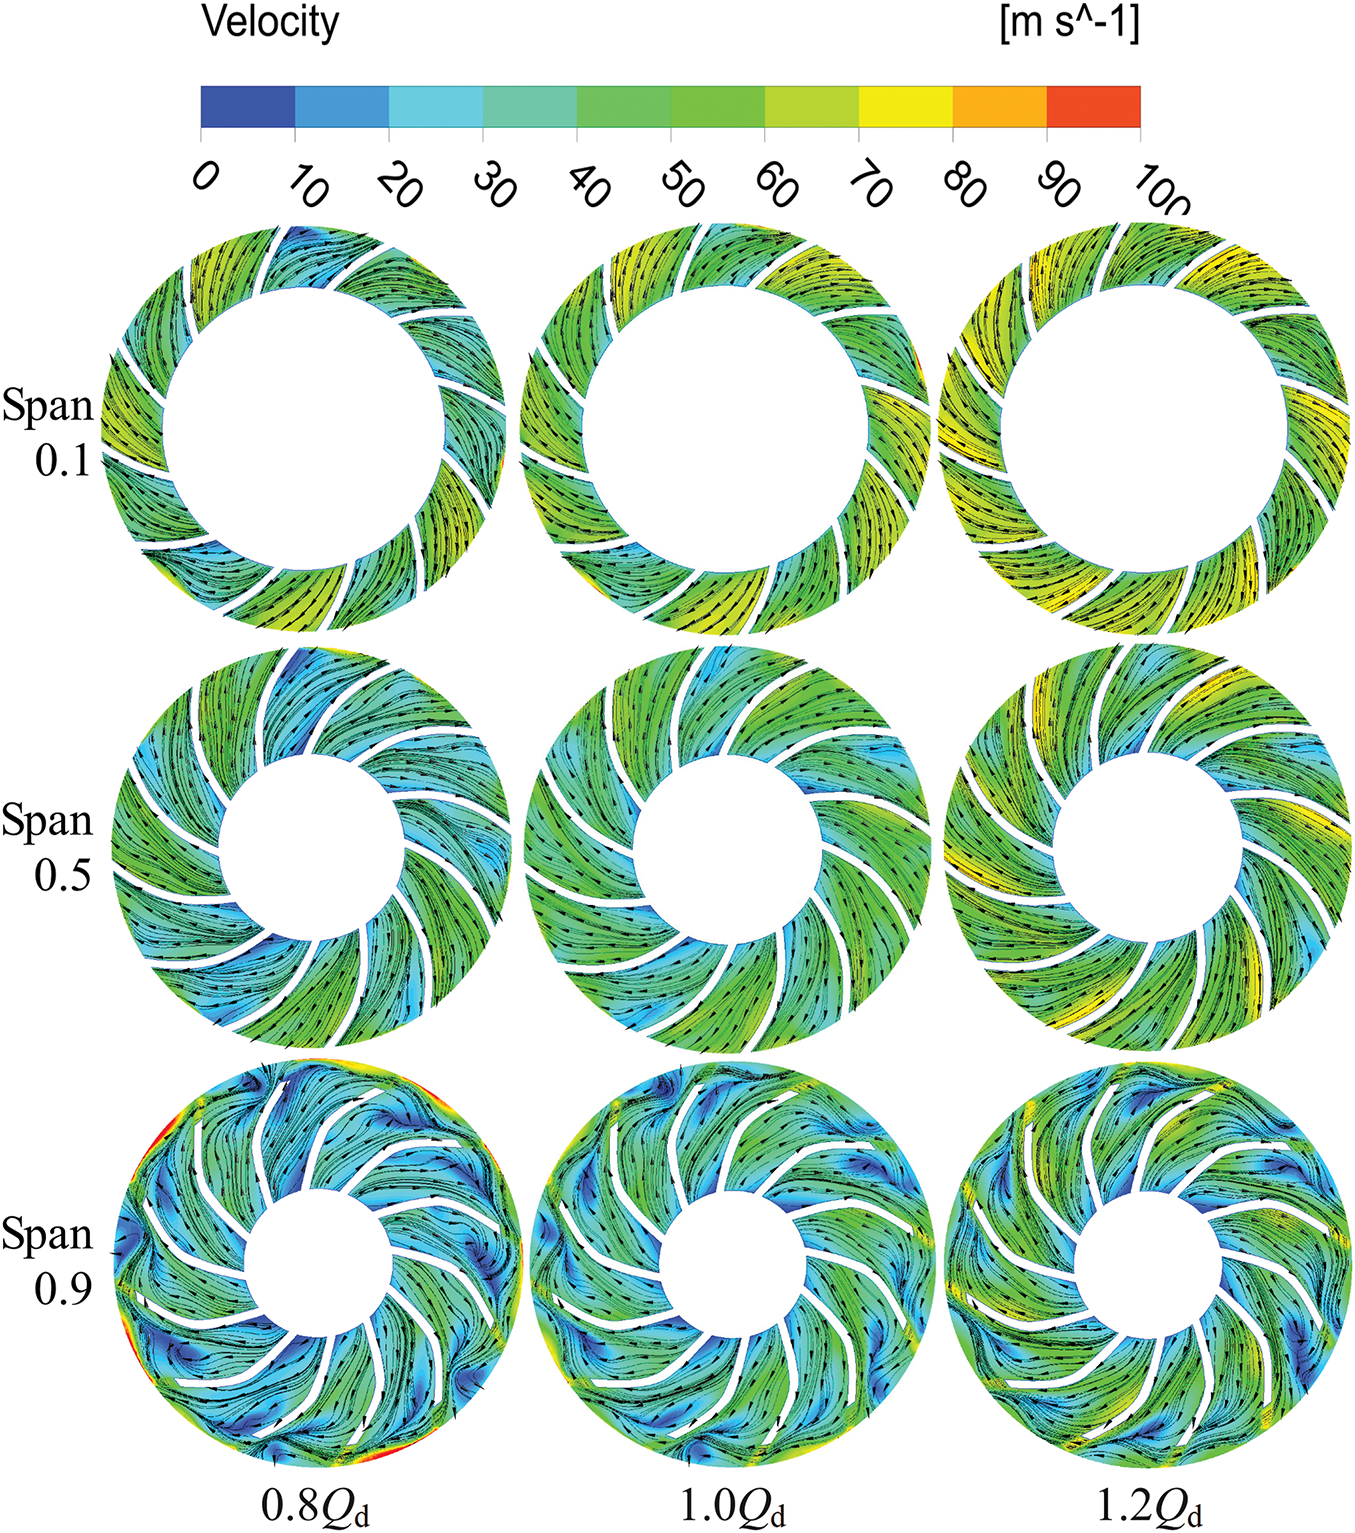
Figure 13: Velocity streamline of impeller
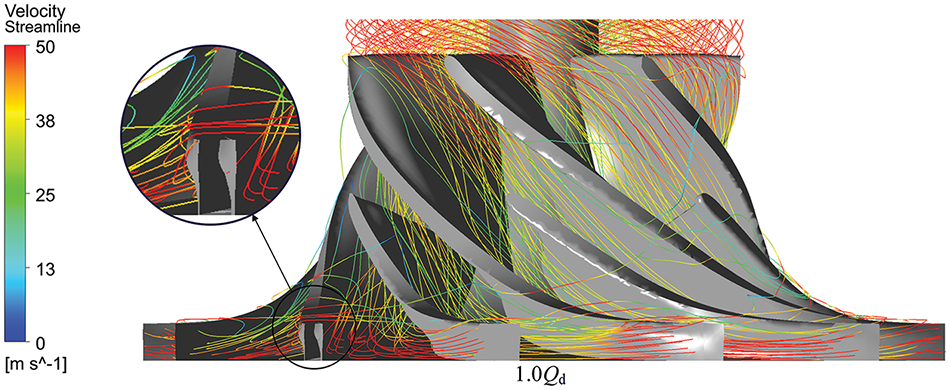
Figure 14: Diagram of impeller rotation field flow under the design condition
4.2.2 Analysis of the Entropy Production Rate of Compressor Diffuser
As a key flow passing component of compressors, the diffuser exhibits entropy production losses second only to the impeller, representing one of the primary loss sources in the overall compressor. Therefore, exploring the entropy production within the diffuser region is crucial for understanding the overall compressor loss.
Fig. 15 illustrates the distribution of local entropy production rates on the diffuser’s meridional plane under various mass flow rates. The figure reveals three distinctive regions characterized by high entropy production rates within the diffuser. The first and second regions are situated on the shroud side and hub side of the diffuser, respectively, while the third one is located in the middle of the flow passage. As flow rates increase, high energy loss areas on both the shroud and hub sides of the diffuser grow larger and stronger. This happens because faster flows create more friction and fluid resistance near the walls, leading to greater energy loss in these zones. To illuminate the distribution of entropy production rates in the middle of the diffuser passage and to dissect the underlying mechanisms of energy losses within the diffuser, this study made a thorough comparative analysis of the central cross section of the diffuser under diverse flow conditions.
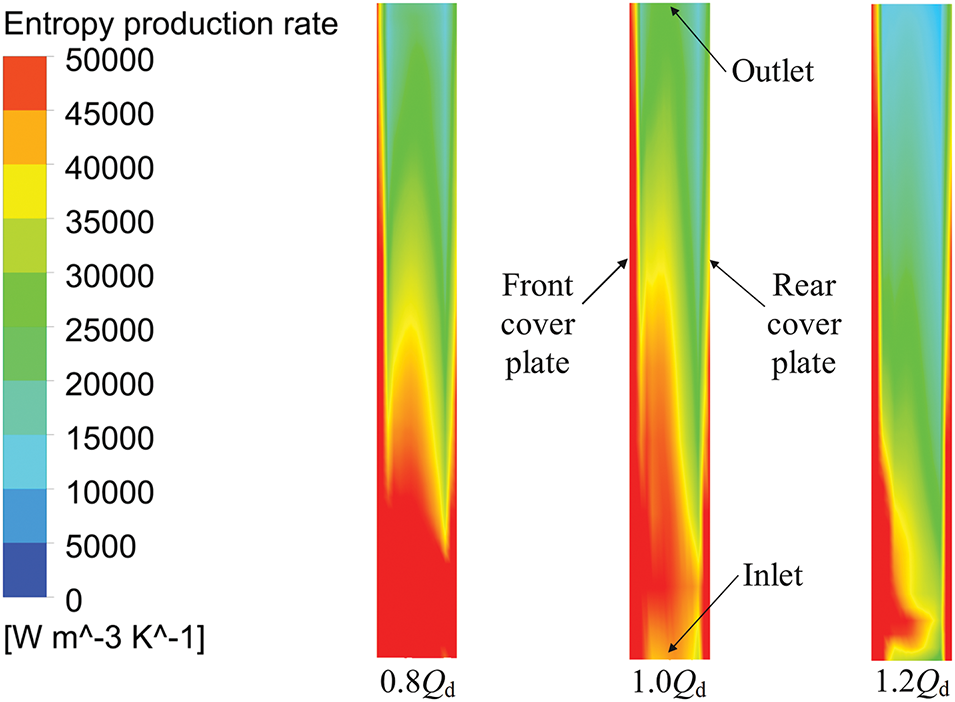
Figure 15: Distribution of local entropy production rate on the meridian plane of diffuser
Fig. 16 illustrates the distribution of local entropy production rate on the central cross section of the diffuser. It is evident that regions with elevated entropy production rate are predominantly concentrated in the C1 region, which is at the trailing edge of the impeller, and the C2 region, which lies within the middle portion of the diffuser flow passage. As the mass flow rate increases, the area of high entropy production within the diffuser gradually diminishes. Fig. 17 presents the distribution of turbulent eddy frequencies, highlighting the correlation between the C1 region and areas of high turbulence eddy frequencies. Analysis indicates the presence of wake vortices at the blade’s trailing edge, which disrupt the uniform distribution of velocity and result in an increased turbulent fluctuation frequency in this region. Consequently, this process augments the entropy production rate. Fig. 18 illustrates the distribution of turbulent kinetic energy. It can be observed that the increase in entropy generation rate in C2 region is attributed to the enhancement of turbulent kinetic energy. Further elucidation will be provided in subsequent analyses, in conjunction with velocity streamline contours.
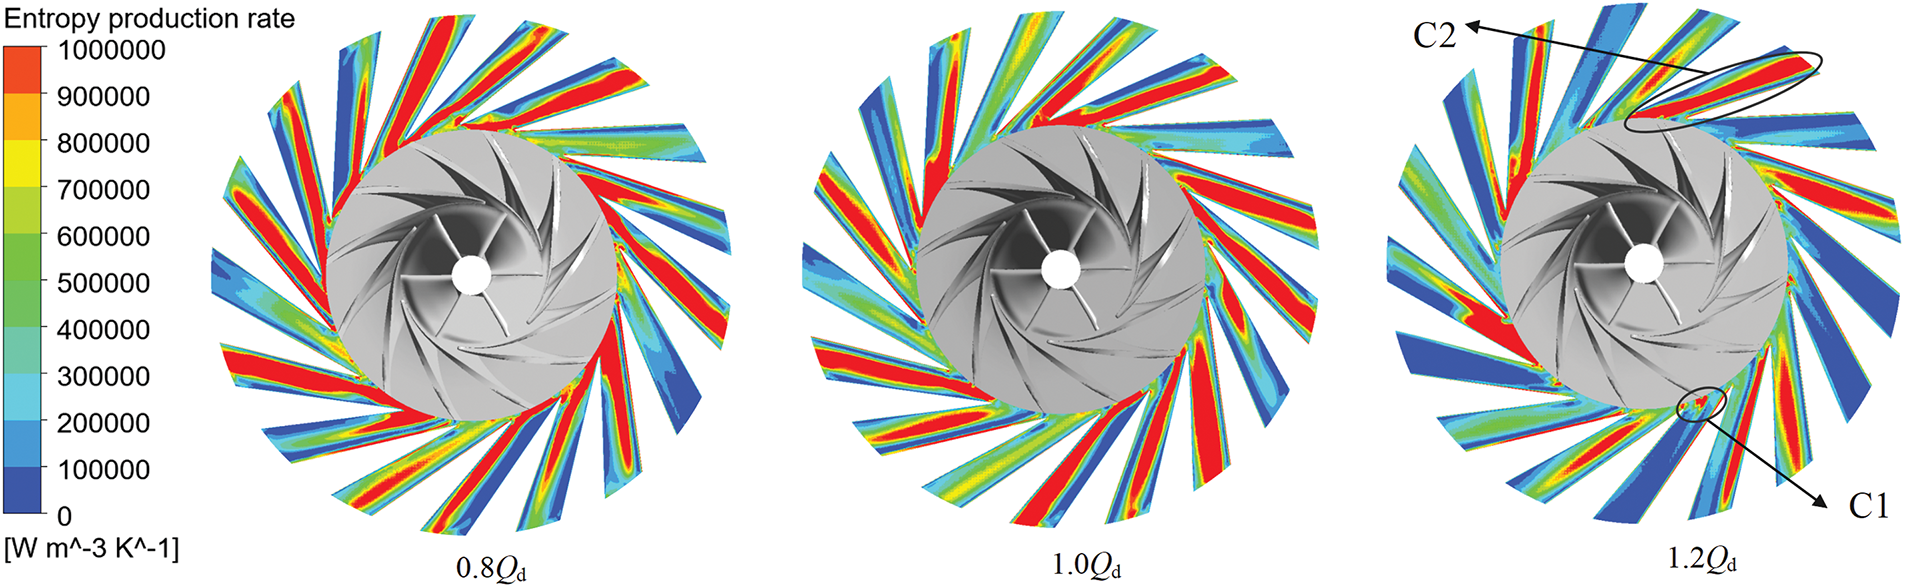
Figure 16: Local entropy production rate distribution of diffuser
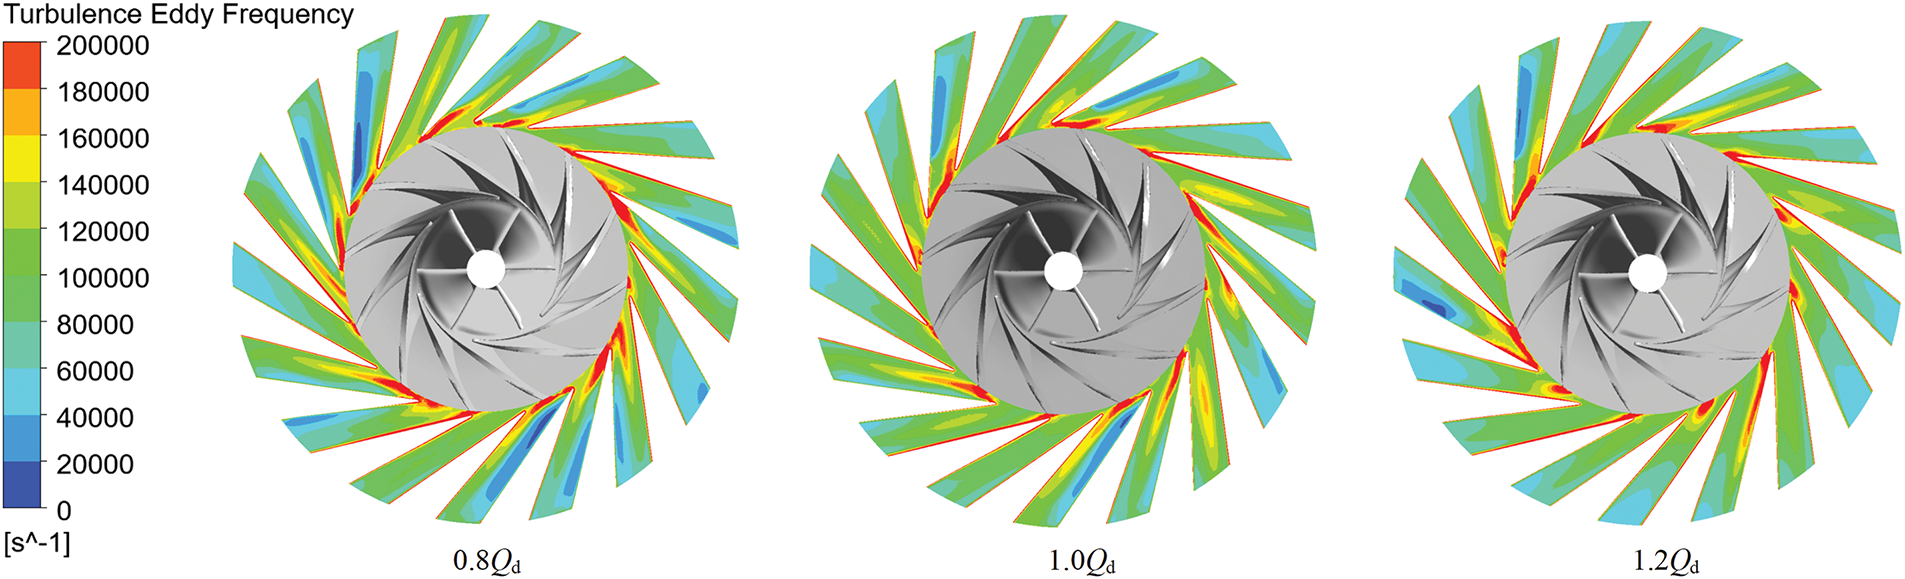
Figure 17: Turbulence eddy frequency distribution of diffuser
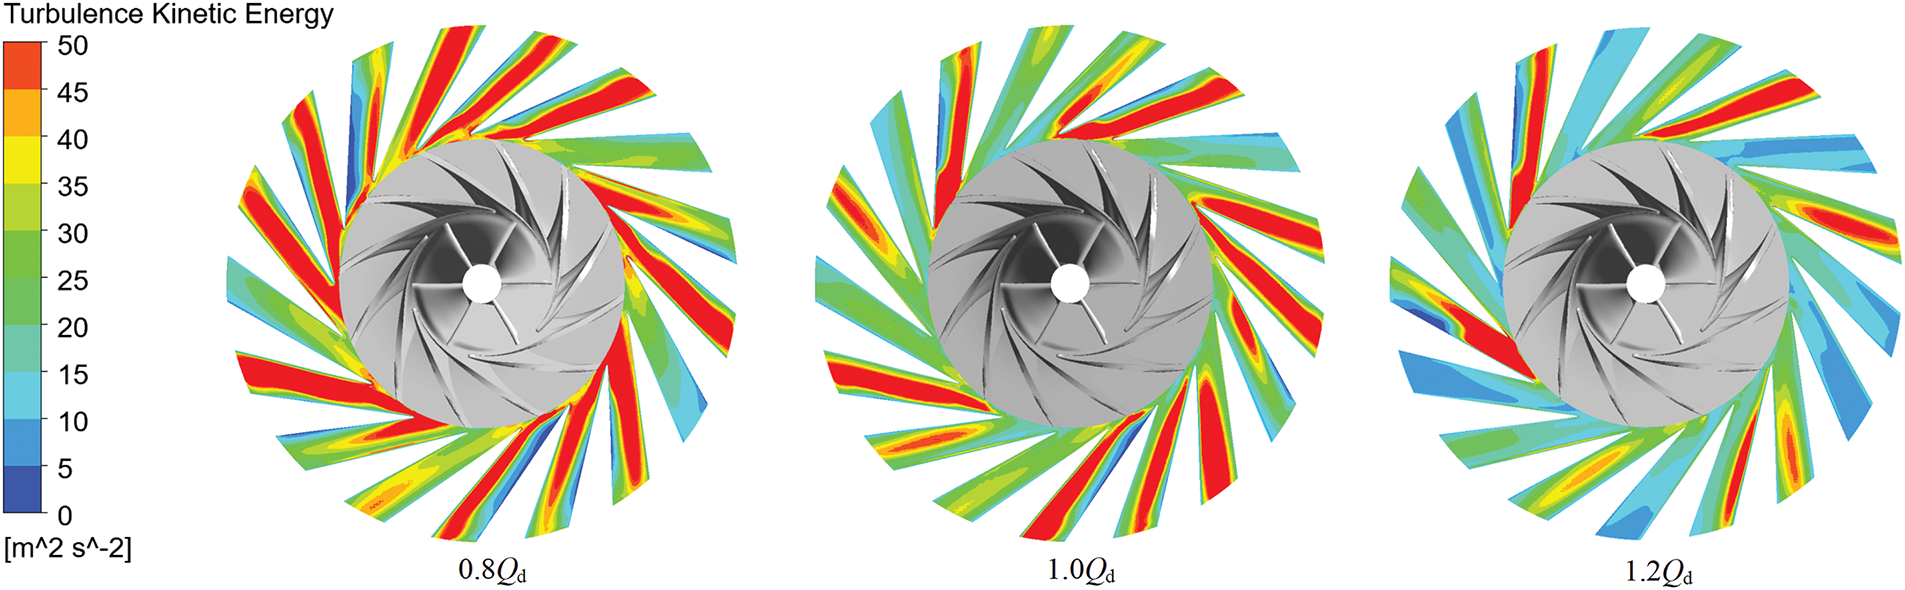
Figure 18: Turbulent kinetic energy distribution of diffuser
Fig. 19 illustrates the velocity streamline within the central cross section of the diffuser across different mass flow rates. The figure unveils the presence of low-speed zones and vortices of varying degrees in the flow passage, particularly in the region C2 where is located with a high entropy production rate. These low-speed zones occupy a considerable portion of the flow passage area, thereby inducing heightened flow chaos, intensified turbulence, and decreased flow stability within the C2 region. The increased turbulent kinetic energy in this region results in a higher entropy generation rate, which in turn induces greater energy losses. Further exploration of the flow characteristics within the diffuser region reveals that the inlet airflow angle of the diffuser is small, and there is a negative angle of attack at the inlet leading edge, leading to flow separation on the suction side of the diffuser. As the fluid approaches the clog boundary, there is a noticeable augmentation in turbulence intensity and flow chaos, culminating in a region characterized by high entropy production. As the mass flow rate rises, the diffuser inlet air flow angle increases, shrinking the low velocity zone. This leads to a contraction in the spatial extent of elevated entropy production rate zones.

Figure 19: Velocity streamline of diffuser
4.2.3 Analysis of Compressor Volute Entropy Production
In the sCO2 centrifugal compressor, the volute serves to guide the airflow from the diffuser, reducing its velocity while pressurizing the gas prior to discharge through the outlet pipe. The entropy production loss within the volute constitutes approximately 20% of the total compressor loss, underscoring the significance of studying this region. To facilitate the precise identification of loss locations in future analyses, the central cross section of the volute was selected for exploration, as depicted in Fig. 20.
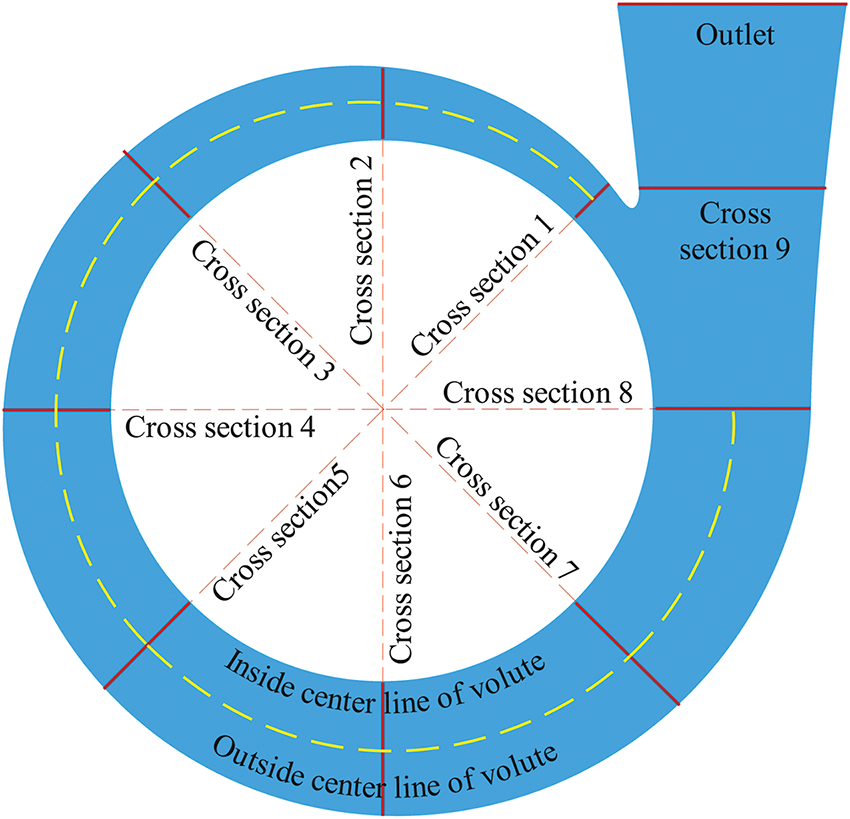
Figure 20: Important structure and area of volute
Fig. 21 presents the distribution of local entropy production rate within the volute region of the centrifugal compressor. It reveals three distinct regions: D1, D2 and D3, with a regular distribution of high entropy production rate within the volute. Notably, D1, the region with high entropy production rate, is distributed uniformly along volute’s inlet, while the region D2 is located outside the volute’s center line, with its intensity of entropy production rate decreases progressively from the first cross section to the eighth. Both regions being associated with the diffuser outlet position. The D3 region, another area with high entropy production rate, is situated between the ninth cross section and the volute’s outlet. The energy dissipation regions have been identified, and the internal mechanisms of energy loss in these regions will be analyzed next.
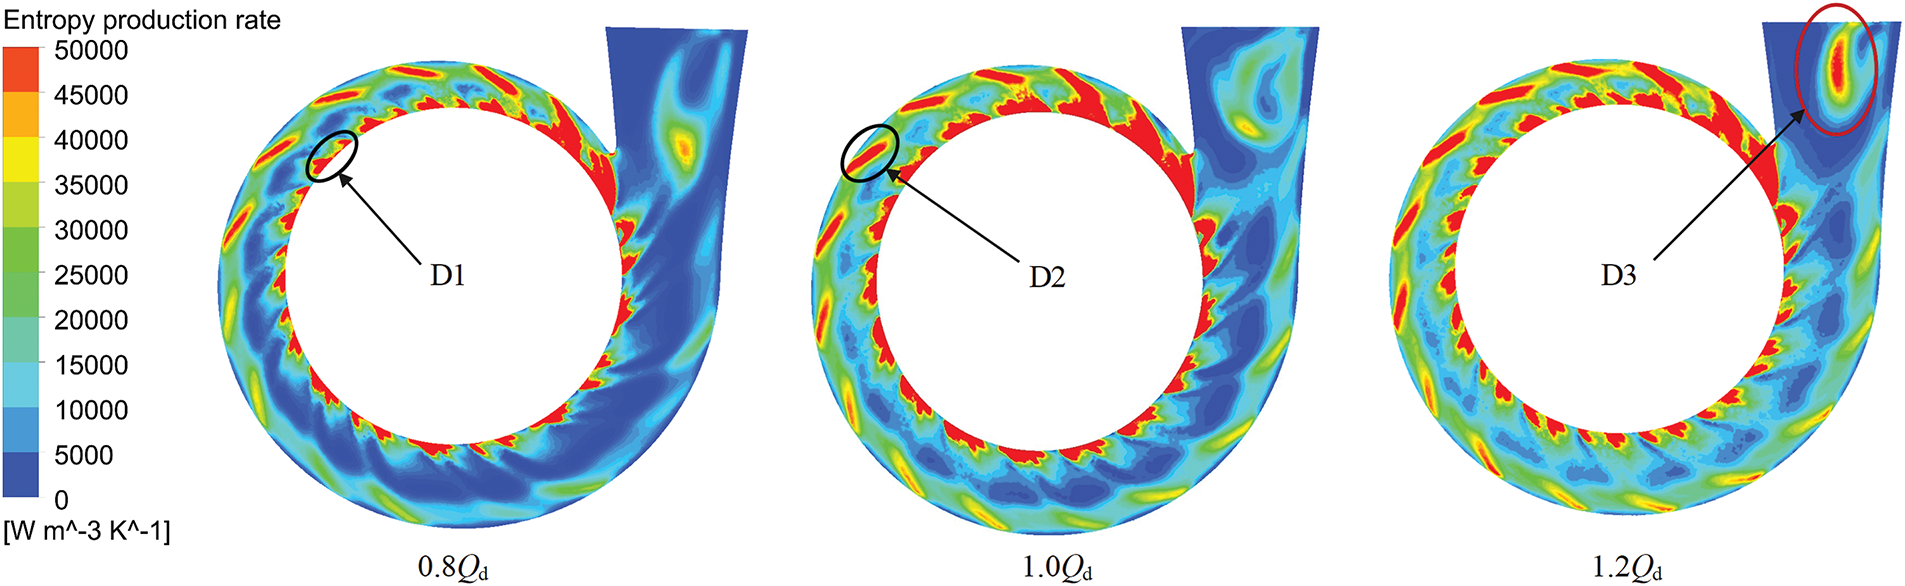
Figure 21: Distribution of local entropy production rates of volute
Fig. 22 depicts the local distribution of entropy production rates in the cross Section 4 of the volute region. It clearly indicates that region D1 is distributed peripherally to the diffuser outlet. Figs. 23 and 24 analyze the turbulent eddy frequency and turbulent kinetic energy in the central cross-section of the volute under varying flow rates. The results reveal that both the turbulent eddy frequency and kinetic energy in region D1 significantly exceed those in the mainstream regions, suggesting that these increases drive up the variation in entropy production rate within D1. In conjunction with the velocity-streamline diagram of Fig. 25, low-speed zone is observed adjacent to the volute area surrounding the diffuser outlet. Analysis of flow characteristics reveals that the primary cause for this phenomenon is the abrupt expansion of the flow area When fluid flows from the diffuser into the volute, leading to flow separation. Consequently, the turbulent fluctuation frequency increases, accompanied by chaotic flow and elevated turbulent kinetic energy within the fluid, thereby driving a marked escalation in the entropy generation rate.
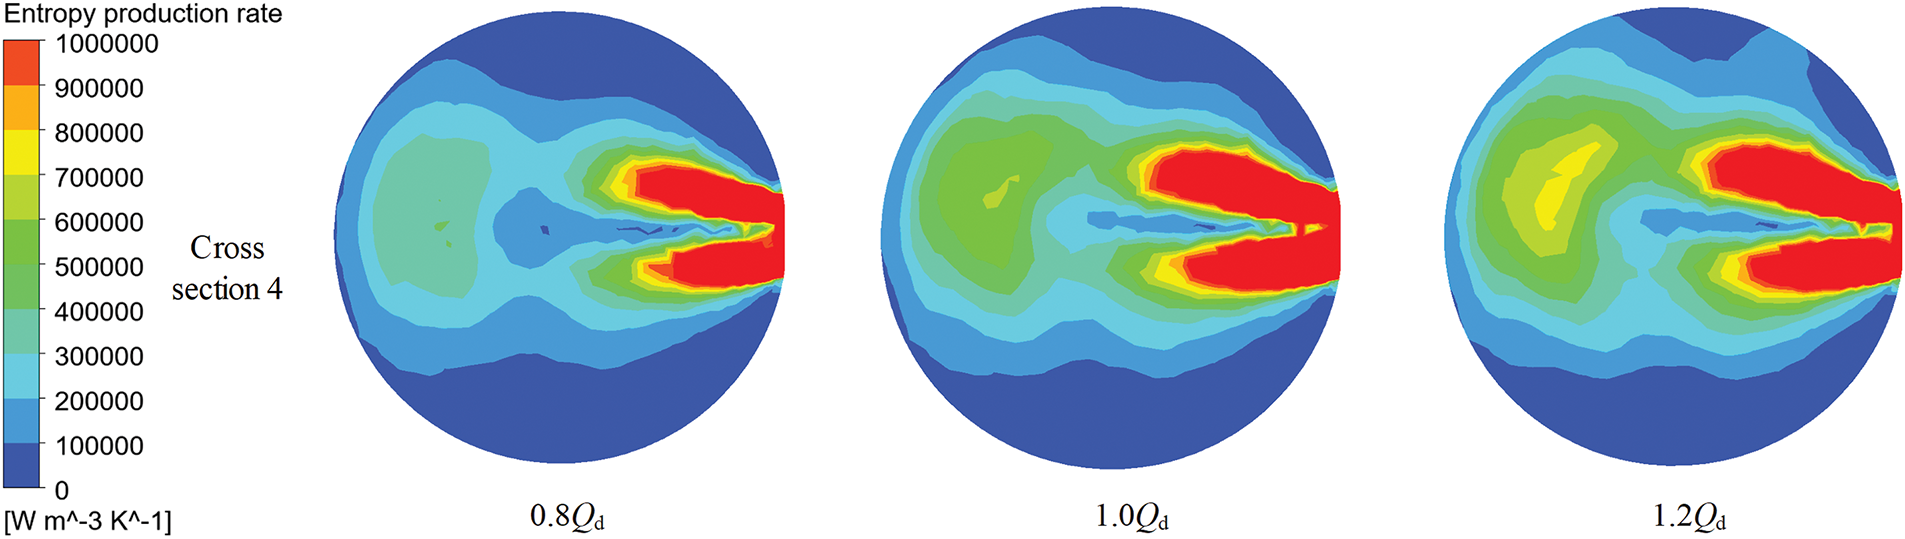
Figure 22: Distribution of local entropy production rates in the fourth section

Figure 23: Turbulent eddy frequency distribution of volute
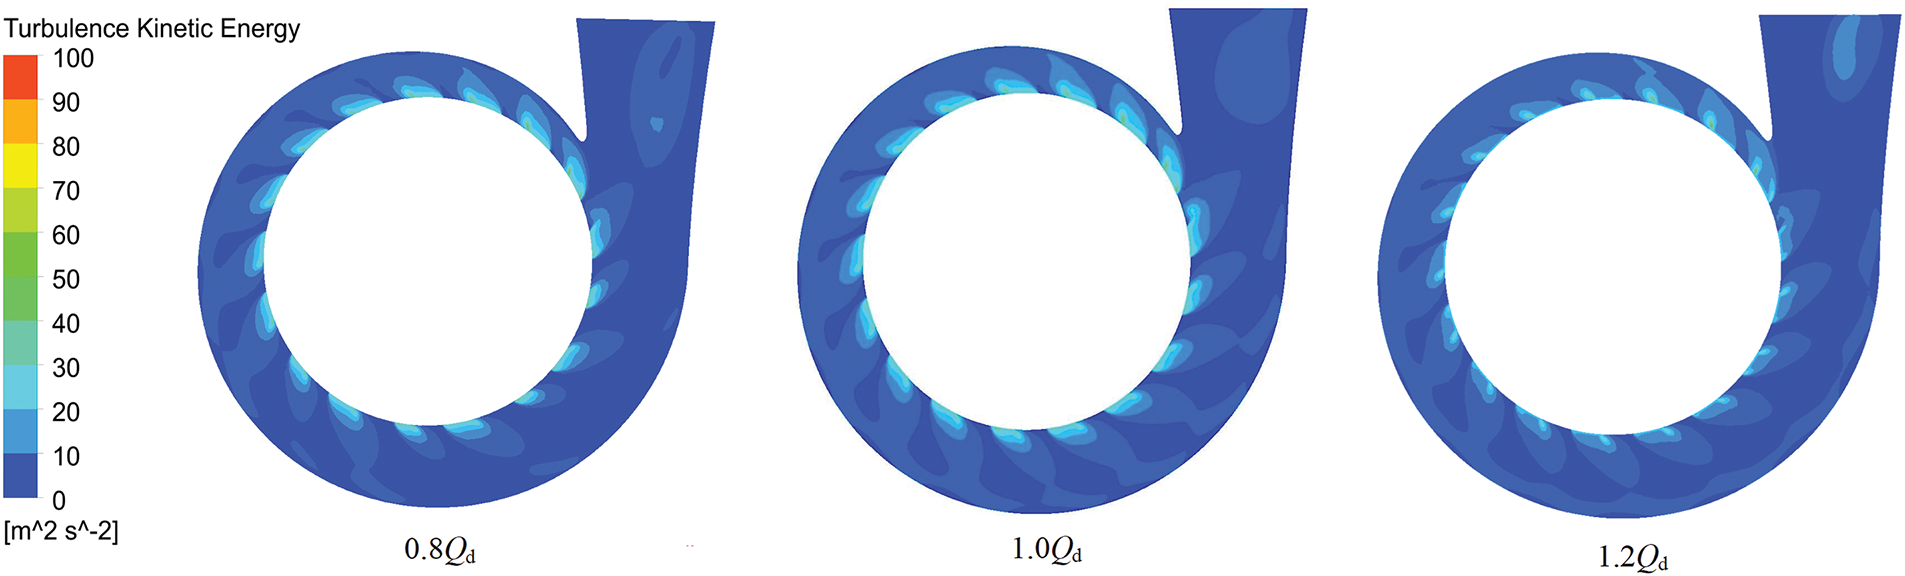
Figure 24: Turbulent kinetic energy distribution of volute
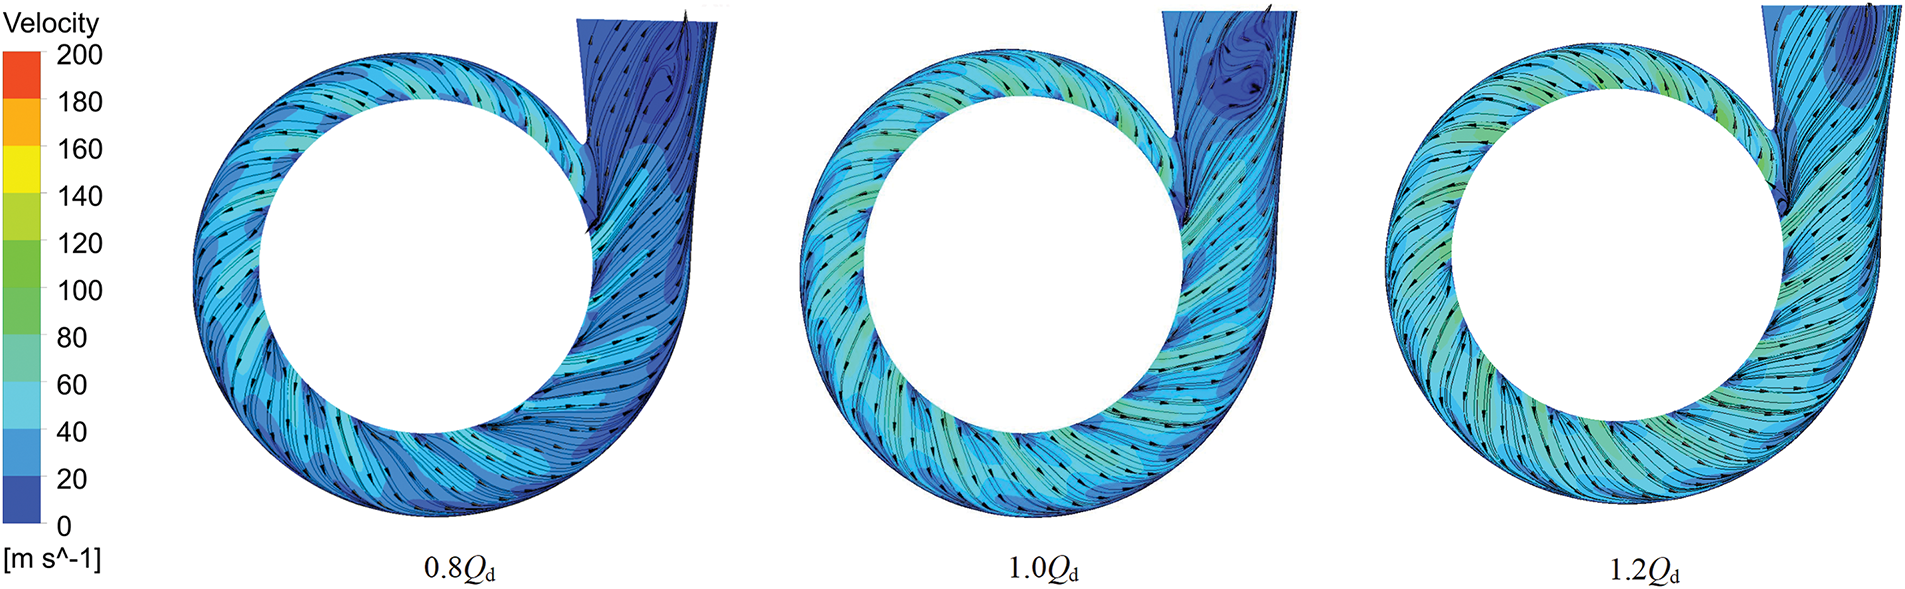
Figure 25: Velocity streamline of volute
Region D2 is distributed in a discrete strip along the outer center line of the volute, with its intensity diminishing progressively along the flow direction, ultimately vanishing at section 8. Fig. 25 reveals the low-velocity areas in the velocity-flow diagram. Fig. 26, depicting the velocity-streamline of the cross section 2, 4, 6, 8, clearly demonstrates that the high-speed fluid at the diffuser outlet strikes the outer wall of the volute and subsequently diverts along both sides of the symmetric section. Rotating vortex structures are formed on either side of the diffuser, and the high-speed fluid at the diffuser outlet creates a significant velocity gradient with the surrounding vortices, leading to an increased entropy production rate. As mass flow rate rises, the intensity of entropy production rate exhibits a hiking trend, whereas the spatial distribution of high entropy generation zones remains relatively stable.
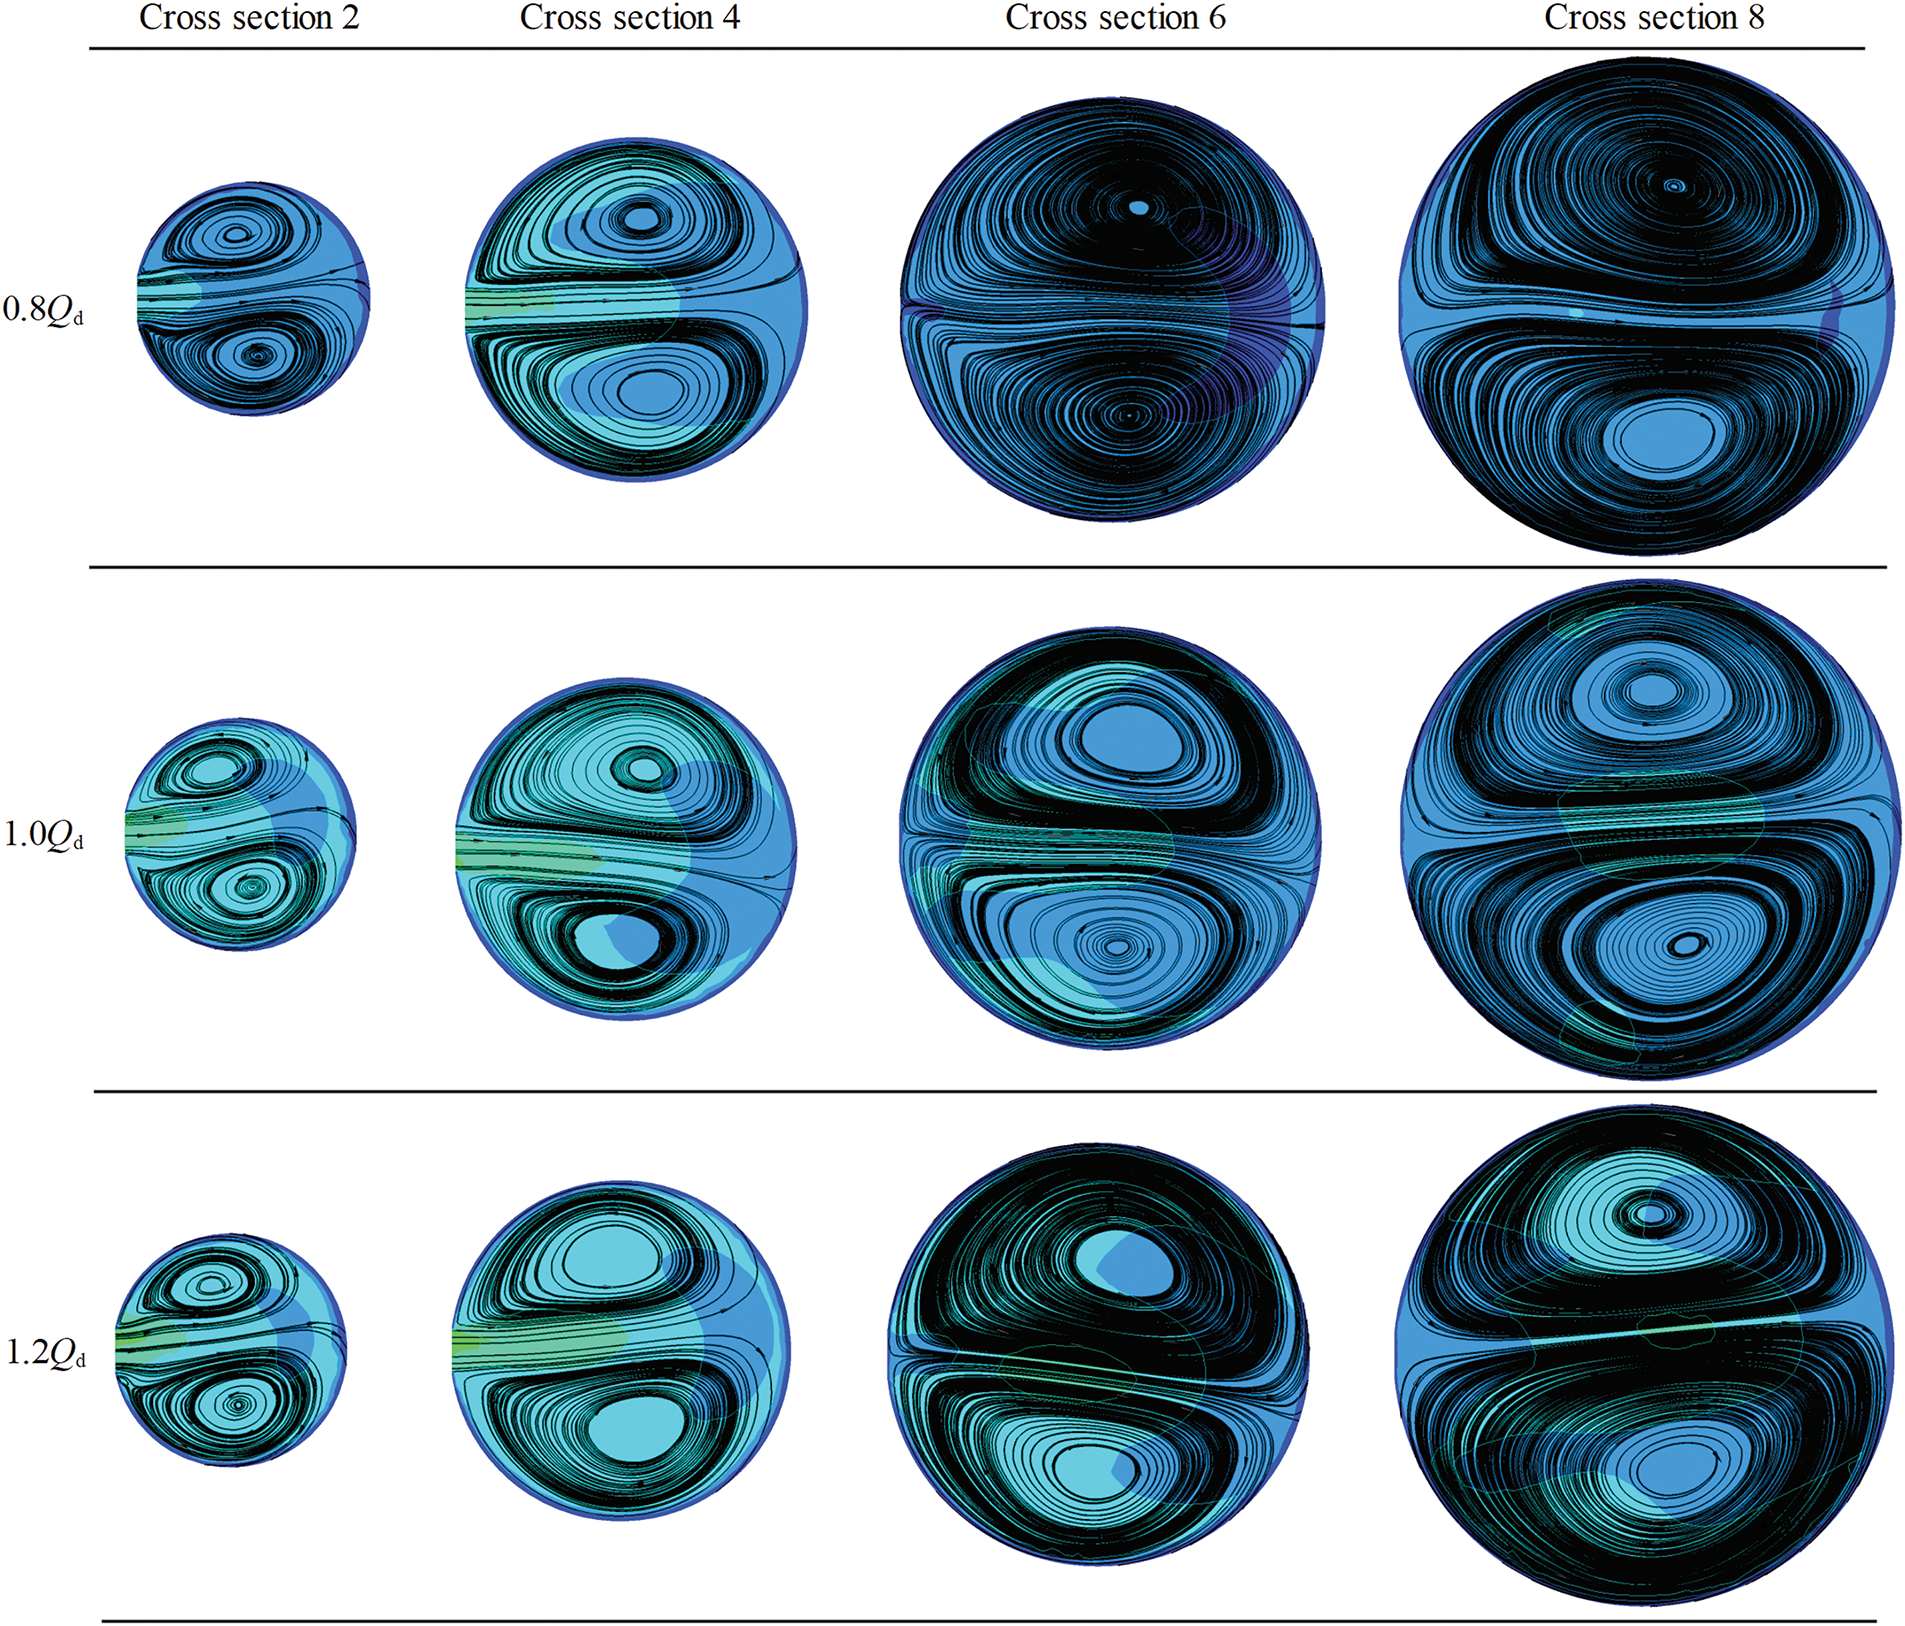
Figure 26: Velocity streamline under different cross sections
Region D3 is located between the cross section 9 of the volute and the outlet. Fig. 23 reveals high turbulent kinetic energy region D3. Fig. 24 for the velocity-streamline indicates the presence of low-speed regions and vortices in this region, suggesting that the flow here is perturbed and characterized by unstable flow. As a result, an escalation occurs in both turbulent kinetic energy and entropy production rate. As the mass flow rate increases, the position of this region progressively shifts towards the volute outlet, accompanied by a marked enhancement in both the range and intensity of the entropy production rate.
This study utilized the entropy production theory to investigate energy dissipation in an sCO2 compressor and its components at varying mass flow rates. The key findings are summarized as follows:
(1) Entropy production losses in the compressor were analyzed and ranked in terms of magnitude. The primary sources of entropy production loss identified were turbulent viscous dissipation, fluctuating temperature, direct viscous dissipation, and mean temperature gradient. Interestingly, the relative contributions of these sources remained relatively constant with increased mass flow rates, although the total entropy production loss exhibited a pattern of initial decrease followed by an increase.
(2) Internal losses within the impeller are mainly attributed to leakage flow at the tip clearance. These losses exhibit a non-monotonic trend with changes in mass flow rate.
(3) Entropy production losses within the diffuser decreased as mass flow rate increased. The areas with high entropy production rates were primarily located at the shroud and hub sides of the diffuser, as well as the central flow passage. This distribution pattern is attributable to the inlet airflow angle, and it results in low-speed zones and vortices within each flow passage and consequently elevates the entropy production rate.
(4) Entropy production losses in the volute decreased with higher mass flow rates. The regions with high entropy production are primarily concentrated around the diffuser outlet and beyond the corresponding volute center line. These high-entropy production zones are a consequence of flow separation, precipitated by the abrupt expansion of the diffuser outlet flow area.
In conclusion, this study employed the entropy production theory to identify energy loss sources in an sCO2 compressor, delineate high-loss areas within flow-through components, and explain the origins of these losses. However, it is important to note that this analysis was limited to steady-state flow conditions. Future research should explore the distribution and sources of losses under unsteady flow conditions to enhance our understanding of sCO2 compressor dynamics and efficiency.
Acknowledgement: None.
Funding Statement: This work was supported by the Double First-Class Key Program of Gansu Provincial Department of Education (grant number GCJ2022-38), Science and Technology Program of Gansu Province (grant number 22ZD6GA038), Key Research and Development Program of Gansu Province—Industrial Project (grant number 25YFGA021).
Author Contributions: Senchun Miao: Conceptualization (equal); Data curation (lead); Formal analysis (lead); Investigation (lead); Methodology (lead); Writing—original draft (lead); Writing—review & editing (equal). Wenkai Hu: Conceptualization (equal); Formal analysis (supporting); Writing—original draft (lead); Investigation (supporting); Methodology (supporting). Jiangbo Wu: Methodology (supporting); Supervision (supporting); Writing—review & editing (equal). Zhengjing Shen: Methodology (supporting); Supervision (supporting); Writing—review & editing (equal). Xiaoze Du: Conceptualization (supporting); Writing—review & editing (equal). All authors reviewed the results and approved the final version of the manuscript.
Availability of Data and Materials: The data presented in this study are available on request from the corresponding author.
Ethics Approval: Not applicable.
Conflicts of Interest: The authors declare no conflicts of interest to report regarding the present study.
Nomenclature
| Entropy production rate [W/(K m3)] | |
| Entropy production [W/K] | |
| Irreversible energy loss [W] | |
| Specific heat capacity at constant pressure [J/(kg K)] | |
| Eddy viscosity [Pa s] | |
| Turbulent Prandtl number | |
| U | Velocity [m/s] |
| X | Cartesian coordinates [m] |
| T | Temperature [K] |
| y+ | Non-dimensional distance from wall |
| Greek Letters | |
| κ | Turbulence Kinetic Energy [m2/s2] |
| Ω | Turbulence Dissipation Rate [s−1] |
| Μ | Dynamic Viscosity [Pa s] |
| Ξ | Isentropic efficiency |
| Λ | Thermal conductivity [W/(m K)] |
| λ | Density [kg/m2] |
| Subscripts | |
| Time-Averaged Value | |
| Fluctuating Value | |
| D | Velocity gradient |
| H | Temperature gradient |
References
1. Li J, Liu F, Li ZY, Shao CC, Liu XY. Grid-side flexibility of power systems in integrating large-scale renewable generations: a critical review on concepts, formulations and solution approaches. Renew Sustain Energy Rev. 2018;93(3):272–84. doi:10.1016/j.rser.2018.04.109. [Google Scholar] [CrossRef]
2. Vertkin MA, Egorov PV, Esin SB, Kolpakov SP, Mikhailov VE, Sukhorukov YG. Carbon dioxide power systems: research lines at Initial design stages and application prospects in Russia. Therm Eng. 2022;69(4):267–78. doi:10.1134/S0040601522040085. [Google Scholar] [CrossRef]
3. Yang H, Du XZ. Performance analysis and multi-objective optimization of Brayton cycle pumped thermal energy storage. Proc CSEE. 2022;42(1):196–211. doi:10.13334/j.0258-8013.pcsee.211100. [Google Scholar] [CrossRef]
4. Zhang L, Dong Z, Yang ZY, Sun NH. Performance and flow field analysis of supercritical carbon dioxide circulation centrifugal compressor. J Eng Thermophys. 2023;44(5):1209–18. [Google Scholar]
5. Alessandro R, Paolo G, Andrea G, Giacomo P. The role of turbomachinery performance in the optimization of supercritical carbon dioxide power systems. J Turbomach. 2020;142(7):1–39. doi:10.1115/1.4046182. [Google Scholar] [CrossRef]
6. Giacomo P, Paolo G, Alessandro R, Lorenzo T, Fulvio BE, Roberto V. Implications of phase change on the aerodynamics of centrifugal compressors for supercritical carbon dioxide applications. J Eng Gas Turbines Power. 2021;143(4):041007. doi:10.1115/1.4049924. [Google Scholar] [CrossRef]
7. Bao WR, Yang C, Wang WL, Du YD, Fu L. Effect of inlet temperature on flow behavior and performance characteristics of supercritical carbon dioxide compressor. Nucl Eng Des. 2021;380:111296. doi:10.1016/j.nucengdes.2021.111296. [Google Scholar] [CrossRef]
8. Liu CG. Numerical simulation of internal flow field in supercritical carbon dioxide centrifugal compressor [dissertation]. Beijing, China: North China Electric Power University; 2022. (In Chinses). [Google Scholar]
9. Kumar H, Mistry CS. Numerical performance and flow field study of centrifugal compressor with supercritical carbon-dioxide (sCO2). In: Proceedings of the ASME, 2019 Gas Turbine India Conference; 2019; Chennai, India: aSME. [Google Scholar]
10. Liu ZY, Tong ZT, Ju PF, Zhang C. Internal flow performance analysis of supercritical carbon dioxide centrifugal compressor at different rotational speeds. J Tianjin Univ Technol. 2022;38(4):1–6. (In Chinese). [Google Scholar]
11. Raman SK, Kim HD. Computational analysis of the performance characteristics of a supercritical CO2 centrifugal compressor. Computation. 2018;6(4):54. doi:10.3390/computation6040054. [Google Scholar] [CrossRef]
12. Du QW, Zhang D, Xie YH. Investigation on steady aerodynamic performance of a sCO2 compressor with different diffusers in solar power system. IOP Conf Ser Mater Sci Eng. 2019;556(1):012027. doi:10.1088/1757-899X/556/1/012027. [Google Scholar] [CrossRef]
13. Shi DB, Xie YH. Aerodynamic optimization design of a 150kW high performance supercritical carbon dioxide centrifugal compressor without a high speed requirement. Appl Sci. 2020;10(6):2093. doi:10.3390/app10062093. [Google Scholar] [CrossRef]
14. Saravi SS, Tassou SA. Diffuser performance of centrifugal compressor in supercritical CO2 power systems. Energy Proc. 2019;161:438–45. doi:10.1016/j.egypro.2019.02.079. [Google Scholar] [CrossRef]
15. Pei JZ, Wang SC, Zhao Z. Effect of inlet guide vanes on flow behavior and performance of S-CO2 centrifugal compressors. Proc CSEE. 2024;44(19):7717–26. doi:10.13334/j.0258-8013.pcsee.231380. [Google Scholar] [CrossRef]
16. Romei A, Paolo G, Giacomo P. Computational fluid-dynamic investigation of a centrifugal compressor with inlet guide vanes for supercritical carbon dioxide power systems. Energy. 2022;255:124469. doi:10.1016/j.energy.2022.124469. [Google Scholar] [CrossRef]
17. Cao R, Li ZG, Deng QH, Li J, Gao TY. Design and aerodynamic performance investigation of supercritical carbon dioxide centrifugal compressor. Acad J Xian Jiaotong Univ. 2020;54(4):44–52. [Google Scholar]
18. Dong Z. Numerical simulation of flow field characteristics of supercritical carbon dioxide centrifugal compressor [dissertation]. Beijing: North China Electric Power University; 2022. (In Chinese). [Google Scholar]
19. Zhu YM. Study on supercritical carbon dioxide centrifugal compressor [dissertation]. Beijing: University of Chinese Academy of Sciences; 2020. [Google Scholar]
20. Ren Y, Zhu ZC, Wu DH, Zhu ZB, Li XJ. Flow loss characteristics of a centrifugal pump based on entropy production. J Harbin Eng Univ. 2021;42(2):266–72. [Google Scholar]
21. Meng Q, Li GD, Mao JY, Zhao DH, Luo YT, Hou TF. Analysis of flow loss characteristics of a multistage pump based on entropy production. Water. 2024;16(20):2974. doi:10.3390/w16202974. [Google Scholar] [CrossRef]
22. Li CH, Wu XT, Luo XQ, Feng JJ, Zhu GJ. Investigation on the entropy production distribution in a multiphase pump considering gas-liquid two-phase velocity slip. Phys Fluids. 2023;35(10):103306. doi:10.1063/5.0169251. [Google Scholar] [CrossRef]
23. Wang W, Wang J, Liang J, Li JJ. Entropy production theory based design methodology for multi-objective airfoil shape optimization. Acta Aerodynamic Sinica. 2019;37(5):827–33. [Google Scholar]
24. Wang ZQ, Yang HY, Li X, Xia XX, Xie BB, Zhang XY. Energy loss evaluation of a radial inflow turbine for organic Rankine cycle application using hierarchical entropy production method. Phys Fluids. 2024;36(7):075121. doi:10.1063/5.0217453. [Google Scholar] [CrossRef]
25. Miao SC, Tan XX, Luo W, Wang XH, Yang JH. The mechanism of internal energy losses in double-suction centrifugal pumps under direct and reverse conditions. Energy. 2024;306:132547. doi:10.1016/j.energy.2024.132547. [Google Scholar] [CrossRef]
26. Li TX, Wang ZH, Wang ZF, Zhang DN. Flow losses analysis of highly-loaded centrifugal impeller based on entropy generation theory. J Eng Thermophys. 2024;45(5):1350–8. [Google Scholar]
27. Yang ZM, Jiang HS, Zhuge WL, Cai RK, Chen HX, Qian YP, et al. Flow loss mechanism in a supercritical carbon dioxide centrifugal compressor at low flow rate conditions. J Therm Sci. 2024;33(1):114–25. doi:10.1007/s11630-023-1857-0. [Google Scholar] [CrossRef]
28. Zhang JY, Tan Z, Xue ZC. Internal energy consumption analysis of counter-rotating axial-flow compressor based on entropy production theory. Phys Fluids. 2024;36(11):11359. doi:10.1063/5.0241070. [Google Scholar] [CrossRef]
29. Yang YM, Cai RK, Zhuge WL, Yang BJ, Yang YJ. Influence of real gas properties on aerodynamic losses in a supercritical CO2 centrifugal compressor. J Therm Sci. 2024;33(6):2032–46. doi:10.1007/s11630-024-2027-8. [Google Scholar] [CrossRef]
30. Wright SA, Radel RF, Vernon ME, Rochau GE, Pickard PS. Operation and analysis of a supercritical CO2 Brayton cycle; 2010. Sandia Report No.: SAND2010-0171. [Google Scholar]
31. Wang JF, Guo YM, Zhou KH, Xia JX, Li Y, Zhao P. Design and performance analysis of compressor and turbine in supercritical CO2 power cycle based on system-component coupled optimization. Energy Convers Manag. 2020;221(6):113179. doi:10.1016/j.enconman.2020.113179. [Google Scholar] [CrossRef]
Cite This Article
 Copyright © 2025 The Author(s). Published by Tech Science Press.
This work is licensed under a Creative Commons Attribution 4.0 International License , which permits unrestricted use, distribution, and reproduction in any medium, provided the original work is properly cited.
 Downloads
 Citation Tools