
 Submit a Paper
 Propose a Special lssue
 Open Access
ARTICLE

Performance Analysis of sCO2 Centrifugal Compressor under Variable Operating Conditions
1 School of Energy and Power Engineering, Lanzhou University of Technology, Lanzhou, 730050, China
2 School of Energy Power and Mechanical Engineering, North China Electric Power University, Beijing, 102206, China
* Corresponding Author: Xiaoze Du. Email:
Fluid Dynamics & Materials Processing 2025, 21(8), 1789-1807. https://doi.org/10.32604/fdmp.2025.064254
Received 10 February 2025; Accepted 21 April 2025; Issue published 12 September 2025
 View Full Text
 Download PDF
Abstract
This study explores the aerodynamic performance and flow field characteristics of supercritical carbon dioxide (sCO2) centrifugal compressors under varying operating conditions. In particular, the Sandia main compressor impeller model is used as a reference system. Through three-dimensional numerical simulations, we examine the Mach number distribution, temperature field, blade pressure pulsation spectra, and velocity field evolution, and identify accordingly the operating boundaries ensuring stability and the mechanisms responsible for performance degradation. Findings indicate a stable operating range for mass flow rate between 0.74 and 3.74 kg/s. At the lower limit (0.74 kg/s), the maximum Mach number within the compressor decreases by 28%, while the temperature gradient sharpens, entropy rises notably, and fluid density varies significantly. The maximum pressure near the blades increases by 6%, yet flow velocity near the blades and outlet declines, with a 19% reduction in peak speed. Consequently, isentropic efficiency falls by 13%. Conversely, at 3.74 kg/s, the maximum Mach number increases by 23.7%, with diminished temperature gradients and minor fluid density variations. However, insufficient enthalpy gain and intensified pressure pulsations near the blades result in a 12% pressure drop. Peak velocity within the impeller channel surges by 23%, amplifying velocity gradients, inducing flow separation, and ultimately reducing the pressure ratio from 1.47 to 1.34.Keywords
Global scrutiny has increasingly focused on the primary energy sources of the Earth, particularly in light of the environmental repercussions associated with fossil fuel use. It is imperative to urgently address the challenges related to potential fuel alternatives and the prudent management of existing resources. In efforts to enhance the overall thermal efficiency of energy systems, carbon dioxide (CO2) has been introduced as an innovative working fluid in waste heat power generation systems, even at lower turbine inlet temperatures [1]. In addition, a series of challenges related to the industrialization of the sCO2 power system have also been proposed in advance [2]. Therefore, people need power generation technologies with higher energy utilization efficiency. sCO2 Brayton cycle power generation technology is also gradually becoming a research hotspot. Supercritical carbon dioxide as the working medium in the Brayton cycle Power systems with efficient and environmentally friendly advantages have garnered widespread attention. Mubashir et al. [3] conducted a thermoeconomic analysis and optimization study was conducted on the sCO2 Brayton cycle, enhancing its thermodynamic and economic performance. Researchers have also studied the layout, applications, and operating conditions of sCO2 [4–7]. The demand for efficient and environmentally friendly conversion systems is steadily increasing. As a crucial component in power cycle systems, research on sCO2 centrifugal compressors is particularly significant.
Based on the advantages of supercritical carbon dioxide (sCO2) Brayton cycle technology, research on this cycle has steadily gained traction. Sandia National Laboratories and the Tokyo Institute of Technology have conducted experimental tests to demonstrate the feasibility of the sCO2 Brayton cycle [8–10]. Pecnik et al. [11] conducted a numerical analysis of a radial inflow sCO2 compressor using the Spalart-Allmaras (S-A) model and the two-equation SST turbulence model, and compared the numerical results with the sCO2 compression cycle test data from Sandia National Laboratories. Rinaldi et al. [11,12] conducted a numerical simulation study was conducted on the Sandia main compressor impeller, revealing that the simulated efficiency and pressure ratio values exceeded those obtained from experimental results. Notably, the isentropic efficiency in the simulations surpassed the experimental values by more than 10%. Lettieri et al. [13] found that the isentropic efficiency of centrifugal compressors with blade diffusers is improved by 3.5% compared to those with no blade diffusers. Compared to air, the sCO2 working fluid in centrifugal compressors at low flow coefficients is more significantly controlled by the Ekman boundary layer at the diffuser leading edge, thereby reducing the stable operating range. Due to the losses at the blades of the sCO2 centrifugal compressor, Gasparin et al. [14] enhanced the design methodology of the sCO2 centrifugal compressor for low mass flow conditions, resulting in improved overall pressure ratios and efficiency. Hosseinpour et al. [15] introduced a novel one-dimensional design approach aimed at expanding the operating range of the sCO2 centrifugal compressor. Zheng et al. [16] discovered that decreasing the side outlet width of the bladeless diffuser cover can significantly reduce backflow and enhance compressor efficiency. At the same time, researchers have proposed several new methods for analyzing centrifugal compressors [17–19].
Stability has long been a primary concern in the study of compressor stages. Understanding and analyzing the unpredictable flow within these stages is particularly crucial for developing flow control technologies and enhancing flow stability [20,21]. CFD simulation plays a vital role in assessing the impact of mass flow on compressor performance. Utilizing CFD for performance evaluation also aids in understanding fluid instabilities and identifying necessary design modifications to minimize losses and enhance efficiency under varying flow conditions [16,22]. Research indicates that variations in the mass flow rate significantly affects compressor performance, particularly in achieving higher efficiency and stability. Kim et al. [23] investigated the flow variables inside the compressor to explore the main reasons for the relatively high efficiency of the compressor near the critical point. Yang et al. [24] found that flow loss is associated with vortices formed within the compressor, which are induced by flow separation in the downstream region of the impeller passage. Fujisawa et al. [25] and Zamiri et al. [26] studied the diffusers of centrifugal compressors with different blade configurations and found that the flow characteristics at the diffuser inlet determine the flow stability within the centrifugal compressor. Yang et al. [27,28] investigated the impact of pressure fluctuations on compressibility stability under unsteady conditions. The operating range of a compressor is constrained by two extremes: surge and choke. At these extremes, the compressor’s efficiency is significantly lower than under normal operating conditions. Consequently, the stable operating conditions of the compressor are limited to these two boundaries. To expand the operating range of centrifugal compressors, a more comprehensive examination of their aerodynamic characteristics and internal flow behavior under extreme conditions is necessary.
This paper investigates the changes in aerodynamic performance and flow characteristics of supercritical carbon dioxide (sCO2) centrifugal compressors under varying operating conditions. The research utilizes a compressor impeller from Sandia National Laboratories. The study determines the limiting operating conditions for stable compressor operation and analyzes the aerodynamic performance and flow characteristics of the compressor within these limits. Additionally, the research elucidates the flow mechanisms responsible for performance degradation under off-design conditions in sCO2 centrifugal compressors, thereby providing a theoretical foundation for the optimal design of supercritical fluid machinery.
The geometric model parameters of the centrifugal compressor discussed in this paper have been carefully selected based on data from Sandia National Laboratories [10]. Table 1 presents the primary one-dimensional aerodynamic design parameters of the compressor impeller.
This paper first conducts a numerical simulation of a centrifugal compressor equipped with a blade diffuser mounted on the impeller. It then compares the numerical simulation results with experimental data to verify the reliability of the simulation. Table 2 presents the selected geometric parameters of the vaned diffuser.
Fig. 1 illustrates the geometric model of the compressor, which has been reconstructed based on the aforementioned parameters. In comparison to the impeller of the Sandia compressor, it demonstrates a high degree of similarity.
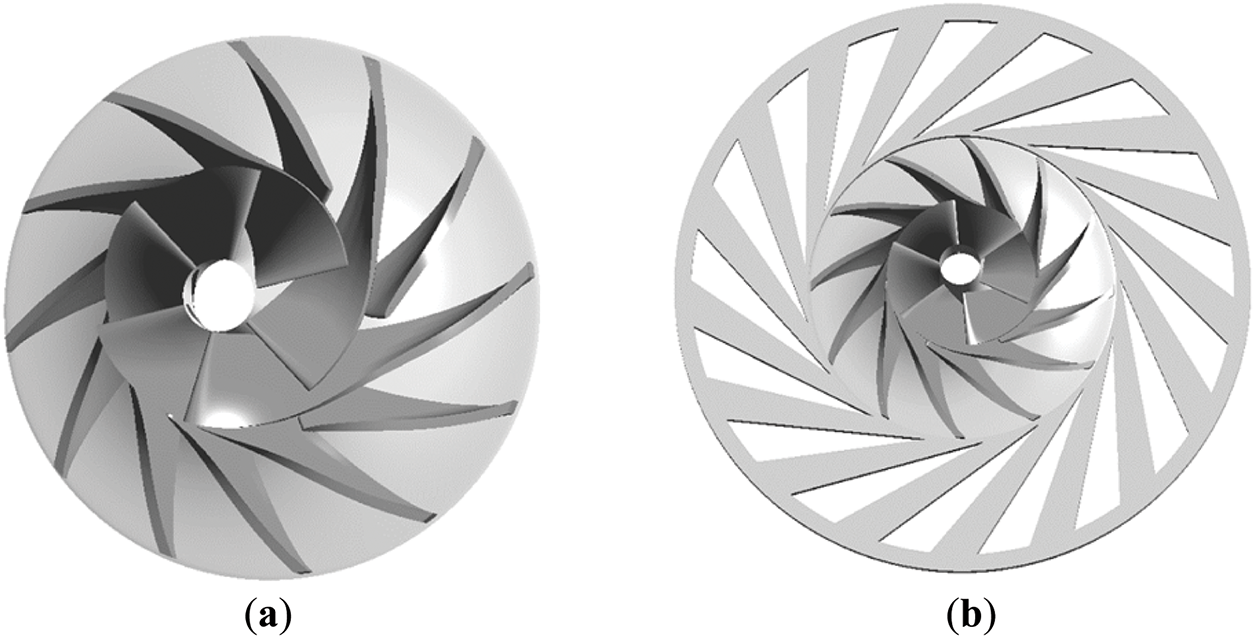
Figure 1: The impeller of the compressor (a); Compressor with blade diffuser (b)
To facilitate the simulation experiments and simultaneously obtain the extreme operating conditions of the compressor, this paper will focus on the sCO2 centrifugal compressor equipped with a bladeless diffuser. The geometric parameters of the bladeless diffuser are presented in Table 3.
The compressor model featuring a bladeless diffuser is illustrated in Fig. 2. This paper will conduct additional numerical simulation studies on the sCO2 centrifugal compressor based on this model.
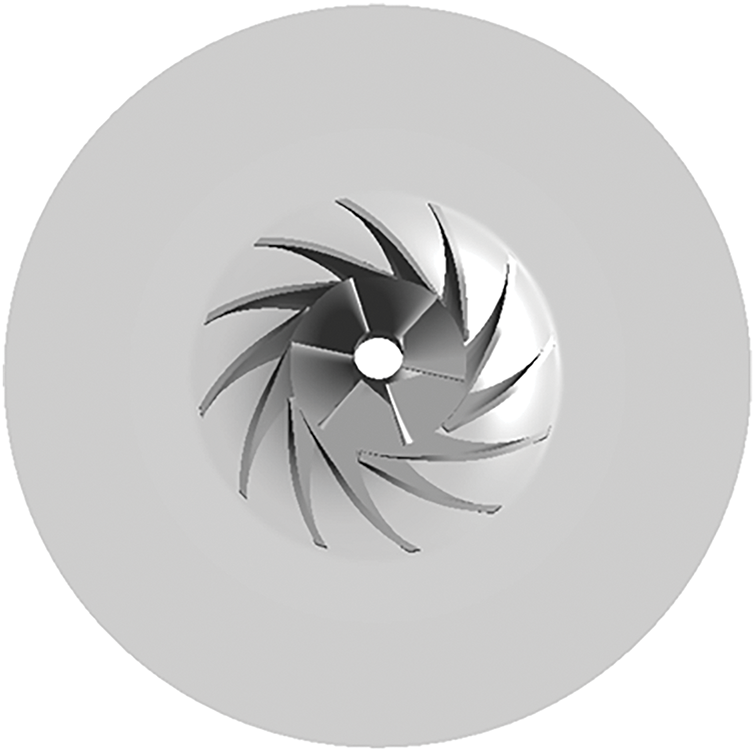
Figure 2: The compressor model with bladeless diffuser
2.2 Numerical Methods and Validation
The supercritical carbon dioxide centrifugal compressor is a typical impeller machine. In this study, we employ conservation equations to analyze compressible fluids, which include the mass conservation equation, the momentum equation, and the energy equation. The Reynolds-Averaged Navier-Stokes (RANS) equations [29] are a widely used method for solving such flow problems. Utilizing the RANS equations for numerical simulations can yield sufficient accuracy, making them suitable for most engineering applications. Consequently, we have chosen to apply the RANS equations for the simulation calculations in this study. For supercritical carbon dioxide centrifugal compressors, the RANS equations encompass the following:
The mass conservation equation reads:
where ρ is the density and v the fluid velocity.
The mass conservation equation in the time-averaged (RANS) form reads:
where the overbar denotes time-averaged quantities.
Among them,
The momentum equation reads:
where τ is the viscous stress tensor.
After time-averaging Eq. (3), it reads:
where
The energy equation reads:
where k is the thermal conductivity.
When employing the Reynolds-Averaged Navier-Stokes (RANS) method, it is essential to time-average the equations and incorporate turbulence-related energy transport terms:
where e is the total energy,
Due to the high density and low viscosity of supercritical carbon dioxide (sCO2), the flow within the impeller exhibits turbulent flow. Consequently, the Shear Stress Transport (SST) k-ω Turbulence Model [30] was utilized to represent the Reynolds stress contribution τRe, which in turn depends on the turbulent viscosity requiring the solution of the following two equations.
The equation for turbulent kinetic energy (k):
The dissipation equation:
Among them,
The sCO2 centrifugal compressor operates near the critical point, where the properties of CO2 undergo significant changes. This study employs the Span-Wagner (SW) equation of state for CO2 to generate RGP tables of varying resolutions for numerical simulation software. The temperature range is 273 to 320 K, the pressure range is 5 to 16 MPa, and the resolution is 500 × 500.
The calculation is conducted in a single pass from the impeller inlet to the diffuser outlet. The mesh is refined at the blades using a structured grid. The grid is divided into 450,000, 530,000, 640,000, 780,000, and 920,000 elements for grid independence verification. By comparing the calculation results, it was determined that when the total number of grid elements reaches 640,000, the calculated efficiency does not exhibit significant changes (Fig. 3). Therefore, 640,000 grid elements were selected for the numerical calculations, as illustrated in Fig. 4. An O-type grid was employed to accommodate the circular arc sections at the leading and trailing edges of the blade.
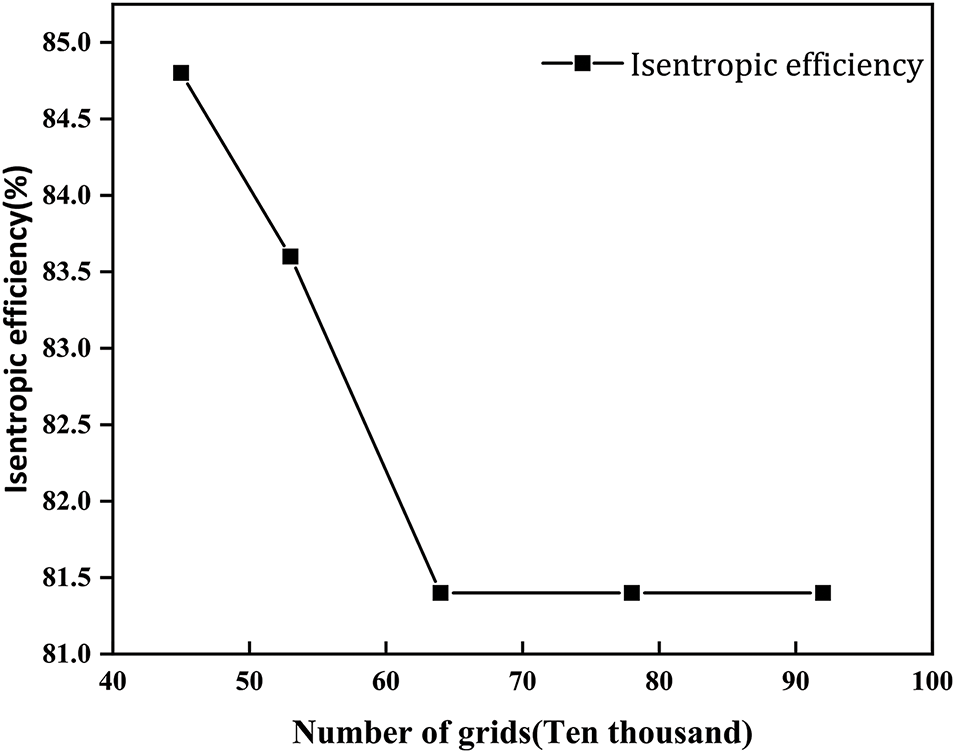
Figure 3: Grid independence verification
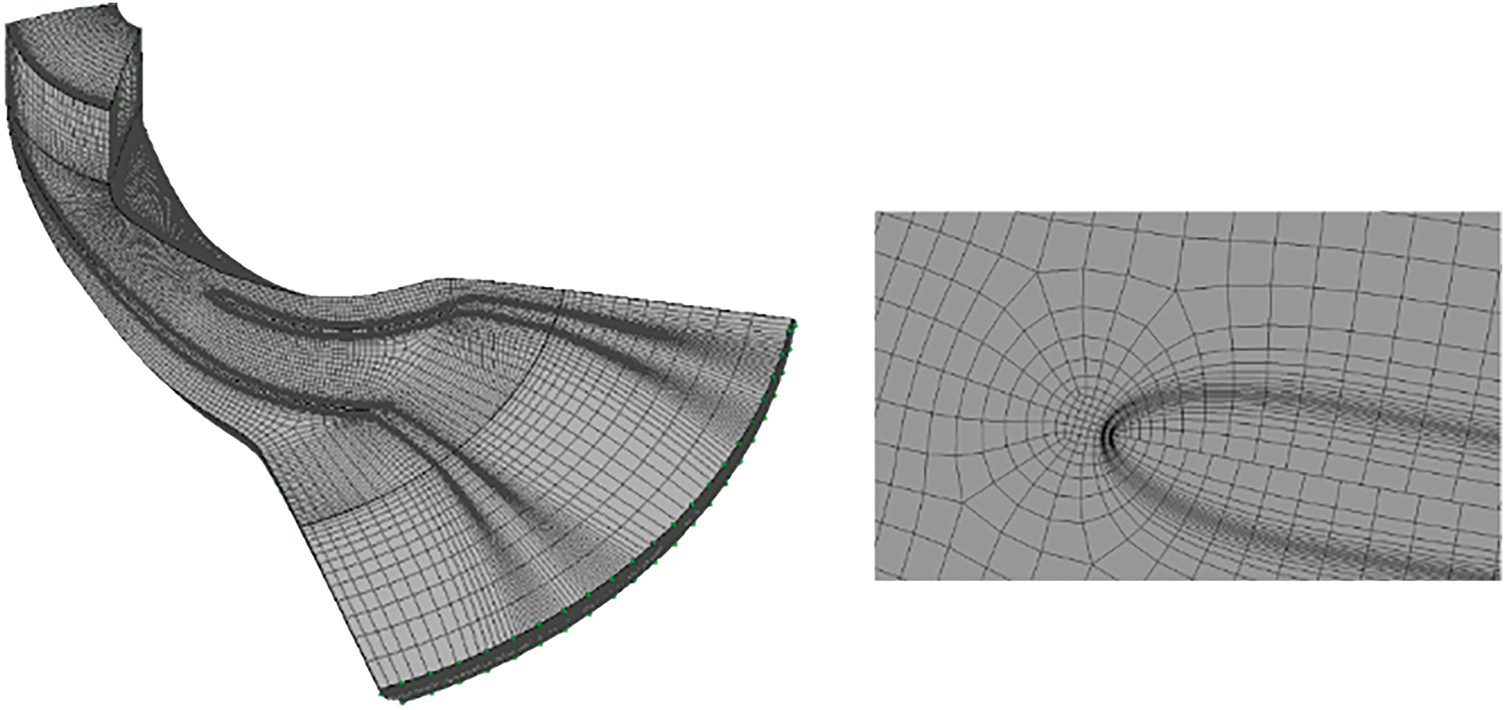
Figure 4: Compressor single-channel mesh
The experimental data for the main compressor operating at 55,000 rpm, released by Sandia, is the most comprehensive available; therefore, numerical simulations are conducted for this specific operating condition. This paper presents both steady and unsteady simulation calculations of the aerodynamic performance of the sCO2 centrifugal compressor, utilizing the commercial software ANSYS CFX for numerical computations. In ANSYS CFX, a fully implicit coupled solver known as the Coupled Algebraic Multigrid (CAMG) method [31], is employed. For the spatial discretization numerical scheme, the convection and diffusion terms are addressed using a second-order upwind scheme, while the gradient term is handled with a central difference scheme that achieves second-order accuracy. Additionally, the diffusion term is corrected using the least squares method.
ANSYS CFX is a finite volume method that employs elements and utilizes second-order discretization schemes in both space and time [32], the solver for compressible flow at subsonic speeds utilizes a fully implicit coupled pressure-based method. The time term employs the default Euler method, adhering to the principle of maintaining a Courant number of less than 1 to control the time step.
The numerical calculation employs the Reynolds-averaged Navier-Stokes (N-S) equations. The inlet conditions for the compressor are defined as axial uniform inflow, with a pressure of 7.89 MPa and a temperature of 306.4 K. The mass flow rate at the compressor outlet is 2.04 kg/s.
Due to the experiment conducted at 55,000 rpm, which includes both design and non-design inlet condition data, the experimental data at this speed is more comprehensive. Consequently, this paper selects the experimental condition at 55,000 rpm as the primary focus for numerical simulation in this chapter. Additionally, the performance curve at the inlet condition of 55,000 rpm is established as the baseline condition for the numerical simulation research.
The calculation process begins by establishing the stator in a frozen state (Frozen Stator, FS) at both the inlet and outlet of the impeller. Based on the specified boundary conditions, steady-state calculations are performed. The impeller domain is designated as the rotating domain, operating at a speed of 55,000 rpm, while the remaining domains are treated as stationary. The frozen rotor method is employed to manage the interface between the rotating and stationary domains. The wall is configured with adiabatic no-slip conditions, and the turbulence model utilizes the SST k-ω automatic wall treatment (AWT) mode. The turbulence intensity is set to 5%, and a higher-order solver scheme is implemented in the solver settings.
The solution that converged in the first stage will serve as the initial flow field for subsequent unsteady calculations. The steady-state (FS) condition has been replaced with the Transient Rotor/Stator (TR/S) condition. By varying the mass flow rate parameters at the outlet, we can obtain the calculation results for the internal flow field and the dynamic behavior of the compressor under different flow conditions. When conducting unsteady calculations on a sCO2 centrifugal compressor, it is crucial to select an appropriate time step to accurately capture the intricacies of the flow field within the impeller. The time step is typically measured in seconds. For the unsteady analysis of the sCO2 centrifugal compressor, the rotational speed is set at 55,000 rpm. The compressor features a total of six main and shroud rotor blades, and the time step is established at 1.85 × 10⁻⁵ s, which indicates that it takes approximately 354 steps for the impeller to complete one full rotation. During the calculation process, it is essential to monitor the mass flow rate at the inlet and the total pressure at the outlet. When the difference in mass flow rates between the inlet and outlet is less than 0.5%, the total pressure curve exhibits minimal fluctuations, and the global residuals are all below 10−4, the solution can be considered converged.
Fig. 5 shows the trend of the total pressure ratio of the compressor with varying mass flow rates for both experimental [33] and simulated results. As the mass flow rate increases, the total pressure ratio decreases.
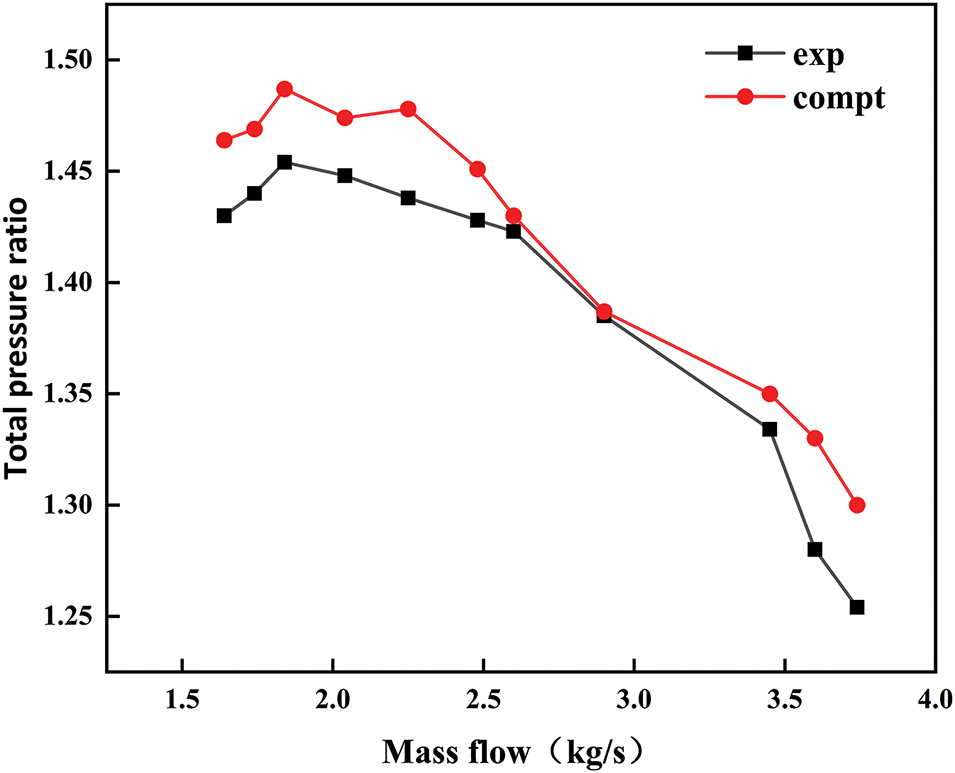
Figure 5: Comparison of simulation and experimental results
Fig. 6 illustrates the comparison of isentropic efficiency between numerical simulations and experimental results. Both the numerical simulation and experimental data exhibit consistent trends; however, there is a notable deviation between the two sets of results. This discrepancy can be attributed to several factors, including errors in the machining process of the main compressor at the early Sandia Laboratory in the United States, as well as blade deformation that occurred during the experiments. These factors contribute to the differences observed between the numerical simulation results and the experimental findings. Additionally, the numerical simulation only accounts for the rotating components of the centrifugal compressor, specifically the centrifugal impeller, whereas the efficiency measured in the tests encompasses the entire main compressor. Consequently, the isentropic efficiency derived from the numerical simulation is expected to be higher.
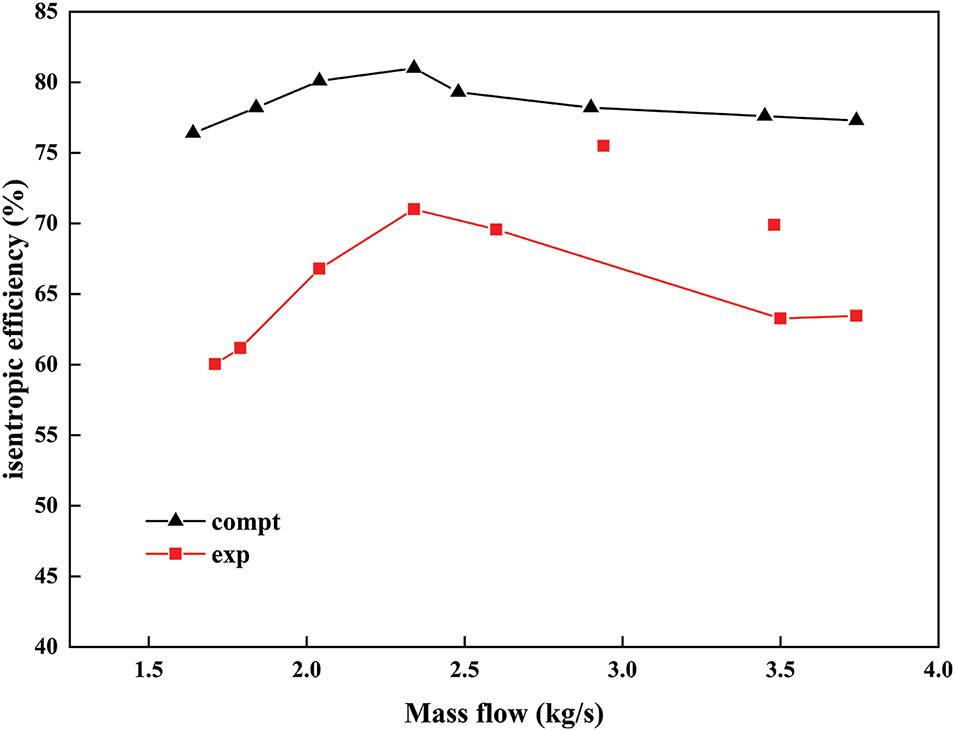
Figure 6: Comparison of isentropic efficiency between simulation and experiment
When the trend of numerical simulation results is consistent with or close to the experimental results, it is considered that the numerical simulation has high accuracy.
3.1 Analysis of the Range of Steady-State Conditions
First, a numerical simulation of the full mass flow conditions of the sCO2 centrifugal compressor is conducted. The final converged conditions of the maximum and minimum mass flow rates from the compressor simulation are utilized as the extreme values of the mass flow range to determine the operational limits of the research subject in this paper. The variation curves of pressure ratio and isentropic efficiency within this range are illustrated in Fig. 7. The results indicate that the stable operating mass flow range of the compressor extends from 0.74 to 3.74 kg/s. Within this range, when the mass flow rate is below 2.04 kg/s, the change in pressure ratio remains relatively steady. However, when the mass flow rate exceeds 2.04 kg/s, the decrease in pressure ratio becomes more pronounced. At 3.74 kg/s, the total pressure ratio drops to 1.34, while at 0.74 kg/s, it remains at 1.46. Consequently, low mass flow rates have a minimal impact on the pressure ratio, whereas variations in the pressure ratio under higher mass flow conditions are more significant.
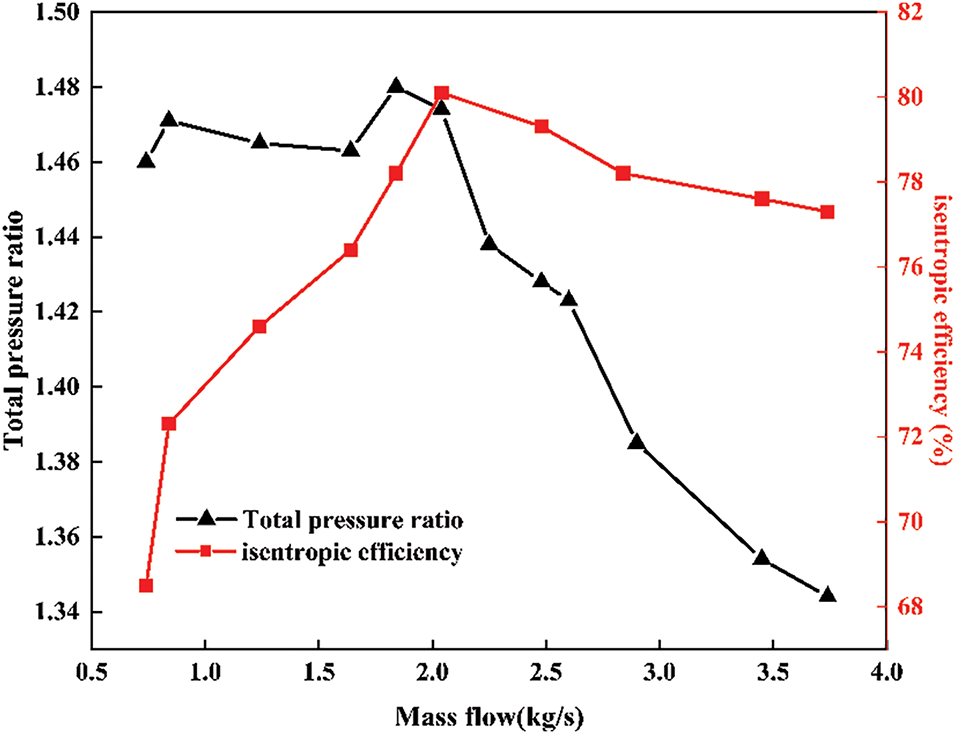
Figure 7: Pressure ratio and isentropic efficiency variation curves across the full operating range
Isentropic efficiency exhibits varying trends based on operating conditions. When operating below the design specifications, the change in the isentropic efficiency of the compressor becomes quite pronounced. At a mass flow rate of 0.74 kg/s, the isentropic efficiency is 68.5%, representing a decrease of 12.9% compared to the 81.4% efficiency observed at 2.04 kg/s. Conversely, at a mass flow rate of 3.74 kg/s, the isentropic efficiency is 77.3%, which reflects only a 4.1% decrease relative to the 2.04 kg/s condition. Thus, it is evident that mass flow rates below the design specifications significantly affect the isentropic efficiency of the compressor, whereas mass flow rates above the design specifications have a comparatively minor impact on the isentropic efficiency.
Therefore, the isentropic efficiency of the compressor is significantly influenced by operating conditions at mass flow rates below 2.04 kg/s. In contrast, the isentropic efficiency is comparatively less affected by operating conditions at mass flow rates above 2.04 kg/s.
The Mach number is a dimensionless parameter that represents the ratio of the fluid’s speed to the local speed of sound. Its magnitude significantly influences compressor performance, including pressure ratio, efficiency, and flow characteristics. Consequently, an analysis of the Mach numbers of the sCO2 centrifugal compressor under two extreme conditions, as well as the design condition, is conducted.
To visually illustrate the Mach number distribution along the streamlines of the compressor, Fig. 8 presents the normalized Mach number distribution curve in the flow direction of the compressor. Under the operating condition of 2.04 kg/s, the maximum Mach number is 0.32. When the mass flow rate is reduced to 0.74 kg/s, the Mach number within the compressor decreases, with a maximum value of 0.25, representing a 28% reduction compared to the 2.04 kg/s operating condition. Conversely, at the 3.74 kg/s operating condition, the Mach number distribution near the leading and trailing edges of the impeller becomes more irregular, exhibiting a local maximum Mach number of 0.396, which is an increase of 23.7% compared to the 2.04 kg/s operating condition.
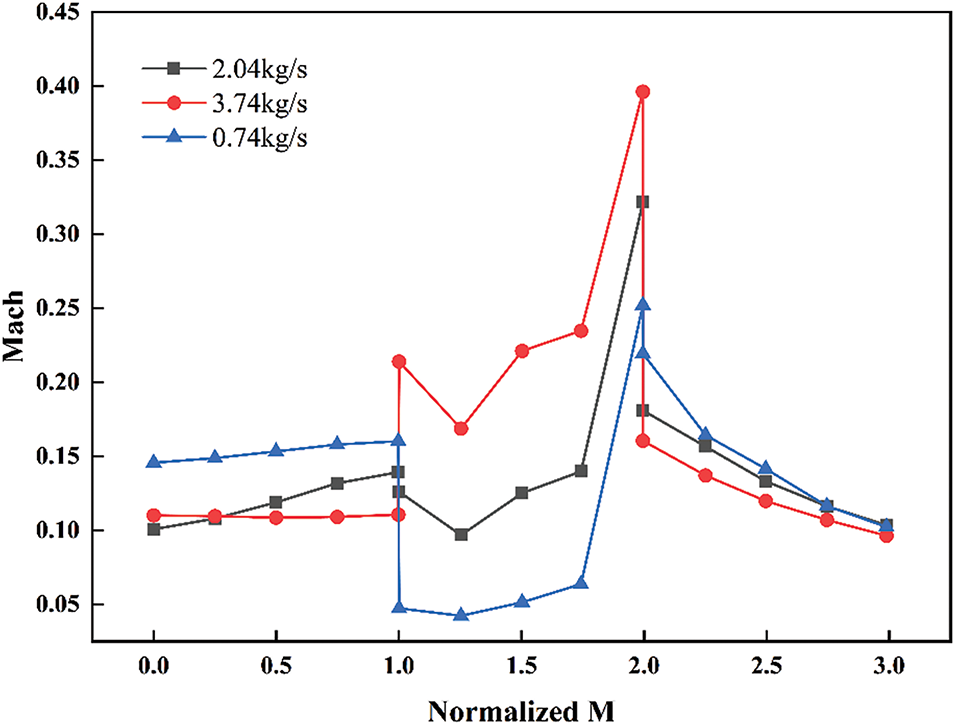
Figure 8: Distribution curve of mach number along the flow direction in the compressor
Fig. 9 illustrates the Mach number distribution in the 50% span region of the compressor at various mass flow rates. As the mass flow rate increases, the Mach number distribution within the compressor becomes increasingly non-uniform, especially at the leading and trailing edges of the blades, where the gradient of the Mach number distribution increases significantly.
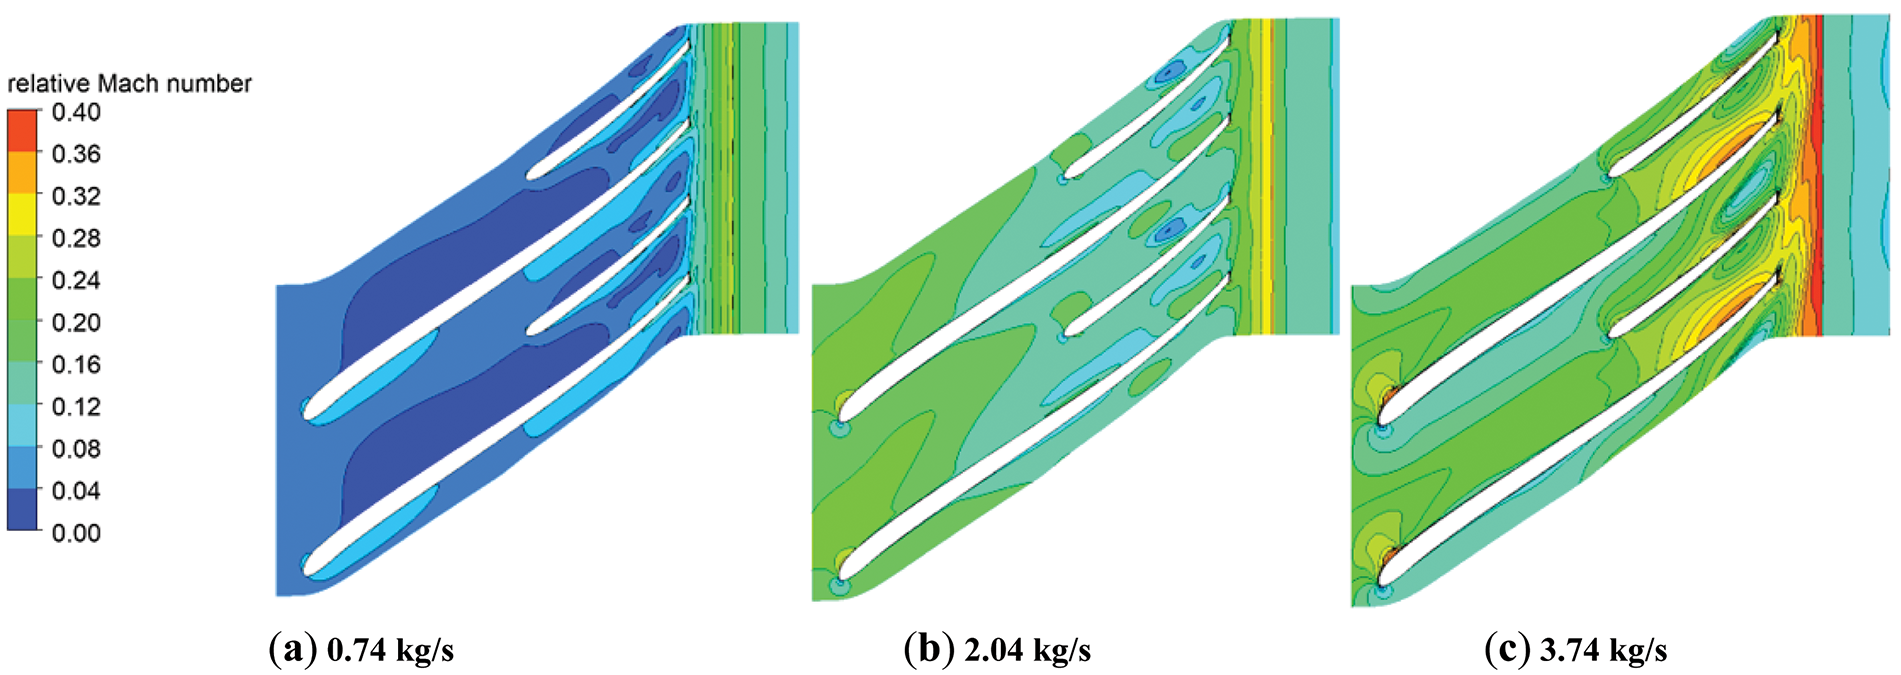
Figure 9: Comparison of mach numbers under variable operating conditions
3.3 Temperature Field Analysis
Fig. 10 illustrates the internal temperature distribution of the compressor under various operating conditions. As the mass flow rate increases, the overall temperature of the compressor decreases, the temperature gradient diminishes, and the temperature distribution becomes more uniform.
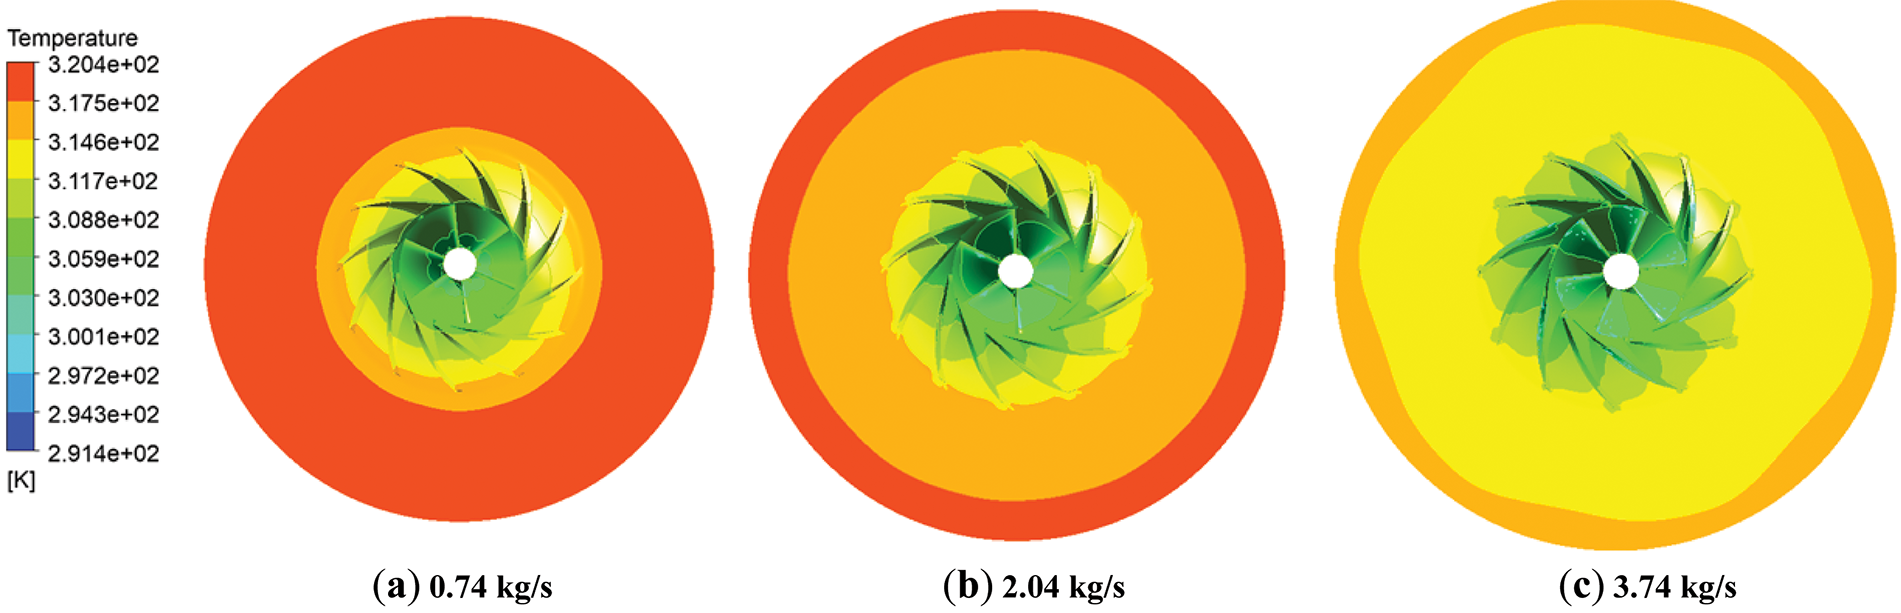
Figure 10: Internal temperature distribution of the compressor under varying operating conditions
To provide a more detailed explanation of the temperature changes in the compressor, we have established eight monitoring points on the key components to track variations in various parameters. The locations of each monitoring point are illustrated in Fig. 11.
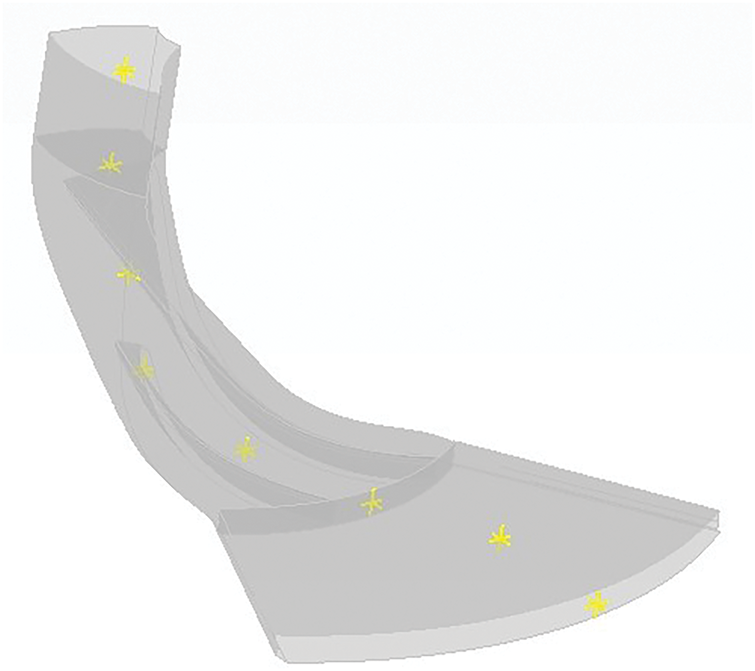
Figure 11: Monitoring point location
Under various operating conditions, the temperature and entropy variation curves of the compressor are illustrated in Fig. 12. The figure indicates that as the mass flow rate increases, the internal temperature of the compressor consistently decreases, while the entropy increases. At the 0.74 kg/s operating condition, the change in internal entropy of the compressor is relatively significant, suggesting considerable energy loss during the compression process. Consequently, the isentropic efficiency under this condition exhibits a marked decline. In contrast, at the 2.04 and 3.74 kg/s operating conditions, the changes in temperature and entropy increase are relatively stable, leading to a more consistent isentropic efficiency.
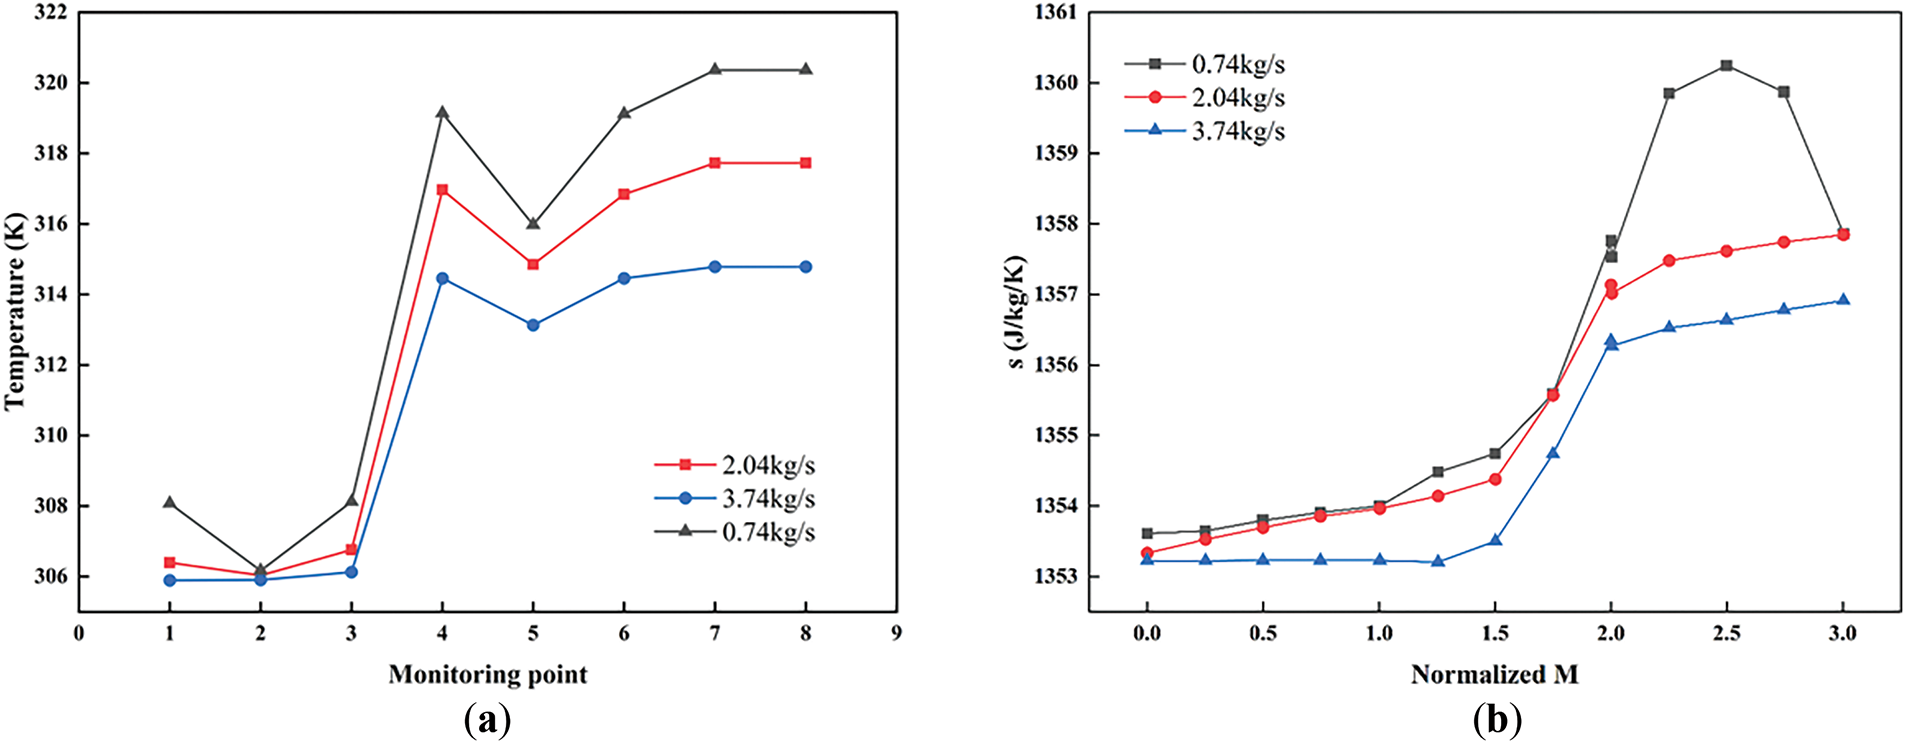
Figure 12: Variation curves of compressor temperature (a) and entropy (b) under different operating conditions
Fig. 13 illustrates the variation in fluid viscosity under different operating conditions of the compressor. As the mass flow rate increases, the fluid viscosity is relatively high at the 0.74 kg/s operating condition. Higher viscosity leads to greater flow resistance, which increases friction losses within the channel and subsequently reduces the isentropic efficiency of the compressor. Conversely, at the 3.74 kg/s operating condition, the fluid viscosity is relatively low, which decreases friction losses within the channel and helps maintain stable isentropic efficiency. However, low fluid viscosity may result in reduced boundary layer energy, potentially affecting the stability of the compressor under high load conditions.
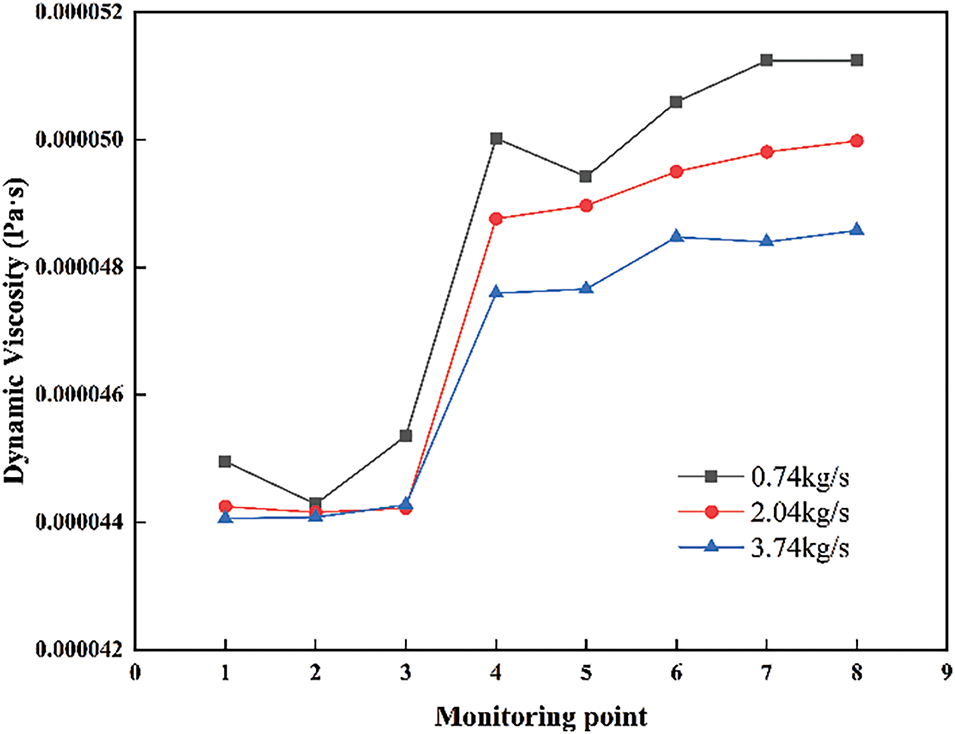
Figure 13: Variation of fluid viscosity curve under different operating conditions of the compressor
Fig. 14 illustrates the variations in internal density and enthalpy of the fluid within the compressor. At the operating condition of 0.74 kg/s, the change in fluid density is more pronounced, which can easily lead to flow losses, resulting in flow instability and negatively impacting isentropic efficiency. Conversely, at the 3.74 kg/s operating condition, the enthalpy of the fluid at the outlet decreases, and the increase in enthalpy during the compression process is inadequate. This insufficiency results in a limited rise in outlet temperature and a reduction in the total pressure ratio.
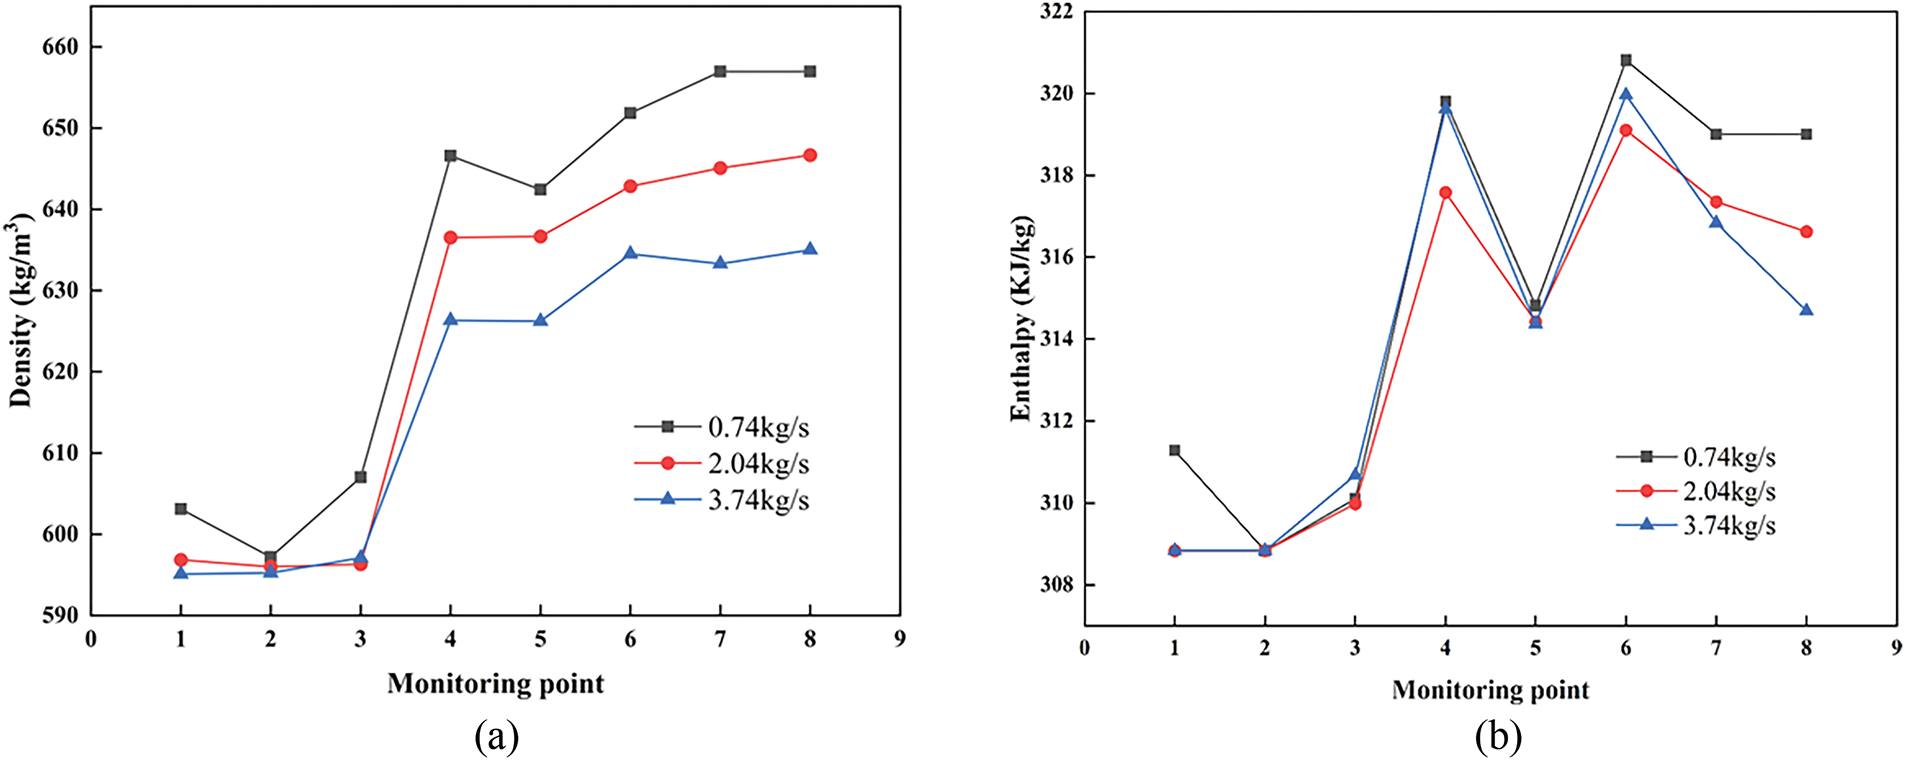
Figure 14: Variation curves of fluid density (a) and enthalpy (b) inside the compressor under different operating conditions
3.4 Pressure Pulsation Analysis
Analyze the pressure fluctuations at the impeller blades of the supercritical carbon dioxide (sCO2) centrifugal compressor, with a primary focus on the pressure variations caused by uneven flow or other factors during the fluid’s movement within the compressor.
At mass flow rates of 0.74, 2.04, and 3.74 kg/s, the pressure pulsations of the main blades and the splitter blades are illustrated in Figs. 15–17. It can be observed that the pressure pulsation trends for both the main blades and the splitter blades are similar; however, the frequency of pressure fluctuations at the splitter blades is approximately 3% to 6% higher than that of the main blades.
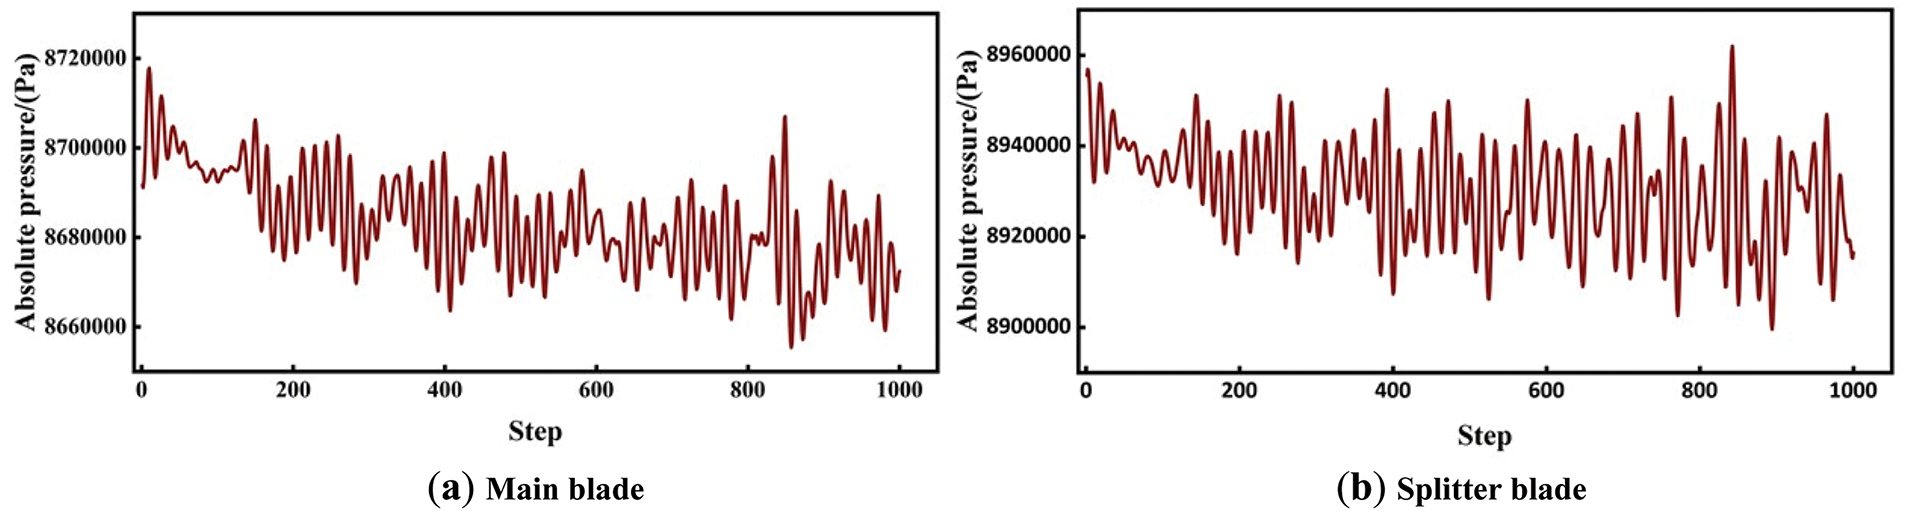
Figure 15: The pressure pulsation at the compressor blades with a mass flow rate of 0.74 kg/s
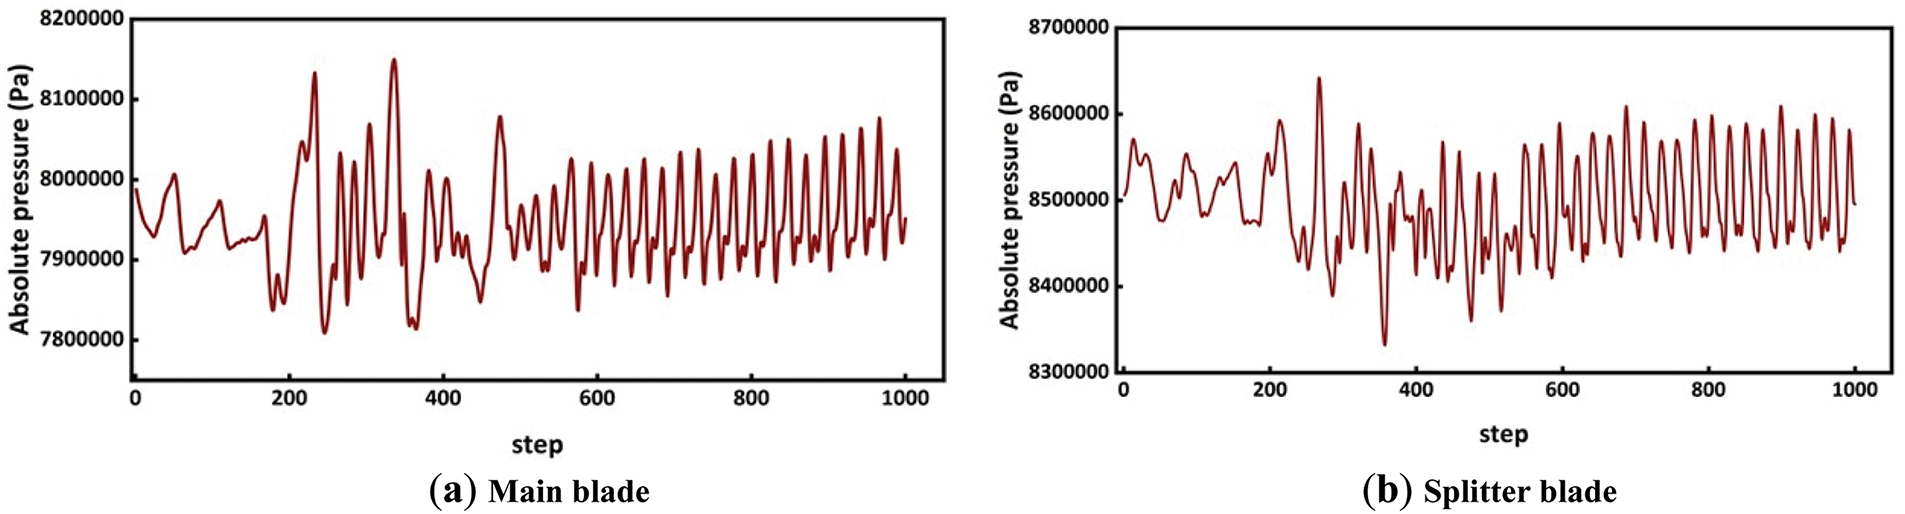
Figure 16: The pressure pulsation at the compressor blades with a mass flow rate of 2.04 kg/s
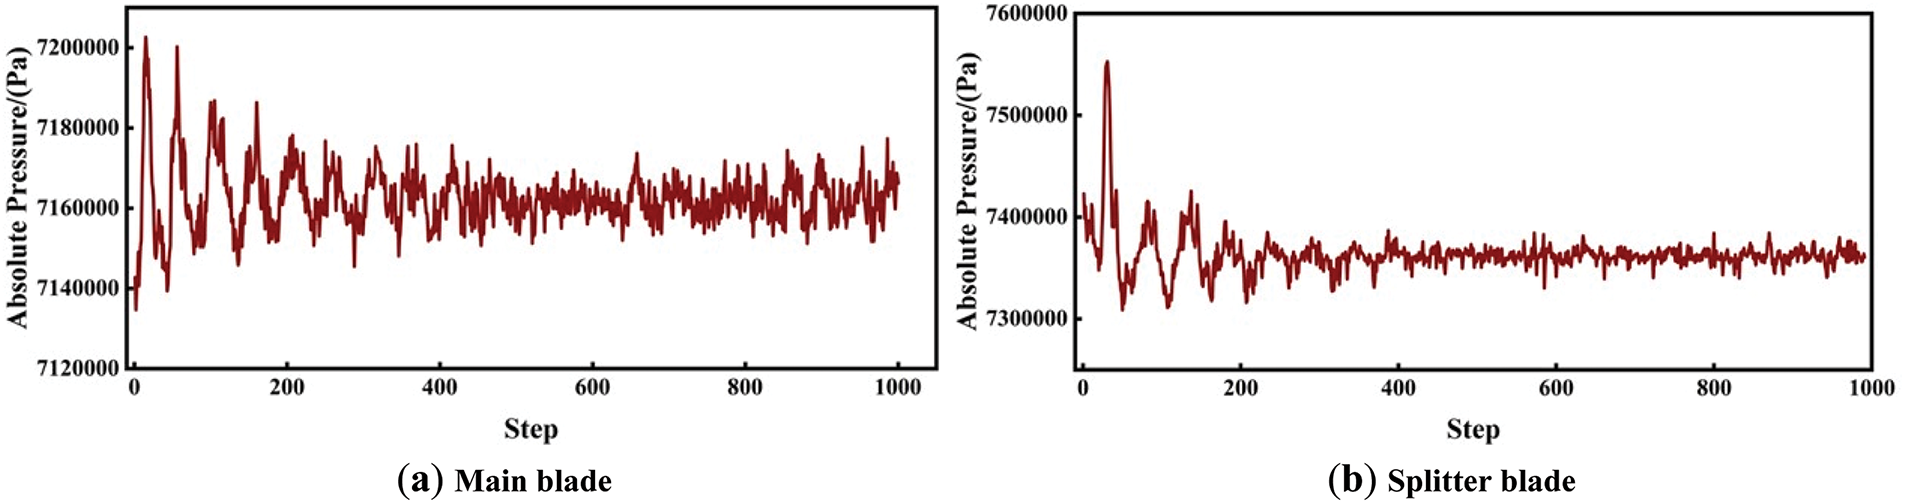
Figure 17: The pressure pulsation at the compressor blades with a mass flow rate of 3.74 kg/s
Under the 0.74 kg/s operating condition, the pressure pulsation frequency at the compressor blades has increased to a certain extent compared to the 2.04 kg/s operating condition, while the pulsation amplitude has decreased. Appropriate high-frequency, small-amplitude pressure pulsations can enhance the uniformity of fluid flow within the compressor, reduce localized low-energy regions, and contribute to the stability of the overall pressure ratio. However, under this operating condition, the average pressure pulsation at the compressor blades is at its highest, with the maximum pressure increasing by 6%. In supercritical carbon dioxide centrifugal compressors, the density of the working fluid changes dramatically, and excessive pressure at the blades may lead to the formation of shock waves. The entropy increase caused by these shock waves can significantly reduce isentropic efficiency. Furthermore, high-pressure areas may create local instabilities, resulting in irreversible losses.
Under the operating condition of 3.74 kg/s, the average pressure pulsation frequency at the compressor blades is at its highest, while the amplitude is at its lowest. Excessively high-frequency pressure pulsations can induce resonance, resulting in local flow instability, which exacerbates energy loss and reduces the total pressure ratio. Additionally, under this operating condition, the average pressure pulsation is minimized, and the maximum pressure is decreased by 12%. Since the primary function of the blades is to accelerate the fluid and alter its direction, effectively converting kinetic energy into pressure energy, a low surface pressure on the blades indicates a poor pressure increase during the compression process, leading to a decrease in the total pressure ratio. A slight increase in pressure enhances fluid mixing, reduces low-energy regions, and is advantageous for stabilizing isentropic efficiency.
Fig. 18 illustrates the velocity distribution of the compressor impeller under various operating conditions. As the mass flow rate increases, the overall flow velocity also rises, leading to a steeper velocity distribution gradient. A larger velocity gradient can cause the boundary layer to thicken or even separate, resulting in the formation of a separation zone, which significantly increases flow loss.
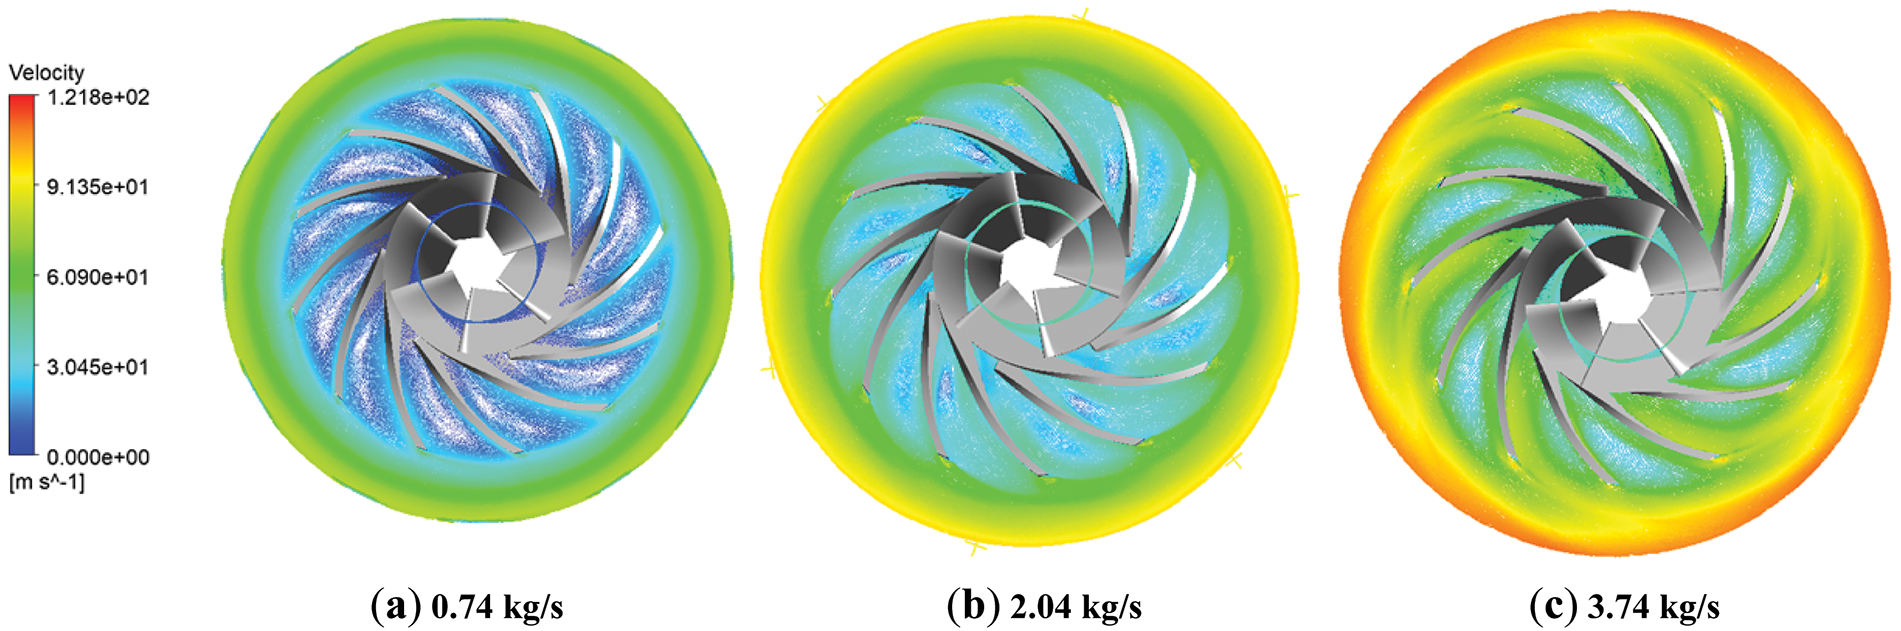
Figure 18: Speed distribution of the compressor impeller under varying operating conditions
Fig. 19 illustrates the variation in speed at key monitoring points of the compressor under different mass flow rates. At the 3.74 kg/s operating condition, the velocity gradient increases significantly, with the maximum velocity rising by 23% compared to the 2.04 kg/s operating condition. Conversely, at the 0.74 kg/s operating condition, the velocity gradient is lower, resulting in a 19% decrease in maximum velocity compared to the 2.04 kg/s operating condition.
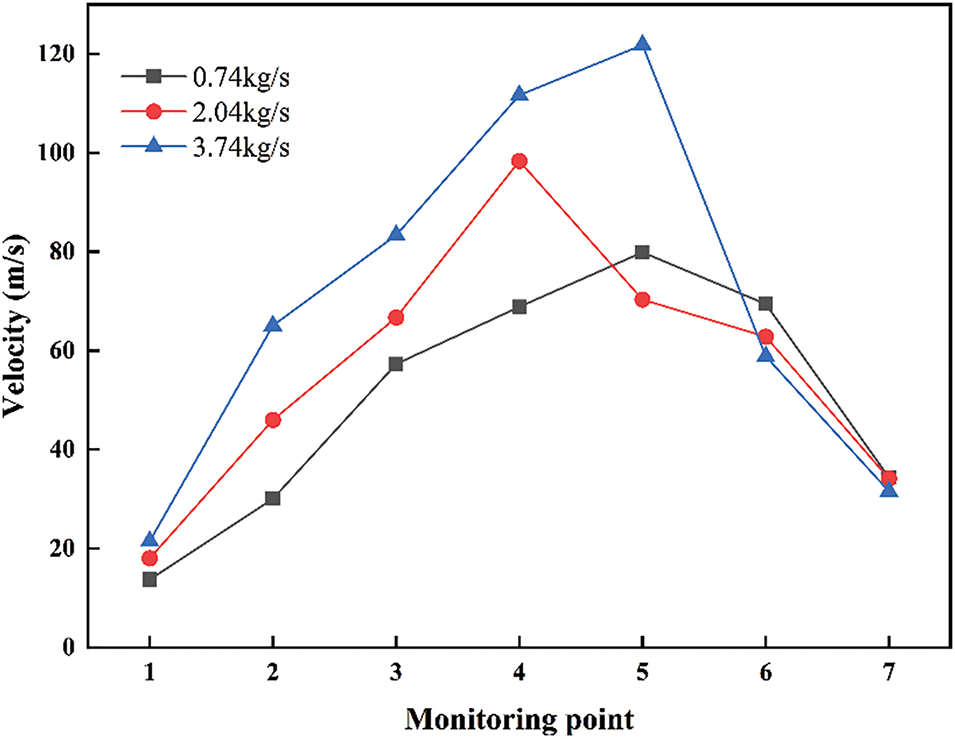
Figure 19: Variation curves of compressor internal speed under different operating conditions
The vector streamlines of the velocity at the blade and impeller outlet under various operating conditions are illustrated in Fig. 20. With consistent density parameters, an increase in mass flow rate results in a gradual rise in the density of velocity streamlines at the compressor blades and impeller outlet, with notably higher speeds observed near the trailing edge of the blades. At a mass flow rate of 0.74 kg/s (a), there is a significant presence of low-speed flow, and multiple vortices form at the top of the blades (near the wall). The blade tip gap allows high-pressure side fluid to leak to the low-pressure side, creating vortices that mix with the mainstream flow, which can lead to additional energy loss and a reduction in isentropic efficiency. In contrast, under the operating condition of 3.74 kg/s (c), the overall flow becomes smoother, particularly within the impeller passage and at the outlet, where the flow distribution appears more uniform. However, the increase in mass flow rate also heightens the velocity distribution gradient at the impeller outlet, which affects the effective flow area of the passage. The uneven velocity gradient at the impeller outlet or diffuser inlet can lead to local blockage, adversely impacting compressor performance. Furthermore, when the fluid exits at high speed, it may increase losses in the exit wake region, resulting in a decrease in the total pressure ratio.
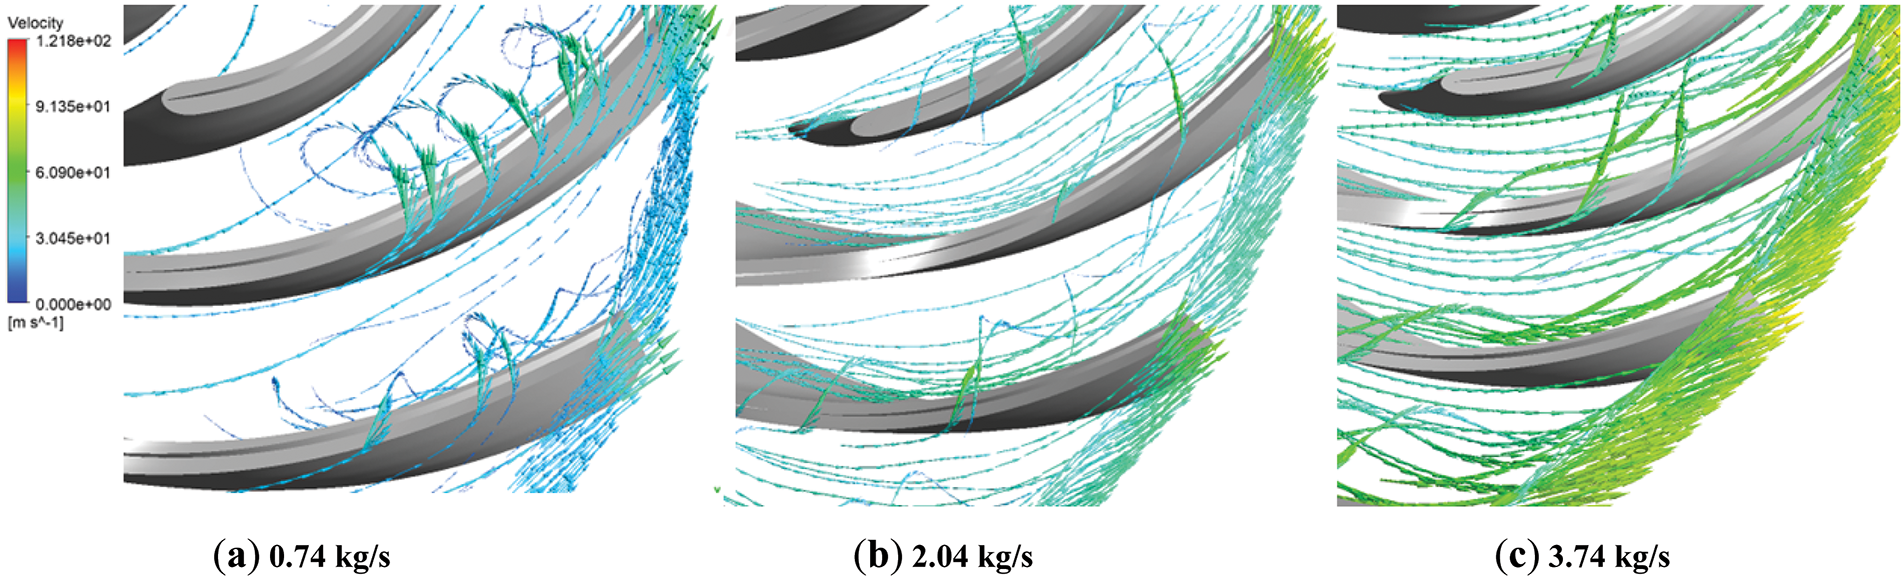
Figure 20: Velocity vector streamlines at the blade and impeller outlets under various operating conditions
This study employs three-dimensional numerical simulations to investigate the flow field properties and aerodynamic performance of a supercritical carbon dioxide (sCO2) centrifugal compressor under various operating conditions. With a design mass flow rate of 2.04 kg/s, the analysis focuses on the internal Mach number distribution, temperature field characteristics, blade pressure pulsation spectrum, and velocity flow field of the compressor across different operating scenarios. These analyses elucidate the operational boundaries of the compressor and the mechanisms underlying performance degradation. The design of the sCO2 centrifugal compressor can be theoretically supported by examining the mechanisms of performance degradation under non-design conditions. The following are the primary research findings:
(1) The sCO2 centrifugal compressor operates under two extreme conditions. With a design flow rate of 2.04 kg/s, the stable operating range of the compressor is between 0.74 and 3.74 kg/s. At the 0.74 kg/s condition, the isentropic efficiency of the compressor significantly decreases compared to the design condition, with a reduction of 13%. In contrast, the efficiency reduction at the 3.74 kg/s condition is only 2.9%. Under the 0.74 kg/s condition, the total pressure remains relatively stable, while at the 3.74 kg/s condition, the total pressure ratio decreases from 1.47 to 1.34.
(2) At a mass flow rate of 0.74 kg/s, the maximum Mach number within the compressor decreases by 28%. The temperature gradient distribution inside the compressor is substantial, leading to a significant increase in entropy. Additionally, the fluid viscosity is elevated, and the variations in density are quite pronounced. The pulsation amplitude at the blades increases, resulting in a maximum pressure rise of 6%. The flow density at the outlet of the blades and impeller is relatively low, characterized by a predominance of low-speed flow, and multiple vortices form at the top of the blades, causing a 19% reduction in maximum speed. Consequently, the efficiency of the compressor under these operating conditions has significantly declined.
(3) At a mass flow rate of 3.74 kg/s, the Mach number distribution near the impeller becomes increasingly uneven, with the maximum Mach number rising by 23.7%. The temperature gradient distribution within the compressor decreases, while entropy stabilizes and increases. Fluid viscosity is lower, density variations are minimal, and the increase in enthalpy is insufficient. The pressure pulsation frequency of the blades is relatively high, although the pulsation amplitude and average pressure remain low, resulting in a maximum pressure reduction of 12%. The velocity gradient distribution within the compressor increases, characterized by a higher density of velocity streamlines at the blade and impeller exit, relatively regular streamlines, and a greater volume of high-speed flow, with the maximum speed increasing by 23%. Consequently, the total pressure ratio under these operating conditions has significantly decreased.
For future research directions, subsequent studies should investigate the factors contributing to the performance decline of compressors under extreme conditions. This can be achieved by analyzing the viscous dissipation power within the compressor, the vortex structure of the blades, and the behavior of secondary flows. Furthermore, optimizing the design of compressor impellers and flow passages for various operating conditions presents another promising avenue for research.
Acknowledgement: We appreciate the technical support of the Research Center for Thermal and Fluid Sciences. Thanks to Key Laboratory of Power Station Energy Transfer Conversion and System of Ministry of Education for the equipment help.
Funding Statement: National Science Foundation of China (grant numbers 52366009 and 52130607), Double First-Class Key Program of Gansu Provincial Department of Education (grant number GCJ2022–38), 2022 Gansu Provincial University Industry Support Plan Project (grant number 2022CYZC-21), Key R&D Program of Gansu Province of China (grant number 22YF7GA163).
Author Contributions: The authors confirm their contributions to the paper as follows: Research conception and design, data collection, results analysis and interpretation, initial draft preparation, funding acquisition: Jiangbo Wu; conception, resources, writing—review and editing: Siyi Sun; supervision: Xiaoze Du. All authors reviewed the results and approved the final version of the manuscript.
Availability of Data and Materials: The data that support the findings of this study are available from the corresponding author upon reasonable request.
Ethics Approval: Not applicable.
Conflicts of Interest: The authors declare no conflicts of interest to report regarding the present study.
References
1. Crespi F, Gavagnin G, Sánchez D, Martínez GS. Supercritical carbon dioxide cycles for power generation: a review. Appl Energy. 2017;195(12):152–83. doi:10.1016/j.apenergy.2017.02.048. [Google Scholar] [CrossRef]
2. Molière M, Privat R, Jaubert J-N, Geiger F. Supercritical CO2 power technology: strengths but challenges. Energies. 2024;17(5):1129. doi:10.3390/en17051129. [Google Scholar] [CrossRef]
3. Mubashir W, Adnan M, Zaman M, Imran M, Naqvi SR, Mehmood A. Thermo-economic evaluation of supercritical CO2 brayton cycle integrated with absorption refrigeration system and organic rankine cycle for waste heat recovery. Therm Sci Eng Prog. 2023;44(8):102073. doi:10.1016/j.tsep.2023.102073. [Google Scholar] [CrossRef]
4. Yu A, Su W, Lin X, Zhou N. Recent trends of supercritical CO2 Brayton cycle: bibliometric analysis and research review. Nucl Eng Technol. 2021;53(3):699–714. doi:10.1016/j.net.2020.08.005. [Google Scholar] [CrossRef]
5. Guo J-Q, Li M-J, He Y-L, Jiang T, Ma T, Xu J-L, et al. A systematic review of supercritical carbon dioxide (S-CO2) power cycle for energy industries: technologies, key issues, and potential prospects. Energy Convers Manag. 2022;258(10–11):115437. doi:10.1016/j.enconman.2022.115437. [Google Scholar] [CrossRef]
6. White MT, Bianchi G, Chai L, Tassou SA, Sayma AI. Review of supercritical CO2 technologies and systems for power generation. Appl Therm Eng. 2021;185(6):116447. doi:10.1016/j.applthermaleng.2020.116447. [Google Scholar] [CrossRef]
7. Ehsan MM, Awais M, Lee S, Salehin S, Guan Z, Gurgenci H. Potential prospects of supercritical CO2 power cycles for commercialisation: applicability, research status, and advancement. Renew SustainEnergy Rev. 2023;172(11):113044. doi:10.1016/j.rser.2022.113044. [Google Scholar] [CrossRef]
8. Fuller RL, Eisemann K. Centrifugal compressor off-design performance for super-critical CO2. In: Proceedings of the Barber Nichols, Inc. Presentation, Supercritical CO2 Power Cycle Symposium; 2011 May 24–25; Boulder, CO, USA. 20 p. [Google Scholar]
9. Utamura M, Fukuda T, Aritomi M. Aerodynamic characteristics of a centrifugal compressor working in supercritical carbon dioxide. Energy Proc. 2012;14(4):1149–55. doi:10.1016/j.egypro.2011.12.1068. [Google Scholar] [CrossRef]
10. Wright S, Radel R, Vernon M, Pickard P, Rochau G. Operation and analysis of a supercritical CO2 Brayton Cycle. Albuquerque, NM, and Livermore, CA: Sandia National Laboratories; 2010. Report No.: SAND2010-0171. [Google Scholar]
11. Pecnik R, Rinaldi E, Colonna P. Computational fluid dynamics of a radial compressor operating with supercritical CO2. J Eng Gas Turbines Power. 2012;134(12):122301. doi:10.1115/1.4007196. [Google Scholar] [CrossRef]
12. Rinaldi E, Pecnik R, Colonna P. Computational fluid dynamic simulation of a supercritical CO2 compressor performance map. J Eng Gas Turbines Power. 2015;137(7):072602. doi:10.1115/1.4029121. [Google Scholar] [CrossRef]
13. Lettieri C, Baltadjiev N, Casey M, Spakovszky Z. Low-flow-coefficient centrifugal compressor design for supercritical CO2. J Turbomach-Trans. 2014;136(8):081008. doi:10.1115/1.4026322. [Google Scholar] [CrossRef]
14. Gasparin E, Mattos V, Saltara F, Mello P, Dezan D, Salviano L, et al. High-dimensional CFD optimization of a low-flow coefficient S-CO2 centrifugal compressor for enhanced oil recovery systems. Geoenergy Sci Eng. 2023;227:211851. doi:10.1016/j.geoen.2023.211851. [Google Scholar] [CrossRef]
15. Hosseinpour J, Messele M, Engeda A. Design and development of a stable supercritical CO2 centrifugal compressor. Therm Sci Eng Prog. 2024;47(3):102273. doi:10.1016/j.tsep.2023.102273. [Google Scholar] [CrossRef]
16. Zheng C, Zhao W, Lyu B, Gao K, Cao H, Zhong L, et al. Performance analysis for a rotary compressor at high speed: experimental study and mathematical modeling. Appl Therm Eng. 2025;263(6):125275. doi:10.1016/j.applthermaleng.2024.125275. [Google Scholar] [CrossRef]
17. Lattner Y, Geller M, Kutz M. Physics-based surge point identification for unsupervised CFD-computation of centrifugal compressor speed lines. Energy Convers Manag X. 2023;17(1):100337. doi:10.1016/j.ecmx.2022.100337. [Google Scholar] [CrossRef]
18. Sandoval OR, Machado LHJ, Hanriot VM, Troysi F, Faria MTC. Acoustic and vibration analysis of a turbocharger centrifugal compressor failure. Eng Fail Anal. 2022;139(1):106447. doi:10.1016/j.engfailanal.2022.106447. [Google Scholar] [CrossRef]
19. Stajuda M, Cava DG, Liśkiewicz G. Aerodynamic instabilities detection via empirical mode decomposition in centrifugal compressors. Measurement. 2022;199(12):111496. doi:10.1016/j.measurement.2022.111496. [Google Scholar] [CrossRef]
20. Al-Busaidi W, Pilidis P. A new method for reliable performance prediction of multi-stage industrial centrifugal compressors based on stage stacking technique: part I—existing models evaluation. Appl Therm Eng. 2016;98:10–28. doi:10.1016/j.applthermaleng.2015.11.115. [Google Scholar] [CrossRef]
21. Sun Z, Zheng X, Kawakubo T. Experimental investigation of instability inducement and mechanism of centrifugal compressors with vaned diffuser. Appl Therm Eng. 2018;133(2):464–71. doi:10.1016/j.applthermaleng.2018.01.071. [Google Scholar] [CrossRef]
22. Dygutsch T, Kasper A, Voss C. On the effect of inter compressor duct length on compressor performance. Aeronaut J. 2022;126(1302):1333–50. doi:10.1017/aer.2022.51. [Google Scholar] [CrossRef]
23. Kim SG, Lee J, Ahn Y, Lee JI, Addad Y, Ko B. CFD Investigation of a centrifugal compressor derived from pump technology for supercritical carbon dioxide as a working fluid. J Supercrit Fluids. 2014;86(1):160–71. doi:10.1016/j.supflu.2013.12.017. [Google Scholar] [CrossRef]
24. Yang Z, Jiang H, Zhuge W, Cai R, Yang M, Chen H, et al. Flow loss mechanism in a supercritical carbon dioxide centrifugal compressor at low flow rate conditions. J Therm Sci. 2024;33(1):114–25. doi:10.1007/s11630-023-1857-0. [Google Scholar] [CrossRef]
25. Fujisawa N, Ema D, Ohta Y. Unsteady behavior of diffuser stall in a centrifugal compressor with Vaned diffuser. In: Proceedings of the ASME Turbo Expo 2020: Turbomachinery Technical Conference and Exposition. Volume 2D: Turbomachinery; 2020 Sep 21–25; Virtual. New York, NY, USA: American Society of Mechanical Engineers; 2021. V02DT46A005. [Google Scholar]
26. Zamiri A, Lee BJ, Taek Chung J. Numerical evaluation of transient flow characteristics in a transonic centrifugal compressor with vaned diffuser. Aerosp Sci Technol. 2017;70(1):244–56. doi:10.1016/j.ast.2017.08.003. [Google Scholar] [CrossRef]
27. Yang M, Cai R, Shu M, Pan L, Zhuge W, Yang B. Effects of pulsating backpressure on performance of stability of a centrifugal compressor. Aerosp Sci Technol. 2022;130:107926. doi:10.1016/j.ast.2022.107926. [Google Scholar] [CrossRef]
28. Yang M, Shu M, Yang B, Martinez-Botas R, Deng K. Unsteady response of performance for centrifugal compressor under pulsating backpressure condition. Aerosp Sci Technol. 2022;126(6):107589. doi:10.1016/j.ast.2022.107589. [Google Scholar] [CrossRef]
29. Abdelwahed M, Bade R, Chaker H, Hassine M. On the study of three-dimensional compressible navier-stokes equations. Bound Value Probl. 2024;2024(1):84. doi:10.1186/s13661-024-01893-9. [Google Scholar] [CrossRef]
30. Lateb M, Masson C, Stathopoulos T, Bédard C. Comparison of various types of k–ε models for pollutant emissions around a two-building configuration. J Wind Eng Ind Aerodyn. 2013;115(29):9–21. doi:10.1016/j.jweia.2013.01.001. [Google Scholar] [CrossRef]
31. Zwart PJ, Alan D. Coupled algebraic multigrid for free surface flow simulations. In: Proceedings of the ASME 2007 26th International Conference on Offshore Mechanics and Arctic Engineering; 2007 Jun 10–15; San Diego, CA, USA. p. 655–64. doi:10.1115/OMAE2007-29080. [Google Scholar] [CrossRef]
32. Höhne T. CFD simulation of thermal-hydraulic benchmark V1000CT-2 using ANSYS CFX. Sci Technol Nucl Install. 2009;2009(1):835162. doi:10.1155/2009/835162. [Google Scholar] [CrossRef]
33. Rinaldi E, Pecnik R, Colonna P. Numerical computation of the performance map of a supercritical CO2 radial compressor by means of three-dimensional CFD simulations. In: Proceedings of the ASME Turbo Expo 2014: Turbine Technical Conference and Exposition. Volume 3B: Oil and Gas Applications; Organic Rankine Cycle Power Systems; Supercritical CO2 Power Cycles; Wind Energy; 2014 Jun 16–20; Düsseldorf, Germany. New York, NY, USA: American Society of Mechanical Engineers; 2014. V03BT36A017. [Google Scholar]
Cite This Article
 Copyright © 2025 The Author(s). Published by Tech Science Press.
This work is licensed under a Creative Commons Attribution 4.0 International License , which permits unrestricted use, distribution, and reproduction in any medium, provided the original work is properly cited.
 Downloads
 Citation Tools