
 Submit a Paper
 Propose a Special lssue
 Open Access
ARTICLE

A Numerical Investigation of Smoke Propagation in Atrium Fires: Role of Make-Up Air Velocity and Fire Source Position with Polystyrene Fuel
1 Mechanical Engineering Department, Misr University for Science and Technology, Giza Governorate, 3237101, Egypt
2 Mechanical Engineering Department, Cairo University, Giza Governorate, 12613, Egypt
3 Department of Management, Universiti Teknologi PETRONAS, Seri Iskandar, 32610, Malaysia
4 Interdisciplinary Research Centre for Aviation and Space Exploration (IRC-ASE), King Fahd University of Petroleum and Minerals (KFUPM), Dhahran, 31261, Saudi Arabia
* Corresponding Author: Ghulam E Mustafa Abro. Email:
# These authors contributed equally to this work
Fluid Dynamics & Materials Processing 2025, 21(8), 2027-2046. https://doi.org/10.32604/fdmp.2025.067678
Received 09 May 2025; Accepted 11 August 2025; Issue published 12 September 2025
 View Full Text
 Download PDF
Abstract
Atrium spaces, common in modern construction, provide significant fire safety challenges due to their large vertical openings, which facilitate rapid smoke spread and reduce sprinkler effectiveness. Traditional smoke management systems primarily rely on make-up air to replace the air expelled through vents. Inadequate calibration, particularly with air velocity, can worsen fire conditions by enhancing oxygen supply, increasing soot production, and reducing visibility, so endangering safe evacuation. This study investigates the impact of make-up air velocity on smoke behaviour in atrium environments through 24 simulations performed using the Fire Dynamics Simulator (FDS). Scenarios include various fire intensities (1, 3, 5 MW) and make-up air velocities (1–3.5 m/s), with fire sources located at the centre, northeast, and southwest corners. The simulation model was validated using updated full-scale fire test data with polystyrene fuel, leading to heightened soot density and reduced smoke clear height. This Research design diverges from other studies that predominantly utilized propane pool fires and concentrated on axisymmetric (Fire at the center of the atrum), Northeast and Southeast corners of the atrium scenarios by using polystyrene—a widely accessible construction material and examining several asymetric fire sites, so providing a more authentic depiction of atrium fire settings. Research reveals that increased air velocities, especially when directed at the fire, result in greater soot density and reduced smoke clearance due to intensified combustion. The northeastern region consistently displayed high temperature readings, highlighting the importance of fire source positioning in smoke behaviour. The study recommends limiting make-up air velocity to 1 m/s to avert turbulence and guarantee safety. This research provides critical insights for fire safety design and aligns with the United Nations Sustainable Development Goals, namely SDG 9 and SDG 11, by promoting safer and more resilient construction practices in urban environments.Keywords
Atrium spaces are a defining feature of contemporary multi-story office and commercial architecture, esteemed for its capacity to augment natural light, elevate indoor aesthetics, and foster open, inviting settings. Nonetheless, their vertically exposed design presents considerable fire safety hazards. In a fire event, smoke can swiftly ascend through the atrium due to thermal buoyancy, jeopardising top floors much sooner than in conventional compartmentalised structures. This vertical linkage between levels not only hastens smoke dissemination but also compromises the efficacy of fire suppression and evacuation systems [1–4]. Mechanical smoke exhaust systems are often utilised in atrium areas to alleviate these dangers. These systems function by collecting hot smoke gases from the upper atrium levels and sustaining a viable smoke layer clear height to facilitate safe evacuation. Fire scenario designs and plume correlations are employed to determine the necessary exhaust flow rates for different fire intensities [5]. To sustain pressure balance and avert adverse pressure consequences, make-up air is injected at lower levels to compensate for the extracted air volume [6,7]. Recent experiments indicate that excessive make-up air velocity can interfere with the plume’s upward flow, diminishing the height of the smoke interface and undermining system performance. Turbulent airflows can facilitate smoke dispersion and disrupt stratification, resulting in unanticipated smoke propagation. This effect is exacerbated when the fire source is positioned near ventilation apertures [8] or when asymmetric venting designs are employed [9,10]. The research that was carried out by Rafinazari, Ayala, Cantizano, and other individuals utilised both numerical simulations [11–13] and full-scale testing in order to demonstrate the significant influence [14,15] that fire size, air velocity, vent placement, and fire position had on smoke dynamics in atria [16].
Furthermore, investigations into fire whirls, smoke recirculation, and multi-source fire scenarios have increased the complexity of smoke control design in large-volume atrium constructions. Experimental and computational endeavours utilising tools such as Fire Dynamics Simulator (FDS) have demonstrated encouraging outcomes in forecasting smoke behaviour; nonetheless, difficulties remain in validating simulation results, particularly in lower plume areas and near-wall circumstances [4,9,13]. Additional research has highlighted the influence of architectural elements, such atrium configuration, roof design, and fire shutter elevation, on ventilation efficacy [10,11]. Concurrently, empirical evidence from institutions including hospitals and shopping centres has enhanced practical comprehension [5,14,15]. The efficiency of smoke extraction is additionally affected by parameters such as exhaust and make-up air ratios, vent areas, and the dimensions of openings in relation to fire sources. Key design concerns have developed, including limiting a make-up air velocity below 1.5–1.75 m/s and ensuring symmetric vent location, to preserve clean smoke layers and avert dangerous circumstances [6,12,14,16]. In spite of these developments, there is still a need for comprehensive study that investigates the dynamic interaction [17–19] of all essential components when they are in authentic operating contexts [20–23]. The features of the fire source, the layout of the vents [24–27], the architectural limits [28–29], and the airflow rates are all examples of these variables [30]. This research delineates the following key contributions:
• Conducting a review of current computational and experimental studies to rigorously evaluate the impact of make-up air velocity, fire source positioning, and vent configuration on smoke movement and ventilation efficacy in atrium settings.
• Assessing and proposing an ideal operating thresholds and architectural factors for efficient smoke control, providing practical recommendations to enhance system performance and reduce smoke layer disturbance across diverse fire scenarios.
• Devising a progressive research framework to facilitate sophisticated simulation methodologies, integrating phenomena such as fire whirls and multi-source fire dynamics, while improving the precision and relevance of computer modelling in forthcoming atrium fire safety investigations.
These scientific contributions render this study unique. This manuscript has been segmented into five sections. Section 1 presents the history pertinent to the issue of our research and delineates the current status of methods. Section 2 delineates the comprehensive technique, while all results are presented in Section 3. Section 4 presents the conclusion and discussion, followed by future proposals and directions in Section 5. The complete flow of this research has been illustrated in Fig. 1.
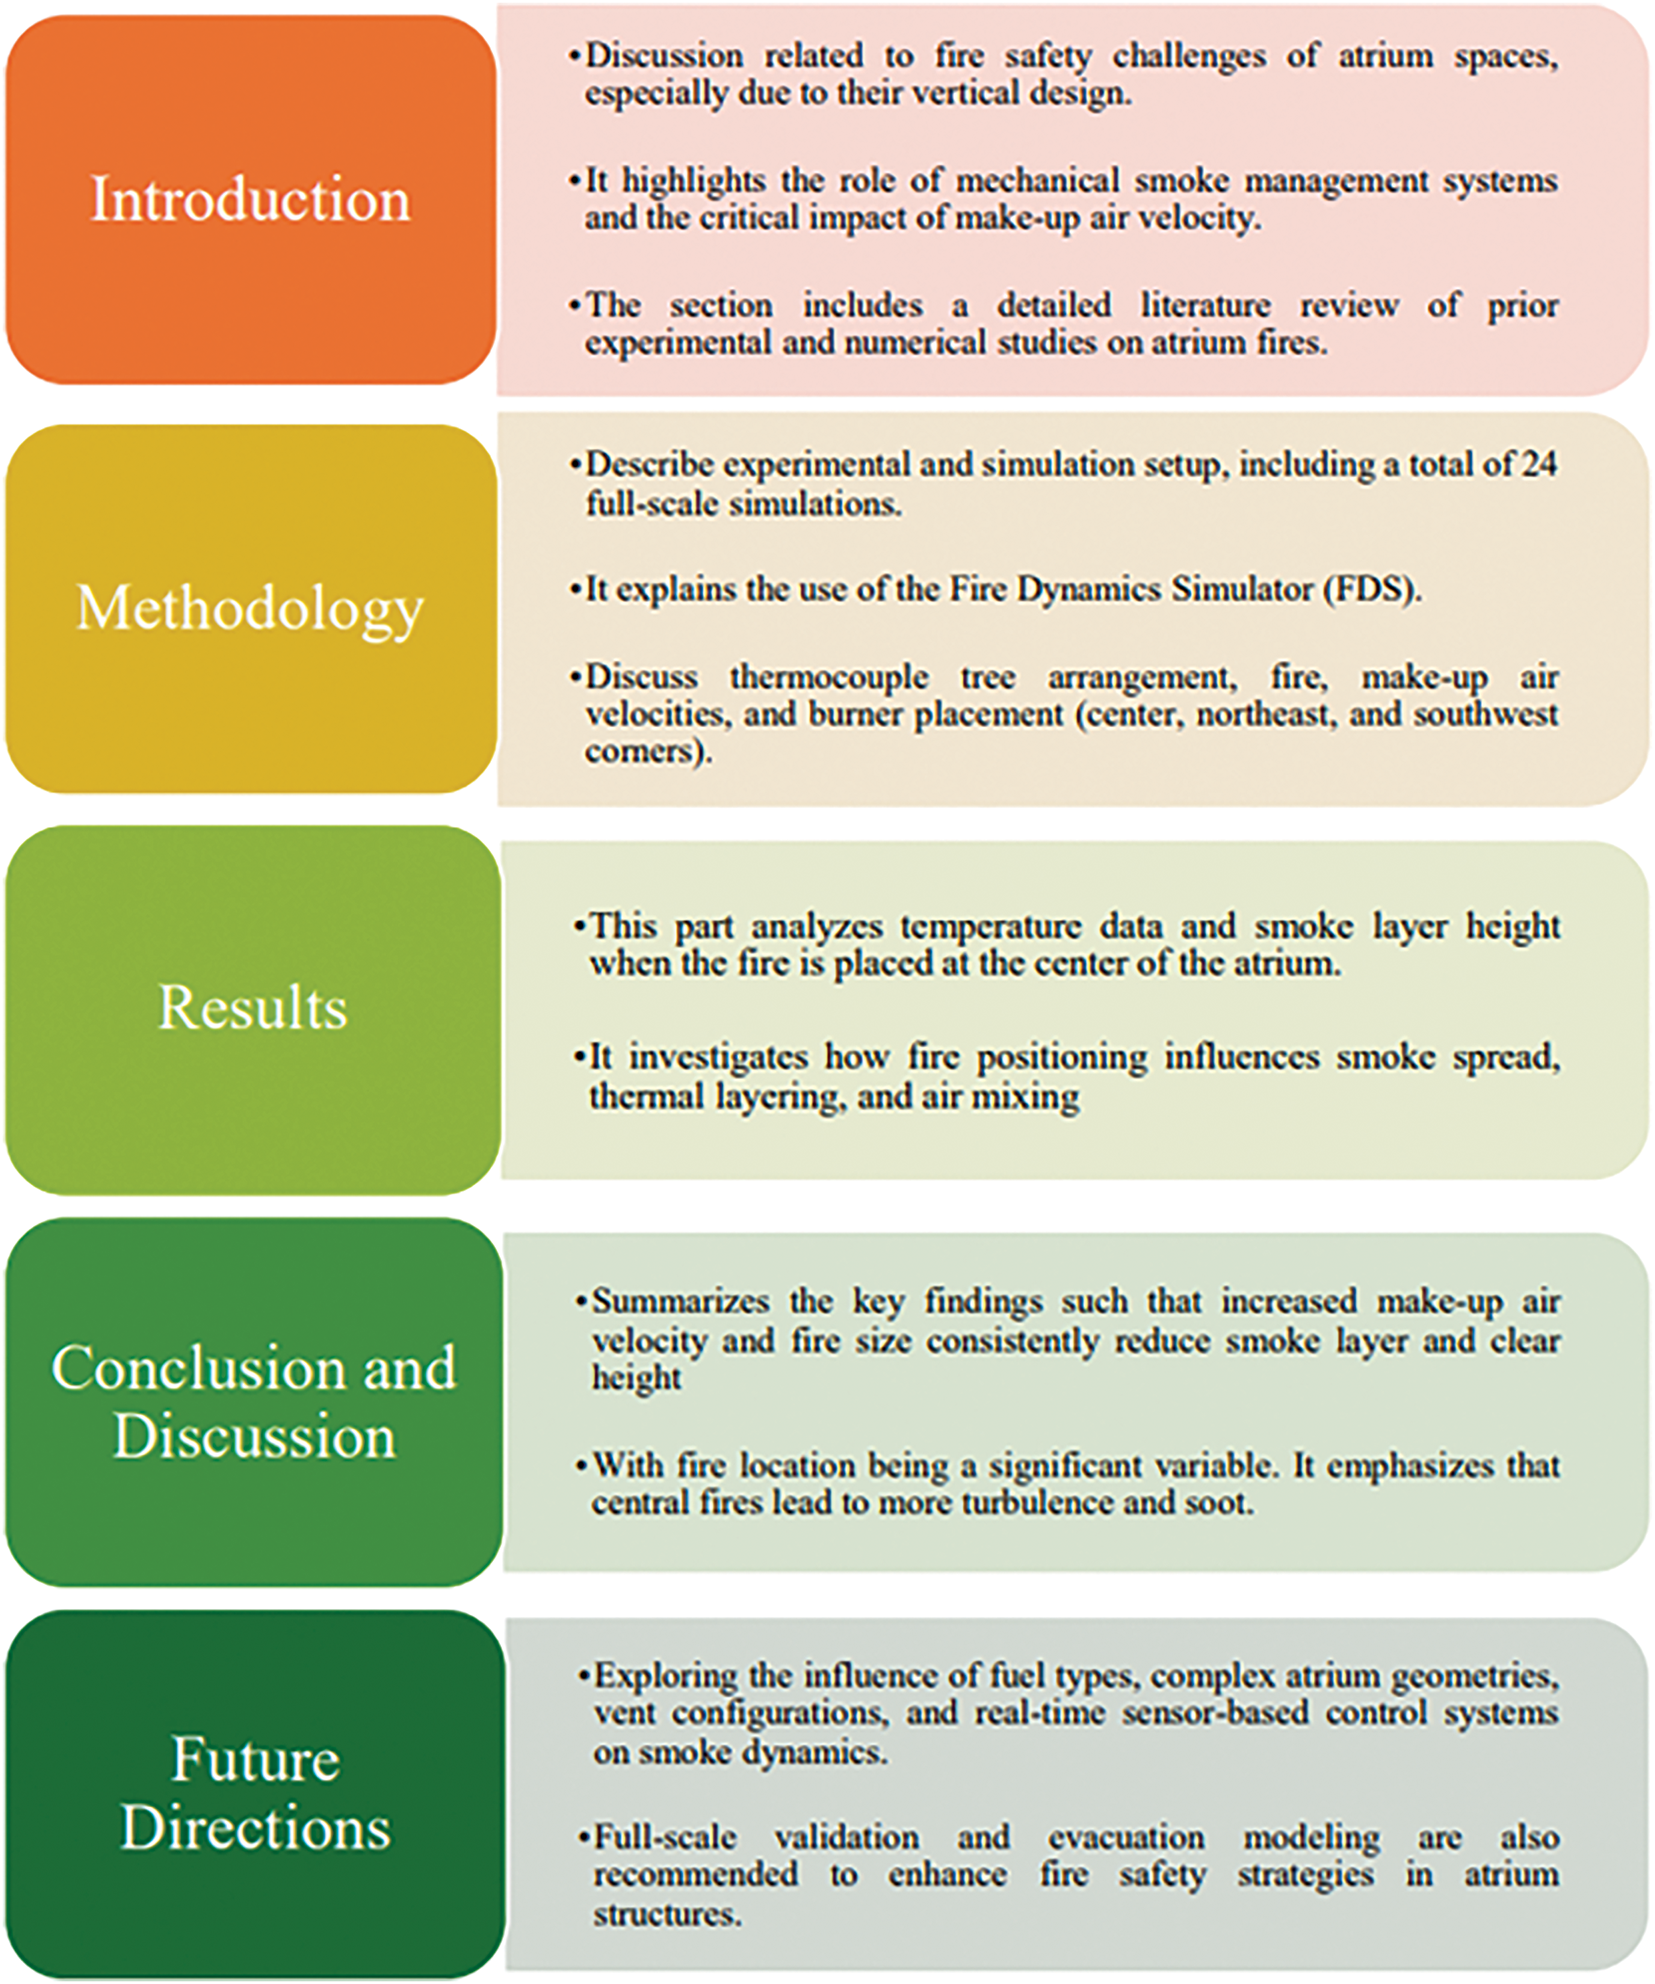
Figure 1: Organization of proposed research
A total of 24 full-scale simulations were conducted at Carleton University’s fire lab [16], as illustrated in Fig. 2. Moreover, three fire sizes (1, 3, and 5 MW) were considered. The exhaust system consisted of six ceiling fans, maintaining a constant flow rate of 33 m3/s as shown in Fig. 3. As the fire progressed and smoke rose, temperature elevations were recorded by thermocouples corresponding to the smoke interface. Additionally, four gas-phase device trees—also composed of 25 sensors each—were used to monitor visibility levels across varying heights as shown in Fig. 4 whereas thermocouples spaced at 1-m intervals from the lower atrium level to the upper boundary as shown in Fig. 5.
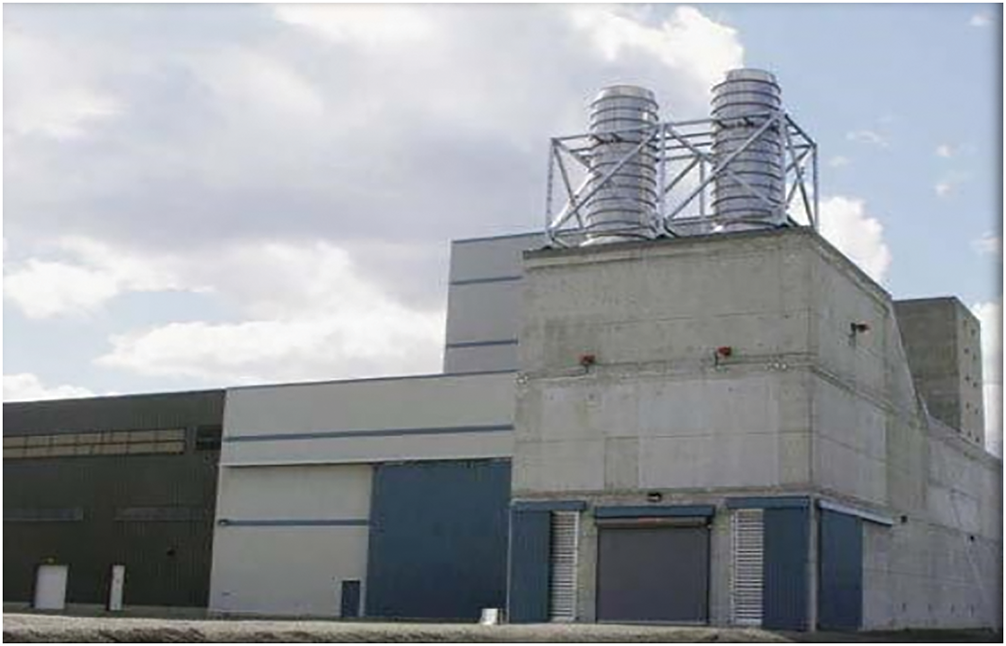
Figure 2: Carleton University fire lab-atrium location
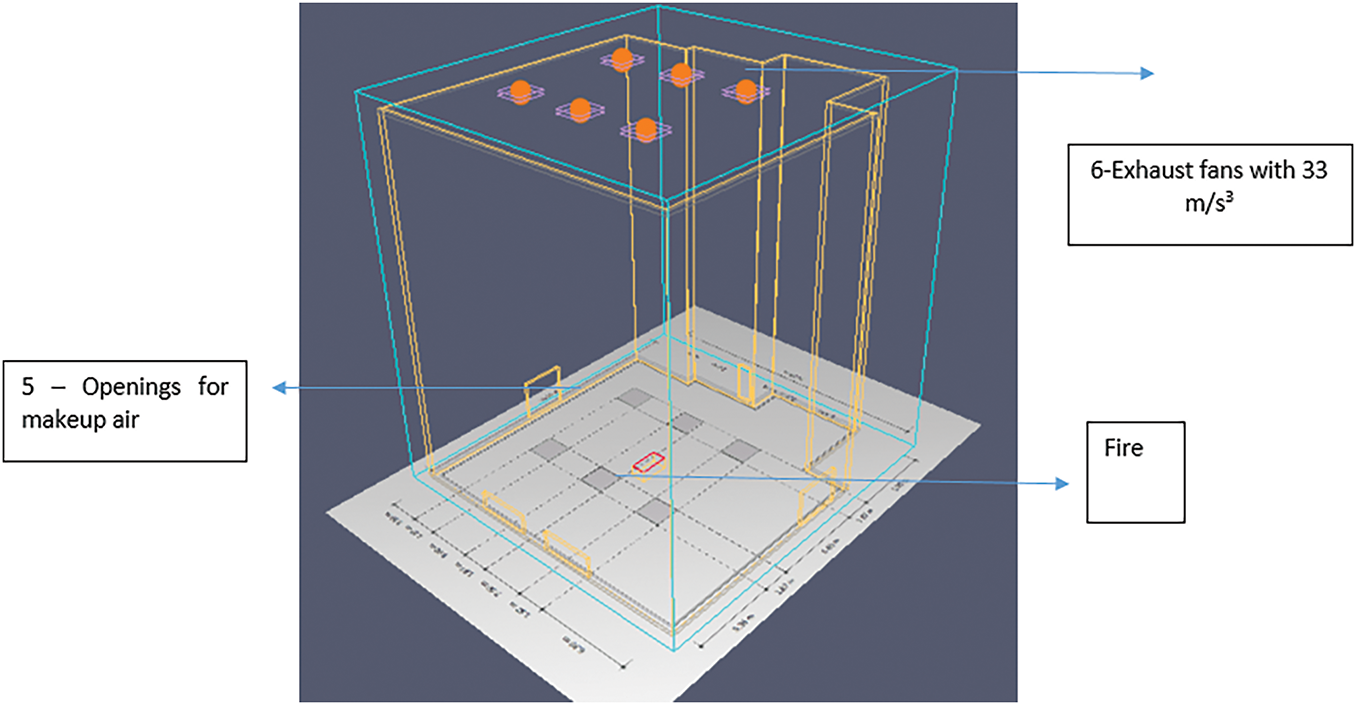
Figure 3: Atrium showing the Vents, Fire and makeup openings
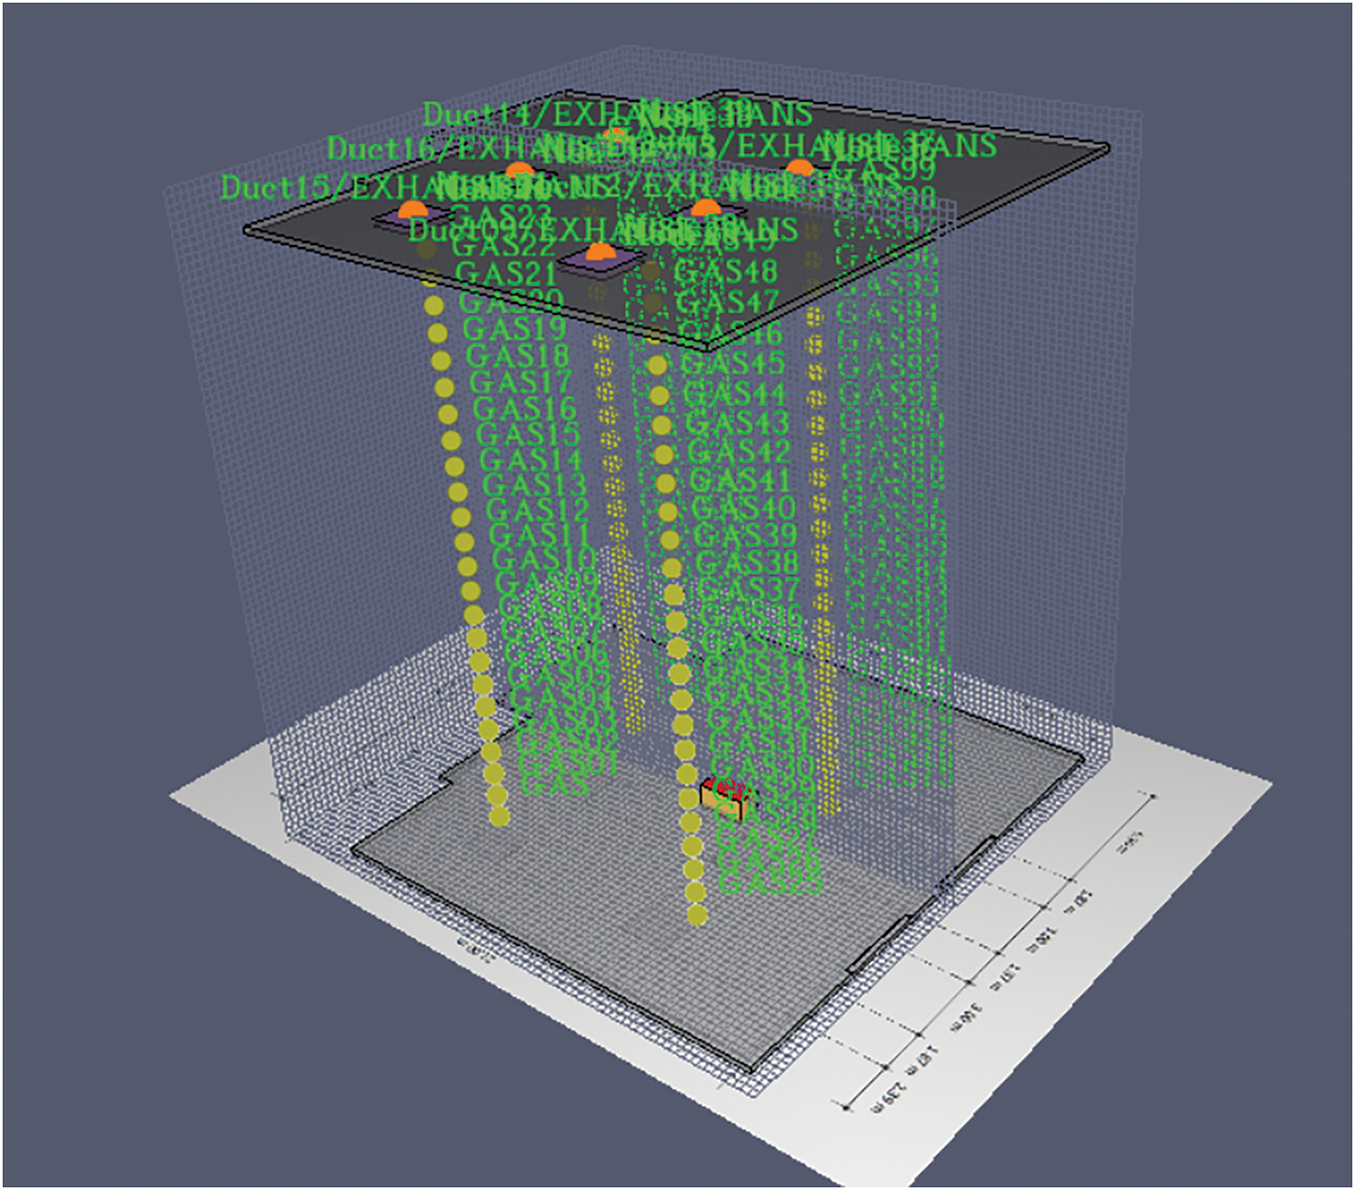
Figure 4: Gas phase devices to detect the visibility on the domain
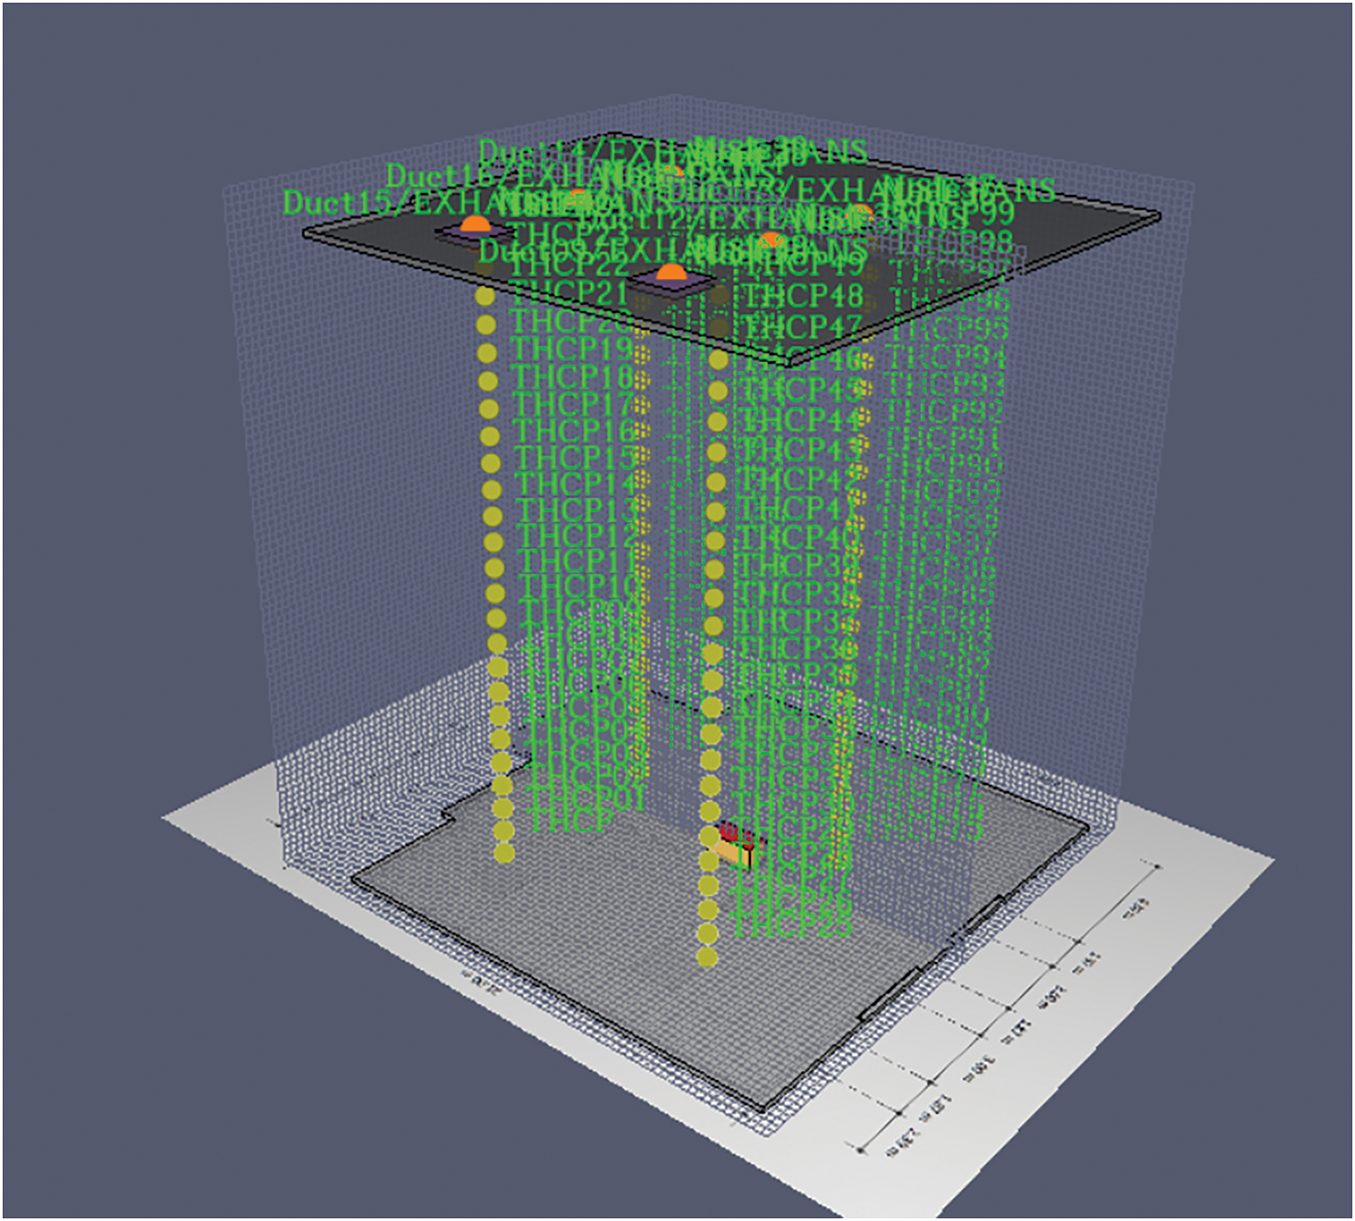
Figure 5: Thermocouple trees to detect the temperature on the domain
Fig. 6 presents results derived from gas-phase visibility data, ramp up time for 1 MW fire size and Ramp up time for 3 MW fire size has been illustrated in Fig. 7. Fig. 8, in the same way, shows the Ramp up time for 5 MW fire size and Fig. 9 depicts atrium with locations of thermocouple, makeup openings and fire overall. Within Fig. 9, the influence of make-up air velocities (1, 1.5, 2.5 and 3.5 m/s) was evaluated for fire locations at the center of the atrium, whereas (1 and 3.5 m/s) was evaluated for Northeast and Southwest fires. Fig. 10 shows thermal profiles measured by thermocouples. Upon completion of the 600-s simulation, data from all sensors were exported to Excel, and averaged values were calculated to establish smoke layer behavior over time. As illustrated in Fig. 11, increased fire size corresponded to decreased smoke layer height.
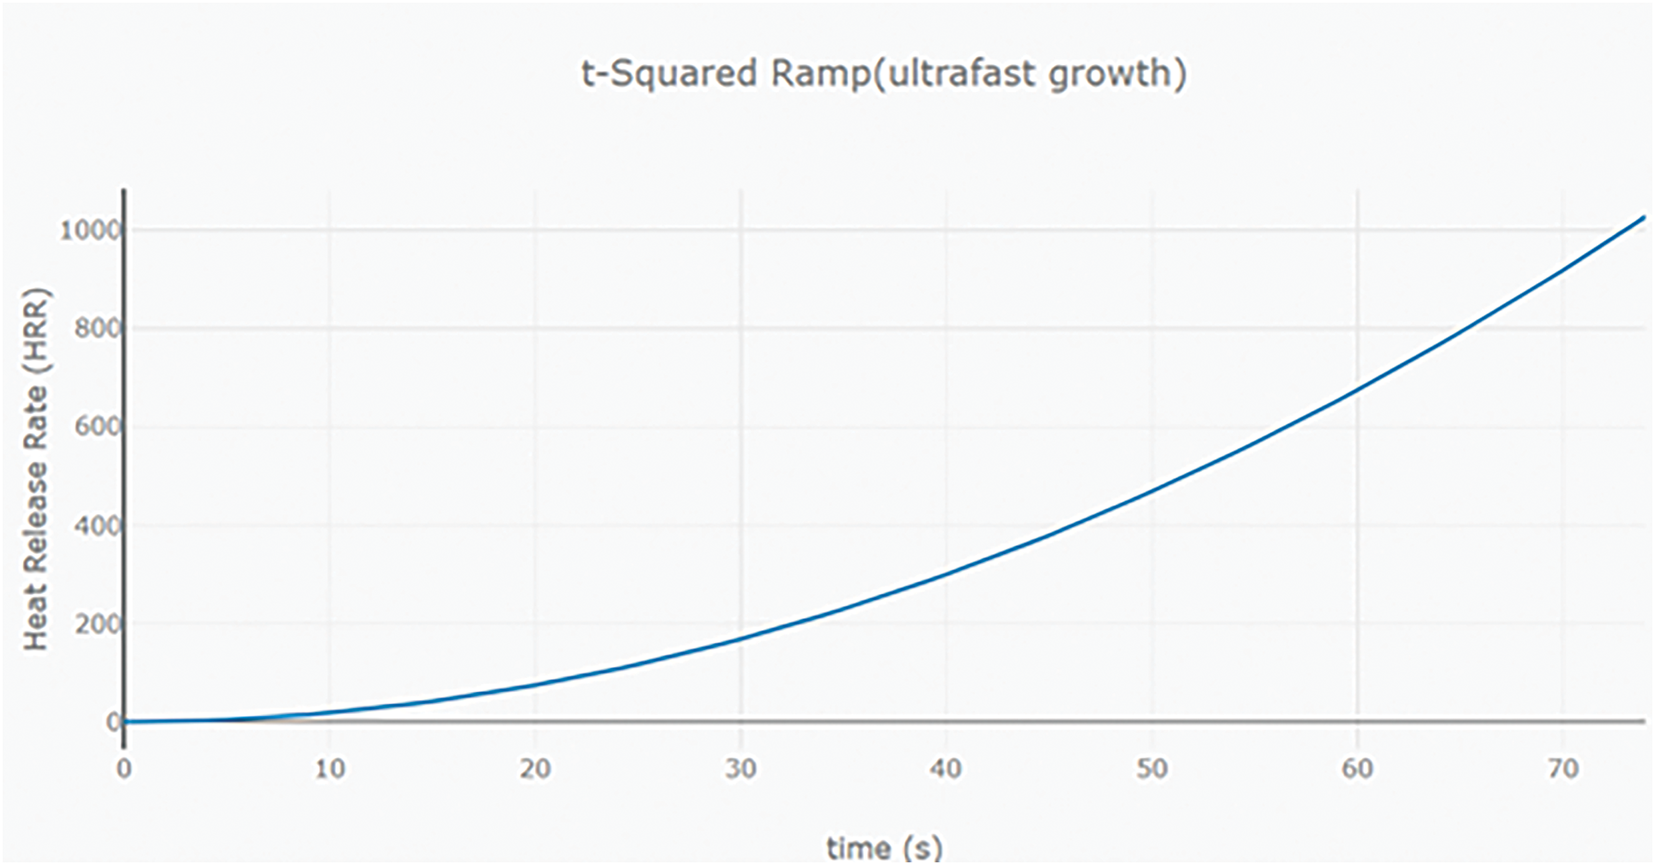
Figure 6: Ramp up time for 1 MW fire size
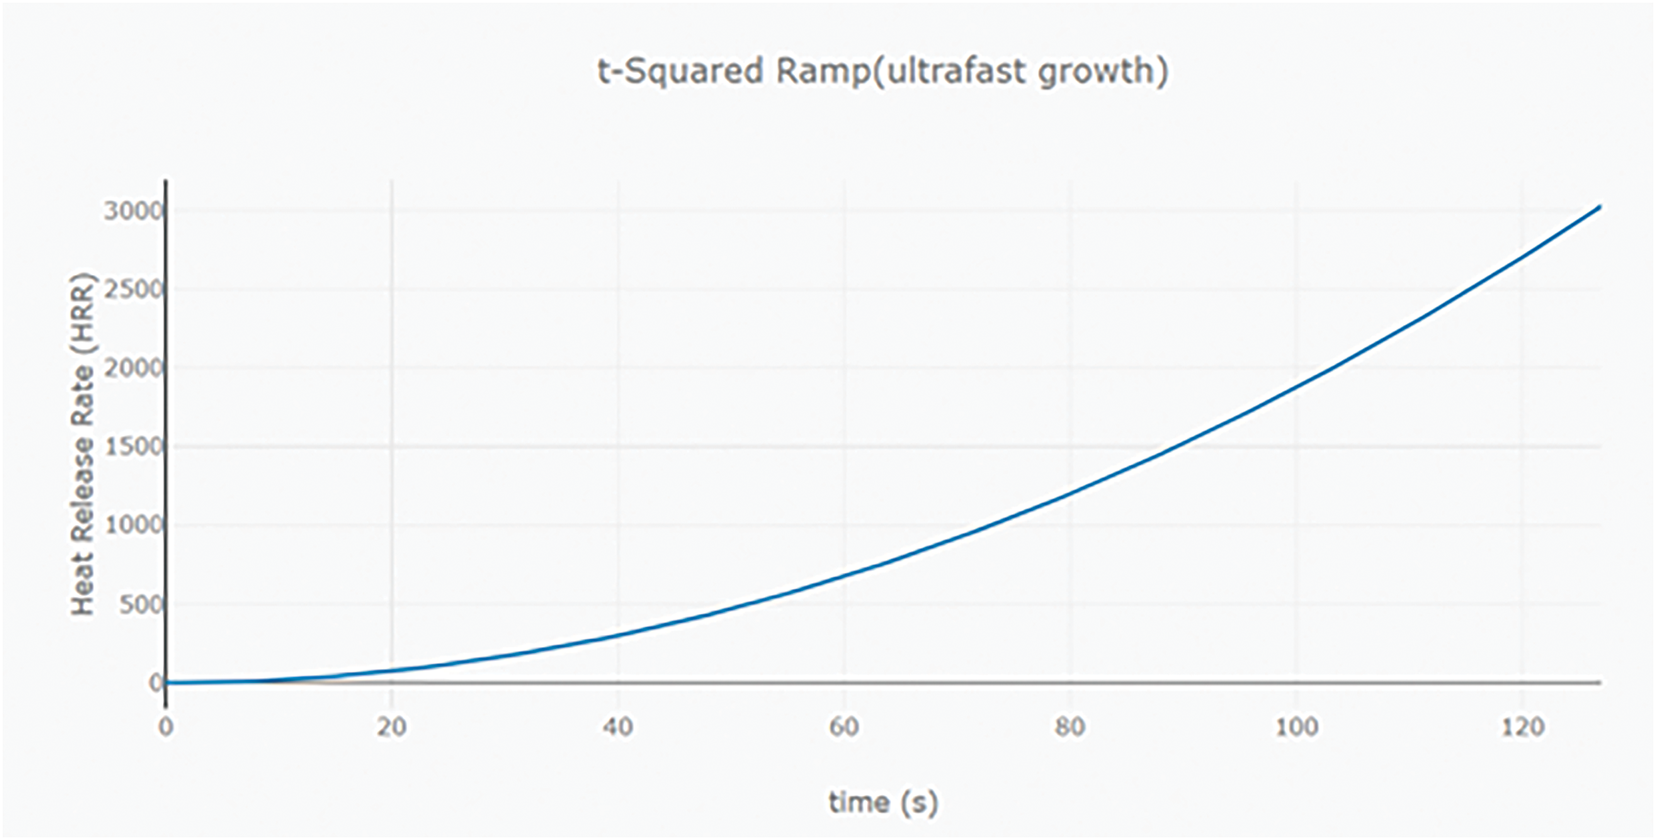
Figure 7: Ramp up time for 3 MW fire size
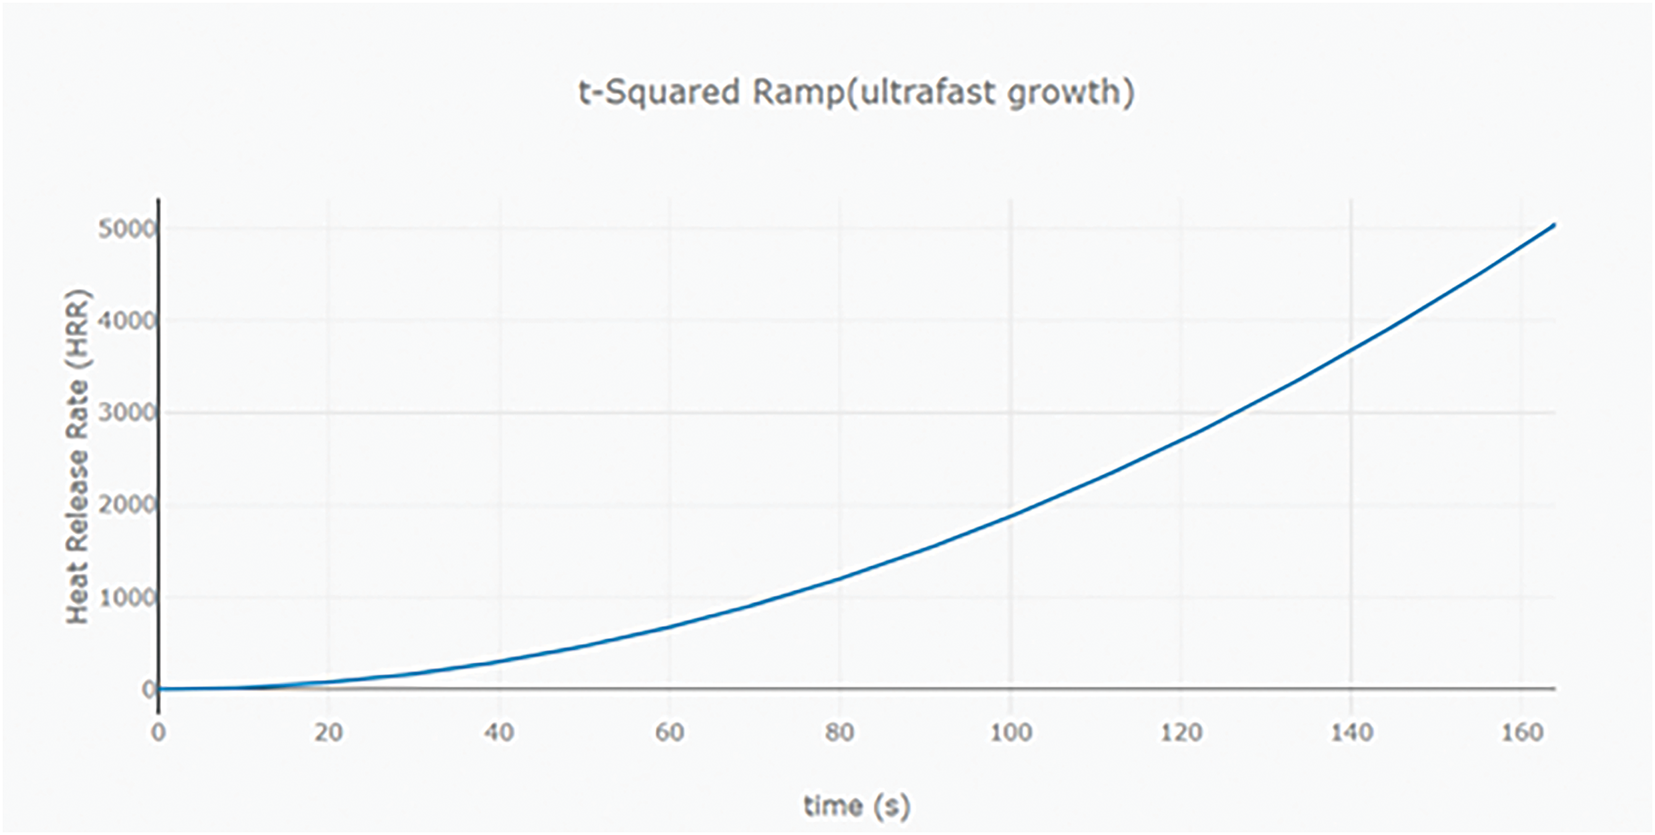
Figure 8: Ramp up time for 5 MW fire size
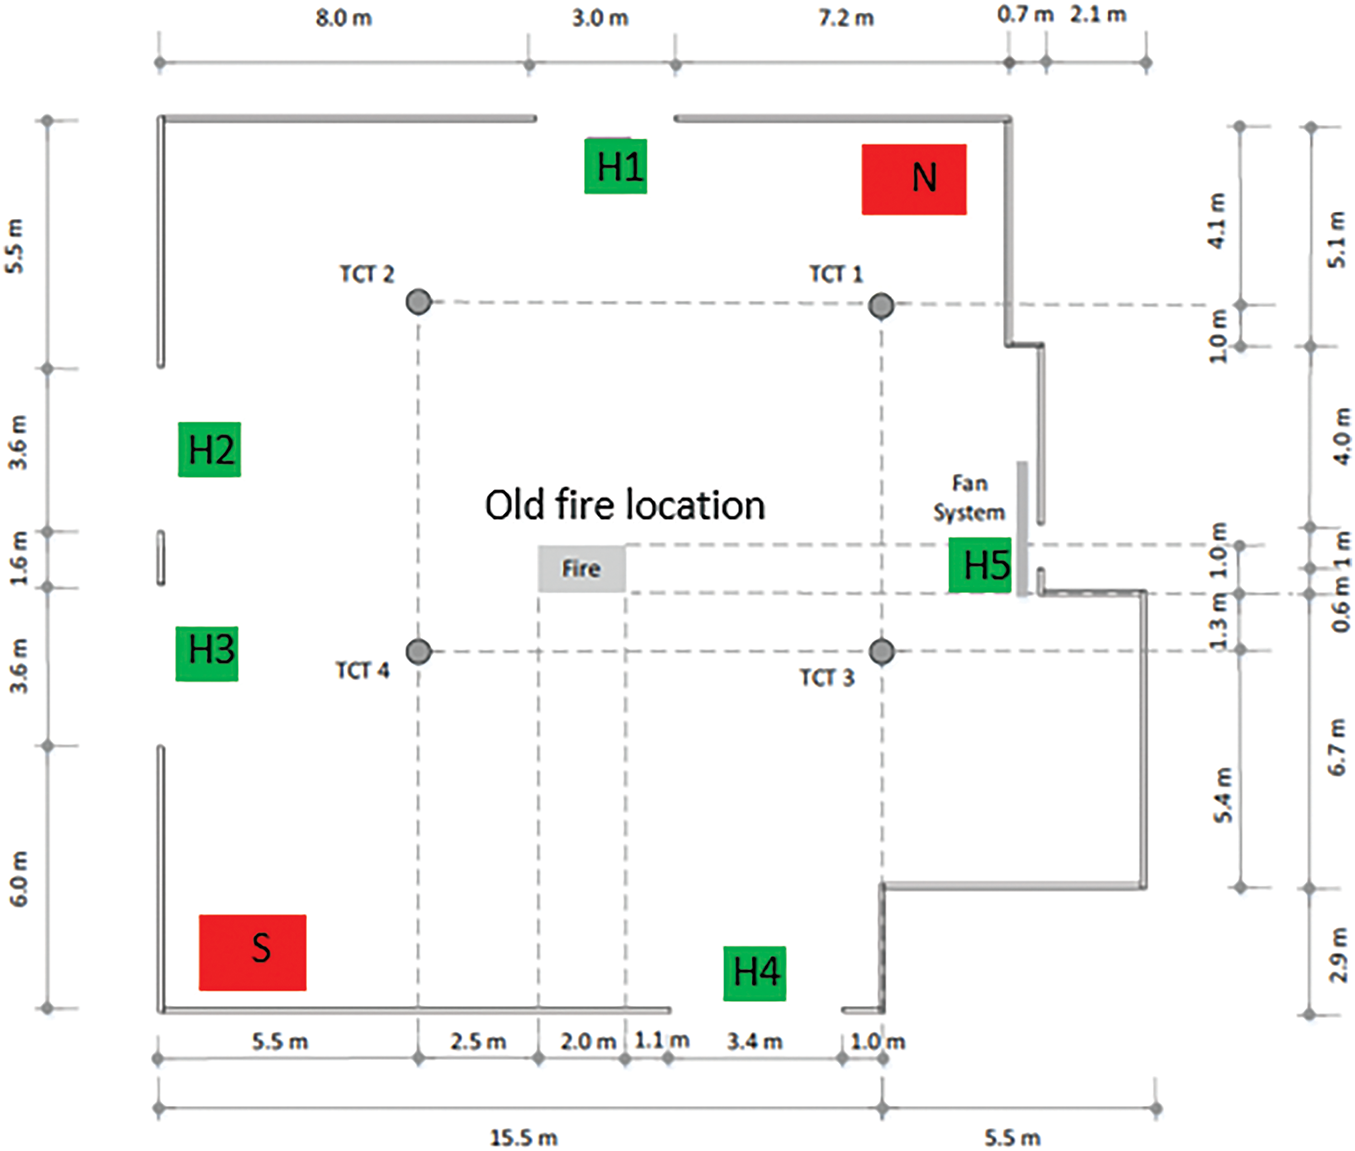
Figure 9: Atrium with locations of thermocouple, makeup openings and fire
Figure 10: Vertical temperature profiles at steady state
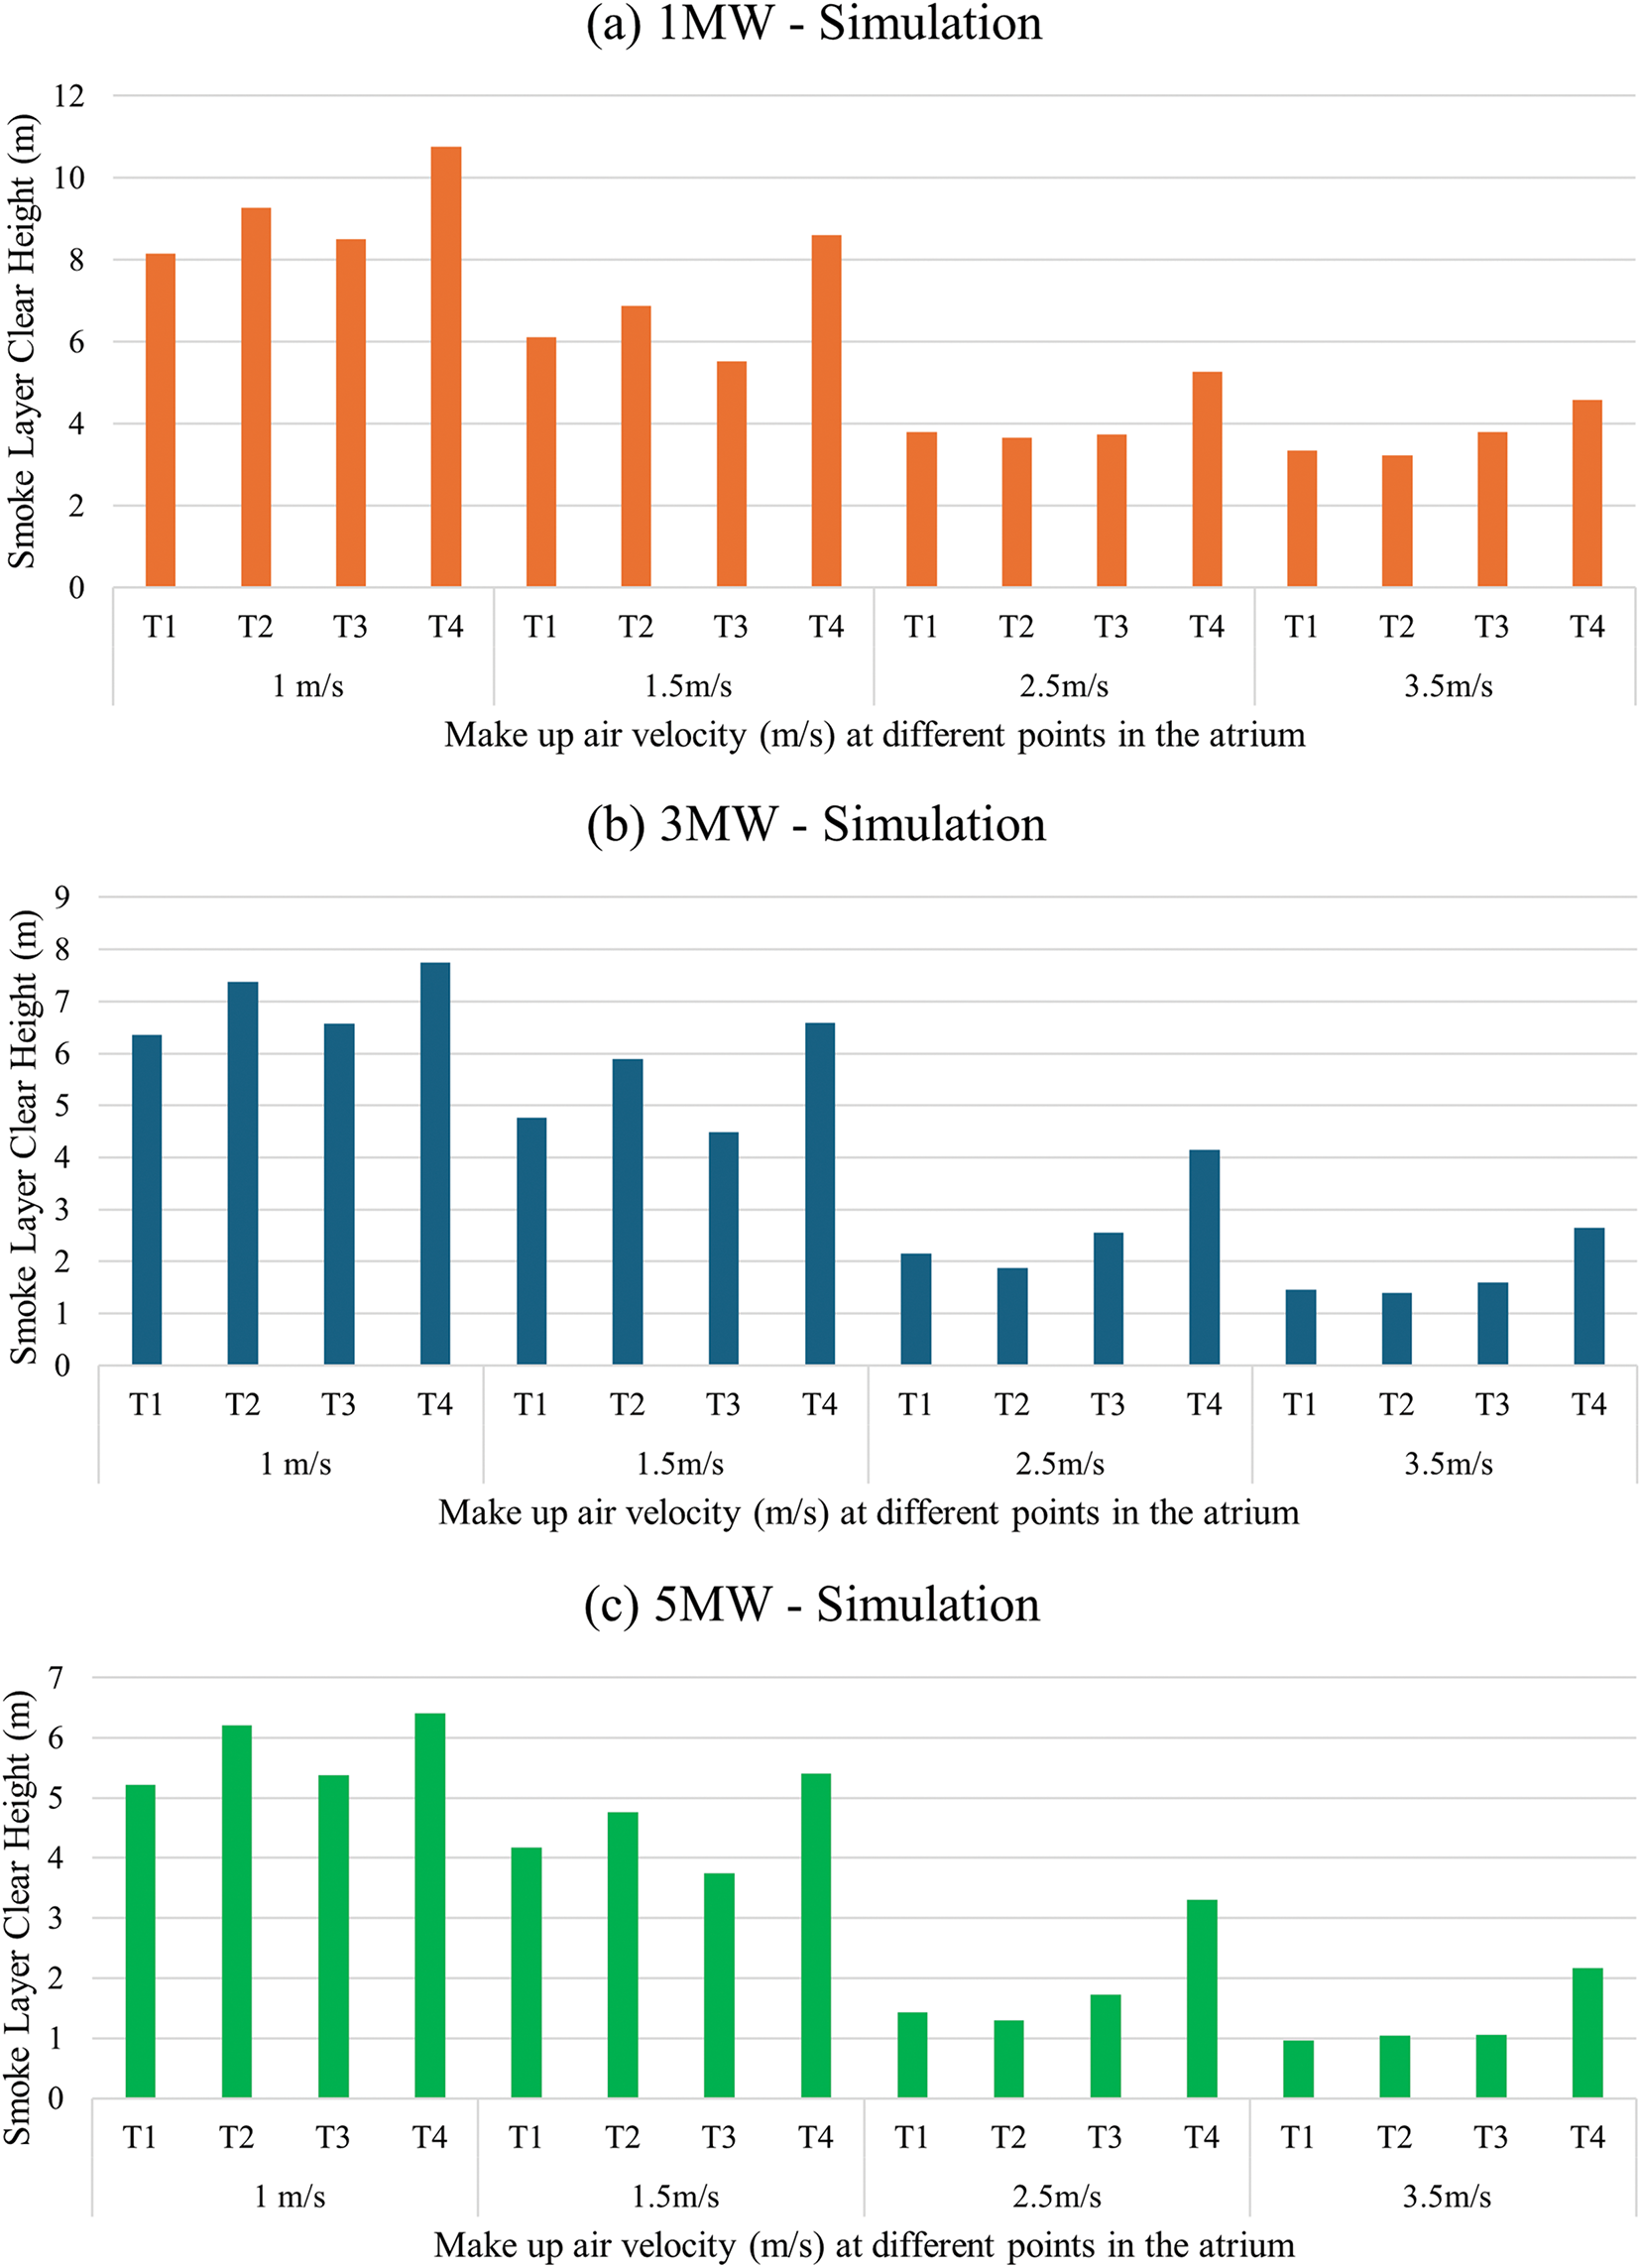
Figure 11: Simulated smoke layer clear height distribution at thermocouple trees T1–T4 under varying make-up air velocities (1.0–3.5 m/s) for fire sizes of (a) 1 MW, (b) 3 MW, and (c) 5 MW. Results show a consistent inverse relationship between make-up air velocity and smoke layer height, with greater turbulence and entrainment at higher velocities leading to reduced clear heights across all fire scenarios
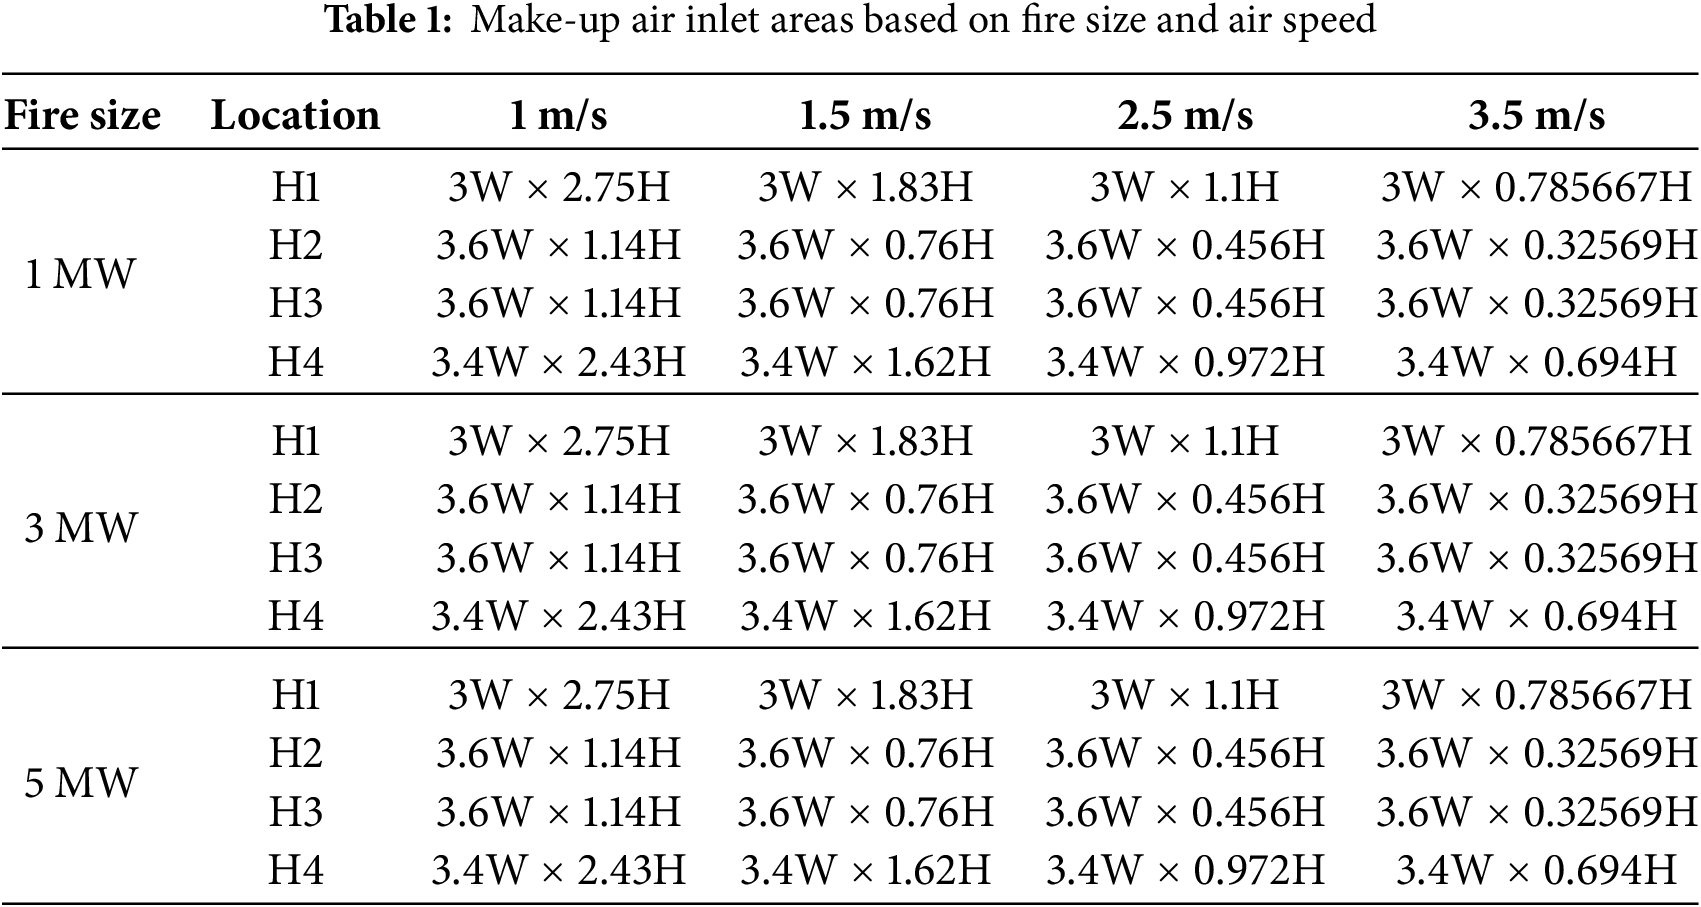
The make-up air was introduced via five adjustable openings (H1–H5), and the burner (2
Each simulation was conducted for 600 s with a constant mechanical exhaust rate of 33
In this study, the heat release rate (Q) was determined using the quadratic fire growth equation
The burner used polystyrene, selected for its high soot yield and realistic fire behavior in atria. Table 2 summarizes the burner’s thermal properties [29]. A medium-resolution grid (0.30 m
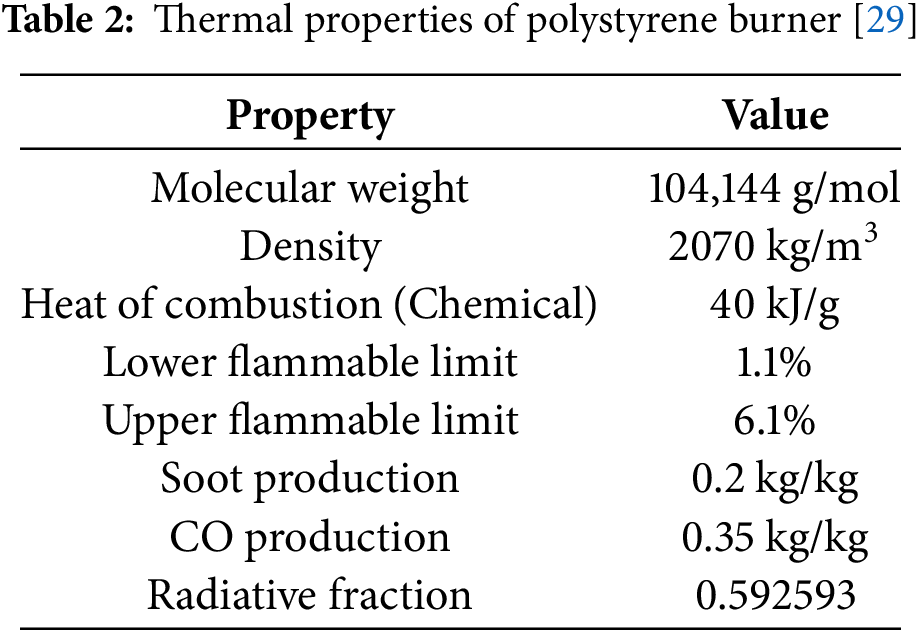
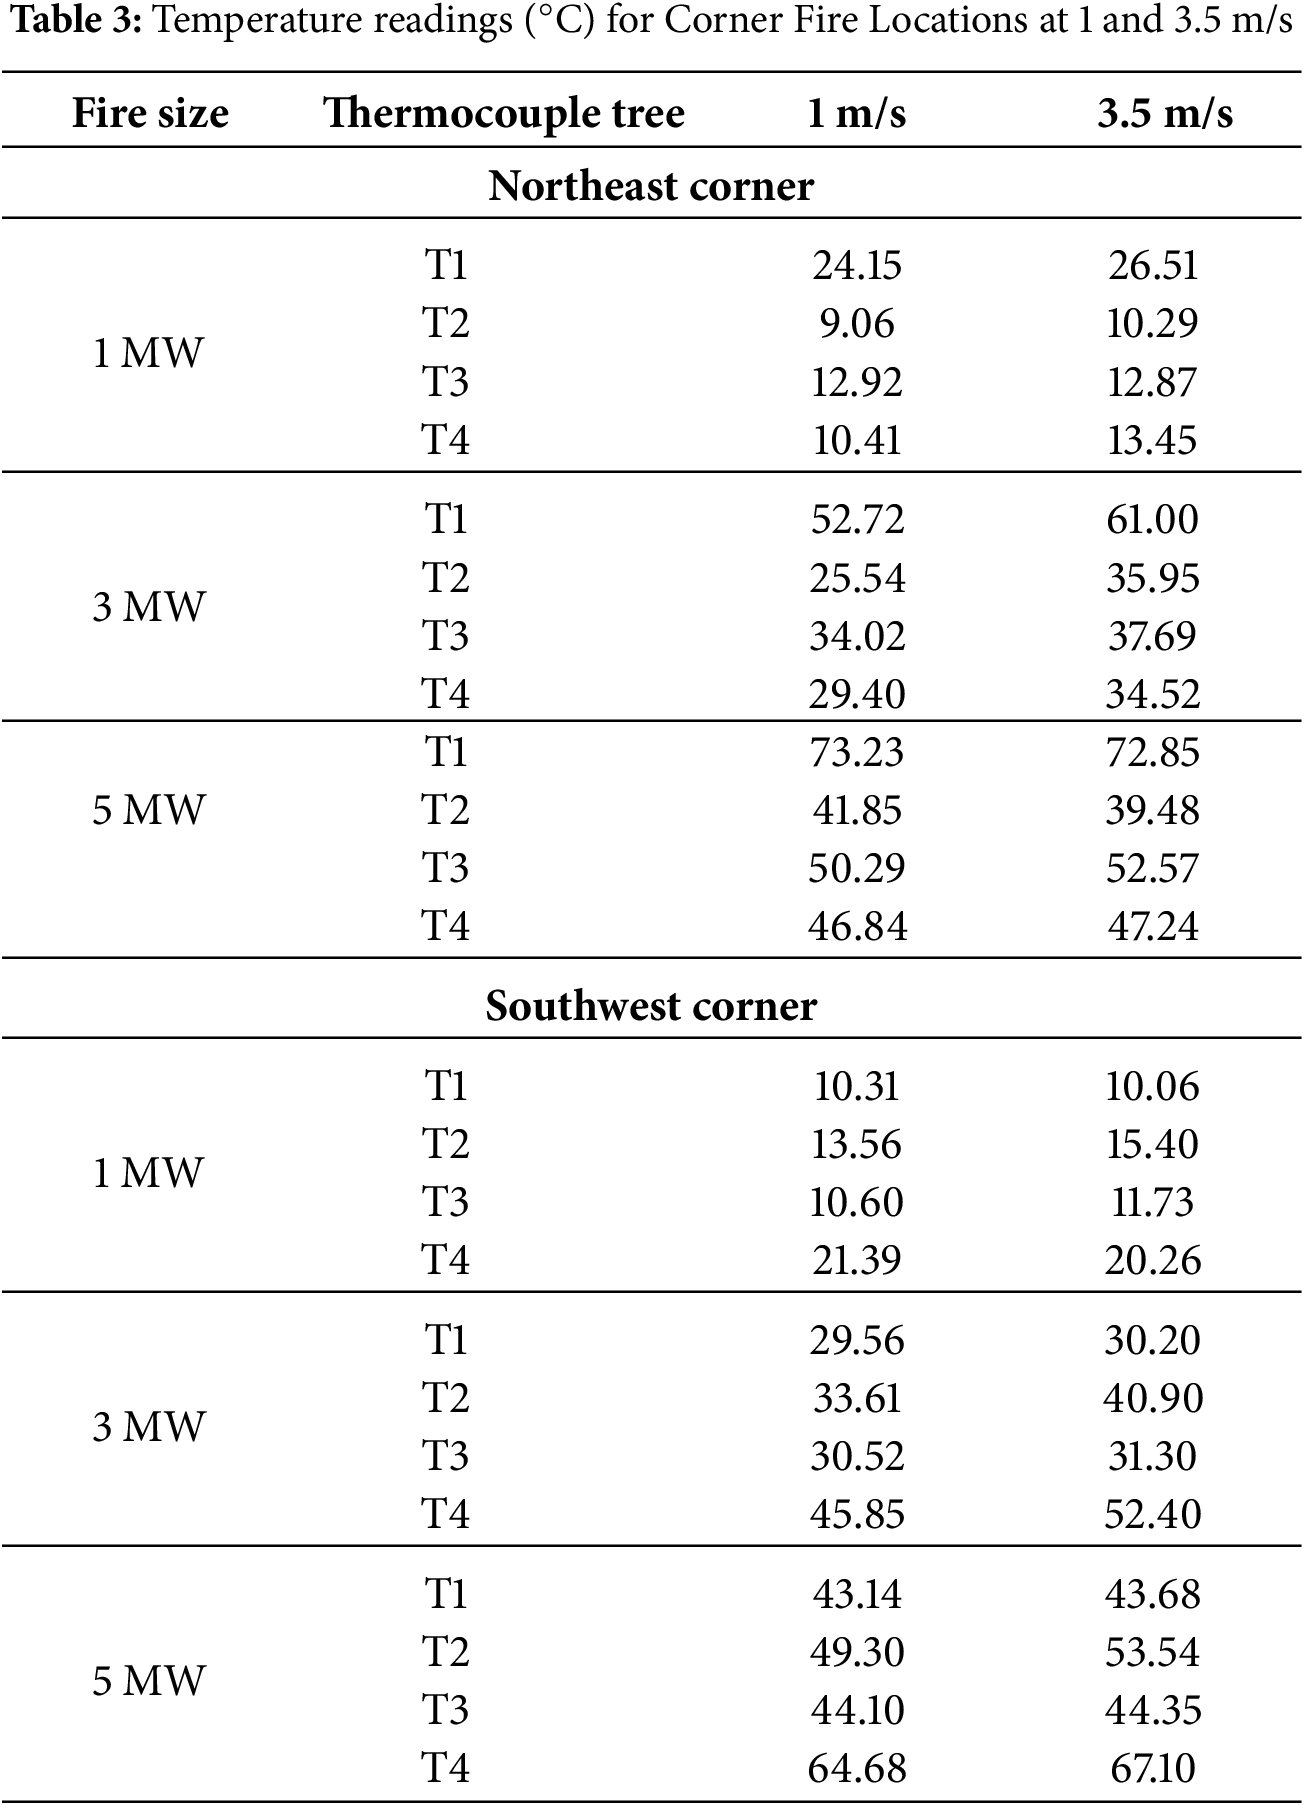
Please note that polystyrene is a solid plastic known for its high soot yield due to incomplete combustion and complex molecular structure. Later Table 3 summarizes fire scenarios for corner locations (Northeast and Southwest) under 1 and 3.5 m/s air velocities. Identical burner properities, Ambient durations were applied whereas Table 5 summarizes the fire scenarios for the fire located at the center of the atrium under (1, 1.5, 2.5, and 3.5 m/s) air velocities. The fuel used was Polystyrene as the burner and different ambient Temperatures and same Duration for 600 s.
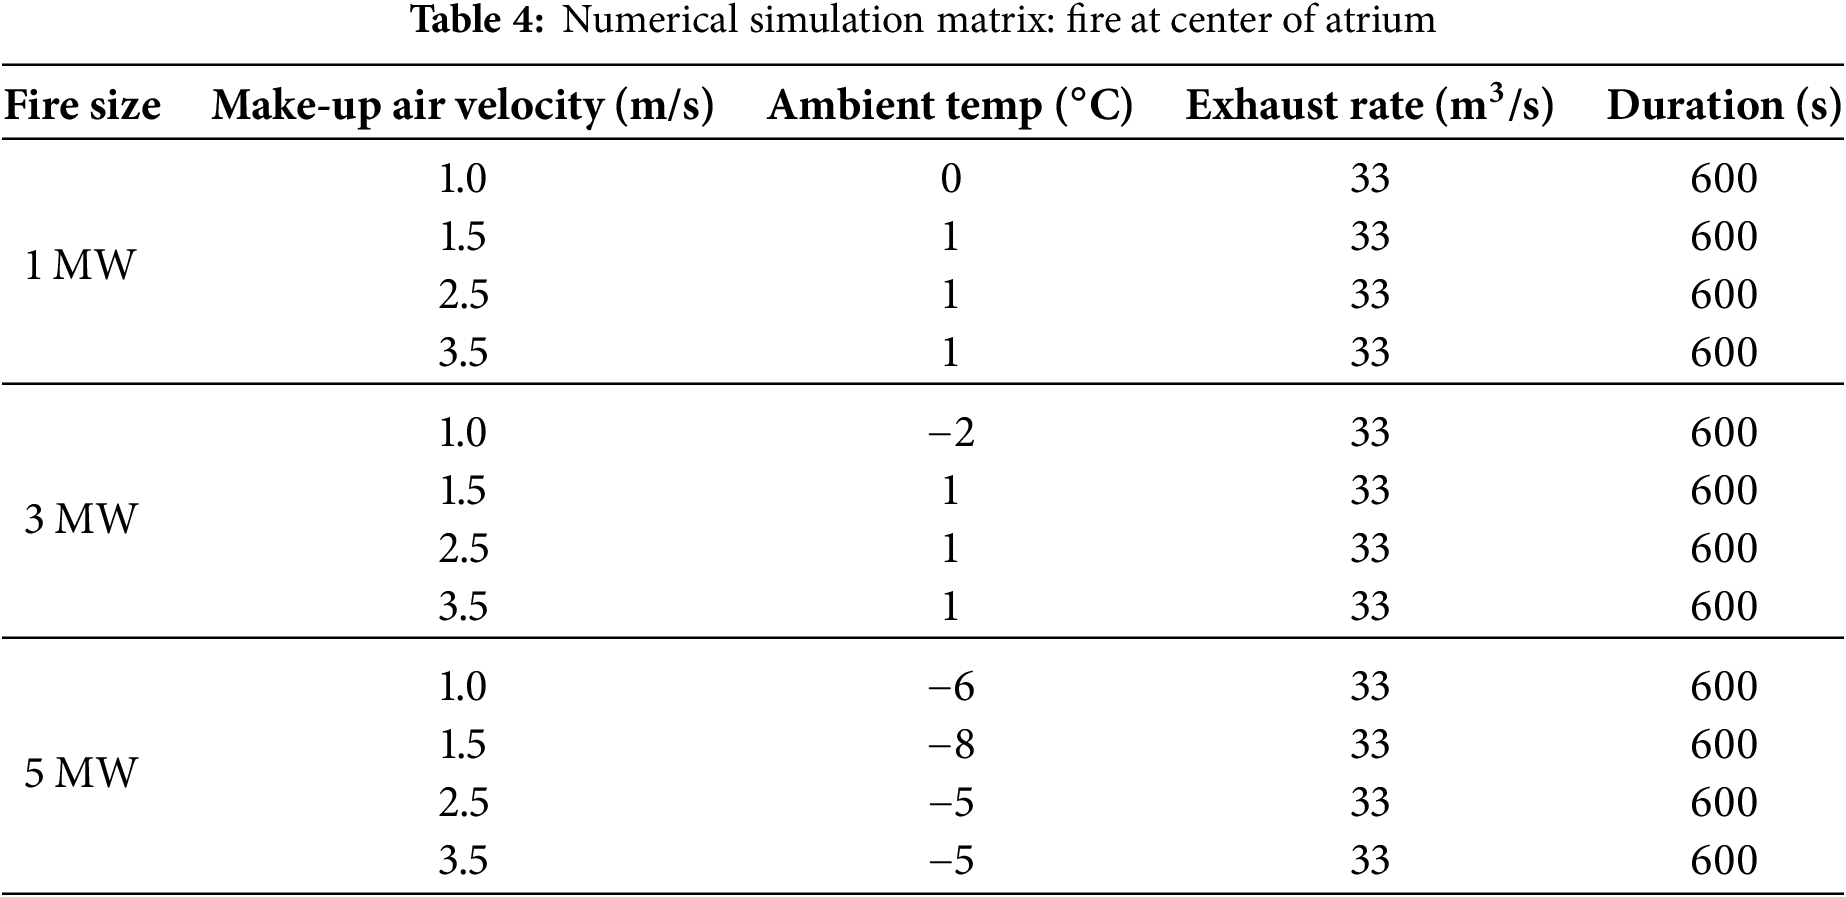
Twelve simulations were conducted for central fire conditions. Results showed a consistent increase in average temperature across thermocouple trees with rising make-up air velocity. T4, being closest to the fire, recorded the highest temperatures. Smoke layer clear height was inversely related to both fire size and air velocity. Later in the section of results and discussion, one may witness Figs. 10 to 12 that show that turbulence increases with higher air velocity, lowering the smoke clear height. Our results align with the previous experimental studies [13–16], but with the changing in Burner fuel type to Polystyrene and evaluating the different make-up air effect on different fire locations, i.e., center of the atrium, Northeast and Southwest of the atrium. The Numerical Simulation Design Matrix shown in Tables 3 and 5 delineates the configuration of 24 full-scale simulations intended to assess the influence of make-up air velocity on smoke dynamics within and the atrium during fire events. The simulations are categorised into two types according to the fire’s location: the atrium’s center and the corners (Northeast and Southwest). Three fire sizes were also evaluated, i.e., 1, 3, and 5 MW—corresponding to small, medium, and large-scale fire intensities. For each fire size at the central site, four distinct make-up air velocities were analysed: 1, 1.5, 2.5, and 3.5 m/s. The selected velocities span a spectrum from low to high air entrainment, facilitating the examination of their effects on thermal stratification and smoke layer elevation. These simulation settings and their validation were supported by past research [16], initiated at the Carleton University fire lab–atrium. The original experiments were conducted under winter conditions, with the fire positioned at the center of the atrium. Various fire sizes and make-up air velocities were tested while maintaining consistent model geometry and exhaust flow rate. In alignment with this methodology, the numerical simulations in the present study replicated the same geometric configuration and ambient temperatures, enabling straightforward comparison between current and prior experimental and simulation results. As shown in Fig. 10 and supported by earlier 5 MW fire tests, the ambient temperatures for the center fire location were defined as:
•
•
•
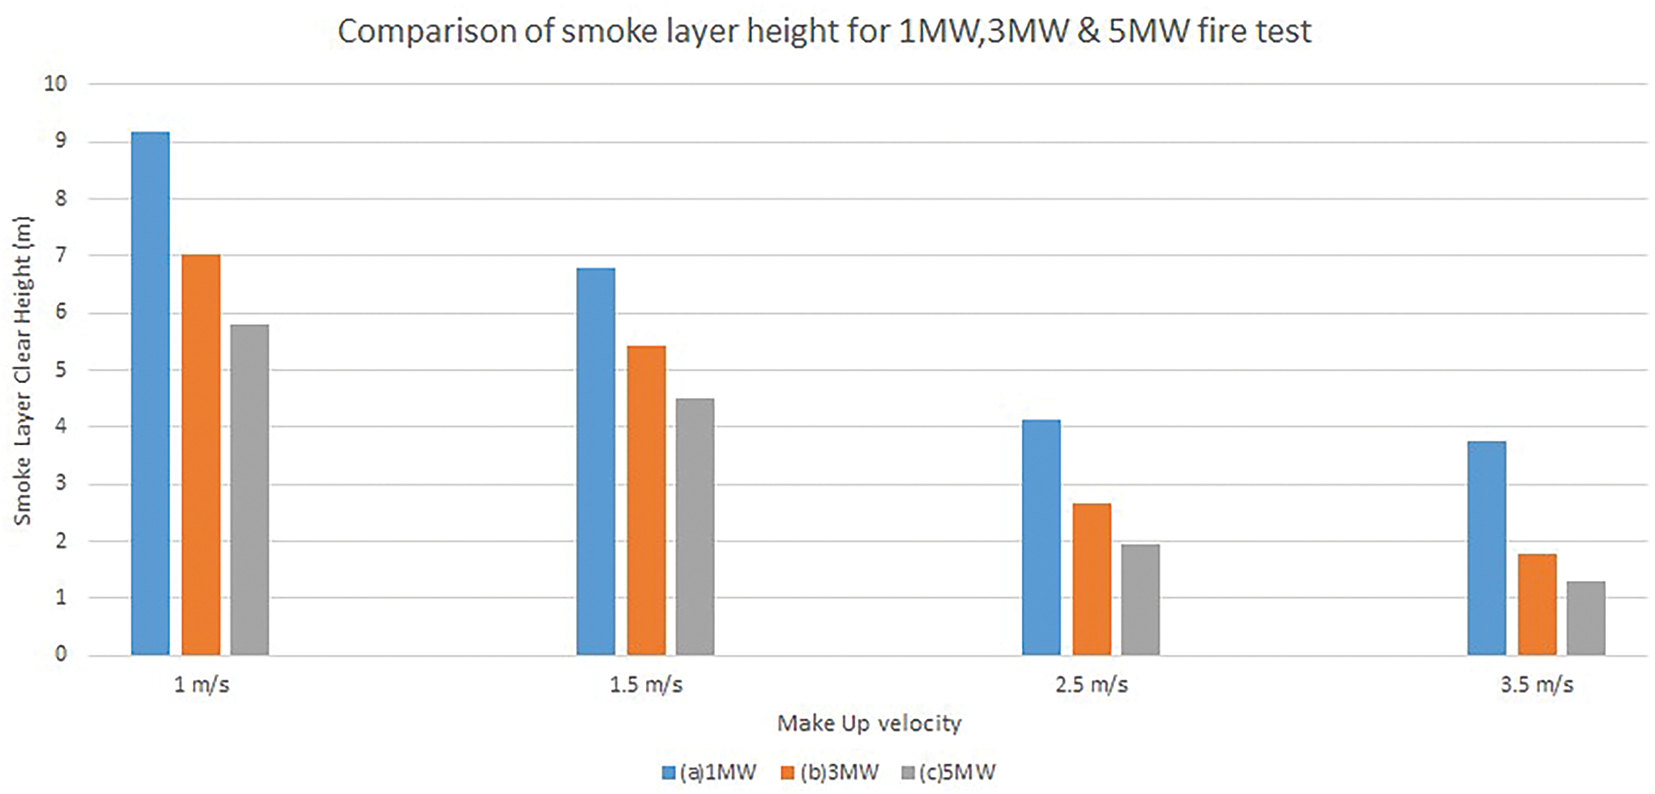
Figure 12: Smoke layer clear height distribution at thermocouple trees T1–T4 under different make-up air velocities for fire sizes of (a) 1 MW, (b) 3 MW, and (c) 5 MW. The figure highlights the inverse relationship between make-up air velocity and smoke layer clear height, with greater turbulence observed at higher velocities across all fire scenarios
Despite these variations in ambient temperature, the observed smoke layer clear heights remained relatively stable and consistent with the expected trend dictated by make-up air velocity. While ambient temperature can influence the buoyancy of the smoke layer to some extent, its overall effect was minor compared to the dominant influence of fire size and air velocity. In the 5 MW scenario, the colder ambient temperatures (−
At the corner locations, only two velocities (1 and 3.5 m/s) were evaluated for each fire size, facilitating a comparison between moderate and high air supply conditions. Each simulation lasted 600 s, maintaining a constant mechanical exhaust rate of 33
Furthermore, please note that the Fire Dynamics Simulator (FDS) was employed as the numerical engine for simulating fire-induced fluid motion, governed by the low-Mach number form of the Navier–Stokes equations. FDS solves the conservation equations for mass, momentum, energy, and species using a finite-difference approach on a structured Cartesian mesh. Spatial discretisation employs second-order central differencing, while time integration is performed using a second-order explicit Runge–Kutta scheme. Pressure-velocity coupling is handled via the fractional-step method by solving a pressure Poisson equation. Turbulence was modeled using the Deardorff subgrid-scale (SGS) model, and default radiation and combustion models within FDS were retained. The time step was adaptively adjusted based on the Courant–Friedrichs–Lewy (CFL) condition to ensure numerical stability. These methods follow established FDS practices as documented in [7,8,13].
Subsequently, twelve more simulations were conducted with the fire positioned in the northeast and southwest corners. Temperatures next to the fire source (notably T1 and T4) escalated with both velocity and fire dimensions. Fires in the southwest corner displayed elevated values owing to the vicinity of sensors. Figs. 10 to 12 illustrate that turbulence escalates with increased air velocity, resulting in a reduction of smoke clear height. Our findings are consistent with prior experimental investigations conducted by Rafinazari and Barbara [13–16], wherein polystyrene was the sole variable in the fuel composition. Moreover, Figs. 13 to 16 depict vertical temperature profiles. Notwithstanding locational disparities, thermal stratification mostly persisted, with minimal variance in upper-level air mixing detected between 1 and 3.5 m/s. Southwest fires exhibited marginally elevated thermal profiles at increased air velocities, aligning with Barbara’s findings [16]. The simulation findings unequivocally demonstrate that centrally situated flames produce greater smoke volume and reduced interface heights compared to corner fires, highlighting the influence of fire position and air velocity on smoke dynamics in atrium environments.
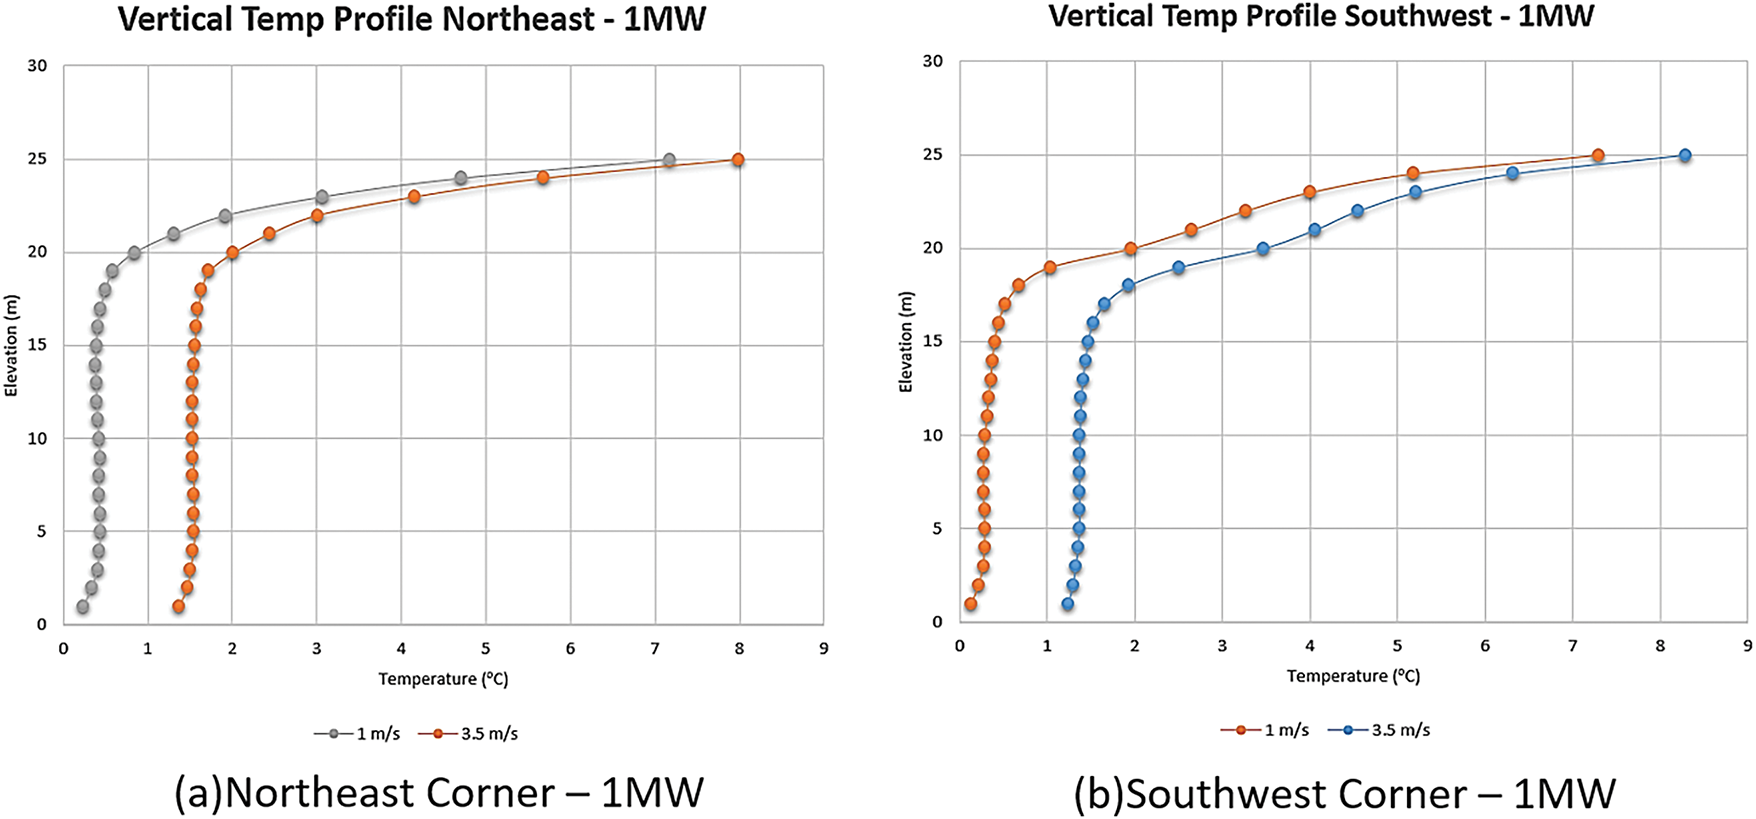
Figure 13: Vertical temperature profiles for 1 MW fire scenarios at (a) northeast and (b) southwest corners of the atrium under make-up air velocities of 1 and 3.5 m/s. The figures show clear thermal stratification and highlight the influence of air velocity and fire position on vertical temperature distribution
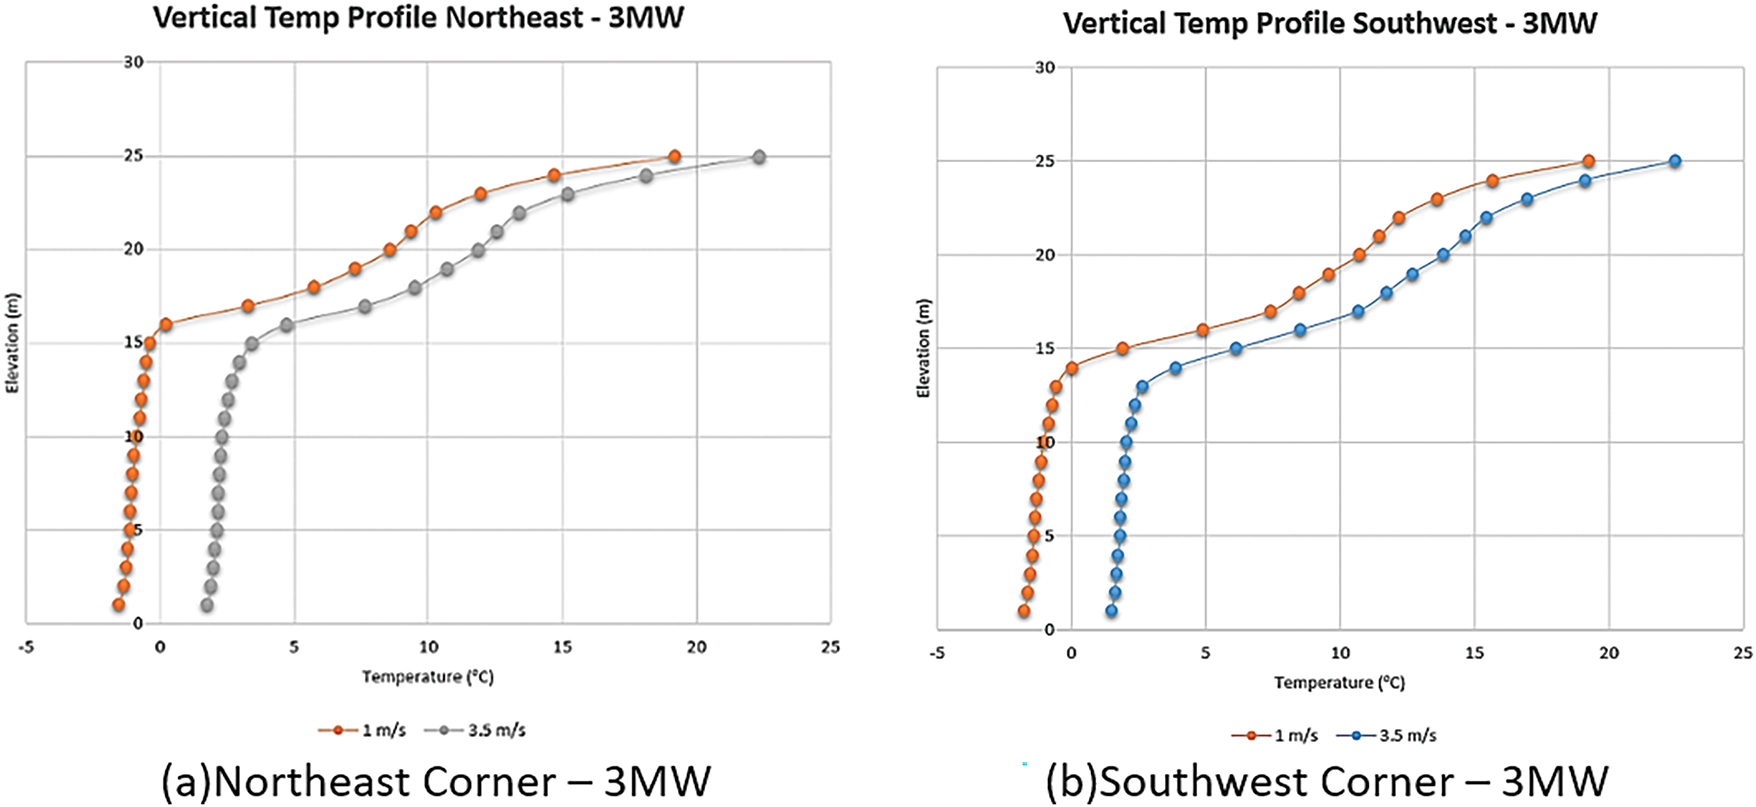
Figure 14: Vertical temperature profiles for 3 MW fire scenarios located at (a) the northeast and (b) the southwest corners of the atrium under make-up air velocities of 1 and 3.5 m/s. The plots illustrate the thermal stratification within the atrium and demonstrate that higher make-up air velocity leads to increased temperatures at higher elevations, while the lower layers remain relatively cooler due to limited air mixing
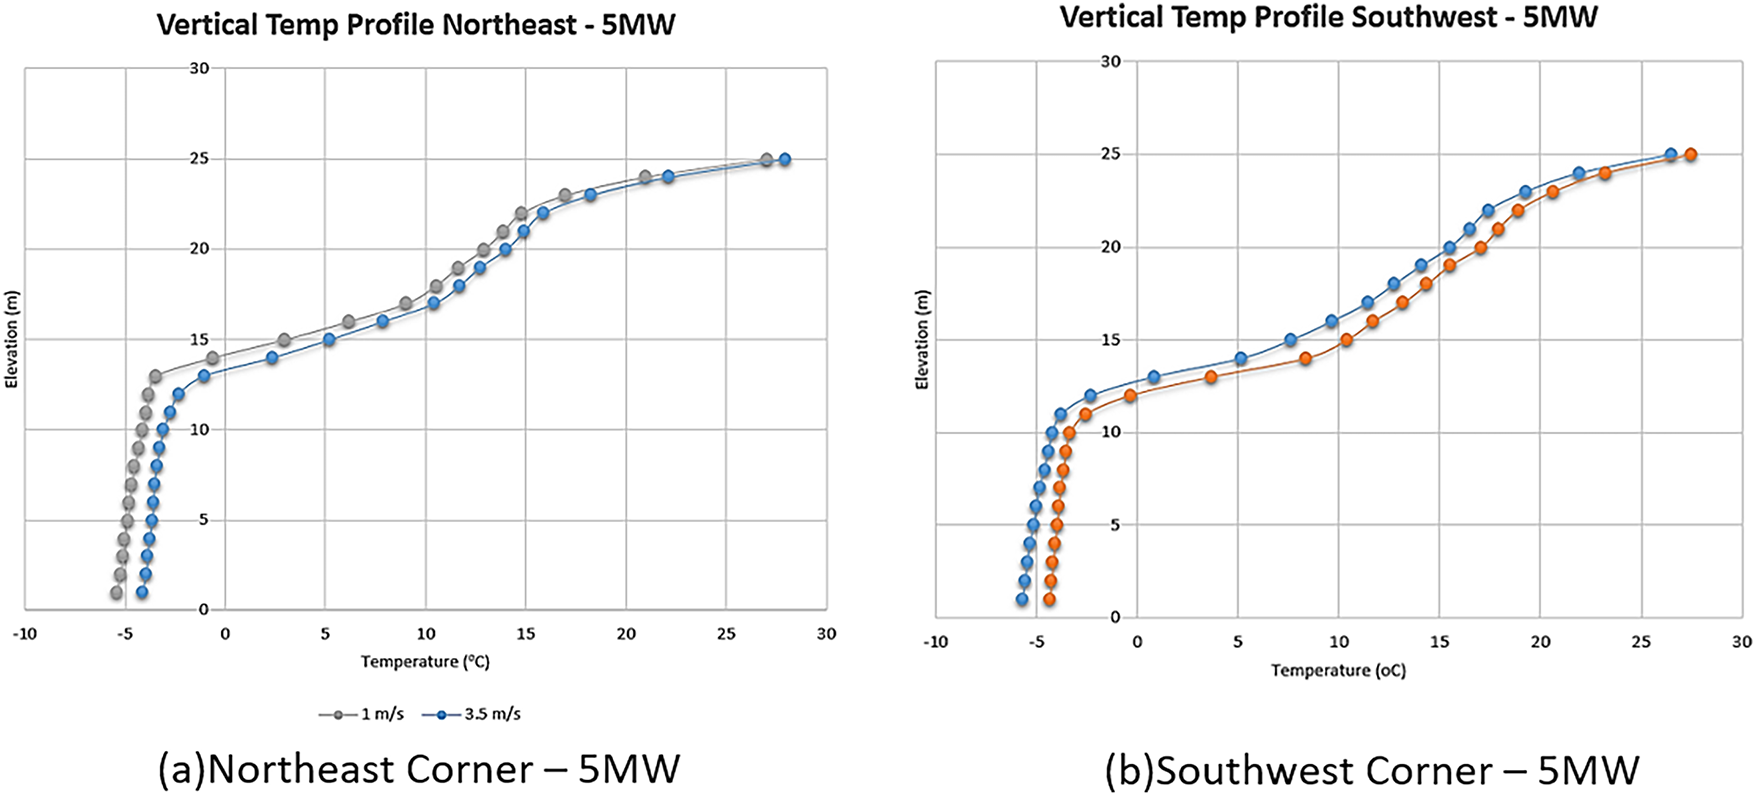
Figure 15: Vertical temperature profiles for 5 MW fire scenarios at (a) the northeast and (b) the southwest corners of the atrium under make-up air velocities of 1 and 3.5 m/s. The results indicate strong thermal stratification, with temperatures increasing significantly at higher elevations. Slight differences between the 1 and 3.5 m/s profiles are observed, especially in the lower region, suggesting limited air mixing
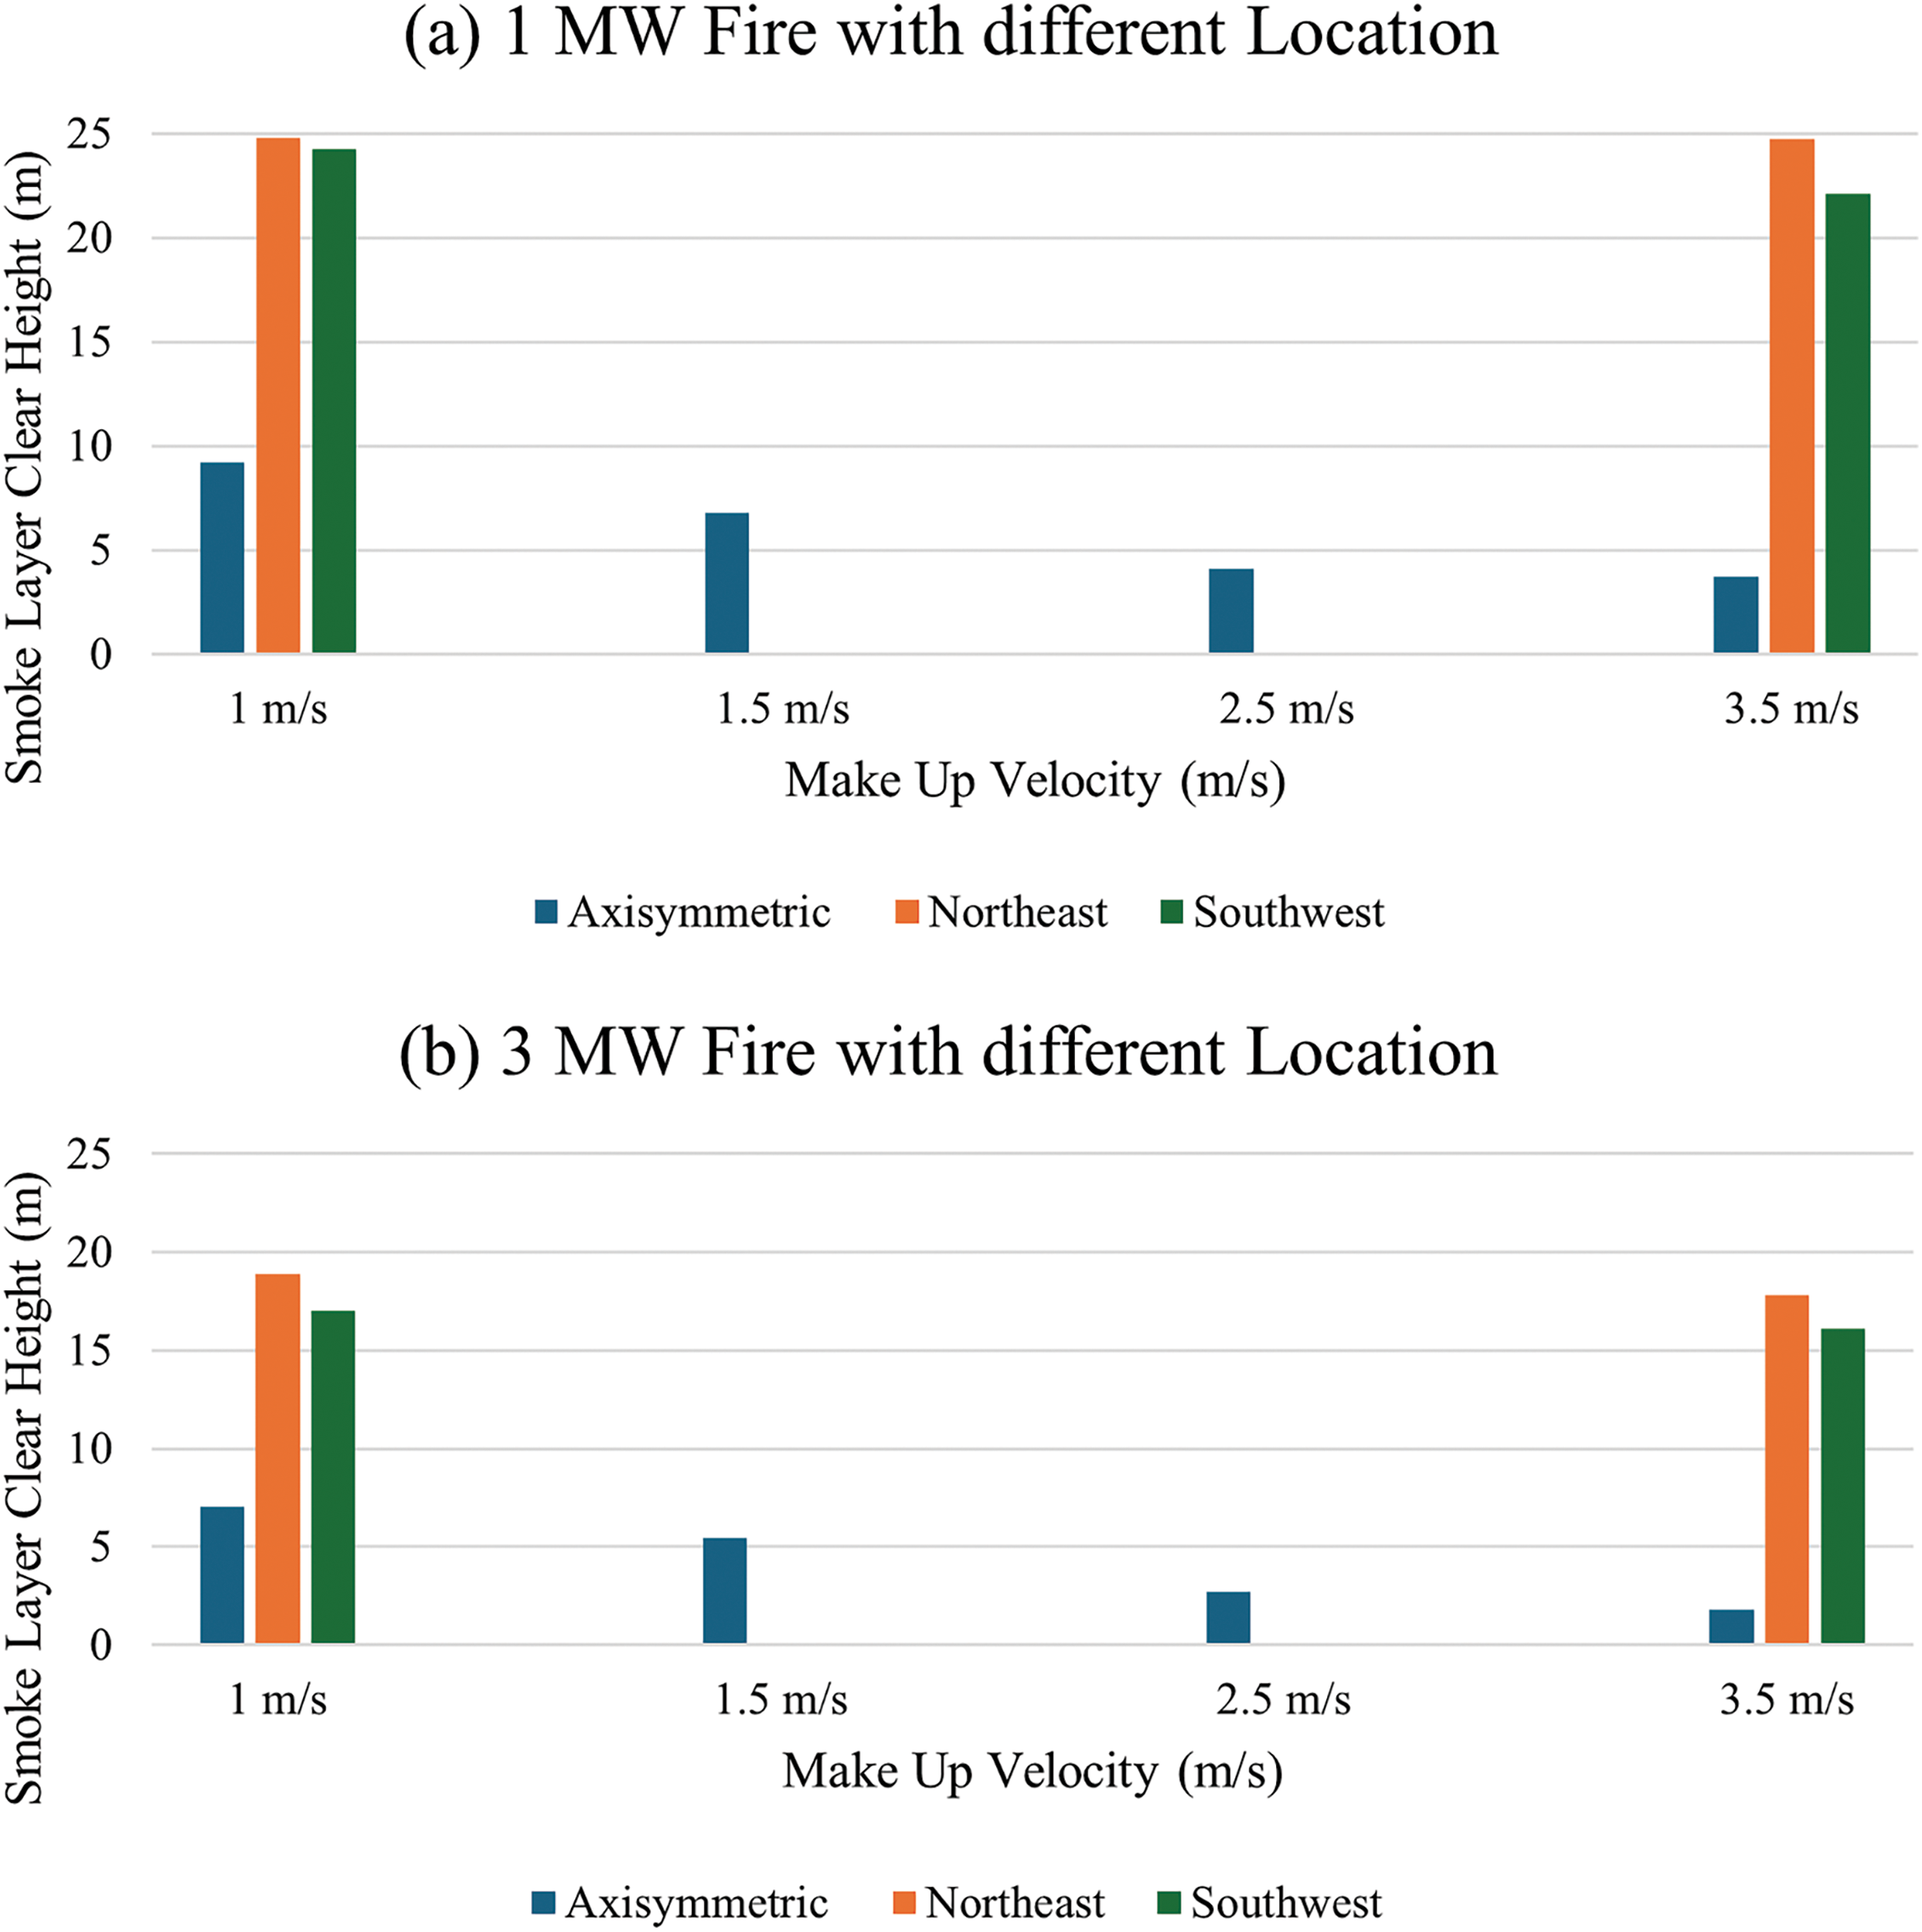
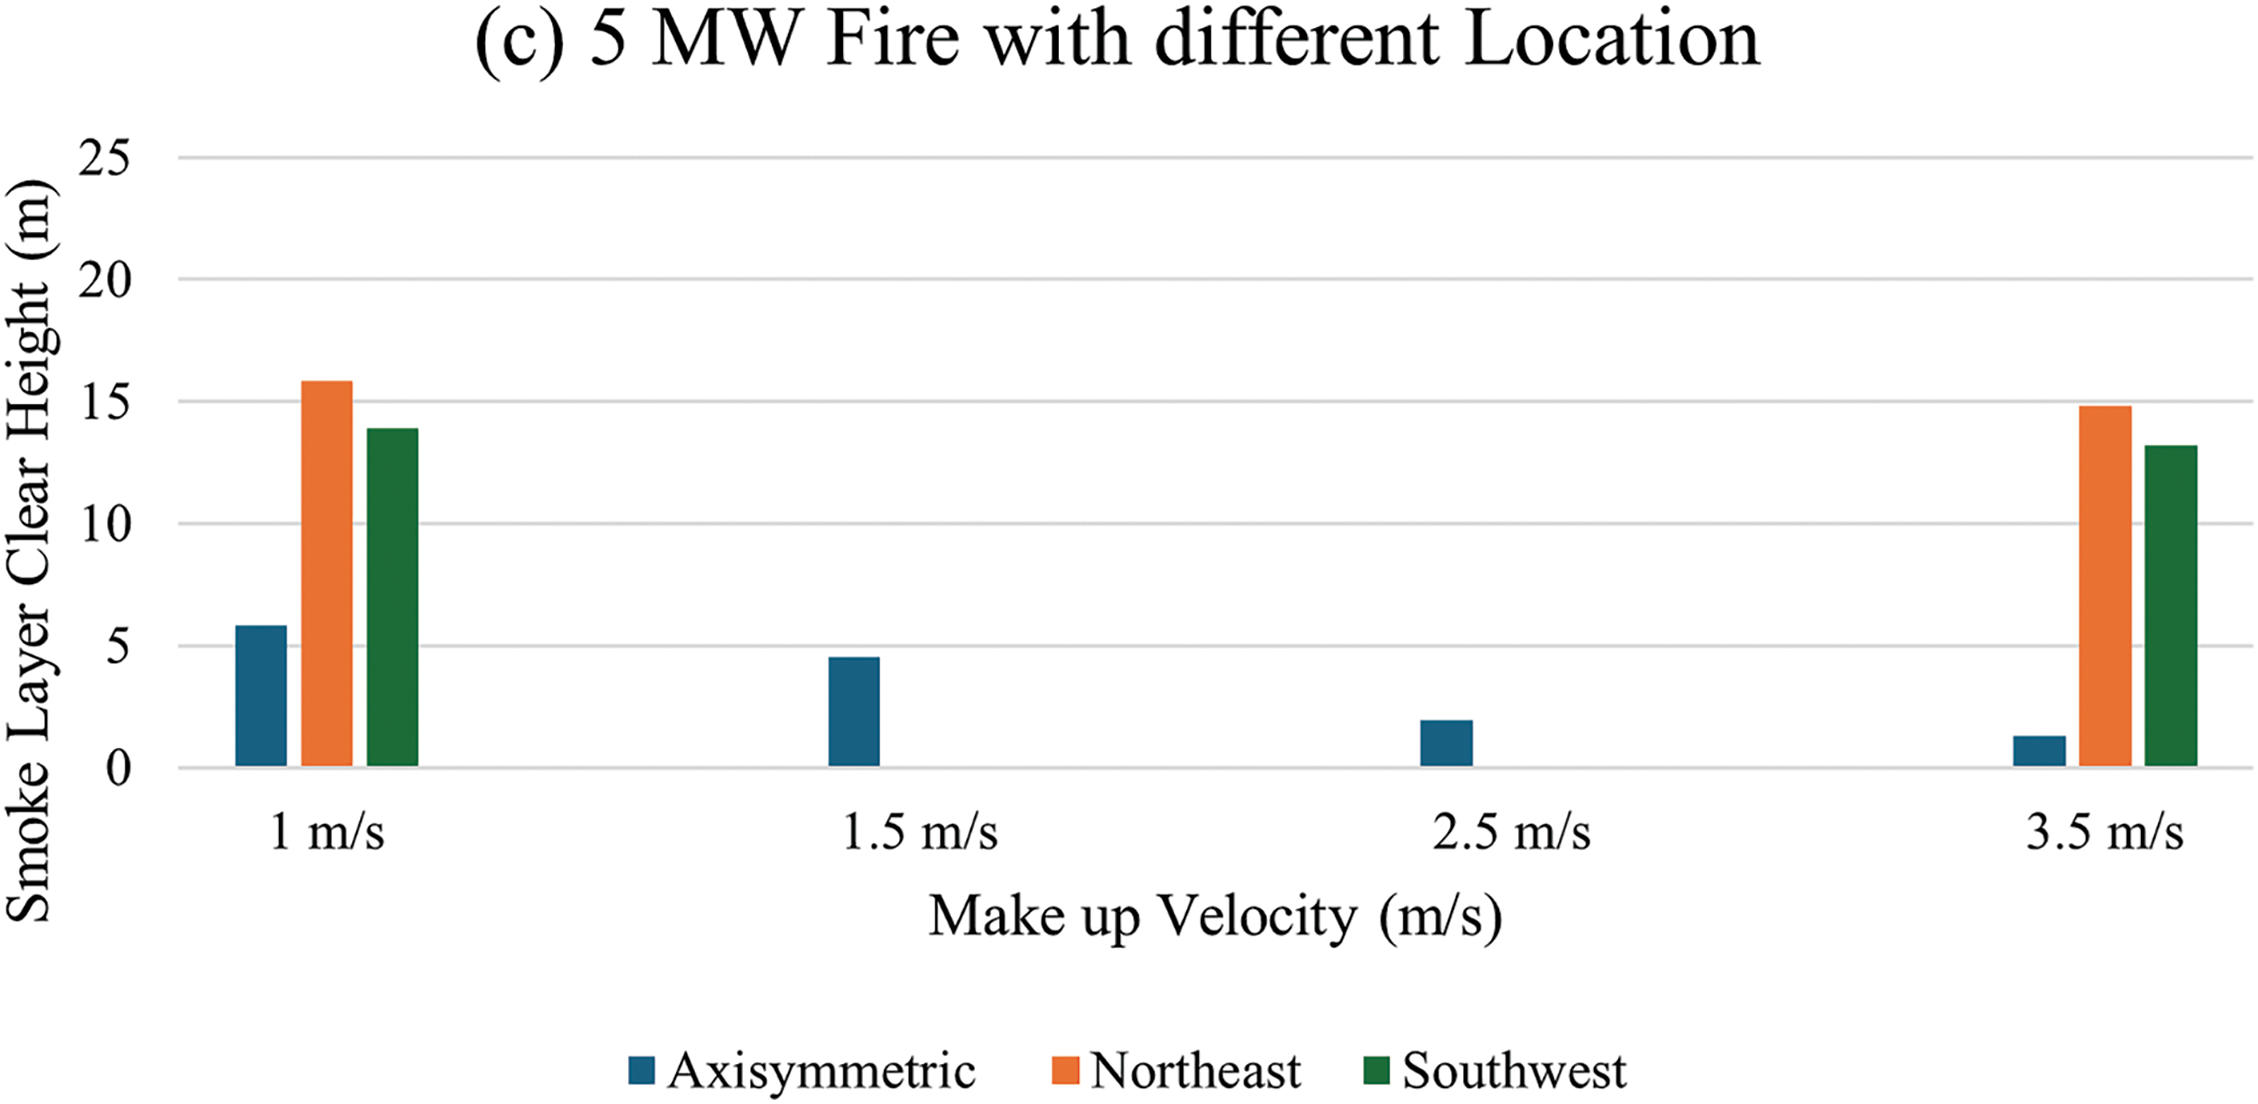
Figure 16: Vertical temperature profiles for 5 MW fire scenarios at (a) the northeast and (b) the southwest corners of the atrium under make-up air velocities of 1 and 3.5 m/s. The results indicate strong thermal stratification, with temperatures increasing significantly at higher elevations. Slight differences between the 1 and 3.5 m/s profiles are observed, especially in the lower region, suggesting limited air mixing
The results from the 12 simulations conducted for the central fire location reveal a consistent trend: an increase in make-up air velocity leads to a noticeable reduction in the average smoke layer clear height across all thermocouple positions and for all tested fire sizes. Furthermore, it is evident that larger fire sizes result in lower smoke layer clear heights, indicating a direct relationship between heat release rate and smoke layer descent. As illustrated in Fig. 11a, for a 1 MW fire scenario, the introduction of higher make-up air velocities causes increased turbulence within the atrium. This turbulence is primarily due to the directional flow of make-up air toward the fire, which intensifies mixing and entrainment, ultimately reducing the height of the smoke layer. Fig. 11b,c further confirms that as fire intensity increases from 3 to 5 MW, the smoke layer height continues to decline, reinforcing the compounded effect of both higher fire size and make-up air velocity on smoke stratification behaviour.
Fig. 11 illustrates the distribution of smoke layer clear heights recorded at four thermocouple trees (T1–T4) for three distinct fire sizes: 1, 3, and 5 MW, across changing make-up air velocities (1, 1.5, 2.5, and 3.5 m/s). Subfigures (a), (b), and (c) represent fire sizes of 1, 3, and 5 MW, respectively. The findings consistently indicate that an increase in make-up air velocity correlates with a decrease in smoke layer clear height at all thermocouple locations. This phenomenon is ascribed to the heightened turbulence and air entrainment resulting from elevated make-up air velocities, which disturb stratification and facilitate the downward mixing of smoke. In the 1 MW fire scenario, the smoke layer clear height remains comparatively elevated, but influenced by the growing velocity. In the 3 and 5 MW scenarios, the smoke layer clear height decreases markedly, especially at velocities over 2.5 m/s. Among the thermocouple trees, T4 often registers the lowest smoke layer clear height, indicating that its proximity to the fire source or air inlets may affect the thermal and flow dynamics in that area. The image underscores the significant influence of make-up air velocity on smoke stratification and the necessity of regulating airflow rates in atrium fire safety design.
Fig. 12 illustrates the clear height of the smoke layer for three distinct fire sizes—1, 3, and 5 MW—across a range of make-up air velocities from 1 to 3.5 m/s. The data unequivocally indicates that an increase in make-up air velocity correlates with a consistent reduction in the clear height of the smoke layer across all fire sizes. This suggests that increased velocities generate greater turbulence and air entrainment, resulting in a more rapid descent of the smoke layer. Of the three situations, the 1 MW fire exhibits the lowest smoke layer elevation at all velocities, whereas the 5 MW fire results in the highest smoke layer due to its increased thermal output and soot generation. The trend indicates that both elevated make-up air velocity and intensified fire conditions adversely affect smoke stratification in the atrium, diminishing the time available for safe escape.
The fire source was positioned at two new locations: the northeast and southwest corners. The burner area and thermal properties remained consistent with those used for the central fire scenario. The three fire sizes considered (1, 3, and 5 MW) were examined under two different make-up air velocities: 1 and 3.5 m/s. In addition to this, Table 3 presents the recorded temperature values for all thermocouple trees (T1–T4) across both fire locations and under both air velocities. As observed in Table 3, thermocouple T1 consistently recorded the highest temperature values for the northeast corner fire location. This is attributed to its proximity to the fire source. A clear trend is visible where temperature rises with increasing fire size and make-up air velocity. For the southwest corner location, thermocouple T4—being closest to the fire—exhibited the highest temperature values. Fig. 13a,b presents the vertical temperature profiles for both corner locations. The data shows that lower-level thermocouples register a rapid increase in temperature, while upper levels remain cooler, indicating minimal air mixing in the lower strata of the atrium. The profiles show a sharp rise in temperature approaching the hot smoke layer. Furthermore, Figs. 14a,b and 15a,b reinforce that the temperature differences between 1 and 3.5 m/s velocities were not substantial across the corner scenarios. However, southwest corner fires tend to generate slightly higher temperatures, particularly at higher fire intensities, which aligns with findings from Barbara [16]. The results emphasize that corner fire locations induce more stable stratification, while still being influenced by fire size and velocity.
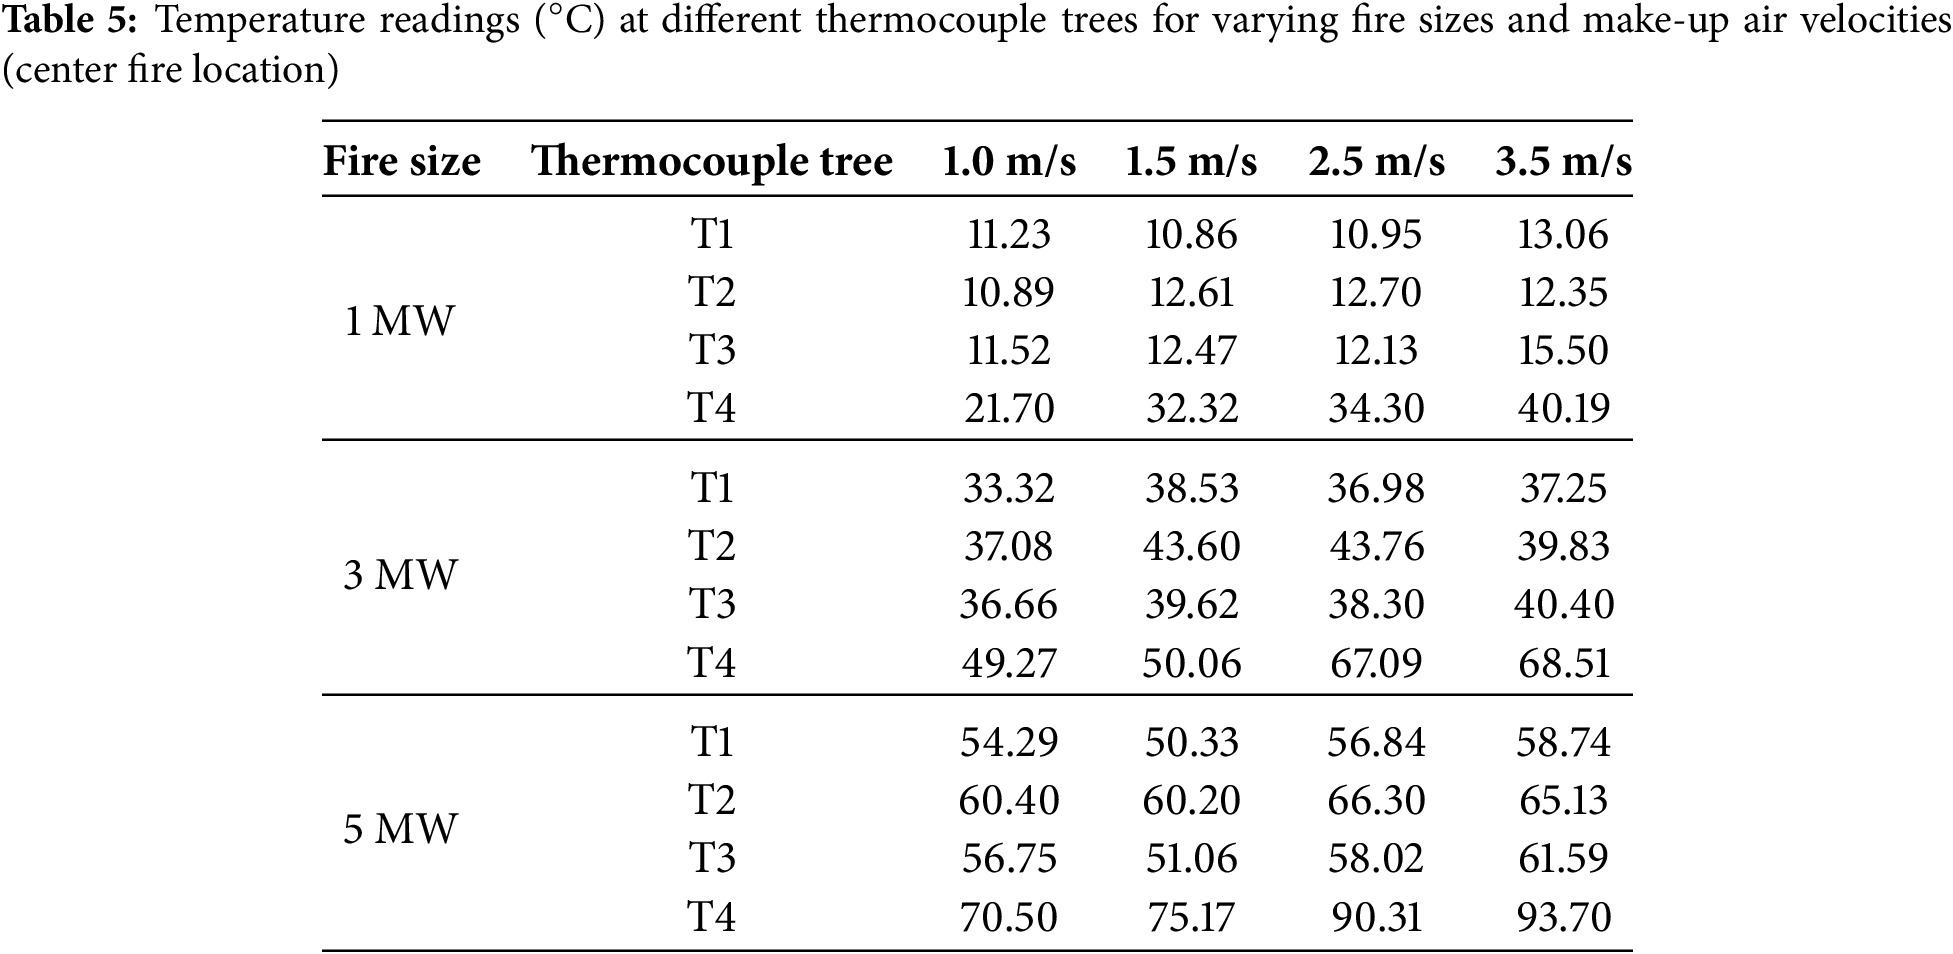
Table 4 presents the average temperature readings recorded at four thermocouple trees (T1–T4) for three different fire sizes (1, 3, and 5 MW) under varying make-up air velocities (1.0 to 3.5 m/s) with the fire source located at the center of the atrium. The results show a consistent increase in temperature, particularly at T4, which is closest to the fire source, as both make-up air velocity and fire size increase. This trend highlights the influence of intensified air entrainment and heat release rate on local thermal conditions within the atrium, with higher velocities contributing to elevated turbulence and enhanced mixing of hot gases.
Fig. 13 illustrates the vertical temperature profiles for a 1 MW fire situated at the northeast (right) and southwest (left) corners of the atrium, under two distinct make-up air velocities: 1 and 3.5 m/s. In all instances, the temperature markedly rises with altitude, especially as it nears the heated smoke layer. The temperature is low at lower heights, signifying restricted air mixing in the lowest section of the atrium. In the northeast fire scenario, the 3.5 m/s profile exhibits marginally elevated temperatures at higher elevations relative to the 1 m/s profile, however both profiles converge near the apex. In the southwest corner, temperatures at 3.5 m/s are consistently elevated across the profile, indicating enhanced heat transport and possibly increased thermal loading in that region. Overall, although both locations display stratification, the southwest corner tends to demonstrate somewhat raised temperatures at increased air velocity.
As shown in Fig. 14a,b, the heat from the fire causes the temperatures to rise at the lower level, but at higher levels, they stay low, indicating that there is little air mixing in the atrium at the lower layer. The temperatures rise quickly as the height gets closer to the hot layer and keep rising till the last thermocouple. The graphic also shows that the temperature profiles of the Southwest and Northeast fires, as well as the velocities of 3.5 and 1 m/s, do not differ much.
Fig. 15a,b shows the same output like the previous fire results. Comparing the results with [13–16] which demonstrated that for this fire size, the profiles are more affected by the increased velocity when the fire is situated in the southwest corner. It illustrates the vertical temperature profiles for a 5 MW fire situated at the northeast (a) and southwest (b) corners of the atrium, examined under two make-up air velocities: 1 and 3.5 m/s. In both subfigures, the temperature rises consistently with altitude, signifying the establishment of a distinct hot smoke layer towards the apex of the atrium. At lower elevations (0–15 m), temperatures remain comparatively low for both velocities, indicating restricted air mixing in the lower stratum. The distinction between air velocities of 1 and 3.5 m/s is nuanced yet perceptible, with somewhat elevated temperatures at higher altitudes for 3.5 m/s, especially in the southwestern context. This indicates that elevated make-up air velocity enhances heat entrainment, influencing the thermal rise rate and gradient. The southwest corner has a marginally steeper temperature gradient than the northeast, probably attributable to the nearness of thermocouples to the fire source or changes in airflow patterns. The graphic demonstrates the impact of fire location and air velocity on the vertical heat distribution within the atrium during high-intensity fire circumstances.
Fig. 16 illustrates a comparative investigation of smoke layer clearance height at several fire sites (Axisymmetric Center, Northeast, and Southwest) for three fire intensities: 1 MW (a), 3 MW (b), and 5 MW (c), across a range of make-up air velocities (1 to 3.5 m/s). The findings indicate that flames situated at the centre (axisymmetric) consistently produce lower smoke layer heights than corner fires, particularly with increasing make-up air velocity. In contrast, corner fires (Northeast and Southwest) have markedly elevated smoke layer clear heights, indicating more stability in stratification and reduced interference from compensatory airflow. The pattern becomes more evident as fire intensity increases (from 1 to 5 MW), when axisymmetric flames with elevated make-up velocities have the lowest interface heights due to heightened plume disruption and turbulence.
The results of this study confirm that, in all studied configurations, a considerable decrease in the smoke layer clear height is a result of both greater fire volumes and higher make-up air velocity. The fire source’s location emerged as a pivotal factor affecting smoke dynamics among the analysed scenarios. Fires situated in the atrium’s centre produced increased turbulence and soot deposition, leading to diminished smoke layer elevations. Conversely, fires located in the northeast and southwest corners demonstrated more stable flow conditions and sustained higher smoke stratification owing to diminished airflow interruption. This investigation exploited polystyrene, a prevalent combustible material in ordinary atrium surroundings, unlike prior studies that utilised propane as a fuel source. In contrast to pressurised propane, polystyrene more accurately simulates realistic fire loads, enhancing the comprehension of smoke dynamics in atria. The results corroborate established rules in handbooks and international fire safety codes, which warn that make-up air velocities over 1 m/s may disrupt the smoke layer, diminish visibility, and impede safe evacuation. This supports the proposal to limit make-up air velocity to 1 m/s to maintain stratification and minimise soot dispersion. Soot distribution varied markedly with fire position; central fires demonstrated greater turbulence and heavier soot layers, whereas corner fires experienced more laminar flow patterns. These inconsistencies are mostly due to discrepancies in plume dynamics and combustion properties linked to the fuel type and geometry.
5 Future Recommendations and Directions
Future studies should investigate the impact of fire sizes exceeding 5 MW, atrium heights over 25 m, and fluctuating exhaust fan flow rates. Further considerations, including burner area, fuel type, placement of make-up air apertures, and positioning of exhaust vents, must be examined to assess the implications of plug-holing and enhance design methodologies. These findings will enhance the formulation of resilient and performance-oriented smoke management strategies, in accordance with UN SDGs 9 and 11, fostering safer and more sustainable urban infrastructure.
Acknowledgement: The authors would like to thank the Mechanical Engineering Department of Misr University for Science and Technology, Egypt and Cairo University, Egypt for supporting this project and providing state of the art facilities. In addition to this, authors are willing to thank Universiti Teknologi PETRONAS, Malaysia and King Fahd University of Petroleum and Minerals, Saudi Arabia for providing technical mentorship.
Funding Statement: The authors received no specific funding for this study.
Author Contributions: The authors confirm contribution to the paper as follows: Conceptualization, Mohamed Gamal, Hamdy Ashour and Omar Huzayyin; methodology, Mohamed Gamal, Hamdy Ashour, Omar Huzayyin, Maran Marimuthu and Ghulam E Mustafa Abro; software, Mohamed Gamal and Hamdy Ashour; validation, Hamdy Ashour, Omar Huzzayyin and Lina Mohamed and Ghulam E Mustafa Abro; formal analysis, Maran Marimuthu, Mohamed Gamal and Lina Mohamed; investigation, Mohamed Gamal, Hamdy Ashour, Omar Huzayyin, Lina Mohamed and Ghulam E Mustafa Abro; resources, Maran Marimuthu, Lina Mohamed and Hamdy Ashour; data curation, Mohamed Gamal; writing—original draft preparation, Mohamed Gamal; writing—review and editing, Mohamed Gamal, Hamdy Ashour, Ghulam E Mustafa Abro and Maran Marimuthu; visualization, Omar Huzayyin and Lina Mohamed; supervision, Hamdy Ashour, Omar Huzayyin, Maran Marimuthu and Ghulam E Mustafa Abro; project administration, Lina Mohamed, Hamdy Ashour and Omar Huzayyin; funding acquisition, Maran Marimuthu and Ghulam E Mustafa Abro. All authors reviewed the results and approved the final version of the manuscript.
Availability of Data and Materials: Data available on request from the authors.
Ethics Approval: Not applicable.
Conflicts of Interest: The authors declare no conflicts of interest to report regarding the present study.
References
1. Rafinazari A, Hadjisophocleous G. An investigation of the effect of make-up air velocity on smoke layer height with asymmetric openings and rotational air flow in atrium fires. J Build Eng. 2020;27(4):100933. doi:10.1016/j.jobe.2019.100933. [Google Scholar] [CrossRef]
2. Ayala P, Rein G, Vigne G, Gutiérrez-Montes C. Fire experiments and simulations in a full-scale atrium under transient and asymmetric venting conditions. Fire Technol. 2016;52(1):51–78. doi:10.1007/s10694-015-0487-9. [Google Scholar] [CrossRef]
3. Ayala P, Rein G, Gutiérrez-Montes C. Factors affecting the make-up air and their influence on the dynamics of atrium fires. Fire Technol. 2018;54(4):1067–91. doi:10.1007/s10694-018-0725-z. [Google Scholar] [CrossRef]
4. Vigne G, Ayala P, Rein G, Gutiérrez-Montes C. Experimental and computational study of smoke dynamics from multiple fire sources inside a large-volume building. Build Simul. 2021;14(4):1147–61. doi:10.1007/s12273-020-0715-1. [Google Scholar] [CrossRef]
5. Liu Q, Xiao J, Cai B, Guo X, Wang H, Chen J, et al. Numerical simulation on the effect of fire shutter descending height on smoke extraction efficiency in a large atrium. Fire. 2022;5(4):101. doi:10.3390/fire5040101. [Google Scholar] [CrossRef]
6. Li SC, Chen Y, Xu C, Gao G. Engineering numerical simulation on the amount of make-up air for mechanical smoke exhaust in atrium. Procedia Eng. 2011;11(1):379–84. doi:10.1016/j.proeng.2011.04.672. [Google Scholar] [CrossRef]
7. Alianto B, Rahim GP, Santoso MA, Nasruddin N, Nugroho YS. Experiment and modeling of smoke ventilation in a compartment using coconut husks as solid fuels. Int J Technol. 2025;16(2):411–22. [Google Scholar]
8. National Fire Protection Association (NFPA). NFPA-92, standard for smoke control systems. Quincy, MA, USA: NFPA; 2024. [Google Scholar]
9. Whulanza Y, Kusrini E, Dewi OC, Gamal A, Susanto D, Kurniawan KR. Reimagining the built environment: a paradigm shift towards sustainable urban development. Int J Technol. 2025;16(2):370–7. [Google Scholar]
10. Doheim RM, Hussein AN, Youssef Y. The impact of atrium shape on natural smoke ventilation. Fire Saf J. 2014;63:9–16. doi:10.1016/j.firesaf.2013.11.005. [Google Scholar] [CrossRef]
11. Ayala P, Gutiérrez-Montes C, Rein G. Influence of atrium roof geometries on the numerical predictions of fire tests under natural ventilation conditions. Energy Build. 2013;65:382–90. doi:10.1016/j.enbuild.2013.06.010. [Google Scholar] [CrossRef]
12. Klote JH, Milke JA, Gann JP, Hadjisophocleous AK, Ferreira MJ. Smoke control engineering handbook. Peachtree Corners, GA, USA: ASHRAE; 2012. [Google Scholar]
13. Rafinazari A, Hadjisophocleous G. A study of the effect of make-up air velocity on the smoke layer height with symmetric openings in atrium fires. Fire Technol. 2017;54(1):229–53. doi:10.1007/s10694-017-0682-y. [Google Scholar] [CrossRef]
14. Pongratz C, Milke JA, Trouve A. A CFD study to identify methods to increase maximum velocity of makeup air for atrium smoke control. ASHRAE Trans. 2016;122(2):10–20. [Google Scholar]
15. Qin TX, Guo YC, Chan CK, Lin WY. Numerical simulation of the spread of smoke in an atrium under fire scenario. Build Environ. 2009;44(1):56–65. doi:10.1016/j.buildenv.2008.01.014. [Google Scholar] [CrossRef]
16. Boakyewah B. A numerical study of the impact of make-up air velocity on the smoke conditions in an atrium [M.S. thesis]. Ottawa, ON, Canada: Carleton University; 2022. [Google Scholar]
17. Lei W, Zhang Z, Li Y, Zheng Z, Tai C, Zhang L. Experimental study on the effect of makeup air inlets height on the fire combustion and smoke diffusion. Case Stud Therm Eng. 2024;61:104951. [Google Scholar]
18. Lei W, Qi Y, Li A, Mei S. Effects of makeup air on atrium smoke conditions: a review. Indoor Built Environ. 2023;32(1):66–84. doi:10.1177/1420326x211059132. [Google Scholar] [CrossRef]
19. Abotaleb HA. Numerical study on smoke exhaust system in a mall with mechanical make-up techniques. Alex Eng J. 2018;57(4):2961–74. doi:10.1016/j.aej.2018.03.001. [Google Scholar] [CrossRef]
20. Lei W, Zhang Z, Zheng Z, Tai C, Zhang L, Zhao S. Scaled experiment and numerical study on the effect of a novel makeup air system on smoke control in atrium fires. J Build Eng. 2024;95(6):110237. doi:10.1016/j.jobe.2024.110237. [Google Scholar] [CrossRef]
21. Sharma A, Mishra KB. Performance assessment of stairwell smoke prevention techniques in a model high-rise building. Therm Sci Eng Prog. 2024;53(1):102725. doi:10.1016/j.tsep.2024.102725. [Google Scholar] [CrossRef]
22. Gutiérrez-Montes C, Sanmiguel-Rojas E, Burgos MA, Viedma A. On the fluid dynamics of the make-up inlet air and the prediction of anomalous fire dynamics in a large-scale facility. Fire Saf J. 2012;51(6):27–41. doi:10.1016/j.firesaf.2012.02.007. [Google Scholar] [CrossRef]
23. Yi L, Chow WK, Li YZ, Huo R. A simple two-layer zone model on mechanical exhaust in an atrium. Build Environ. 2005;40(7):869–80. doi:10.1016/j.buildenv.2004.08.018. [Google Scholar] [CrossRef]
24. Zhou J, Hadjisophocleous G. Parameters affecting fire plumes. Build Eng. 2008;114:140–6. [Google Scholar]
25. Lei W, Zheng Z, Rong C, Tai C, Zhao S, Li A. Study on fire smoke control in evacuation passageways on the top floor of an atrium involving breathing zones combined with underfloor makeup air supplementation. Saf Sci. 2022;153(4):105807. doi:10.1016/j.ssci.2022.105807. [Google Scholar] [CrossRef]
26. Zhang Y, Geng P. Artificial intelligence based smoke flow mechanism analysis and prediction patterns of fire for large space building. Alex Eng J. 2024;100(1):322–30. doi:10.1016/j.aej.2024.05.061. [Google Scholar] [CrossRef]
27. Beyler C. Fire hazard calculations for large, open hydrocarbon fires. In: SFPE handbook of fire protection engineering. 4th ed. Quincy, MA, USA: National Fire Protection Association; 2008. p. 3–10. doi:10.1007/978-1-4939-2565-0_66. [Google Scholar] [CrossRef]
28. Brzezińska D, Brzezińska M. A new approach to smoke control systems in complex atria. Build Serv Eng Res Technol. 2024;45(3):337–51. [Google Scholar]
29. Gwynne SM, Boyce KE. Engineering data. In: SFPE handbook of fire protection engineering. New York, NY, USA: Springer; 2016. p. 2429–551. [Google Scholar]
30. Roh JS, Ryou HS, Park WH, Jang YJ. CFD simulation and assessment of life safety in a subway train fire. Tunn Undergr Space Technol. 2009;24(4):447–53. doi:10.1016/j.tust.2008.12.003. [Google Scholar] [CrossRef]
Cite This Article
 Copyright © 2025 The Author(s). Published by Tech Science Press.
This work is licensed under a Creative Commons Attribution 4.0 International License , which permits unrestricted use, distribution, and reproduction in any medium, provided the original work is properly cited.
 Downloads
 Citation Tools