
 Submit a Paper
 Propose a Special lssue
 Open Access
ARTICLE

Biomimetic Flow Field Inspired by Sunflower Phyllotaxis: Design and Performance Optimization for Solid Oxide Fuel Cells
1 Shanghai Baolong Automotive Corporation, Shanghai, 201619, China
2 College of Mechanical and Electrical Engineering, Qingdao University, Qingdao, 266071, China
3 National Engineering Research Center for Intelligent Electrical Vehicle Power System, Qingdao, 266071, China
* Corresponding Author: Qinghai Zhao. Email:
(This article belongs to the Special Issue: Fluid Mechanics & Thermodynamics in Renewable Energy and HVAC Systems)
Fluid Dynamics & Materials Processing 2025, 21(9), 2177-2199. https://doi.org/10.32604/fdmp.2025.068499
Received 30 May 2025; Accepted 13 August 2025; Issue published 30 September 2025
 View Full Text
 Download PDF
Abstract
To advance the performance of solid oxide fuel cells (SOFCs), this work proposes a novel biomimetic flow field architecture inspired by the geometric arrangement of sunflower florets. Drawing on natural principles of optimal spatial distribution, a multi-physics simulation model of the resulting Sunflower Bionic Flow Field (SBFF) was developed. Building upon this foundation, an enhanced configuration was introduced by integrating an annular channel, yielding a modified variant referred to as Modified Sunflower Bionic Flow Field (MSBFF). For comparative purposes, a conventional Traditional Parallel Flow Field (TPFF) was also analyzed under identical conditions. Simulation results underscore the superior gas distribution performance of the bionic configurations. Both SBFF and MSBFF significantly improved the homogeneity of reactant gas molar concentration throughout the flow domain. Relative to the TPFF, the SBFF achieved a 13.32% increase in current density, while the MSBFF reached an enhancement of 15.09%. Correspondingly, peak power densities rose by 14.07% and 16.55%, respectively. Furthermore, these bio-inspired structures contributed to improved thermal regulation, as evidenced by a reduction in average electrolyte temperature by 3.22% for the SBFF and 2.92% for the MSBFF. To further optimize performance, the influence of Fibonacci spiral channel count within the MSBFF design was systematically investigated. Results reveal a strong positive correlation between the number of spiral channels and electrochemical output. In particular, the MSBFF with 16 spiral channels (MSBFF-16) demonstrated the most favorable electrical and thermal characteristics. At an operating voltage of 0.7 V, MSBFF-16 exhibited a current density increase of 1.27% and 0.94% over MSBFF and MSBFF-12, respectively. Likewise, peak power density improved by 2.69% and 1.67%. Finally, the study examined the impact of varying inlet mass fractions of oxygen and hydrogen on SOFC performance. Distinct trends were observed: increasing the oxygen mass fraction markedly enhanced heat transfer and current density, while greater hydrogen mass fractions significantly boosted fuel utilization. These findings highlight the crucial role of reactant composition and flow field topology in governing the electrochemical and thermal efficiency of SOFC systems.Keywords
SOFC is a new energy conversion device with great potential [1]. SOFC directly converts chemical energy into heat and electricity through electrochemical reactions with high efficiency [2,3], an all-solid-state structure [4,5] and a wide range of fuels [6]. Therefore, SOFCs are recognized as a possible pathway to address energy shortages and environmental degradation [7,8,9,10]. However, SOFC exhibits challenges in terms of long-term durability, and SOFC’s positive-electrolysis-negative electrode and interconnect are a sandwich structure. Thermal stress induced by temperature imbalance may cause severe damage to fuel cell, such as delamination and cracking [11,12]. SOFC durability and operational stability will be adversely affected. Therefore, the reduction of the temperature gradient of SOFC is a key parameter in promoting the operational reliability of SOFC [13,14,15,16]. Additionally, researchers have been aiming for a higher power delivery performance of SOFCs.
Interconnectors are an essential part of SOFC. The flow channel design of interconnectors is essential to enhance the temperature uniformity and power density of SOFCs [17]. So far, much research on the flow channel has focused on proton exchange membrane fuel cells (PEMFCs) [18,19,20,21]. In contrast to PEMFCs, SOFCs operate in a high-temperature condition, so a higher-pressure drop isn’t needed to avoid water flooding. For SOFC flow field design, TPFF is mainly concentrated on parallel flow channels [22], serpentine flow channels [23], and staggered flow channels [24]. Some researchers have improved SOFC performance by inserting obstacles into the flow channel. Khazaee and Rava [25] changed the geometry from rectangle to triangle and trapezoid, and the simulation results indicated that the rectangular channel exhibits a better performance. Guo et al. [26] presented some novel flow field designs by changing the shape of the interconnect ribs. The results revealed that the new interconnectors can provide higher electric power. Chellehbari et al. [27] considered the effect of the number and shape of obstacles in the flow channel on the SOFC performance, thus exploring a more efficient SOFC. Canavar and Timurkutluk [28] proposed a braided nickel-based collector network for the anode flow field, which offers the possibility of enhancing the volumetric power density of SOFCs. Kim et al. [29] investigated the physical phenomena of SOFC based on pin shape changes. SOFC was optimized by considering power output, flow distribution, and blower consumption.
In recent years, the flow field of SOFC has been studied and investigated extensively [30,31,32]. Quach et al. [33] integrated alternating flow into the interconnect design, and uniform temperature distribution was obtained by considering different temperatures and fuel utilization rates. Dong et al. [34] presented an anode-supported SOFC with cells designed in concentric circles, and the flow field is cross-flow. Kong et al. [35] proposed a novel X-type interconnector. The X-type interconnect has excellent electrical properties. Yan et al. [36] designed a spiral-shaped interconnector that has been proven to enhance mass transfer capability. Saied et al. [37] optimized the flow field of SOFC. Different flow field structures were analyzed, such as the Spiral flow field, serpentine flow field with different inlets, TPFF, and so on. Numerical results revealed that the three-entrance serpentine flow channel achieved excellent fuel and oxygen distribution over the three-phase boundary, and a higher collected current was obtained. Fu et al. [38] suggested a beam and slot flow field structure. The results indicated that the structure reduced the charge transfer path and removed the gas diffusion limitation. Li et al. [39] designed a new type of flow field structure, effectively increasing the net power density of SOFC through vertical and horizontal sinusoidal flow channels. The electrical performance and transmission characteristics of SOFC were enhanced.
Advancements in bionic research have revealed that nature provides spectacular structural forms that adapt to complex and changing environments. The natural development and evolution provide abundant and practical bionic materials for human use and long-term life. As a combination of bionics and mechanical design, bionic structural design has emerged to draw on the unique advantages of delicate natural structures, opening a new innovative way for the field of optimal structural design. The design of natural transport systems was simplified. The bionic structure embodies the transport structure of “survival of the fittest” in nature. The bionic flow field design can conform to thermodynamics and fluid mechanics, improving fuel cell performance [40]. Li et al. [41] established a bionic flow field based on the nautilus. The nautilus bionic channel had better reactant uniformity and excellent power delivery than the traditional honeycomb and serpentine channels. Xia et al. [42] designed an improved leaf-vein bionic flow field, and they found the advantages of lower pressure drop and more homogeneous reactant gases compared with the traditional flow field. Zhang et al. [43] integrated the human frame configuration into the bionic flow field design, and investigated the effect of different flow patterns and relative humidity on the performance of PEFMC. So far, the application of the bionic flow field has been primarily focused on the PEFMC. However, few studies have combined bionics with SOFC flow field design.
This study is focused on a novel bionic flow field based on the sunflower structure. A three-dimensional multi-physical field model with SBFF was established. The heat transfer characteristics and electrical properties of the SBFF were investigated. The significance of the SBFF in improving the performance of the SOFC was verified by comparing it with the TPFF. The effect of bionic flow fields with different numbers of Fibonacci spiral flow channels on SOFC performance was explored, and the differences in electrical properties and thermal characteristics were compared. Additionally, the effect of reactant gas inlet mass fraction on SOFC performance was investigated.
2.1 Physical Model Description
The sunflower tray exhibits a helical arrangement. An efficient flow field structure was designed to borrow from the fine arrangement and organization of the sunflower tray. In SOFC, the uniform flow of the fluid is the key to improving the reaction efficiency. The structure of the sunflower tray is conducive to the uniform distribution of fluid along the flow channel. In addition, the flow efficiency and reaction rate of the reactants are improved by reducing the dead volumes of the reactants in the flow channel.
Therefore, this paper established a novel interconnect flow field structure inspired by the nature of sunflower seeds, as shown in Fig. 1. The bio-inspired flow field is integrated into both the cathode and anode channels of the SOFC. The geometric dimensions of the SOFC are shown in Table 1. The air/fuel inlet of the flow field is arranged in the center of the circular flow channel, and the air/fuel outlet is located at the outermost part. The SBFF is exhibited in Fig. 2a. In addition, to explore the flow field configuration with optimal performance, the original bionic channel is further improved by adding an annular channel to the SBFF, as illustrated in Fig. 2b. Meanwhile, this paper also investigates the TPFF and compares it with the bionic flow channel. The TPFF is illustrated in Fig. 2c. A co-flow configuration is applied to the TPFF. The fuel and air adopt the same flow directions.
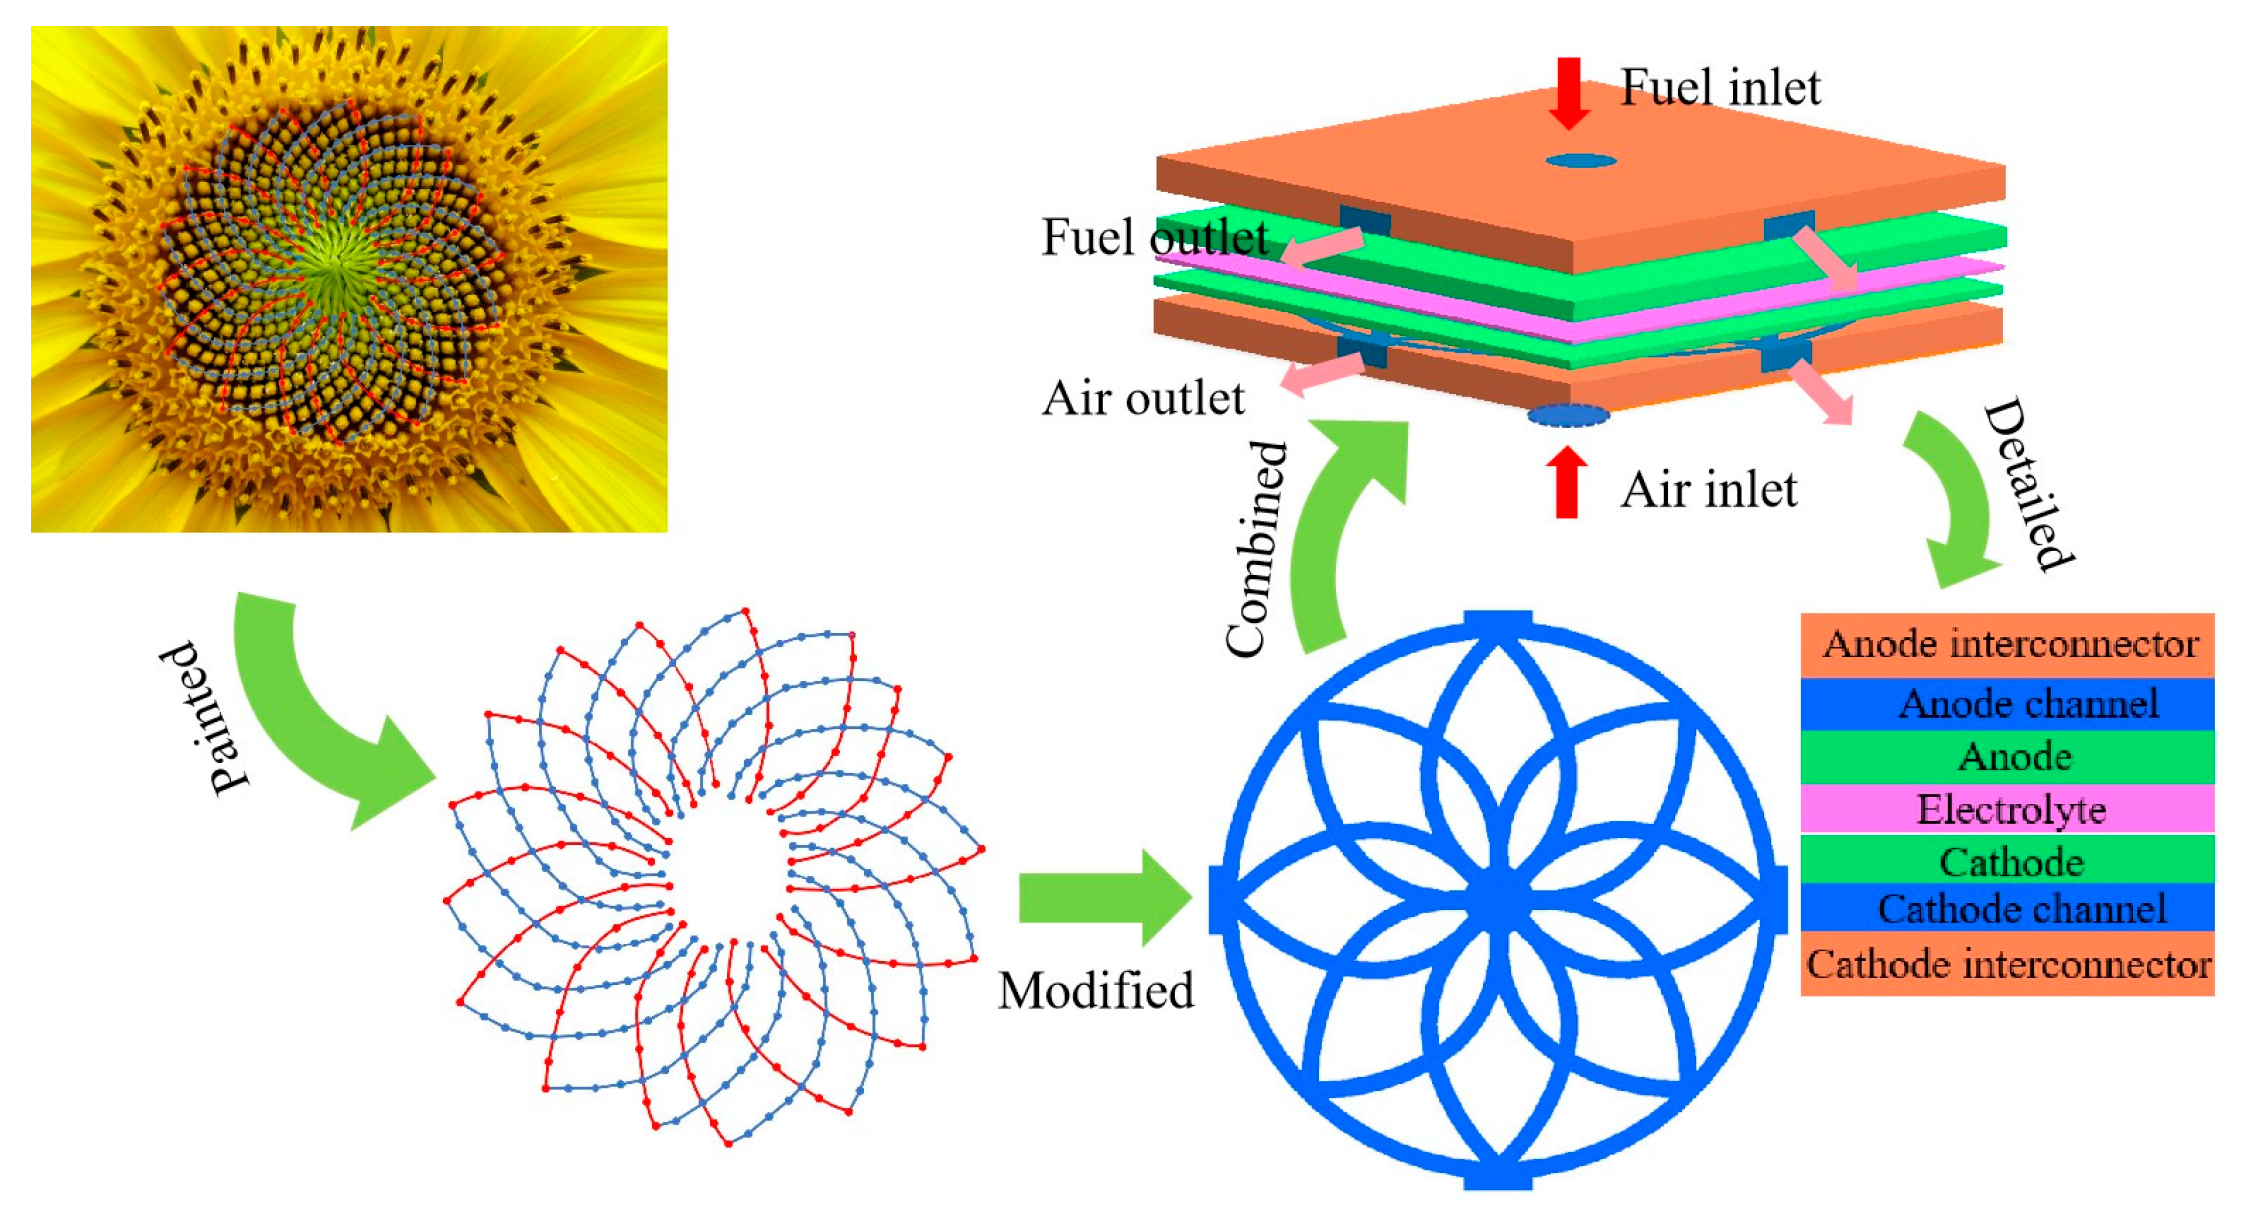
Figure 1: Design of sunflower bionic flow channel.
Table 1: Geometric parameters for the model.
| Parameter | Symbol | Value | Unit |
|---|---|---|---|
| Gas channel height | Hch | 1 | mm |
| Gas channel width | Wch | 1.5 | mm |
| Inlet diameter | Lin | 6 | mm |
| Outlet width | Lout | 6 | mm |
| Interconnect thickness | Hic | 1.5 | mm |
| SOFC width | Ws | 50 | mm |
| SOFC length | Ls | 50 | mm |
| Anode thickness | δan | 500 | μm |
| Cathode thickness | δca | 50 | μm |
| Electrolyte thickness | δel | 20 | μm |
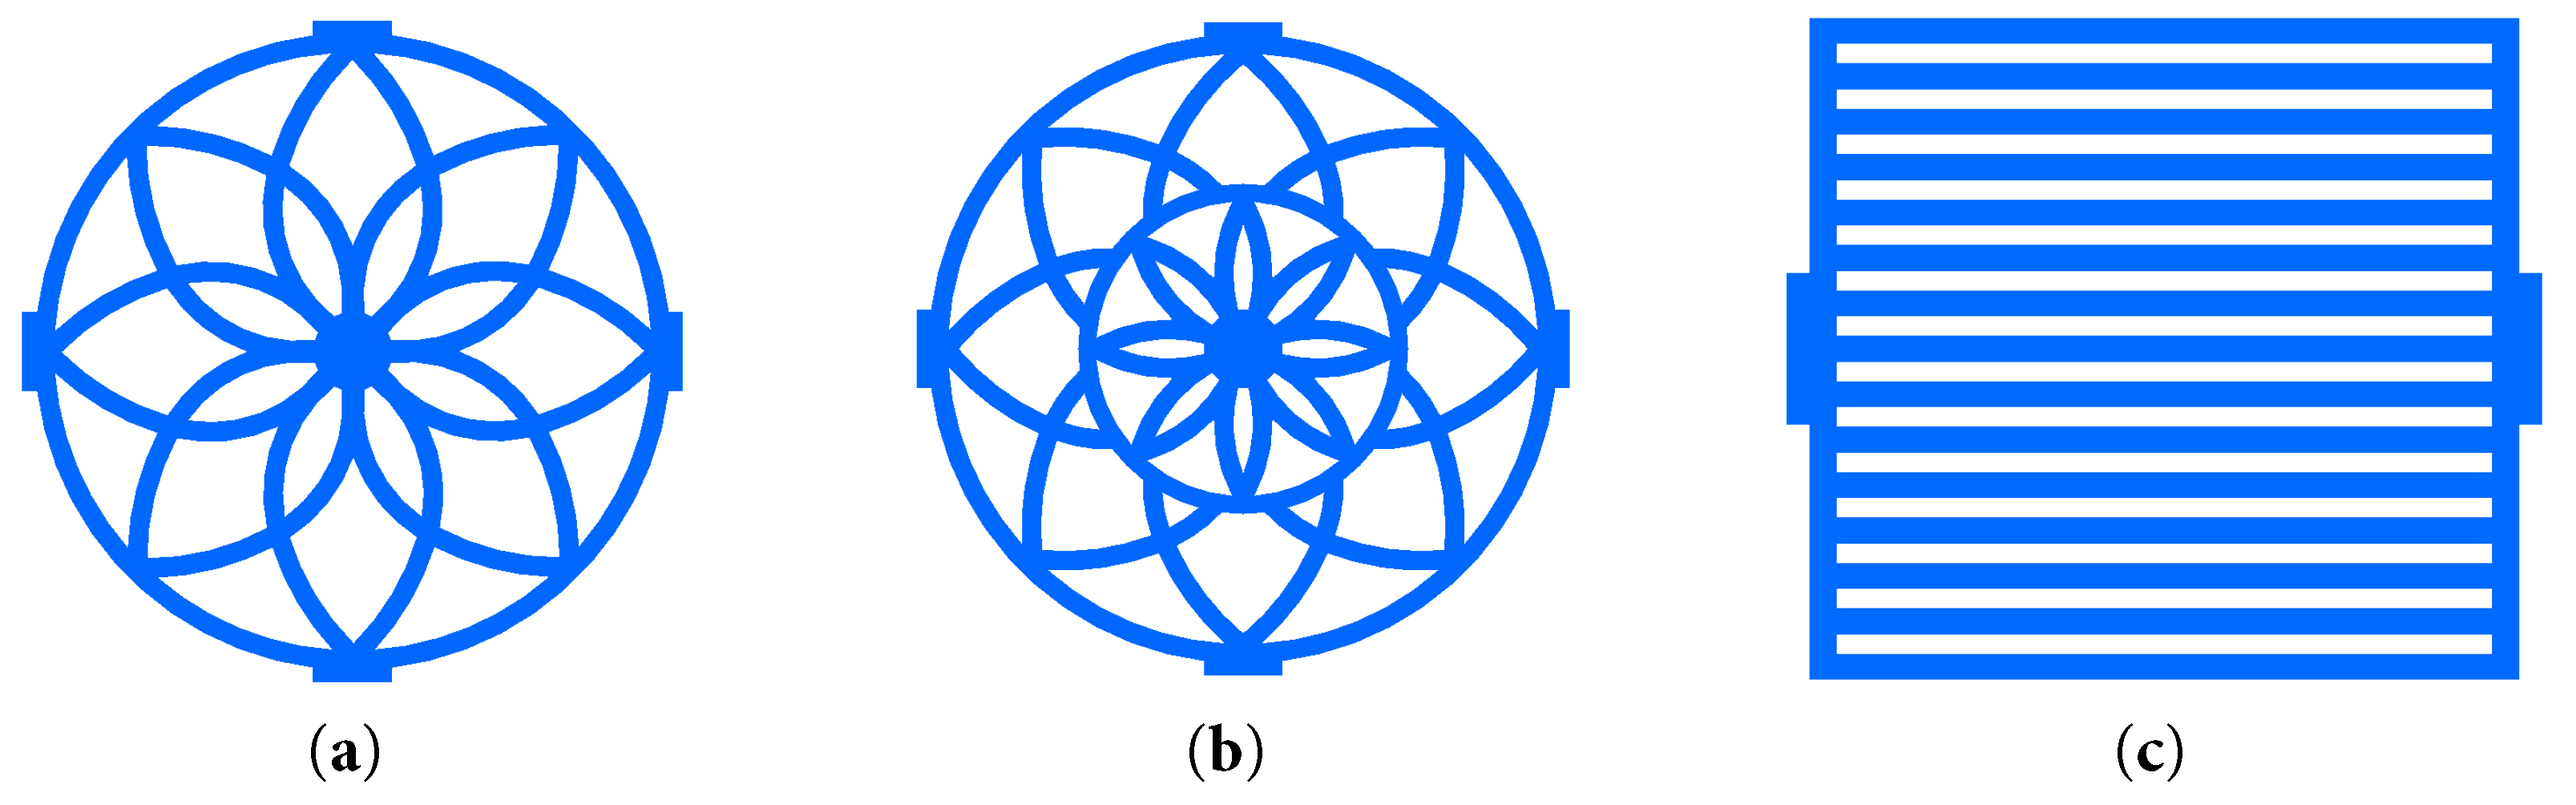
Figure 2: Bionic flow field and traditional flow field: (a) SBFF; (b) MSBFF; (c) TPFF.
2.2 Governing Equation of Fuel Cell
During SOFC operation, complex interactions exist among electrochemical reactions, fluid flow, species diffusion, and heat transfer. Resolving these coupled phenomena is essential for accurate numerical simulation. Reactive gas flow involves momentum transfer and convective heat transfer in flow channels; Species diffusion couples with electrochemical reactions, mass transport, and charge transfer, accompanied by energy conversion during reactions in porous electrodes.
Mass conservation:
Species conservation: The transport phenomena of species in porous electrodes and flow channels are described by the Maxwell-Stefan equation [29,44]:
The binary gas diffusion coefficients (Dij) can be calculated as [27,45,46]:
In porous media, the effective diffusion coefficient is usually affected by porosity and distortion. When molecular diffusion is considered, the effective diffusion coefficient can be expressed as [27,46]:
Momentum conservation: The pressure and velocity distributions of the anode and cathode channels are obtained by the momentum transfer equation. Fluid flow in porous electrodes and flow channels is simulated by the weakly compressible Brinkman equation [25,27,47].
For flow channel:
For porous electrodes:
Charge balances: Charge transport is divided into electron transport and ion transport. The charge conservation equation determines the current density of the electrolyte and the electrode [25,48]:
Electrolyte layer:
Electrode layer:
Electrolyte layer:
Anode electrode layer:
Cathode electrode layer:
The current density in the electrode can be obtained from the Butler-Volmer function [37]:
Heat transport model: Assume that the fluid and the porous structure have the same temperature. The classical heat conduction equation is expressed as [25]:
In this paper, all models were simulated by COMSOL Multiphysics. A finite volume discretization scheme with the second-order upwind method is adopted to construct the conservation equations. As a steady-state problem is solved, time discretization is unnecessary. The governing equation system is solved monolithically through a fully coupled approach. The solution of this nonlinear system relies on the Newton-Raphson iteration algorithm [48]. The linear system of equations arising within each iteration is handled by the PARDISO direct solver, with the relative residual convergence criterion set to less than 10−5. All operations and boundary conditions are determined by literature. All external conditions are subject to insulation boundary conditions. Continuity of current and potential is applied at the internal boundaries. In the heat transfer model, due to symmetry, symmetric conditions are imposed on the upper and lower connecting body surfaces and sides. Detailed boundary conditions of the flow field are displayed in Table 2. The material properties associated with SOFC components are shown in Table 3.
Table 2: Boundary conditions [24].
| Parameter | Symbol | Value | Unit |
|---|---|---|---|
| Operating pressure | pref | 1 | atm |
| Operating temperature | Tref | 1073 | K |
| Anode hydrogen inlet velocity | ua | 0.4 | m/s |
| Cathode air inlet velocity | uc | 3 | m/s |
| Molar mass H2 | MH2 | 2 | g/mol |
| Molar mass O2 | MO2 | 32 | g/mol |
| Molar mass N2 | MN2 | 28 | g/mol |
| Molar mass H2O | MH2O | 18 | g/mol |
| Anode inlet mass fraction | ω0, H2 | H2:H2O = 0.4:0.6 | — |
| Cathode inlet mass fraction | ω0,O2 | O2:N2 = 0.15:0.85 | — |
| Inlet hydrogen temperature | Tin,a | 1073 | K |
| Inlet air temperature | Tin,c | 1073 | K |
Table 3: Model physical parameters [24,41].
| Parameters | Symbol | Value | Unit |
|---|---|---|---|
| Anode density | ρan | 3310 | kg/m3 |
| Cathode density | ρca | 3030 | kg/m3 |
| Electrolyte density | ρel | 5160 | kg/m3 |
| Interconnect density | ρic | 3030 | kg/m3 |
| Anode thermal conductivity | kan | 11 | W/(m·K) |
| Cathode thermal conductivity | kca | 6 | W/(m·K) |
| Electrolyte thermal conductivity | kel | 2.7 | W/(m·K) |
| Interconnect thermal conductivity | kic | 20 | W/(m·K) |
| Anode heat capacity | cp,an | 450 | J/(kg·K) |
| Cathode heat capacity | cp,ca | 430 | J/(kg·K) |
| Electrolyte heat capacity | cp,el | 470 | J/(kg·K) |
| Interconnect heat capacity | cp,ic | 550 | J/(kg·K) |
| Anode porosity | εan | 0.4 | |
| Cathode porosity | εca | 0.4 | |
| Anode tortuosity | τan | 3.8 | |
| Anode tortuosity | τca | 3.8 | |
| Exchange current density of anode | ian | 4637.4 | A/m2 |
| Exchange current density of cathode | ica | 1166.2 | A/m2 |
| Anode diffusion coefficient | Dan,eff | 4.9825 × 10⁻⁵ | m2/s |
| Cathode diffusion coefficient | Dca,eff | 1.2018 × 10⁻⁵ | m2/s |
| Reference diffusion coefficient | Dref | 3.16 × 10⁻⁸ | m2/s |
2.3 Simulation Model Assumptions
In the numerical simulation, SOFC models establish the charge balance equations required for coupling mass, momentum, energy, and electrochemical reactions. To facilitate the solution, the following assumptions were made without impacting the reaction mechanism of SOFC [27].
- (1)Mixtures of all gases are considered ideal gases.
- (2)The flow of reactants in the flow field is a laminar flow type.
- (3)The diffusion and catalytic layers have uniform structure and isotropy.
- (4)The effects of gravity and the radiative heat transfer inside the fuel cell are ignored.
- (5)The contact resistance between the connector and the electrode is ignored.
- (6)The steady-state condition is employed in the performance study of the SOFC.
To verify the reliability of the simulation model results, numerical simulation results were compared with experimental data from a published reference under the same operating and boundary conditions [49], as illustrated in Fig. 3. The simulation results are consistent with the published data results. Therefore, the simulation model in this paper is feasible and reasonable. The model can provide reasonable data to support the theoretical research of SOFC.
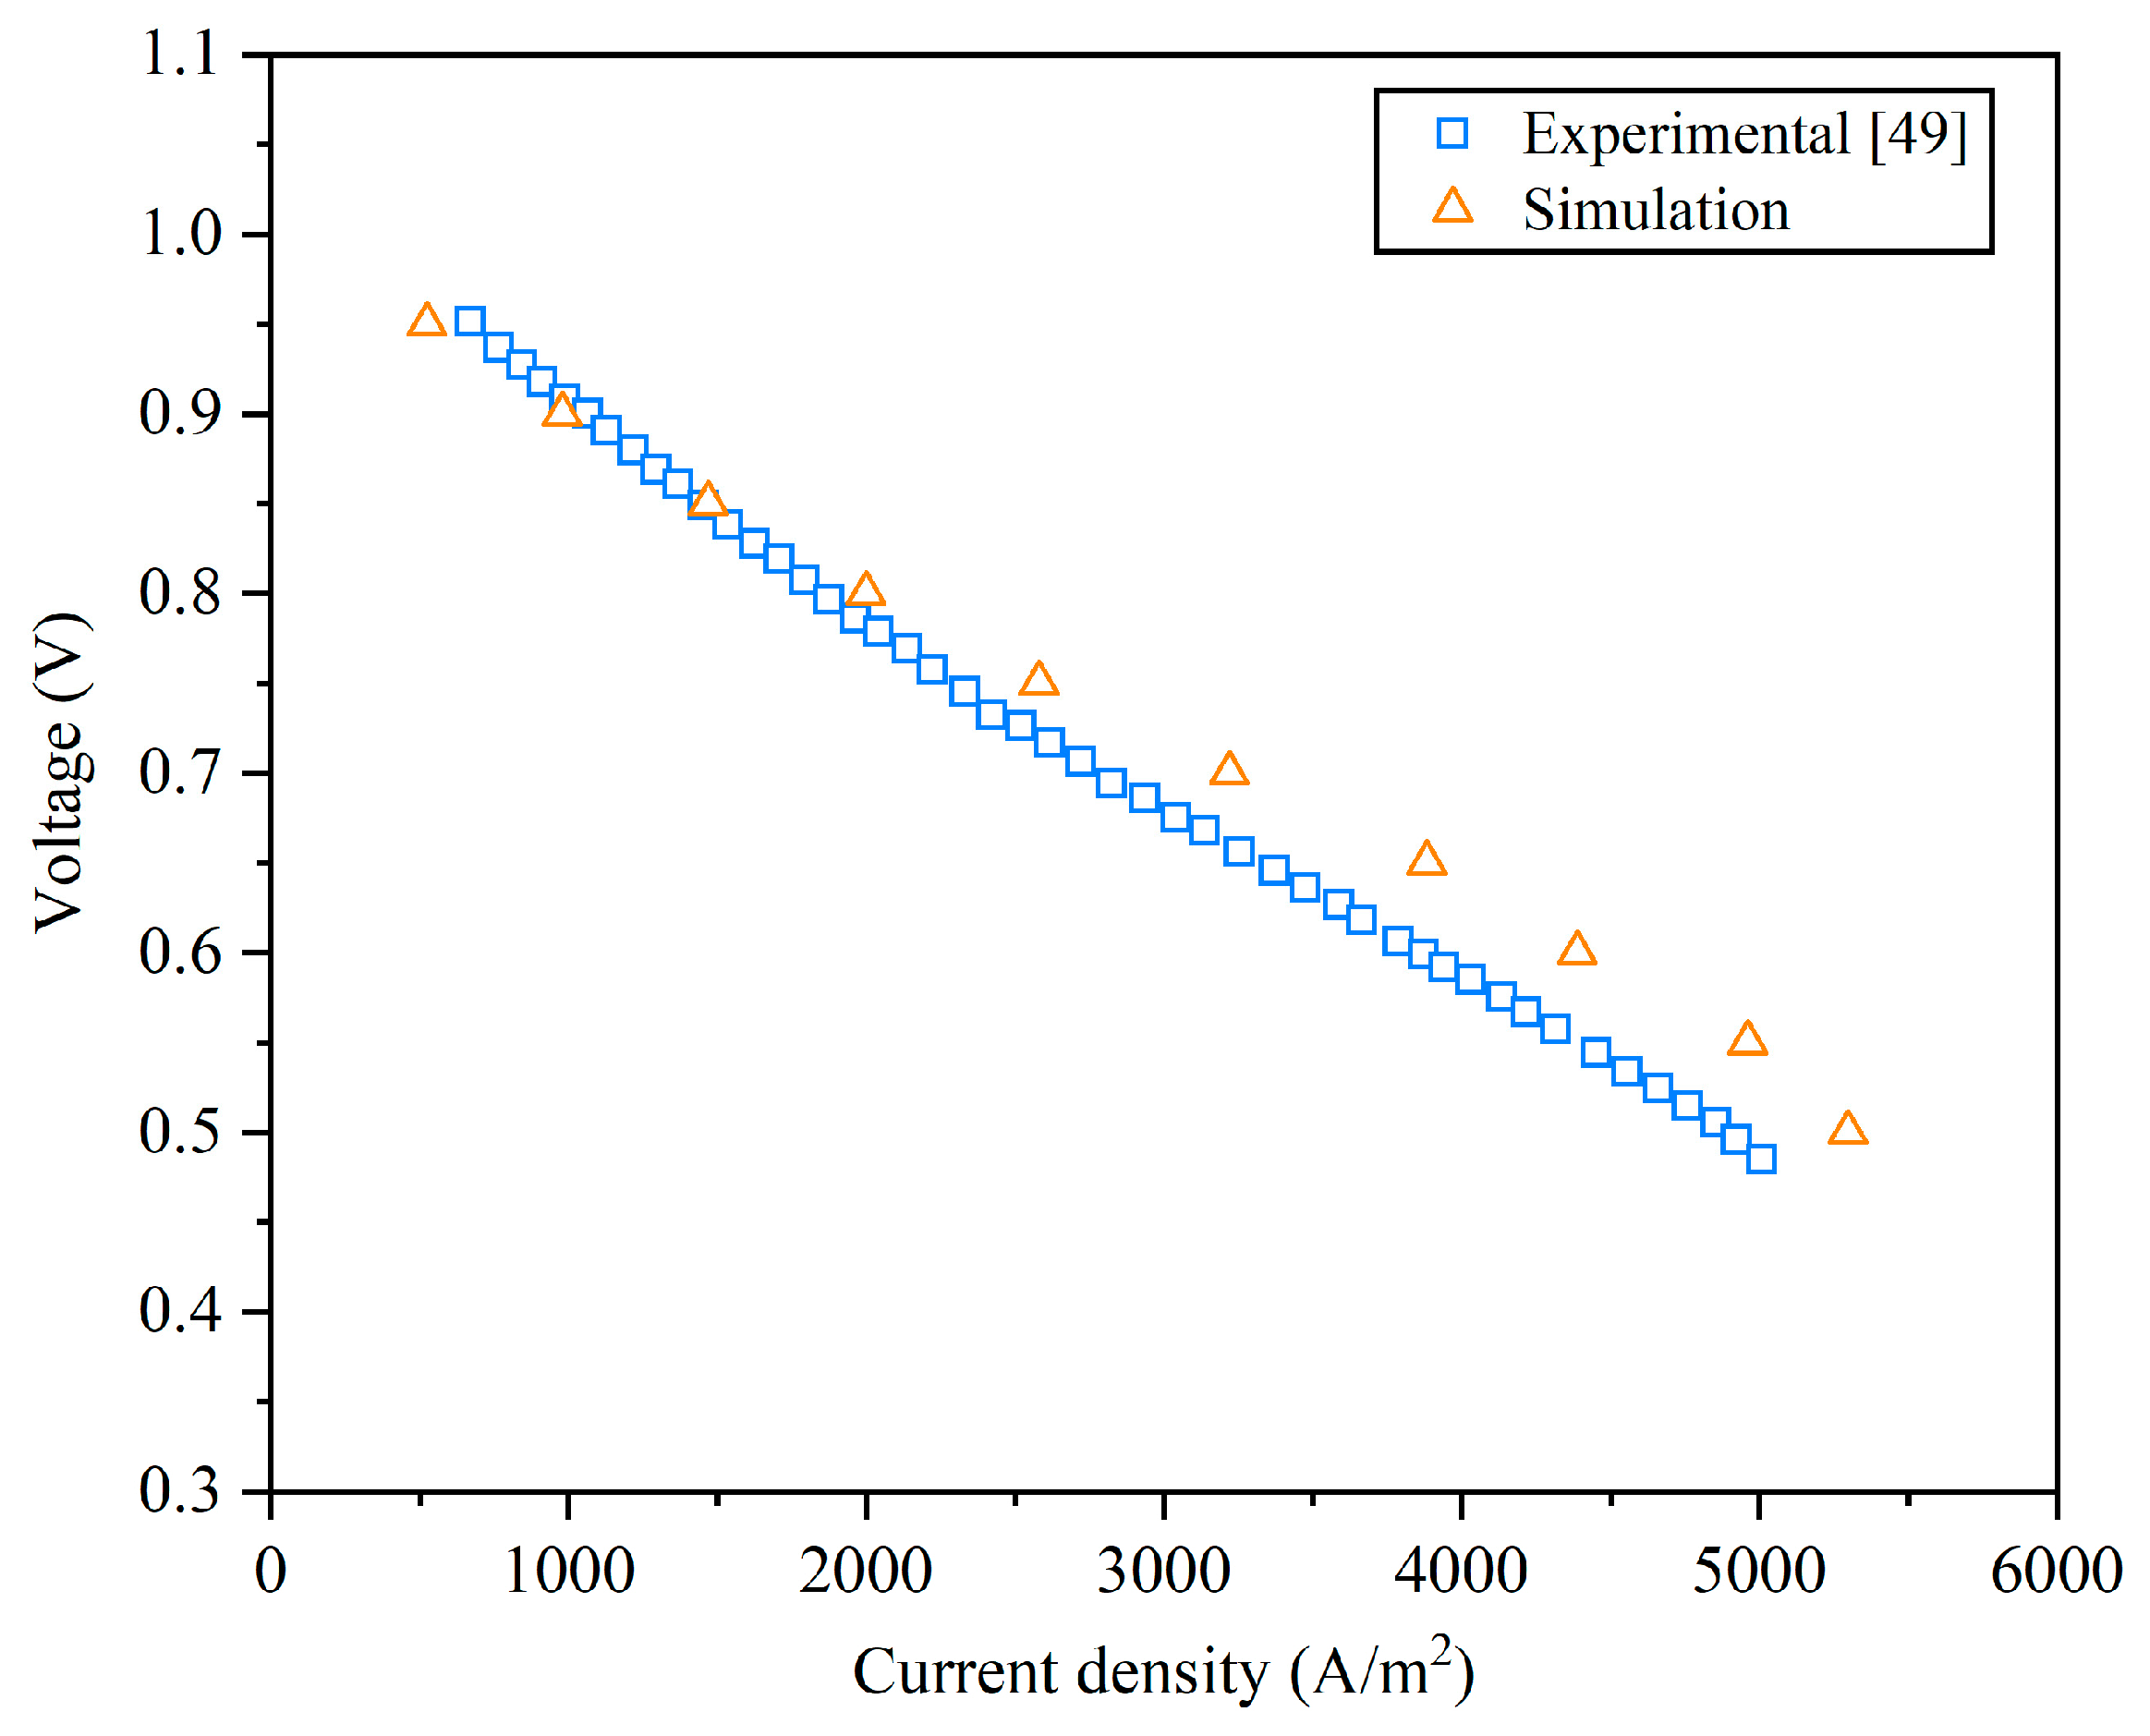
Figure 3: Model validation [49].
All models simulated are meshed by the COMSOL Multiphysics built-in meshing module in this paper, tetrahedral grids are used, and the grids are locally densified in the reaction area. In solving the mathematical model, the test of grid independence is necessary. Based on ensuring the effectiveness of grid division, selecting the appropriate grid number can significantly improve the accuracy of the calculation results, save time for model solving, and reduce the computer memory occupied. In this paper, four grid models (762,650, 1,435,009, 2,172,478, 2,825,651) are applied to test the grid independence, and the test results of SOFC grid independence are shown in Table 4. From the perspective of accuracy and economy, this paper adopts a simulation model with several grids of 2,172,478.
Table 4: Grid independence test.
| Mesh Type | Grid Number | Current Density (A/m2) | Max Temperature (K) |
|---|---|---|---|
| Mesh-1 | 762,650 | 6270.1 | 1132.5 |
| Mesh-2 | 1,435,009 | 6377.7 | 1133.7 |
| Mesh-3 | 2,172,478 | 6419.9 | 1134.3 |
| Mesh-4 | 2,825,651 | 6435.4 | 1134.4 |
The current density is an important parameter to assess the SOFC properties. The polarization curve reflects the comprehensive performance of the SOFC under certain working conditions. Fig. 4 shows the polarization and power density curves of SBFF, MSBFF and TPFF. When the current density is less than 2000 A/m2, the polarization and power density curves of the different flow fields exhibited minor differences, the voltage loss was mainly caused by the activation polarization at low current densities. As the current density continued to increase, the polarization curves of different flow field structures were different due to the voltage loss caused by the reduction of electron, ionic resistance, and reactant concentration in the fuel cell. When the operating voltage is 0.7 V, relative to the TPFF, the SBFF achieved a 13.32% increase in current density, while the MSBFF reached an enhancement of 15.09%. In addition, to further compare the performance differences of SOFC with different flow channels, the power density curve reveals that the peak power density of the bionic channel was obviously better than that of the TPFF. Compared with the TPFF, the peak power density of SBFF and MSBFF was raised by 14.07% and 16.55%, respectively.
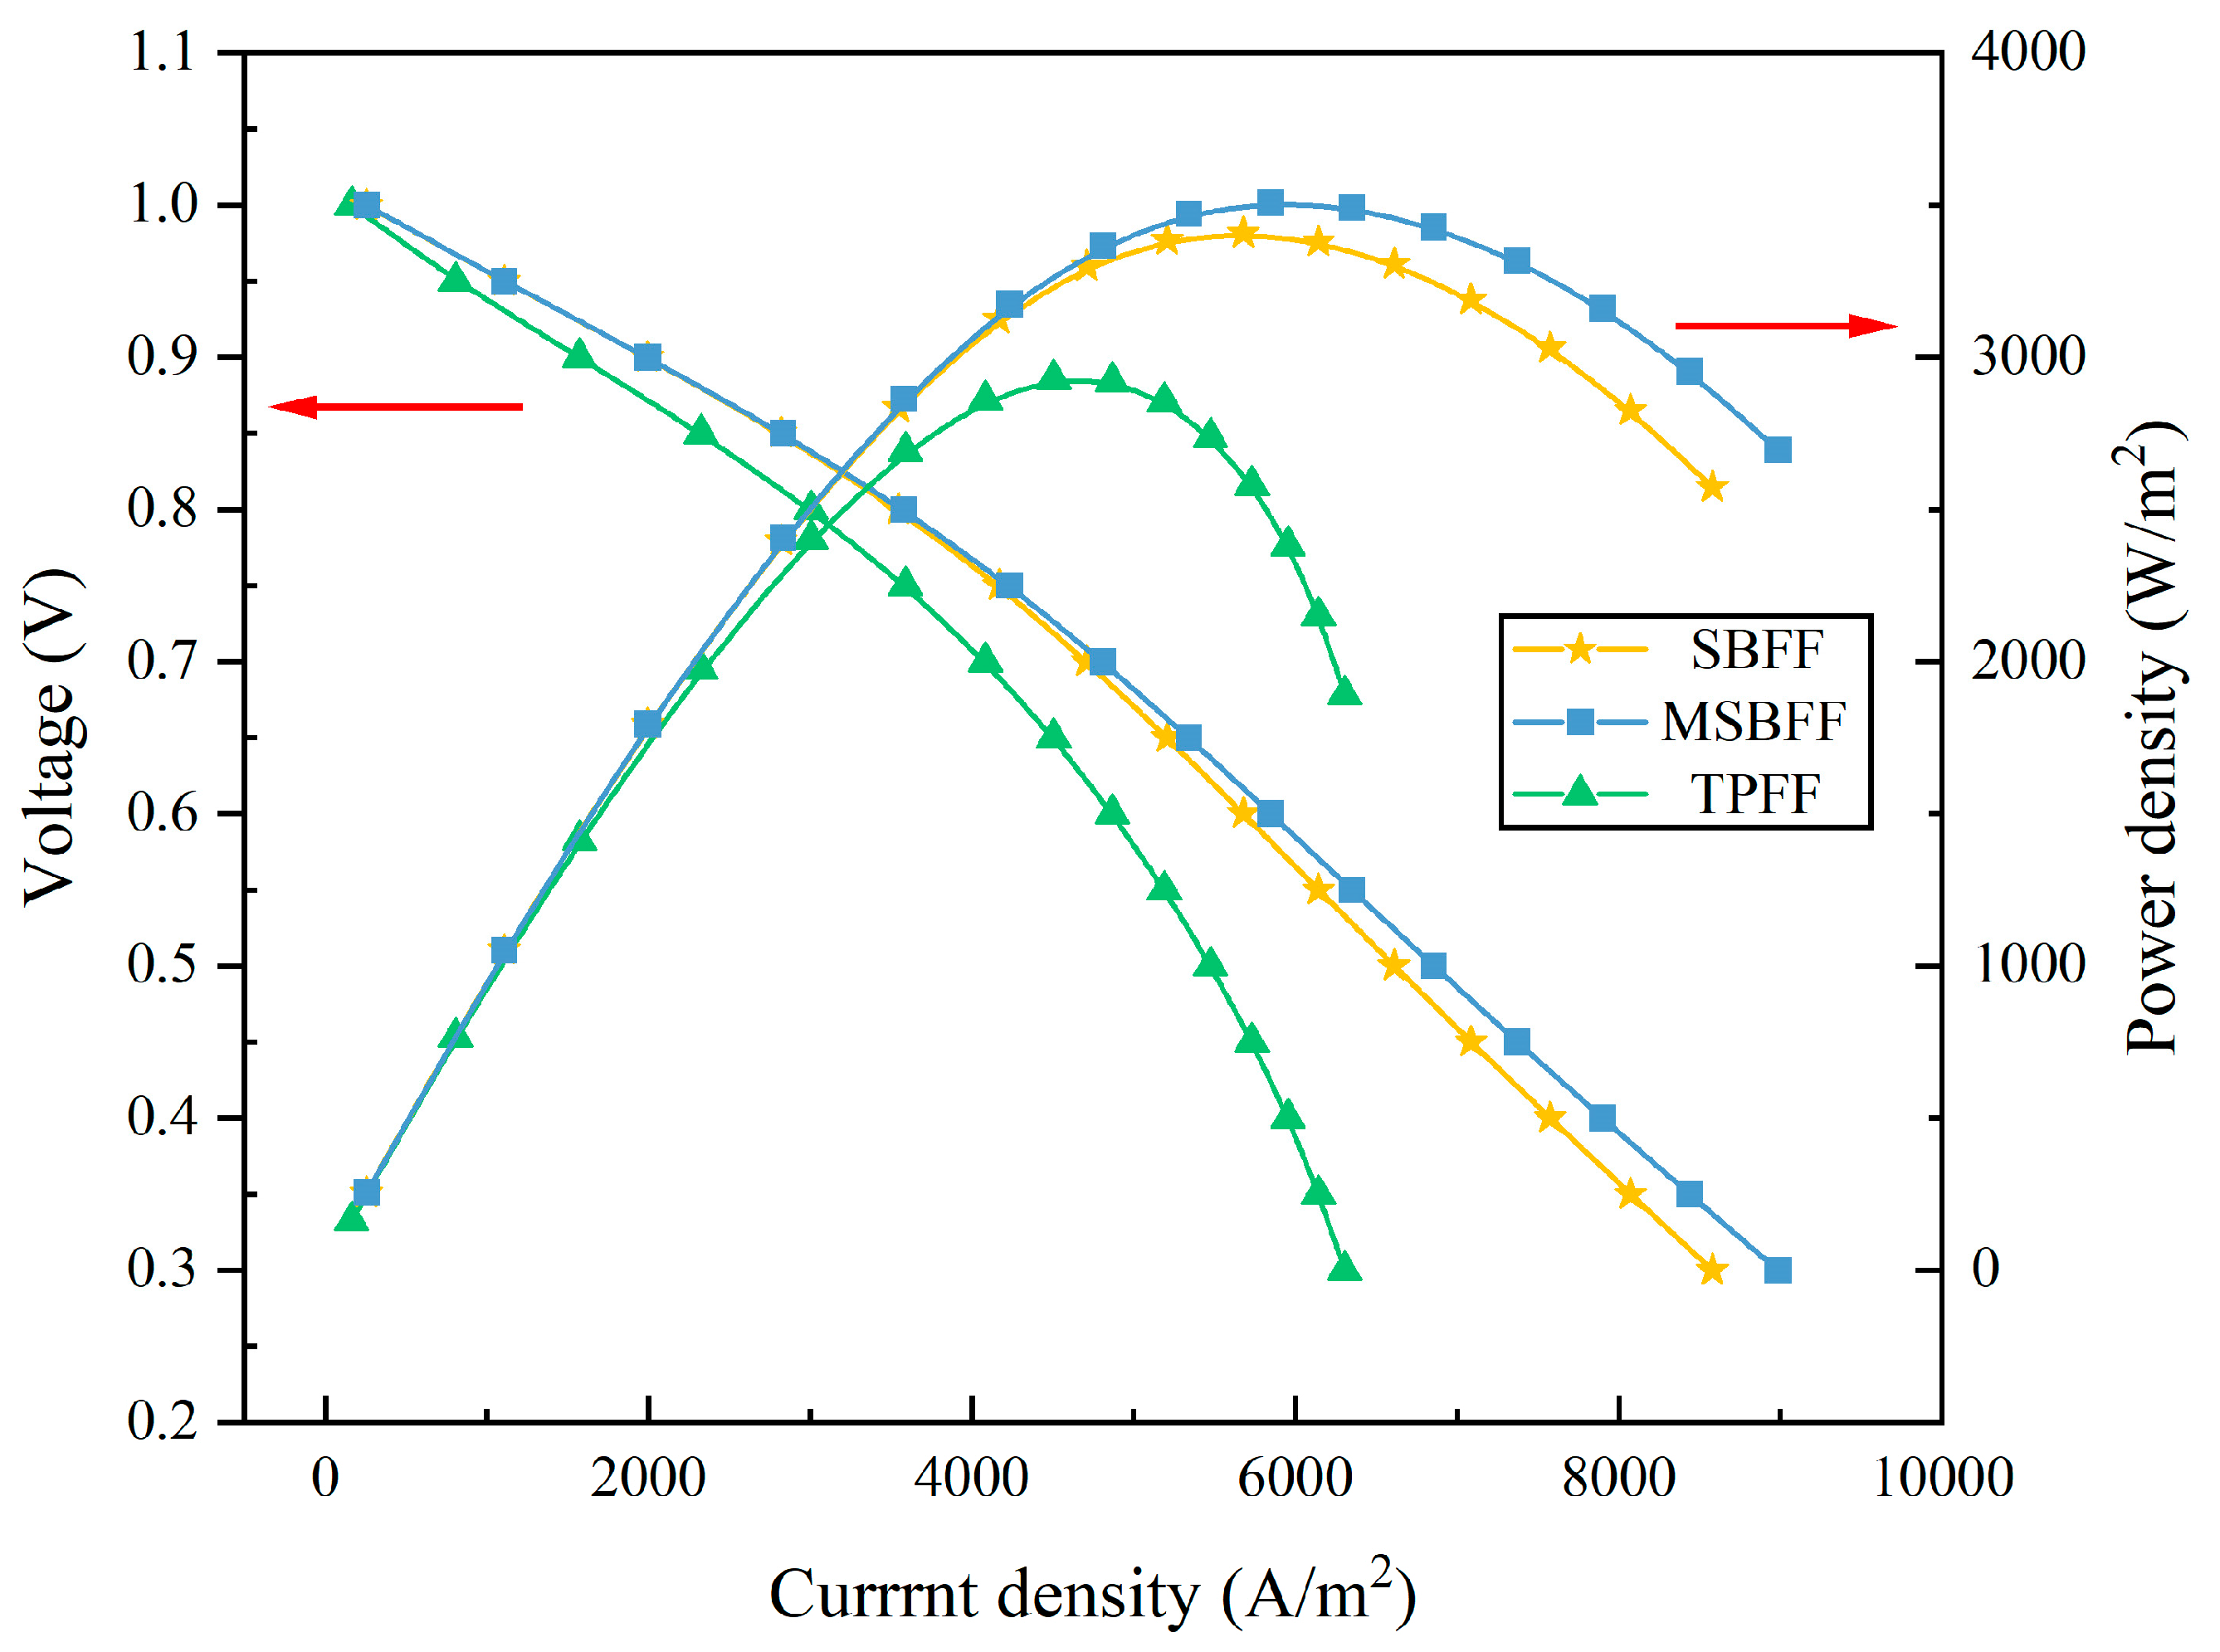
Figure 4: Polarization and power density curves of different flow fields.
3.2 Effect of Various Flow Fields on SOFC Performance
Concentration and homogeneity of reactants in the flow fields are essential criteria for judging the performance of flow fields. Fig. 5 describes the oxygen mole distribution of various flow field structures when the operating voltage is 0.7 V.

Figure 5: Oxygen molar concentration distribution of different flow fields: (a) SBFF; (b) MSBFF; (c) TPFF.
As shown in Fig. 5, the molar concentration of oxygen was distinctly higher at the inlet of the flow channel. As the gas flows, the reactants continue to participate in the reaction, and the oxygen molar concentration of the flow channel gradually decreases from the inlet to the outlet. Because the bionic flow channel prolongs the flow path, oxygen can reside longer within the channel. Consequently, oxygen diffusion and utilization are enhanced. The oxygen molar concentration of SBFF and MSBFF was appreciably higher than that of TPFF. The bionic flow channel design, the SBFF and MSBFF had a more uniform distribution of oxygen molar concentration. More areas of low oxygen concentration occurred in TPFF, and this phenomenon wasn’t conducive to enhancing the current density and peak power density of SOFCs. To further analyze the distinction of reactant distribution between the different flow channels, Liu et al. [50] proposed the non-uniformity index N, which can be expressed as:
According to Eq. (21), the average molar concentration of oxygen and non-uniform index at the cathode-electrolyte interface of different flow channels are shown in Fig. 6. The average oxygen molar concentrations of the SBFF and MSBFF were substantially more significant than the TPFF, and the MSBFF had the maximum average molar concentration. The non-uniformity indices of the SBFF and MSBFF were markedly less than the TPFF. Consequently, more oxygen was involved in the electrochemical reaction, and the oxygen distribution of the bionic flow fields was more uniform. The oxygen consumption rate can be boosted. The electrochemical reactions within the SOFC were accelerated, thus improving the SOFC performance.
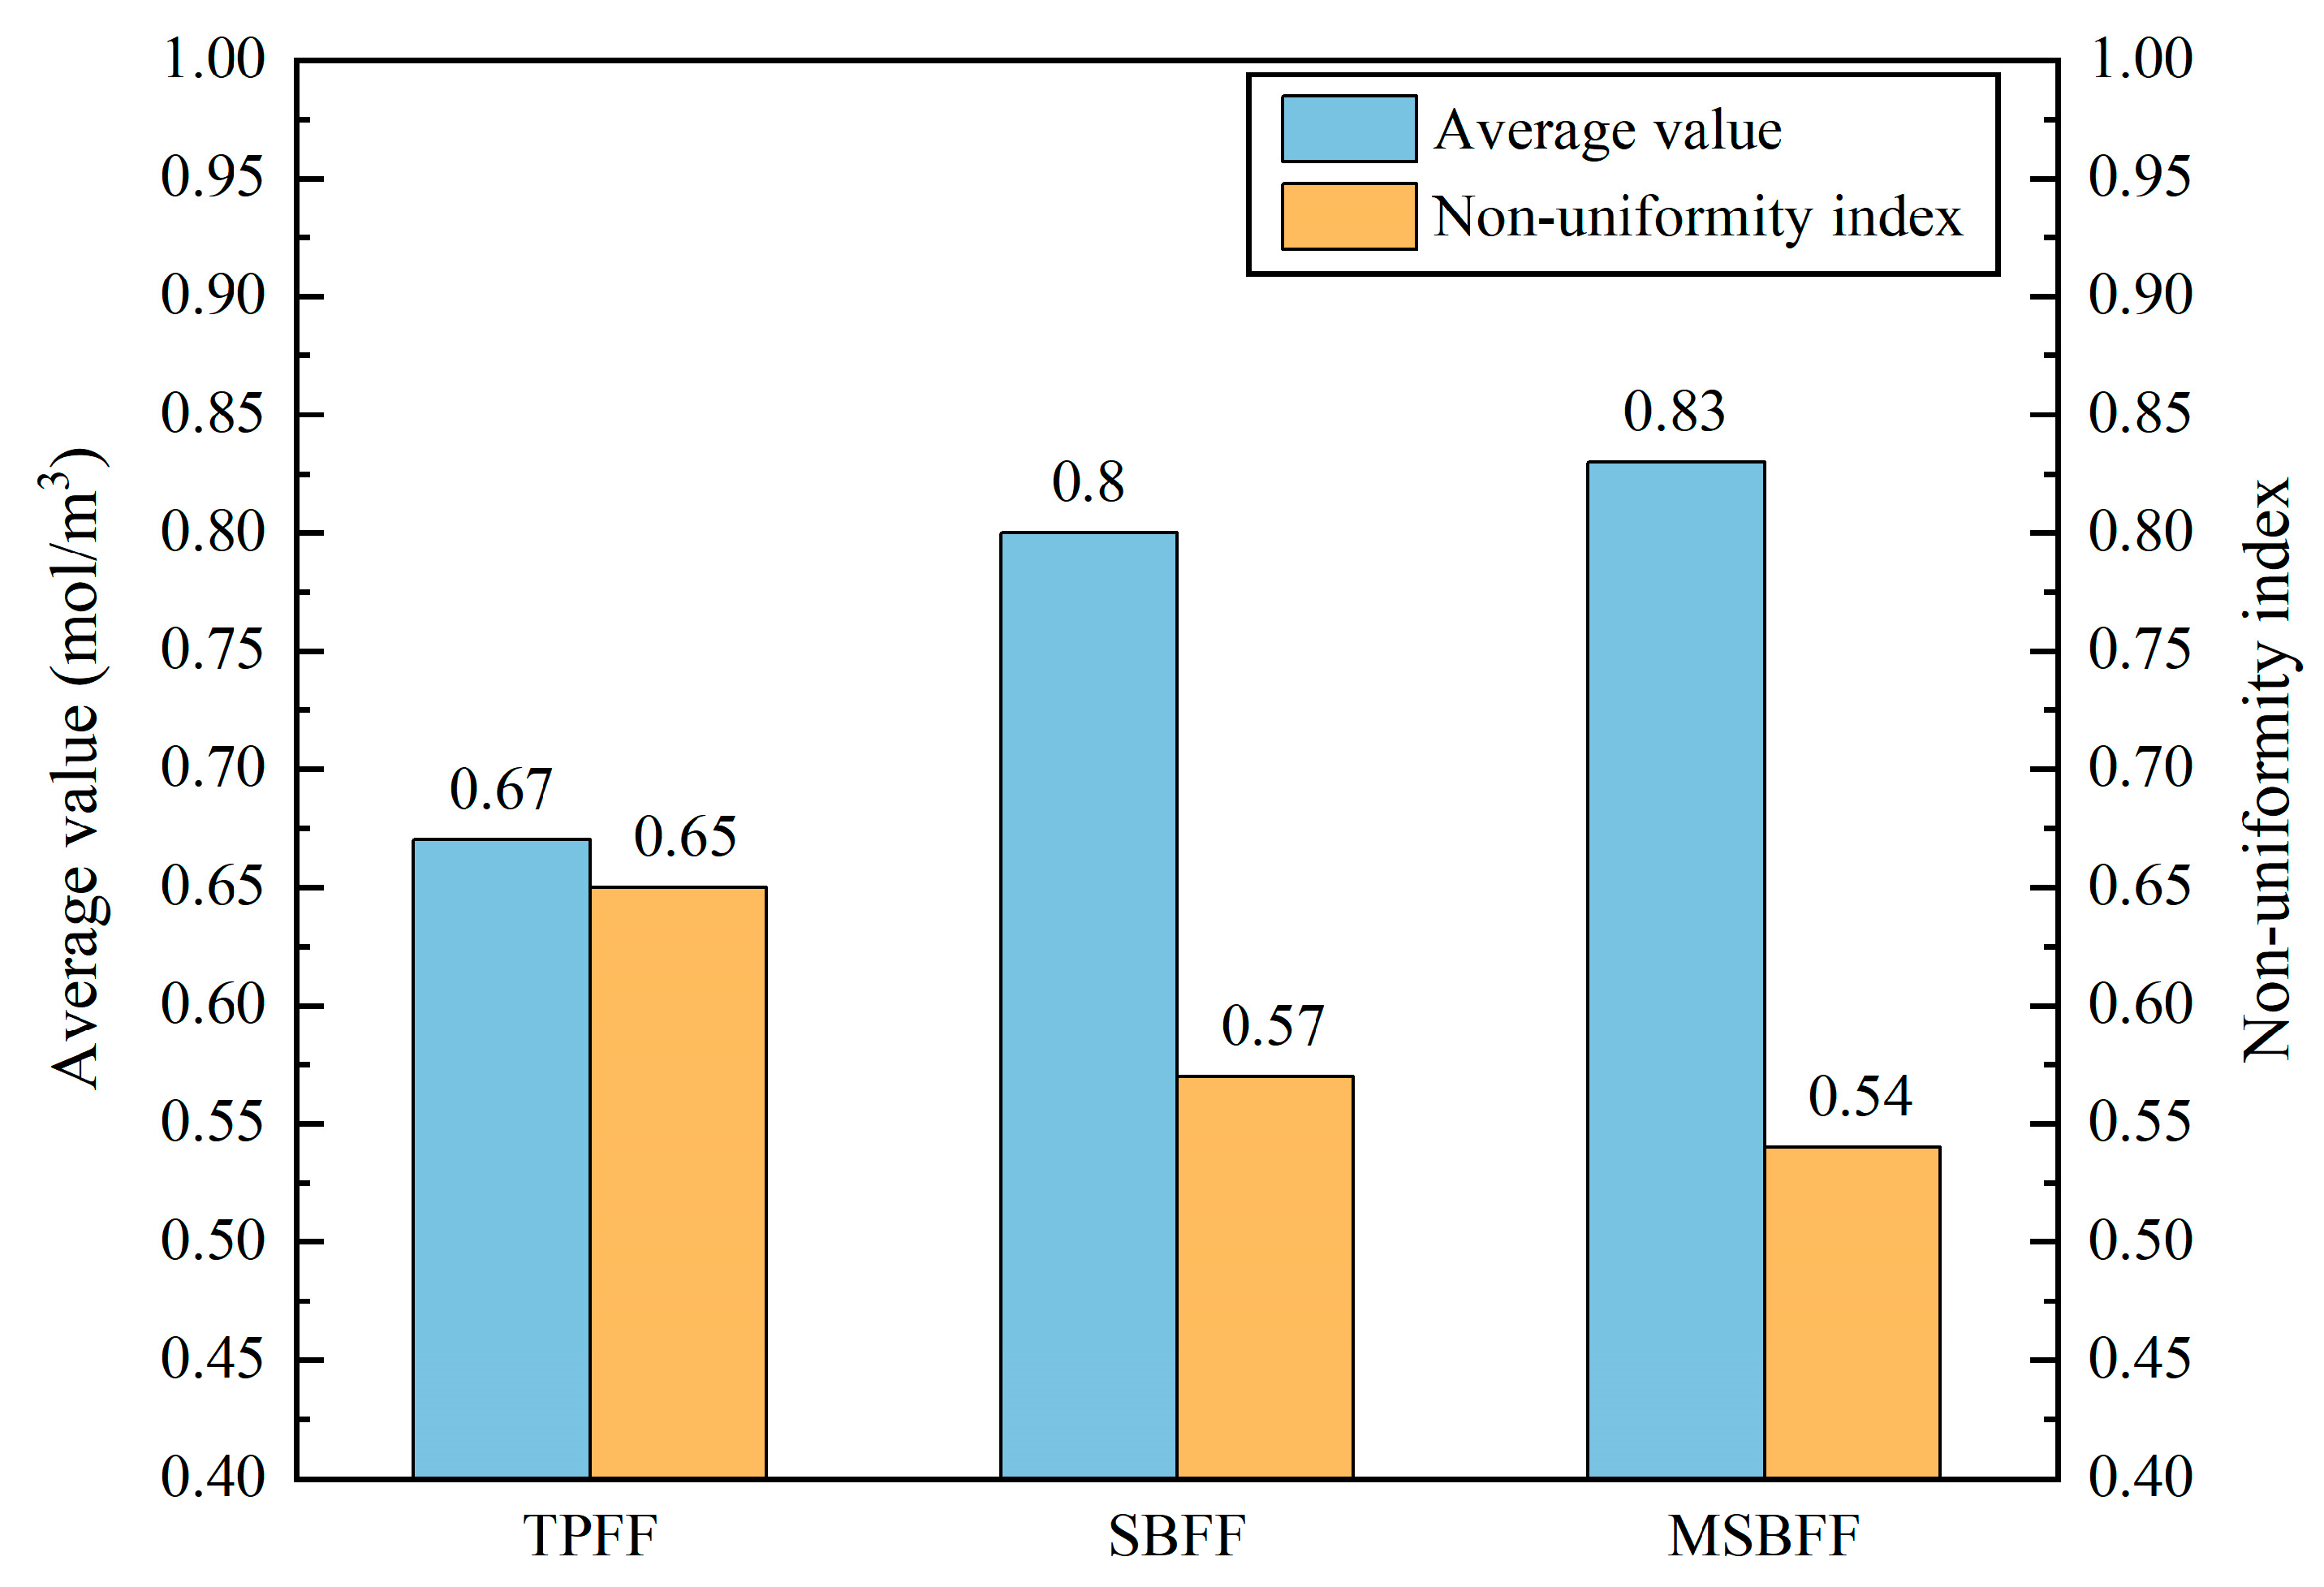
Figure 6: Average oxygen molar concentration and non-uniform index value for the different flow fields.
The current density can directly reflect the working properties of the fuel cell. The distribution of current density has an essential effect on the fuel cell power delivery capability and stability. At the operating voltage of 0.7 V, the current density distribution of SBFF, MSBFF and TPFF at the cathode-electrolyte interface is illustrated in Fig. 7.

Figure 7: Current density distribution of different flow fields: (a) SBFF; (b) MSBFF; (c) TPFF.
As observed in Fig. 7, the current density distribution is closely related to the oxygen distribution. The current density value was the highest at the fuel inlet, and the current density gradually decreased from the inlet to the outlet of the flow field. Because of the relatively lower concentration of reactants which reduced the reaction rate of the electrode-electrolyte interface, the current density was lower in the region with poor oxygen concentration. In addition, the current density of TPFF gradually attenuated along the direction of gas flow, and a prominent ‘stratification’ phenomenon appeared. The attenuation of current density was more pronounced in corners. Nevertheless, due to the symmetry and dispersion of the SBFF and MSBFF, the current density changed relatively gently. The current density dispersion was relatively uniform. MSBFF had a higher average current density and faster electrochemical reaction rate. Therefore, the MSBFF can provide a stable electrochemical reaction and improve the SOFC performance.
The flow field design of SOFC not only improves the output performance of the battery, but also the different flow channel structures will lead to different pressure drops within the flow channels. An increase in pressure drop will result in an increase in power loss for transporting the reaction gas, reducing the net power density of the fuel cell. Therefore, it is necessary to analyze the power loss caused by the pressure drop between the inlet and outlet of the SOFC. The relationship between power loss and related physical quantities can be derived by the following expression:
Fig. 8 shows the pressure drop and net power density for different flow channels. It can be observed that the pressure drop of SBFF and MSBFF is significantly higher than that of TPFF, but the net power density of both SBFF and MSBFF is greater than that of TPFF. SBFF and MSBFF can increase the gas diffusion time by means of a dense and interconnected microchannel network, thereby promoting the diffusion of gas to the TPB and reducing local concentration polarization compared to TPFF. So, the electrochemical efficiencies of SBFF and MSBFF have been significantly enhanced. However, the complex geometric configurations of SBFF and MSBFF result in a significant increase in the complexity of the flow path. The overall pressure drop is showing an upward trend. The power loss subsequently increased. Although the power losses of SBFF and MSBFF are higher than those of TPFF, compared to sacrificing some fluidic performance in exchange for the improvement of electrochemical performance, the power loss is slight. The net power density of SBFF and MSBFF has increased by 13.75% and 16.20%, respectively compared to TPFF.
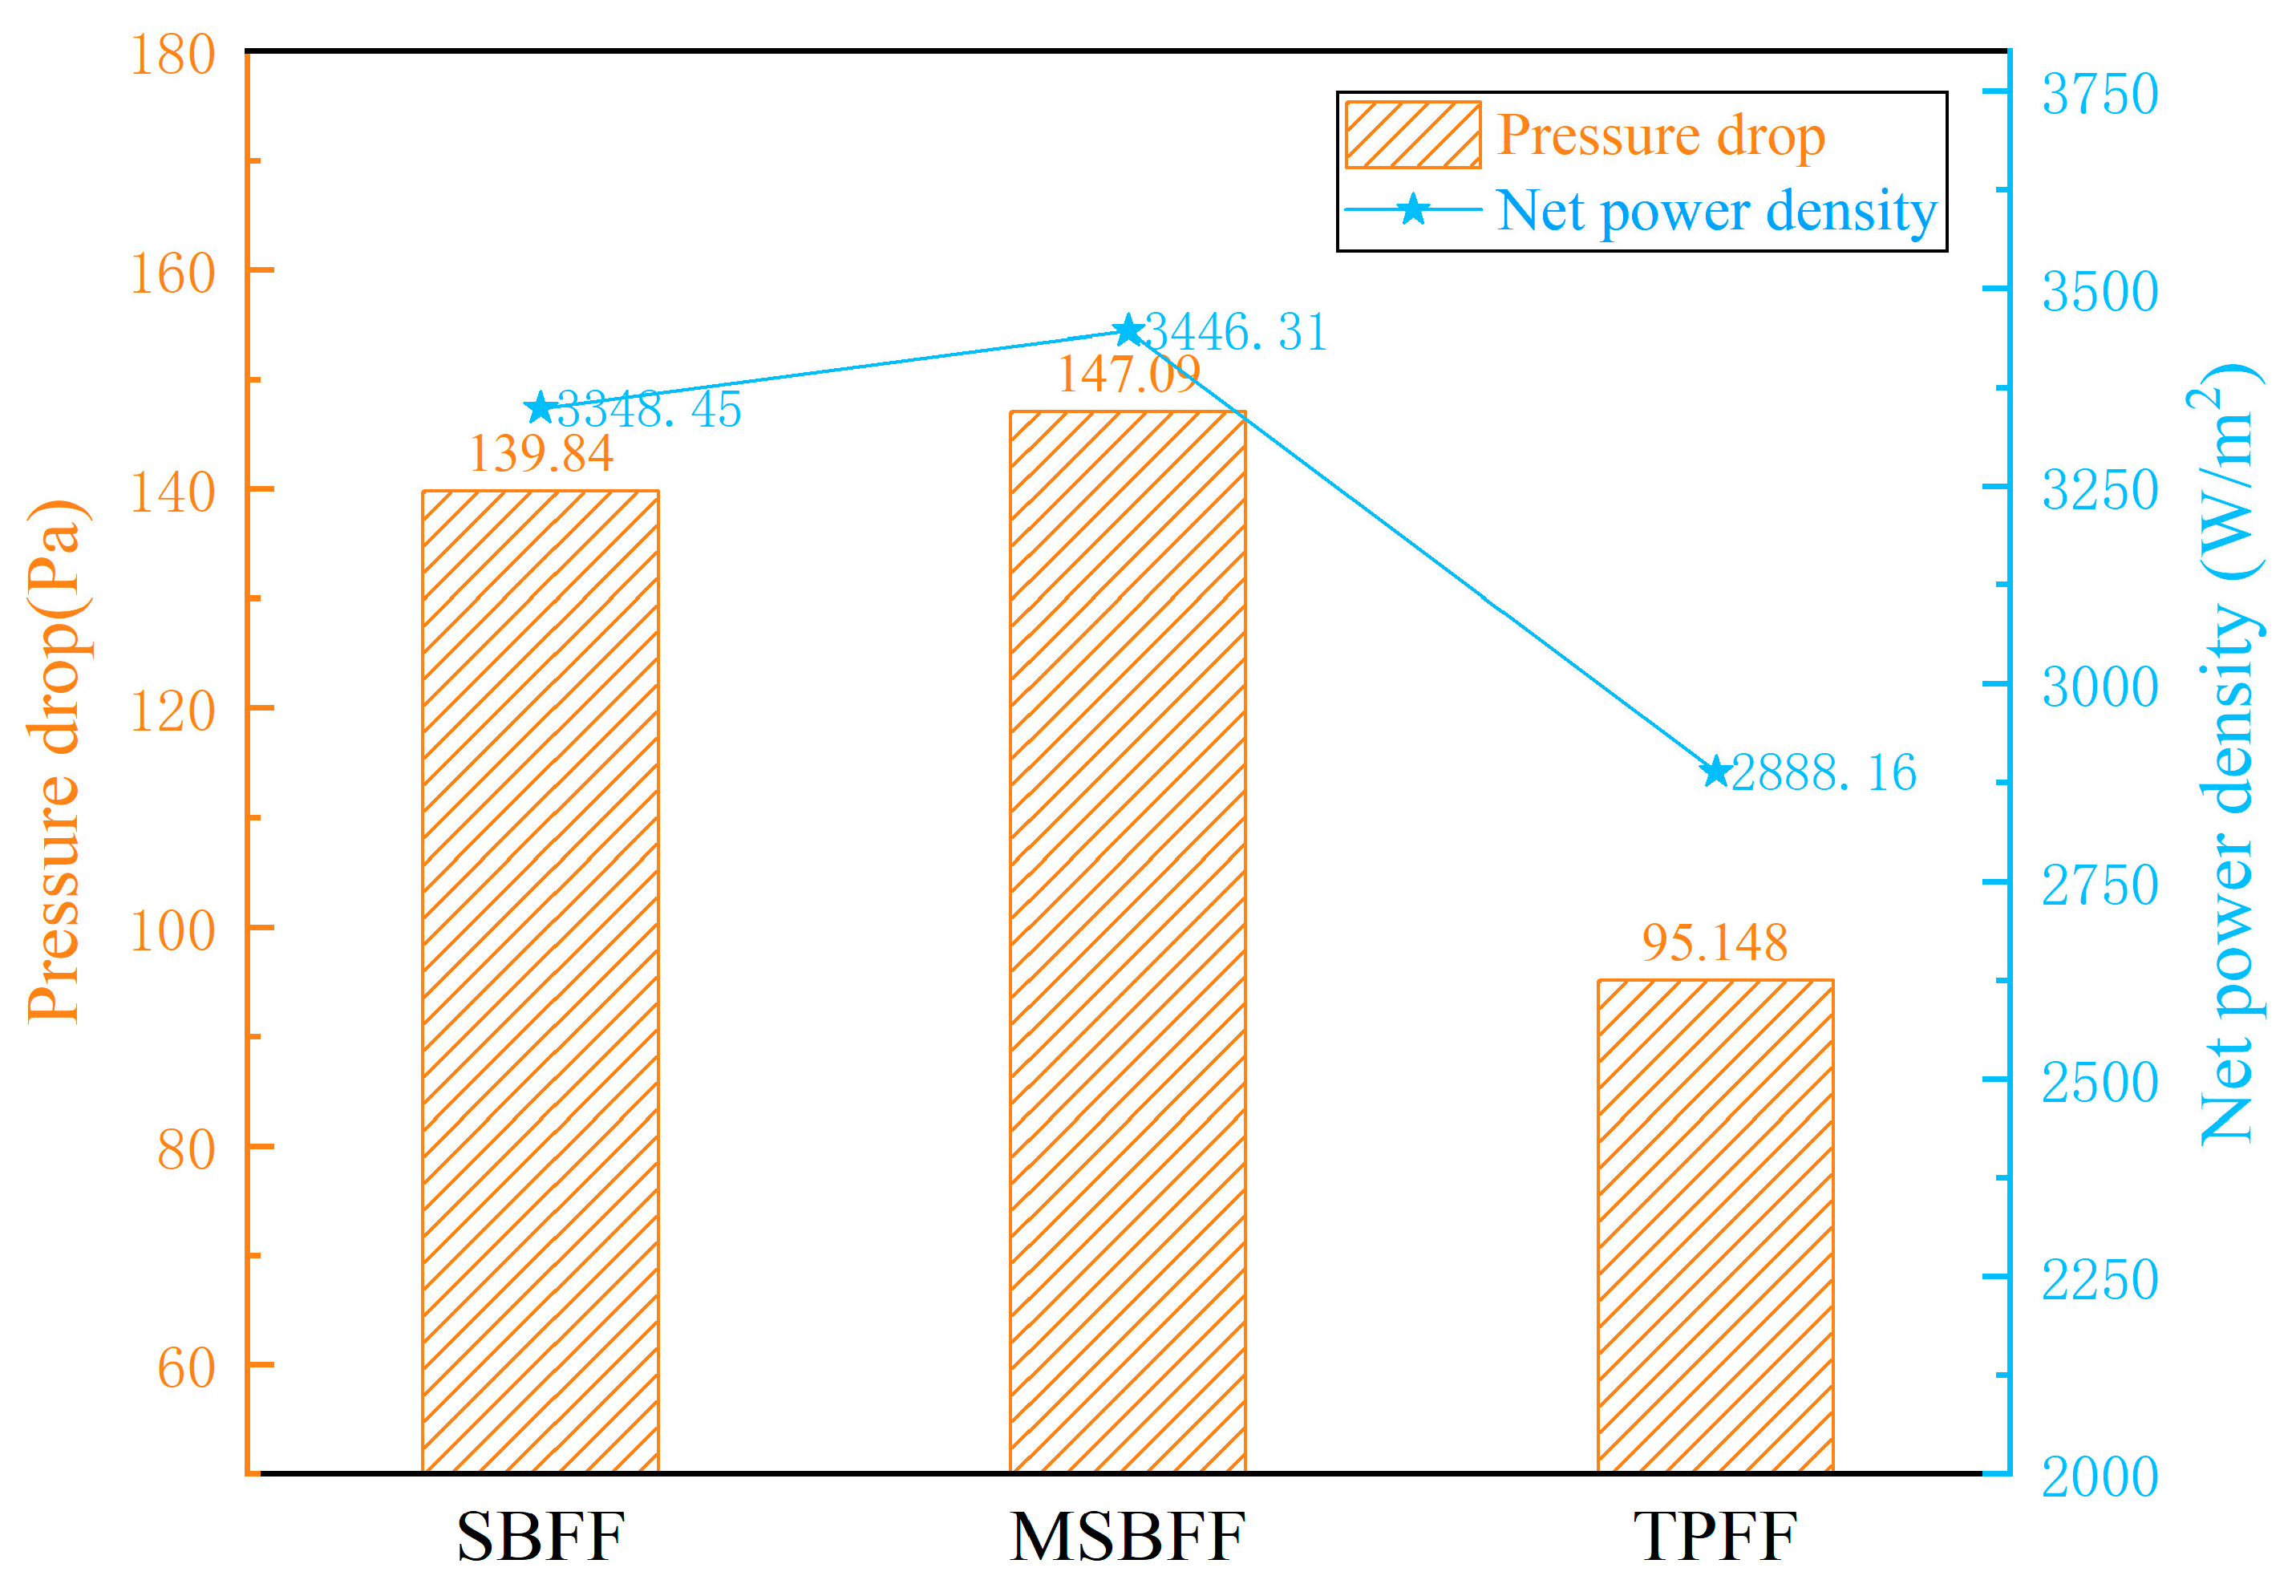
Figure 8: Pressure drop and net power density for the different flow fields.
Temperature is one of the critical factors affecting the electrochemical reaction and material diffusion of SOFC. Fig. 9 illustrates the temperature distribution of SBFF, MSBFF and TPFF when the operating voltage is 0.7 V. The increase in temperature is due to the heat resulting from entropy generation, and cell polarization, including cell resistance (ionic and electronic) along with the electrochemical reaction activation.

Figure 9: Temperature distribution of different flow fields: (a) SBFF; (b) MSBF; (c) TPFF.
As can be seen from Fig. 9, the temperature constantly rose along the direction of gas flow and achieved the maximum value near the exit area. The reaction activity at the entrance of the flow field was weak, and the heat release was low. Furthermore, the gas flow had a specific cooling effect on the SOFC, so the lowest temperature occurs near the inlet. Fig. 10a represents the average temperature of the electrolytes for different flow fields at different operating voltages. The average temperature of TPFF increased substantially faster than the SBFF and MSBFF. When the operating voltage is 0.7 V, a reduction in average electrolyte temperature by 3.22% for the SBFF and 2.92% for the MSBFF. As can be seen from Fig. 10b, the electrolyte temperature difference of the TPFF is the maximum, and the temperature difference of the electrolyte in TPFF increased by 70.63% and 65.44% relative to the SBFF and MSBFF, respectively. Fig. 10c depicts the electrolyte temperature gradient for different flow fields at different operating voltages. The electrolyte temperature gradients of the bionic flow fields were significantly below the TPFF. The temperature-related main characteristic parameters of MSBFF were increased to some extent compared to SBFF, but these parameters were significantly lower than those of TPFF. However, MSBFF has some extent in terms of current density and power density as compared to SBFF.
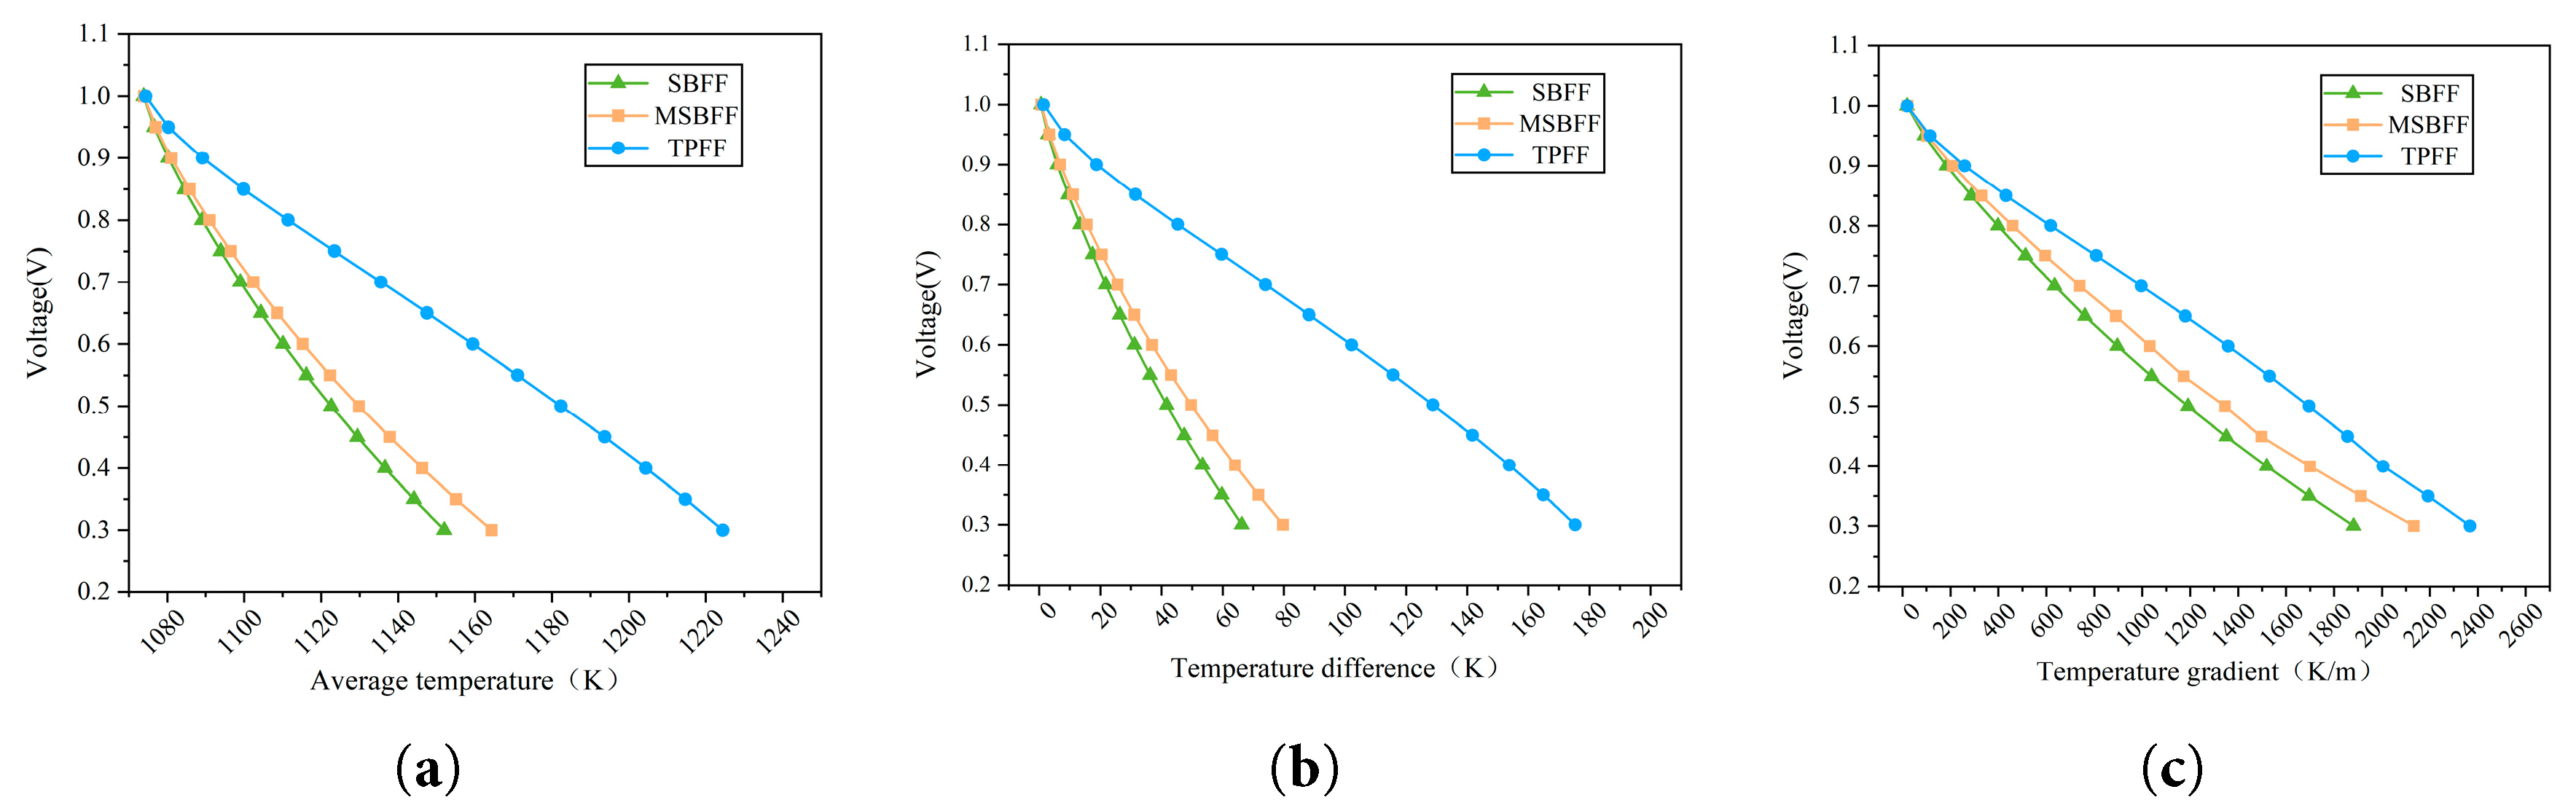
Figure 10: Electrolyte temperature-related parameters of different flow fields at different operating voltages: (a) Average temperature; (b) Temperature difference; (c) temperature gradient.
3.3 Effect of Different Numbers of Fibonacci Spiral Flow Channels on SOFC Performance
Based on the above analysis, the MSBFF shows excellent overall performance. In this section, the effect of different numbers of Fibonacci spiral flow channels on SOFC performance was studied with MSBFF as an example. The number of Fibonacci spiral channels outside the annular flow channels in MSBFF was varied, as shown in Fig. 11. The MSBFF with 8 pairs of spiral channels is depicted in Fig. 11a. The MSBFF with 12 pairs of spiral channels (MSBFF-12) and 16 pairs of spiral channels (MSBFF-16) are illustrated in Fig. 11b,c. The polarization and power density curves of different bionic channels are shown in Fig. 11.

Figure 11: MSBFF design with different numbers of Fibonacci spiral flow channels: (a) MSBFF, (b) MSBFF-12, (c) MSBFF-16.
As can be seen from Fig. 12, when the voltage is above 0.6 V, the effect of different runner structures on current density and peak power density is tiny. When the voltage is below 0.6 V, the influence of varying flow field structures on the current density and peak power density gradually enlarges. At the same operating voltage, MSBFF-16 can provide the maximum current density and peak power density, so MSBFF-16 has the best electrochemical performance. At an operating voltage of 0.7 V, MSBFF-16 exhibited a current density increase of 1.27% and 0.94% over MSBFF and MSBFF-12, respectively. Likewise, peak power density improved by 2.69% and 1.67%. Therefore, MSBFF-16 can effectively enhance SOFC performance. SOFC performance was optimized as the number of Fibonacci spiral flow channels.
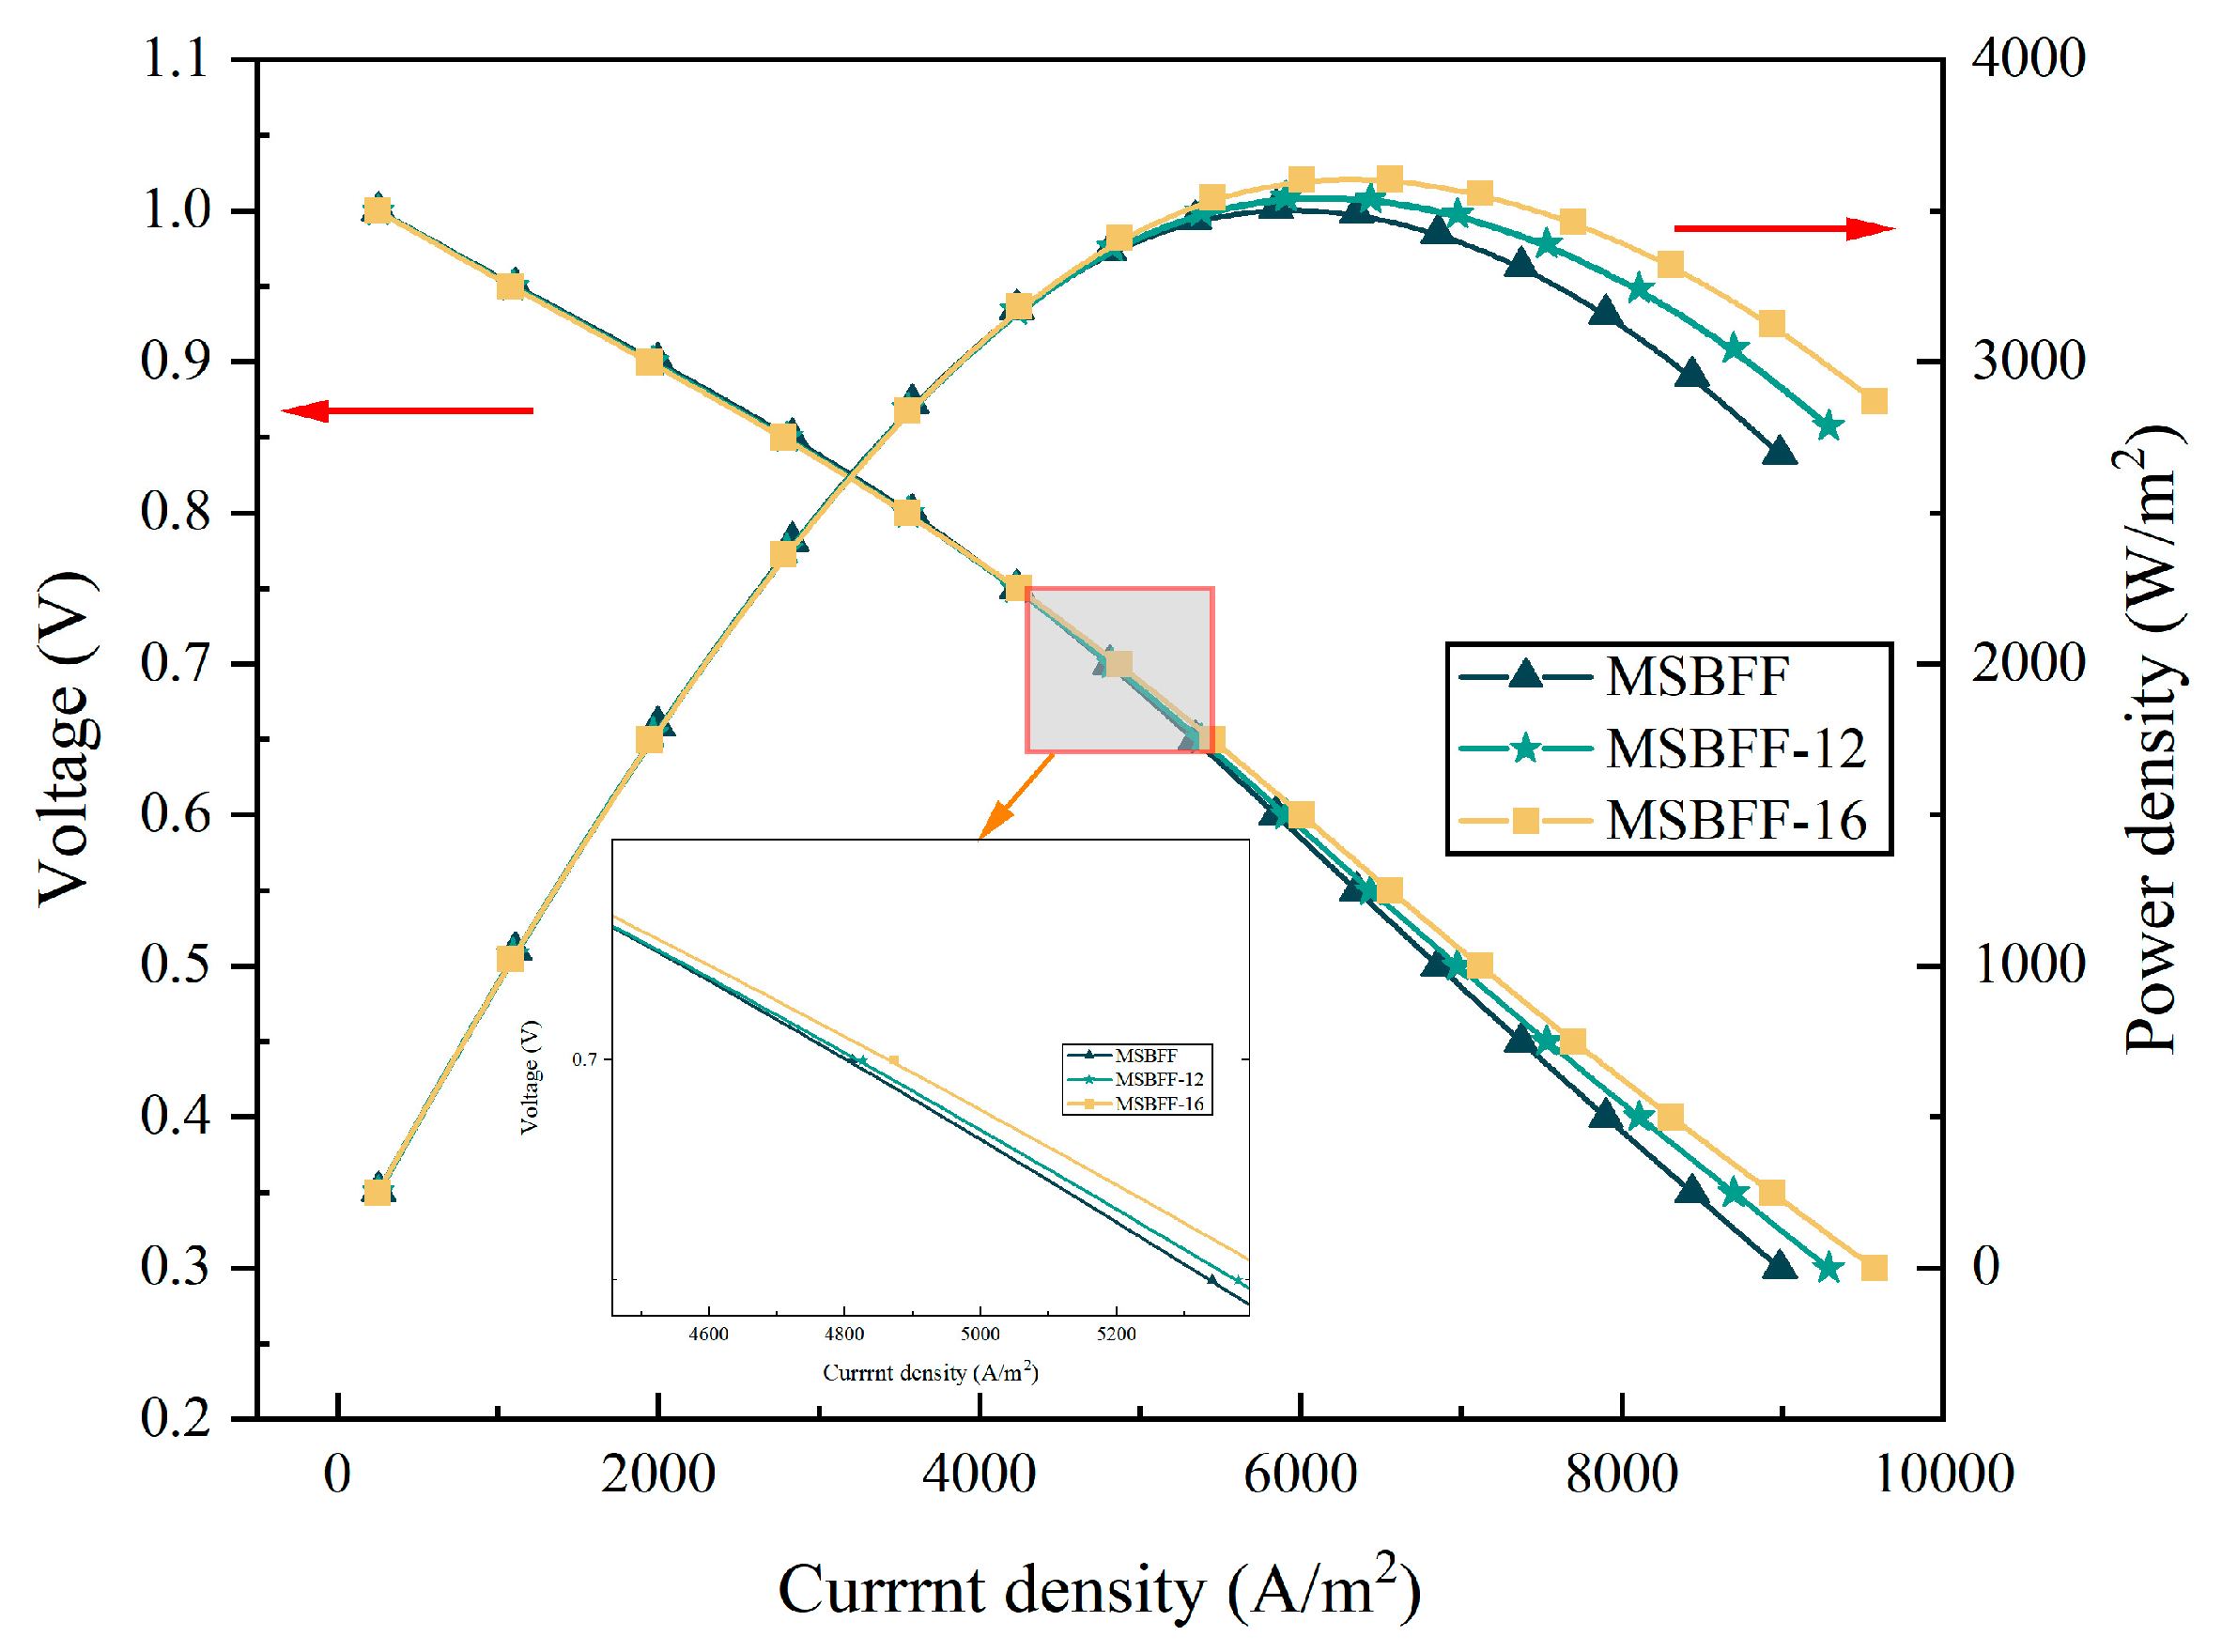
Figure 12: Polarization and power density curves of the different MSBFFs.
Fig. 13 shows the oxygen concentration distribution of different MSBFFs. As the electrochemical reaction continued, large amounts of oxygen were consumed at the inlet of the flow channels, resulting in a low molar concentration of oxygen near the outlet. Through comparative analysis, as the number of Fibonacci spiral flow channels declined, more and more low-oxygen concentration areas appeared, indicating an inadequate provision of oxygen to these areas. Compared with other structures, MSBFF had the most regions of low oxygen concentration. This phenomenon is because the contact area between the flow channel and the electrode surface was reduced in the MSBFF configuration. The ability of oxygen convection between adjacent subcostal channels was weaker. Therefore, the electrochemical reaction wasn’t intense enough. The current density was relatively minor.
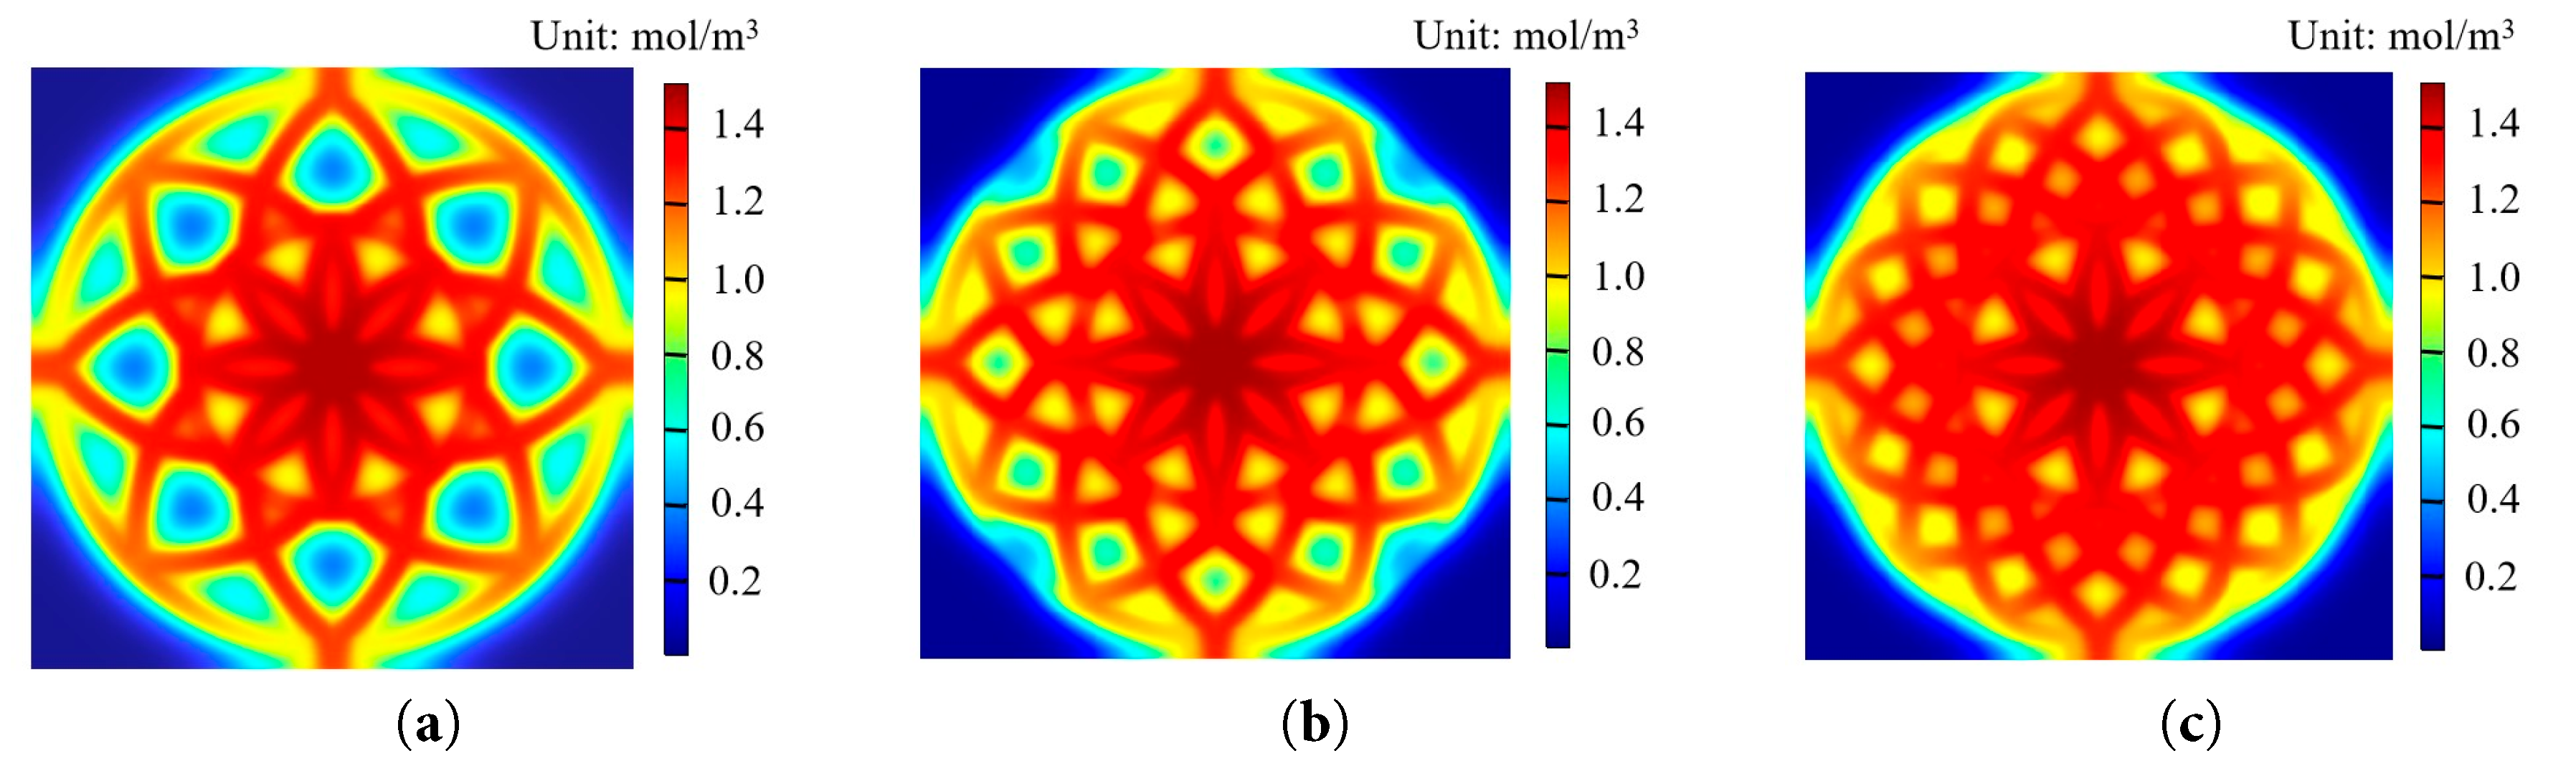
Figure 13: Oxygen concentration distribution of different MSBFFs: (a) MSBFF; (b) MSBFF-12; (c) MSBFF-16.
The oxygen distribution directly affects the electrochemical reaction rate of the electrolyte layer. To quantitatively analyze the differences between different structures, the average oxygen concentration distribution and non-uniformity index of the various structures were obtained, as shown in Fig. 14. With the increase of the number of Fibonacci spiral flow channels, the average molar concentration of oxygen in the cathode-electrolyte area grew, and the oxygen non-uniformity index declined. The average oxygen concentration of MSBFF-16 is 0.95 mol/m3, and the non-uniformity index of MSBFF-16 is 0.50. Compared with MSBFF and MSBFF-12, the average oxygen molar concentration at the cathode-electrolyte area of MSBFF-16 was increased by 12.63% and 6.32%, respectively, and the non-uniformity index of MSBFF-16 was decreased by 7.41% and 5.66%, respectively. Therefore, an increase in the number of Fibonacci spiral channels can achieve a more uniform distribution of oxygen, and more oxygen effectively participates in the reaction, further promoting the performance of SOFCs.

Figure 14: Average oxygen molar concentration and non-uniform index value for different MSBFFs.
Fig. 15 exhibits the current density distribution of the different MSBFFs at an operating voltage of 0.7 V. The results indicated that the current density area increased with the number of Fibonacci spiral flow channels. MSBFF-12 and MSBFF-16 can raise the effective reaction area, and the current densities were amplified. Therefore, MSBFF-12 and MSBFF-16 had larger current density areas. This phenomenon was consistent with the law of oxygen distribution.
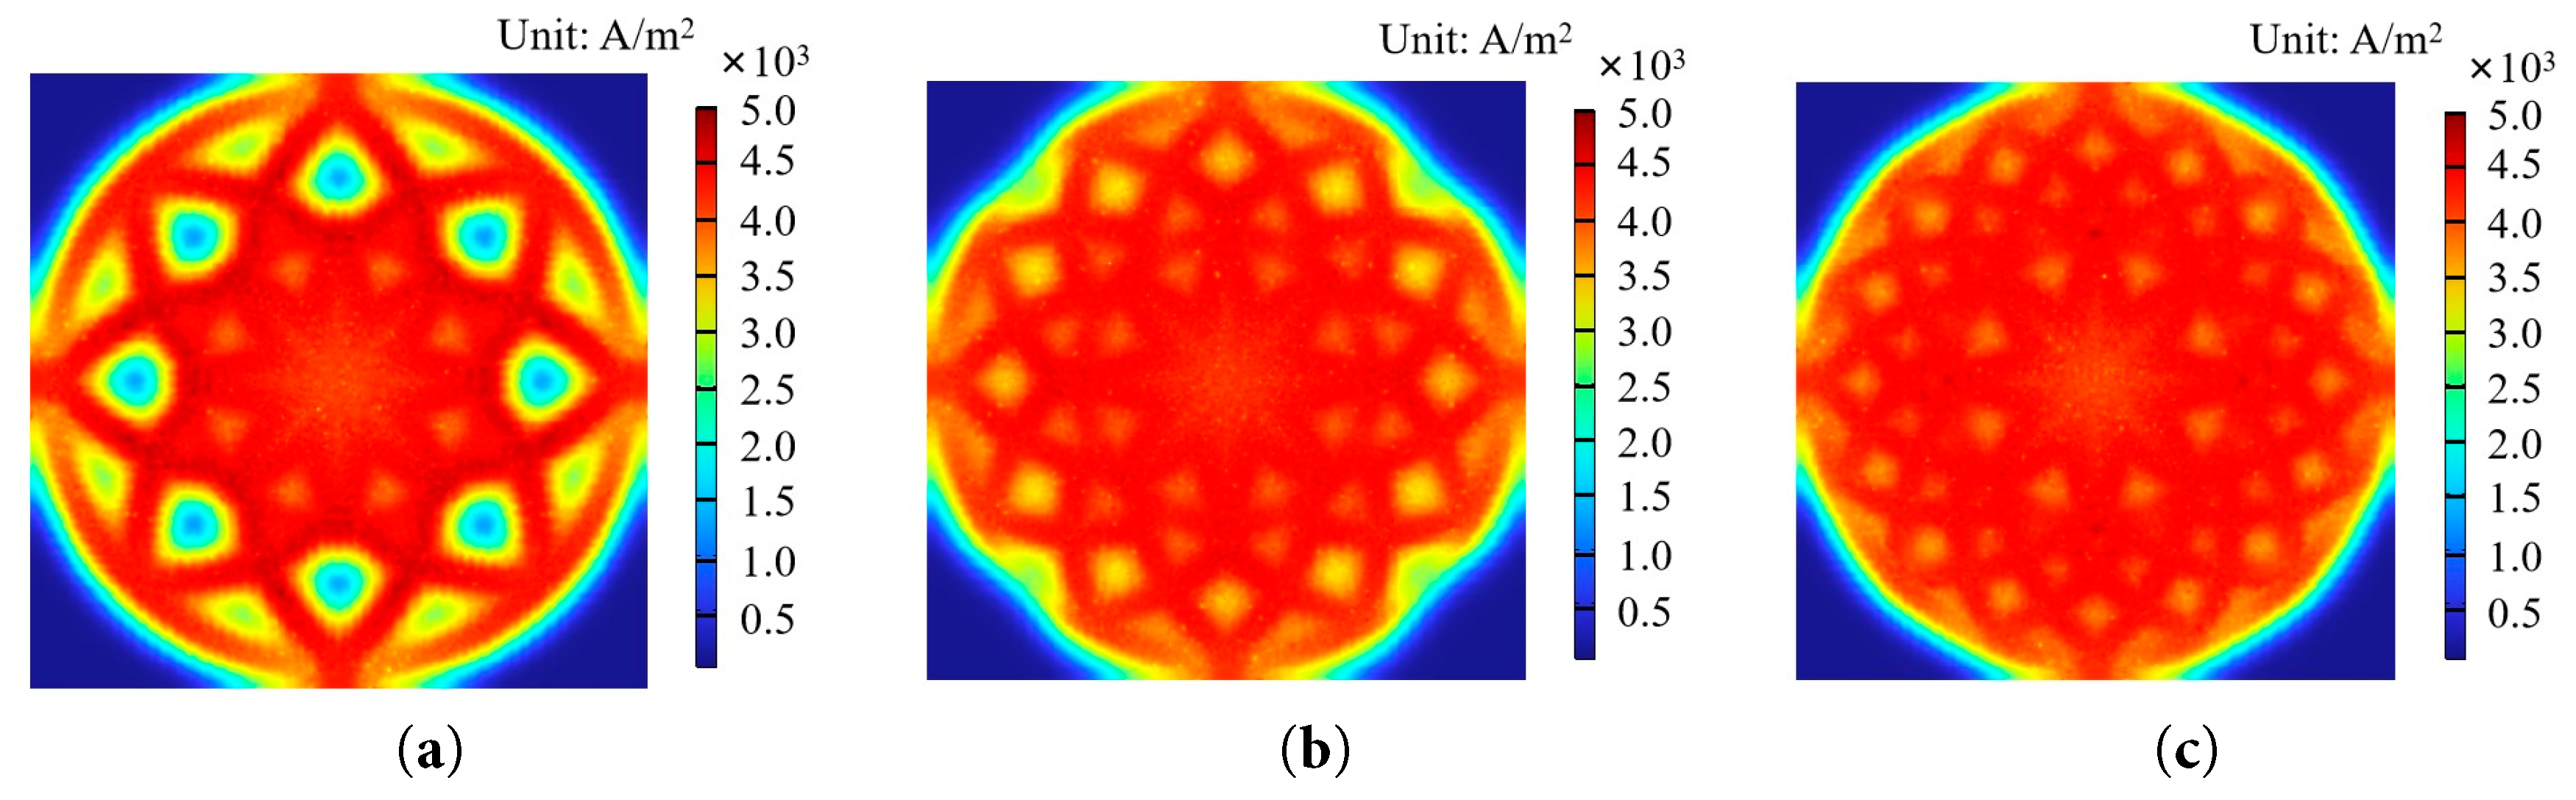
Figure 15: Current density distribution for different MSBFFs: (a) MSBFF, (b) MSBFF-12, (c) MSBFF-16.
When the operating voltage is 0.7 V, the temperature distributions of the different MSBFFS are shown in Fig. 16, and the main characteristic parameters of the electrolyte temperature are listed in Table 5. The uninvolved reactions can absorb the heat generated by the reactions. Therefore, the temperature of the SOFC continues to rise along the direction of the gas flow, reaching its maximum near the outlet of the flow channels. The flow channel of the MSBFF-16 had a wide contact area with the electrode surface, and the oxygen molar concentration was relatively higher. Electrochemical reactions were accelerated, causing more heat to be released. Therefore, MSBFF-16 had the highest temperature difference and temperature gradient compared to MSBFF and MSBFF-12. However, MSBFF-16 exhibited 63.57% and 19.15% reductions in temperature difference and temperature gradient compared with TPFF at an operating voltage of 0.7 V. The optimization of the flow field design of the interconnect not only improves the power delivery capability of the SOFC but also ensures that the temperature difference stress doesn’t rise significantly. The service life of SOFC is extended.

Figure 16: Temperature distribution for different SBFFs: (a) MSBFF; (b) MSBFF-12; (c) MSBFF-16.
Table 5: The main characteristic parameters of electrolyte temperature at an operating voltage of 0.7 V
| Flow Field | Maximum Temperature (K) | Average Temperature (K) | Temperature Difference (K) | Temperature Gradient (K/m) |
|---|---|---|---|---|
| MSBFF | 1106.30 | 1102.36 | 25.59 | 738.67 |
| MSBFF-12 | 1106.74 | 1102.60 | 26.04 | 758.86 |
| MSBFF-16 | 1107.63 | 1103.31 | 26.98 | 805.51 |
3.4 Effect of Reaction Gas Inlet Mass Fraction Variation on SOFC Performance
The inlet mass fraction of reactant gas has a significant influence on SOFC performance. In this section, MSBFF was studied for the effect of different inlet mass fractions of hydrogen/oxygen on SOFC performance at the operating voltage of 0.7 V. SOFC performance can be evaluated by electrochemical reactions. Electrochemical reactions can be expressed in terms of reactant utilization. The utilization rate [28] of the reactants in the fuel cell can be calculated using Eq. (22).
Fig. 17a represents the main characteristic variables of SOFC performance at different oxygen inlet mass fractions of oxygen. Oxygen mass fractions were varied from 0.15, 0.2 to 0.4. The results showed that the oxygen inlet mass fraction significantly influenced SOFC performance indexes. When the inlet oxygen mass fraction increased from 0.15 to 0.4, the current density significantly increased from 4810.84 A/m2 to 7342.47 A/m2. This rise in current density can be attributed to the enhanced oxygen supply. More oxygen facilitates the rate of electrochemical reactions. The properties of SOFC were enhanced. However, temperature difference and temperature gradient increased significantly with the rise of inlet oxygen mass fraction. Higher thermal stress may be generated. Conversely, the oxygen utilization rate decreased as oxygen concentration increased, dropping from 23.51% to 9.91%. This result indicated that although the oxygen supply of the electrochemical reaction increased, effective oxygen utilization decreased. The reason is that the increase in current density is not directly proportional to the increase in mass flow rate of oxygen, resulting in insufficient participation of excess oxygen in electrochemical reactions. Overall, SOFC performance was significantly dependent on oxygen inlet mass fraction. A higher inlet mass fraction of oxygen improves SOFC characteristics. However, the thermal management of SOFCs will be affected. Furthermore, the effect of different inlet mass fractions of hydrogen on the fuel cell was studied. The main characteristic variables of SOFC performance at different inlet mass fractions of hydrogen are shown in Fig. 17b. Hydrogen mass fractions ranged from 0.4, 0.5 to 0.9.

Figure 17: The main characteristic variables: (a) different inlet mass fractions of oxygen; (b) different inlet mass fractions of hydrogen.
Compared to the variation in the mass fraction of oxygen at the inlet, the SOFC current density only increases slightly when the hydrogen mass fraction increases from 0.4 to 0.9, indicating that the performance of the SOFC is less sensitive to changes in hydrogen concentration. Meanwhile, the temperature difference and temperature gradient of the SOFC increased by only 8.06% and 8.67%, respectively. The variation in inlet hydrogen mass fraction had a relatively minor effect on SOFC thermal management. Hydrogen utilization improved significantly, from 69.30% to 77.34%. This significant improvement indicates that a higher hydrogen inlet mass fraction substantially enhances fuel utilization efficiency, further enhancing SOFC performance and efficiency.
In this study, we proposed a novel biomimetic flow channel structure inspired by sunflower morphology for SOFC. The difference between SBFF, MSBFF, and TPFF was investigated by numerical simulation. The effect of SBFF with different pairs of Fibonacci spiral flow channels on SOFC performance was studied. The main conclusions are shown as follows:
- (1)The bionic flow fields can promote a more uniform distribution of oxygen at the cathode-electrolyte layer interface, and more oxygen was involved in the electrochemical reaction. Therefore, the bionic flow fields can improve the oxygen consumption rate, accelerate the internal electrochemical reaction of SOFC, and further enhance the power delivery capability of SOFC.
- (2)The current density of SBFF and MSBFF increased by13.32% and 15.09%, respectively. The peak power density of SBFF and MSBFF rose by 14.07% and 16.55%, respectively.
- (3)As the number of Fibonacci spiral flow channels increased, the oxygen molar concentration distribution and current density distribution of SOFC became more uniform, and the current density and peak power density of SOFC were significantly increased.
- (4)The MSBFF-16 achieved a 1.27% increase in current density. Likewise, peak power density improved by 2.69%. The MSBFF had lower temperatures and temperature differences than the TPFF.
- (5)The increase in the oxygen inlet mass fraction caused a significant increase in heat transfer characteristics and electrical properties, while the efficiency of oxygen utilization decreased. In contrast, the current density and thermal characteristics of the hydrogen mass fraction were enhanced to a relatively minor extent, while the hydrogen utilization was significantly improved.
Although the SBFF can better enhance the overall performance of solid oxide batteries, the biomimetic flow channel has limitations in SOFC thermal management. In future research, the multi-scale modeling approach will be employed to comprehensively optimize the flow field structure of SOFC from microstructure to macrostructure.
Acknowledgement:
Funding Statement: This work was supported by a grant from National Key R&D Plan of China (Grant No. 2023YFB2504503).
Author Contributions: The authors confirm contribution to the paper as follows: Conceptualization and methodology: Liangxiu Zhang; analysis and interpretation of result: Liangxiu Zhang and Feiteng Cheng; visualization: Feiteng Cheng; writing—original draft preparation: Liangxiu Zhang; writing—review and editing: Liangxiu Zhang, Qinghai Zhao and Feiteng Cheng; resources and supervision: Qinghai Zhao. All authors reviewed the results and approved the final version of the manuscript.
Availability of Data and Materials: The data that support the findings of this study are available from the corresponding author upon reasonable request.
Ethics Approval: Not applicable.
Conflicts of Interest: The authors declare no conflicts of interest to report regarding the present study.
Nomenclatures
| Variables/Letters | Acronyms | |||
| A | activation specific surface areas | MSBFF | modified sunflower bionic flow field | |
| C | molar concentration | PEMFC | proton exchange membrane fuel cell | |
| cp | heat capacity | SBFF | sunflower bionic flow field | |
| Dij | binary gas diffusion coefficients | SOFC | solid oxide fuel cells | |
| Dref | reference diffusion coefficient | TPFF | traditional parallel flow field | |
| E | equilibrium potential difference | Greek Letters | ||
| F | Faraday constant | α | transfer coefficient | |
| Hch | Gas channel height | γ | concentration index | |
| Hic | Interconnect height | δan | Anode thickness | |
| ian/ca | anode/cathode current | δca | Cathode thickness | |
| keff | effective thermal conductivity | δel | Electrolyte thickness | |
| Lin | Inlet diameter | ε | porosity | |
| Lout | Outlet width | ζ | pumping efficiency | |
| Ls | SOFC length | η | overpotential | |
| M | molar mass | μ | fluid viscosity | |
| N | non-uniformity index | ρ | density | |
| p | pressure | σ | effective conductivities | |
| R | molar gas constant | τ | distortion | |
| Si | mass source | ϕ | potential | |
| Sm | mass source term | ω | mass fraction | |
| Su | velocity source | Ψ | power loss | |
| T | temperature | Subscripts and Superscripts | ||
| u | velocity | an | anode | |
| Ur | utilization rate | ca | cathode | |
| Wch | Gas channel width | eff | effective | |
| Ws | SOFC width | el | electrolyte | |
| x | mole fraction | eq | equilibrium | |
| i/j | species i/j | |||
| ref | reference | |||
References
1. Mojaver P, Chitsaz A, Sadeghi M, Khalilarya S. Comprehensive comparison of SOFCs with proton-conducting electrolyte and oxygen ion-conducting electrolyte: thermoeconomic analysis and multi-objective optimization. Energy Conv Manag. 2020;205:112455. doi:10.1016/j.enconman.2019.112455. [Google Scholar] [CrossRef]
2. Huang HT, Lu DC, Li CX, Zhang SL. Advanced design strategies for highly efficient and durable anodes in direct ammonia solid oxide fuel cells. Int J Hydrogen Energy. 2024;87:89–99. doi:10.1016/j.ijhydene.2024.09.010. [Google Scholar] [CrossRef]
3. Hai T, El-Shafay AS, Alizadeh A, Almojil SF, Almohana AI, Alali AF. Employing a booster/ejector-assisted organic flash cycle to heat recovery of SOFC system; exergy and economic-based optimization. Int J Hydrogen Energy. 2023;48(48):18433–53. doi:10.1016/j.ijhydene.2023.01.254. [Google Scholar] [CrossRef]
4. Pesaran A, Hussain AM, Ren YY, Wachsman ED. Optimizing bilayer electrolyte thickness ratios for high-performing low-temperature solid oxide fuel cells. J Electrochem Soc. 2024;171(5):054503. doi:10.1149/1945-7111/ad3c96. [Google Scholar] [CrossRef]
5. Yadav AK, Sinha S, Kumar A. Advancements in composite cathodes for intermediate-temperature solid oxide fuel cells: a comprehensive review. Int J Hydrogen Energy. 2024;59:1080–93. doi:10.1016/j.ijhydene.2024.02.124. [Google Scholar] [CrossRef]
6. Yahya A, Naji H, Dhahri H. A lattice Boltzmann analysis of the performance and mass transport of a solid oxide fuel cell with a partially obstructed anode flow channel. Fuel. 2023;334:126537. doi:10.1016/j.fuel.2022.126537. [Google Scholar] [CrossRef]
7. Xia L, Li XS, Song J, Ren XD, Gu CW. Design and analysis of S-CO2 cycle and radial turbine for SOFC vehicle waste-heat recovery. J Therm Sci. 2023;28(3):559–70. doi:10.1007/s11630-019-1105-9. [Google Scholar] [CrossRef]
8. Ahmed KI, Ahmed MH. Developing a novel design for a tubular solid oxide fuel cell current collector. Appl Sci. 2022;12(12):6003. doi:10.3390/app12126003. [Google Scholar] [CrossRef]
9. Xu Q, Wang CT, Miao FX, Guan WB, Singhal SC. Thermal stress analysis of a solid oxide fuel cell considering interconnect deformation. J Electrochem Soc. 2023;170(8):084502. doi:10.1149/1945-7111/aceb32. [Google Scholar] [CrossRef]
10. Ilbas M, Kumuk B, Alemu MA, Arslan B. Numerical investigation of a direct ammonia tubular solid oxide fuel cell in comparison with hydrogen. Int J Hydrogen Energy. 2020;45(60):35108–17. doi:10.1016/j.ijhydene.2020.04.060. [Google Scholar] [CrossRef]
11. Miao XY, Rizvandi OB, Navasa M, Frandsen HL. Modelling of local mechanical failures in solid oxide cell stacks. Appl Energy. 2021;293:116901. doi:10.1016/j.apenergy.2021.116901. [Google Scholar] [CrossRef]
12. Sayadian S, Ghassemi M, Ahmadi S, Robinson AJ. Numerical analysis of transport phenomena in solid oxide fuel cell gas channels. Fuel. 2022;311:122557. doi:10.1016/j.fuel.2021.122557. [Google Scholar] [CrossRef]
13. Guk E, Venkatesan V, Babar S, Jackson L, Kim JS. Parameters and their impacts on the temperature distribution and thermal gradient of solid oxide fuel cell. Appl Energy. 2019;241:164–73. doi:10.1016/j.apenergy.2019.03.034. [Google Scholar] [CrossRef]
14. Lee S, Oh S, Lee S, Jang H. Development of an ammonia decomposition reactor, afterburner and post-decomposition reactor for 1 kW solid oxide fuel cells using ammonia. Energy Conv Manag. 2024;314:118661. doi:10.1016/j.enconman.2024.118661. [Google Scholar] [CrossRef]
15. Gong CY, Cai SS, Chi B, Tu ZK. Thermodynamic analysis and multi-objective optimization of different gas turbine configuration strategies for an atmospheric SOFC system. Int J Hydrogen Energy. 2024;85:327. doi:10.1016/j.ijhydene.2024.08.348. [Google Scholar] [CrossRef]
16. Ren KD, Su YP, Zhong Z, Jiao ZJ. Microstructure-insight topology optimization for efficient interconnect flow channels in solid oxide fuel cells. Int J Heat Mass Transf. 2025;242:126823. doi:10.1016/j.ijheatmasstransfer.2025.126823. [Google Scholar] [CrossRef]
17. Yadav AK, Sinha S, Kumar A. Comprehensive review on performance assessment of solid oxide fuel cell-based hybrid power generation system. Therm Sci Eng Prog. 2023;46:102226. doi:10.1016/j.tsep.2023.102226. [Google Scholar] [CrossRef]
18. Sevinc H, Hazar H. A novel approach to bipolar plate design in fuel cells with unique flow field geometries. Energy Conv Manag. 2025;343:120237. doi:10.1016/j.enconman.2025.120237. [Google Scholar] [CrossRef]
19. Babay MA, Adar M, Chebak A, Mabrouki M. Exploring the sustainability of serpentine flow-field fuel cell, straight channel PEM fuel cells hight temperature through numerical analysis. Energy Nexus. 2024;514:1002283. doi:10.1016/j.nexus.2024.100283. [Google Scholar] [CrossRef]
20. Hazar H, Yilmaz M, Sevinc H. The effects of different flow field patterns on polymer electrolyte membrane fuel cell performance. Energy Conv Manag. 2021;248:114818. doi:10.1016/j.enconman.2021.114818. [Google Scholar] [CrossRef]
21. Babay MA, Adar M, Chebak A, Mabrouki M. Enhancing proton exchange membrane fuel cell efficiency: optimal tilt angles and airflow dynamics in wedge-shaped flow channels. Fuel. 2025;397:135447. doi:10.1016/j.fuel.2025.135447. [Google Scholar] [CrossRef]
22. Iliev IK, Gizzatullin AR, Filimonova AA, Chichirova ND, Beloev IH. Numerical simulation of processes in an electrochemical cell using COMSOL multiphysics. Energies. 2023;16(21):7265. doi:10.3390/en16217265. [Google Scholar] [CrossRef]
23. Jiang CY, Gu YC, Guan WB, Ni M, Sang JK, Zhong Z. Thermal stress analysis of solid oxide fuel cell with Z-type and Serpentine-type channels considering pressure drop. J Electrochem Soc. 2020;167(4):044517. doi:10.1149/1945-7111/ab79aa. [Google Scholar] [CrossRef]
24. Lee HL, Han NG, Kim MS, Kim YS, Kim DK. Studies on the effect of flow configuration on the temperature distribution and performance in a high current density region of solid oxide fuel cell. Appl Therm Eng. 2022;206:118120. doi:10.1016/j.applthermaleng.2022.118120. [Google Scholar] [CrossRef]
25. Khazaee I, Rava A. Numerical simulation of the performance of solid oxide fuel cell with different flow channel geometries. Energy. 2017;119:235. doi:10.1016/j.energy.2016.12.074. [Google Scholar] [CrossRef]
26. Guo MT, He QJ, Cheng C, Zhao DQ, Ni M. New interconnector designs for electrical performance enhancement of solid oxide fuel cells: a 3D modelling study. J Power Sources. 2022;533:231373. doi:10.1016/j.jpowsour.2022.231373. [Google Scholar] [CrossRef]
27. Chellehbari YM, Adavi K, Amin JS, Zendehboudi S. A numerical simulation to effectively assess impacts of flow channels characteristics on solid oxide fuel cell performance. Energy Conv Manag. 2021;244:114280. doi:10.1016/j.enconman.2021.114280. [Google Scholar] [CrossRef]
28. Canavar M, Timurkutluk B. Design and fabrication of novel anode flow-field for commercial size solid oxide fuel cells. J Power Sources. 2017;346:49–55. doi:10.1016/j.jpowsour.2017.02.020. [Google Scholar] [CrossRef]
29. Kim D, An S, Yeom E. Investigation of cell performance in pin geometry of solid oxide fuel cell considering blower power input. Chem Eng Sci. 2023;282:119350. doi:10.1016/j.ces.2023.119350. [Google Scholar] [CrossRef]
30. Gong CY, Tu ZK, Chan SH. A novel flow field design with flow re-distribution for advanced thermal management in Solid oxide fuel cell. Appl Energy. 2023;331:120364. doi:10.1016/j.apenergy.2022.120364. [Google Scholar] [CrossRef]
31. Xia L, Khosravi A, Han MF, Sun L. Artificial intelligence based structural optimization of solid oxide fuel cell with three-dimensional reticulated trapezoidal flow field. Int J Hydrogen Energy. 2023;48(72):28131–49. doi:10.1016/j.ijhydene.2023.03.392. [Google Scholar] [CrossRef]
32. Osman S, Ahmed K, Nemattalla M, Ookawara S, Ahmed M. Performance and thermal stresses in functionally graded anode-supported honeycomb solid-oxide fuel cells. Int J Hydrogen Energy. 2021;46(65):33010–27. doi:10.1016/j.ijhydene.2021.07.131. [Google Scholar] [CrossRef]
33. Quach TQ, Kim YS, Lee DK, Ahn KY, Lee SY, Bae Y. Thermal management of ammonia-fed solid oxide fuel cells using a novel alternate flow interconnector. Energy Conv Manag. 2023;291:117248. doi:10.1016/j.enconman.2023.117248. [Google Scholar] [CrossRef]
34. Dong SK, Jung WN, Rashid K, Kashimoto A. Design and numerical analysis of a planar anode-supported SOFC stack. Renew Energy. 2016;94:637–50. doi:10.1016/j.renene.2016.03.098. [Google Scholar] [CrossRef]
35. Kong W, Han Z, Lu SY, Gao X, Wang XR. A novel interconnector design of SOFC. Int J Hydrogen Energy. 2020;45(39):20329–38. doi:10.1016/j.ijhydene.2019.10.252. [Google Scholar] [CrossRef]
36. Yan M, Fu P, Li X, Zeng M, Wang QW. Mass transfer enhancement of a spiral-like interconnector for planar solid oxide fuel cells. Appl Energy. 2015;160:954–64. doi:10.1016/j.apenergy.2015.03.115. [Google Scholar] [CrossRef]
37. Saied M, Ahmed K, Nemat-Alla M, Ahmed M, El-Sebaie M. Performance study of solid oxide fuel cell with various flow field designs: numerical study. Int J Hydrogen Energy. 2018;43(45):20931–46. doi:10.1016/j.ijhydene.2018.09.034. [Google Scholar] [CrossRef]
38. Fu QR, Li ZY, Wei W, Liu FX, Xu XF, Liu ZJ. Performance enhancement of a beam and slot interconnector for anode supported SOFC stack. Energy Conv Manag. 2021;241:114277. doi:10.1016/j.enconman.2021.114277. [Google Scholar] [CrossRef]
39. Li M, Huang Z, Yan D, Jia LC, Zhang WY. Investigation of the effect of sinusoidal flow channel structures on the steady state and transient characteristics of SOFC. Int J Hydrogen Energy. 2025;136:477–90. doi:10.1016/j.ijhydene.2025.04.516. [Google Scholar] [CrossRef]
40. Rostami L, Haghshenasfard M, Sadeghi M, Zhiani M. A 3D CFD model of novel flow channel designs based on the serpentine and the parallel design for performance enhancement of PEMFC. Energy. 2022;258:124726. doi:10.1016/j.energy.2022.124726. [Google Scholar] [CrossRef]
41. Li N, Wang WT, Xu RY, Zhang JH, Xu HP. Design of a novel nautilus bionic flow field for proton exchange membrane fuel cell by analyzing performance. Int J Heat Mass Transf. 2023;200:123517. doi:10.1016/j.ijheatmasstransfer.2022.123517. [Google Scholar] [CrossRef]
42. Xia L, Yu ZT, Xu GP, Ji SB, Sun B. Design and optimization of a novel composite bionic flow field structure using three-dimensional multiphase computational fluid dynamic method for proton exchange membrane fuel cell. Energy Conv Manag. 2021;247:114707. doi:10.1016/j.enconman.2021.114707. [Google Scholar] [CrossRef]
43. Zhang SY, Yang QG, Xu HT, Mao YJ. Numerical investigation on the performance of PEMFC with rib-like flow channels. Int J Hydrogen Energy. 2022;47(85):36254–63. doi:10.1016/j.ijhydene.2022.08.185. [Google Scholar] [CrossRef]
44. Xu Y, Cai S, Chi B, Tu Z. Optimal design and performance enhancement based on field synergy theory in a solid oxide electrolysis cell with blockage flow channel. Electrochim Acta. 2024;479:143842. doi:10.1016/j.electacta.2024.143842. [Google Scholar] [CrossRef]
45. Zhang WY, Zhang WC, Kuang X, Jia LC, Yan D. Numerical optimization of obstacles channel geometry for solid oxide fuel cells. Int J Hydrogen Energy. 2023;48(97):38438–53. doi:10.1016/j.ijhydene.2023.06.140. [Google Scholar] [CrossRef]
46. Timurkutluk B, Ucar E. Development of high performance and low-cost solid oxide fuel cell stacks: numerical optimization of flow channel geometry. Int J Energy Res. 2021;45(15):20634–50. doi:10.1002/er.7129. [Google Scholar] [CrossRef]
47. Zhang B, Wang YZ, Zheng JP, Liu D. Study on buildings CCHP system based on SOFC. Fluid Dyn Mater Process. 2020;16(3):665–74. doi:10.32604/fdmp.2020.09314. [Google Scholar] [CrossRef]
48. Raj A, Sasmito AP, Shamin T. Numerical investigation of the effect of operating parameters on a planar solid oxide fuel cell. Energy Conv Manag. 2015;90:138–45. doi:10.1016/j.enconman.2014.10.055. [Google Scholar] [CrossRef]
49. Park JM, Kim DY, Baek JD, Yoon YJ, Su PC, Lee SH. Effect of electrolyte thickness on electrochemical reactions and thermo-fluidic characteristics inside a SOFC unit cell. Energies. 2018;11(3):473. doi:10.3390/en11030473. [Google Scholar] [CrossRef]
50. Liu HC, Yang WM, Tan J, An Y, Cheng LS. Numerical analysis of parallel flow fields improved by micro-distributor in proton exchange membrane fuel cells. Energy Conv Manag. 2018;176:99–109. doi:10.1016/j.enconman.2018.09.024. [Google Scholar] [CrossRef]
Cite This Article
 Copyright © 2025 The Author(s). Published by Tech Science Press.
This work is licensed under a Creative Commons Attribution 4.0 International License , which permits unrestricted use, distribution, and reproduction in any medium, provided the original work is properly cited.
 Downloads
 Citation Tools