
 Submit a Paper
 Propose a Special lssue
 Open Access
ARTICLE

CO2 Injection to Mitigate Reservoir Damage in Edge/Bottom-Water Condensate Gas Reservoirs
1 State Key Laboratory of Oil and Gas Reservoir Geology and Exploitation, Southwest Petroleum University, Chengdu, 610500, China
2 PetroChina Xinjiang Oilfield Company, Karamay, 834000, China
3 PetroChina Jidong Oilfield Company, Tangshan, 063299, China
* Corresponding Author: Wen Wang. Email:
(This article belongs to the Special Issue: Fluid and Thermal Dynamics in the Development of Unconventional Resources III)
Fluid Dynamics & Materials Processing 2025, 21(9), 2331-2357. https://doi.org/10.32604/fdmp.2025.068990
Received 11 June 2025; Accepted 11 September 2025; Issue published 30 September 2025
 View Full Text
 Download PDF
Abstract
Condensate gas reservoirs have attracted increasing attention in recent years due to their significant development potential and dual value from both natural gas and condensate oil. However, their exploitation is often hindered by the dual challenges of retrograde condensation and water invasion, which can markedly reduce recovery factors. CO2 injection offers a promising solution by alleviating condensate blockage, suppressing water influx, and simultaneously enabling geological CO2 storage. Accordingly, research on optimizing CO2 injection to mitigate formation damage is critical for the efficient development and management of edge- and bottom-water condensate gas reservoirs. In this study, a long-core displacement mechanism model was constructed using CMG-GEMTM and WinPropTM. The model simulates reservoir depletion from initial conditions (41.2 MPa, 102.5°C) to the current reservoir pressure (13.5 MPa), followed by gas injection. It was then upscaled to the edge- and bottom-water reservoir scale to capture complex fluid phase behavior, enabling a multi-factor coupled optimization of CO2 injection strategies. Model reliability was verified through comparison with core experimental results. Subsequently, the effects of geological parameters (e.g., reservoir permeability and rhythmic heterogeneity) and engineering parameters (e.g., injection pressure and rate) on reservoir performance were systematically evaluated. The results indicate that appropriate target zone selection and optimization of injection pressure and rate—avoiding formation fracturing and preventing gas channeling—can substantially improve reservoir development outcomes. Applying this approach to the K Gas Reservoir, the optimal strategy involved injecting CO2 at a rate of 5 × 10⁴ m3/d, restoring pressure to 22.5 MPa in a composite rhythmic reservoir with an average permeability of 10 mD. This scheme increased the condensate oil recovery factor by 18.7 percentage points (from 43.9% to 60.9%) while reducing the water-cut rise rate by approximately 34%.Keywords
In recent years, the global transition in energy structure and the pursuit of carbon neutrality have driven a surge in demand for clean energy sources such as natural gas [1,2,3], while the high-value condensate oil from condensate gas reservoirs has further enhanced the economic viability of their development [4,5,6,7]. However, developing condensate gas reservoirs faces two core challenges: First, retrograde condensation phenomena caused by declining reservoir pressure [8,9,10,11]. Condensate dropout near the wellbore blocks pores, reducing gas relative permeability. Second, water blocking effects triggered by edge/bottom water invasion, exacerbating gas well productivity decline and water cut rise [12,13,14]. Together, these factors lead to ultimate recovery factors for condensate gas reservoirs generally lower than those of conventional gas reservoirs, with condensate oil recovery factors in some reservoirs even falling below 30% [15], highlighting an urgent need for improved development efficiency [16,17].
Addressing these challenges, CO2 injection technology has emerged as a research hotspot due to its multi-functional benefits [18,19,20,21]. When injected into a condensate gas reservoir, CO2 mitigates retrograde condensate damage through physico-chemical mechanisms [22,23,24]: Condensate gas reservoir fluids exhibit complex phase behavior, existing as gas under initial reservoir conditions. As pressure drops below the dew-point pressure, heavy hydrocarbon components (C7+) drop out as liquid condensate. CO2 dissolves into condensate, reducing its viscosity and altering its phase behavior, promoting the revaporization of the dropped-out liquid (the vaporizing effect). Several researchers have conducted experiments on CO2 injection for condensate damage removal. Al-Abri et al. [25] performed high-pressure core flooding experiments, finding that after injecting supercritical CO2 (SCCO2), the relative permeabilities of both SCCO2 and condensate oil improved due to reduced interfacial tension and viscosity from CO2 dissolution, which provided favorable flow conditions and a more stable displacement front. The maximum condensate recovery was achieved with pure SCCO2 injection, reaching 80% of the condensate-in-place. Liu et al. [26] conducted evaluation experiments for retrograde condensate remediation, discovering that CO2 injection increased gas relative permeability and alleviated condensate blockage; injection of methane and CO2 reduced condensate damage by approximately 80.62%. Wang [27] performed long-core displacement experiments, demonstrating that CO2 injection significantly reduces residual oil viscosity and enhances mobility through strong swelling effects and efficient vaporizing capacity. It vaporizes residual oil into the gas phase and synergistically triggers the reverse condensation process—when the enriched gas mixture migrates to low-pressure zones, condensate re-drops out, effectively reducing residual oil saturation. These studies confirm that when pressure falls below the dew point, condensate saturation increases significantly near the wellbore, reducing permeability and creating an “oil blocking” effect that severely constrains productivity. CO2 injection can markedly reduce condense saturation, slow the decline in dew-point pressure, reduce oil-gas interfacial tension, and improve displacement efficiency.
However, experiments have limitations [18]: First, high costs hinder comprehensive sensitivity analysis of multiple parameters (e.g., varying permeability, heterogeneity, injection rates), and results can be stochastic due to core sample heterogeneity, leading to poor repeatability. Second, replicating exact reservoir high-pressure and high-temperature conditions is difficult, causing deviations in simulating supercritical CO2 phase behavior and dynamic miscibility processes with the oil. Third, real-time observation of condensate distribution, migration, and removal within microscopic pores is challenging with conventional methods like CT scanning. Despite these limitations, experiments provide essential data (recovery, pressure, fluid composition changes). Numerical simulation of long-core displacement models is used to validate and calibrate parameters using this experimental data. By matching experimental recovery, pressure gradients, and breakthrough times, key parameters like relative permeability curves, diffusion coefficients, and minimum miscibility pressure (MMP) can be history matched, ensuring model reliability in front advancement, recovery dynamics, and pressure response. Several researchers have successfully matched experiments with numerical models. Su et al. [28] used CMG modeling, finding good agreement between experimental results and PVT properties predicted by a tuned equation of state based on CVD and CCE tests, demonstrating the composite method successfully reproduced initial reservoir fluid phase behavior with acceptable accuracy. Hou et al. [29] used CMG software to match P-V relations, dew-point pressure, gas-oil ratio, condensate density, retrograde liquid volume, and P-T phase diagrams, finding calculated values very close to experimental data with relative errors below 4%. Ahmed et al. [30] used Artificial Neural Networks to build predictive models for CVD test performance, evaluated using root mean square error and correlation coefficient, achieving fits above 94.8%. Therefore, history matching is essential and critical [31,32].
Concurrently, the water blocking effect induced by edge/bottom water invasion is equally significant. Water influx not only reduces gas relative permeability but also forms zones of high water saturation through capillary pressure adsorption, further exacerbating wellbore blockage [33,34,35]. CO2 injection can suppress water influx while enabling CO2 storage: CO2-water mixtures exhibit increased density, creating a “gas-water gravity segregation” effect that delays water coning. Simultaneously, CO2 is stored in the formation via dissolution, residual trapping, and hydrodynamic trapping, achieving carbon reduction. Studies show CO2 injection can increase the CO2 storage ratio in condensate gas reservoirs to over 30%, offering combined economic and environmental benefits [36,37,38]. Due to the vastly smaller scale of laboratory cores compared to actual reservoirs, which cannot fully replicate subsurface heterogeneity (e.g., fractures, pore structure variations), the long-core numerical model was upscaled to a 3D full-field reservoir simulation model. This model accounts for the dual effects of retrograde condensation and water influx to simulate different development scenarios and output optimal injection strategies. Narinesingh et al. [39] used CMG-GEM to model a gas reservoir, finding injection pressure promotes revaporization of retrograde condensate, increasing condensate oil recovery factor by 16%. Shen et al. [24] utilized a history-matched CMG reservoir model to study condensate recovery changes under CO2 injection rates from 0 to 100,000 SCM/D, identifying 1000 SCM/D as the optimal rate maximizing condensate oil recovery factor improvement at 28.9%. Wang et al. [40] established a CO2 injection numerical model using CMG-GEM to investigate the impact of injection rate, pressure, and volume on condensate recovery and CO2 storage, ultimately optimizing parameters: injection rate 7000 m3/d, injection volume 0.43 hydrocarbon pore volume (HCPV), and injection pressure 32 MPa. Zhao et al. [41] coupling a multiphase flow model with a retrograde condensate damage model, found that under low permeability (<5 mD) conditions, increasing formation permeability reduces the condensate dropout radius, significantly enhances gas flow capacity, and reduces skin factor by 9.91%. Wang et al. [42] performed simulations in reservoirs with different rhythmic sequences, discovering that inverse rhythmic reservoirs offer the best CO2 storage efficiency, while positive rhythmic reservoirs yield the highest recovery. Thus, inverse rhythmic reservoirs are preferred for storage-dominated objectives, while positive rhythmic reservoirs are optimal for displacement-focused goals. Hu et al. [43] developed a three-dimensional numerical model to accurately simulate the flow behavior of carbon dioxide in highly heterogeneous carbonate natural gas reservoirs. The study revealed that lower CO2 injection rates and reduced interlayer permeability differentials can delay CO2 leakage, thereby enhancing gas recovery efficiency. However, decreasing the injection rate also leads to reduced methane production and extends the duration of CO2 injection operations. Wang [27] used a CMG-GEM 2D cross-sectional model of injector-producer pairs, finding that both permeability and CO2 injection volume impact CGR recovery. When injection volume is less than 0.21 HCPV, CO2 injection achieves the highest oil recovery factory by most effectively vaporizing residual oil into the gas phase. Heterogeneity causes injected gas to preferentially channel through high-permeability, low-water-saturation paths, accelerating gas breakthrough; consequently, recovery gains from gas injection were only 2%–4% higher than depletion recovery. In addition to geological heterogeneity and engineering controls such as injection pressure and rate, recent international studies highlight other critical factors impacting reservoir performance. Khormali et al. [44] quantify the effects of calcium sulfate precipitation during waterflooding on rock permeability using core experiments and ANN models. They show that increased temperature, sulfate ion concentration, and injected pore volume, as well as a reduced injection rate, all exacerbate scaling-induced permeability loss. Mansi et al. [45] conducted a statistical analysis to evaluate the effectiveness of CO2-enhanced gas recovery and sequestration in shale gas reservoirs. Their study identified fracture permeability, organic content, CO2 adsorption capacity, and well spacing as the primary factors controlling EGR performance. These insights complement earlier Chinese and classical studies by underscoring the importance of integrating chemical–mechanical formation damage and well-pattern optimization into reservoir modeling and field-scale development strategies. However, despite these advances, many existing studies tend to isolate geological factors (such as average permeability or rhythmicity) from engineering controls (such as injection rate and pressure). There remains a lack of integrated approaches that couple reservoir heterogeneity with injection optimization for well placement and target design. This study addresses that gap by developing a multi-parameter simulation framework that jointly considers stratified heterogeneity, CO2 injection dynamics, and their coupled effects on condensate recovery efficiency in gas-condensate reservoirs.
To gain deeper insights into the formation damage mechanisms in Block P and the impact of CO2 injection on reservoir recovery, this study conducted condensate damage removal experiments. Real-time changes in formation pressure and oil/gas composition at the outlet were monitored, enabling the identification of distinct stages during CO2 flooding. Numerical simulation methods were employed to validate the reliability of the core-scale displacement model. Building on this, a sector model or mechanistic reservoir simulation model was established. This model simulates the impact of geological parameters like reservoir heterogeneity and rhythmic characteristics on reservoir performance, and optimizes engineering parameters such as injection pressure (from 13.5 MPa to 30 MPa) and rate (from 10,000 m3/d to 60,000 m3/d). This work provides practical guidance for enhancing recovery in edge/bottom water condensate gas reservoirs and holds significant importance for adjusting gas injection development strategies in such reservoirs.
2 Condensate Damage Mitigation Experiment
CO2 gas (purity 99.99%) was supplied by Chengdu Dongfang Electric Gas Co., Ltd. Formation water was prepared in the laboratory based on the analysis report of formation water from the condensate gas reservoir. It is of the NaHCO3 type with a total salinity of 16,630 mg/L, and was used for core saturation. Live reservoir fluid for displacement experiments was recombined using surface separator oil and gas from production wells in Block P condensate gas reservoir, following the Chinese Petroleum Industry Standard SY/T 5542-2009 (Methods for Analysis of Oil and Gas Reservoir Fluid Properties) [46]. Real reservoir sandstone cores from the condensate gas reservoir were used for the displacement experiments. Flash separation tests were performed on the recombined samples to measure the gas-oil ratio. The composition of the flashed oil and flashed gas was analyzed using gas chromatography. The composition data of the wellstream are presented in Table 1. Condensate fluid was recombined at a condensate gas-oil ratio of 4100 m3/m3 under reservoir conditions of 41.2 MPa and 102.5°C. Real reservoir sandstone cores from the condensate gas reservoir were used for the displacement experiments, core basic petrophysical properties are presented in Table 2. These cores were obtained from Block P, the primary producing block of the field, which was selected through a rigorous screening process based on its representative geological properties (porosity, permeability, and fluid composition) consistent with the reservoir’s main development targets. This ensures the experimental results directly address the key production challenges of the field.
Table 1: Composition of recombined sample.
| Component | Well Stream/mol% | Flashed Gas/mol% | Flashed Oil/mol% |
|---|---|---|---|
| CO2 | 0.37 | 0.38 | - |
| N2 | 2.01 | 2.06 | - |
| C1 | 85.29 | 87.37 | - |
| C2 | 5.54 | 5.67 | 0.01 |
| C3 | 1.92 | 1.97 | 0.07 |
| iC4 | 0.55 | 0.56 | 0.14 |
| nC4 | 0.74 | 0.75 | 0.40 |
| iC5 | 0.28 | 0.27 | 0.71 |
| nC5 | 0.35 | 0.33 | 1.34 |
| C6 | 0.51 | 0.37 | 6.15 |
| C7 | 0.41 | 0.15 | 11.12 |
| C8 | 0.51 | 0.12 | 16.51 |
| C9 | 0.32 | - | 13.46 |
| C10 | 0.26 | - | 10.85 |
| C11+ | 0.95 | - | 39.25 |
Table 2: Core basic petrophysical properties.
| Core ID | Length (cm) | Diameter (cm) | Pore Volume | Porosity (%) | Permeability (mD) | Outlet |
|---|---|---|---|---|---|---|
| 1 | 6.334 | 2.50 | 2.66 | 9.42 | 8.57 |  |
| 2 | 5.895 | 2.50 | 1.77 | 6.41 | 6.14 | |
| 3 | 2.5 | 2.50 | 0.98 | 15.82 | 8.07 | |
| 4 | 6.303 | 2.50 | 2.28 | 2.39 | 7.40 | |
| 5 | 6.163 | 2.50 | 2.66 | 4.63 | 8.82 | |
| 6 | 6.122 | 2.50 | 2.68 | 3.81 | 8.93 | |
| 7 | 6.14 | 2.50 | 2.73 | 3.93 | 9.08 | |
| 8 | 4.41 | 2.50 | 1.62 | 1.15 | 7.50 | |
| mean | - | 2.50 | - | 5.94 | 8.06 | |
| Total | 43.867 | - | 17.38 | - | - | Inlet |
The displacement experiments were conducted under reservoir conditions of 102.5°C and 41.2 MPa using a long-core flooding apparatus. As shown in Fig. 1, the experimental setup consisted of three main systems: (1) an injection system comprising injection pumps, fluid sample containers, and transfer vessels; (2) a core-holder system with a Hassler-type cell rated for 70 MPa operation; and (3) a production system equipped with back-pressure regulation and phase separation capabilities. The complete apparatus included precision metering pumps (±0.01 mL/min accuracy), a temperature-controlled air bath (±0.5°C stability), intermediate containers, and real-time monitoring instruments (pressure transducers and flow meters) to record experimental data.
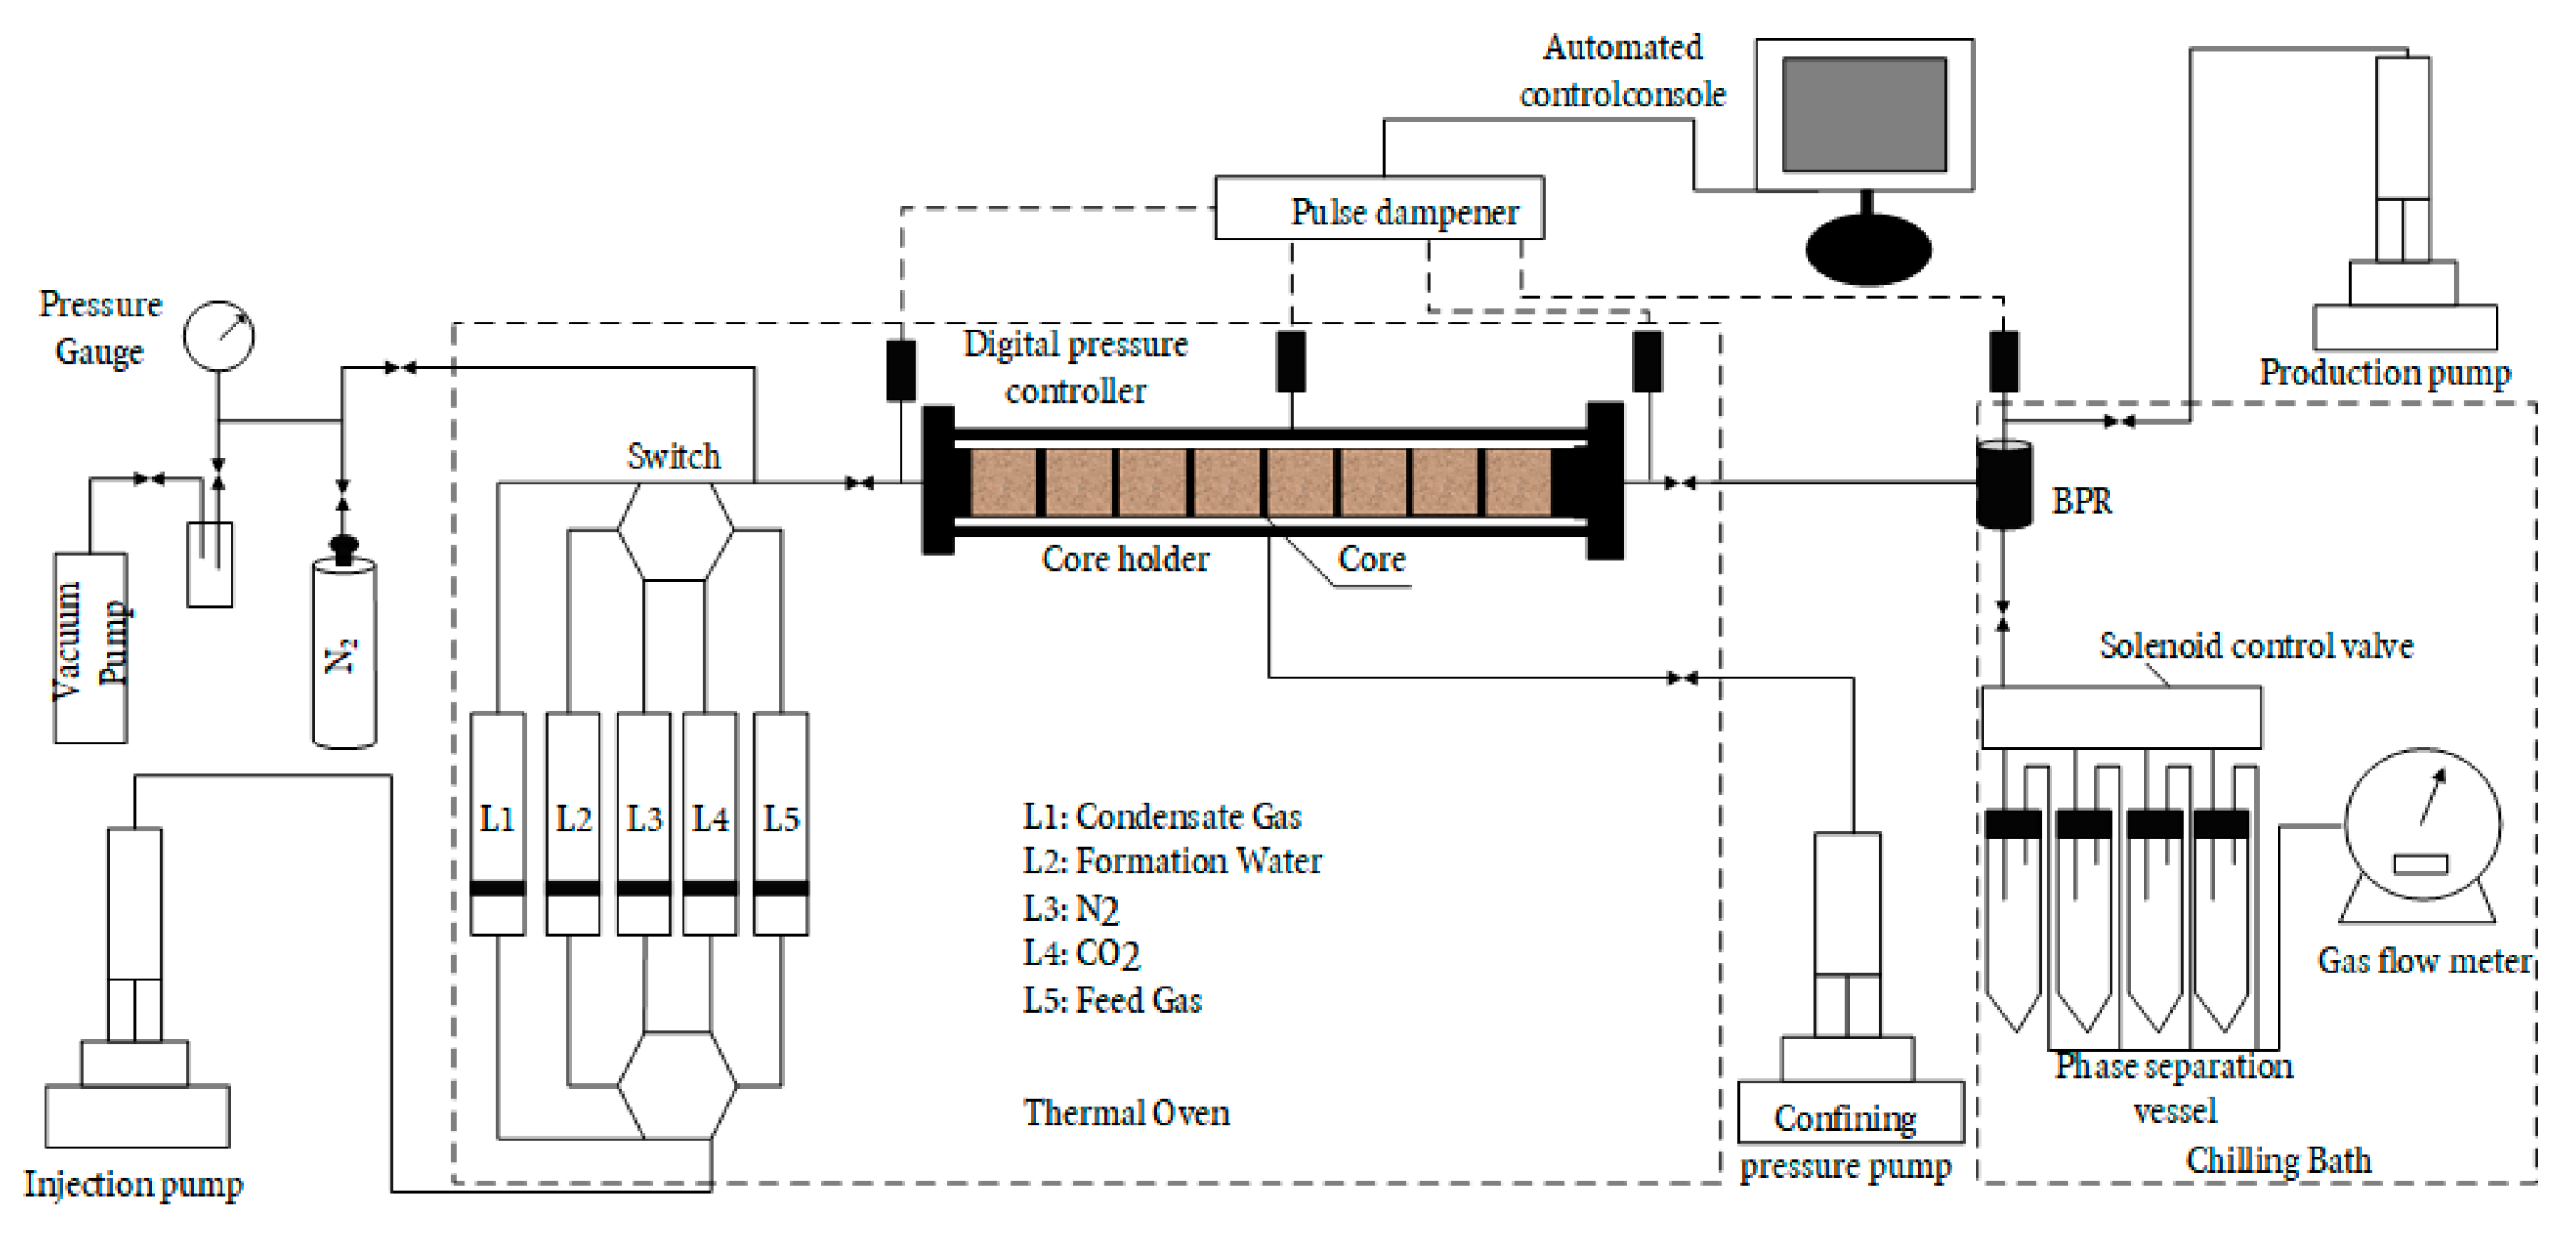
Figure 1: Schematic flow diagram of the experimental apparatus.
Eight core samples with comparable petrophysical properties were obtained from the P block, with a total length of 43.87 cm. Cores were cleaned, saturated with formation brine, and flooded with oil to establish irreducible water saturation. A recombined fluid mixture was then injected to restore the initial gas saturation. Prior to each gas injection test, the core was pressure-depleted to the target level, followed by gas injection to MMP ± 2–5 MPa. The system was shut in for 12 h to ensure equilibrium. Subsequently, displacement was performed at a constant injection rate of 0.1 mL/min until no oil was produced. Pressure and production volumes were continuously monitored throughout the experiment (Table 3).
Table 3: Experimental parameters.
| Injection Medium | Fluid Type | Experimental Scope |
|---|---|---|
| CO2 | Original Reservoir Fluid in Block P Condensate Gas Reservoir | (1) Depletion from initial reservoir pressure (41.2 MPa) to current reservoir pressure (13.5 MPa) (2) CO2 injection to repressurize to 16.5 MPa and 22.5 MPa for displacement tests |
Existing data indicate that the minimum miscibility pressure (MMP) for the condensate gas reservoir is 21.5 MPa. In the experimental displacement design, CO2 injection was conducted at 13.5 MPa, followed by production after pressure restoration to 23.5 MPa and 16.5 MPa, respectively. This approach aims to simulate CO2 miscible flooding and CO2 immiscible flooding development methods. Fig. 2 illustrates condensate production and recovery factor variation during the depletion development stage. In the initial high-pressure phase, hydrocarbon phase behavior remains stable, with condensate existing as a liquid phase in rock pores, facilitating its displacement toward production wells. Consequently, the recovery factor gradually increases. The gas-to-liquid ratio shows no significant variation, resulting in minor fluctuations in the gas-oil ratio (GOR). However, as pressure further declines, displacement efficiency progressively diminishes, causing the growth rate of condensate recovery to flatten. Concurrently, condensate undergoes phase transition from liquid to vapor, triggering a sharp rise in GOR. When pressure decreased from 41.2 MPa to 13.5 MPa, the condensate recovery factor reached 26.21%, while the GOR increased substantially to 8241 m3/m3.
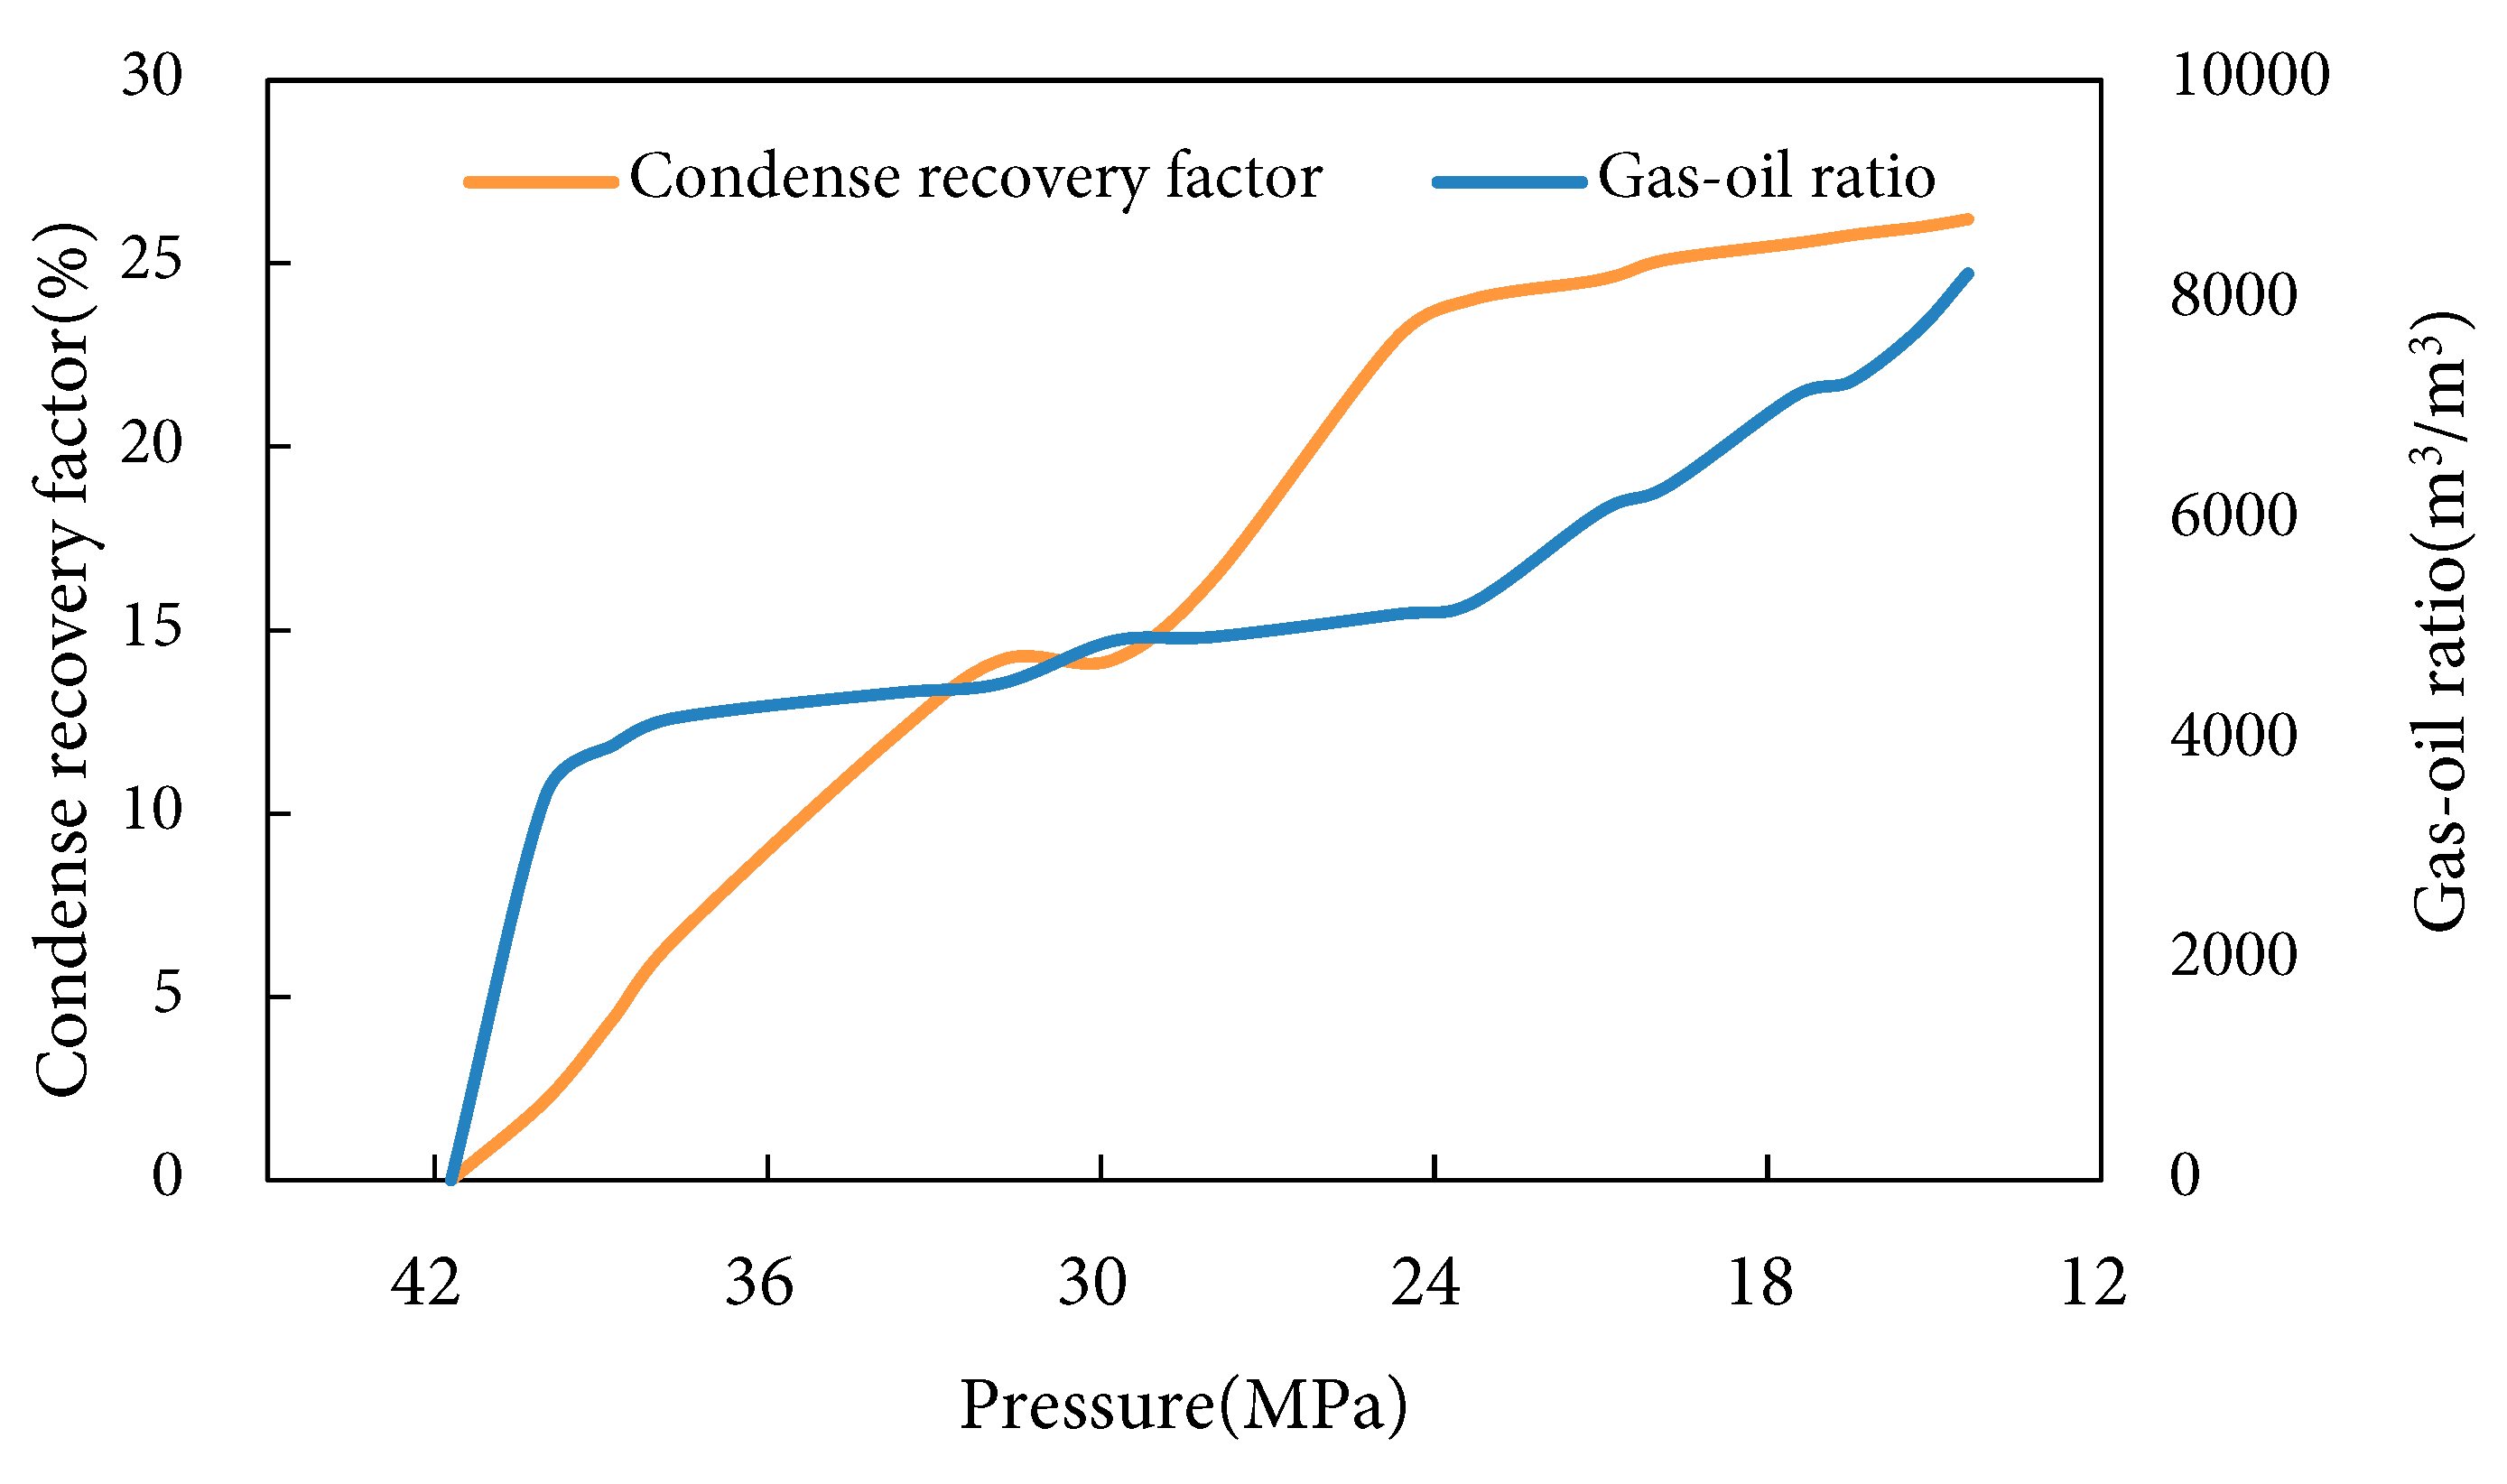
Figure 2: Condensate recovery factor and gas-oil ratio variation during depletion development.
Fig. 3 depicts condensate recovery factor and gas-oil ratio variation under CO2 immiscible flooding, with the displacement process segmented into three phases: During the minimal gas production phase (HCPV < 0.8), constant-rate and constant-pressure CO2 injection limited hydrocarbon production at the outlet, resulting in gradual increases in both gas-oil ratio and recovery factor; as injection progresses to 0.51 HCPV, continuous gas flow pathways develop within the pore network, triggering a significant surge in gas production and a sharp gas-oil ratio escalation. At 0.8 HCPV when CO2 breakthrough occurs, substantial CO2 directly contacts unswept-zone condensate, markedly enhancing displacement efficiency through oil-phase viscosity reduction and extraction of intermediate hydrocarbon components (C2–C6), while constant-pressure displacement suppresses retrograde evaporation—collectively promoting liquid hydrocarbon production in vapor phase. Consequently, the gas-oil ratio growth rate decelerates due to efficient mobilization of movable oil and reduced formation of new gas channeling pathways.
After CO2 breakthrough at 0.8 HCPV, although CO2 initially enhances displacement efficiency via viscosity reduction and extraction of intermediate hydrocarbons (C2–C6), the movable condensate is nearly depleted as injection enters the “gas channeling phase” beyond 0.91 HCPV. Two key constraints emerge: First, immiscible displacement inherently fails to eliminate interfacial tension, leaving residual oil trapped in low-permeability zones unrecoverable. Second, geological heterogeneity causes CO2 to preferentially channel through high-permeability paths, leading to inefficient recirculation that cannot access bypassed condensate in low-permeability regions. Thus, the recovery factor stabilizes at 32.76%, reflecting inherent limitations of immiscible displacement (inability to eliminate interfacial tension for residual oil mobilization under immiscible pressure) and geological heterogeneity (bypassed condensate in low-permeability zones). This also reflects that there is an “effective injection threshold” in CO2 immiscible flooding, providing a basis for optimizing injection parameters and tapping remaining oil in subsequent development.
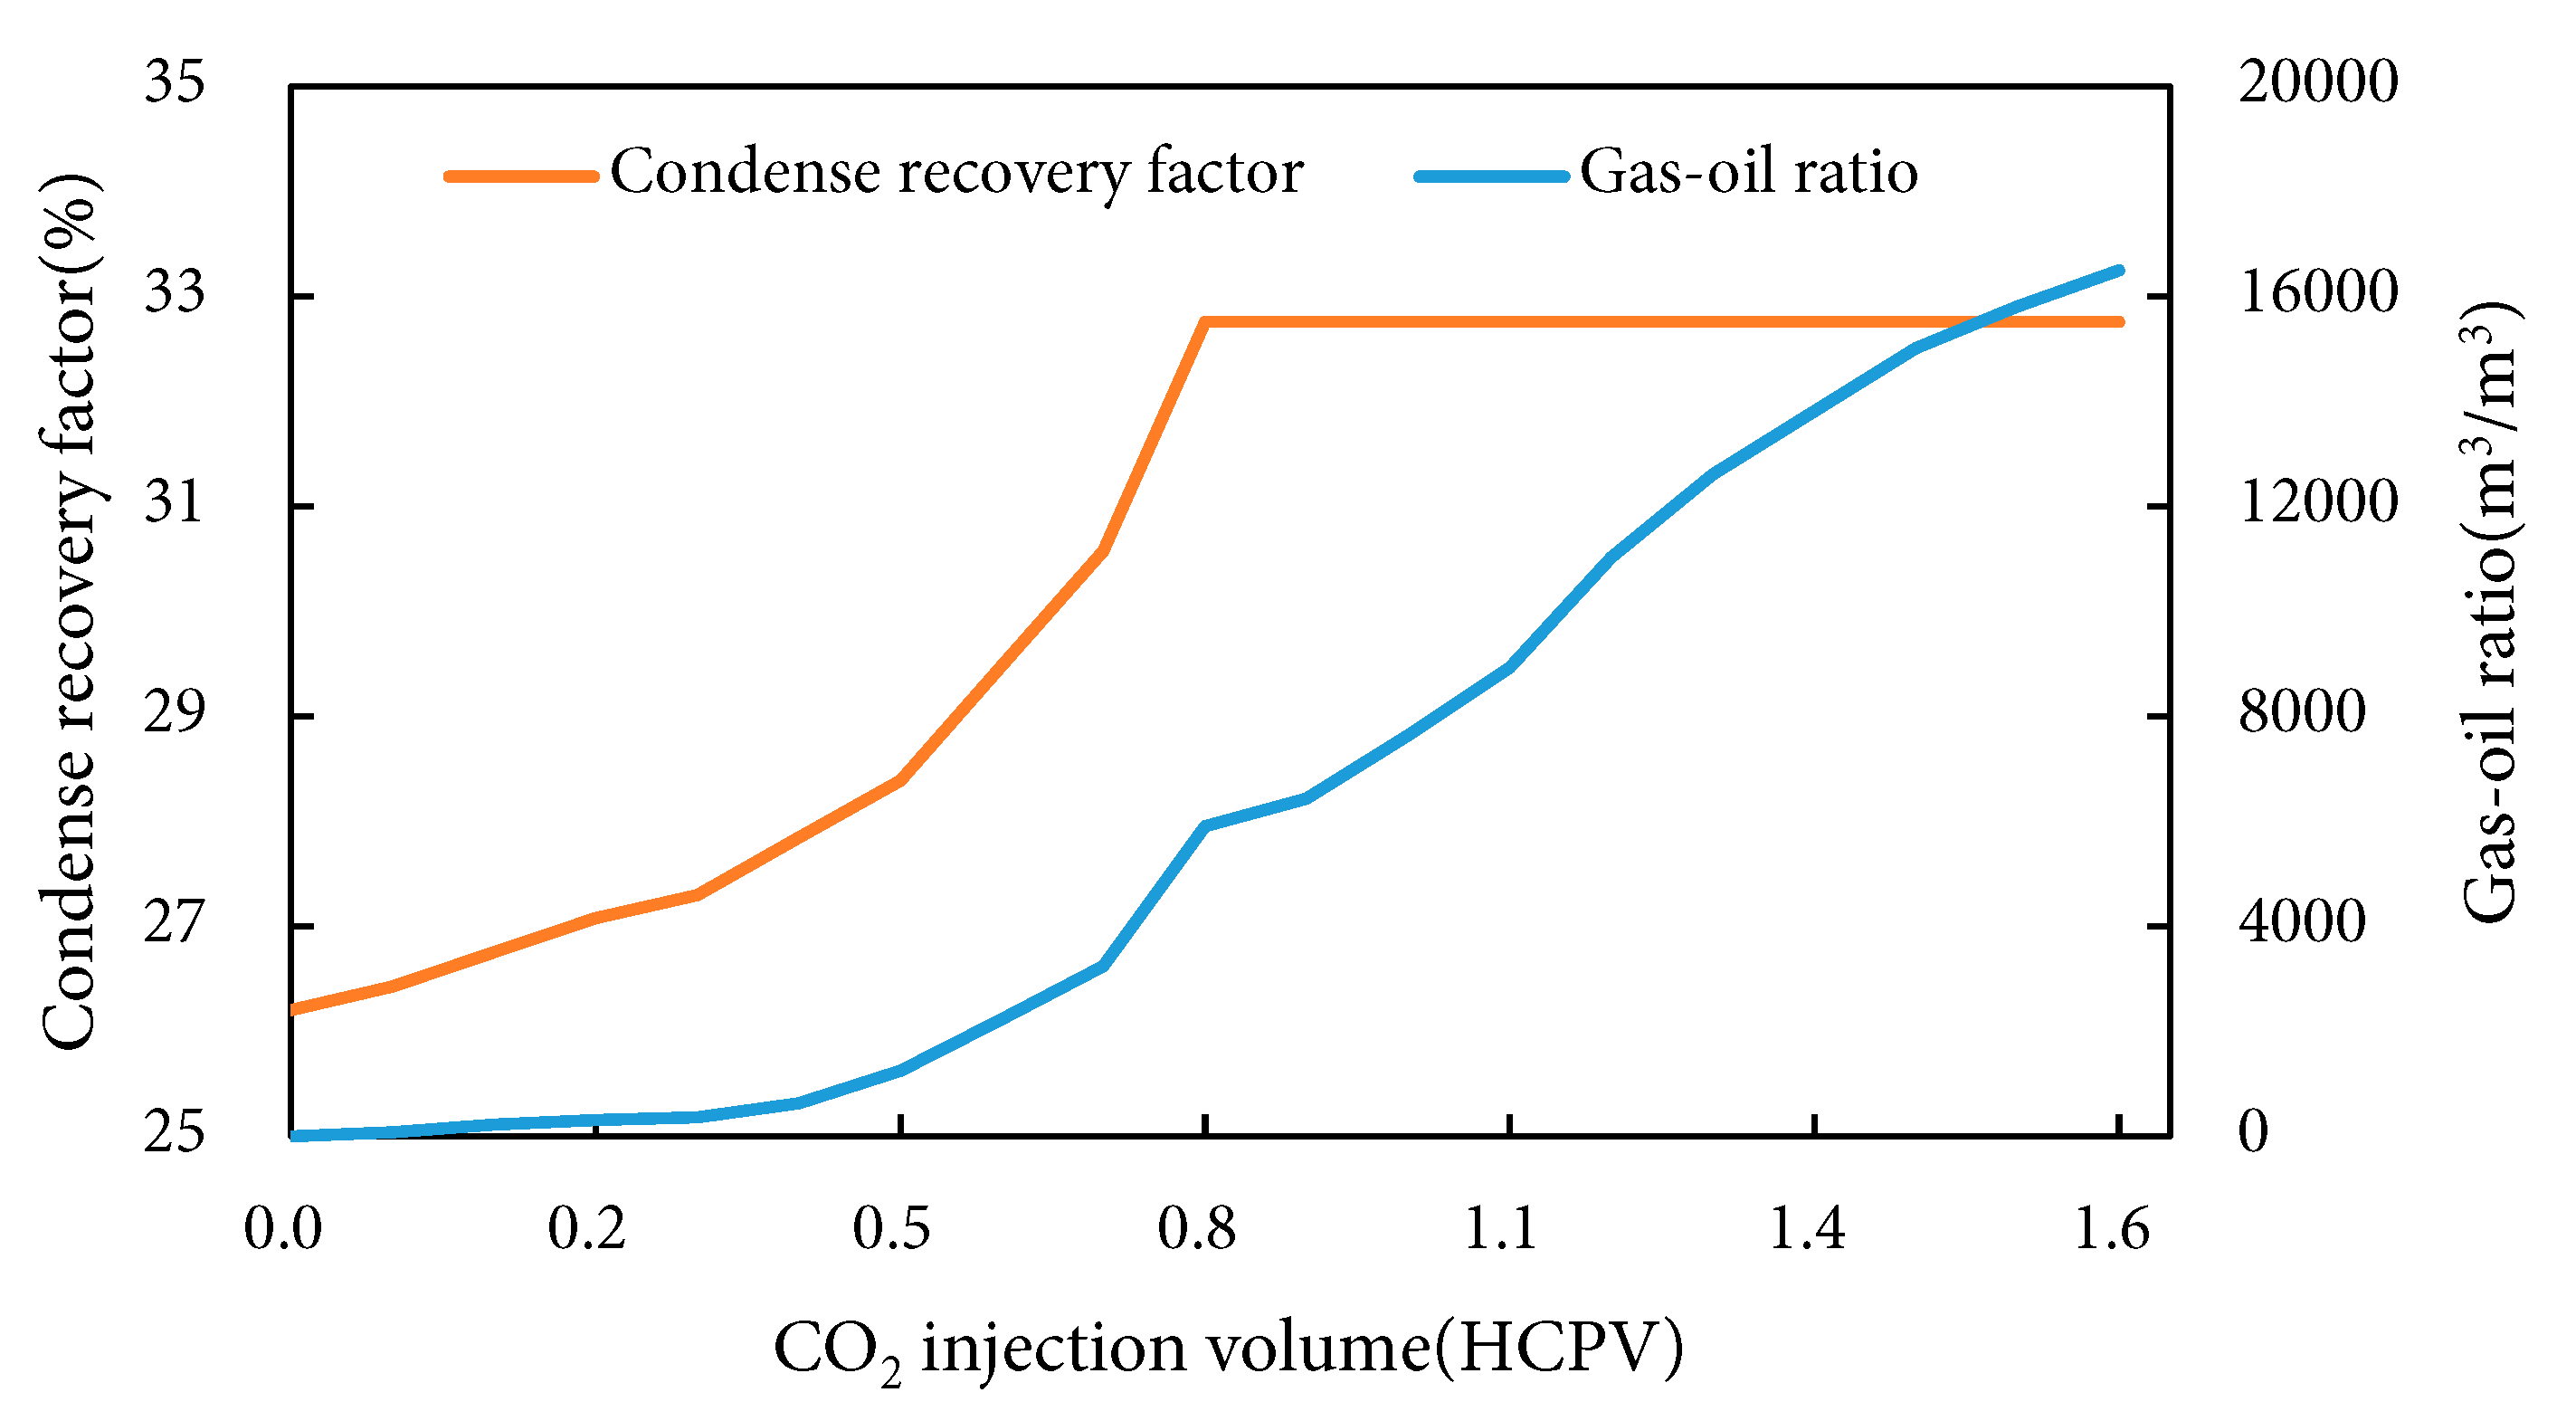
Figure 3: Condensate recovery factor and gas-oil ratio variation under CO2 immiscible flooding.
Fig. 4 presents condensate recovery factor and gas-oil ratio variation under CO2 miscible flooding, delineating four injection phases: During the gas-free production phase (HCPV < 0.38), under miscible pressure conditions, CO2 fully dissolves into condensate forming a miscible front where injected gas remains entirely solubilized without independent gas flow, resulting in exclusive production of degassed condensate at the outlet. The minimal gas production phase (HCPV = 0.38–1.05) exhibits advancing miscible front movement toward the production well, with partial CO2 breaking through as free gas ahead of the oil phase, yielding trace associated gas at the outlet and gradual gas-oil ratio (GOR) increase while oil production remains constrained by incomplete interwell connectivity of the miscible zone. At gas breakthrough (HCPV = 1.05–1.83), miscible front arrival triggers three pivotal mechanisms: (1) Miscible extraction achieving dynamic miscibility that eliminates interfacial tension, efficiently vaporizing light-to-intermediate hydrocarbons (C2–C30); (2) Viscosity plunge reducing oil viscosity to 1/10–1/20 of original values, drastically enhancing mobility; (3) Volumetric expansion exceeding 150% that drives significant residual oil toward the wellbore. Collectively, these propel condensate recovery from pre-breakthrough accumulation to 44.77% with concurrent GOR surge. In the gas channeling phase (HCPV > 1.83), movable oil depletion within the swept zone enables CO2-dominated flow through high-permeability channels, yielding >85% CO2 content in produced gas with near-zero condensate output and renewed GOR escalation. The ultimate recovery stabilizes at 44.77%, demonstrating both miscible flooding constraints (≈55% oil in low-permeability zones bypassed due to heterogeneity) and advantages (12.01% incremental recovery over immiscible flooding’s 32.76% through capillary resistance elimination).
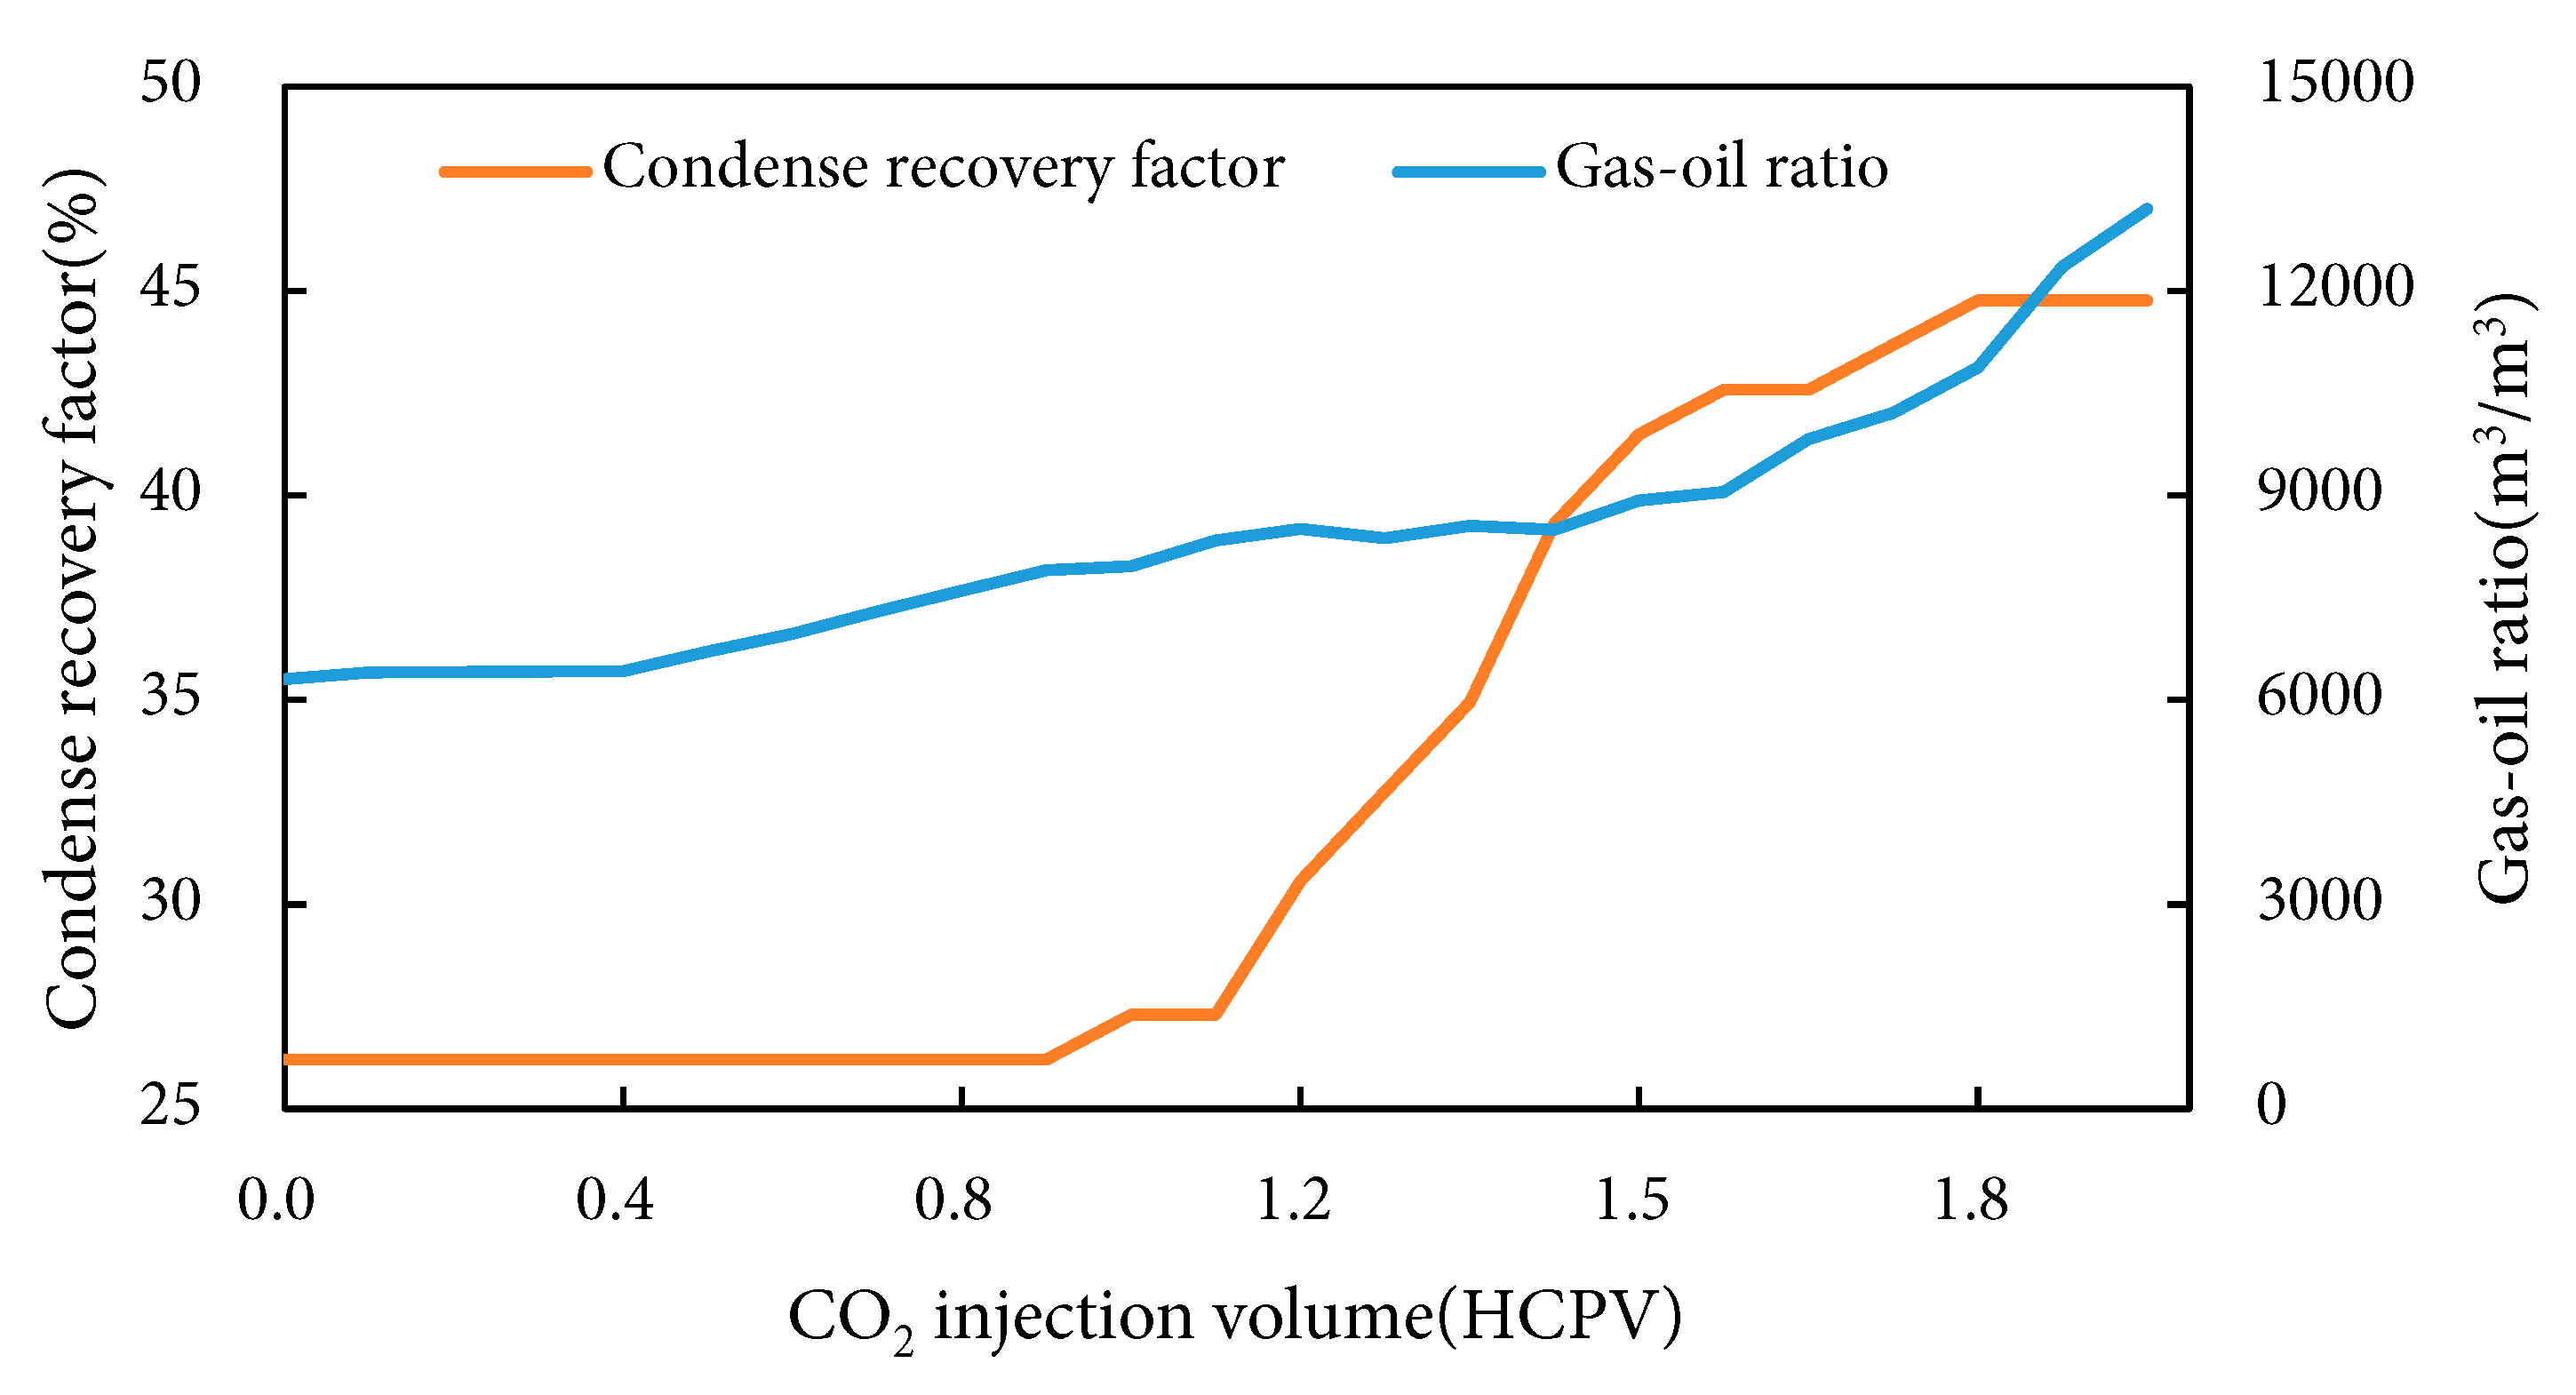
Figure 4: Condensate recovery factor and gas-oil ratio variation under CO2 miscible flooding.
When injection pressure exceeds the minimum miscibility pressure (MMP), complete miscibility between CO2 and condensate is achieved, reducing interfacial tension to near-zero levels. This condition fundamentally suppresses viscous fingering during gas-liquid flow while significantly improving the mobility ratio—typically decreasing from 10–50 in immiscible states to 1–5 under miscible conditions. The resultant uniform displacement front slows CO2 frontal advancement, delaying gas breakthrough from 0.8 HCPV in immiscible flooding to 1.05 HCPV. This breakthrough postponement directly enhances recovery through three mechanisms: (1) Expanded microscopic sweep efficiency: The extended pre-breakthrough period allows full development of the miscible zone, enabling effective extraction of condensate from low-permeability regions via high solvency power of CO2; (2) Optimized displacement mechanism: Single-phase flow in the miscible state eliminates capillary trapping effects; (3) Component gradient enhancement: Sustained “extraction-condensation” equilibrium at the advancing front cyclically vaporizes intermediate hydrocarbons (C5–C30), boosting condensate vaporization efficiency by 2–3 fold. Fundamentally, CO2 injection above MMP inhibits viscous fingering through interfacial tension elimination, where breakthrough delay represents spatial expansion of efficient extraction processes. This temporal extension enables thorough maturation of the miscible front, ultimately achieving step-change recovery improvement via phase transformation mechanisms (liquid oil-miscible zone-hydrocarbon-enriched vapor phase), establishing CO2 miscible flooding as the technical cornerstone for efficient condensate reservoir development.
3 Core-Scale Numerical Validation
3.1 Model Parameter Configuration
This section establishes a core flooding model using the K Gas Reservoir in Block P as a case study, implemented through the numerical simulation software CMG-GEM™ 2022 (Fig. 5). While this process cannot fully characterize the entire reservoir, it accurately captures flow dynamics and compositional changes within the formation. The model geometry replicates actual core dimensions, with core-scale modeling parameters detailed in Table 2 and saturation parameters for oil displacement modeling provided in Table 4.
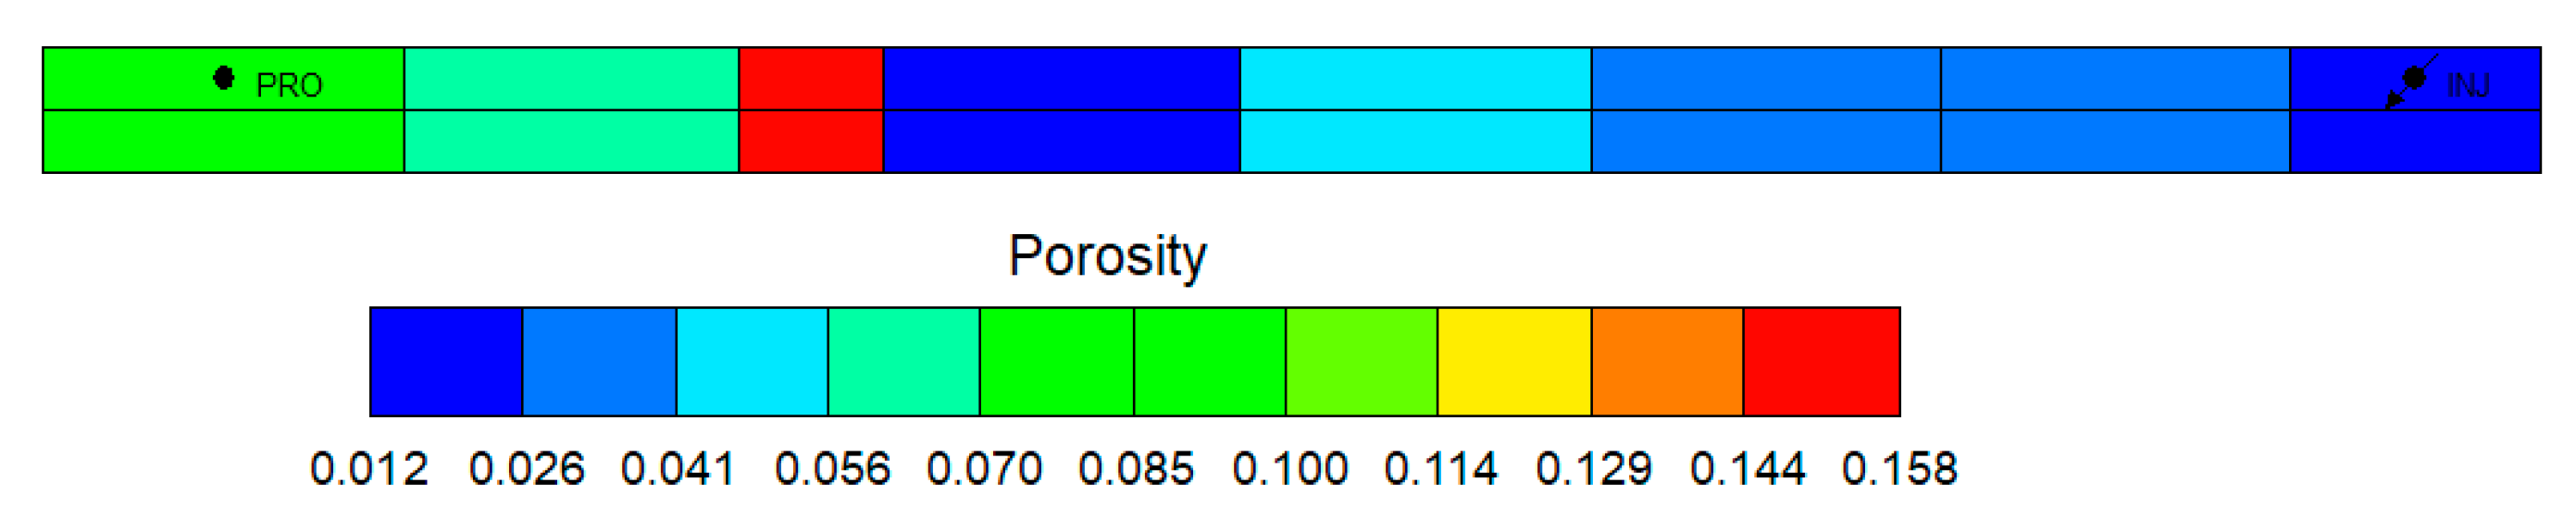
Figure 5: Long-core oil displacement model for Block P (CMG-GEM™, Ver.2022)
Table 4: Core flooding modeling saturation parameters.
| Bulk Reservoir Volume (cm3) | Pore Volume (cm3) | Hydrocarbon Pore Volume (cm3) | Water Saturation (%) |
|---|---|---|---|
| 212.32 | 11.29 | 7.40 | 34.45 |
3.2 Fluid Phase Behavior and Properties
To establish the PVT equation for the condensate gas reservoir, reservoir fluid characterization was performed through analysis of experimental data including: Bubble point determination, Single-stage flash separation, Constant composition expansion (CCE) and Constant volume depletion (CVD) test. The crude oil composition and ratios of model reflect actual original reservoir fluid properties. Components above C11 are grouped as C11+ with a specific gravity of 0.8212 g/cm3 and molecular weight of 205.1 g/mol (see Table 1). Key state parameters for the PVT equation were derived using the WinProp™ phase behavior simulator within CMG 2022, with flash separation and bubble point determination fitting results presented in Table 5, while CCE and CVD experimental fits are shown in Fig. 6 and Fig. 7, respectively. Based on fluid similarity criteria [47], the original reservoir fluid was partitioned into 7 pseudo-components. The C21+ fraction exhibits a molecular weight of 406.1 g/mol (detailed in Table 6).
Table 5: Fitted results of single flash tests and saturation pressure (at a reservoir temperature of 102.5°C).
| Index | Experiment | Simulation | Relative Error |
|---|---|---|---|
| Gas oil ratio (m3/m3) | 4100.00 | 4112.56 | −0.31% |
| Condensate oil density (g/cm3) | 247.80 | 247.80 | 0% |
| Condensate gas volume factor | 0.0038 | 0.0035 | 0.79% |
| Saturation pressure (MPa) | 38.93 | 38.93 | 0% |
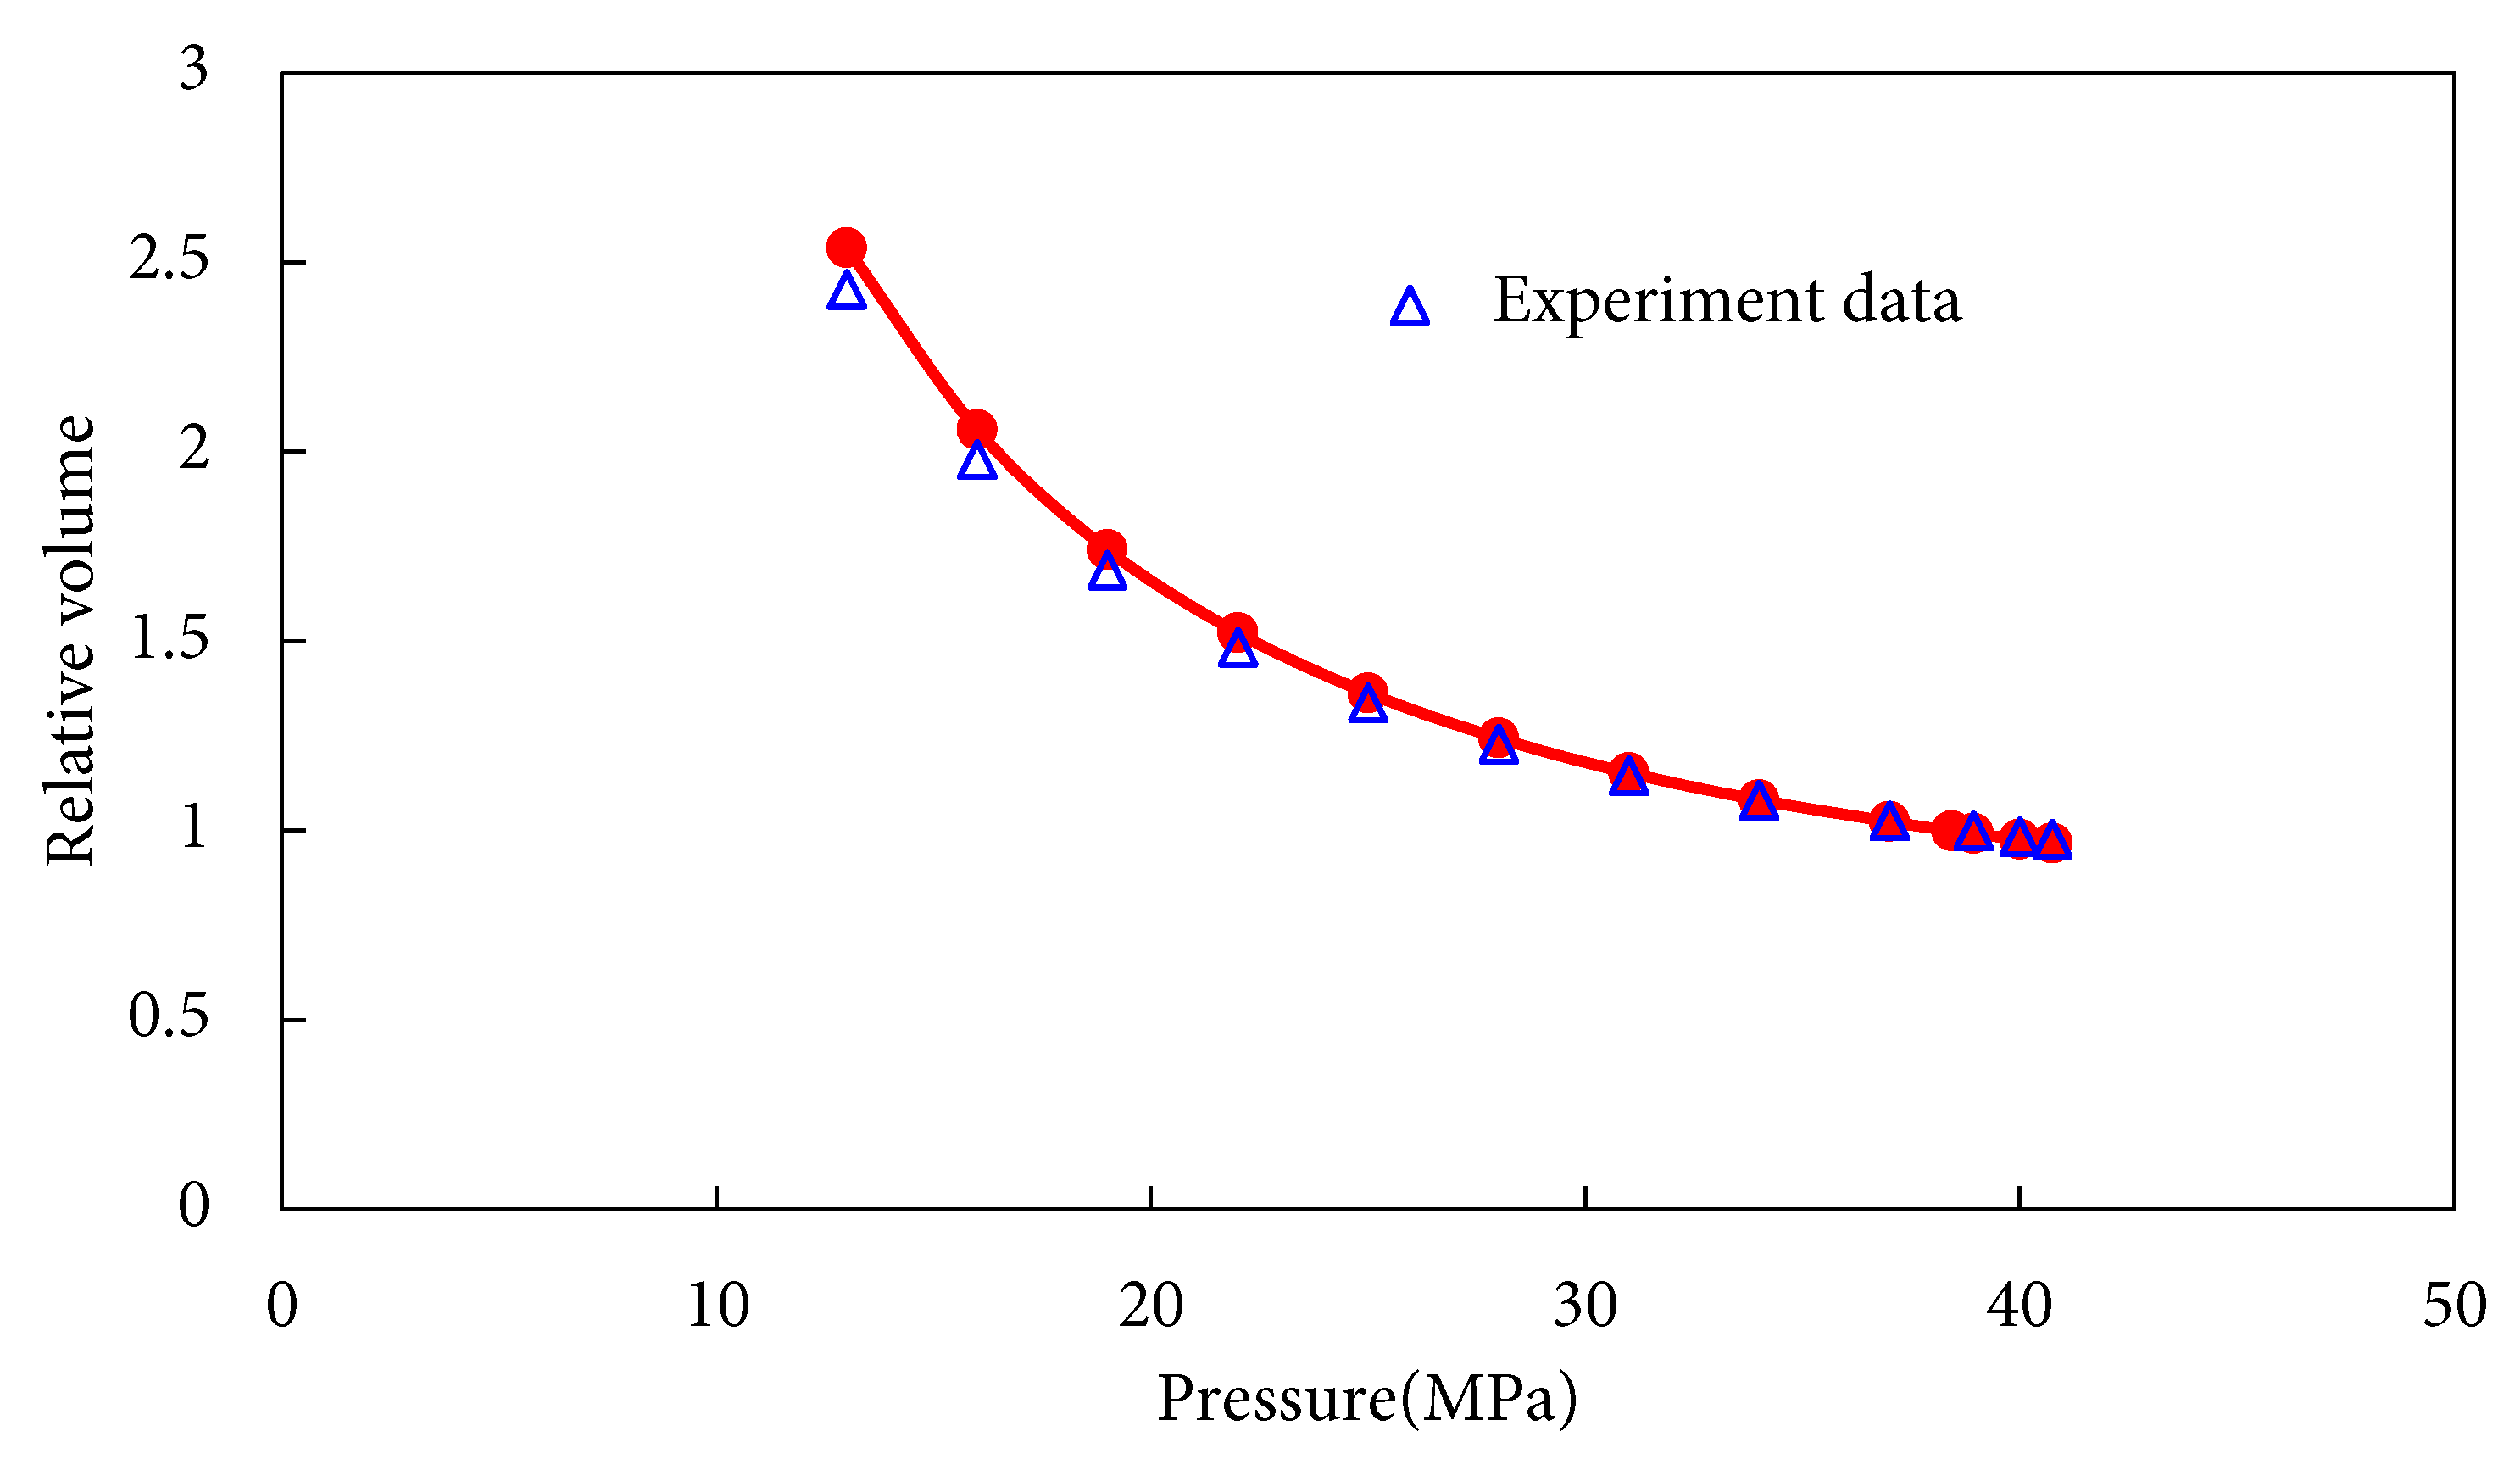
Figure 6: CCE experimental data fitting plot.
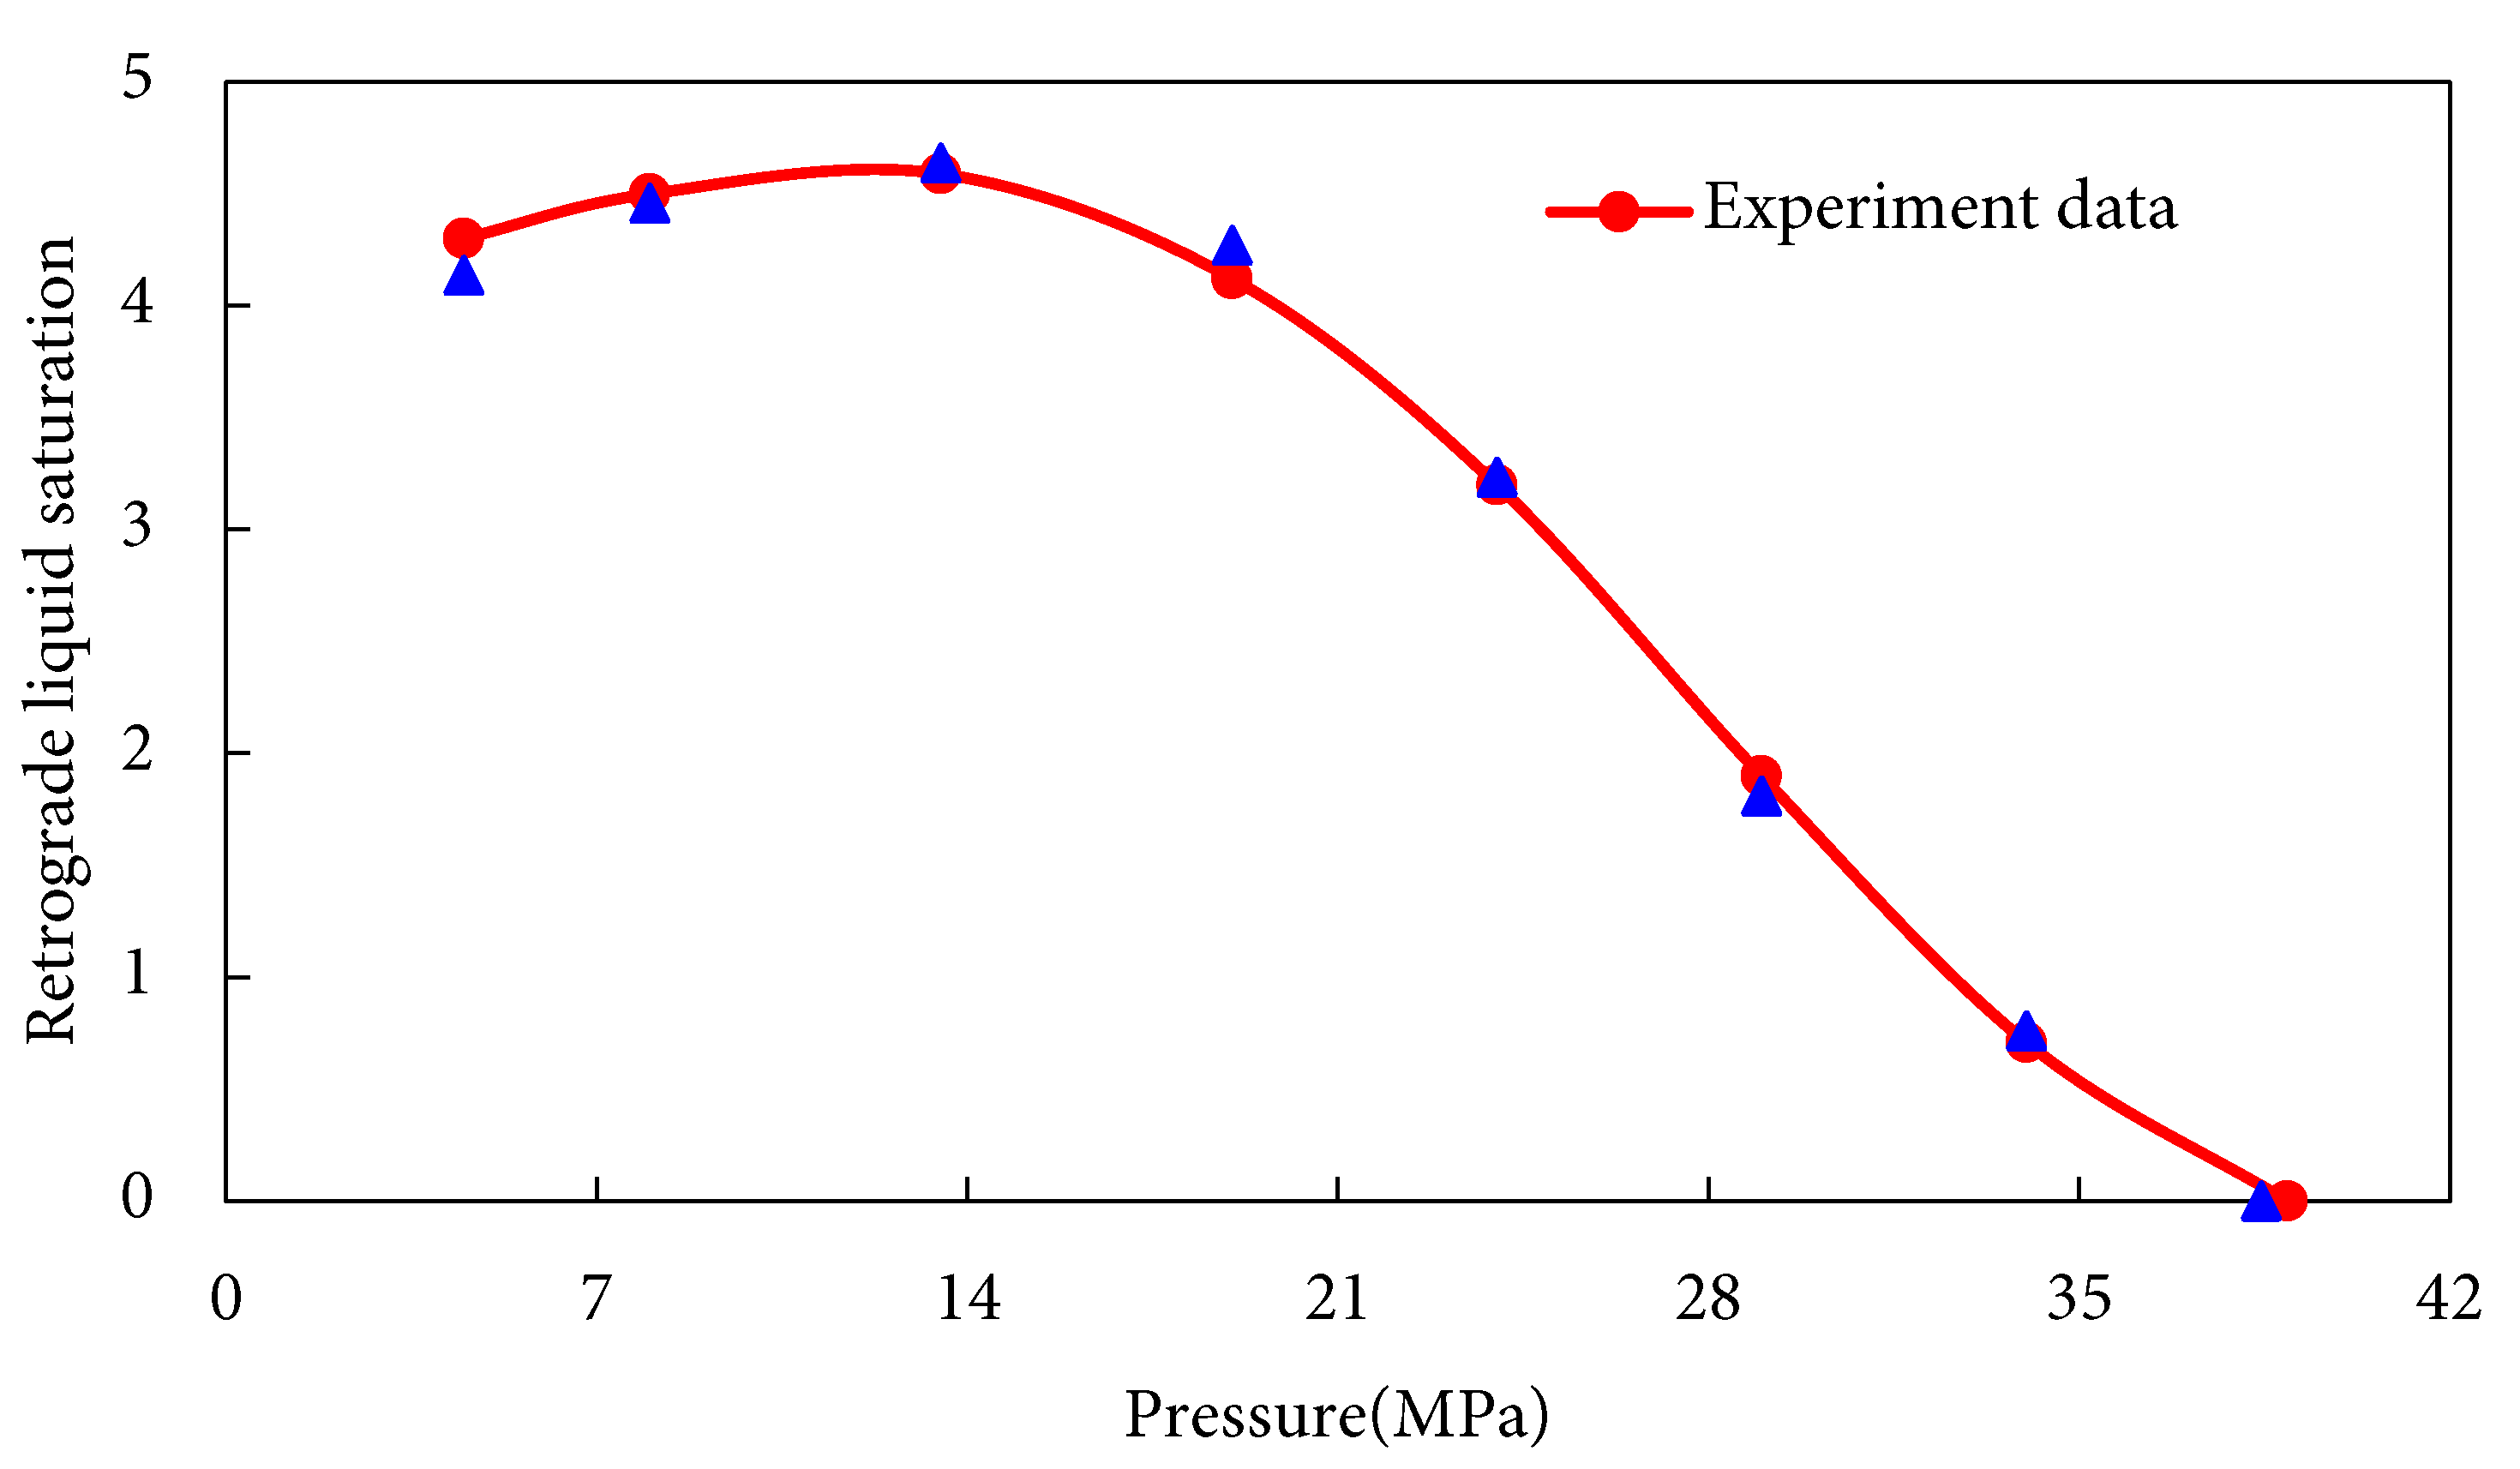
Figure 7: CVD experimental data fitting plot.
Table 6: Compositional fitting results of original reservoir fluid PVT properties.
| Pseudo-Component | Composition % |
|---|---|
| CO2 | 0.37 |
| N2 + C1 | 87.28 |
| C2 to C6 | 9.89 |
| C7 to C10 | 1.5 |
| C11 to C15 | 0.7 |
| C16 to C20 | 0.17 |
| C21+ | 0.09 |
Fig. 8 compares simulated versus experimental condensate recovery factors under varying reservoir pressures during depletion, confirming exceptional agreement between numerical simulations and experimental results throughout this stage. Based on the regression relationship, the coefficient of determination (R2) was calculated to be 98.67%, indicating a high level of accuracy in the simulation and a strong correlation with experimental data.
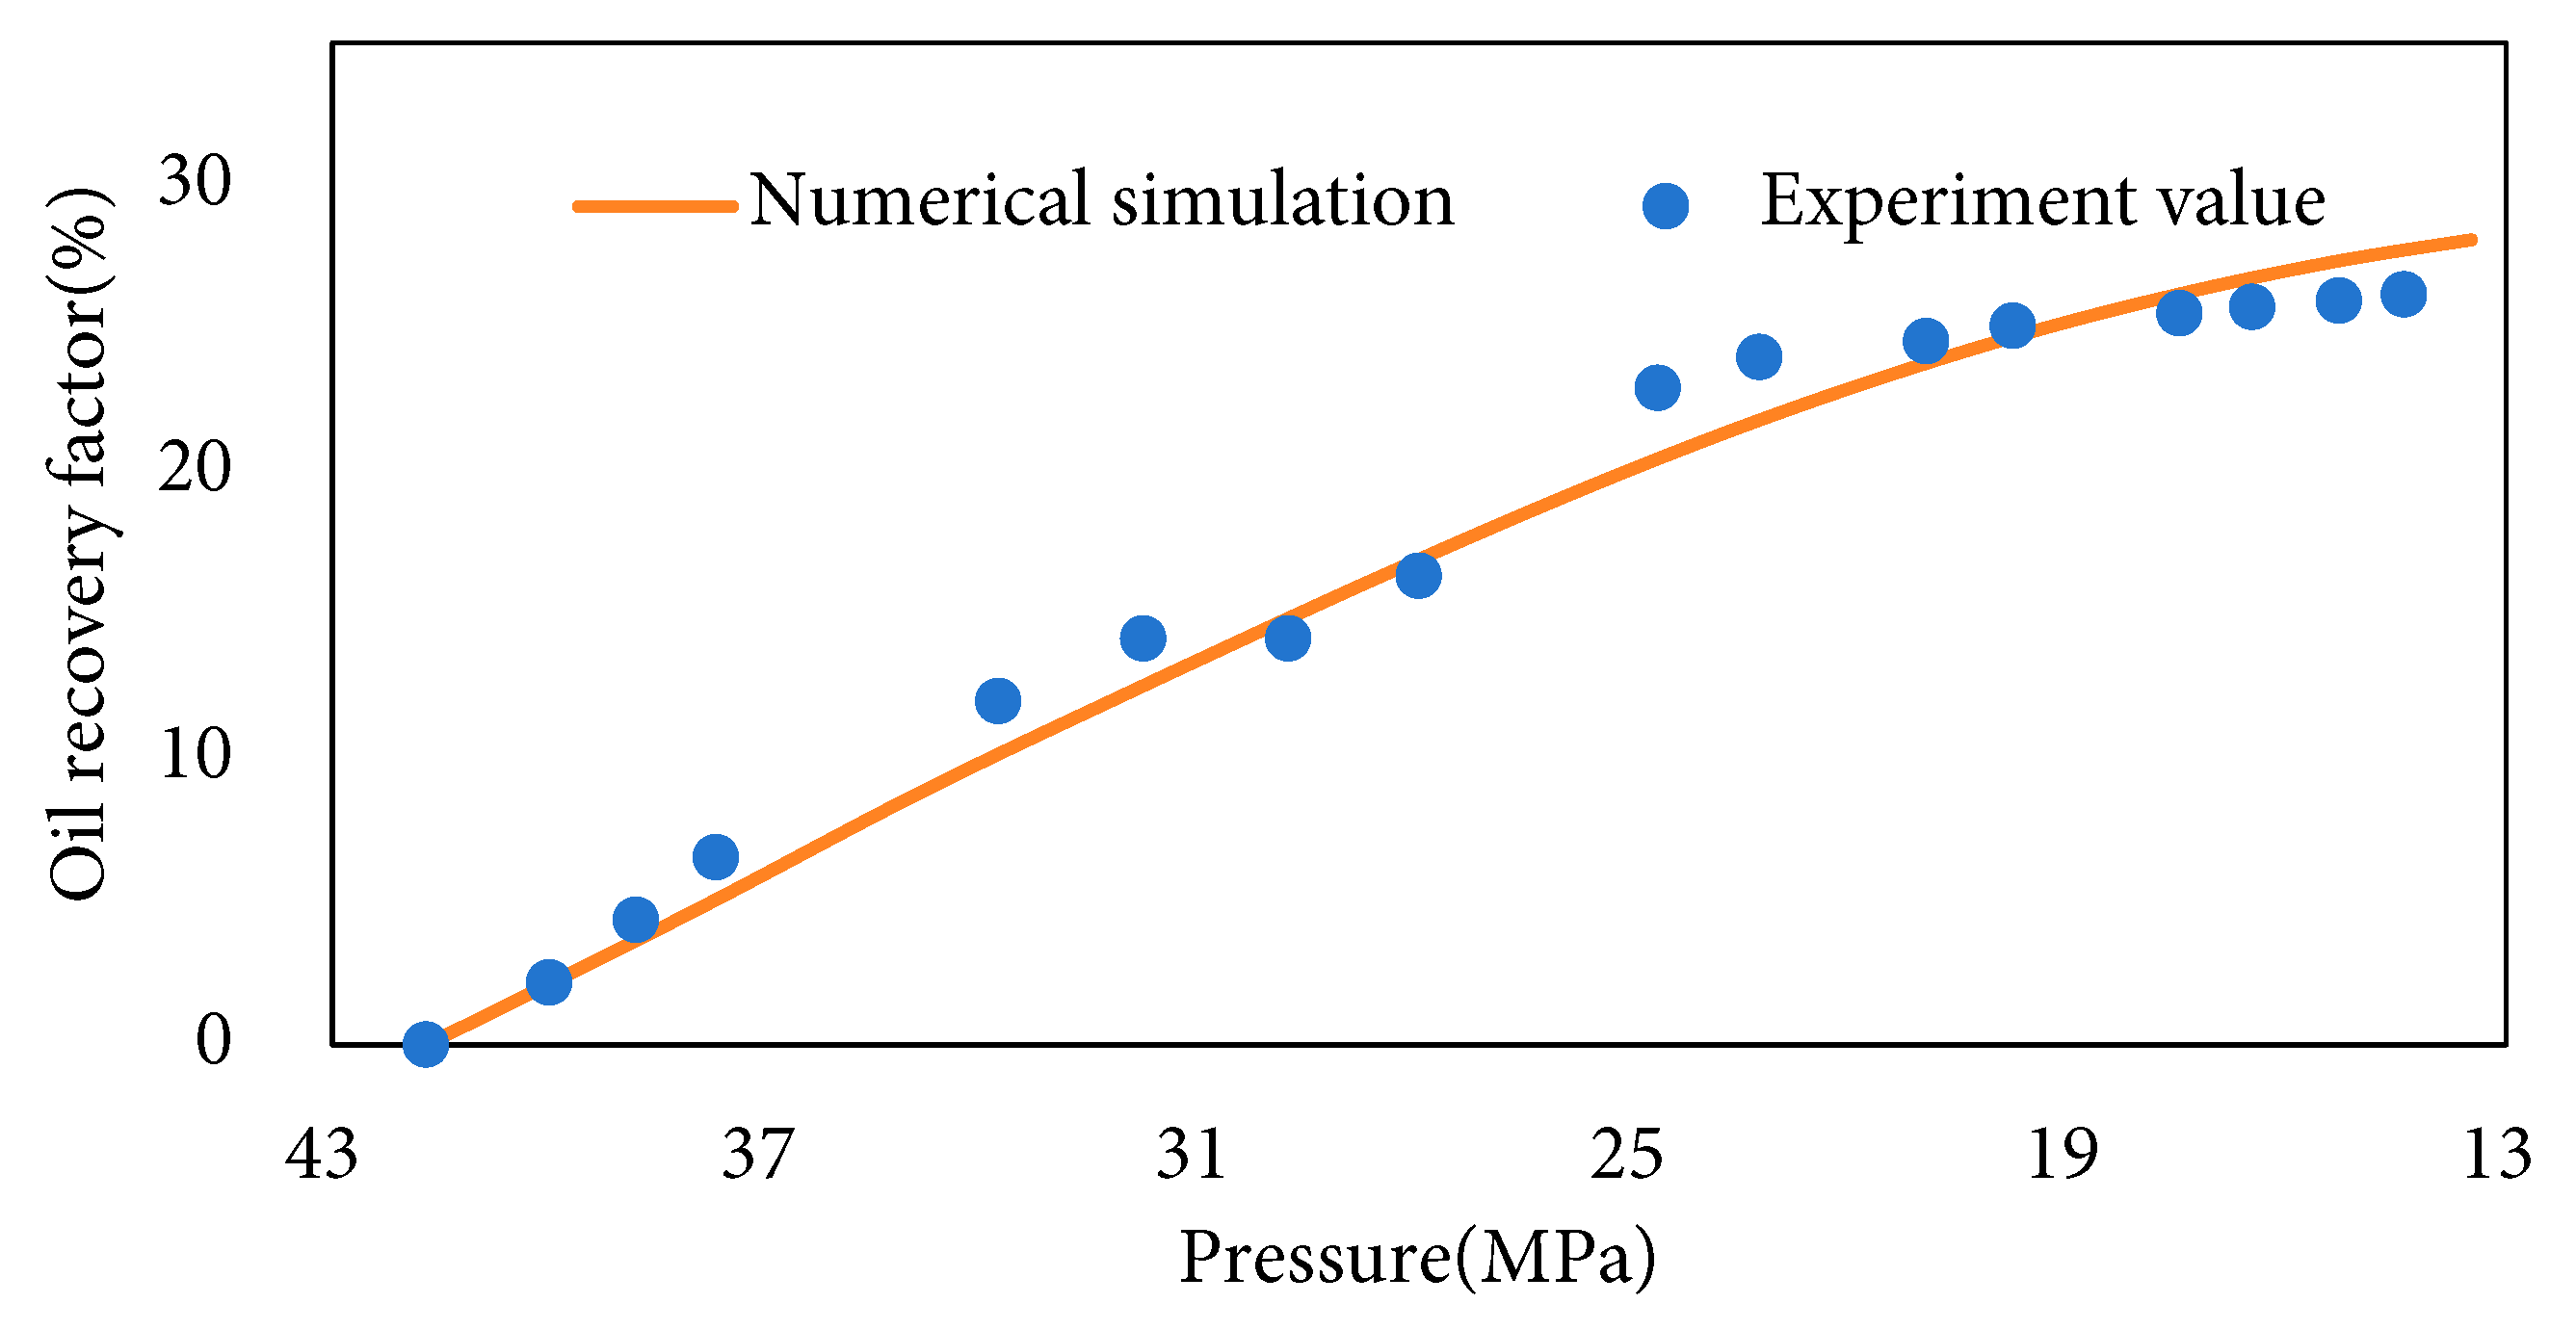
Figure 8: Fitting results for depletion stage.
3.3.2 CO2 Immiscible Flooding Stage
Fig. 9 compares the simulated and experimental condensate oil recovery factors under different CO2 injection volumes during the immiscible flooding stage of the condensate reservoir, with an overall good agreement between the two datasets. Both indicate that when the bottom-hole pressure drops below the dew-point pressure, condensate blockage significantly impairs reservoir productivity and causes substantial condensate oil loss. However, across the entire recovery factor fitting curve, the simulated values consistently exceed the experimental measurements. This discrepancy stems from multiple factors: component lumping effects, where the simulation groups C11+ fractions into a single pseudocomponent, potentially overestimating the solubility of CO2 with heavy fractions and leading to optimistic recovery predictions; experimental uncertainties, such as heterogeneous initial saturation distribution in core samples, pressure control fluctuations, and measurement errors of produced fluids (especially volatilization losses of condensate oil during phase separation); in addition, due to partial immiscibility in the core, the experimental condensate viscosity is higher than the simulated value, reducing the actual displacement efficiency; the simulated fluid density is lower than the experimental data due to simplified PVT models, which affects gravity-driven flow and overestimates sweep efficiency; meanwhile, core samples exhibit heterogeneous porosity (1.15–15.82%) and micro-fractures that trap residual oil, whereas the simulation uses homogeneous porosity (average 5.94%), underestimating residual saturation and overpredicting recovery. Based on the regression relationship, the coefficient of determination (R2) was calculated to be 93.5%.
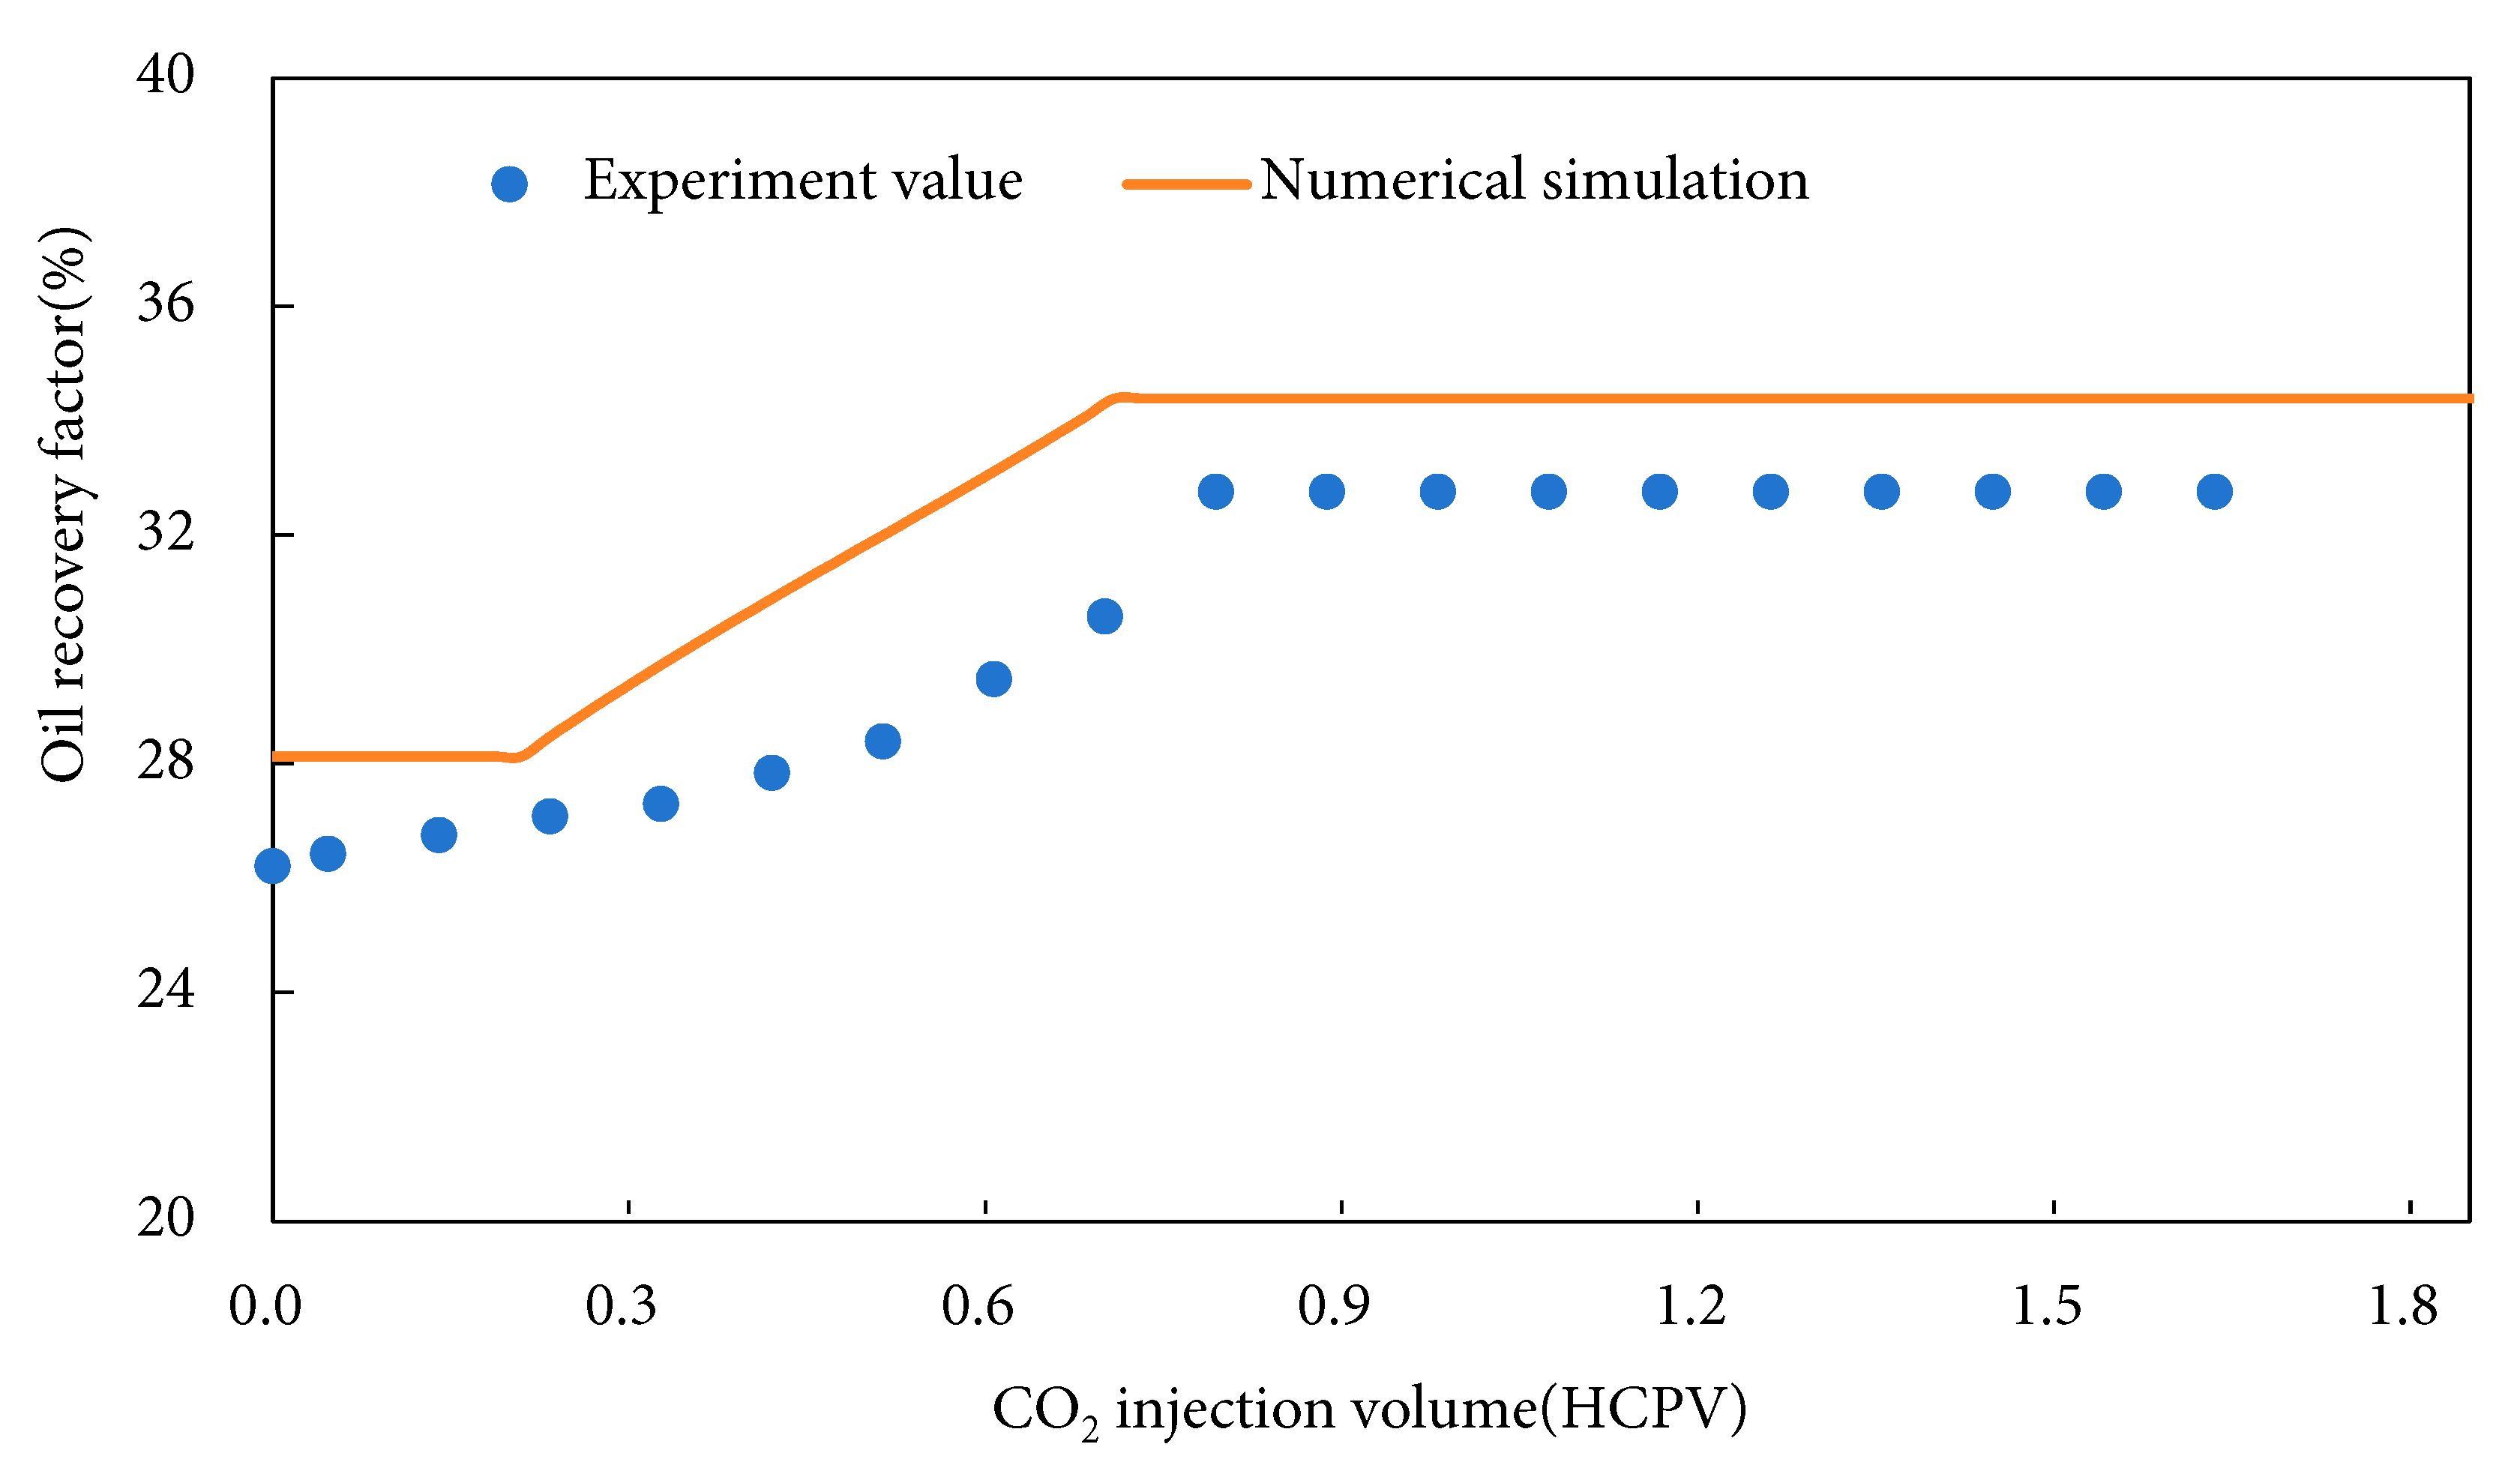
Figure 9: Fitting results for CO2 immiscible flooding stage.
3.3.3 CO2 Miscible Flooding Stage
Fig. 10 presents a similar comparison for the miscible flooding stage. The discrepancies between experimental and simulated values arise from several factors, including the simulation assuming homogeneous reservoirs, ideal phase behavior, and fixed relative permeability curves, whereas experimental heterogeneities, wettability variations, and capillary end effects reduce sweep efficiency; the simulation determines miscibility based on minimum miscibility pressure (MMP), while dynamic flow phenomena such as viscous fingering in experiments cause local immiscibility, lowering actual recovery; furthermore, the simulation assumes equilibrium phase behavior, while experimental temperature gradients (2–3°C) and pressure fluctuations (±0.3 MPa) induce non-equilibrium condensate dropout, increasing residual oil; experimental cores have variable porosity (1.15–15.82%) with low-permeability zones acting as barriers, whereas the simulation uses average porosity, overestimating CO2 diffusion and underestimating bypassed oil; In the simulation, the interfacial tension under miscible conditions is set to near zero, but the experimental values remain at 0.01 to 0.03 mN/m due to local compositional variations, thereby weakening the displacement efficiency. Based on the regression relationship, the coefficient of determination (R2) was calculated to be 97.75%.
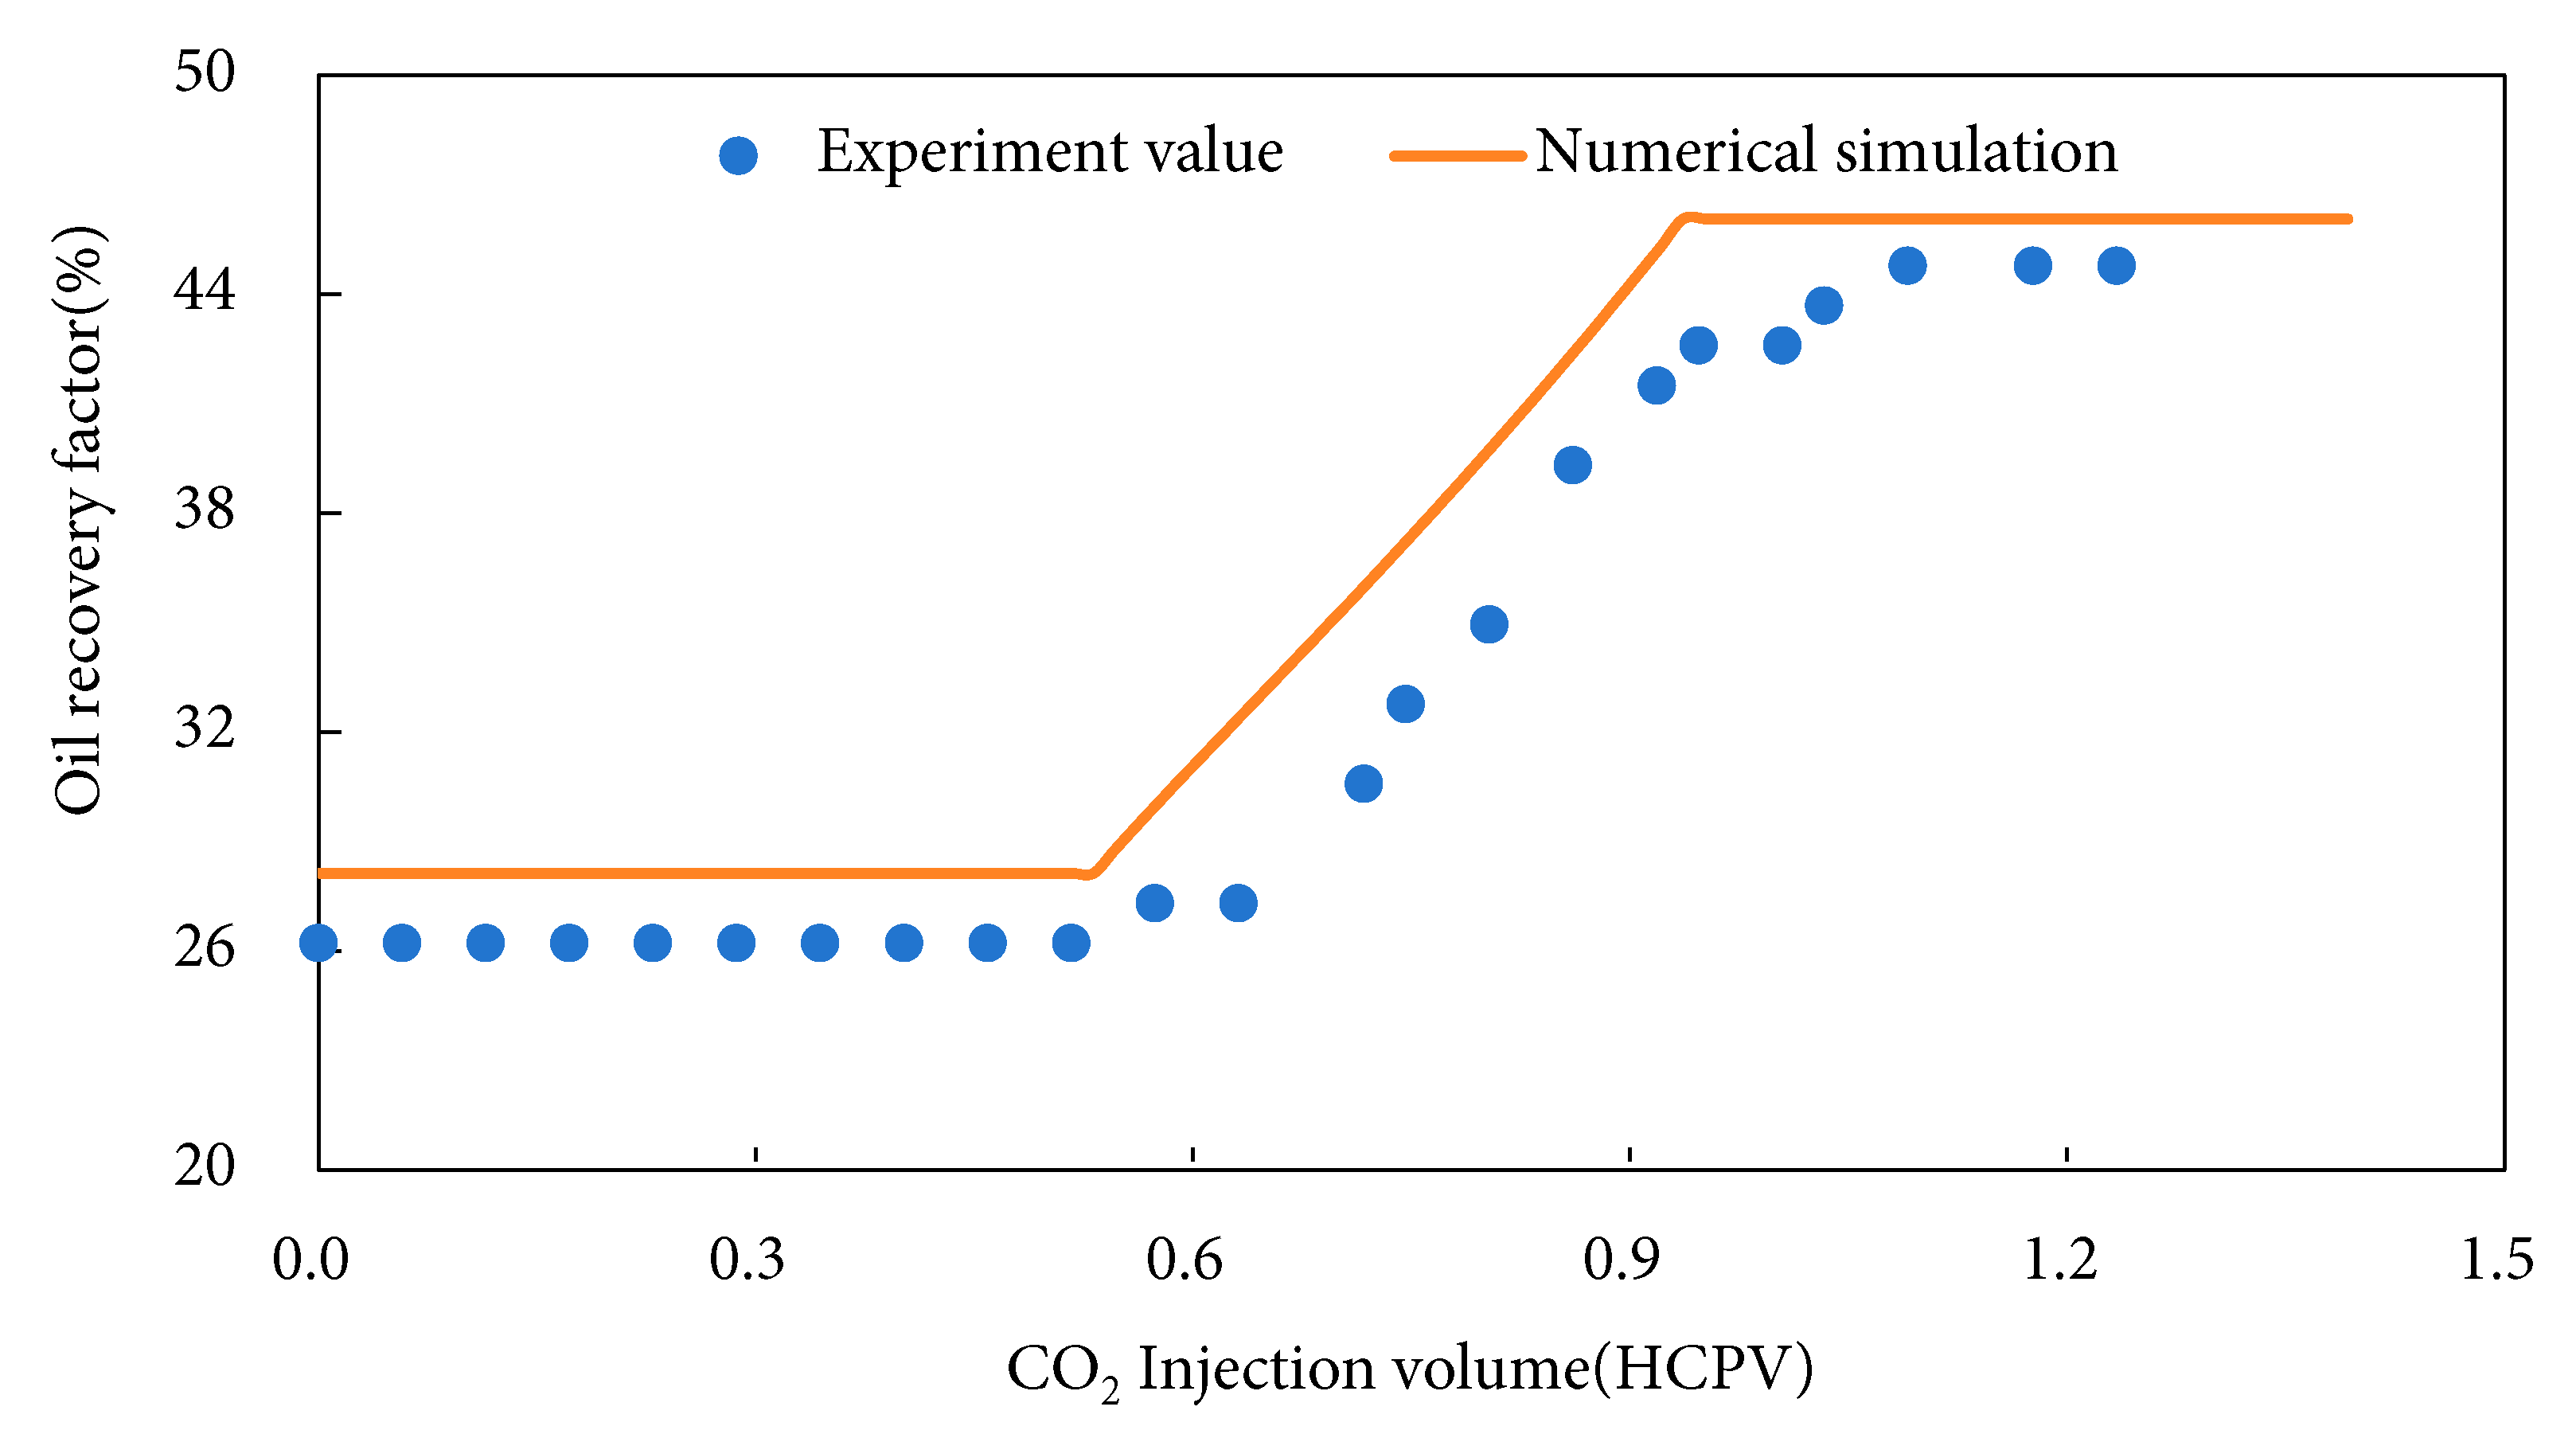
Figure 10: Fitting results for CO2 miscible flooding stage.
The close agreement between experimental and simulated results (Fig. 8, Fig. 9 and Fig. 10) confirm the reliability of the core-scale model. This linkage between core experiments and numerical simulations ensures that the key mechanisms (e.g., retrograde condensation and CO2-condensate interactions) captured at the core scale can be reliably extrapolated to reservoir-scale simulations, enhancing the explanatory power of our findings for Block P’s specific dynamics.
4 Field-Scale Numerical Simulation
4.1 Model Parameter Configuration
The simulation model employs a Cartesian grid with 31 × 31 × 20 cells (Fig. 11), where each grid block is 30 m × 30 m × 1 m. The reference depth is set at 3880 m, with an initial reservoir pressure of 41.2 MPa and formation temperature of 102.5°C. Connate water saturation is initialized at 34%, and the rock compressibility is 0.91 × 10⁻⁷ 1/kPa. One CO2 injection well (inj-1) and one production well are placed at distinct locations within the model, as shown in Fig. 11, representing a simplified line-drive configuration.
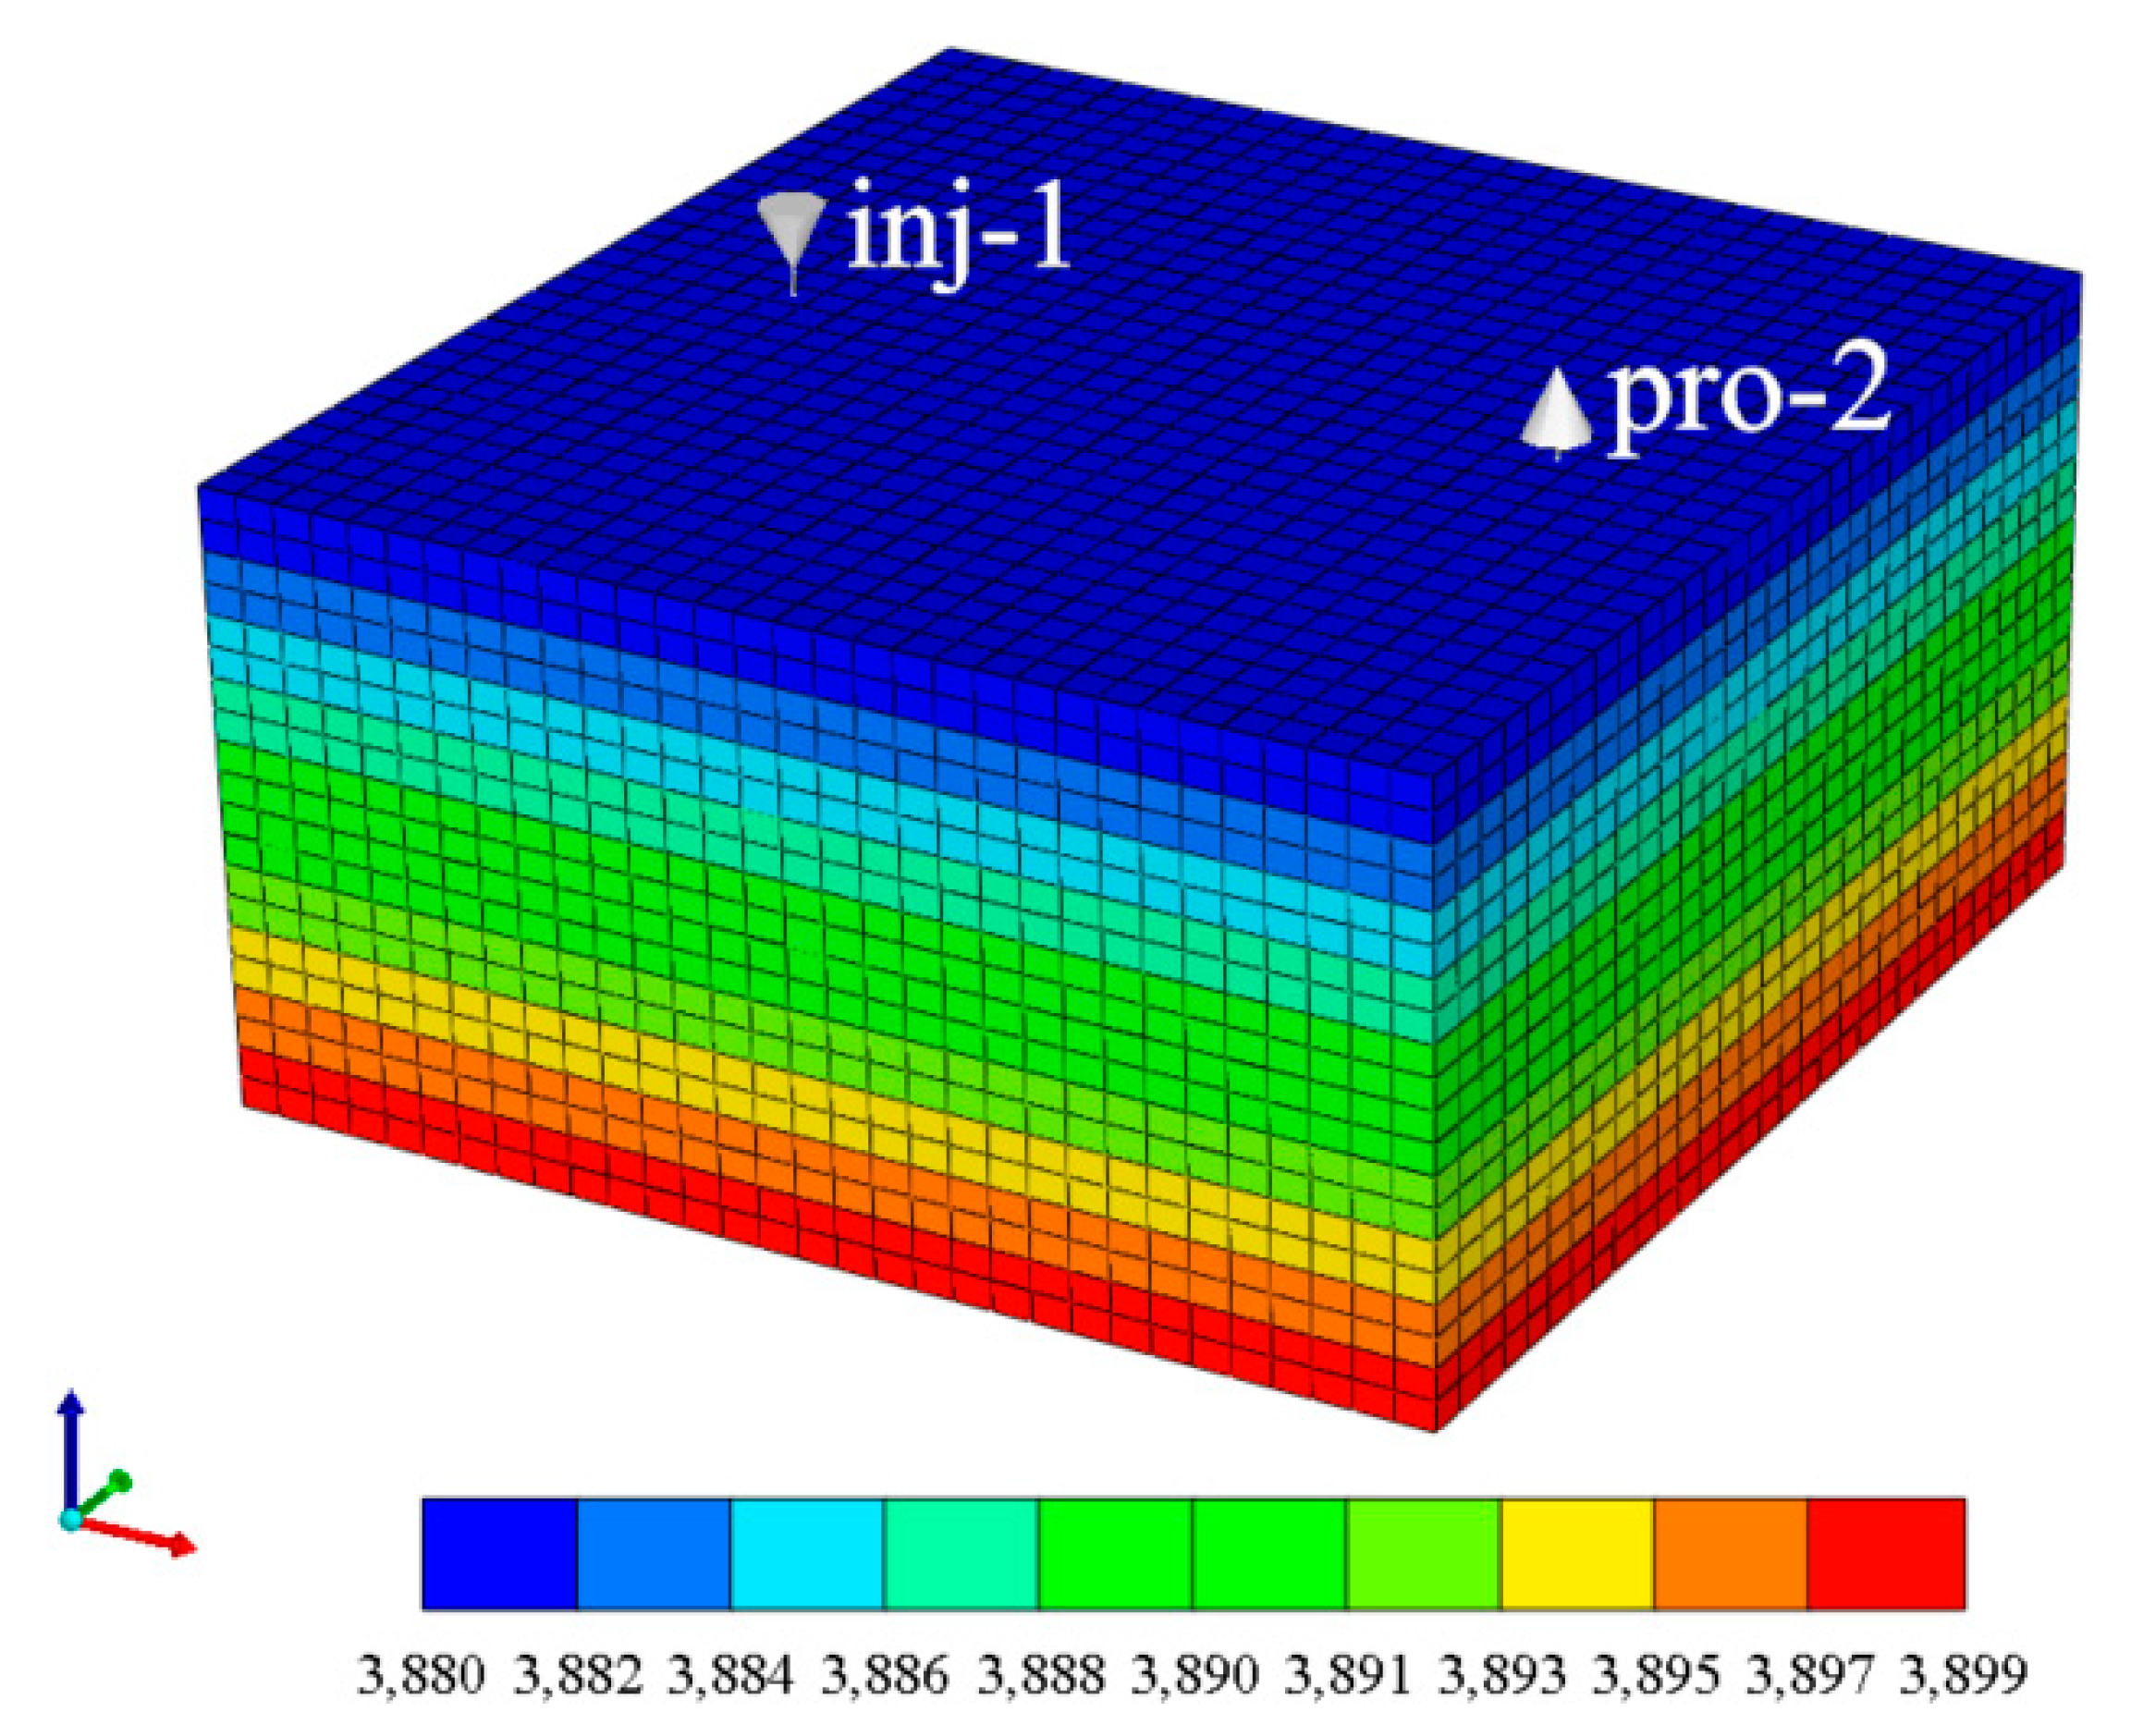
Figure 11: Three-dimensional grid schematic of the mechanistic model.
Relative permeability curves for all fluid phases are derived from core experiments and modeled using Corey-type correlations. For oil-water systems, end-point relative permeabilities are set as Kro = 0.8 (oil) and Krw = 0.25 (water), with Corey exponents of 3.0 and 2.2, respectively (Fig. 12a). For gas-water systems, end-point values are Krg = 0.9 (gas) and Krw = 0.25 (water), with Corey exponents of 2.5 and 2.2, respectively (Fig. 12b). These curves are input into CMG-GEM as tabular data to ensure accurate interpolation across varying saturation ranges, directly influencing displacement front stability and CO2 sweep efficiency. Capillary pressure is characterized using the Brooks-Corey model, with an entry pressure of 0.8 MPa and a pore-size distribution index (λ) of 2.0 (Fig. 13).
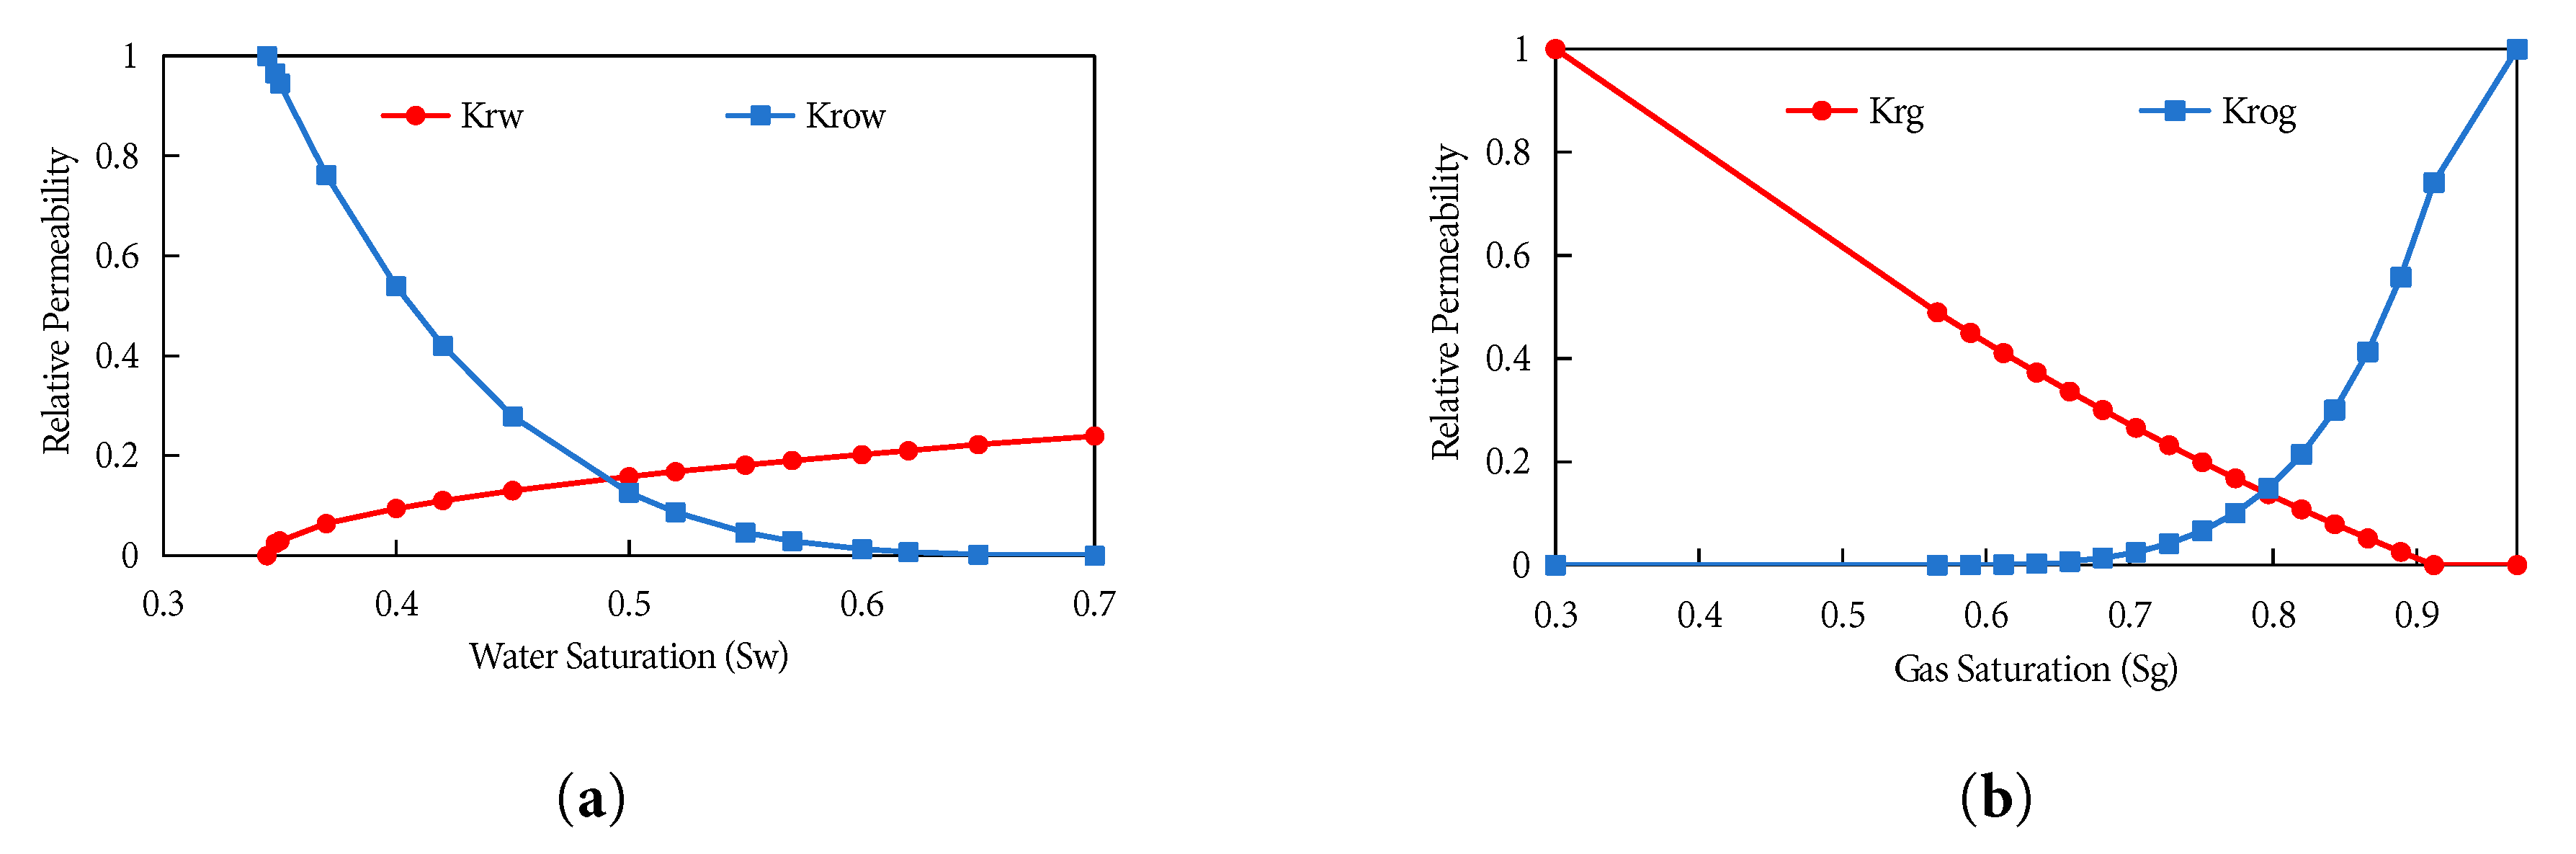
Figure 12: Relative Permeability Curves: (a) Oil-Water Relative Permeability Curve. (b) Gas-Water Relative Permeability Curve.
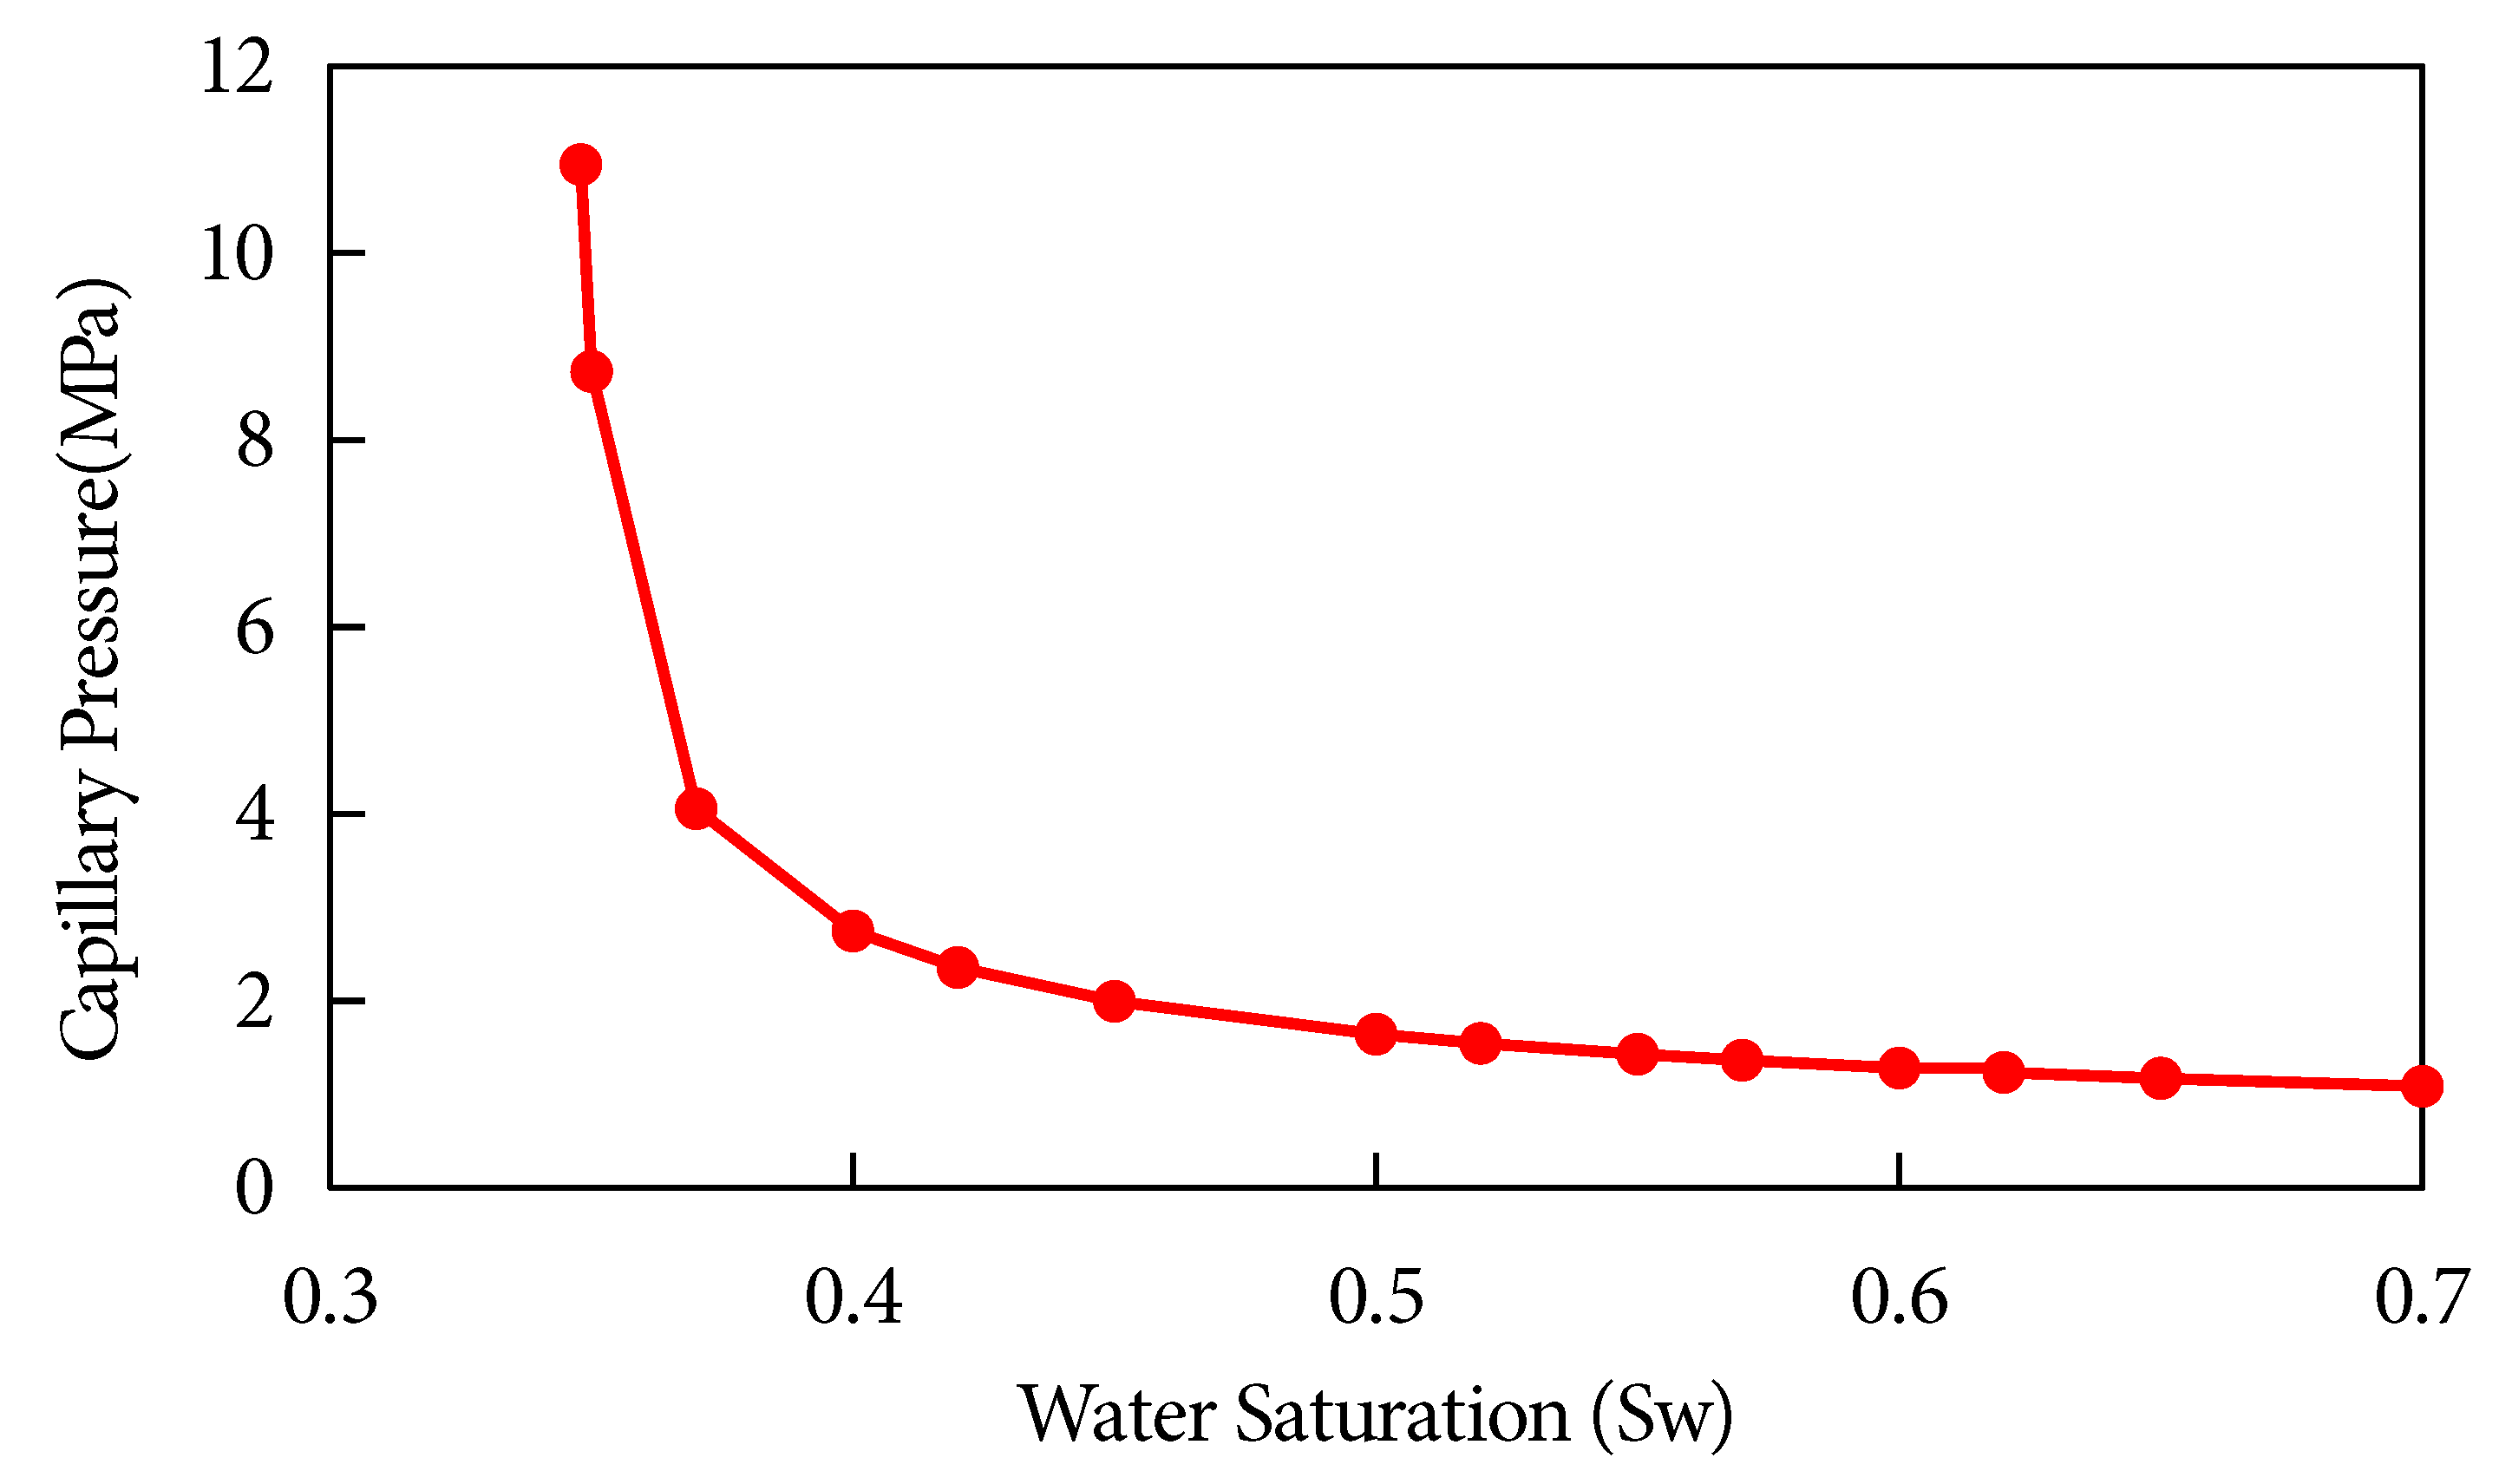
Figure 13: Capillary pressure curve.
4.2 Parameter Sensitivity Analysis
This model investigates the impact of CO2 injection on condensate oil recovery under varying permeability conditions, vertical heterogeneity patterns, injection pressures and injection rates. The findings will inform optimal well placement and dynamic production strategy adjustment through injection parameter optimization. The designed simulation cases are detailed in Table 7.
Table 7: Parameter design for numerical simulation cases.
| Influencing Factors | Scheme Parameters |
|---|---|
| Permeability | 1 mD |
| 10 mD | |
| 50 mD | |
| Heterogeneity | positive rythym |
| reverse rythym | |
| composite rythym | |
| Injection pressure | 13.5 MPa |
| 16.5 MPa | |
| 22.5 MPa | |
| 30 MPa | |
| Injection rate | 2 × 10⁴ m3/d |
| 3 × 10⁴ m3/d | |
| 4 × 10⁴ m3/d | |
| 5 × 10⁴ m3/d | |
| 6 × 10⁴ m3/d |
Under a controlled production rate of 50,000 m3/d, simulations evaluated CO2 injection effects over 10 years after depleting to 13.5 MPa in reservoirs with permeabilities of 1 mD, 10 mD and 50 mD. Fig. 14 illustrates condensate recovery factor and water cut variations. Condensate recovery increases with permeability due to higher CO2 displacement efficiency and superior gas mobility in high-permeability systems, which effectively mobilize condensate and reduce water cut. Specifically, as permeability increases from 1 mD to 50 mD, the 10-year condensate recovery factor rises by 12.3 percentage points (from 45.2% to 57.5%), with the most significant gain (7.1 percentage points) observed between 1 mD and 10 mD. For water cut dynamics, 1 mD reservoirs reach 0.45 by 2034, while 10 mD reservoirs remain below 0.30 until 2040; all cases show an inflection point in 2029, coinciding with CO2 injection initiation in 2028, confirming gas injection’s effect on delaying water cut rise. All reservoir cases complete depletion in 2028 (pressure dropping to 13.5 MPa) and initiate CO2 injection immediately; high-permeability (50 mD) reservoirs extend production to 2040—4 years longer than 1 mD reservoirs (producing until 2036). This difference directly reflects higher gas mobility and slower water breakthrough in high-perm systems, with a water cone advancement rate (0.8 m/year) only 53% of that in 1 mD reservoirs (1.5 m/year). Conversely, low-permeability reservoirs exhibit inefficient CO2 displacement fronts, restricted gas migration, and limited sweep—where competitive gas-water flow causes localized pressure fluctuations, merely delaying water cut rise. Permeability governs gas channeling velocity and sweep efficiency: High-permeability systems facilitate stable CO2 fronts that enhance recovery through gravity segregation and viscous fingering, displacing residual oil.
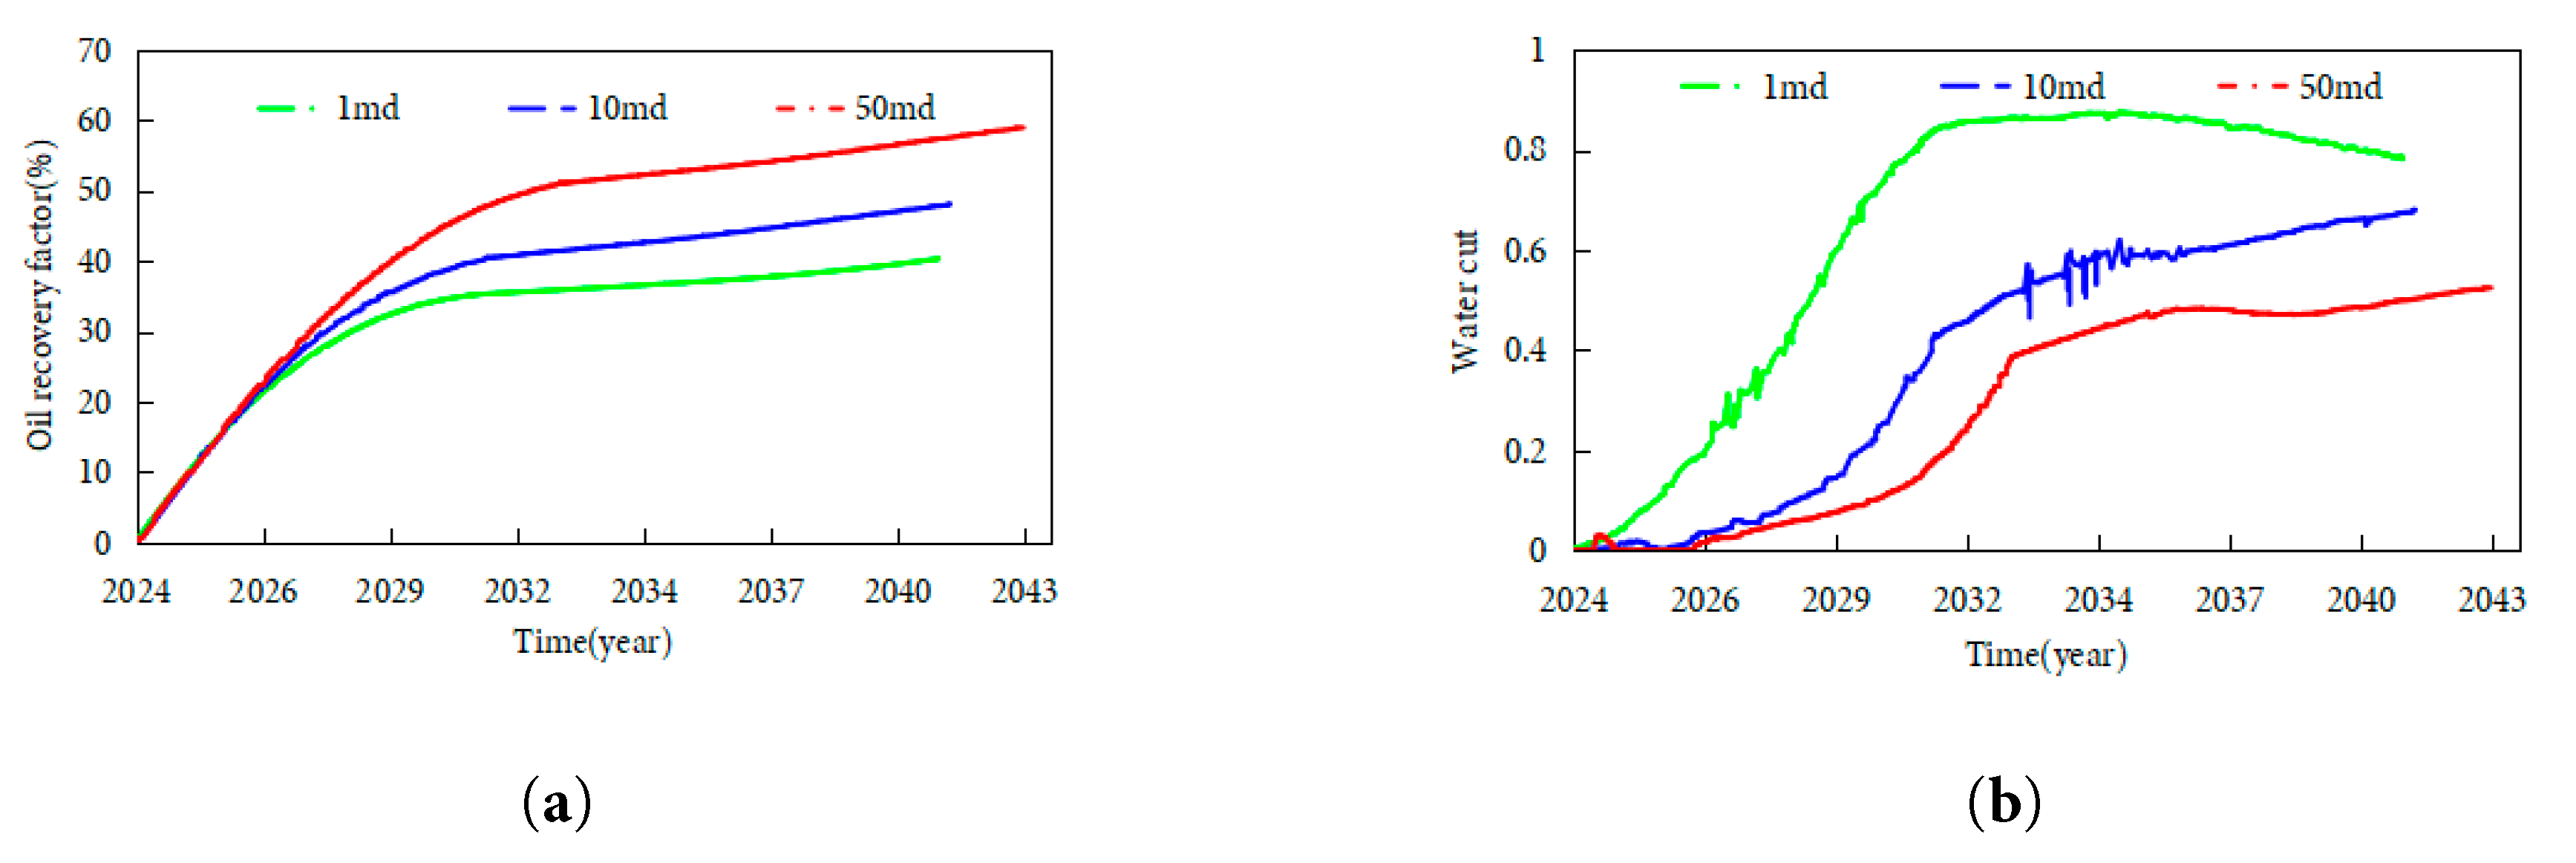
Figure 14: Condensate recovery and water cut under varying permeability: (a) Condensate recovery factor. (b) Water cut.
Fig. 15 presents water saturation distributions during CO2-enhanced recovery in reservoirs with different average permeabilities. Low-permeability reservoirs experience severe water encroachment with poor CO2 containment due to: (i) slow pressure transmission creating a pressure sink near producers, enabling bottomwater coning through high-perm channels; and (ii) limited CO2 diffusion preventing stable gas-cap barriers, allowing water relative permeability dominance and rapid aquifer influx. In high-permeability systems, CO2 rapidly breakthroughs via preferential paths without sufficient competition with bottomwater, resulting in unstable gas-water interfaces and early gas channeling, thus offering limited water control. Moderate-permeability reservoirs (10 mD) may achieve optimal balance. Quantitative analysis shows: 1 mD reservoirs exhibit water cones with a ~65° angle, 8.2 m vertical height (spanning 8–9 K-grids), extending 12 m from the well; 10 mD reservoirs have ~40° cones, 4.5 m height, confined within 6 m of the well. After 10 years of injection, 10 mD reservoirs achieve an 18 m radial CO2 sweep, pushing high water saturation (>0.6) 5–7 m from the well—twice the range of 1 mD reservoirs.
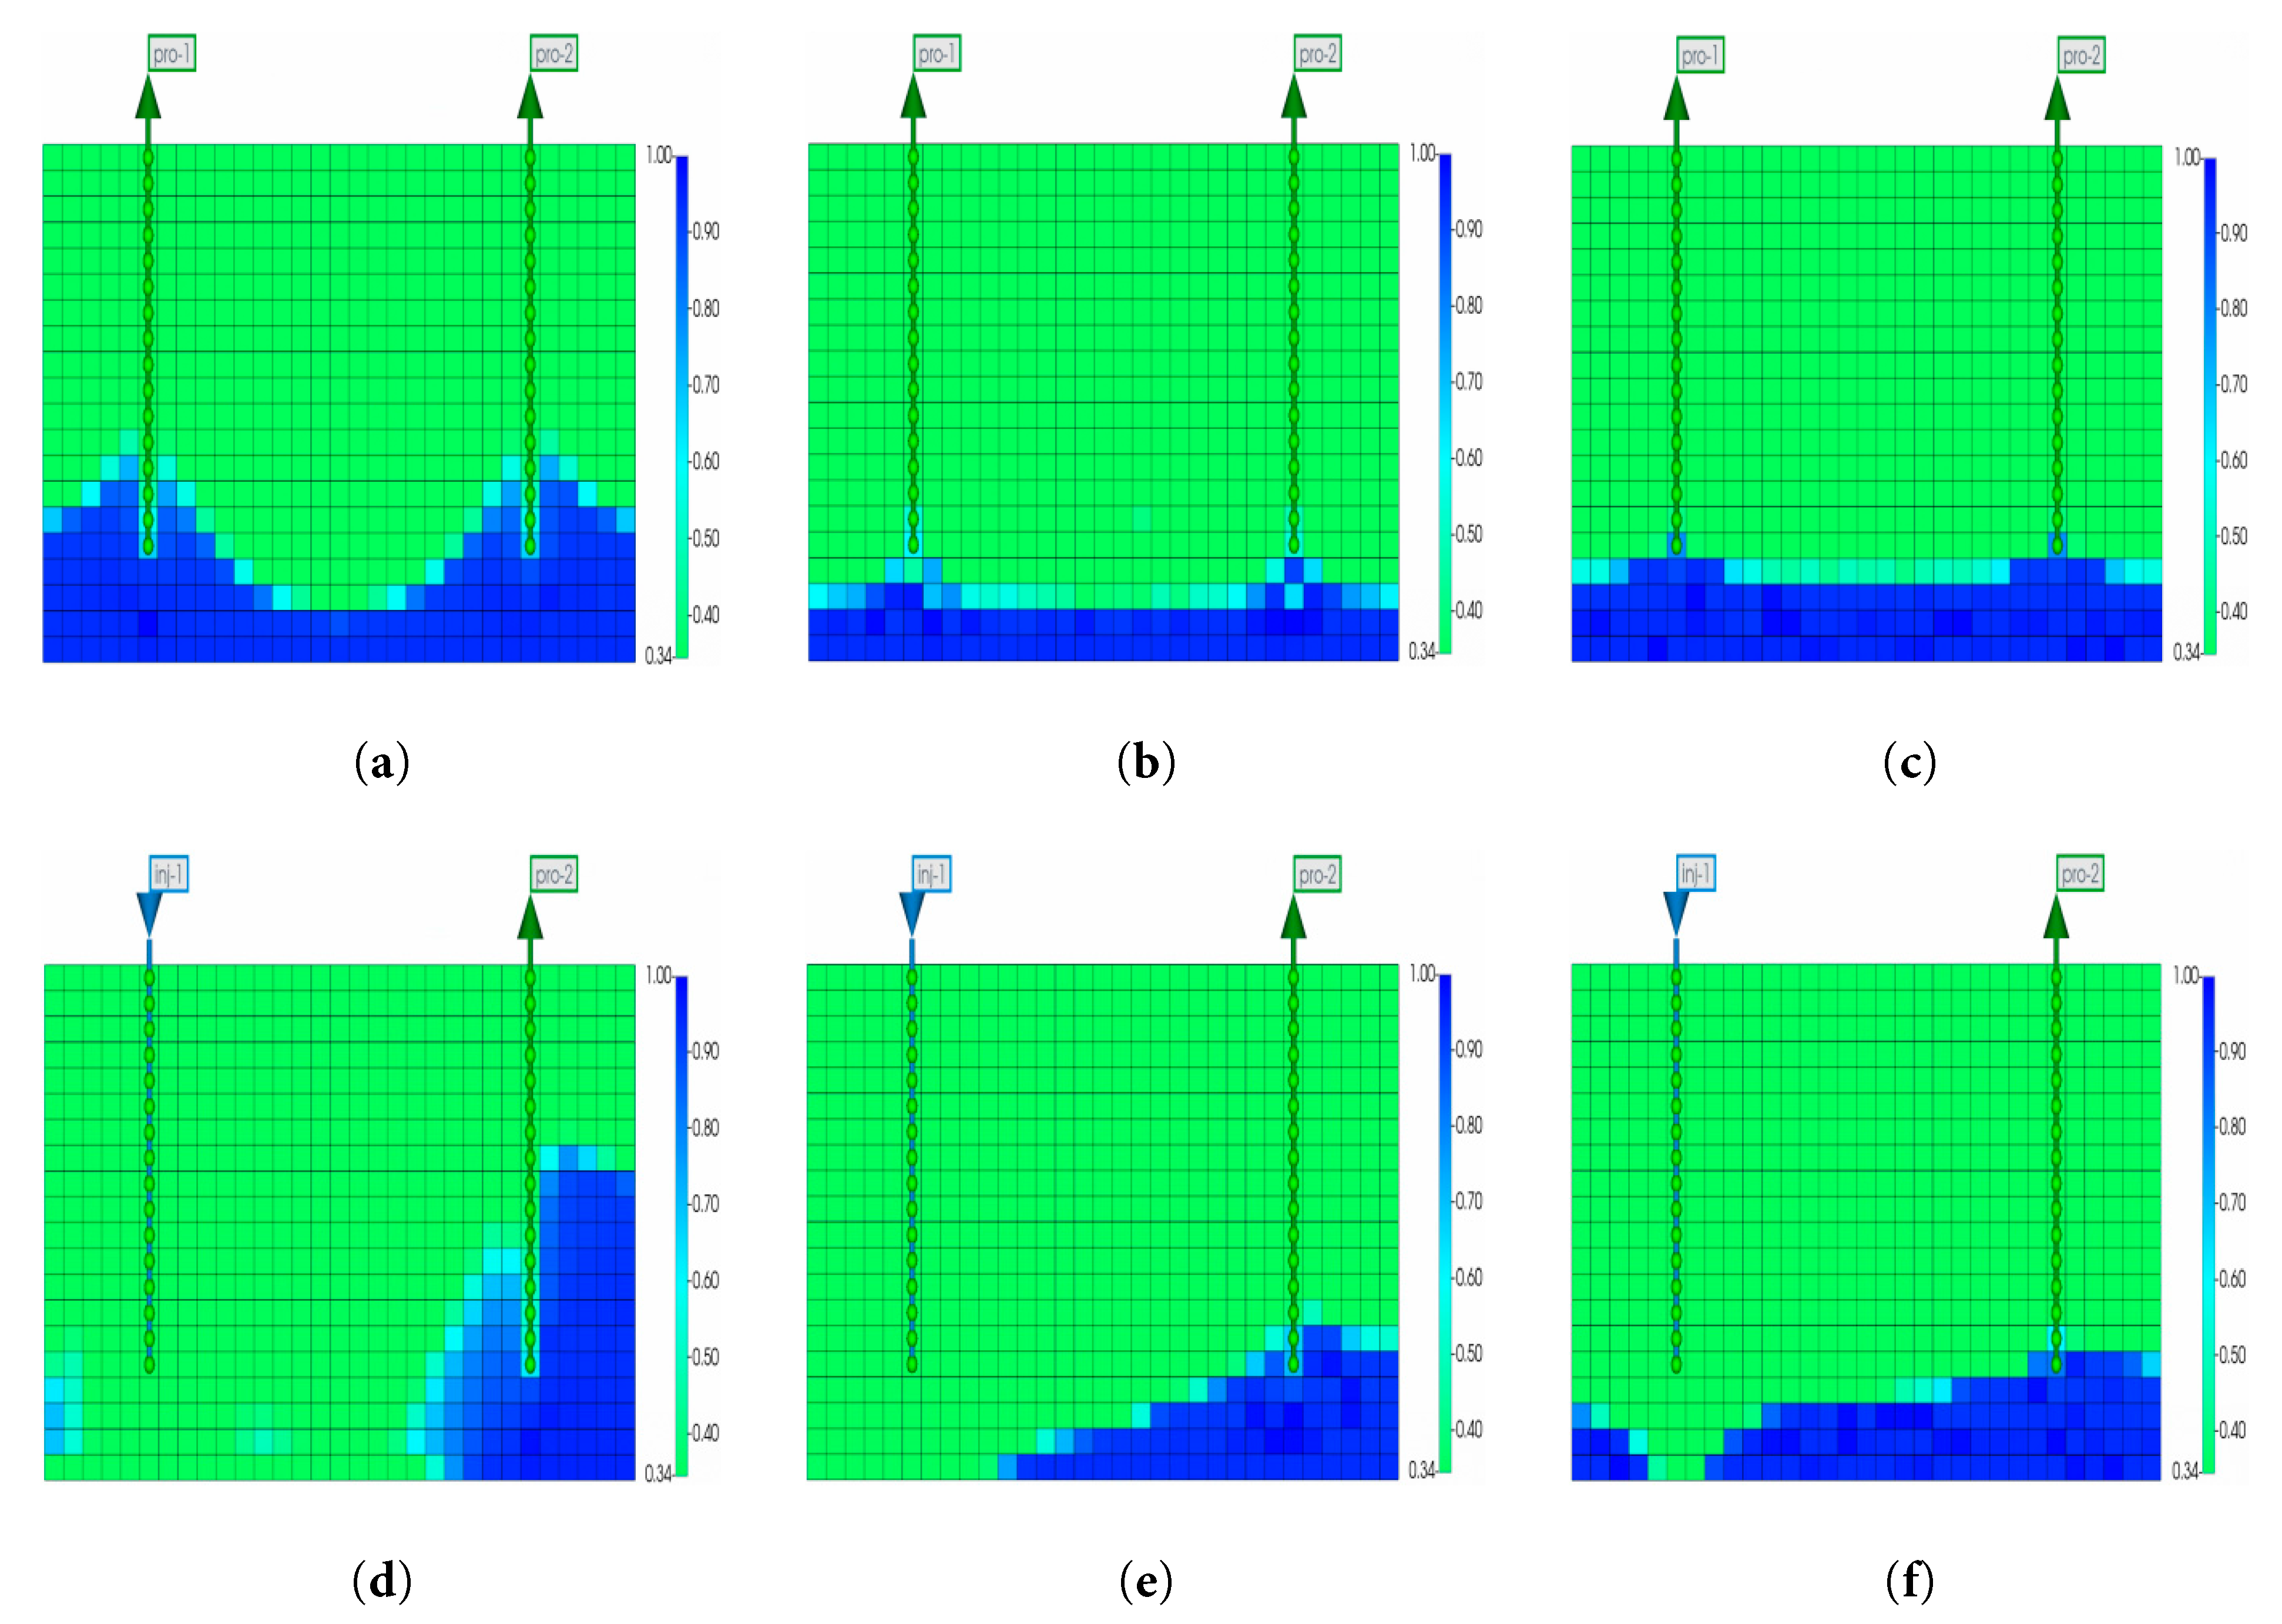
Figure 15: Water saturation distribution during reservoir development under varying permeability conditions: (a) 1 mD reservoir before gas injection. (b) 10 mD reservoir before gas injection. (c) 50 mD reservoir before gas injection. (d) 1 mD reservoir after 10 years of gas injection. (e) 10 mD reservoir after 10 years of gas injection. (f) 50 mD reservoir after 10 years of gas injection.
Building on prior findings, the 10 mD average permeability scenario demonstrated optimal recovery performance. Consequently, simulations evaluated CO2 injection over 10 years following depletion to 13.5 MPa in reservoirs exhibiting positive, reverse and composite rhythmicity patterns (all averaging 10 mD permeability). Fig. 16 illustrates condensate recovery factors and water cut trends. The composite rhythmic reservoir achieved the highest recovery due to alternating vertical permeability distribution: CO2 preferentially entered mid-section high-perm zones before bidirectionally diffusing, expanding sweep coverage to effectively displace condensate from central and partial upper/lower intervals. Simultaneously, heterogeneity mitigated extreme gas channeling and water encroachment, balancing displacement efficiency with aquifer control. Positive rhythmic reservoirs exhibited superior water encroachment suppression as CO2 formed gas barriers in basic high-perm zones, though accelerated bottomwater coning through porous media caused severe water saturation rise. Reverse and composite rhythmic patterns experienced less water encroachment—reverse reservoirs developed stable gas caps suppressing bottomwater rise, while composite systems partially blocked aquifer pathways through mid-section displacement. Both displayed comparable water control, though reverse rhythmicity’s low-perm basic zones limited recovery. Reservoir heterogeneity governs the trade-off between CO2 sweep efficiency and water encroachment risk, with compound rhythmicity optimizing displacement coverage and risk distribution, positive rhythmicity highlighting the displacement-aquifer conflict, and reverse rhythmicity compensating for local displacement deficiencies through water suppression. Specific data show: The 10-year recovery of composite rhythmic reservoirs reaches 58.6%, 6.3 percentage points higher than positive rhythmic reservoirs (52.3%) and 8.5 percentage points higher than reverse rhythmic reservoirs (50.1%). For water cut, composite rhythmic reservoirs exhibit the lowest annual rise rate (0.02), with a water cut of 0.32 by 2040, significantly lower than positive (0.41) and reverse (0.38) rhythms. All rhythmic reservoirs show a water cut inflection point in 2029, coinciding with CO2 injection initiation in 2028, confirming gas injection as the key to suppressing water cut rise. All reservoirs completed depletion (pressure 13.5 MPa) and initiated injection in 2028, with composite rhythmic reservoirs having the longest production cycle (until 2040), followed by positive (2038) and reverse (2037) rhythms, reflecting composite rhythm’s advantages in energy retention and water invasion control.
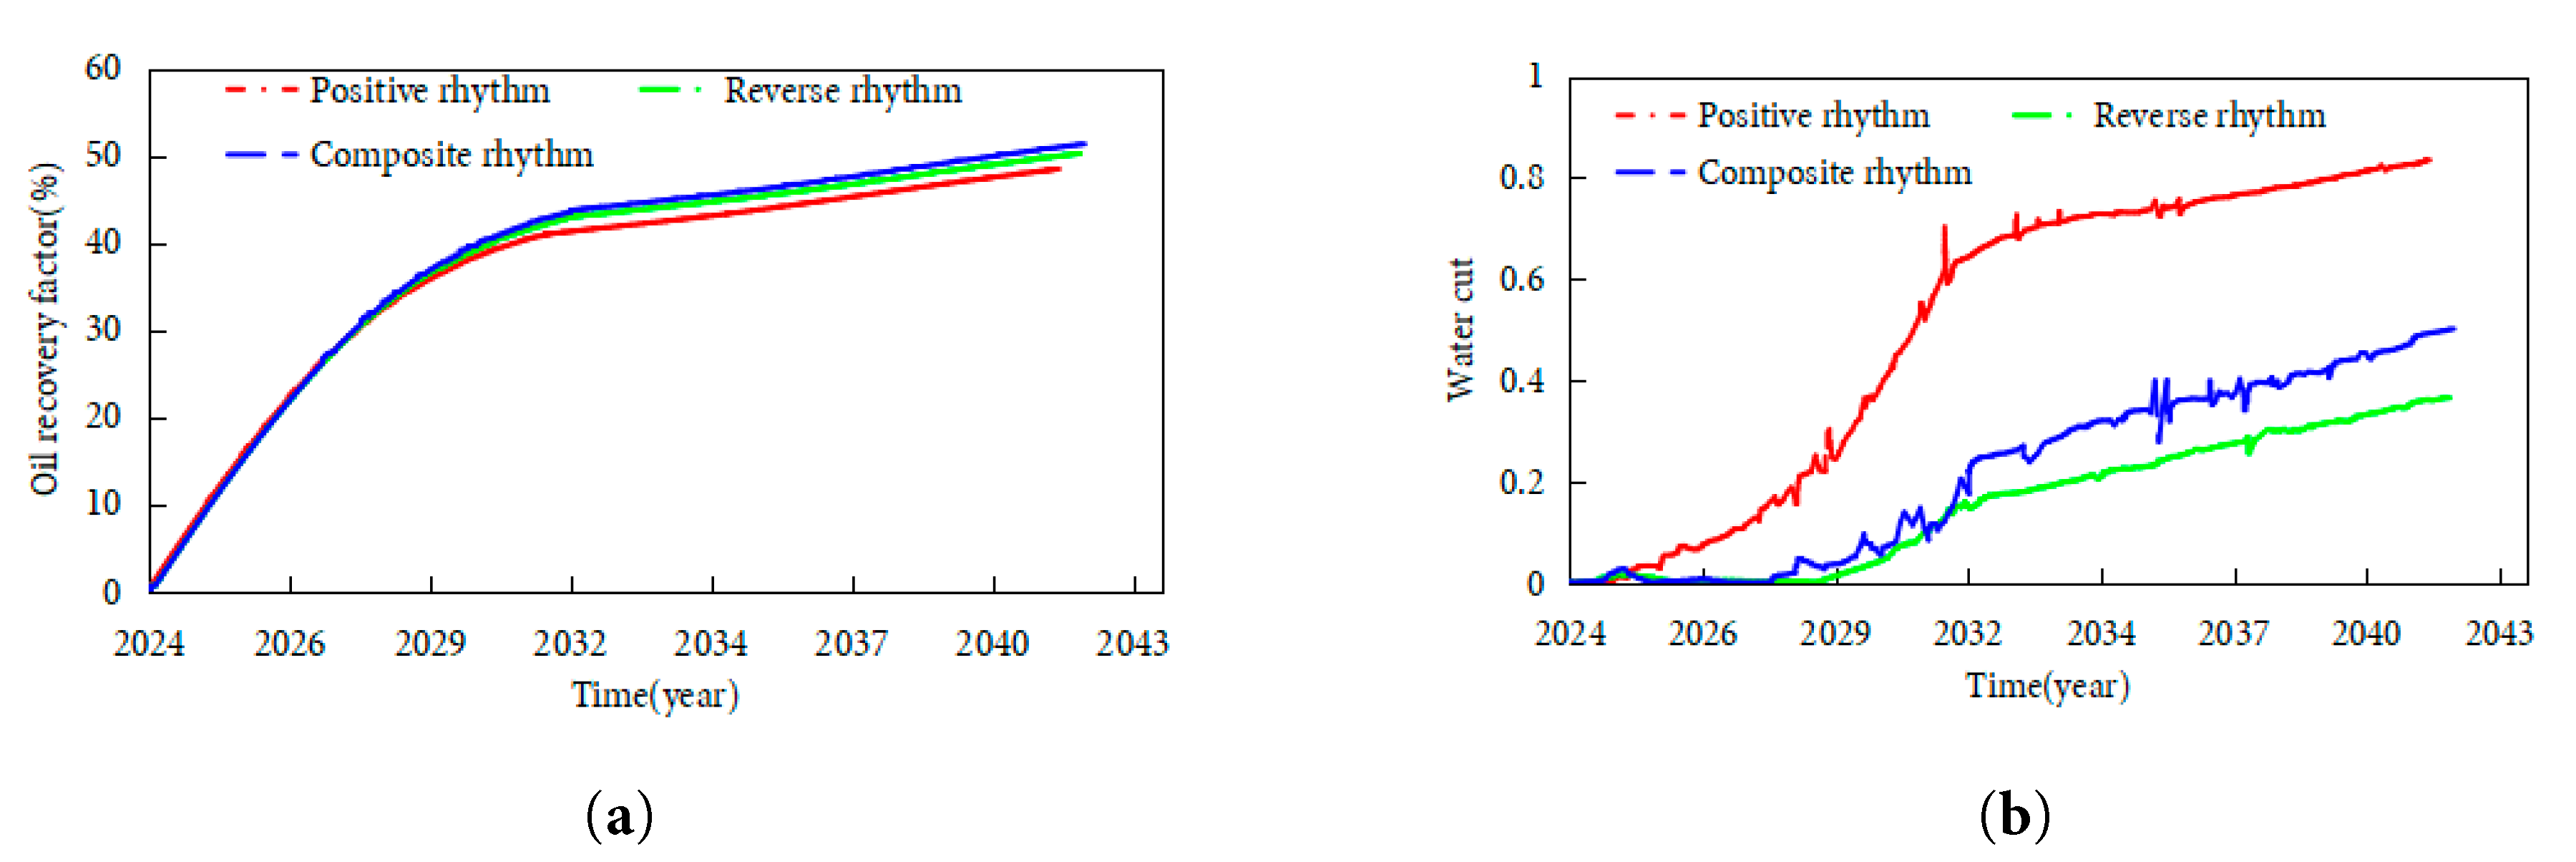
Figure 16: Condensate recovery and water cut with varying heterogeneity patterns: (a) Condensate recovery factor. (b) Water cut.
Fig. 17 depicts oil saturation distribution with different heterogeneity patterns. In positive rhythmic reservoirs, buoyancy-driven CO2 migrated toward the reservoir top, displacing basic condensate upward while bottom water coning through high-perm layers left residual oil trapped in low-perm upper zones. Reverse rhythmic systems experienced limited downward CO2 migration due to gravity effects, yielding minimal displacement of capillary-trapped basic condensate. Composite rhythmic reservoirs demonstrated superior dynamics: Injected CO2 first penetrated mid-section high-perm zones, laterally displacing condensate before buoyancy and capillary forces enabled upward migration through micro-fractures or interlayer discontinuities; concurrently, gravity and pressure gradients drove downward advancement in an inverted cone-shaped advance. This 3D expansion leveraged interlayer heterogeneity to contact oil-bearing upper/lower zones beyond single high-perm layers, achieving optimal displacement efficiency. Quantitative analysis shows: After gas injection in composite rhythmic reservoirs, oil saturation in high-perm intervals (10–15 mD) drops from initial 0.04 to below 0.01, forming a gentle oil cone (angle ~30°) with an oil sweep range of 15 m (distance from the well)—50% higher than positive rhythms (10 m) and 87.5% higher than reverse rhythms (8 m). The gas-injection oil displacement range reaches 12 m radially, with residual oil saturation in high-perm strips dropping to 0.008 and in low-perm intervals (5–8 mD) to below 0.02, significantly outperforming positive rhythms (residual oil 0.035 in low-perm zones) and reverse rhythms (residual oil 0.025 in high-perm zones).
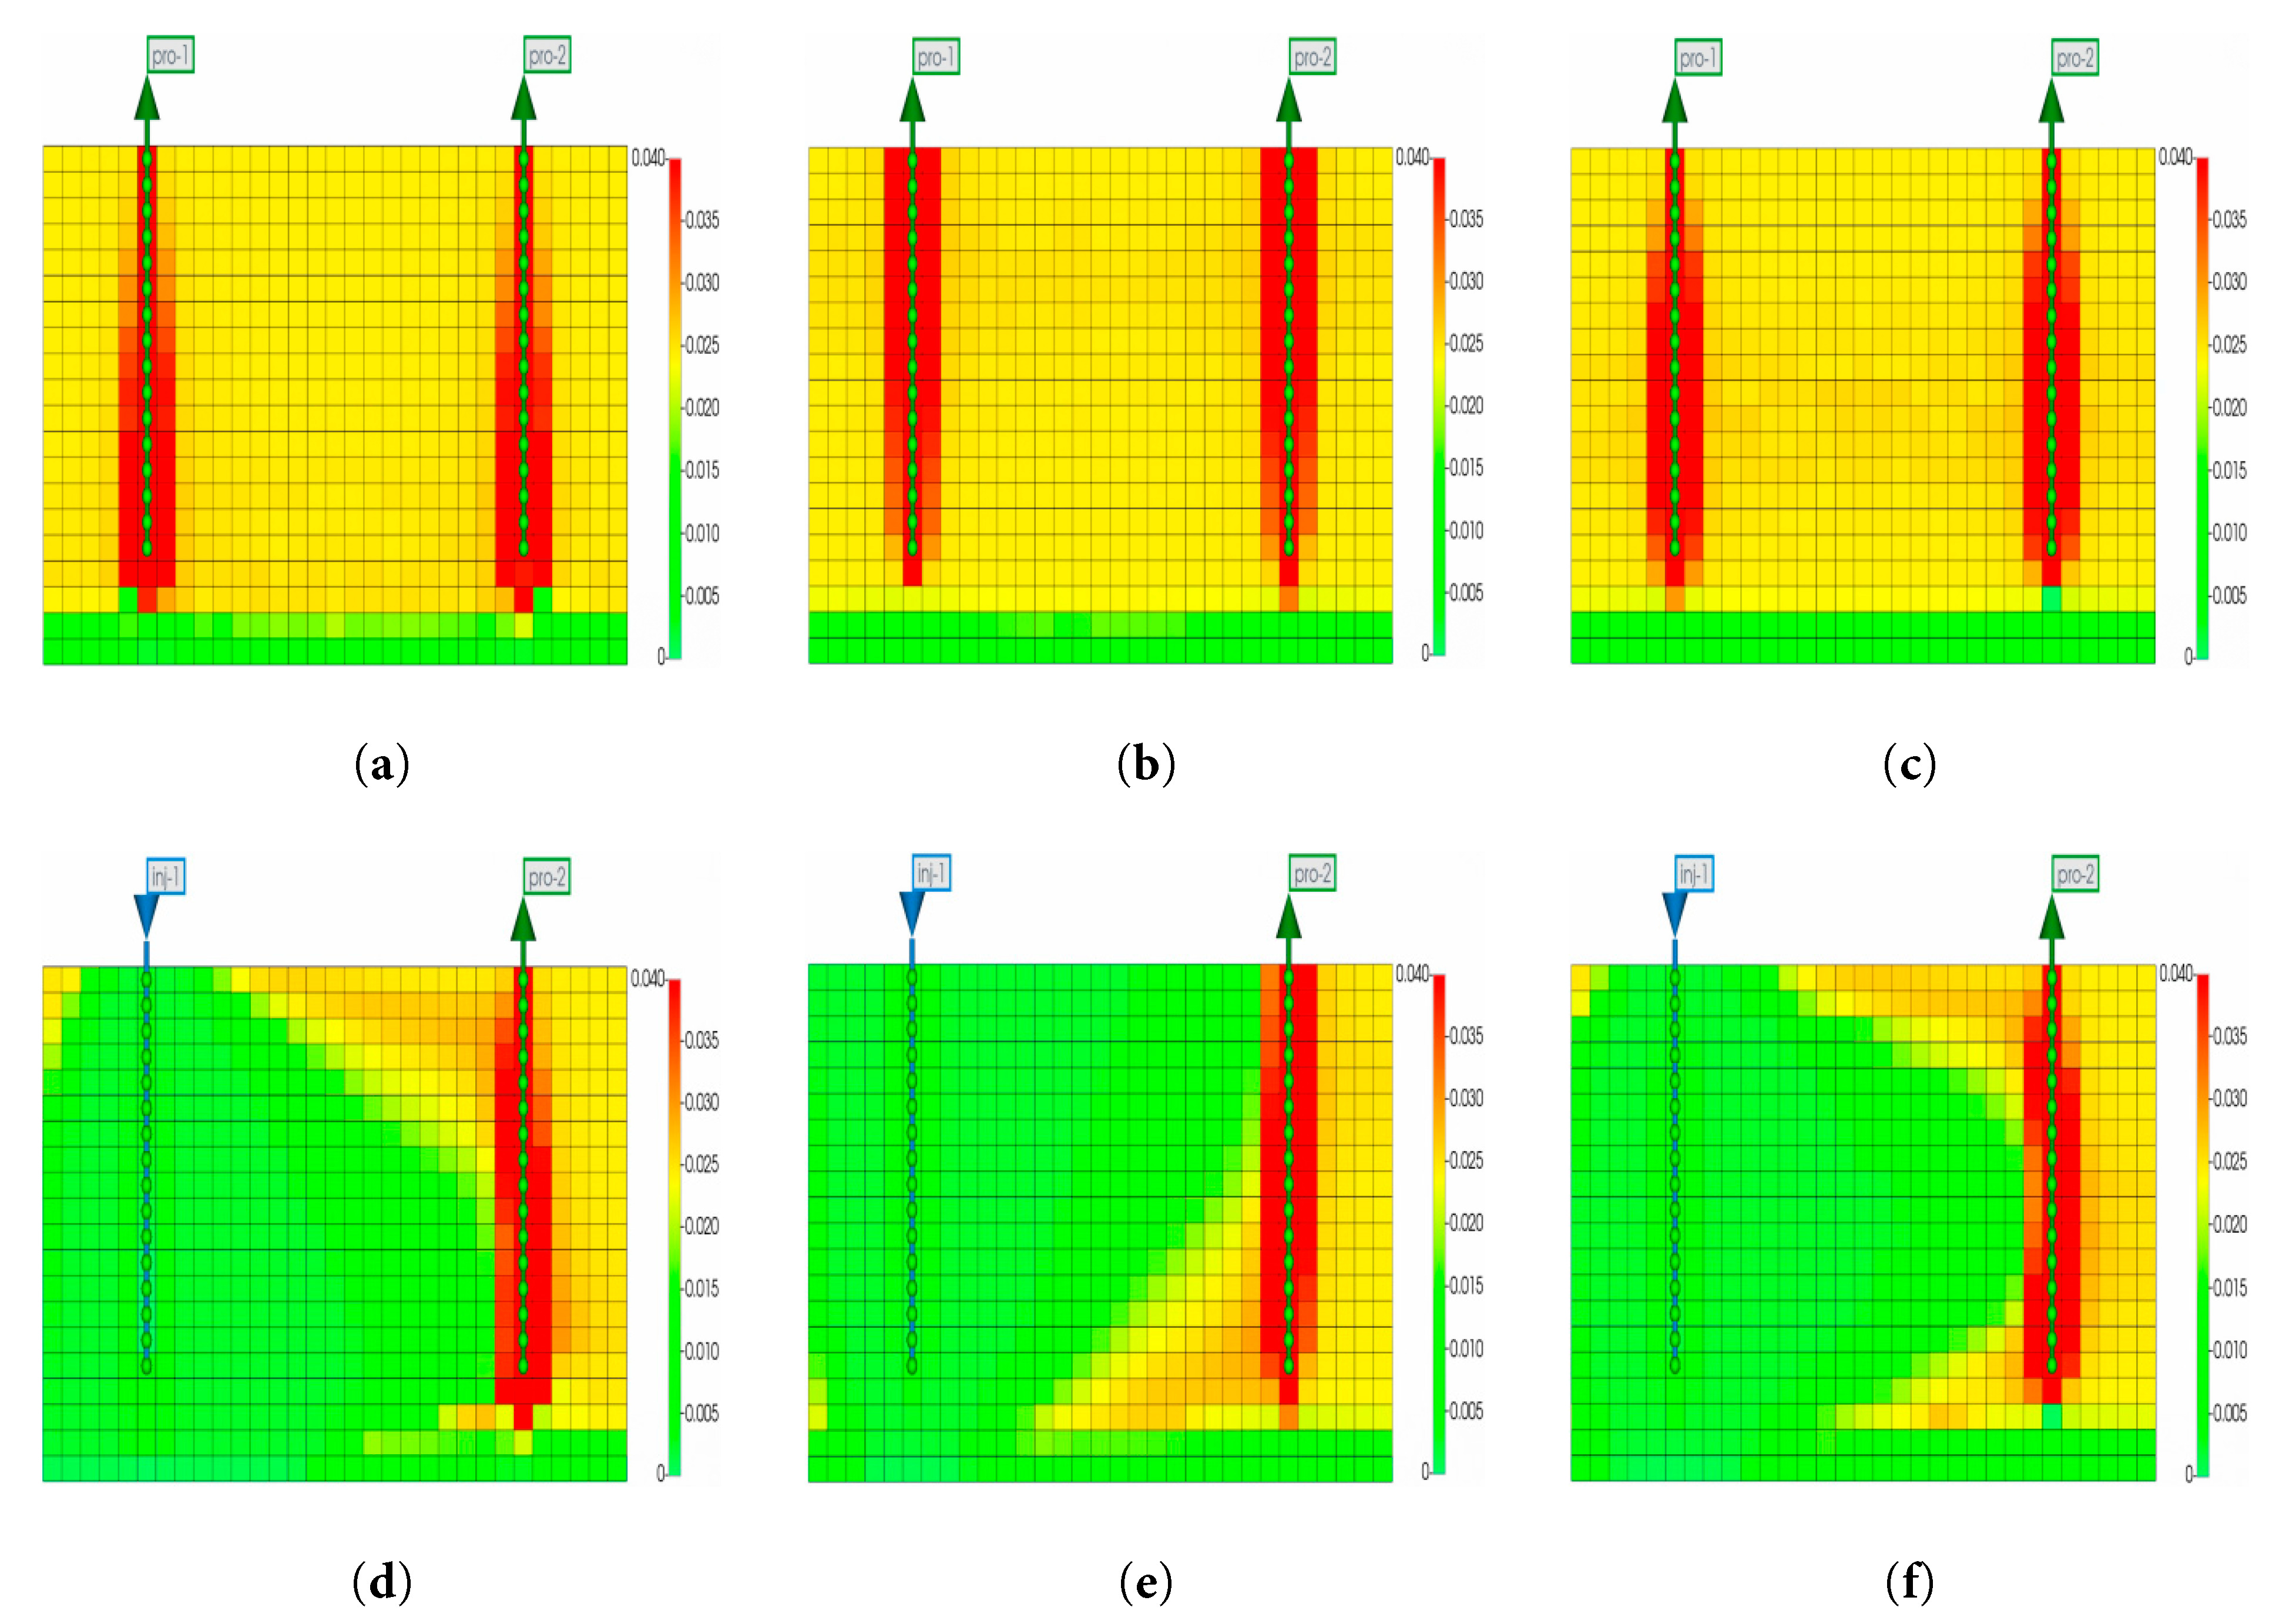
Figure 17: Oil saturation distribution under varying heterogeneity patterns: (a) Positive rhythmic reservoir before gas injection. (b) Reverse rhythmic reservoir before gas injection. (c) Composite rhythmic reservoir before gas injection. (d) Positive rhythmic reservoir after 10 years of gas injection. (e) Reverse rhythmic reservoir after 10 years of gas injection. (f) Composite reservoir after 10 years of gas injection.
Based on the research from the previous section, the development of condensate gas reservoirs using CO2 injection in a composite rhythmic pattern yields the best results. Therefore, based on numerical simulations of the composite rhythmic pattern, the effects of CO2 injection for 10 years under different injection pressures (13.5 MPa, 16.5 MPa, 22.5 MPa, and 30 MPa) following depletion were simulated. The changes in condensate gas reservoir recovery factor and water cut are shown in Fig. 18. Quantitative analysis of Fig. 16 reveals that at 13.5 MPa, the 10-year condensate recovery factor is 43.7%; at 16.5 MPa, it increases to 48.9% (+5.2 percentage points); at 22.5 MPa (above MMP), it jumps to 60.9% (+12.0 percentage points vs. 16.5 MPa); at 30 MPa, it reaches 61.2% (+0.3 percentage points vs. 22.5 MPa), with water cuts of 0.52, 0.47, 0.35, and 0.34 by 2040, respectively. A consistent inflection point occurs in 2029 across all cases, immediately after CO2 injection initiation in 2028, while production cycles differ by pressure: 13.5 MPa ends in 2036, 16.5 MPa in 2038, 22.5 MPa and 30 MPa extend to 2040. The results indicate that during CO2 flooding, the higher the formation pressure recovery, the better the suppression of water invasion, and the more effective CO2 injection is at improving condensate oil recovery. As the injection pressure increases, the recovery rate improves significantly. This is because at 21.5 MPa, the minimum miscibility pressure (MMP) is reached, and CO2 forms a miscible phase with the condensate oil. The interfacial tension approaches zero, enhancing mobility, while the CO2 diffusion area expands. As a result, condensate oil saturation significantly decreases (see Fig. 19). Fig. 19 shows that at 22.5 MPa, CO2 forms a broad front with a ~25° angle, extending 22 m radially—1.8 times the range at 13.5 MPa—reducing oil saturation from 0.04 to <0.01 in 75% of the swept area, with displacement covering 18 m radially, compared to 10 m at 13.5 MPa. In the case of immiscible displacement (at 13.5 MPa and 16.5 MPa), the CO2 displacement energy is insufficient, and the bottom water advances along the high-permeability layers, causing the water cut to rise rapidly. In miscible displacement (at 22.5 MPa and 30 MPa), CO2 occupies the pores and forms a gas displacement barrier, which suppresses the water invasion path, thereby slowing down the increase in water cut.
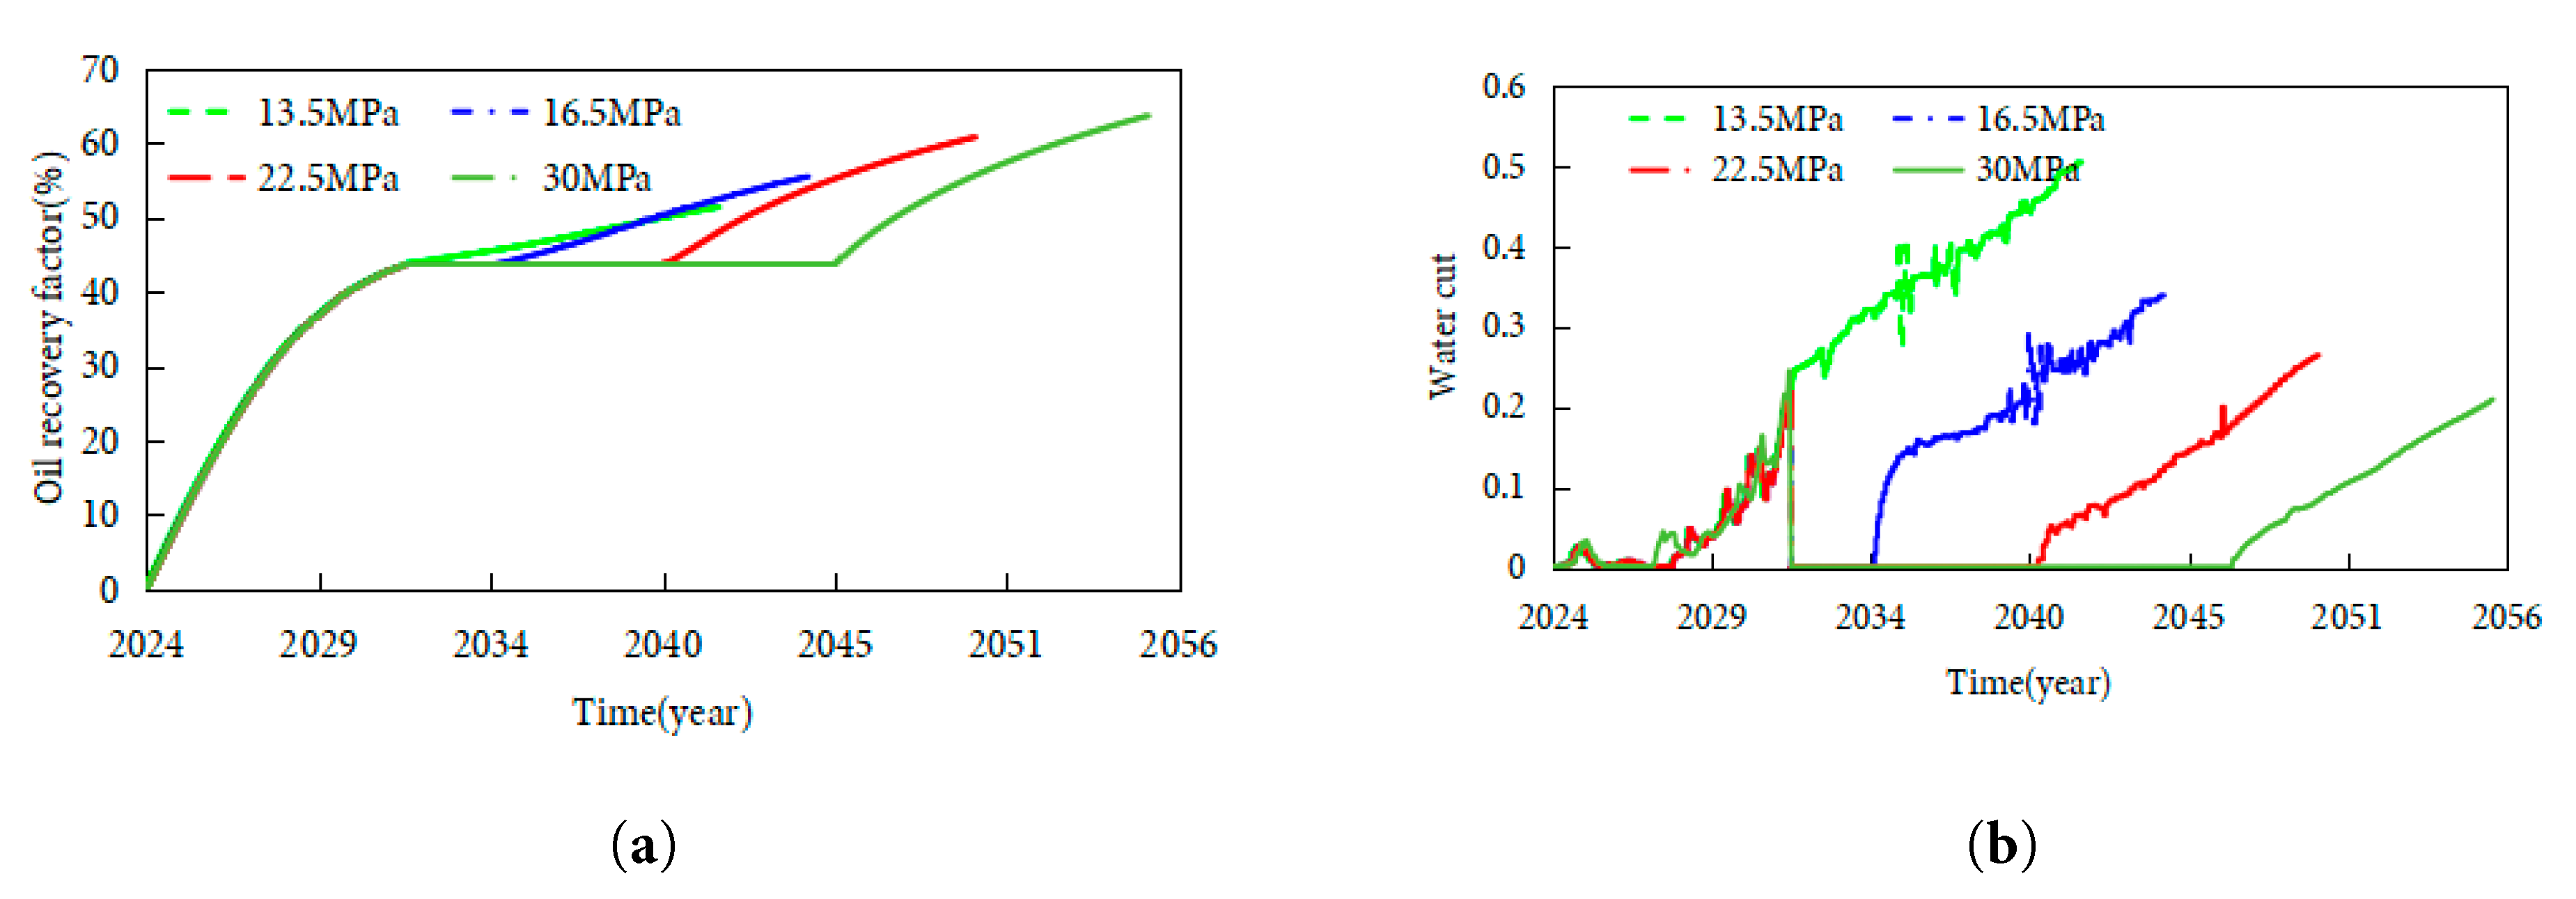
Figure 18: Condensate recovery and water cut under varying injection pressures: (a) Condensate recovery factor. (b) Water cut.
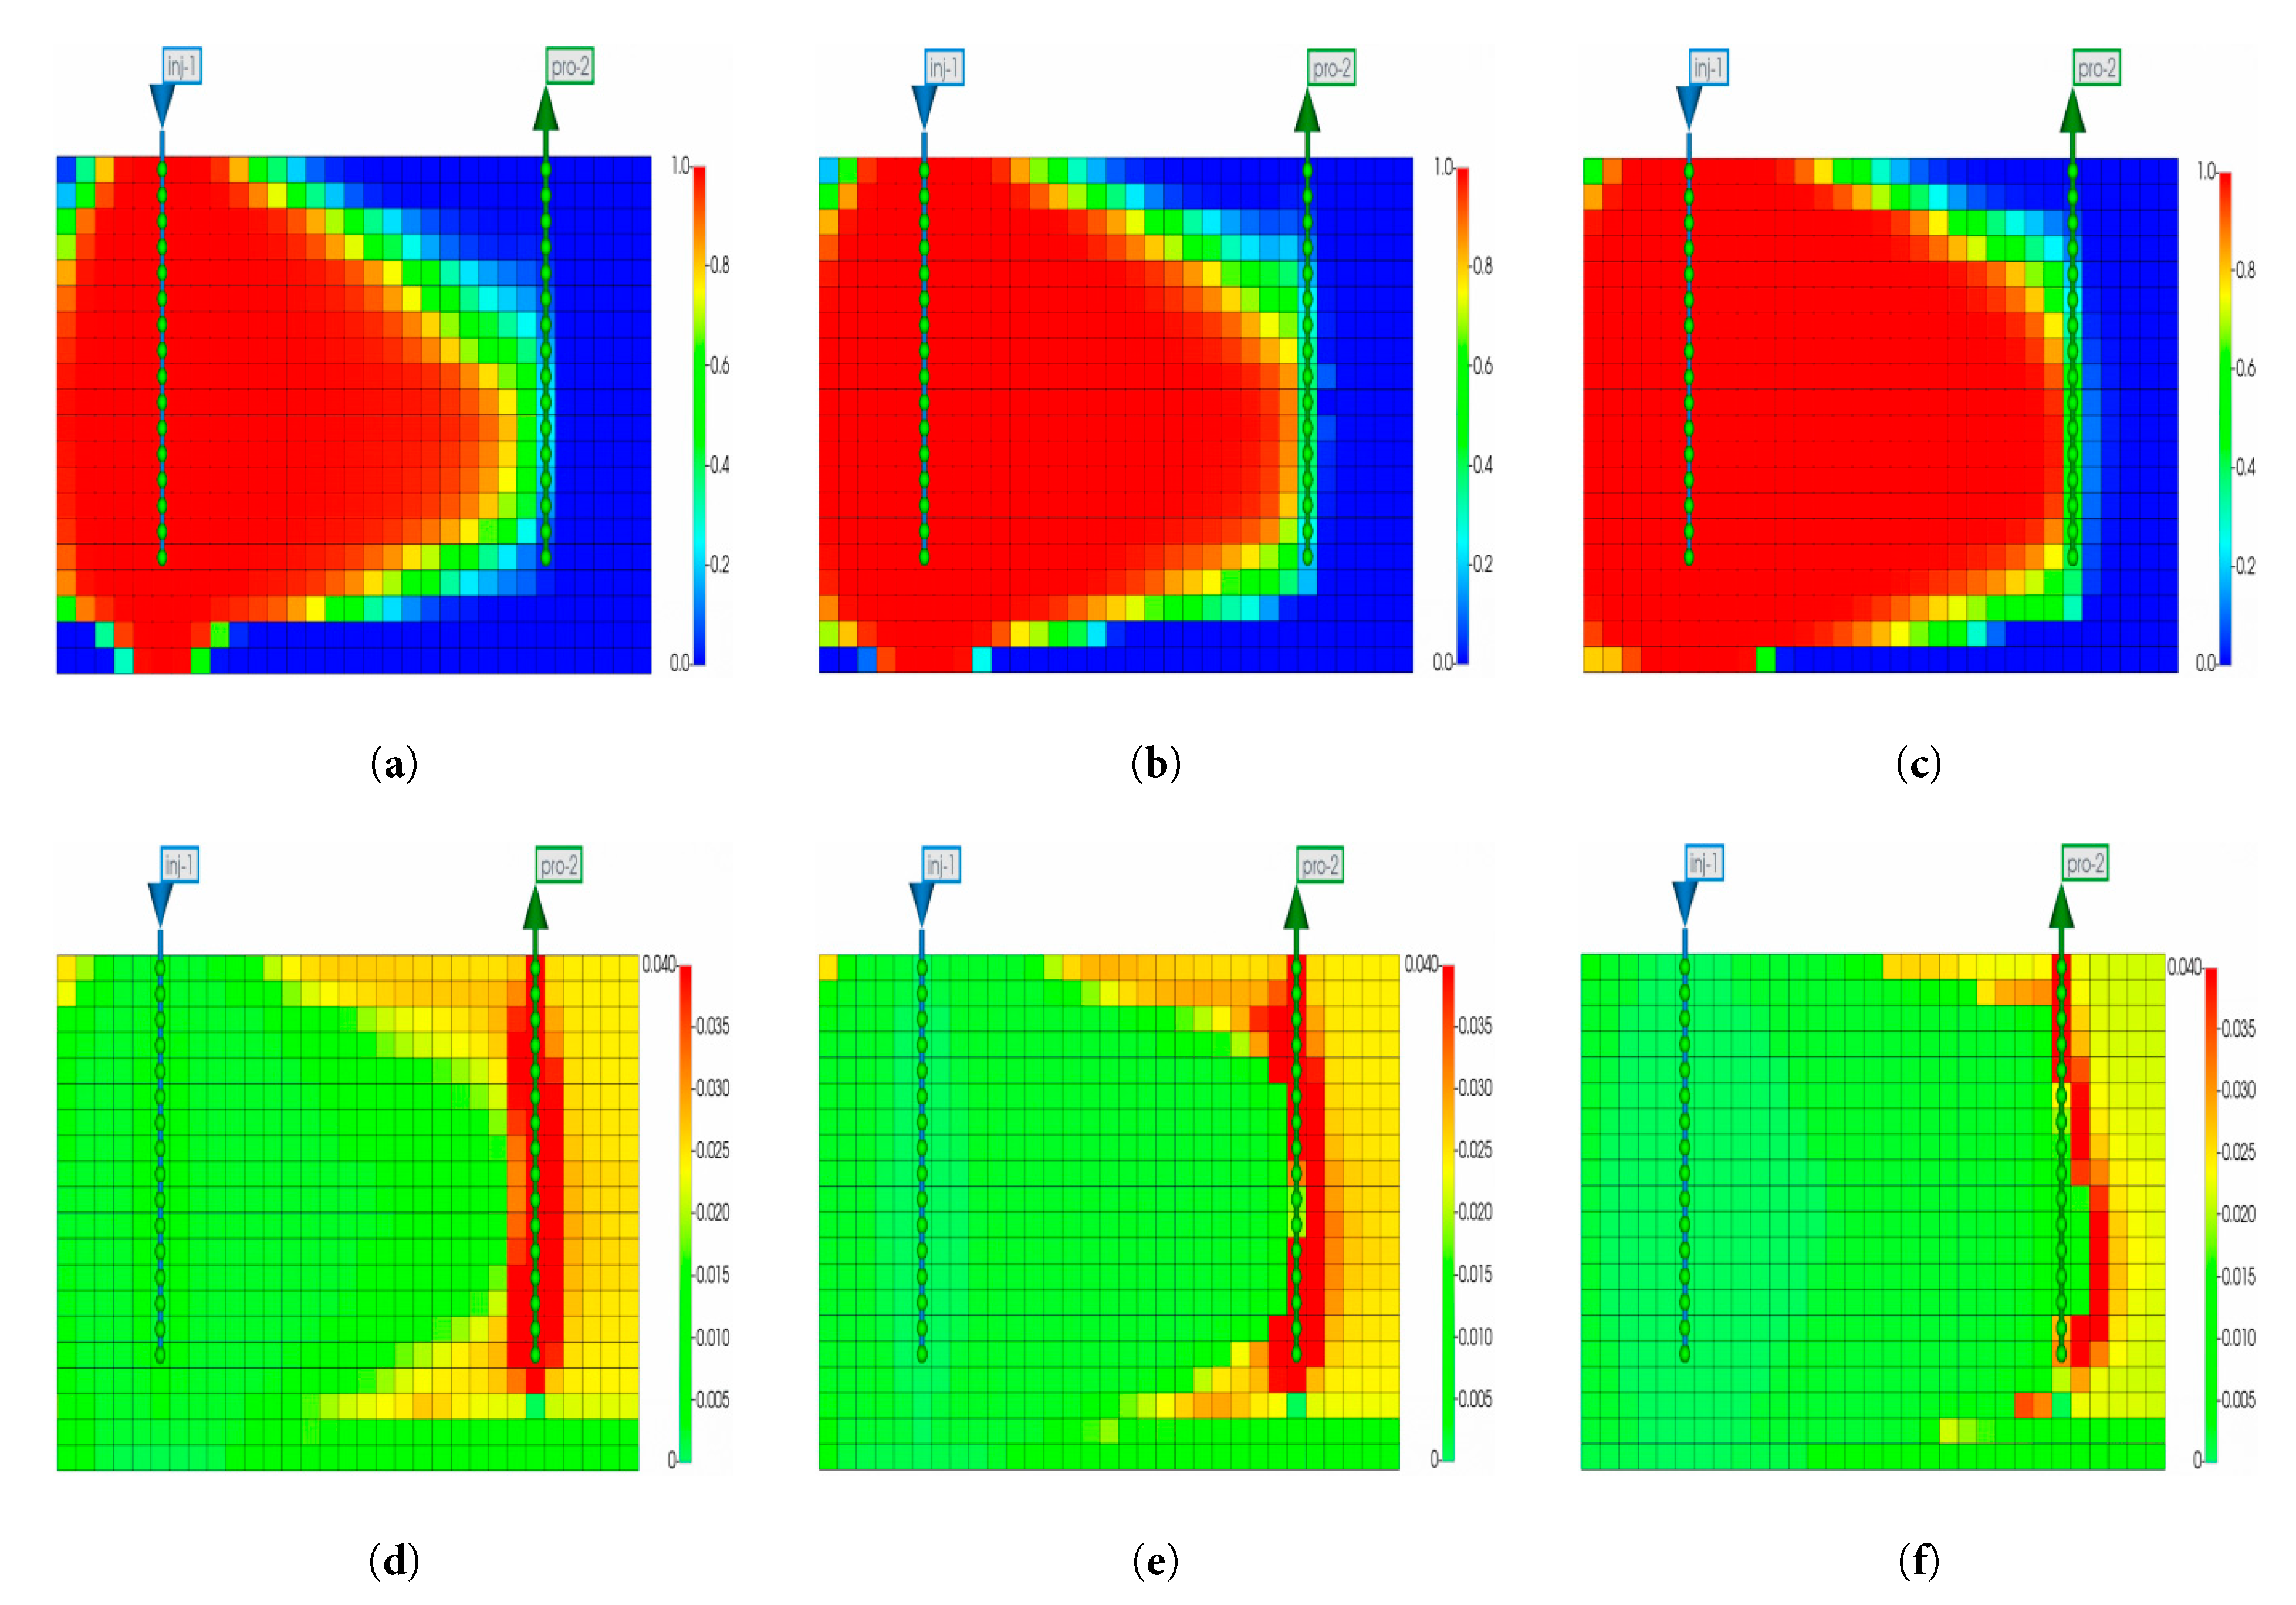
Figure 19: CO2 migration and condensate oil saturation changes under different injection pressures after 10 years: (a) CO2 migration at 13.5 MPa. (b) CO2 migration at 16.5 MPa. (c) CO2 migration at 22.5 MPa (d) Condensate oil saturation at 13.5 MPa. (e) Condensate oil saturation at 16.5 MPa. (f) Condensate oil saturation at 22.5 MPa.
Based on the previous study, CO2 injection at a pressure of 22.5 MPa under the composite rhythmic model yields the best development performance for the condensate gas reservoir. Building upon this model, the effect of varying injection rates from 2 × 10⁴ m3/d to 6 × 10⁴ m3/d over a 10-year production period was investigated. Quantitative analysis of Fig. 20 shows distinct trends across injection rates: At 2 × 10⁴ m3/d, the 10-year condensate recovery factor is 52.6%, with a water cut of 0.48 by 2040; at 3 × 10⁴ m3/d, recovery rises to 55.8% (+3.2 percentage points) and water cut drops to 0.43; at 4 × 10⁴ m3/d, recovery reaches 58.9% (+3.1 percentage points) with a water cut of 0.39; at 5 × 10⁴ m3/d, recovery peaks at 60.9% (+2.0 percentage points) and water cut stabilizes at 0.35; at 6 × 10⁴ m3/d, recovery only increases marginally to 61.2% (+0.3 percentage points) while water cut rises slightly to 0.36 due to gas channeling. A consistent water cut inflection point occurs in 2029 for all cases, immediately following CO2 injection initiation in 2028, confirming the causal link to gas injection. All scenarios complete depletion by 2028 (pressure 13.5 MPa) and start injection simultaneously, but production cycles differ: 2 × 10⁴–4 × 10⁴ m3/d terminate in 2038, while 5 × 10⁴–6 × 10⁴ m3/d extend to 2040 due to sustained energy support. As shown in Fig. 20, increasing the injection rate leads to a slower rise in water cut, indicating a more effective suppression of bottom-water coning and a greater improvement in condensate oil recovery. When the injection rate increases from 2 × 10⁴ m3/d to 6 × 10⁴ m3/d, the oil recovery improves significantly. This is because a higher injection rate can rapidly replenish reservoir energy, enhance the lateral sweep efficiency of CO2, and drive more condensate oil toward the production wells, as illustrated in Fig. 21. Fig. 21 reveals detailed oil saturation changes: At 5 × 10⁴ m3/d, oil saturation in high-permeability zones (10–15 mD) drops from 0.04 to below 0.01, forming a gentle displacement front with a radial angle of ~25°, extending 18 m from the well—1.5 times the sweep range of 2 × 10⁴ m3/d (12 m). Residual oil saturation (>0.02) is confined to areas 8 m beyond the wellbore, compared to 5 m at 6 × 10⁴ m3/d (due to gas channeling creating steeper fronts with ~40° angles). CO2-driven oil displacement covers 15 m radially at 5 × 10⁴ m3/d, pushing residual oil 6–8 m away from high-permeability channels, whereas 6 × 10⁴ m3/d shows uneven displacement with localized saturation spikes near the well. Simultaneously, miscible displacement reduces interfacial tension and improves fluid mobility. At high injection rates (greater than 5 × 10⁴ m3/d), CO2 occupies the pore space and forms a gas-drive barrier, effectively suppressing bottom-water intrusion along high-permeability layers, thereby slowing the water cut increase. However, when the injection rate exceeds 5 × 10⁴ m3/d, the risk of gas channeling intensifies. The gas front may prematurely break through to production wells, resulting in reduced sweep efficiency and diminishing incremental oil recovery. Therefore, the injection rate must strike a balance between reservoir energy support and the risk of gas channeling. An injection rate of 5 × 10⁴ m3/d is identified as the critical threshold, optimizing both condensate oil displacement efficiency and water invasion control. Beyond this rate, gas channeling leads to diminishing marginal returns, indicating the need for integrated technical and economic optimization.
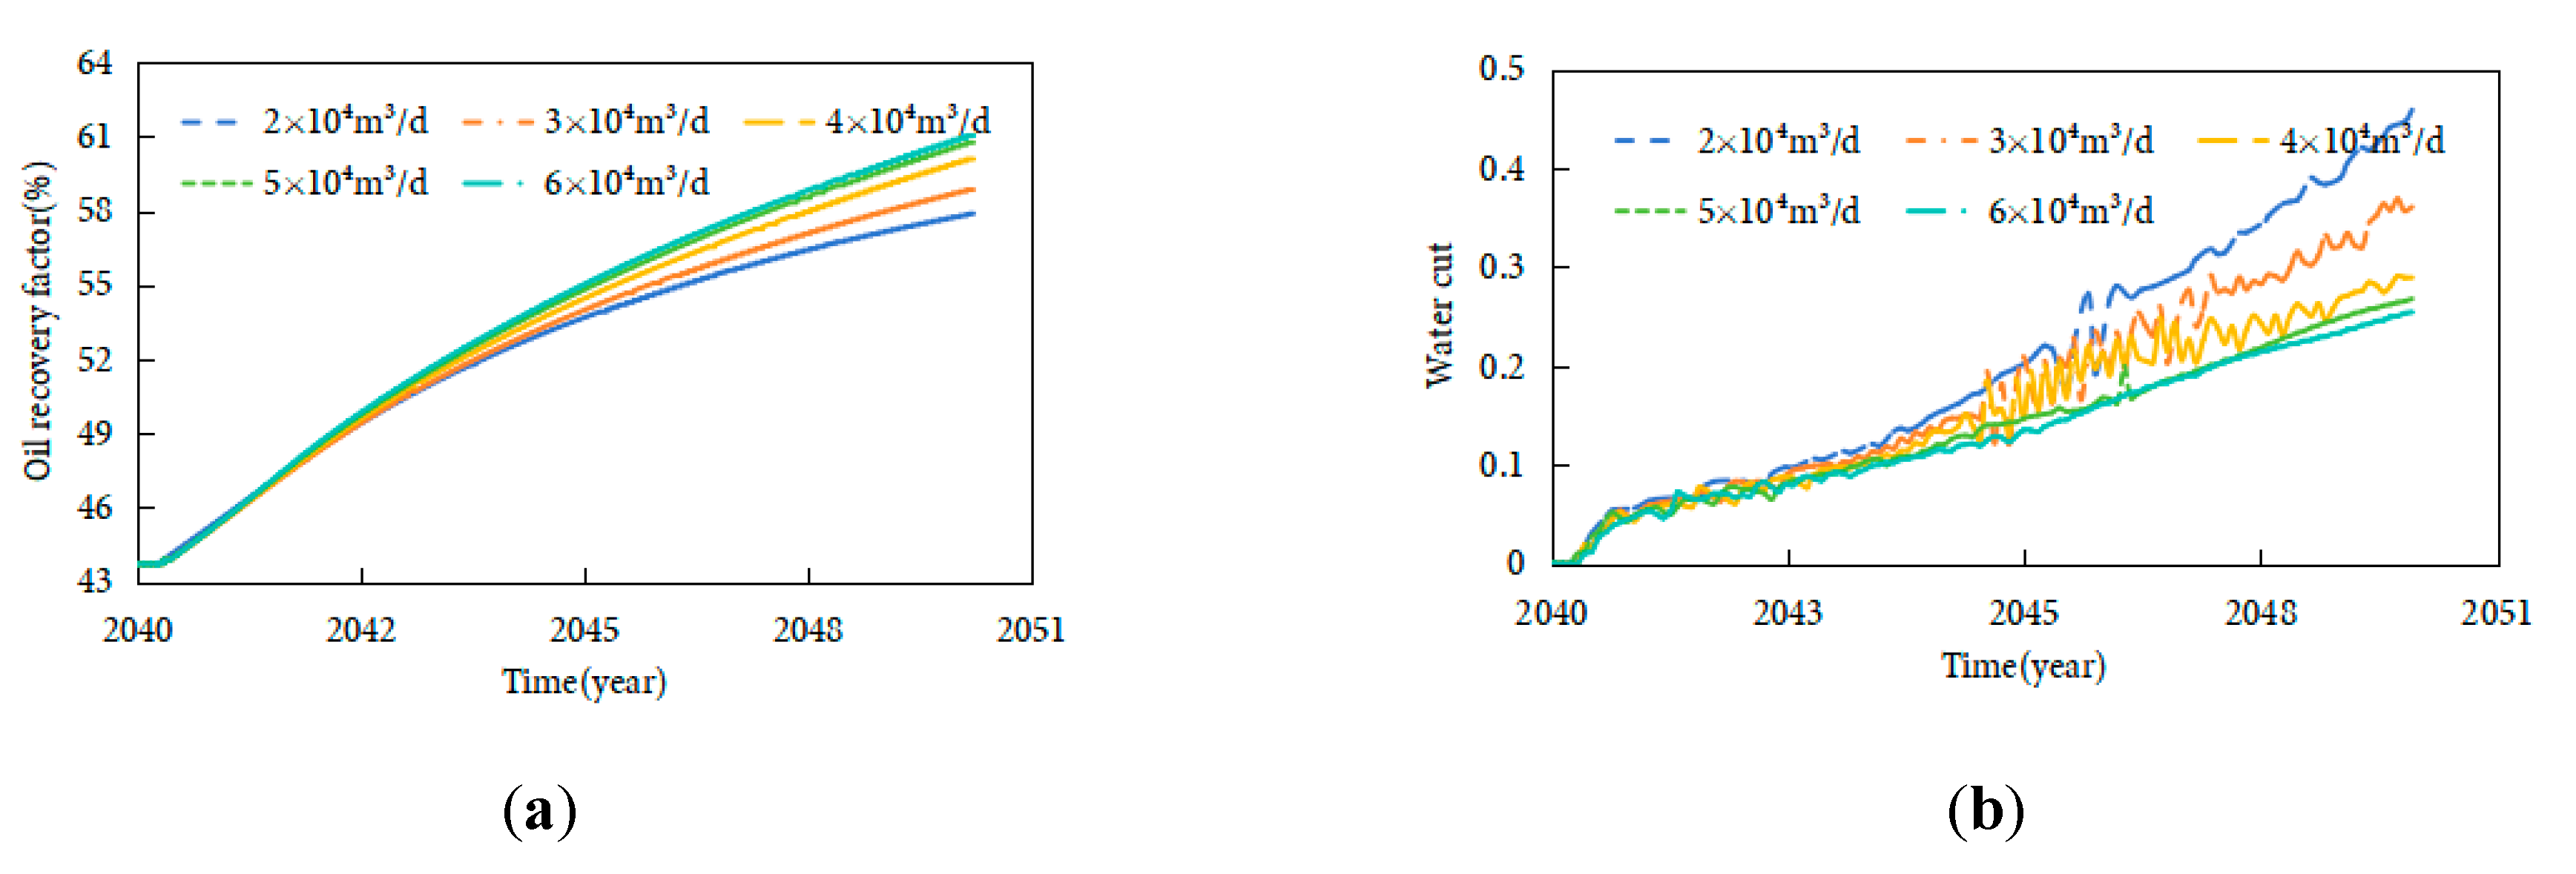
Figure 20: Condensate recovery and water cut under varying injection rates: (a) Condensate recovery factor. (b) Water cut.
In summary, the preceding analyses focus on the individual impacts of geological (e.g., permeability, heterogeneity) and engineering parameters (e.g., injection pressure, rate) on condensate recovery. However, most previous studies neglect the coupling between geological features and engineering controls, which often results in suboptimal or oversimplified injection designs. To address this, a geological-engineering integrated optimization framework is proposed. Based on permeability–rhythmicity zonation, this framework incorporates sensitivity results for injection rate and pressure, enabling a collaborative parameter screening process. A 3D optimization map (see Fig. 22) is developed, offering a quantitative reference for zone selection and strategy formulation in CO2 flooding design.
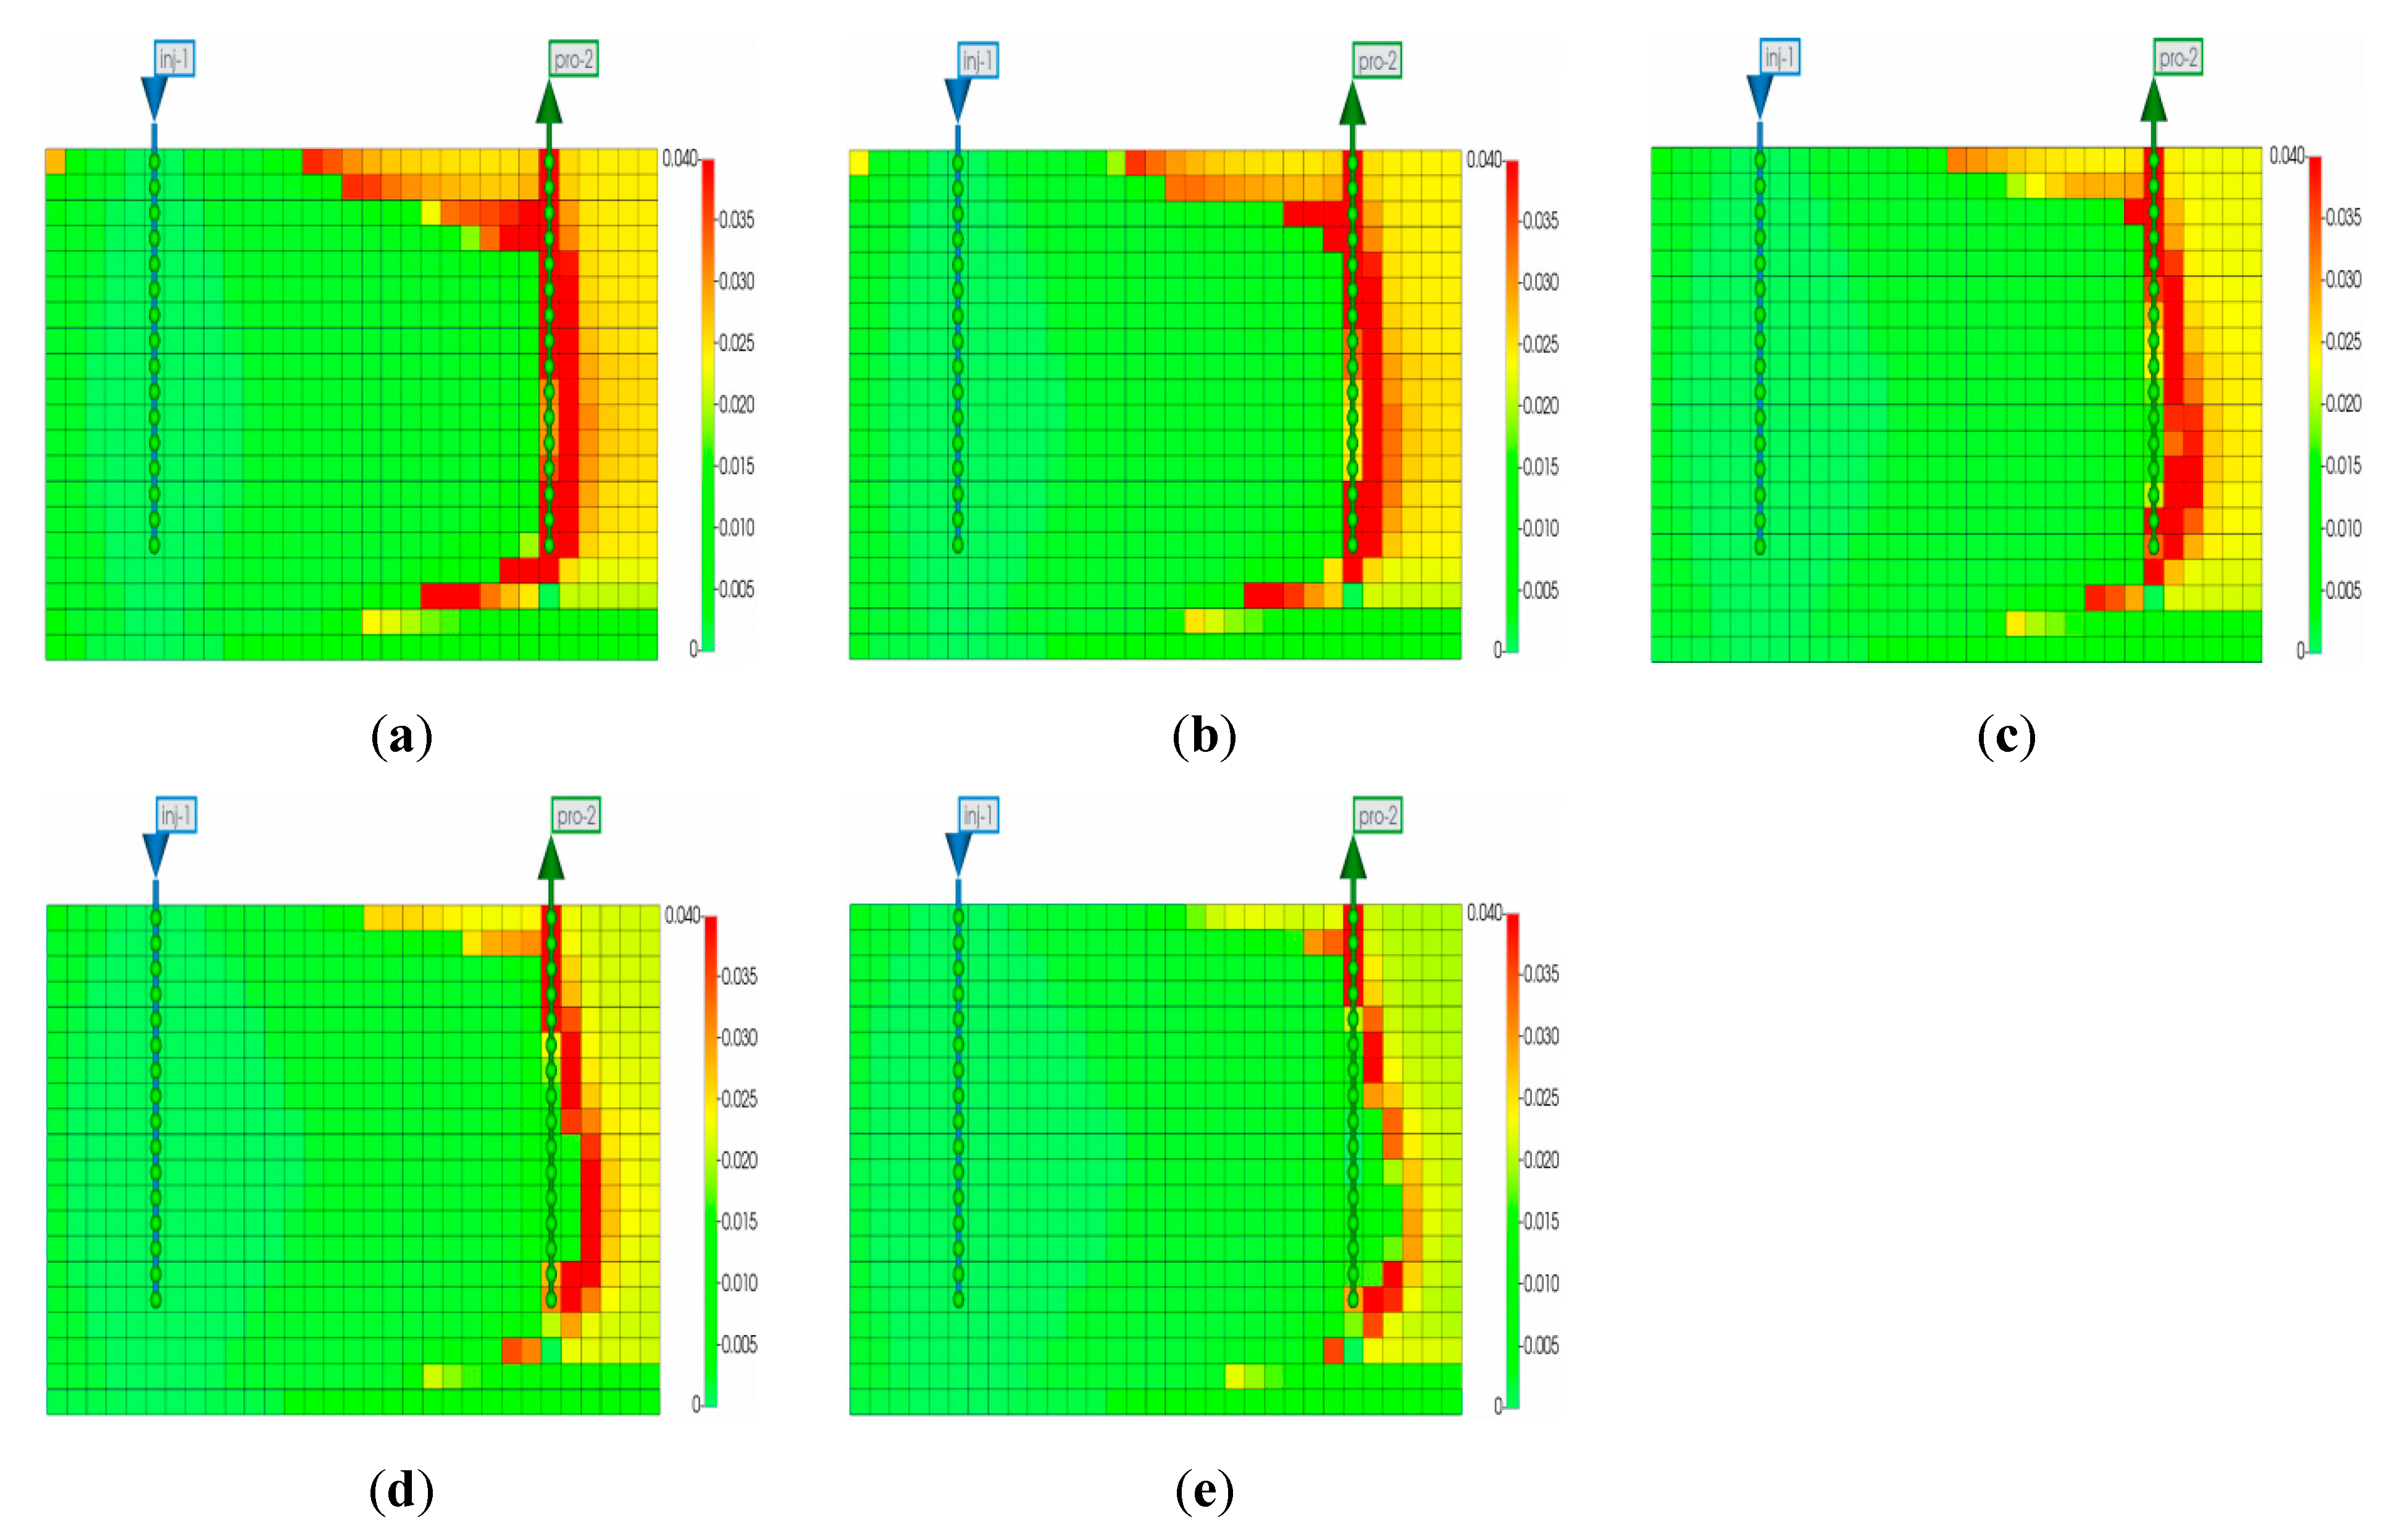
Figure 21: Condensate oil saturation changes under different injection rates: (a) 2 × 10⁴ m3/ds. (b) 3 × 10⁴ m3/d. (c) 4 × 10⁴ m3/d for 10 years. (d) 5 × 10⁴ m3/d. (e) 6 × 10⁴ m3/d.
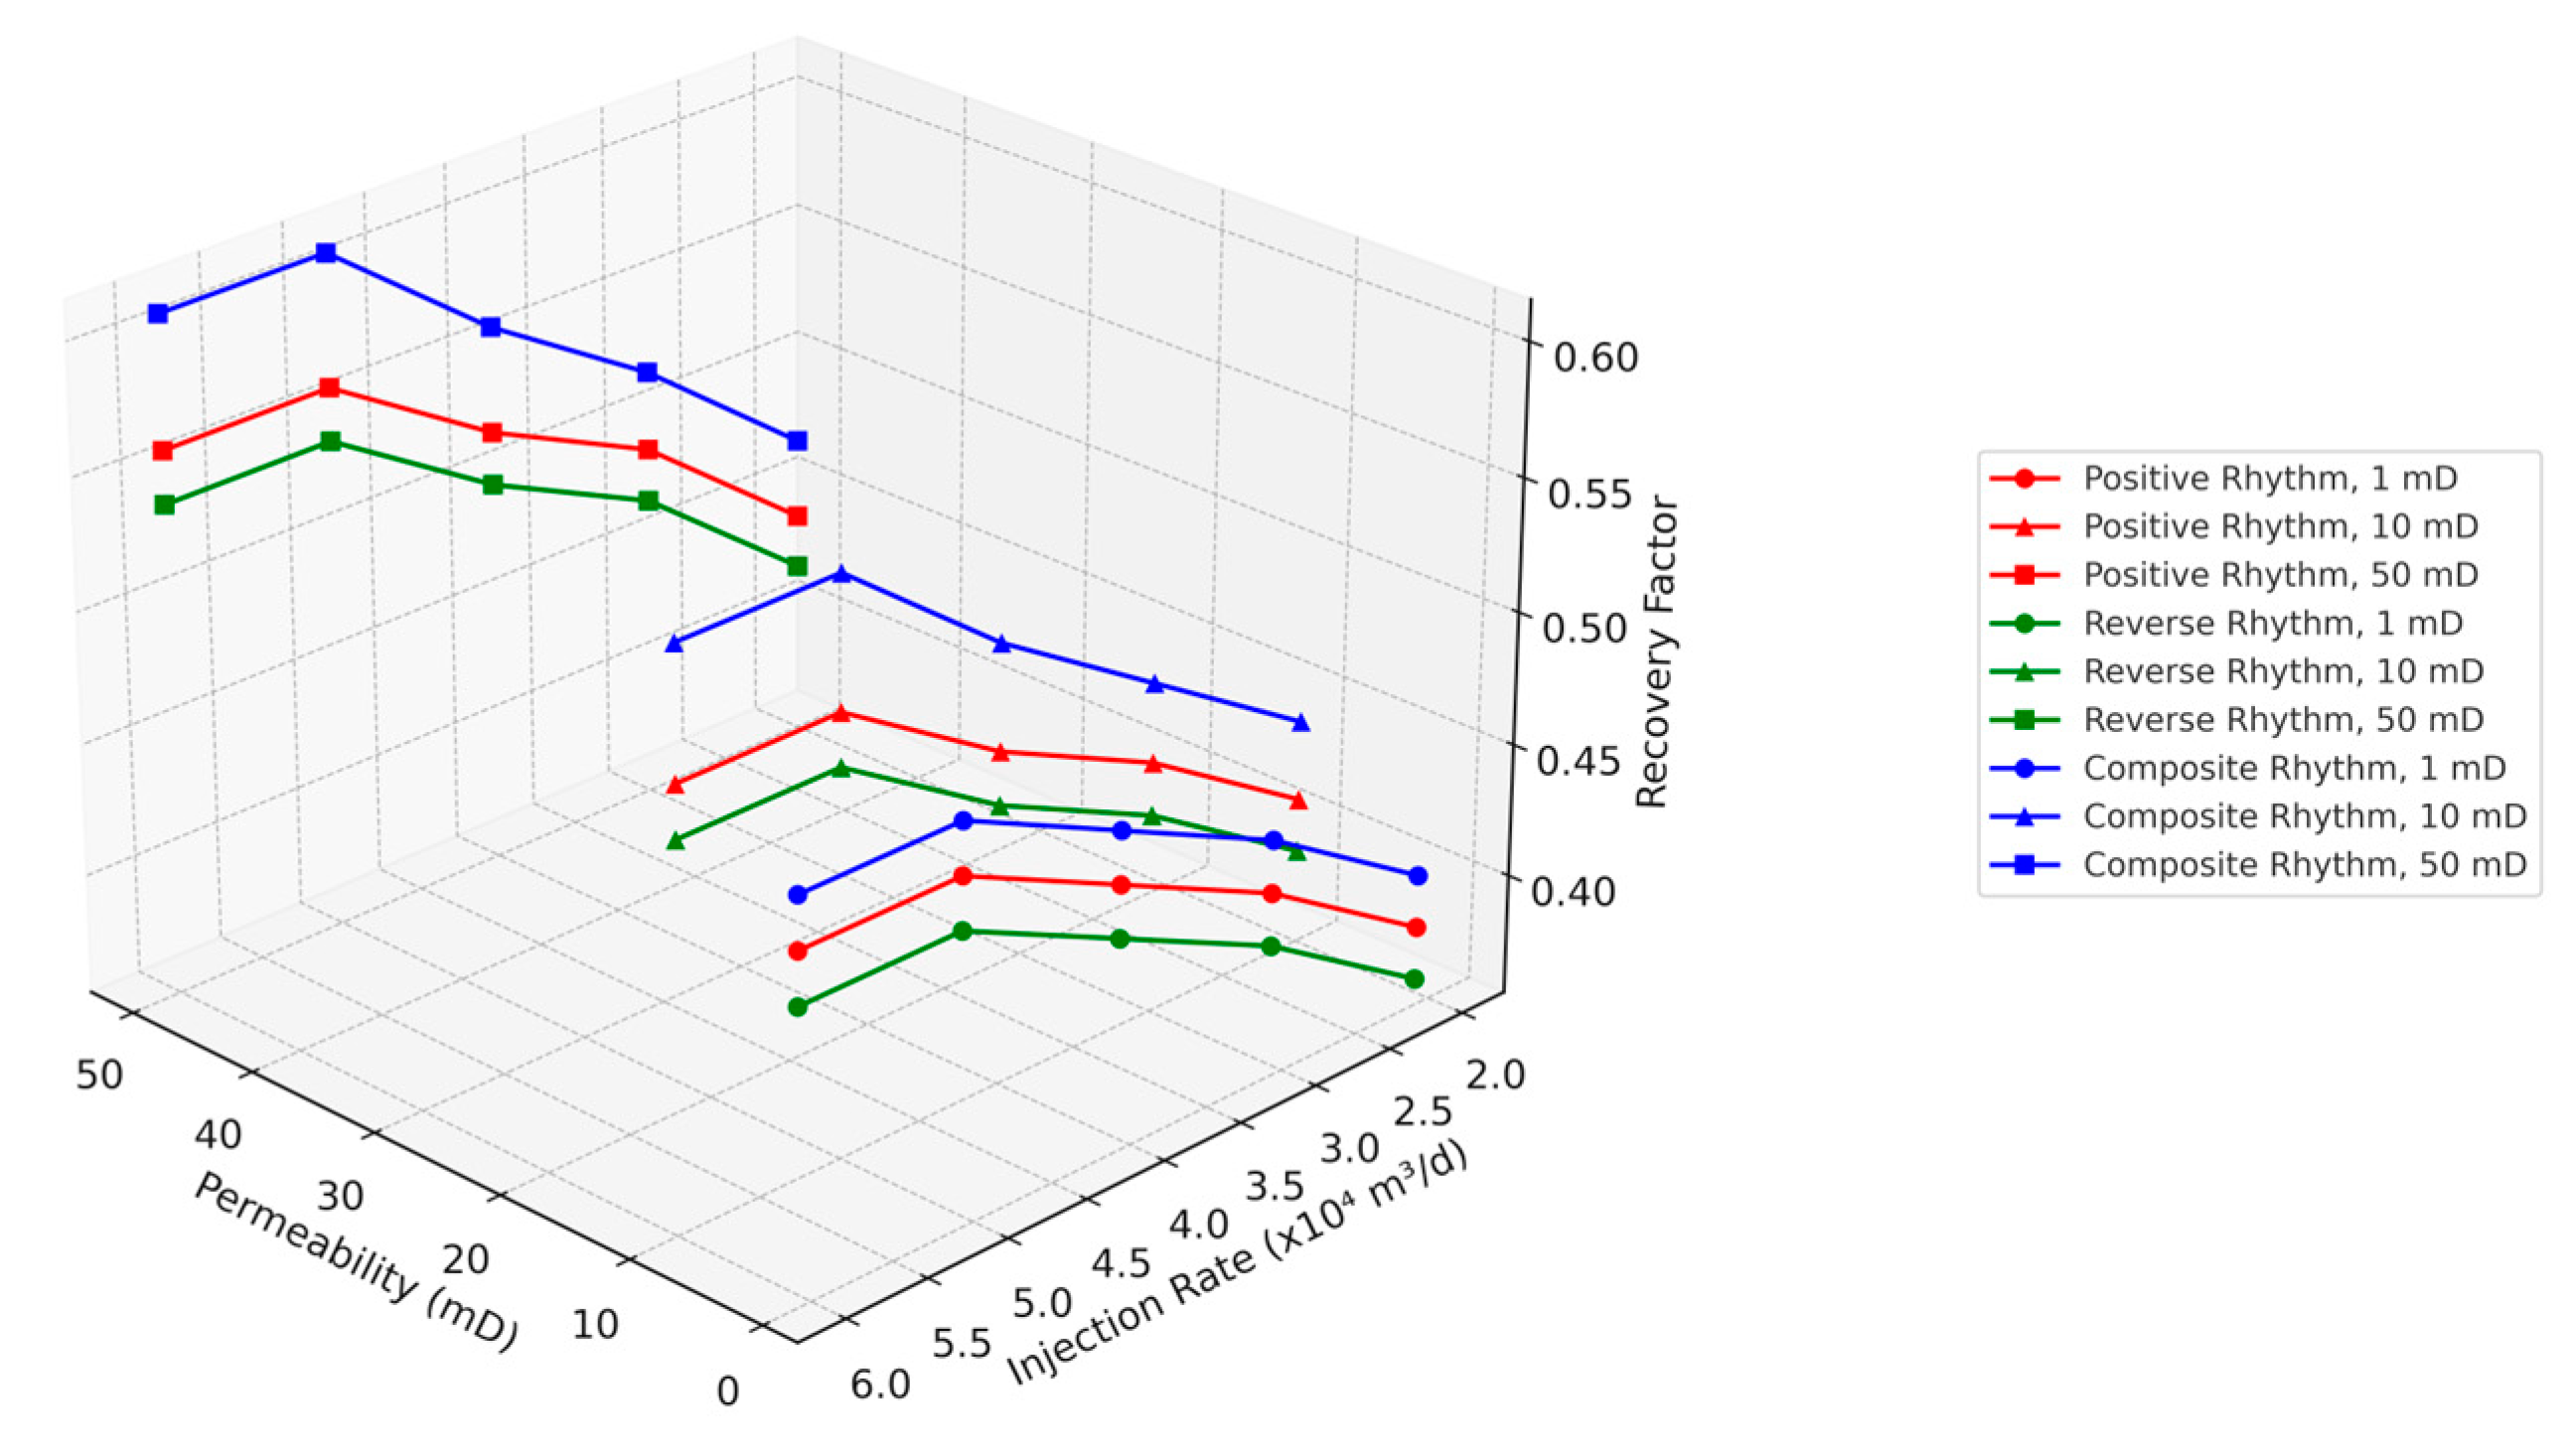
Figure 22: Coupled optimization of geological and engineering parameters.
Based on the results of numerical simulation studies, this research proposes a collaborative development scheme that integrates reservoir geological characteristics and dynamic development regulation. To optimize the key operational parameters within this scheme, statistical tools including Analysis of Variance (ANOVA) and Response Surface Methodology (RSM) were employed: ANOVA was first used to identify significant influencing factors by evaluating the impact of variables such as average permeability, heterogeneity, injection rate and injection pressure on condensate oil recovery and water cut increase rate, so as to identify which variable is the most critical influencing factor. RSM was then applied to construct a response surface model, optimizing the combination of these significant factors to maximize recovery while minimizing water cut rise.
The optimized collaborative development scheme is as follows: During the reservoir selection phase, priority should be given to composite rhythmic reservoirs with moderate vertical permeability contrasts and continuous distribution of caprock layers as the target area. These reservoirs not only have good vertical connectivity but also have natural caprock layers to suppress bottom water cone development. During the development phase, a three-stage progressive development strategy is adopted: initially, an elastic depletion extraction is implemented with a production rate of 5 × 10⁴ m3/d (optimized via RSM). When the formation pressure drops to the critical transition pressure of 13.5 MPa (identified through ANOVA as a key threshold), CO2 gas injection and pressure maintenance collaborative engineering is initiated, using a “segment plug injection + periodic shut-in” composite gas injection process (with slug size and shut-in duration optimized by RSM) to rebuild the reservoir pressure system to 22.5 MPa. After the pressure recovery, the system transitions to a constant pressure production phase at 5 × 10⁴ m3/d. This approach relies on a real-time dynamic monitoring system (including downhole fiber optic DTS, production fluid profiling instruments, etc.) to construct an “Injection-Production Coupling—Intelligent Regulation” production system. Numerical simulation results show that compared to traditional development methods, this scheme increases the condensate oil recovery by 18.7 percentage points (from 43.9% to 60.9%), while reducing the water cut increase rate by approximately 34%. It strikes a balance between efficient condensate oil displacement and water invasion suppression.
5 Conclusions and Suggestions for Further Research
This study presents core displacement experiments conducted on the P block condensate gas reservoir, where we divided the CO2 displacement process into distinct stages. These findings offer practical guidance for optimizing subsequent CO2 flooding and production strategies. Using the CMG simulator, we performed numerical simulations to validate our model and developed a macro-scale numerical simulation mechanism that accounts for both retrograde condensation and water invasion effects. Additionally, we carried out sensitivity analyses on key physical parameters of the P block, providing critical parameter support to enhance condensate oil recovery in this reservoir.
Our main conclusions are as follows:
- (1)Under depletion, retrograde condensation causes a high-saturation condensate bank to form near the wellbore, sharply reducing gas relative permeability and trapping a significant portion of liquid hydrocarbons. Simulation results show that condensate saturation can exceed 25% in the near-wellbore zone, with the effect being more severe in high-permeability layers of composite rhythmic reservoirs.
- (2)During CO2 injection, the displacement process progresses through four distinct GOR-based stages—gas-free, minimal gas presence, gas breakthrough, and gas channeling—which correspond to clear front-movement patterns. In reservoirs with bottom-water drive, the advancing CO2 front forms an inclined wedge shape toward the water contact, and CO2 preferentially sweeps upper high-permeability layers before gradually penetrating lower zones. This layered front movement mitigates direct contact between the water cone and the production well, delaying water breakthrough.
- (3)Numerical simulations yielded well-fitted results, allowing us to determine an optimal production strategy through careful selection of target areas and injection parameters. The strategy involves: selecting composite rhythmic reservoirs; conducting depletion production at a rate of 5 × 10⁴ m3/d; injecting CO2 to restore formation pressure from 13.5 MPa (when pressure drops to this level) back to 22.5 MPa; and then maintaining constant-pressure production at 5 × 10⁴ m3/d. In the optimized case, condensate oil recovery increased by 18.7 percentage points (from 43.9% to 60.9%), while the water cut rise rate decreased by ~34%. Visualization of simulation outputs shows that CO2 injection redistributes condensate saturation—reducing near-wellbore liquid holdup to below 10%—and suppresses water cone development by maintaining a gas barrier above the aquifer.
- (4)This study establishes, for the first time, a four-dimensional optimization framework that integrates geological factors (rhythmicity and permeability) and engineering factors (injection pressure and rate). By analyzing how reservoir heterogeneity influences fluid sweep patterns and how injection parameters can be adjusted to counteract these effects, we developed a visual optimization guide. This guide explicitly links geological architecture to CO2 front geometry, condensate bank dissipation, and water invasion suppression, improving the adaptability and effectiveness of CO2 flooding strategies in condensate gas reservoirs.
One limitation of this study is its focus on Block P, whose geological and fluid properties may not fully represent other condensate gas reservoirs. Due to confidentiality constraints, detailed field application data cannot be publicly disclosed. To address this and enhance the generalizability of the proposed strategies, future research will expand experimental and simulation efforts in three key directions: (1) Quantifying scale effects using fine-grid simulation (10 × 10 × 0.5 m grids) to capture sub-meter heterogeneities, ensuring more accurate extrapolation from core to field scale; (2) Optimizing well density (1–3 injectors per producer) to balance sweep efficiency and economic feasibility, which is critical for adapting the strategy to diverse reservoir development scenarios; (3) Integrating geochemical modules (e.g., CMG-STARS) to simulate CO2-brine-rock interactions and their impacts on porosity/permeability evolution, thereby accounting for complex CO2 dissolution-precipitation dynamics. These extensions will help validate the applicability of the proposed approach across varying permeability ranges, heterogeneity patterns, and reservoir settings.
Acknowledgement:
Funding Statement: This research is supported by the National Natural Science Foundation of China (No. 52474047).
Author Contributions: Wen Wang: Writing—original draft, Visualization, Validation, Methodology, Formal analysis, Conceptualization. Yulong Zhao: Writing—review & editing, Writing—original draft, Validation, Investigation, Formal analysis, Conceptualization. Bo Li: Writing—review & editing, Supervision, Methodology, Results analysis, Conceptualization. Bowen Guan: Writing—review & editing, Software, Methodology, Funding acquisition, Conceptualization. Haoran Sun: Writing—review & editing, Supervision, Methodology, Software, Conceptualization. Tao Zhang: Writing—review & editing, Results analysis, Methodology, Funding acquisition, Conceptualization. All authors reviewed the results and approved the final version of the manuscript.
Availability of Data and Materials: The data that support the findings of this study are available upon reasonable request from the authors.
Ethics Approval: Not applicable.
Conflicts of Interest: The authors declare no conflicts of interest to report regarding the present study.
References
1. Bessel VV, Koshelev VN, Kutcherov VG, Lopatin AS, Morgunova MO. Sustainable transformation of the global energy system: natural gas in focus. IOP Conf Ser Earth Environ Sci. 2020;408:012001. doi:10.1088/1755-1315/408/1/012001. [Google Scholar] [CrossRef]
2. Caineng Z, Minjie L, Feng M, Hanlin L, Zhi Y, Yichao Y, et al. Development, challenges and strategies of natural gas industry under carbon neutral target in China. Pet Explor Dev. 2024;51(2):476–97. doi:10.1016/S1876-3804(24)60038-8. [Google Scholar] [CrossRef]
3. Hafeznia H, Pourfayaz F, Maleki A. An assessment of Iran’s natural gas potential for transition toward low-carbon economy. Renew Sust Energ Rev. 2017;79:71–81. doi:10.1016/j.rser.2017.05.042. [Google Scholar] [CrossRef]
4. Wang Y, Liu X, Huang Z, Wang Z, Liu Y. Characterization of wax precipitation and deposition behavior of condensate oil in wellbore: a comprehensive review of modeling, experiment, and molecular dynamics simulation. Energies. 2022;15(11):4018. doi:10.3390/en15114018. [Google Scholar] [CrossRef]
5. Liu W, Yang Y, Qiao C, Liu C, Lian B, Yuan Q. Progress of seepage law and development technologies for shale condensate gas reservoirs. Energies. 2023;16(5):2446. doi:10.3390/en16052446. [Google Scholar] [CrossRef]
6. Wang Z, Wen Z, He Z, Song C, Liu X, Chen R, et al. Global condensate oil resource potential and exploration fields. Acta Pet Sin. 2021;42(12):1556. (In Chinese). doi:10.7623/syxb202112002. [Google Scholar] [CrossRef]
7. Xue Y, Wang D. Formation conditions and exploration direction of large natural gas reservoirs in the oil-prone Bohai Bay Basin, East China. Pet Explor Dev. 2020;47(2):280–91. doi:10.1016/S1876-3804(20)60046-5. [Google Scholar] [CrossRef]
8. Bennion DB, Thomas FB, Schulmeister B. Retrograde condensate dropout phenomena in rich gas reservoirs-impact on recoverable reserves, permeability, diagnosis, and stimulation techniques. J Can Pet Technol. 2001;40(12):TN1. doi:10.2118/01-12-TN1. [Google Scholar] [CrossRef]
9. Maleki MR, Rashidi F, Mahani H, Khamehchi E. A simulation study of the enhancement of condensate recovery from one of the Iranian naturally fractured condensate reservoirs. J Pet Sci Eng. 2012;92:158–66. doi:10.1016/j.petrol.2012.06.011. [Google Scholar] [CrossRef]
10. Jing W, Zhang L, Zhang Y, Memon BS, Li A, Zhong J, et al. Phase behavior of gas condensate in fractured-vuggy porous media based on microfluidic technology and real-time computed tomography scanning. Phys Fluids. 2023;35(12):122002. doi:10.1063/5.0175119. [Google Scholar] [CrossRef]
11. Igwe U, Khishvand M, Piri M. Retrograde condensation in natural porous media: an in situ experimental investigation. Phys Fluids. 2022;34(1):013102. doi:10.1063/5.0073801. [Google Scholar] [CrossRef]
12. Zhou M, Li X, Hu Y, Xu X, Jiang L, Li Y. Physical simulation experimental technology and mechanism of water invasion in fractured-porous gas reservoir: a review. Energies. 2021;14(13):3918. doi:10.3390/en14133918. [Google Scholar] [CrossRef]
13. Tu H, Zhou M, Gu Y, Guo X. Preparation and characterization of super hydrophobic/oleophobic material and its application in releasing liquid locking in tight condensate gas reservoirs. J Pet Sci Eng. 2022;212:110281. doi:10.1016/j.petrol.2022.110281. [Google Scholar] [CrossRef]
14. Tran TV, Truong TA, Ngo AT, Hoang SK, Trinh VX. A case study of gas-condensate reservoir performance under bottom water drive mechanism. J Pet Explor Prod Technol. 2019;9(1):525–41. doi:10.1007/s13202-018-0487-7. [Google Scholar] [CrossRef]
15. Liang B, Tan XH, Zhu GJ, Tian B, Wang S, Li N, et al. Study on improving recovery of condensate oil in low perm and high condensate gas reservoir. In: Proceedings of the International Field Exploration and Development Conference; 2020 Sep 23–25; Chengdu, China. p. 3123–32. doi:10.1007/978-981-16-0761-5_293. [Google Scholar] [CrossRef]
16. Du F, Nojabaei B. A review of gas injection in shale reservoirs: enhanced oil/gas recovery approaches and greenhouse gas control. Energies. 2019;12(12):2355. doi:10.3390/en12122355. [Google Scholar] [CrossRef]
17. Tang Y, Cheng M, Wang Y, Qin J, He Y, Zhang S, et al. Experimental study on the mechanism of enhanced oil recovery of shale gas condensate reservoirs. Arab J Sci Eng. 2025:1–19. doi:10.1007/s13369-025-10128-7. [Google Scholar] [CrossRef]
18. Burachok O. Enhanced gas and condensate recovery: review of published pilot and commercial projects. Naft-Gaz. 2021;77(1):20–5. doi:10.18668/NG.2021.01.03. [Google Scholar] [CrossRef]
19. Wang C, Wang W, Su Y, Zhao Y, Wen J, Li L, et al. Assessment of CO2 storage potential in high water-cut fractured volcanic gas reservoirs—case study of China’s SN gas field. Fuel. 2023;335:126999. doi:10.1016/j.fuel.2022.126999. [Google Scholar] [CrossRef]
20. Zhang A, Fan Z, Zhao L. An investigation on phase behaviors and displacement mechanisms of gas injection in gas condensate reservoir. Fuel. 2020;268:117373. doi:10.1016/j.fuel.2020.117373. [Google Scholar] [CrossRef]
21. Aminian K, Almulla A, Ameri S. Enhanced liquid recovery by carbon dioxide sequestration in gas/condensate reservoirs. Int J Oil Gas Coal Technol. 2013;6(5):485–506. doi:10.1504/IJOGCT.2013.056125. [Google Scholar] [CrossRef]
22. Hassan A, Mahmoud M, Al-Majed A, Alawi MB, Elkatatny S, BaTaweel M, et al. Gas condensate treatment: a critical review of materials, methods, field applications, and new solutions. J Pet Sci Eng. 2019;177:602–13. doi:10.1016/j.petrol.2019.02.089. [Google Scholar] [CrossRef]
23. Zhang K, Lau HC. Utilization of a high-temperature depleted gas condensate reservoir for CO2 storage and geothermal heat mining: a case study of the Arun gas reservoir in Indonesia. J Clean Prod. 2022;343:131006. doi:10.1016/j.jclepro.2022.131006. [Google Scholar] [CrossRef]
24. Shen CH, Hsieh BZ, Tseng CC, Chen TL. Case study of CO2-IGR and storage in a nearly depleted gas-condensate reservoir in Taiwan. Energy Procedia. 2014;63:7740–9. doi:10.1016/j.egypro.2014.11.808. [Google Scholar] [CrossRef]
25. Al-Abri A, Sidiq H, Amin R. Mobility ratio, relative permeability and sweep efficiency of supercritical CO2 and methane injection to enhance natural gas and condensate recovery: coreflooding experimentation. J Nat Gas Sci Eng. 2012;9:166–71. doi:10.1016/j.jngse.2012.05.011. [Google Scholar] [CrossRef]
26. Liu N, Huang X, Luo H, Yang C, Wang Z, Min C. Study on eliminating retrograde condensate pollution in low-permeability condensate gas reservoir. J Porous Media. 2023;26(9):1–19 doi:10.1615/JPorMedia.2023045111. [Google Scholar] [CrossRef]
27. Wang J. Simulation study of enhanced condensate recovery by gas injection in gas condensate reservoirs with natural water influx from lab to field. Phys Fluids. 2025;37(2):026133. doi:10.1063/5.0258124. [Google Scholar] [CrossRef]
28. Su Z, Tang Y, Ruan H, Wang Y, Wei X. Experimental and modeling study of CO2-improved gas recovery in gas condensate reservoir. Petroleum. 2017;3(1):87–95. doi:10.1016/j.petlm.2016.10.004. [Google Scholar] [CrossRef]
29. Hou D, Jia Y, Shi Y, Zhao R, Tang H, Sun L. Experimental study on the effect of CO2 on phase behavior characteristics of condensate gas reservoir. J Chem. 2020;2020(1):6041081. doi:10.1155/2020/6041081. [Google Scholar] [CrossRef]
30. Ahmed ME, Sultan AS, Hassan A, Abdulraheem A, Mahmoud M. Predicting the performance of constant volume depletion tests for gas condensate reservoirs using artificial intelligence techniques. Neural Comput Appl. 2022;34(24):22115–25. doi:10.1007/s00521-022-07682-8. [Google Scholar] [CrossRef]
31. Barsotti E, Tan SP, Saraji S, Piri M, Chen JH. A review on capillary condensation in nanoporous media: implications for hydrocarbon recovery from tight reservoirs. Fuel. 2016;184:344–61. doi:10.1016/j.fuel.2016.06.123. [Google Scholar] [CrossRef]
32. Seteyeobot I, Jamiolahmady M, Jaeger P, Nasieef A. An experimental study of the effects of CO2 injection on gas/condensate recovery and CO2 storage in gas-condensate reservoirs. In: Proceedings of the SPE Annual Technical Conference and Exhibition; 2021 Sep 21–23; Dubai, United Arab Emirates. p. D011S009R004. doi:10.2118/206117-MS. [Google Scholar] [CrossRef]
33. Henderson GD, Danesh A, Peden JM. An experimental investigation of waterflooding of gas condensate reservoirs and their subsequent blowdown. J Pet Sci Eng. 1992;8(1):43–58. doi:10.1016/0920-4105(92)90043-Z. [Google Scholar] [CrossRef]
34. He DB, Jia AL, Wei YS, Guo JL, Yan HJ, Meng DW, et al. Theory and technology of balanced development of conventional gas reservoirs. Nat Gas Ind J. 2023;43(1):76–85. (In Chinese). doi:10.3787/j.issn.1000-0976.2023.01.008. [Google Scholar] [CrossRef]
35. Yang X, Fei H, Shi J, Sheng L, Guo D, Yao E. Enhancing gas recovery in tight dolomite reservoirs:a study of water-lock damage and chemical drainage. Processes. 2023;11(11):3228. doi:10.3390/pr11113228. [Google Scholar] [CrossRef]
36. Matkivskyi S, Burachok O. Impact of reservoir heterogeneity on the control of water encroachment into gas-condensate reservoirs during CO2 injection. Manag Syst Prod Eng. 2022;1(30):62–8. doi:10.2478/mspe-2022-0008. [Google Scholar] [CrossRef]
37. Liang B, Chen C, Jia C, Wang C, Wang X, Zha Y, et al. Carbon capture, utilization and storage (CCUS) in oil and gas reservoirs. Fuel. 2024;375:132353. doi:10.1016/j.fuel.2024.132353. [Google Scholar] [CrossRef]
38. Wang J, Ryan D, Szabries M, Jaeger P. A study for using CO2 to enhance natural gas recovery from tight reservoirs. Energy Fuels. 2019;33(5):3821–7. doi:10.1021/acs.energyfuels.8b04464. [Google Scholar] [CrossRef]
39. Narinesingh J, Alexander D. CO2 enhanced gas recovery and geologic sequestration in condensate reservoir: a simulation study of the effects of injection pressure on condensate recovery from reservoir and CO2 storage efficiency. Energy Procedia. 2014;63:3107–15. doi:10.1016/j.egypro.2014.11.334. [Google Scholar] [CrossRef]
40. Wang W, Liu H, Dong X, Chen Z, Li Y, Sun L, et al. Experimental and modeling study of the effects of CO2 injection on gas/condensate recovery and CO2 storage in gas-condensate reservoirs. In: Proceedings of the SPE Europec featured at EAGE Conference and Exhibition; 2022 Jun 5–9; Madrid, Spain. p. D032S009R002. doi:10.2118/209713-MS. [Google Scholar] [CrossRef]
41. Zhao H, Zhang X, Gao X, Chen P, Guo K. A novel method for the quantitative evaluation of retrograde condensate pollution in condensate gas reservoirs. Processes. 2024;12(3):522. doi:10.3390/pr12030522. [Google Scholar] [CrossRef]
42. Wang XC, Wang PJ, Cui C, Fan D, Huang LG, Tuluhon AL. Influence of heterogeneous reservoir on carbon sequestration and carbon displacement. J Phys Conf Ser. 2024;2834(1):012180. doi:10.1088/1742-6596/2834/1/012180. [Google Scholar] [CrossRef]
43. Hu J, Yang S, Zuo H, Liu Y, Shen B, Gao X, et al. Numerical simulation of CO2 storage with enhanced gas recovery in depleted highly heterogeneous carbonate gas reservoir. Phys Fluids. 2025;37(7):073112. doi:10.1063/5.0276145 [Google Scholar] [CrossRef]
44. Khormali A, Ahmadi S, Aleksandrov AN. Analysis of reservoir rock permeability changes due to solid precipitation during waterflooding using artificial neural network. J Pet Explor Prod Technol. 2025;15(1):1–18. doi:10.1007/s13202-024-01898-1. [Google Scholar] [CrossRef]
45. Mansi M, Almobarak M, Lagat C, Xie Q. Statistical analysis of controlling factors on enhanced gas recovery by CO2 injection in shale gas reservoirs. Energy Fuels. 2023;37(2):965–76. doi:10.1021/acs.energyfuels.2c03216. [Google Scholar] [CrossRef]
46. Gerasimov A, Alexandrov I, Grigoriev B. Modeling and calculation of thermodynamic properties and phase equilibria of oil and gas condensate fractions based on two generalized multiparameter equations of state. Fluid Phase Equilib. 2016;418:204–23. doi:10.1016/j.fluid.2016.01.016. [Google Scholar] [CrossRef]
47. Liu L, Hou S, Zhang N. Incorporating numerical molecular characterization into pseudo-component representation of light to middle petroleum distillates. Chem Eng Sci X. 2019;3:100029. doi:10.1016/j.cesx.2019.100029. [Google Scholar] [CrossRef]
Cite This Article
 Copyright © 2025 The Author(s). Published by Tech Science Press.
This work is licensed under a Creative Commons Attribution 4.0 International License , which permits unrestricted use, distribution, and reproduction in any medium, provided the original work is properly cited.
 Downloads
 Citation Tools