
 Submit a Paper
 Propose a Special lssue
 Open Access
ARTICLE
Pore-Scale Simulations to Enhance Development Strategies in Offshore Weak Water-Drive Reservoirs
1 CNOOC China Limited, Shanghai Branch, Shanghai, China
2 Hainan Institute of China University of Petroleum (Beijing), Sanya, China
3 State Key Laboratory of Petroleum Resources and Engineering, China University of Petroleum, Beijing, China
* Corresponding Author: Keliu Wu. Email:
(This article belongs to the Special Issue: Subsurface Fluid Flow Dynamics and Applications in Carbon Reduction Technologies)
Fluid Dynamics & Materials Processing 2026, 22(1), 6 https://doi.org/10.32604/fdmp.2026.074990
Received 22 October 2025; Accepted 26 January 2026; Issue published 06 February 2026
 View Full Text
 Download PDF
Abstract
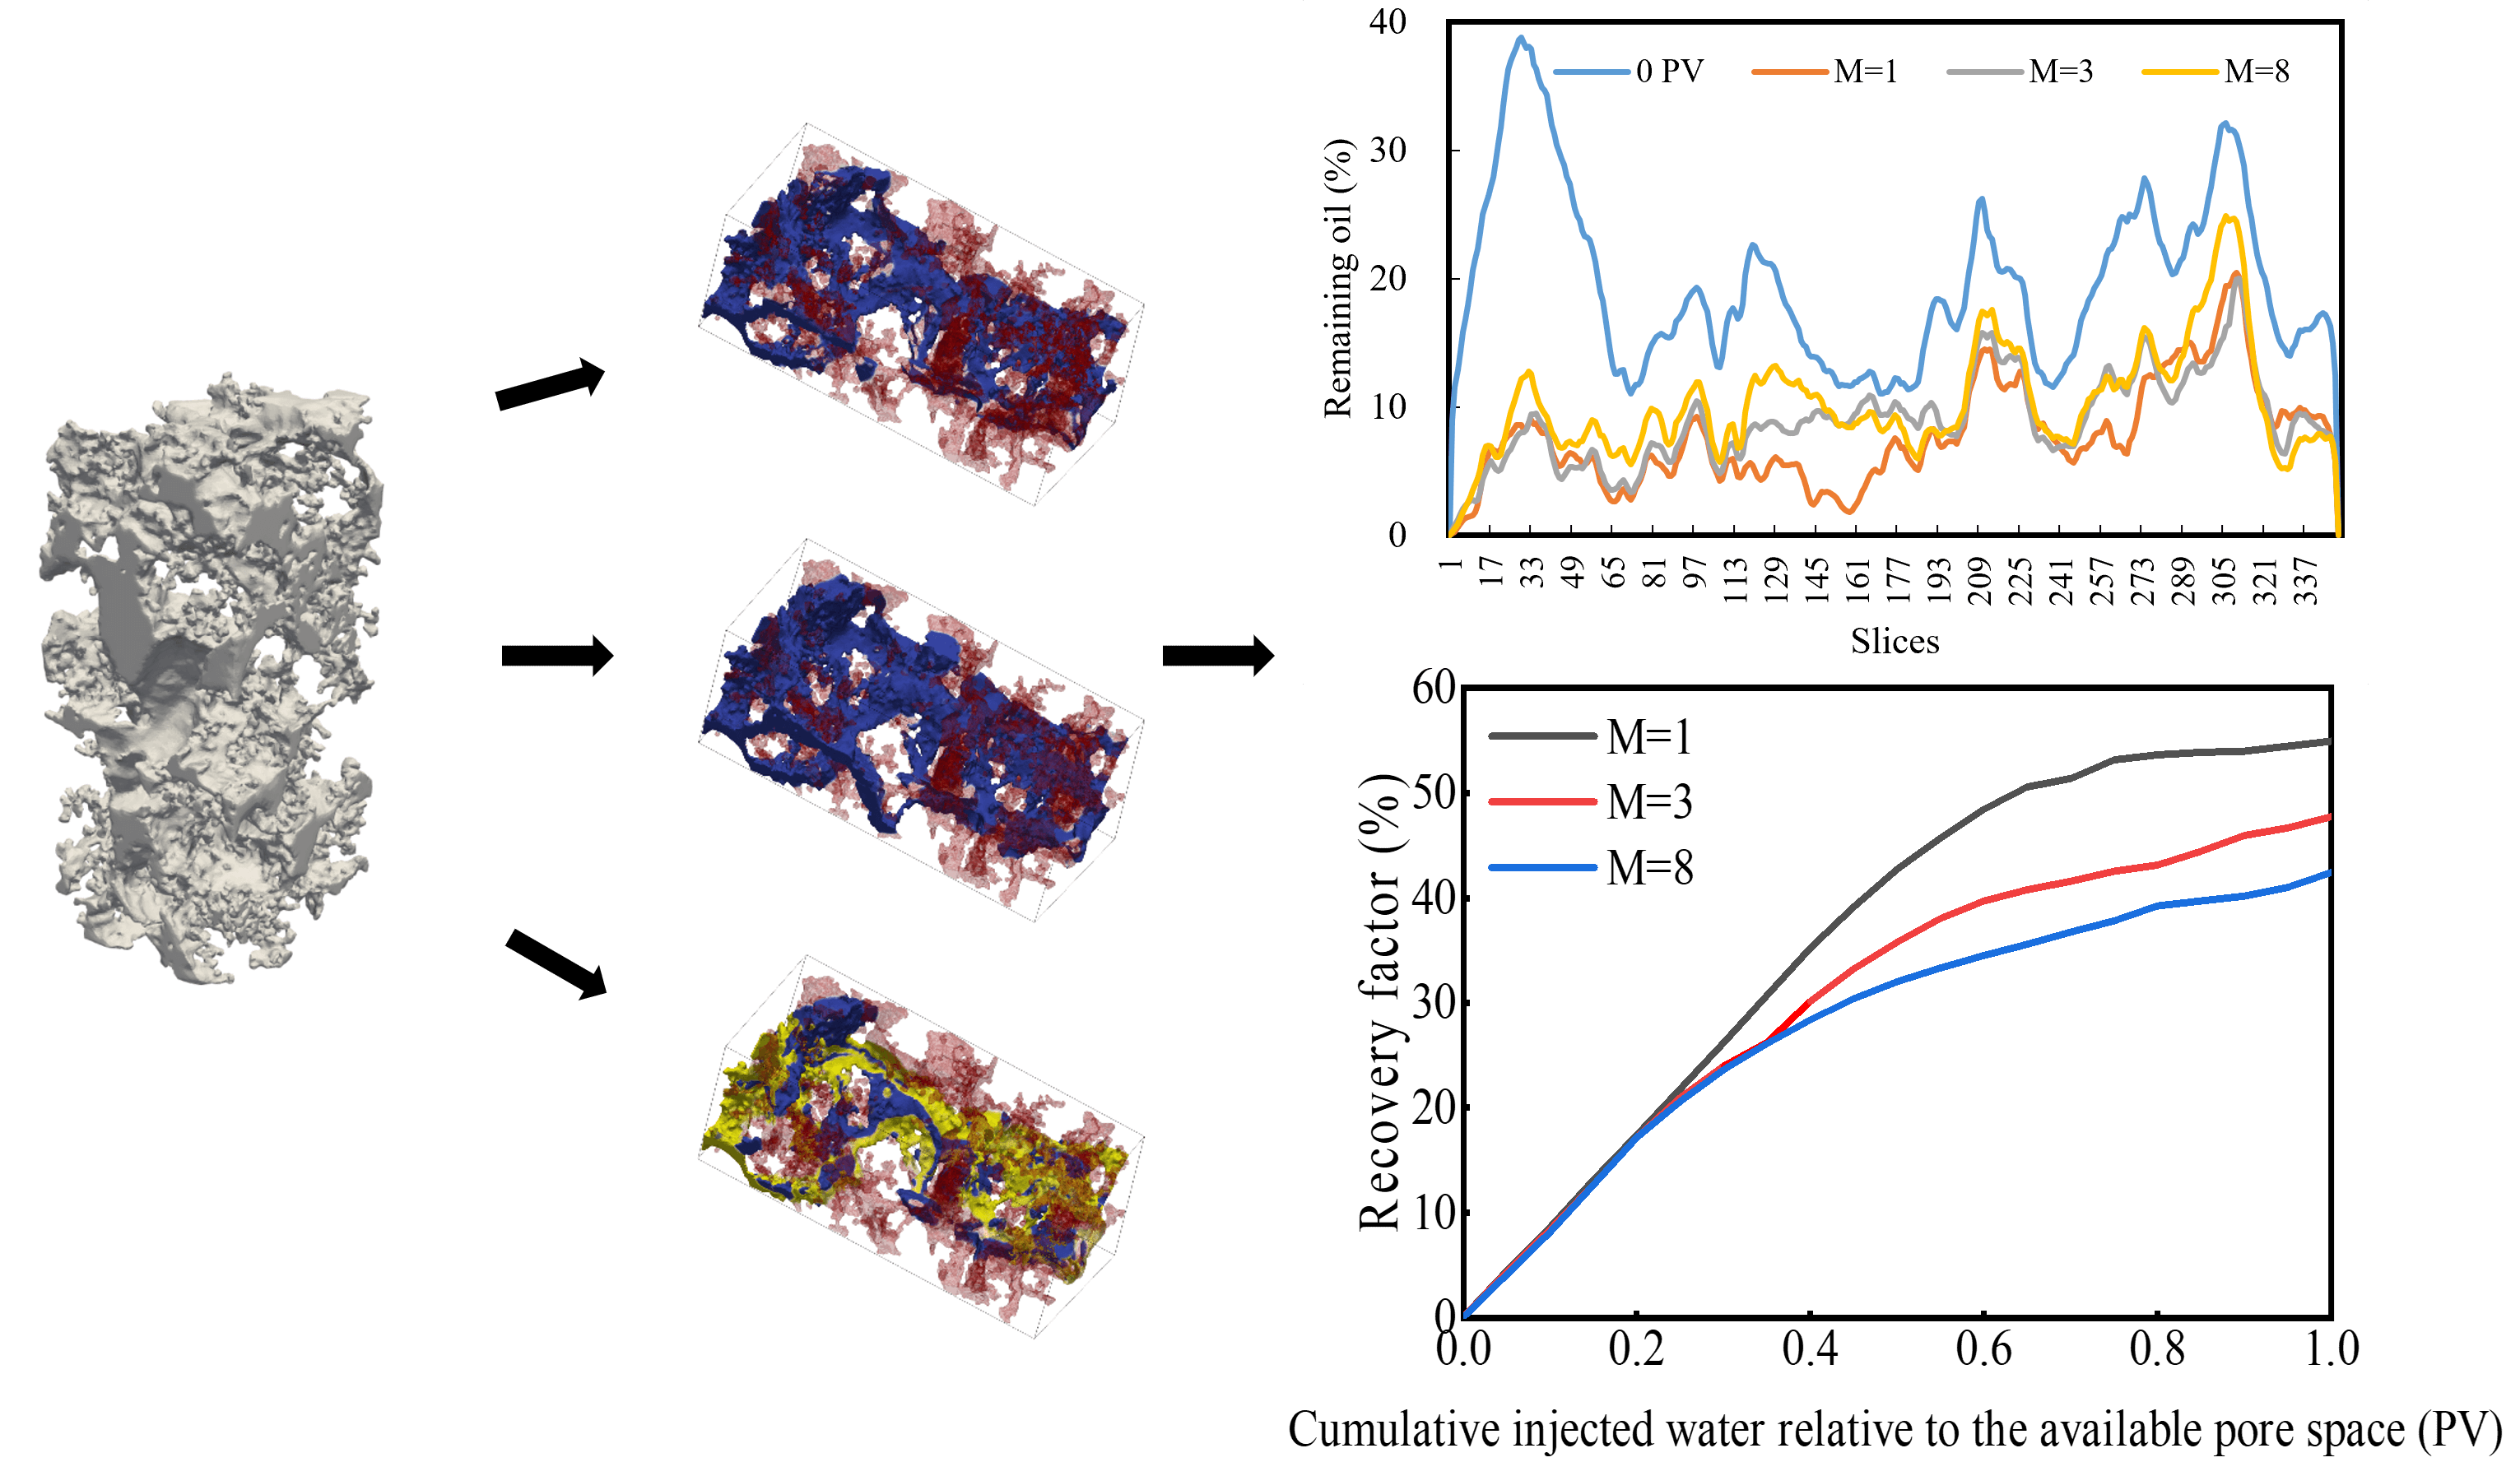
Weak water-drive offshore reservoirs with complex pore architecture and strong permeability heterogeneity present major challenges, including rapid depletion of formation energy, low waterflood efficiency, and significant lateral and vertical variability in crude oil properties, all of which contribute to limited recovery. To support more effective field development, alternative strategies and a deeper understanding of pore-scale flow behavior are urgently needed. In this work, CT imaging and digital image processing were used to construct a digital rock model representative of the target reservoir. A pore-scale flow model was then developed, and the Volume of Fluid (VOF) method was applied to simulate and optimize waterflooding schemes aimed at boosting oil recovery. Optimization focused on adjusting injection rates, varying the oil–water viscosity ratio, and implementing a water-alternating-gas (WAG) process. Results show that, for equal injection volumes, higher injection rates cause early water breakthrough through high-permeability pathways, yielding slower gains in recovery. Lowering the oil–water viscosity ratio improves mobility control, suppresses viscous fingering, enlarges sweep volume, and enhances recovery. When CH4 becomes fully miscible, it dissolves into the crude oil, lowering viscosity and eliminating interfacial tension, thereby providing greater displacement efficiency than partially miscible injection. Following a switch from water to gas injection, residual oil saturation decreases and becomes more uniformly distributed, indicating that the combined action of water and gas significantly improves both sweep efficiency and microscopic displacement.Graphic Abstract
Keywords
Offshore weak water-drive reservoirs are rich in hydrocarbon resources; however, its overall productivity remains low, and its economic efficiency is poor, significantly limiting large-scale development [1,2]. Weakly water-driven reservoirs lack sufficient aquifer support to maintain pressure, so sustained production relies on artificial energy supplementation to improve recovery. Such reservoirs commonly exhibit poor reservoir quality, strong heterogeneity, and complex pore–throat structures that compartmentalizes flow. Analysis has identified the following key production challenges: (1) The long-term reliance on natural energy development has resulted in severely insufficient formation energy. It is urgent to supplement energy through water or gas injection to restore reservoir pressure and enhance oil recovery. However, the current injection-production schemes lack systematic optimization of key parameters, which negatively impacts the energy supplement effect and displacement efficiency. (2) The viscosity of crude oil varies significantly both horizontally and vertically, with a range of 1 mPa·s–8 mPa·s. This variability leads to difficulties in controlling the mobility ratio during displacement, presenting significant challenges for optimizing injection and production parameters in waterflooding development. (3) The complex fluid properties coupled with weak water energy, result in limited effectiveness of conventional waterflooding, necessitating the exploration of more efficient development methods to enhance both recovery factor and economic benefits. In response to the above-mentioned problem of insufficient understanding of the seepage mechanism and development methods, this study conducts a microscopic flow simulation analysis of weak water-drive reservoirs. The aim is to propose effective enhanced oil recovery (EOR) strategies, thereby providing a scientific basis for formulating development technical policies and ultimately achieving efficient reserve utilization and improved recovery [3,4,5].
Currently, the optimization of waterflooding development and the selection of development strategies lack scientific and rational guidance from reservoir engineering methodologies. The optimization and adjustment of water and gas injection parameters are primarily qualitative, with parameter design lacking a quantitative theoretical foundation [6]. Although numerical simulation techniques have become increasingly advanced, field application design still relies heavily on analogy and extrapolation from specific field experiences. This approach is not based on quantitative optimization algorithms derived from the petrophysical characteristics and fluid interactions of the reservoir itself. This leads to significant uncertainties in enhancing oil recovery (EOR) efforts [7,8,9]. In particular, the dynamic behavior of water/gas injection fronts remains an under-explored area, and systematic understanding of residual oil distribution in low-permeability reservoirs is still insufficient [10,11]. Zhou et al. [12] employed a systematic approach combining nuclear magnetic resonance (NMR) tests with fluorescence analysis of frozen slides to evaluate the effects of alkaline, surfactant, polymer, and ASP flooding systems on oil recovery efficiency and the pore-scale distribution of residual oil. They focused on analyzing the variation characteristics of residual oil saturation across different pore size ranges. Li et al. [13] constructed a Multicomponent and multiphasemulti relaxation time-Lattice Boltzmann model (MCMP-MRT-LBM) to investigate the occurrence states of crude oil in laminated shale under varying water saturation conditions. The results demonstrated that with the increase in water content, the remaining oil gradually changes from continuous state to discontinuous state. The remaining oil was gradually distributed in quartz in columnar and solitary droplets and distributed in kerogen in a membranous form. Water is gradually distributed in clusters throughout the reservoir.
The pore-scale multiphase flow simulation techniques primarily include pore network modeling (PNM) [14,15,16], the lattice Boltzmann method (LBM) [17,18], and VOF [19,20,21] based on direct numerical simulation (DNS), the level set method (LS) [22,23,24], and the phase-field method (PF) [25,26]. In addition to physics-based numerical modeling, data-driven approaches such as Response Surface Methodology (RSM), machine learning (ML), and artificial neural networks (ANN) have also been employed in recent years to predict permeability evolution and optimize flooding performance at larger scales [27]. Among these methods, PNM simplifies the modeling of complex pore structures but has limitations in accuracy. The LBM is prone to numerical instability when simulating multiphase systems with high density ratios and significant viscosity differences. In comparison, direct numerical simulation methods exhibit superior numerical stability. Specifically, the VOF is characterized by accurate interface capturing and computational efficiency, making it highly suitable for simulating complex flow processes in porous media. Huang et al. [28] utilized the interFoam solver in OpenFOAM to simulate the water flooding process, focusing on the effects of varying flow velocity. The study investigated how changes in flow velocity influence the oil-water distribution, residual oil location, and morphology under constant water injection volumes. However, the study was limited to a two-dimensional model and did not account for three-dimensional variations. SONG et al. [29] incorporated the interfacial tension term and developed a pore-scale mathematical model for CO2 flooding using an open-source solver. The results indicated that the recovery rate of miscible CO2-SAG flooding was 16.5% higher than that of continuous CO2 injection. However, the study did not consider the impact of water-gas displacement on the swept volume.
This study takes a typical offshore weak water-drive reservoir as the research object. Based on CT scanning and high-precision digital core reconstruction, a geometric model was established, and a pore-scale oil–water (gas) flow mathematical model was developed. The VOF method is then used to simulate waterflooding optimization and development method selection. By quantitatively analyzing the effects of injection velocity, oil-water viscosity, miscibility degree, and injection patterns on oil recovery efficiency and front stability, the micromechanical mechanism of development parameter optimization is clarified. This study aims to provide a theoretical basis and quantitative design for transitioning development methods and injection-production adjustment in offshore weak-water drive reservoirs.
2 Mathematical Methods and Geometric Modeling
The Navier-Stokes equations are a set of partial differential equations used to describe the motion of viscous fluids and are fundamental to fluid mechanics. They account for the effects of fluid viscosity, pressure gradients, inertial forces, and external forces, enabling accurate simulations of fluid behavior under different conditions [30,31]. By coupling the continuity equation with the N-S equations, the pressure and velocity of incompressible two-phase flow in Newtonian fluids can be solved. The governing equations are as follows:
The core idea of the VOF method is to define the volume fraction of the reference phase within a control volume. If the control volume is entirely filled with the water phase, the volume fraction is 1; if it is entirely filled with the oil phase, the volume fraction is 0. At the interface, the volume fraction within the control volume lies between 0 and 1, as shown in Fig. 1 [32].
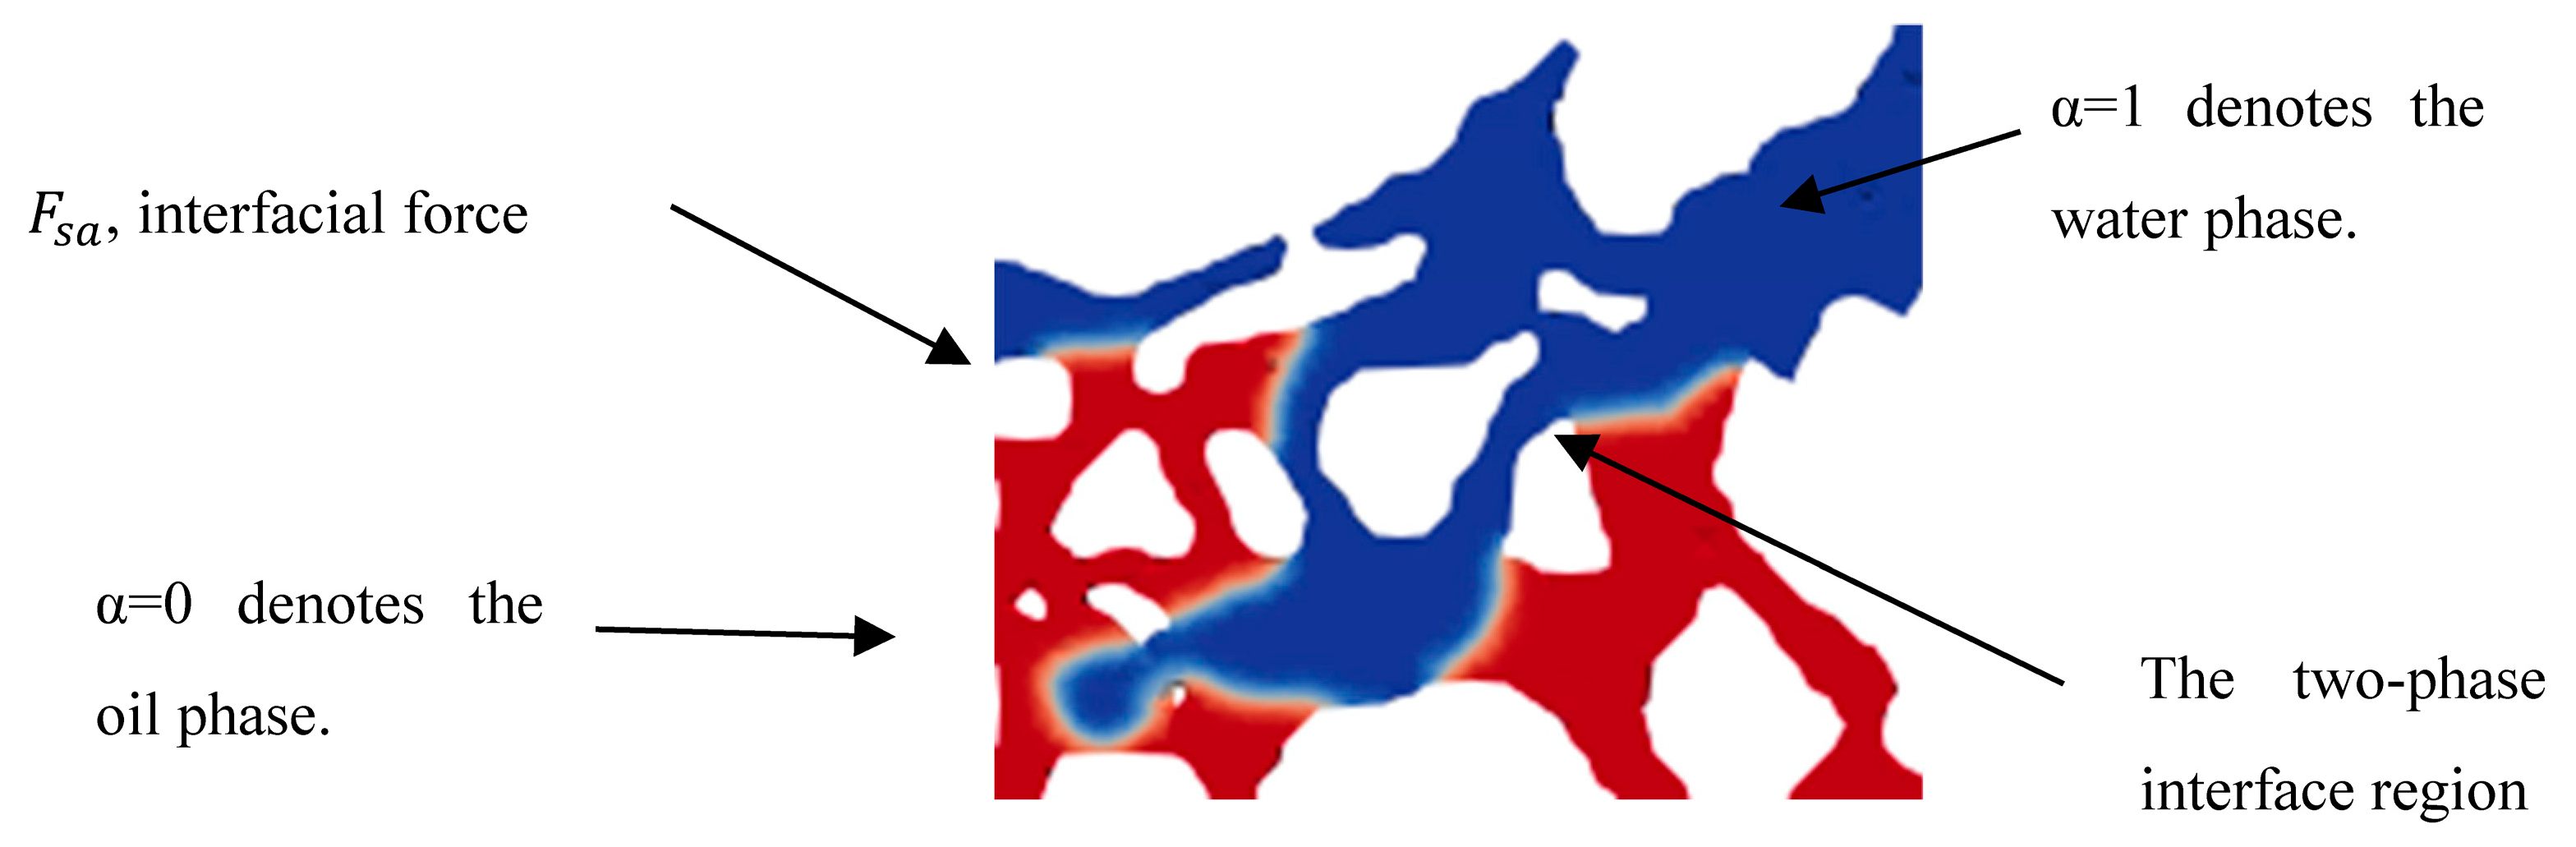
Figure 1: Volume fraction schematic.
To maintain the mass and momentum balance of each phase, the density ρ and viscosity μ in Eqs. (3) and (4) can be expressed as functions of the α:
By substituting the density and viscosity calculated in the two-phase interface region into the continuity Eq. (1), the phase equilibrium equation for the two-phase fluid flow can be derived:
The definition of the interfacial force Fsa in Eqs. (2) is given by [33,34]:
The contact angle θ satisfies:
Microscopic flow simulation analysis was carried out by pore-scale CFD on the digital core. The governing equations were implemented using interFoam, an open-source solver based on OpenFOAM. InterFoam is specifically designed for multiphase flow problems and employs the VOF method to track the interface between different phases. In this study, pressure–velocity coupling was achieved through the PIMPLE algorithm. Temporal discretization used an implicit Euler scheme, and the time step was dynamically adjusted to maintain the Courant number below 0.5. For spatial discretization, Gauss linear (second-order) schemes were applied to gradient and interpolation terms. The convection term of velocity was discretized using linearUpwind, while the VOF equation employed the vanLeer scheme with interface compression, ensuring bounded and sharp interface capturing.
A representative core sample from the target reservoir was selected, with a diameter of 6 mm and a length of 4 mm. After undergoing oil-washing, salt-removal, and drying treatments, the core was scanned using micro-CT to construct a digital rock geometry model of a weak waterflooding reservoir. Through conventional core physical property testing, the rock sample was measured to have a porosity of 19.9% and a gas permeability of 30.3 × 10⁻³ μm2.
2.2.1 Geometrical Model Parameters
In this study, Avizo software, in combination with the blockMesh and snappyHexMesh utilities in OpenFOAM, was employed to generate the pore-scale mesh. The workflow in Avizo involved a series of image-processing steps, including artifact removal, filtering and noise reduction, threshold segmentation, local contrast-based segmentation, and binarization, which collectively enabled the construction of a three-dimensional digital rock model. The resulting digital rock model was exported in STL format. The surfaceFeatures utility in OpenFOAM was then used to extract the characteristic edges and surface features of the solid skeleton. Subsequently, the computational mesh of the pore structure was generated using the snappyHexMesh method, with surface refinement (level 2) and snapping applied to accurately capture the intricate pore boundaries while preserving the original pore morphology [19,32,35].
A region of 150 × 150 × 350 voxels was extracted as the representative elementary volume (REV), with a single-voxel resolution of 3.0 μm. The geometrical model, shown in Fig. 2, has a porosity of 19.5% and a permeability of 27.6 × 10⁻³ μm2. These parameters are in good agreement with the results of conventional core property measurements, thus providing a reliable basis for subsequent pore-scale numerical simulations. Additionally, Fig. 3 shows the pore-throat radius frequency distribution for the connected pore network of the 3D digital rock [36,37]. The radii are mainly less than 30 μm but broadly dispersed, indicating pronounced heterogeneity in the pore structure.
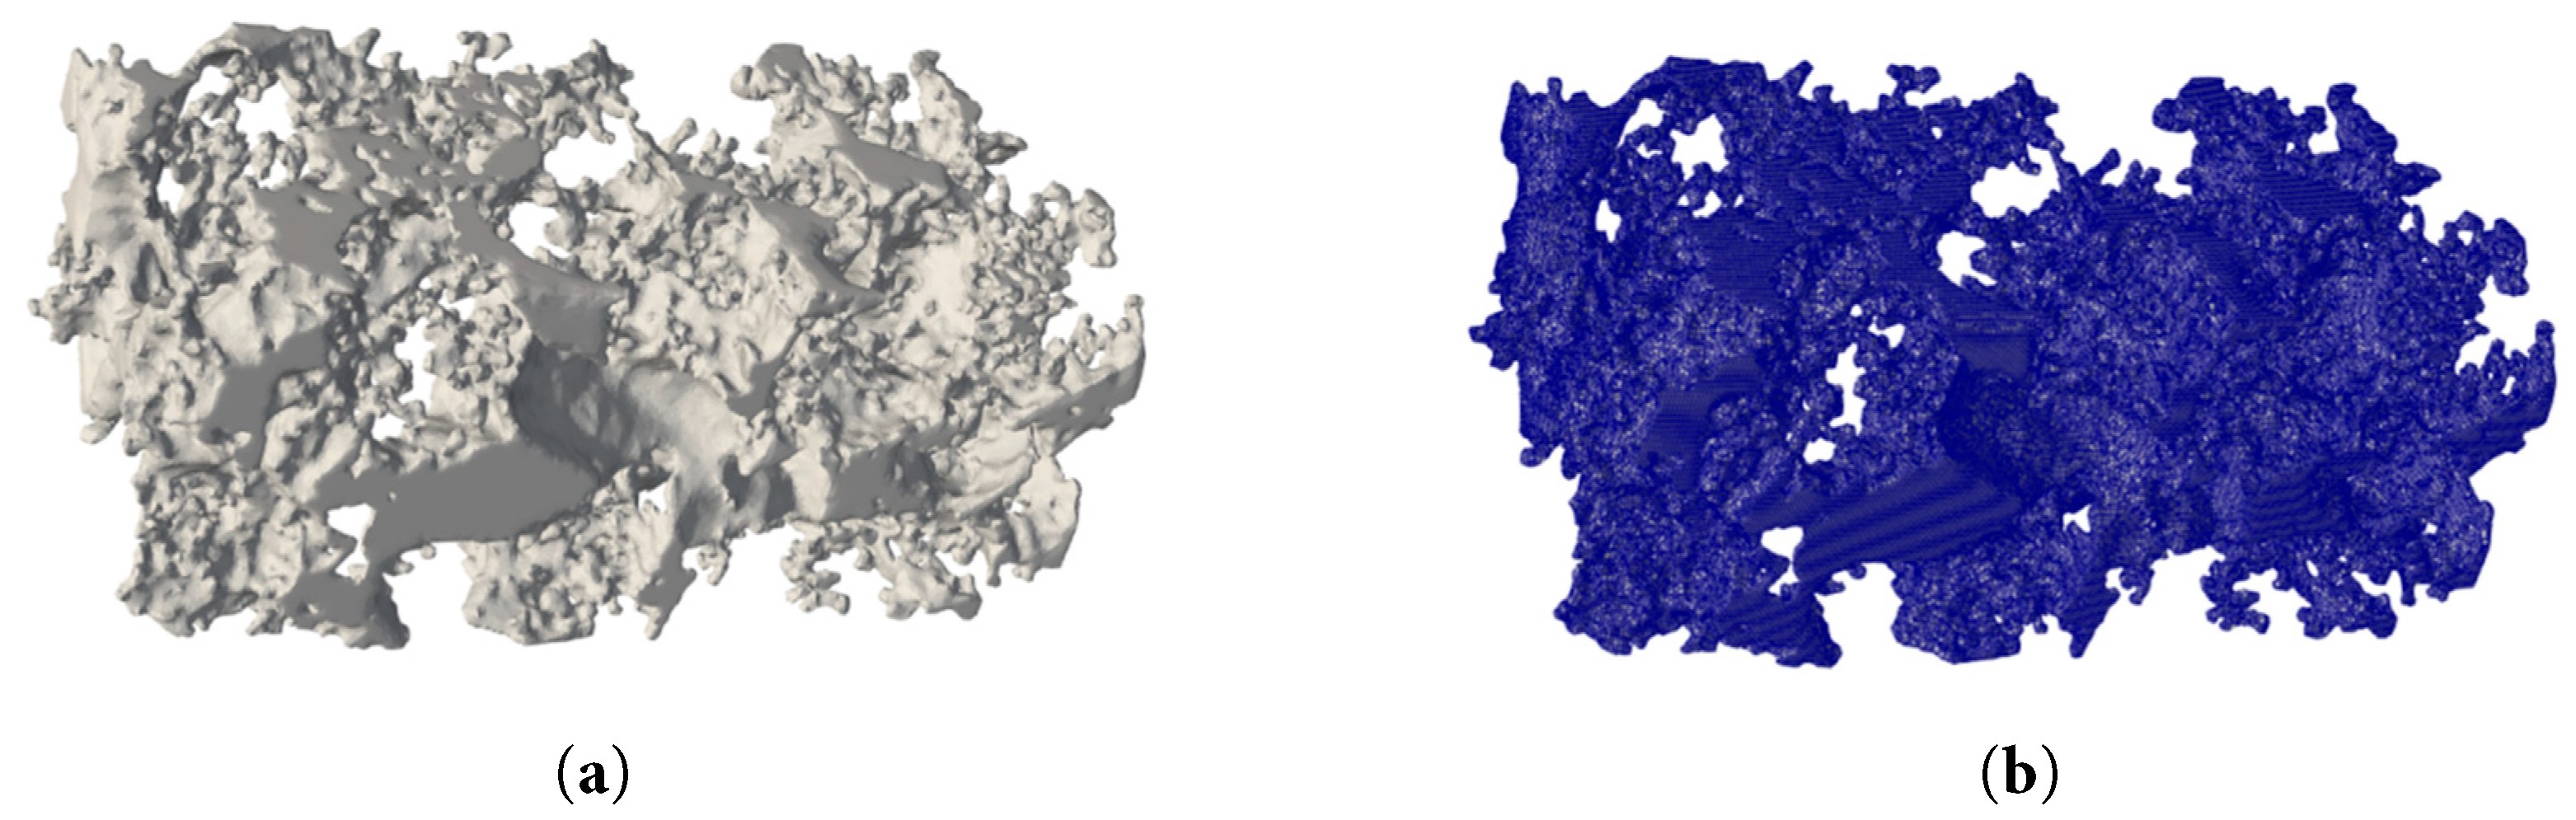
Figure 2: Digital rock geometrical model: (a) before and (b) after mesh generation.
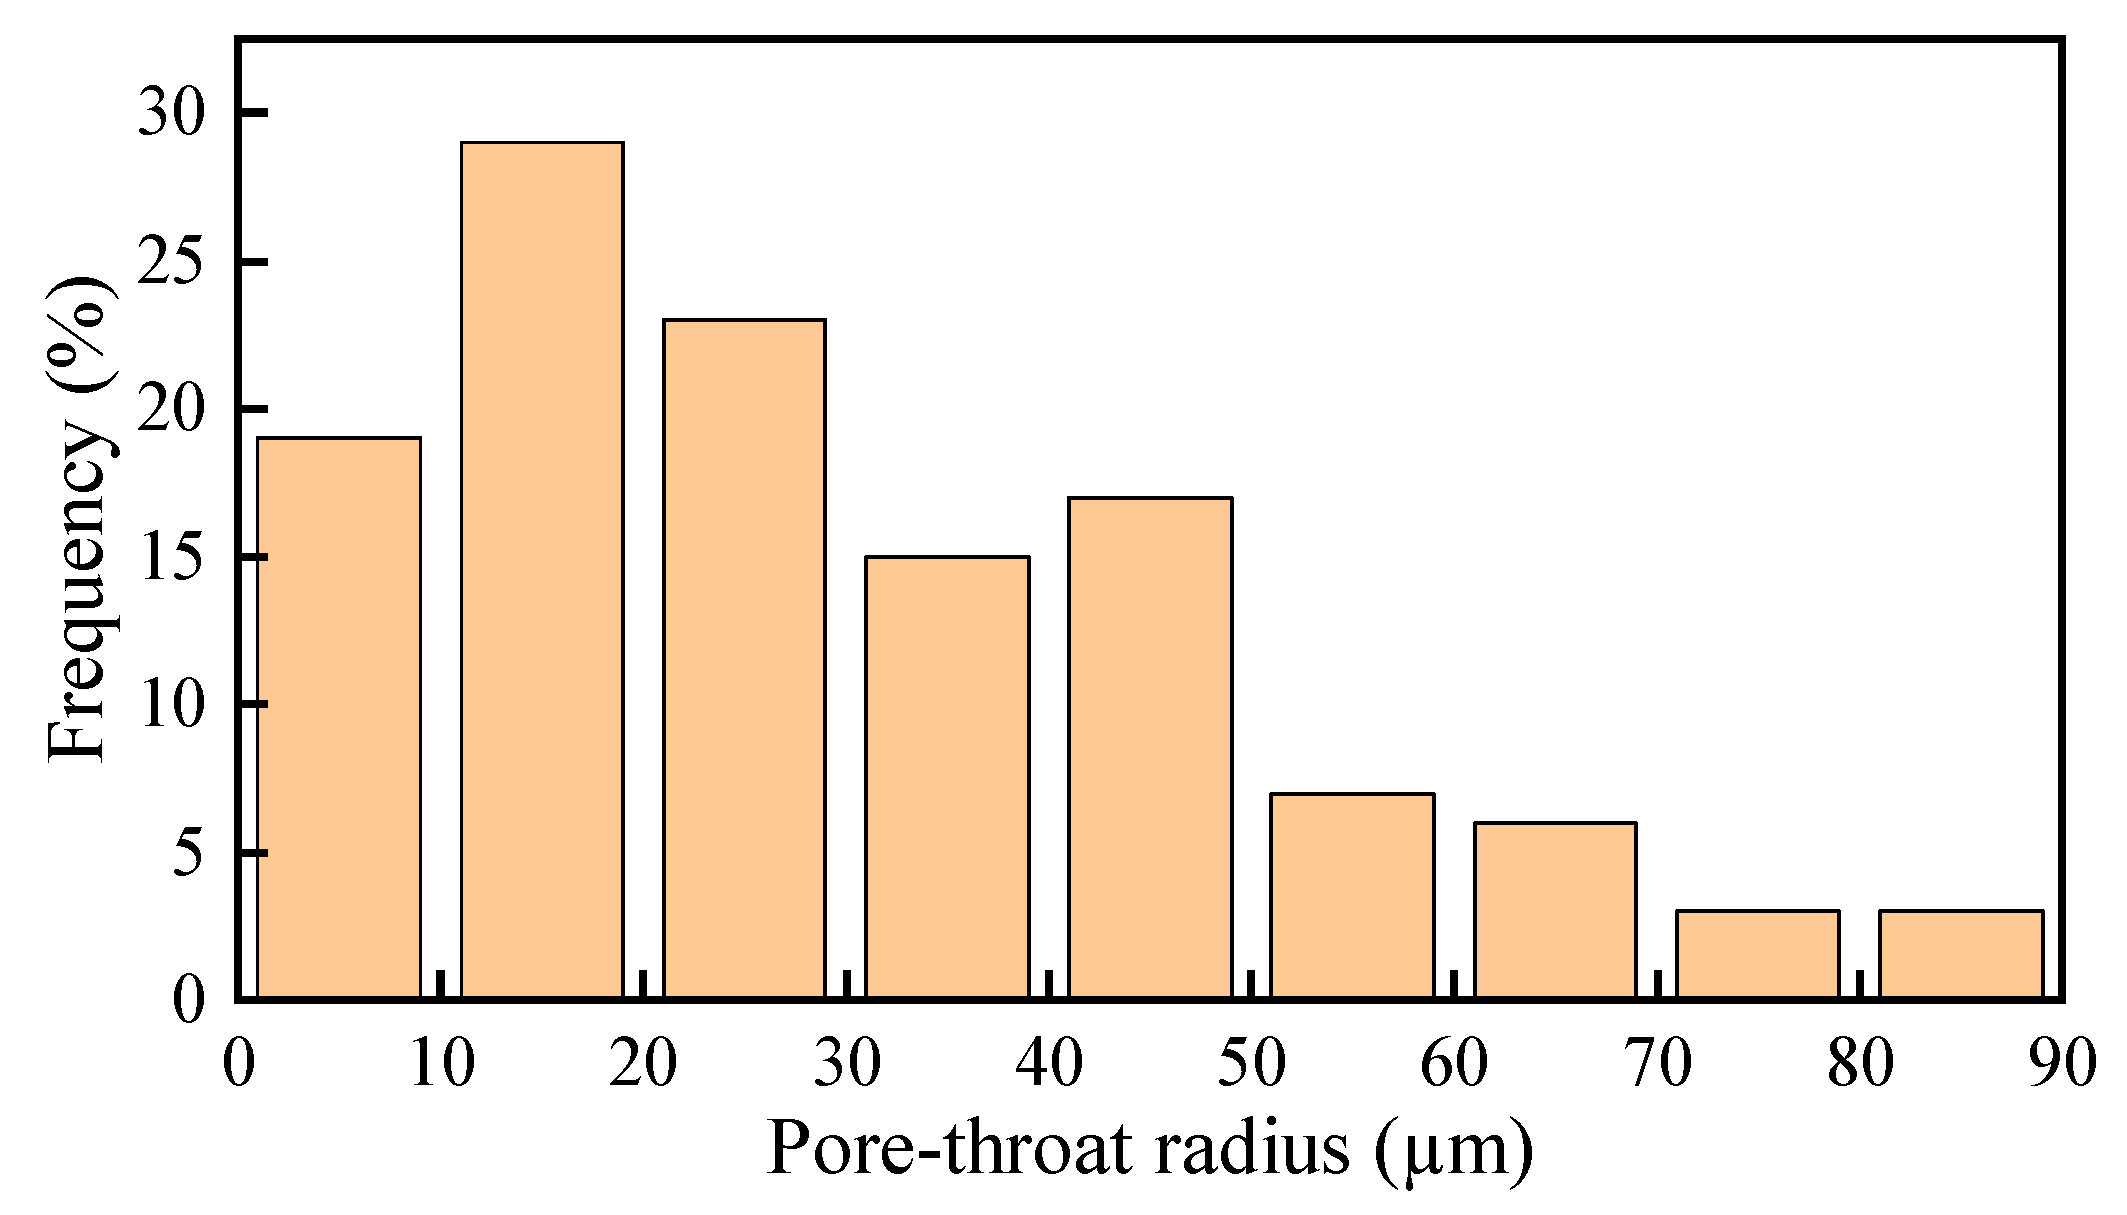
Figure 3: Pore-throat radius distribution of the connected pore network.
2.2.2 Mesh Sensitivity Analysis
Previous studies utilizing the VOF method with interface compression schemes have demonstrated the necessity of assessing grid sensitivity [19,31,38,39,40]. Accordingly, to ensure numerical stability and accuracy, a grid independence test was conducted. Three mesh systems with different resolutions were generated based on the same digital rock geometry: Coarse (985,486 cells), Medium (1,224,178 cells), and Fine (1,583,120 cells). The water flooding process was simulated using these three mesh systems under identical boundary conditions.
Fig. 4 compares the recovery factor curves obtained from the three mesh systems. As observed, the results from the coarse mesh show a noticeable deviation, predicting a higher recovery factor (50.8%), likely due to numerical diffusion effects associated with insufficient grid resolution. However, the curves for the medium and fine meshes are in excellent agreement, particularly in the later stages of injection. Table 1 quantifies the results at 1.0 PV. The final recovery factors for the medium and fine meshes are 47.7% and 46.8%, respectively. The relative error between them is less than 2.0%, indicating that the solution has achieved grid independence.
Considering the balance between computational accuracy and efficiency, the medium mesh system (1,224,178 cells) was selected as the baseline for all subsequent simulation schemes in this study.
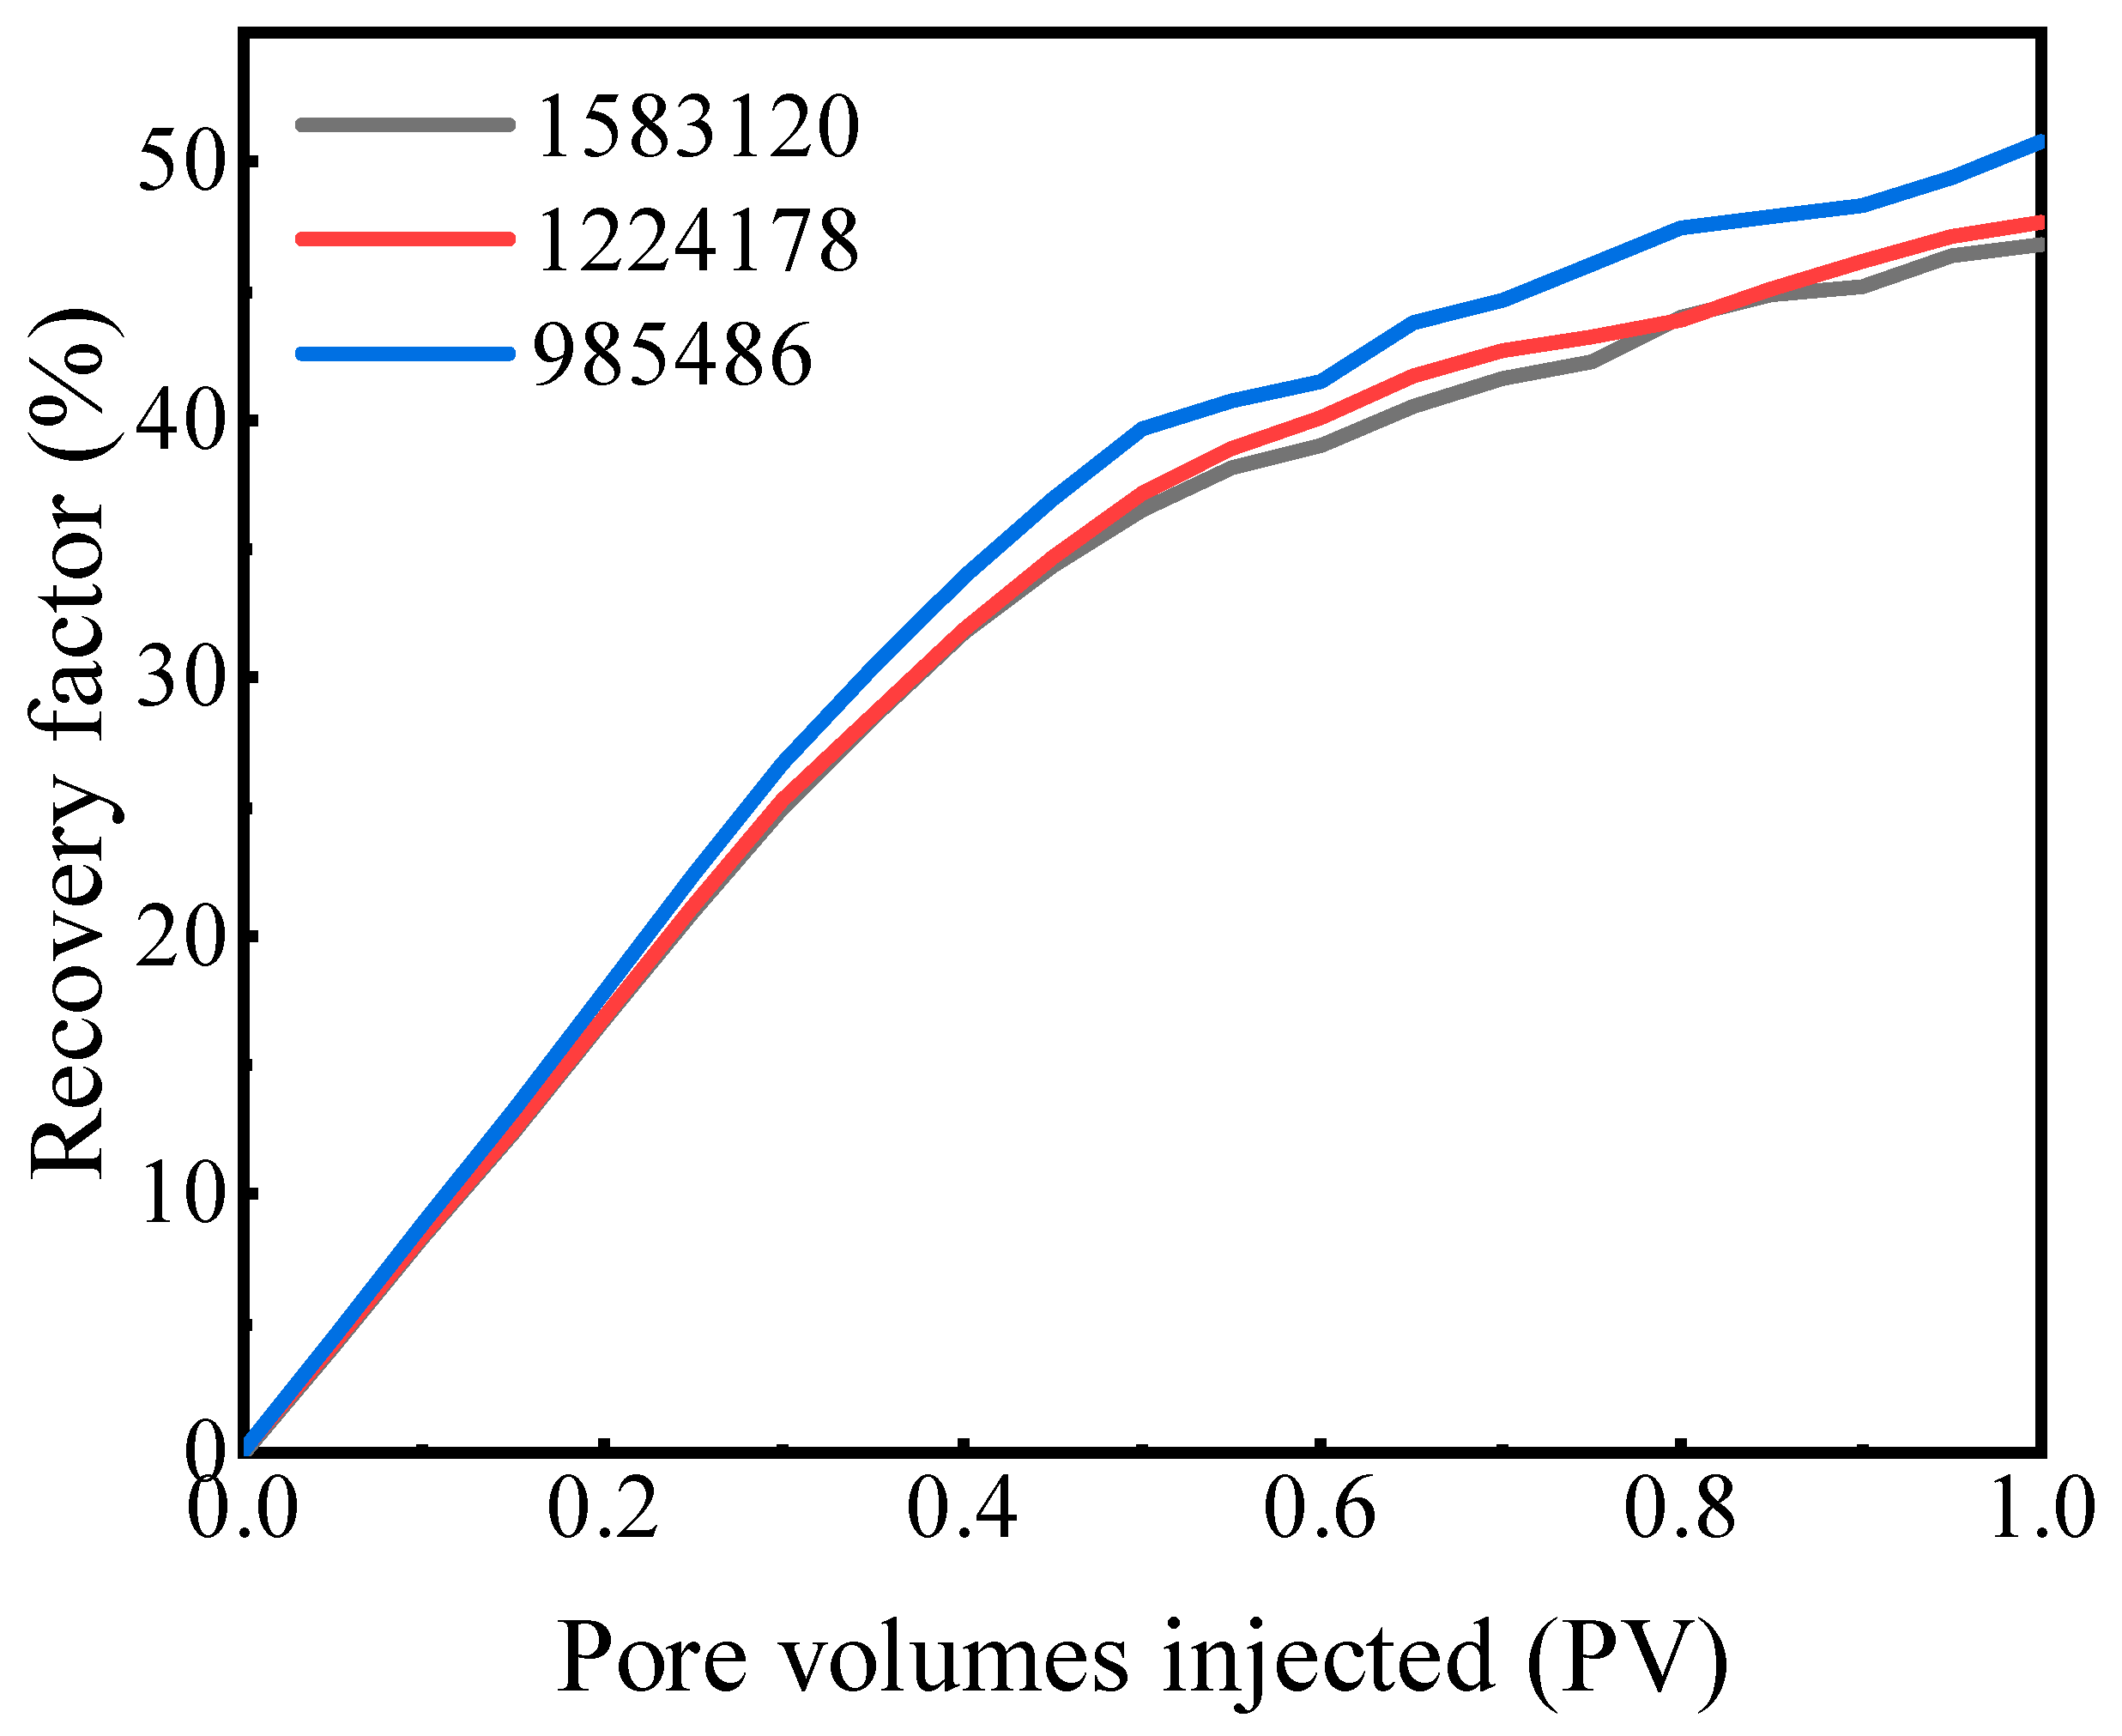
Figure 4: Comparison of recovery factors simulated using different mesh systems.
Table 1: Quantitative results of the mesh sensitivity analysis.
| Mesh System | Number of Cells | Recovery Factor at 1.0 PV (%) | Relative Error (%) |
|---|---|---|---|
| Coarse | 985,486 | 50.80 | - |
| Medium | 1,224,178 | 47.70 | 6.10% (vs. Coarse) |
| Fine | 1,583,120 | 46.80 | 1.89% (vs. Medium) |
Based on core samples collected from the target offshore reservoir, a laboratory rock wettability test was conducted to determine the wetting characteristics. Wettability is generally characterized by the contact angle θ, which is defined as the angle formed at the three-phase contact line, measured through the liquid phase between the solid–liquid and liquid–gas interfaces [41]. As shown in Fig. 5, the reservoir exhibited a contact angle of 85.9°.
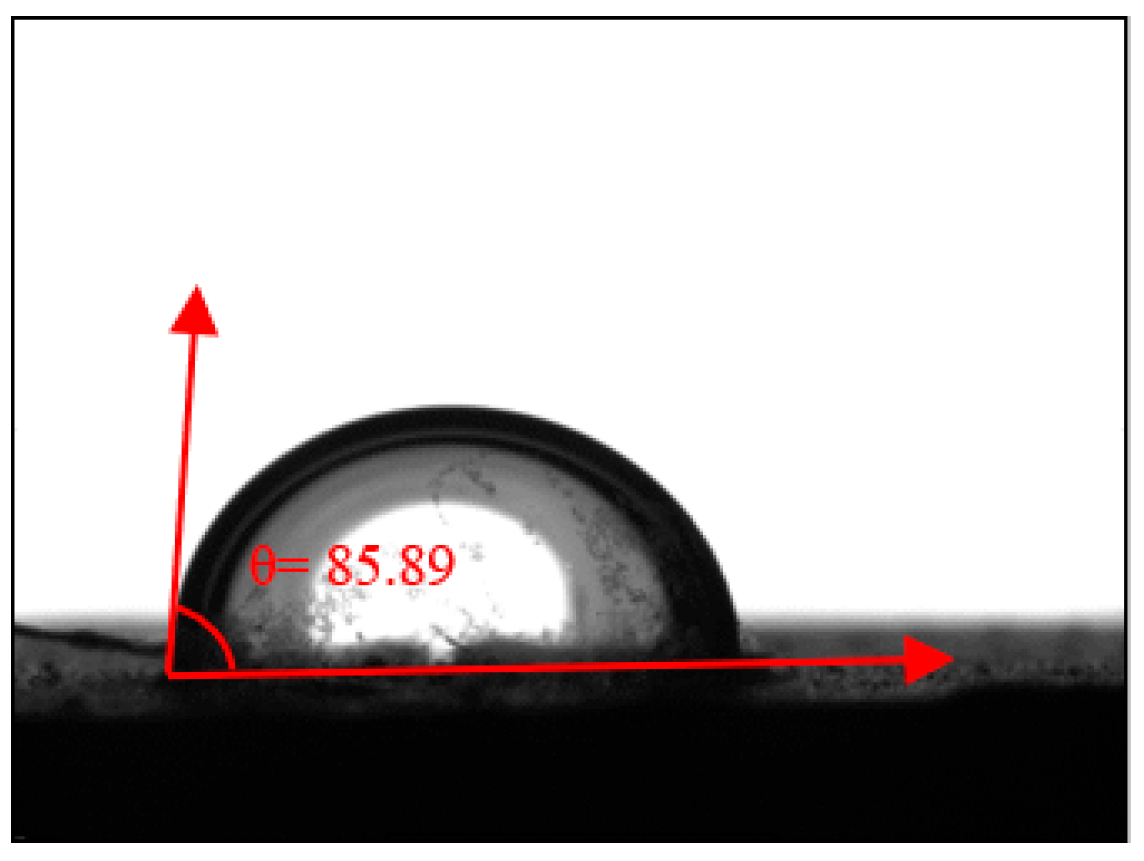
Figure 5: Experimentally measured contact angle.
3 Model Validation and Scheme Design
To validate the accuracy of the VOF method in simulating interfacial flow, a laminar two-phase flow model between parallel plates was solved and compared with the analytical solution [42,43]. Fig. 6 illustrates the schematic of the stratified two-phase flow between parallel plates. Two immiscible fluids are distributed between two infinitely long, parallel plates, with the channel extending to a height of 2b in the y-direction, and the channel centerline located at y = 0. Fluid 1 occupies the region 0 < |y| < a, while Fluid 2 occupies the region a < |y| < b. Two constant pressure gradients, G1 and G2, are applied to Fluid 1 and Fluid 2, respectively. Both fluids have the same density ρ, while their viscosities are μ1 and μ2, respectively.
Assuming that the fluid flow between the parallel plates reaches a steady state and satisfies Poiseuille flow, the analytical solution for the velocity profile along the y-direction cross-section, within the positive half-axis between two infinitely long parallel plates, is given by:
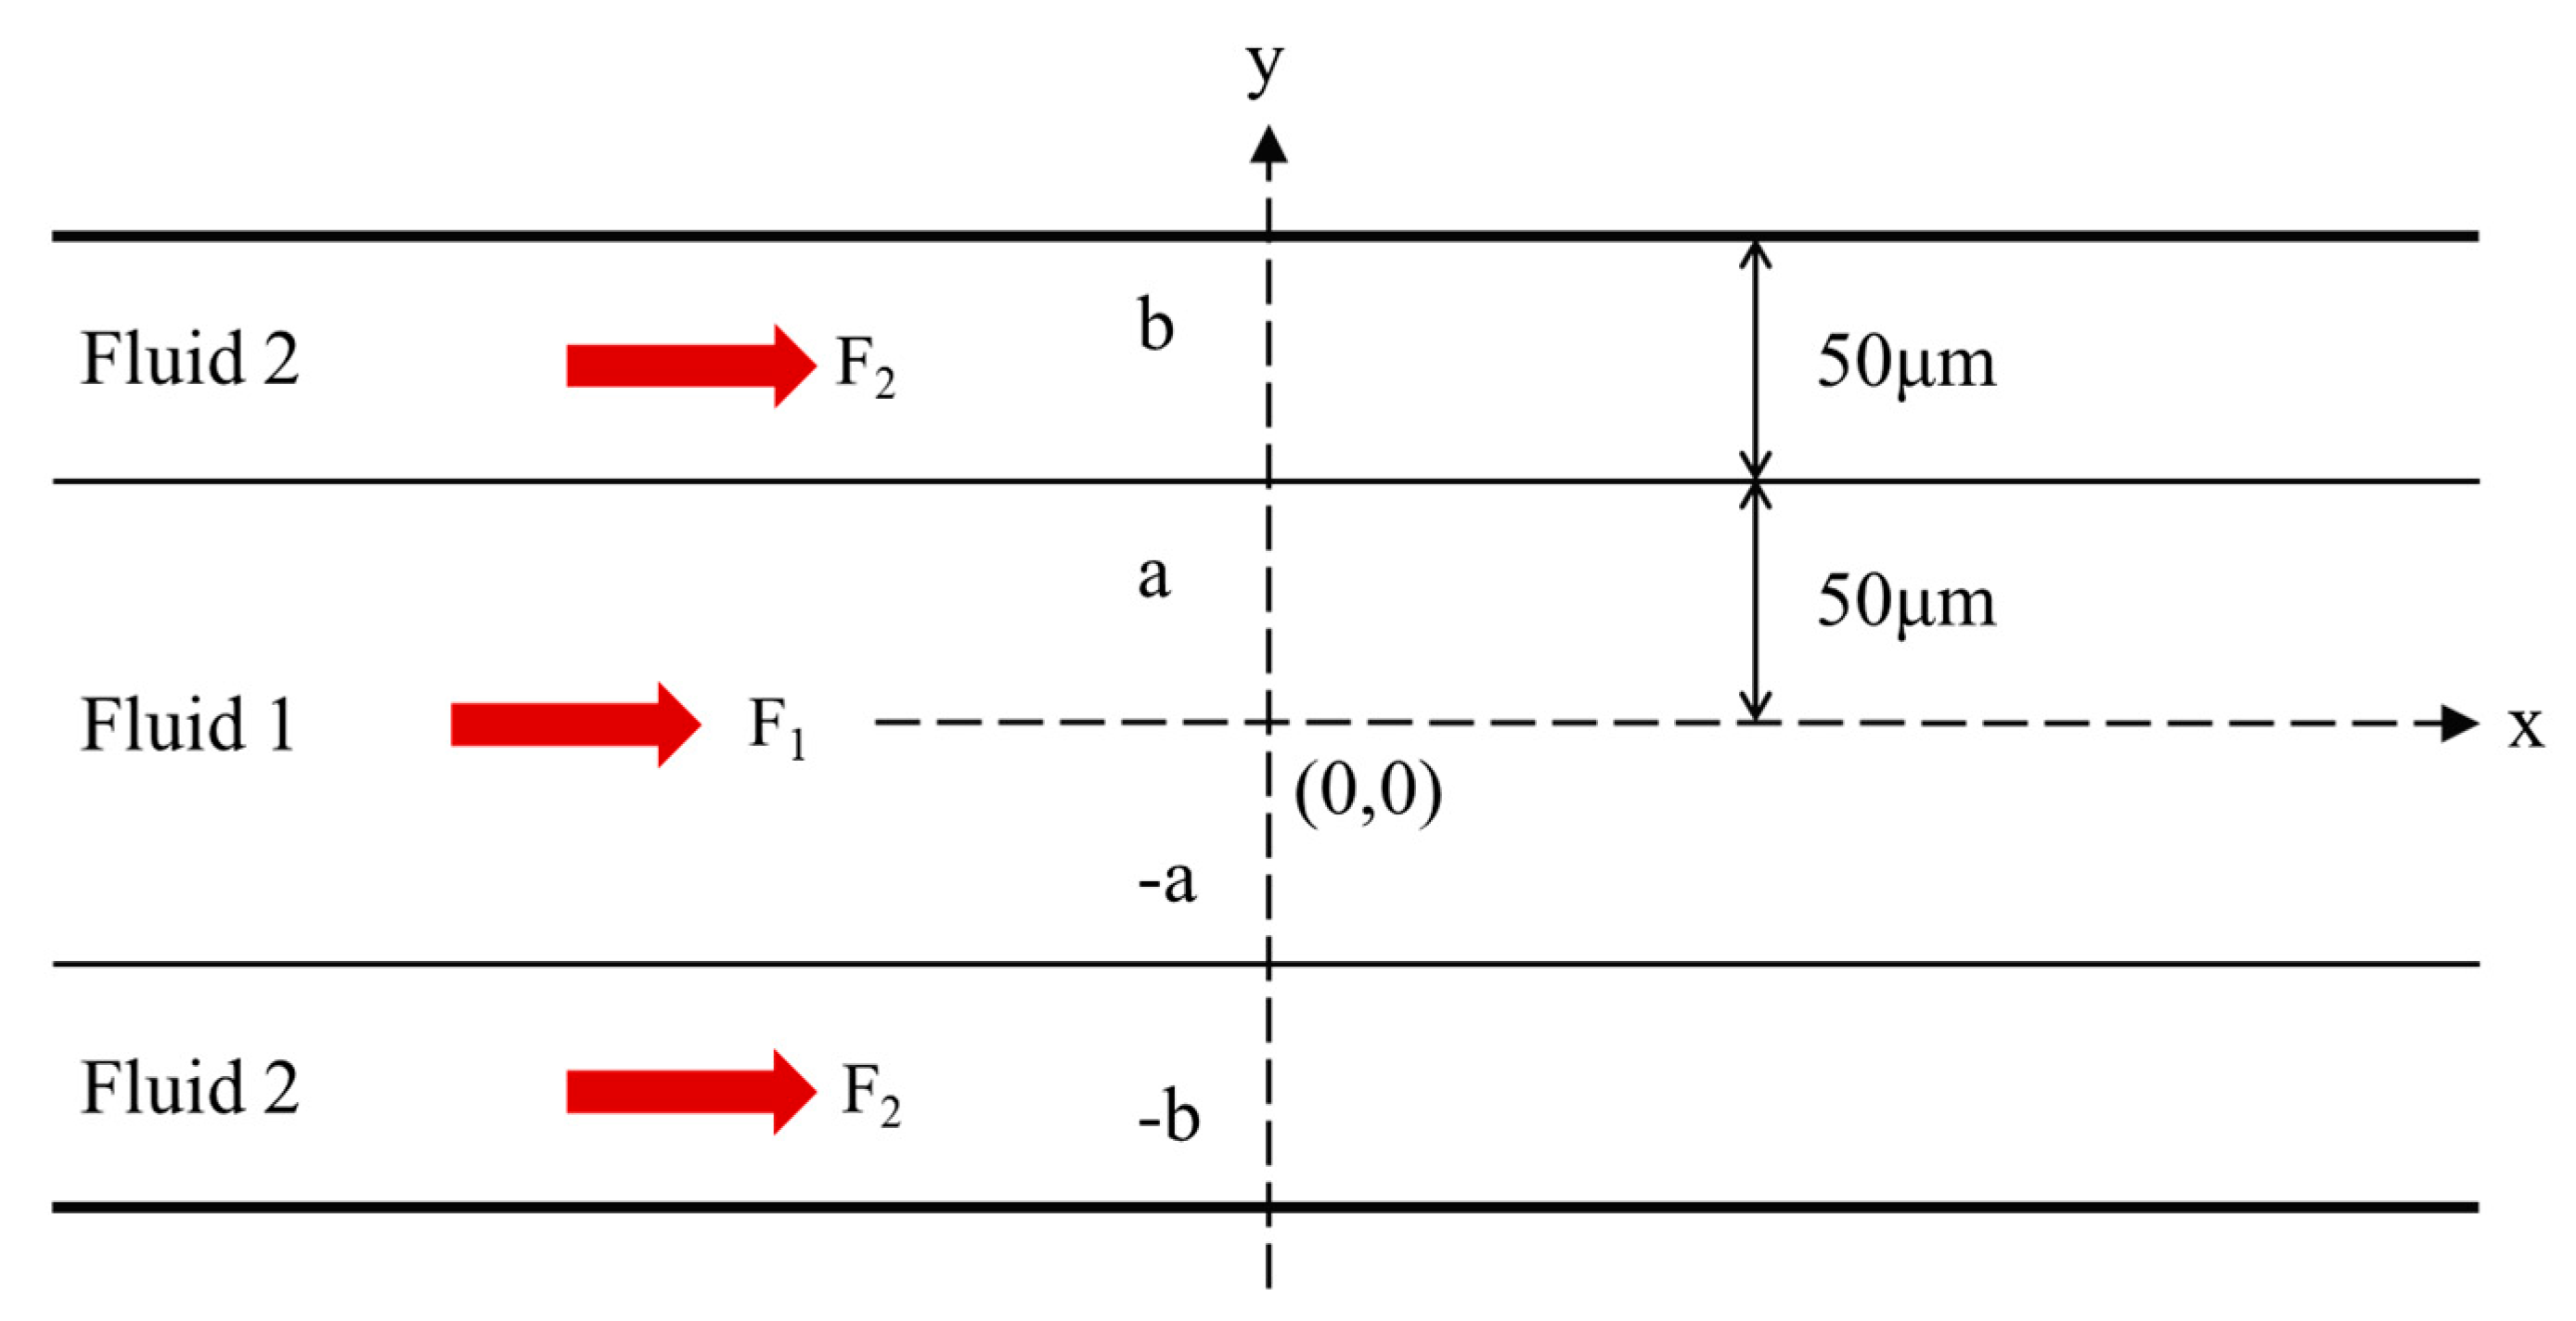
Figure 6: Stratified two-phase flow model between parallel plates.
The computational domain measures 10 μm × 200 μm. The initial velocity field was set to zero. Periodic boundary conditions were applied along the x-direction, while no-slip boundary conditions were imposed at the walls. The densities of the two fluids are ρ1 = ρ2 = 1000 kg/m3, with the viscosities of μ1 = 4 mPa·s and μ2 = 50 mPa·s, respectively. The interfacial tension between the two phases is 0.07 N/m. The distance between the parallel plates is 2a + 2b = 200 μm. A constant pressure gradient of G1 = 1 × 10⁶ Pa/m was applied to Fluid 1, and G2 = 0 was applied to Fluid 2. Fig. 7 presents a comparison between the numerical velocity profile across the parallel plates cross section and the corresponding analytical solution. The numerical results agree well with the analytical solution derived from Poiseuille’s law, thereby validating the accuracy of the proposed model and numerical methodology.
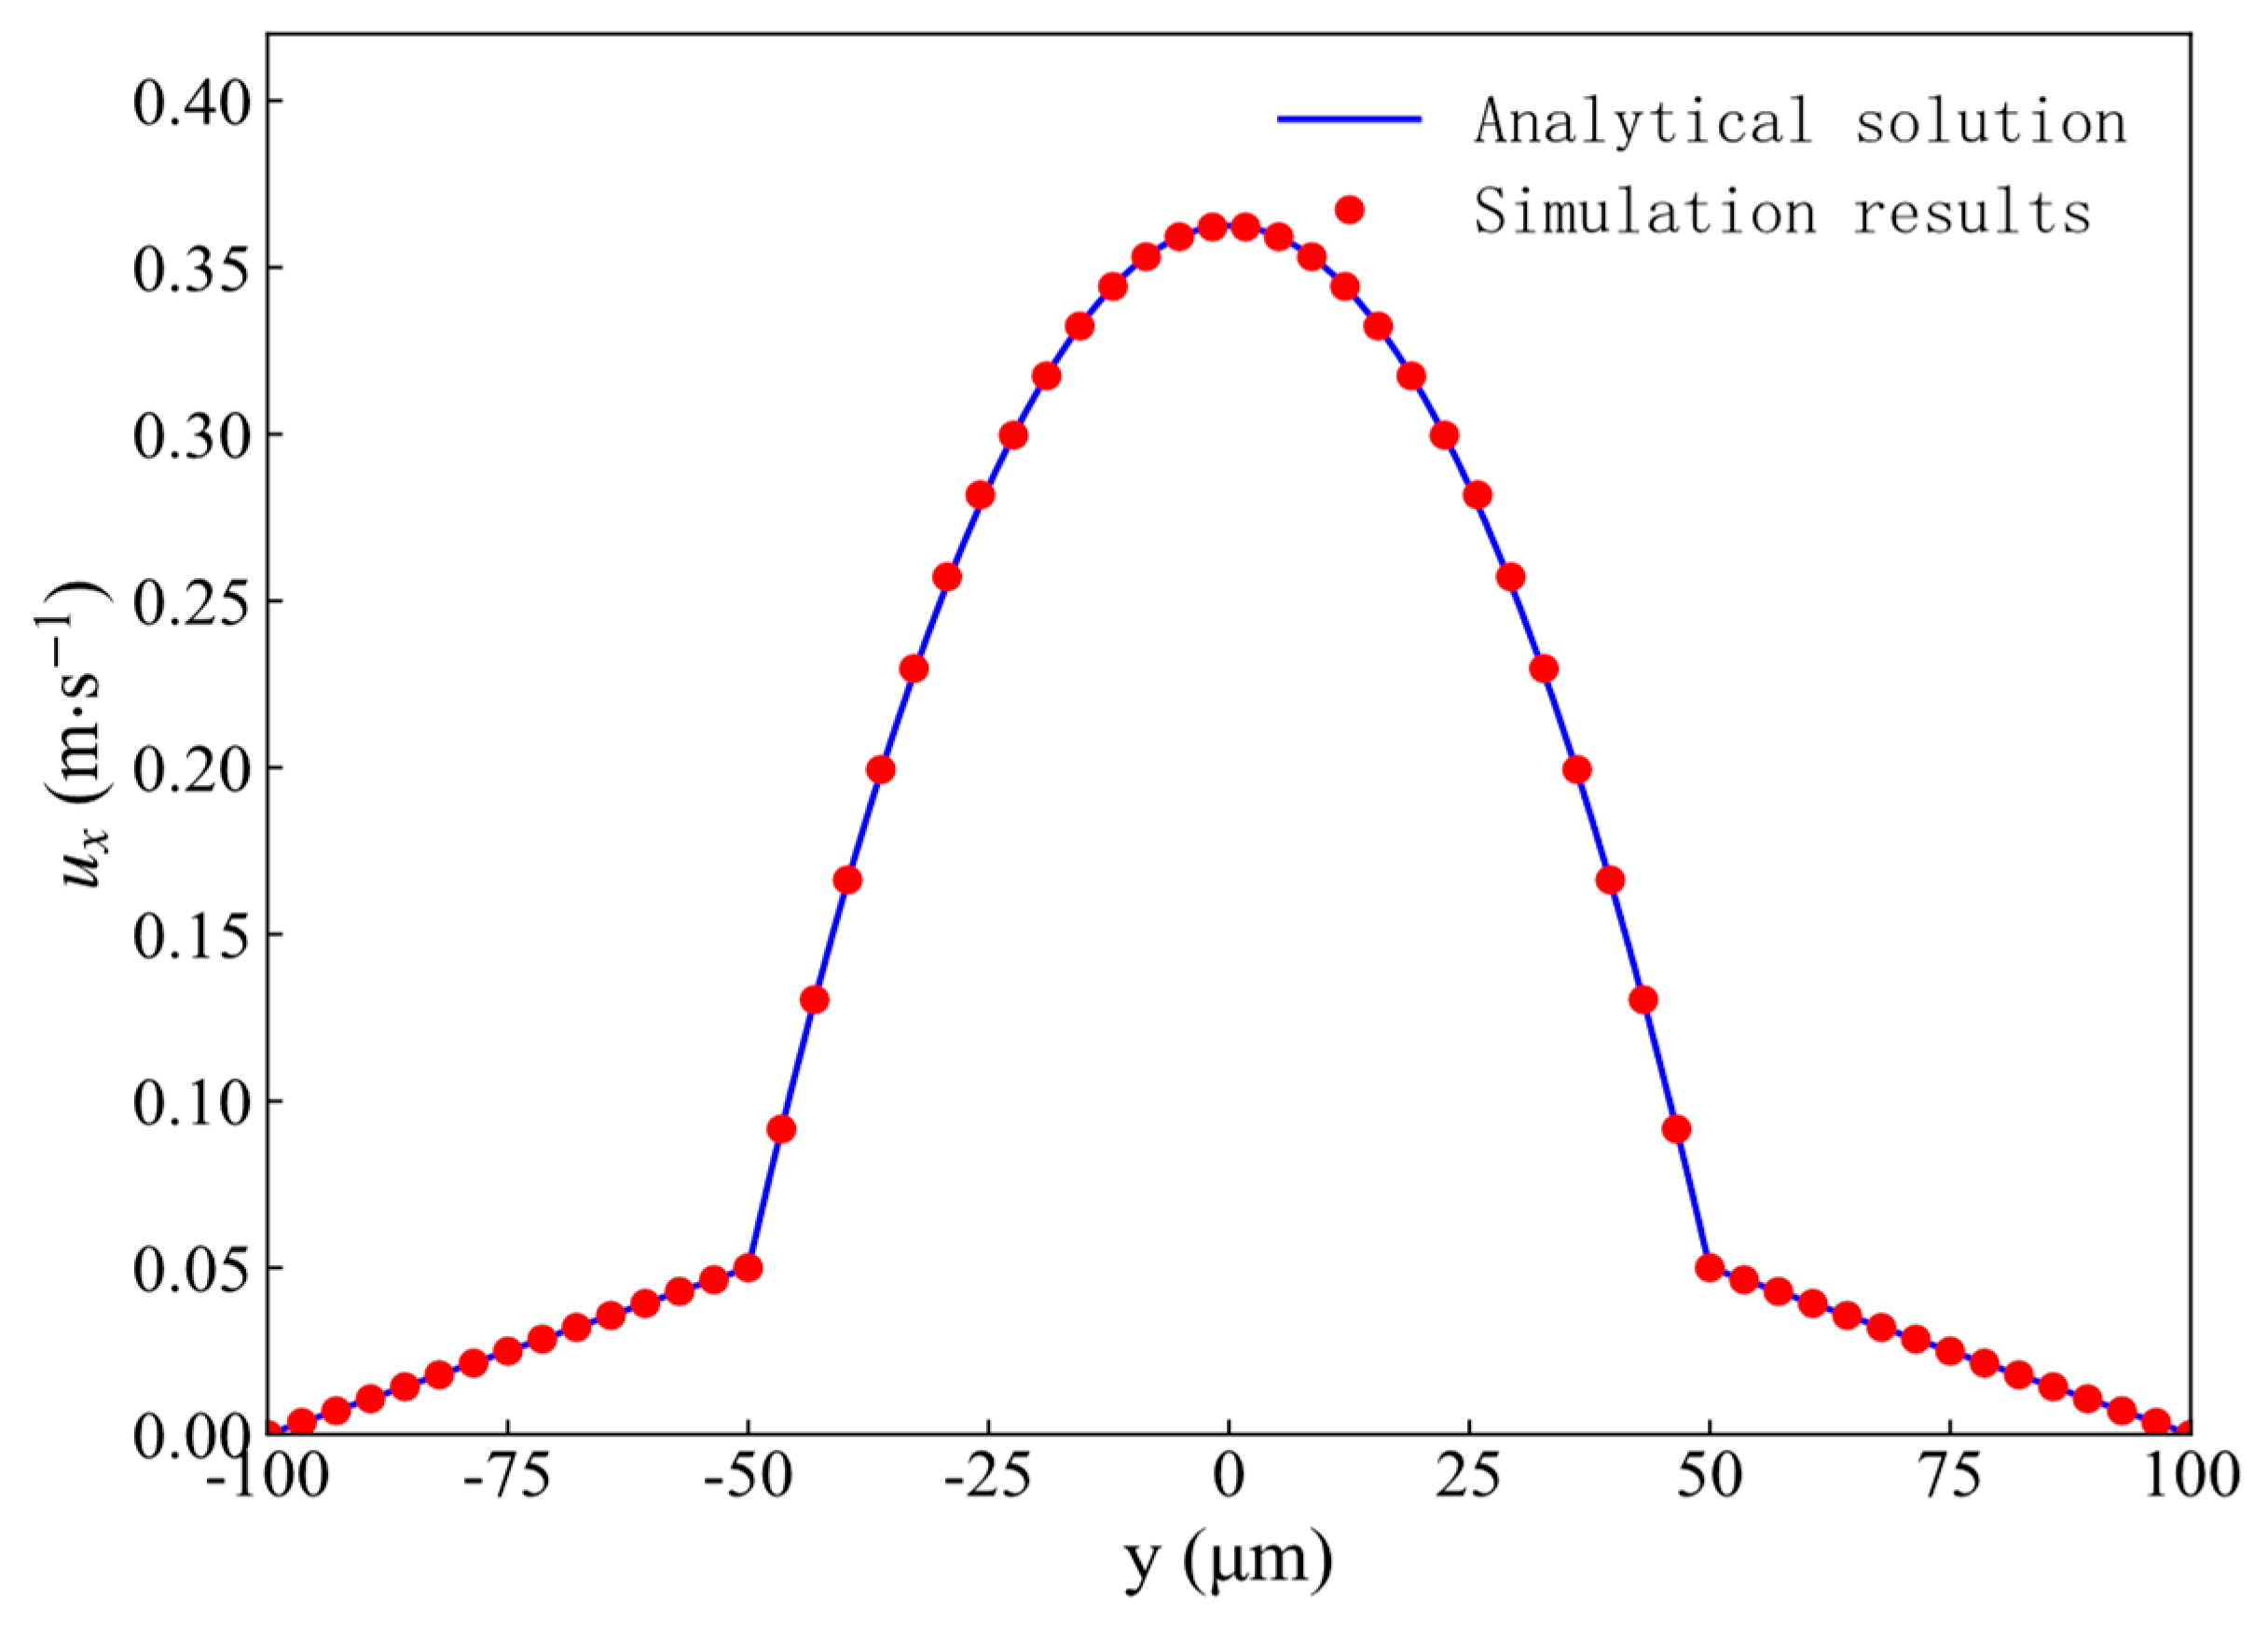
Figure 7: Comparison of numerical and analytical solutions for the velocity profile between parallel plates.
Based on the target reservoir core, a three-dimensional digital rock model was constructed (geometrical representation shown in Fig. 1) to conduct pore-scale numerical simulations. The effects of injection velocity, oil–water viscosity ratio, and miscibility degree on microscale flow behavior were systematically analyzed. Specifically, Schemes 1–3 compare cases with different injection velocities, Schemes 2, 4, and 5 examine variations in the viscosity ratio, and Schemes 6–8 focus on different miscibility degrees and injection patterns. The multiphase flow simulation parameters and corresponding scheme distinctions are summarized in Table 2.
Table 2: Simulation scheme design.
| Scheme | Velocity (m/s) | Wettability (°) | Oil–Water Viscosity Ratio | Diffusion Coefficient (m2/s) | Interfacial Tension (N/m) | Injection Patterns |
|---|---|---|---|---|---|---|
| 1 | 0.0002 | 85.9 | 3 | / | 0.02 | Waterflooding |
| 2 | 0.001 | 85.9 | 3 | / | 0.02 | Waterflooding |
| 3 | 0.002 | 85.9 | 3 | / | 0.02 | Waterflooding |
| 4 | 0.001 | 85.9 | 1 | / | 0.02 | Waterflooding |
| 5 | 0.001 | 85.9 | 8 | / | 0.02 | Waterflooding |
| 6 | 0.001 | / | / | 1 × 10⁻¹⁰ | 0.01 | Partially miscible |
| 7 | 0.001 | / | / | 1 × 10⁻⁹ | 0 | Miscible |
| 8 | 0.001 | / | / | 1 × 10⁻⁹ | 0 | Water-alternating-gas miscible |
To further indicate the controlling mechanisms of oil–gas–water flow in the target reservoir, multiphase VOF simulations were conducted based on the digital rock model shown in Fig. 1. The study systematically analyzed the effects of injection velocity, oil–water viscosity ratio, miscibility degree, and injection patterns on displacement efficiency. By examining the distribution of residual oil, the influence mechanisms of these factors on reservoir recovery were clarified, thereby identifying the most effective development strategy for the target reservoir. The simulation results not only provide a theoretical basis for reservoir development but also offer technical guidance for subsequent engineering applications.
4.1 Effect of Injection Velocity on Displacement Efficiency
To investigate the effect of injection velocity on the recovery factor and residual oil distribution of the target reservoir, pore-scale two-phase flow simulations were employed based on the model established in the previous section. The injection velocity was set as a variable parameter, with values to 0.0002 m/s, 0.001 m/s, and 0.002 m/s. Water was continuously injected along the positive X-axis, while zero-gradient boundary conditions were applied at both the inlet and outlet. The oil–water distribution results under different injection velocities are shown in Fig. 8, and the corresponding variations in residual oil saturation across slices are shown in Fig. 9a. Variations in injection velocity exerted a significant influence on fingering and channeling phenomena in the water flooding process. According to the calculations and comparison with the log M–log Ca phase diagram summarized by Liu et al. [44], the region corresponding to V = 0.002 m/s falls within the crossover zone, where both viscous fingering and capillary fingering coexist. As V decreases, the displacement behavior becomes increasingly dominated by capillary fingering. As the injection velocity increases, the width of the fingering front decreases, resulting in a non-uniform oil–water distribution and leaving portions of the reservoir unswept and ineffectively displaced. In contrast, lower injection velocities allow water to permeate the reservoir more uniformly. Although residual oil saturation varies with different injection velocity, the overall differences are relatively small. A pronounced reduction in oil saturation was observed near the core inlet, whereas substantial residual oil remained in the central and outlet regions.
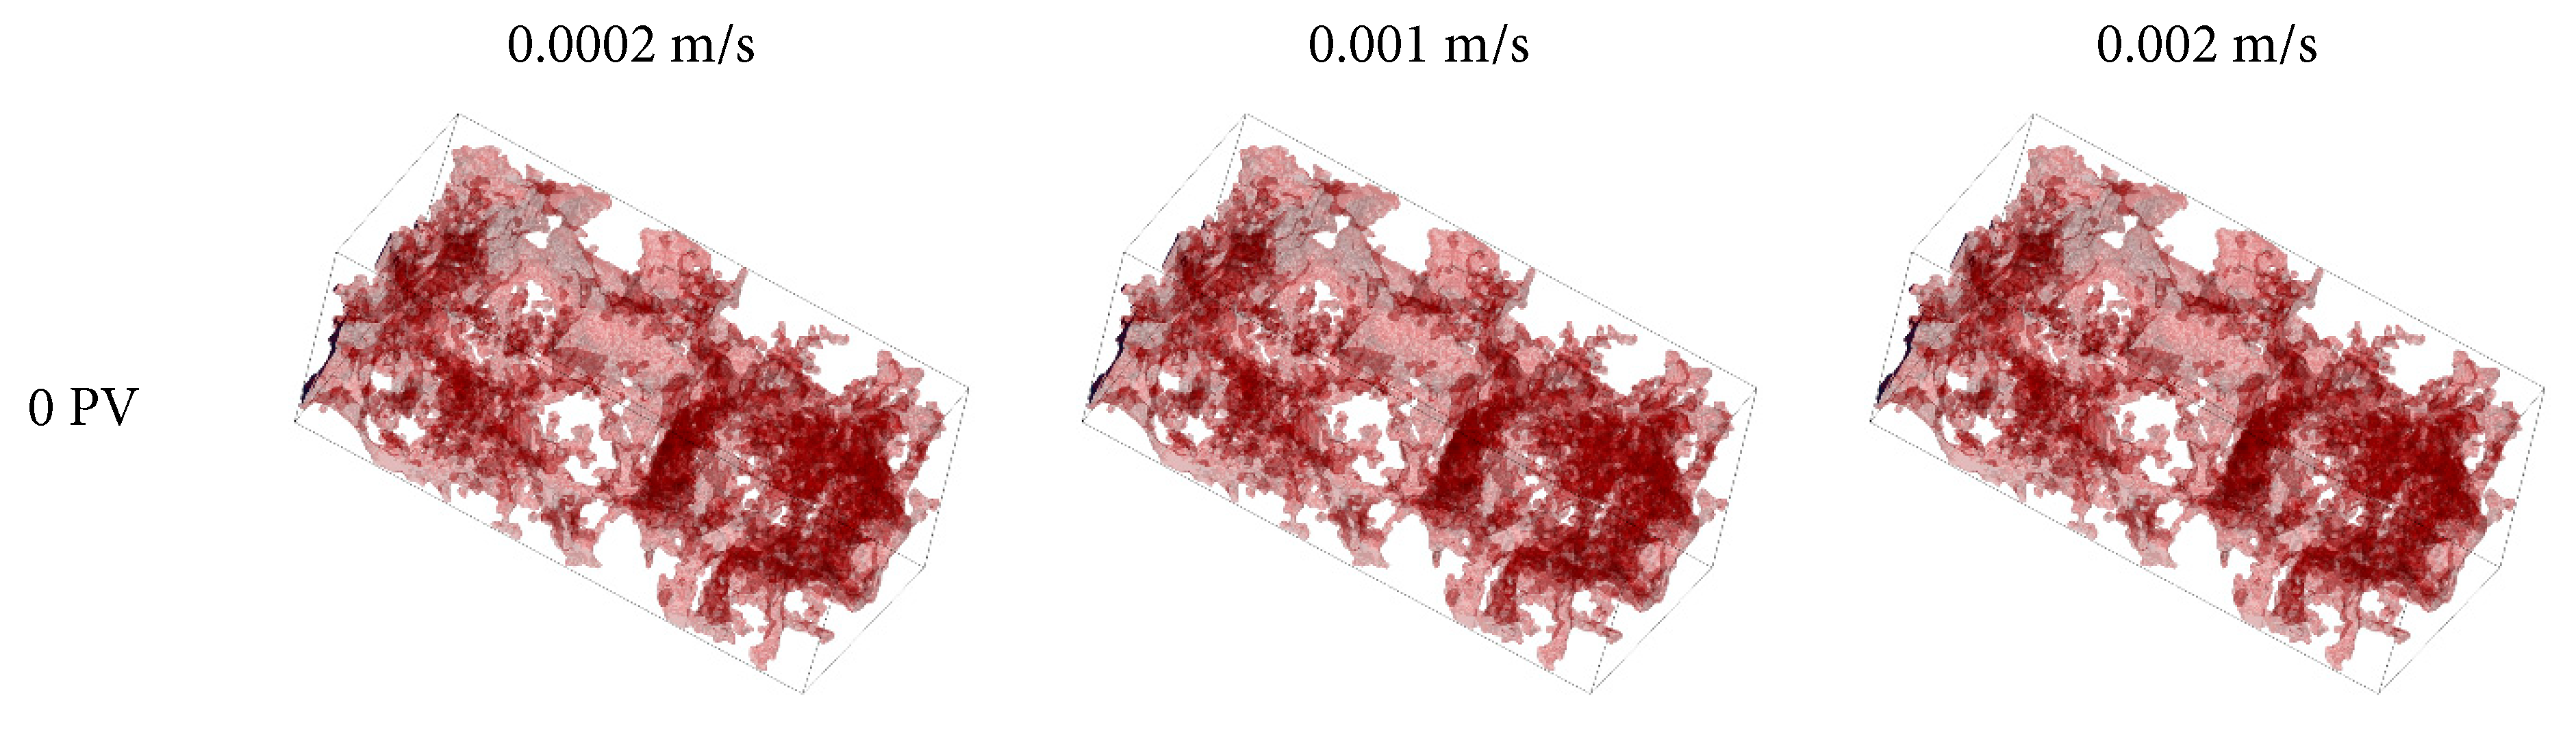
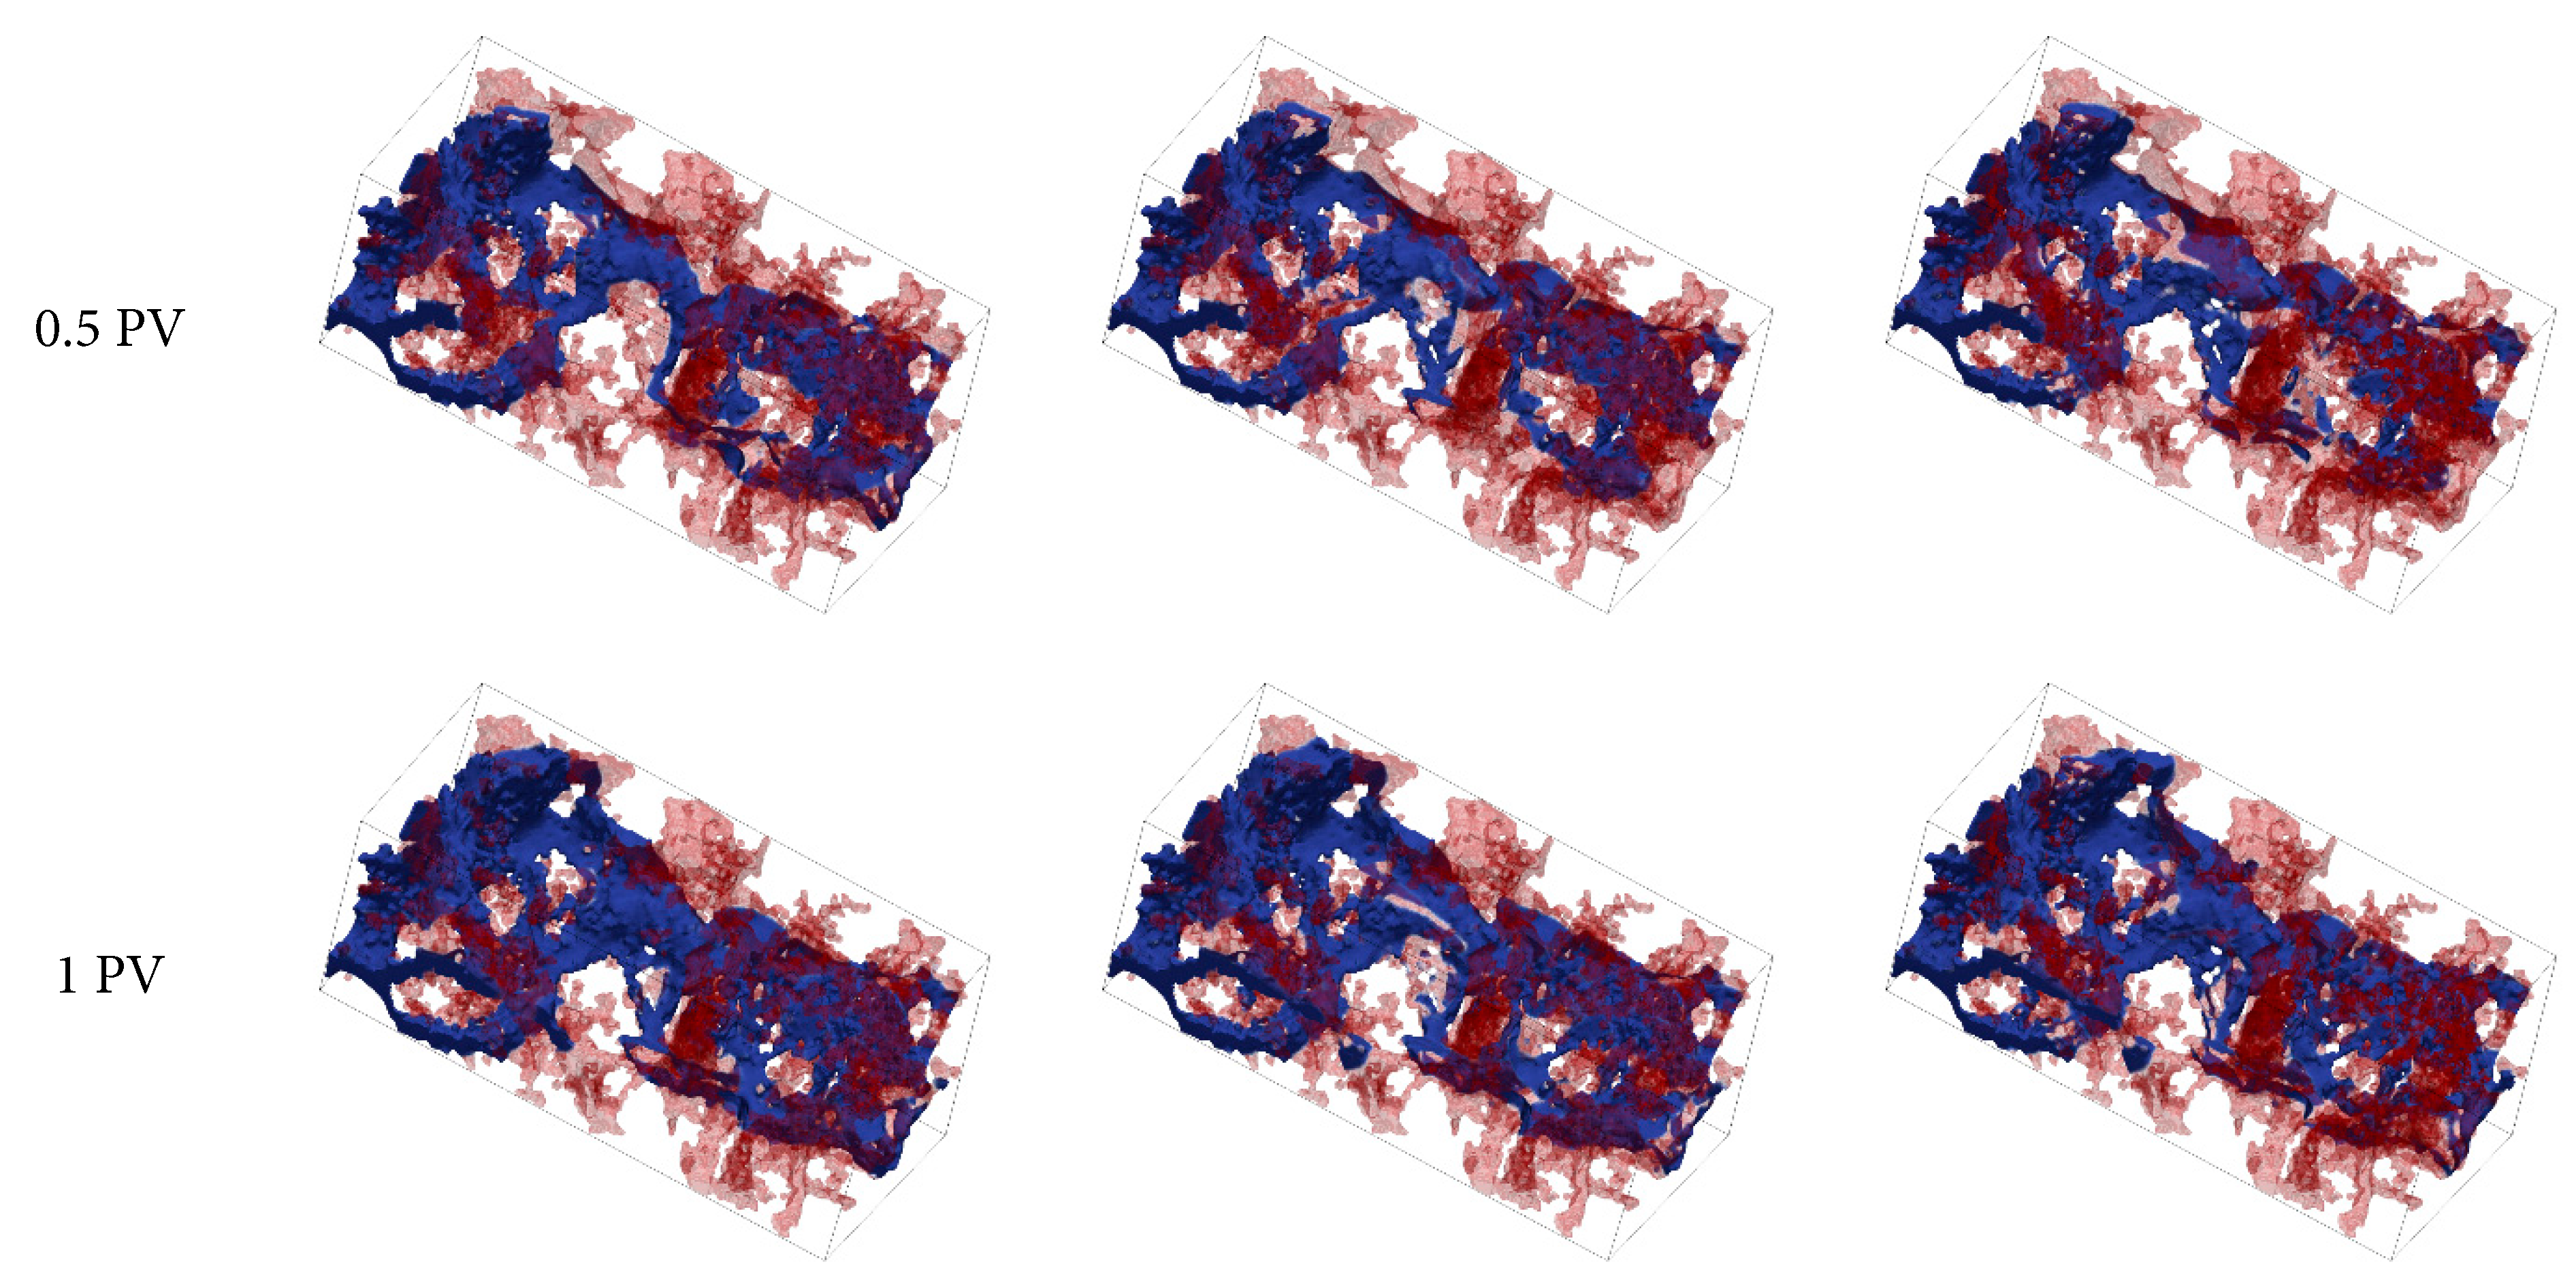
Figure 8: Oil–water phase distributions under different injection velocities, with water shown in blue and oil in red.
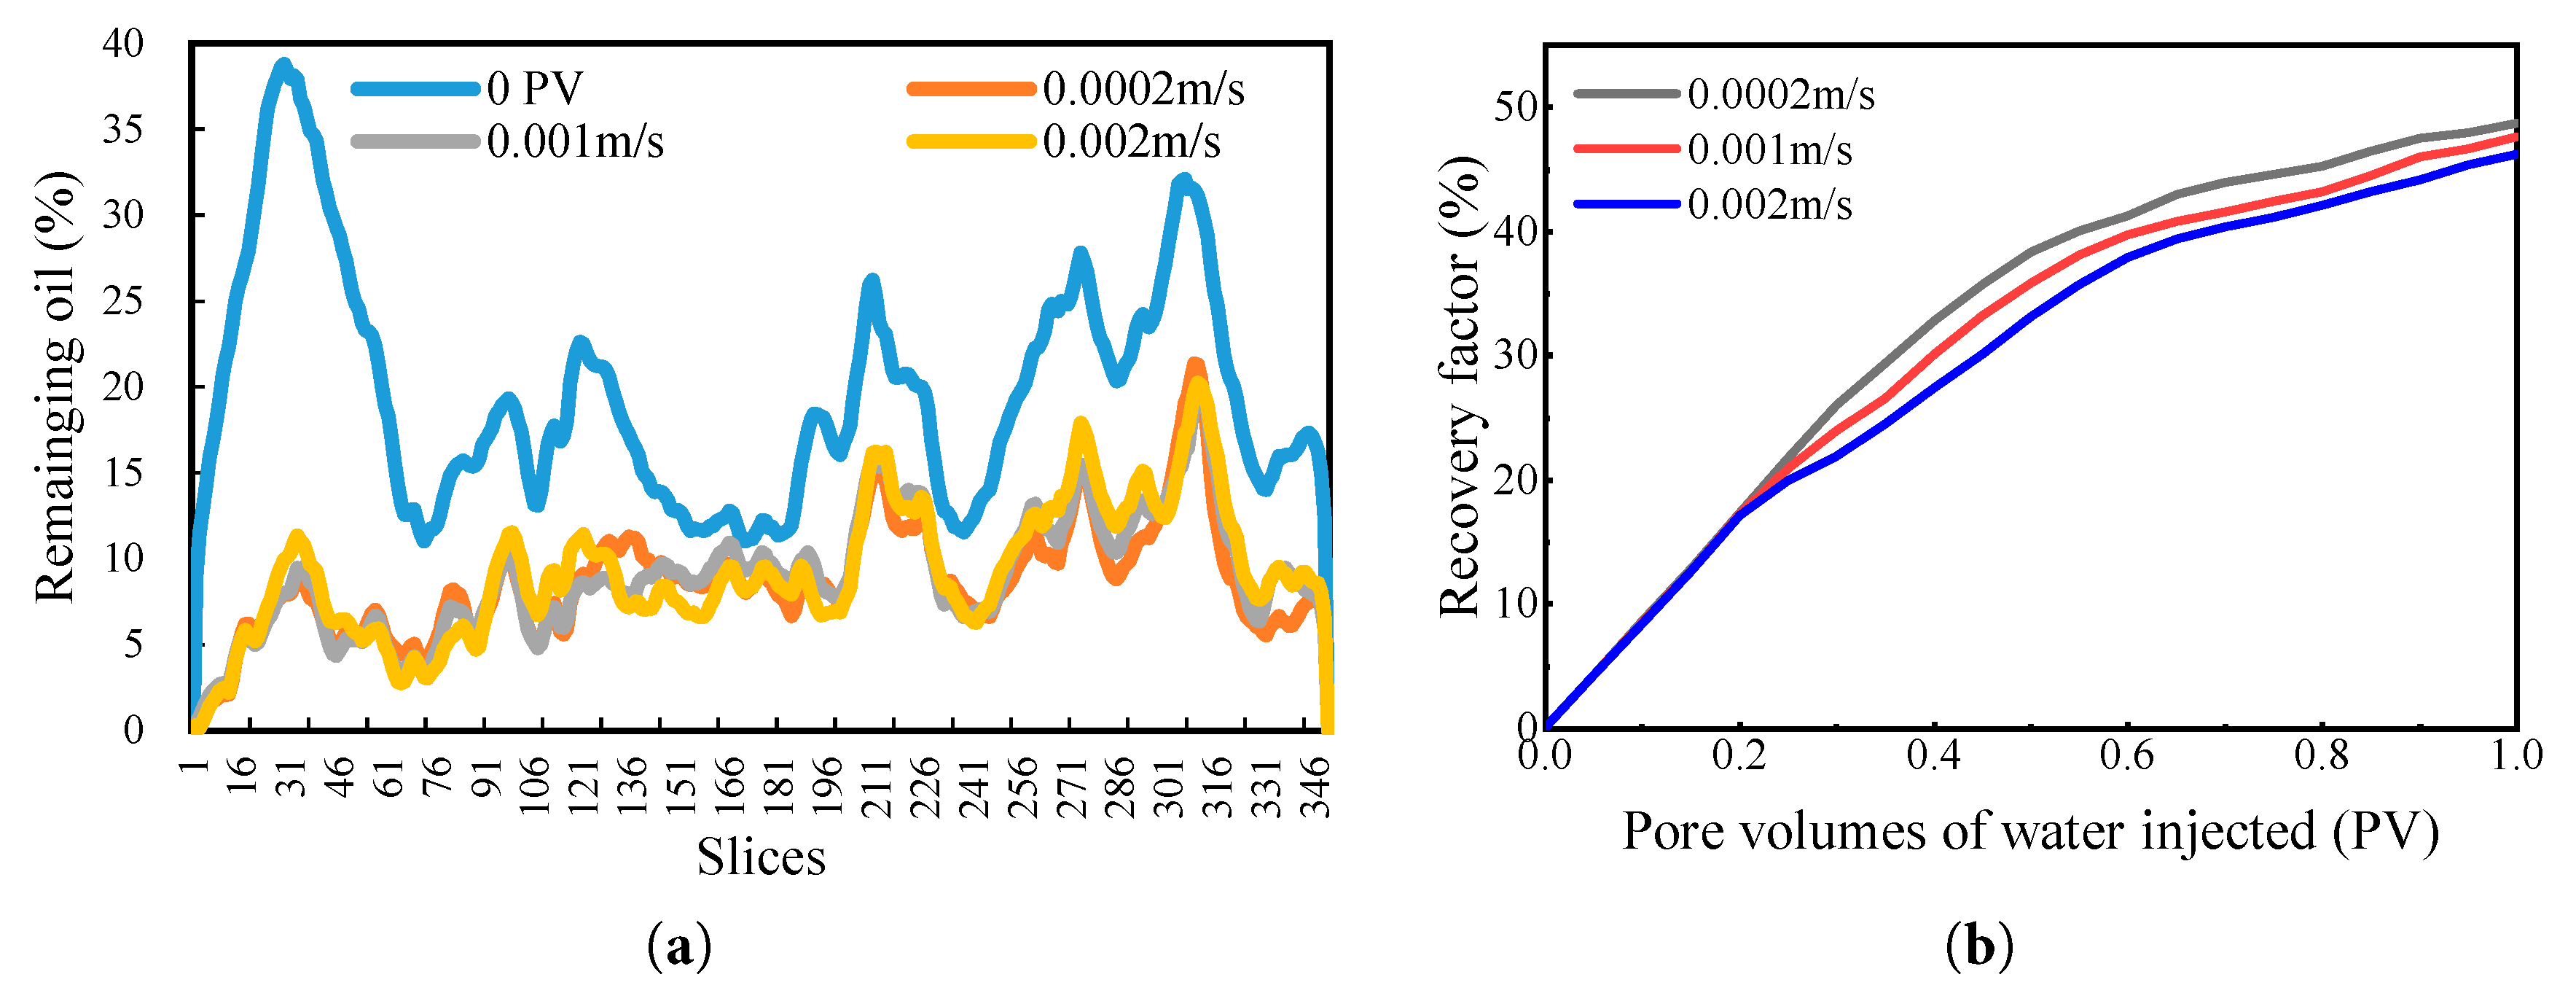
Figure 9: (a) Residual oil saturation profiles across slices; (b) Variation of recovery factor at different injection velocities.
The variations in recovery factor under different injection velocities are shown in Fig. 9b. The results indicate that the incremental recovery achieved at higher injection velocities is relatively limited. This phenomenon occurs because high injection rates readily induce viscous fingering of the injected water, which promotes subsequent flow preferentially through the previously formed dominant channels. Consequently, oil in adjacent low-permeability zones remains ineffectively displaced, leading to unswept residual oil in certain regions and reduced volumetric sweep efficiency. Although lowering the injection velocity can improve displacement efficiency and enhance oil recovery, field applications often encounter challenges such as reduced liquid production rates and insufficient well productivity, which significantly diminish economic benefits.
4.2 Effect of Oil–Water Viscosity Ratio on Displacement Efficiency
With increasing crude oil viscosity, the viscous resistance and shear stress arising from intermolecular friction become more pronounced, thereby impeding the relative movement between the two fluid phases. To further investigate the influence of oil-water viscosity ratio on recovery efficiency and residual oil distribution in low-permeability reservoirs, pore-scale two-phase flow simulations were conducted based on the model established in the previous section. The crude oil viscosity was set to μo = 3 mPa·s, and different oil-water viscosity ratios (M = 1, 3, 8) were considered, corresponding to injected water viscosities (μ) of 3 mPa·s, 1 mPa·s, and 0.375 mPa·s, respectively, while keeping other conditions unchanged. The oil–water distribution results under different viscosity ratios are shown in Fig. 10, and the corresponding variations in residual oil saturation across slices are shown in Fig. 11a. Based on the calculations and comparison with the log M–log Ca phase diagram, the region corresponding to M = 1 lies within the crossover zone, where both viscous fingering and capillary fingering coexist. As M increases, the displacement process becomes increasingly dominated by capillary fingering. Under the condition of M = 1, the displacement front remains relatively stable, with the water phase advancing uniformly toward the core center, thereby enabling most of the oil to be effectively displaced. Remaining oil decreased most rapidly at the front section of the core and gradually declined toward the middle. As the viscosity ratio increases, channeling phenomena become more pronounced, leading to extensive retention of uncontacted oil at the outlet end.
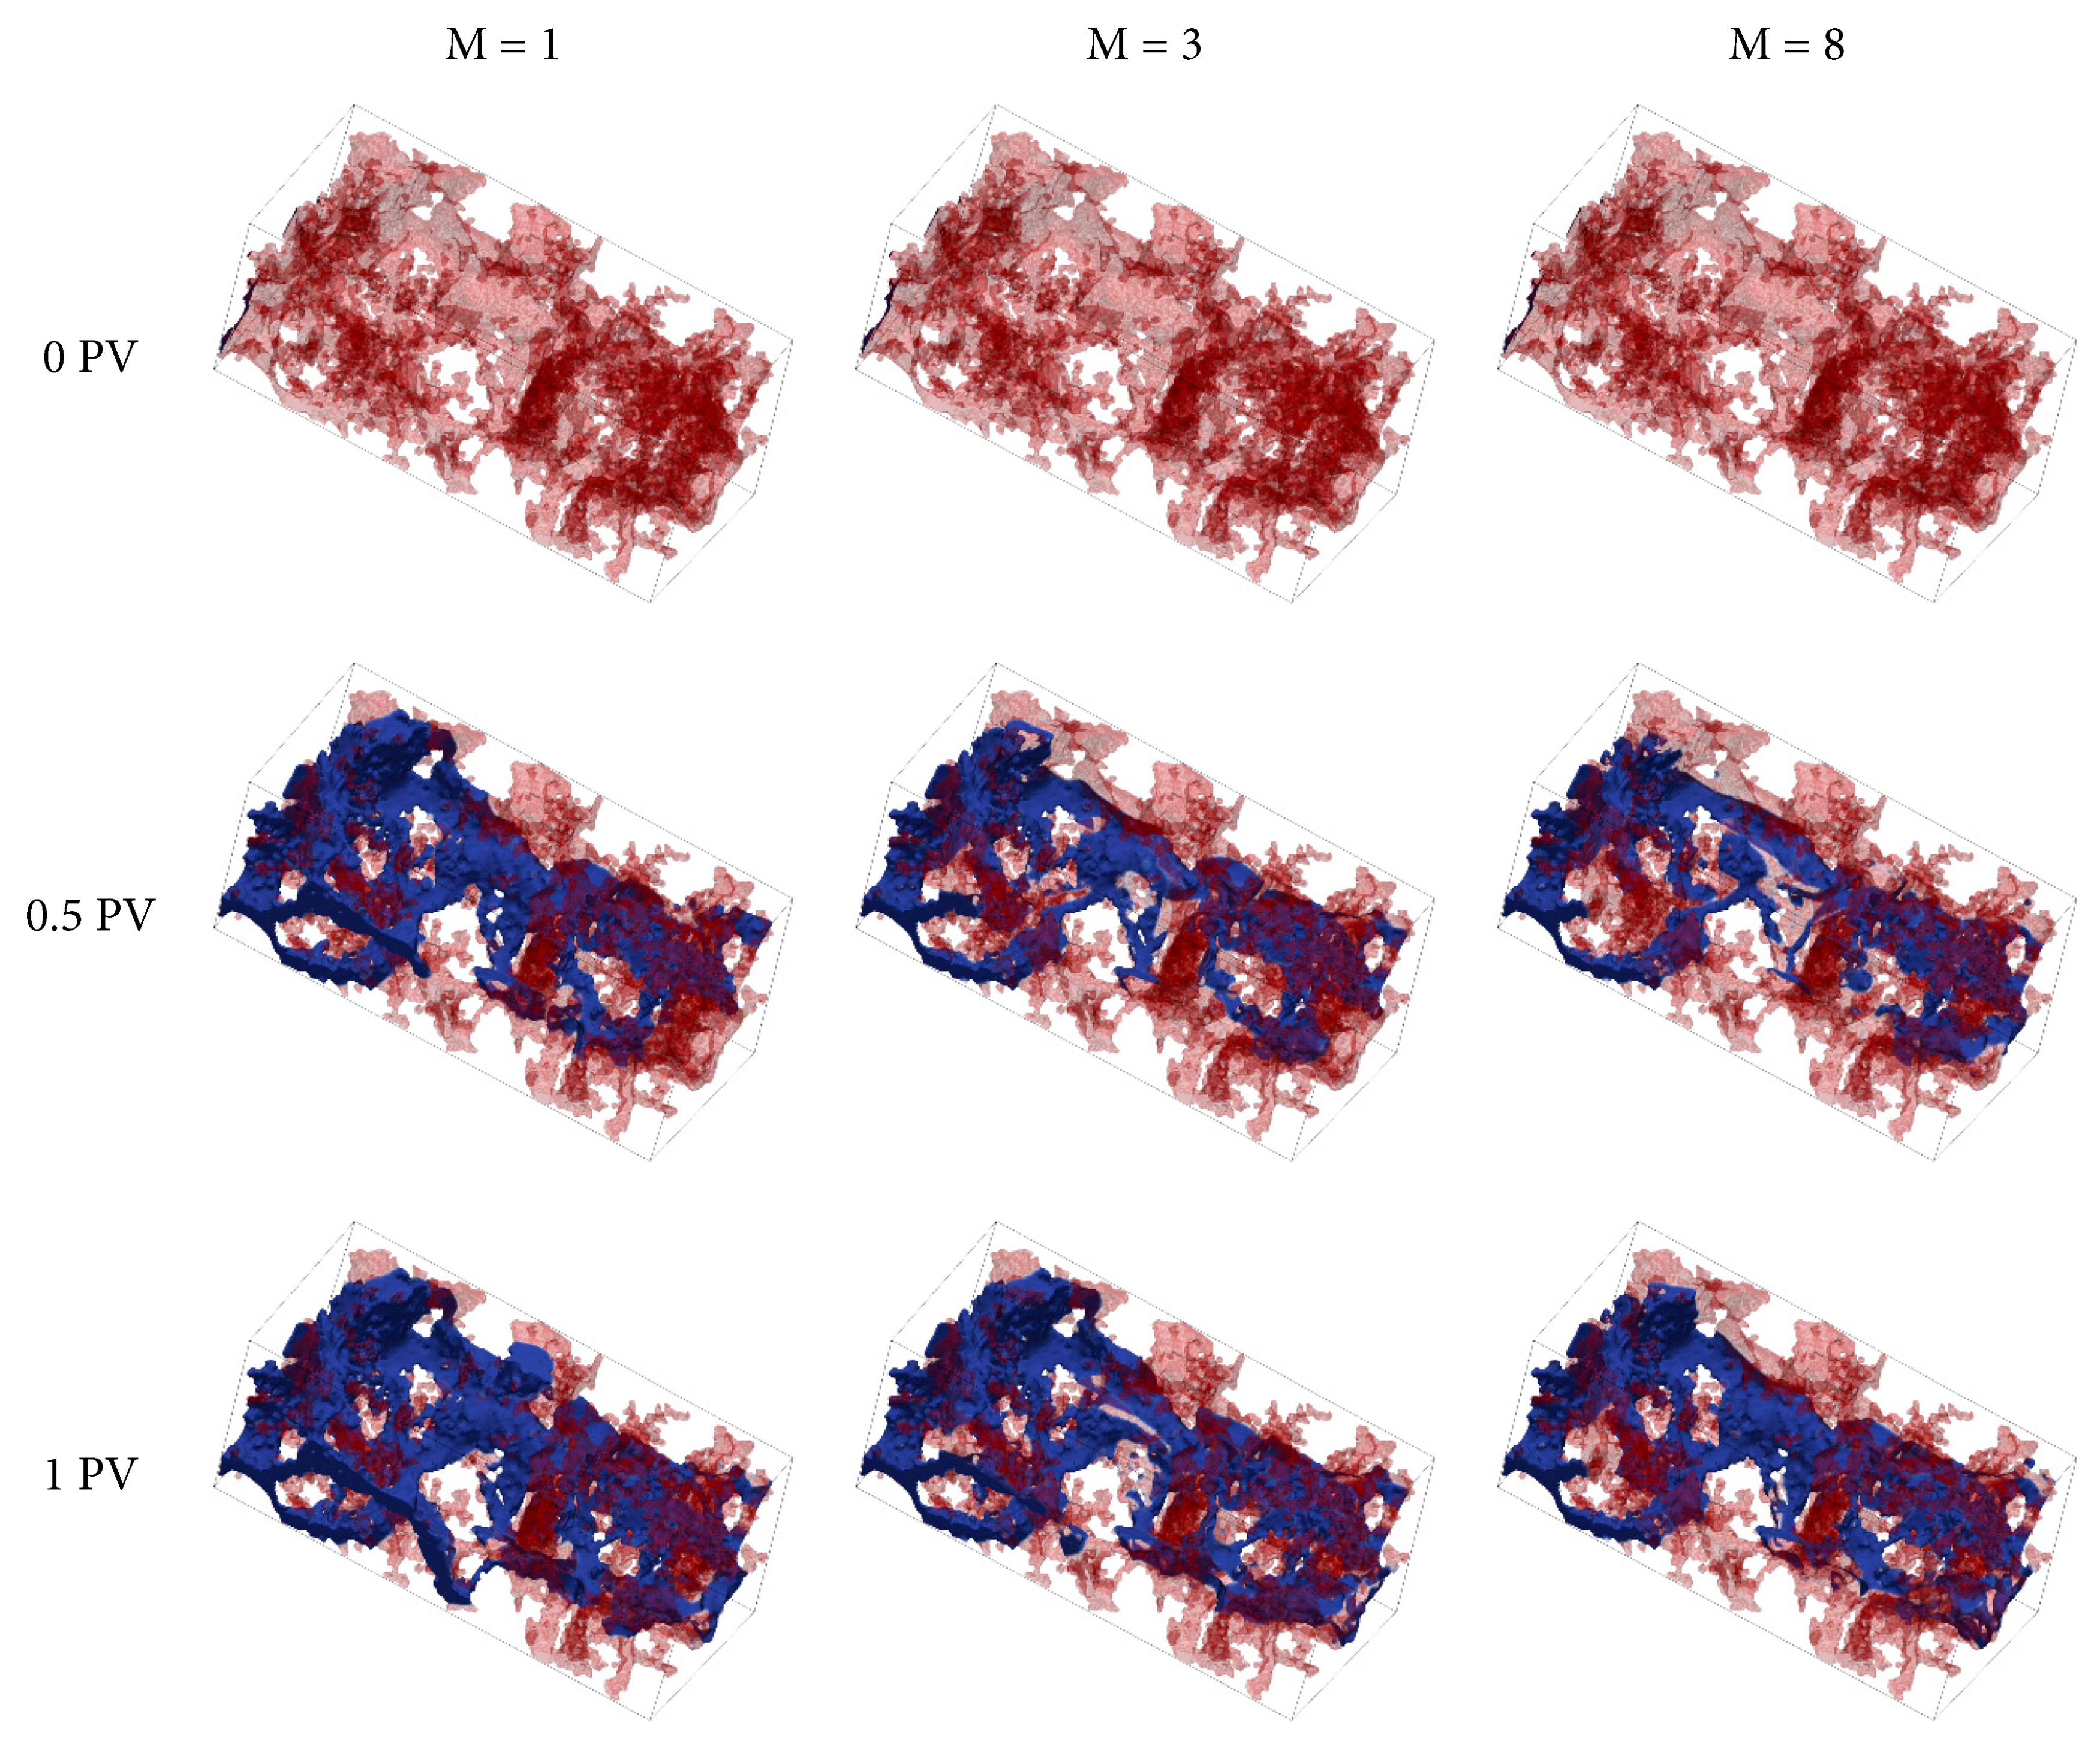
Figure 10: Oil–water phase distributions under different oil–water viscosity ratio, with water shown in blue and oil in red.
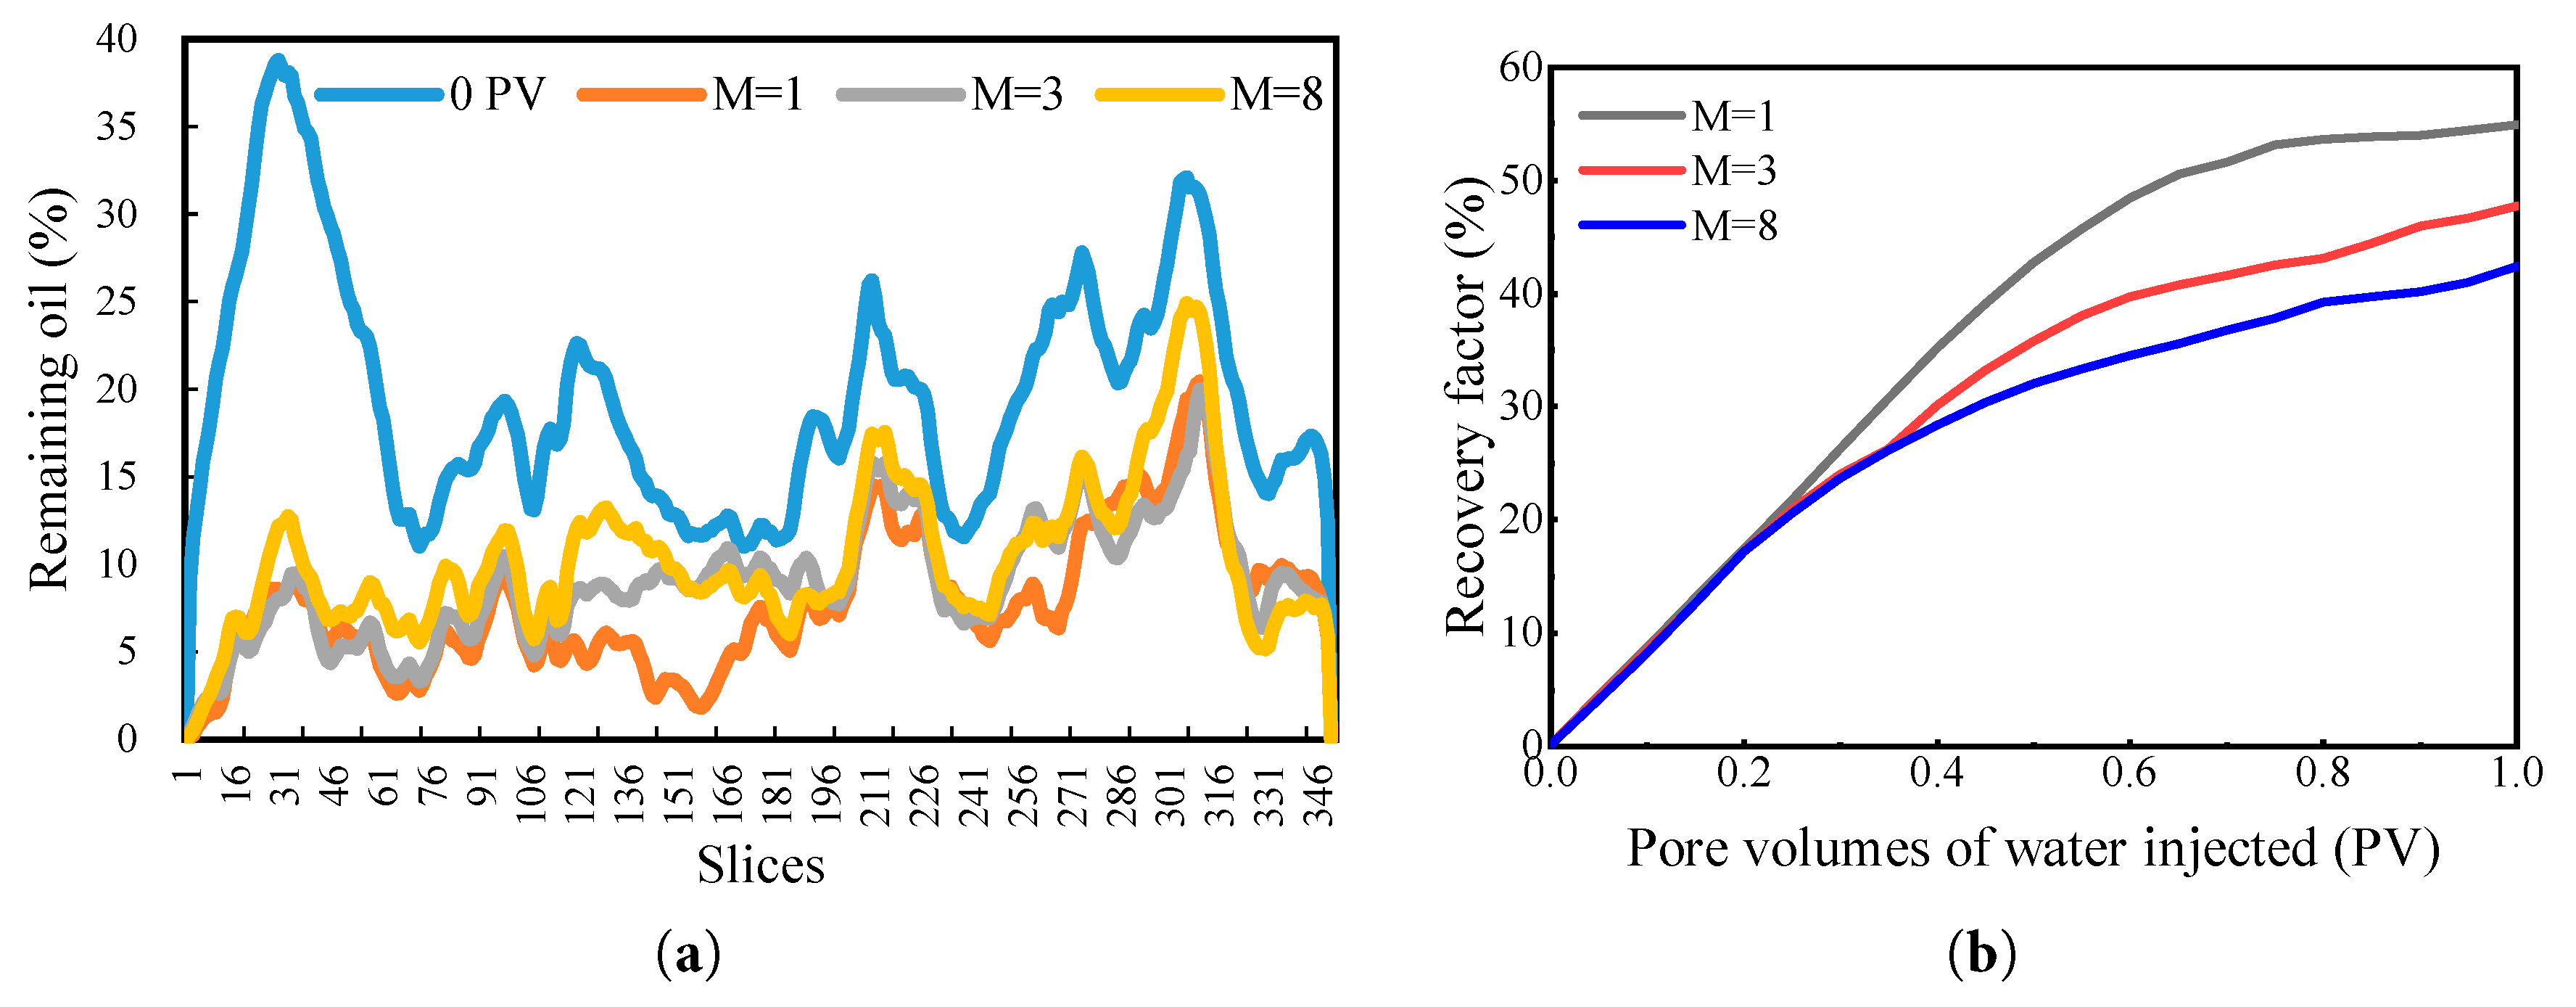
Figure 11: (a) Residual oil saturation profiles across slices; (b) Variation of recovery factor at different oil–water viscosity ratio.
The variations in recovery factor at different oil–water viscosity ratios are shown in Fig. 11b. The results indicate that as the viscosity ratio decreases, the water–oil mobility ratio is reduced, expanding the water swept volume and mitigating viscous fingering. Consequently, the slope of the recovery curve increases progressively, ultimately improving oil recovery. At M = 8, the recovery factor is the lowest, with the growth rate markedly slowing during the mid-stage due to severe instability of the displacement front and early water breakthrough through high-permeability channels. Considering the adverse effects of high oil–water viscosity ratios, mobility control can be achieved by adding polymers or other thickening agents to the injection water. Under optimized low mobility ratio conditions, microscale interfacial dynamics governed by viscous and shear forces markedly enhance the stability and uniformity of the flood front, thereby improving oil mobilization within pore spaces and significantly increasing remaining oil recovery.
4.3 Effect of Miscibility Degree and Injection Patterns on Displacement Efficiency
Based on the pore-scale two-phase flow model established in the previous section, different degrees of miscibility were characterized by varying the interfacial tension and diffusion coefficient. Under the conditions of 120°C and 30 MPa, the density and viscosity of CH4 were calculated as 144.35 kg/m3 and 2.12 × 10⁻⁵ Pa·s, respectively. Three CH4 flooding schemes were designed: partially miscible flooding, miscible flooding, and water-alternating-gas miscible flooding (i.e., injecting 0.5 PV of water followed by 0.5 PV of gas). By comparing the effects of different miscibility degree and injection patterns on recovery factor and residual oil distribution in low-permeability reservoirs, the pore-scale flow mechanisms of gas injection processes were revealed.
The oil–water (gas) distribution results under different miscibility degrees and injection patterns are shown in Fig. 12, and the variations in residual oil saturation across slices are shown in Fig. 13a. Under partially miscible flooding, the injected gas (yellow) advances preferentially through high-permeability channels, exhibiting significant fingering, and large portions of low-permeability and dead-end regions remain unswept. Under miscible flooding conditions, where the interfacial tension is reduced to zero, the dissolution and diffusion of CH4 into crude oil are enhanced, resulting in a markedly improved displacement efficiency compared with partially miscible flooding. The lighter yellow coloration indicates a broader gas distribution and a significantly expanded sweep volume. However, due to the strong heterogeneity of the reservoir, residual oil still remained in some low-permeability zones. During the water-alternating-gas flooding process, the water phase initially occupies the inlet and the high-permeability channels. Due to the Jamin effect, gas is subsequently diverted into regions that are otherwise difficult to sweep. This resulted in further mobilization of remaining oil in the front section of the core. The overall residual oil saturation reaches its minimum and exhibits the most uniform distribution, with most slice profiles concentrated in the low-saturation range. This indicates that the synergistic displacement of water and gas significantly enhances both sweep efficiency and microscopic displacement efficiency.
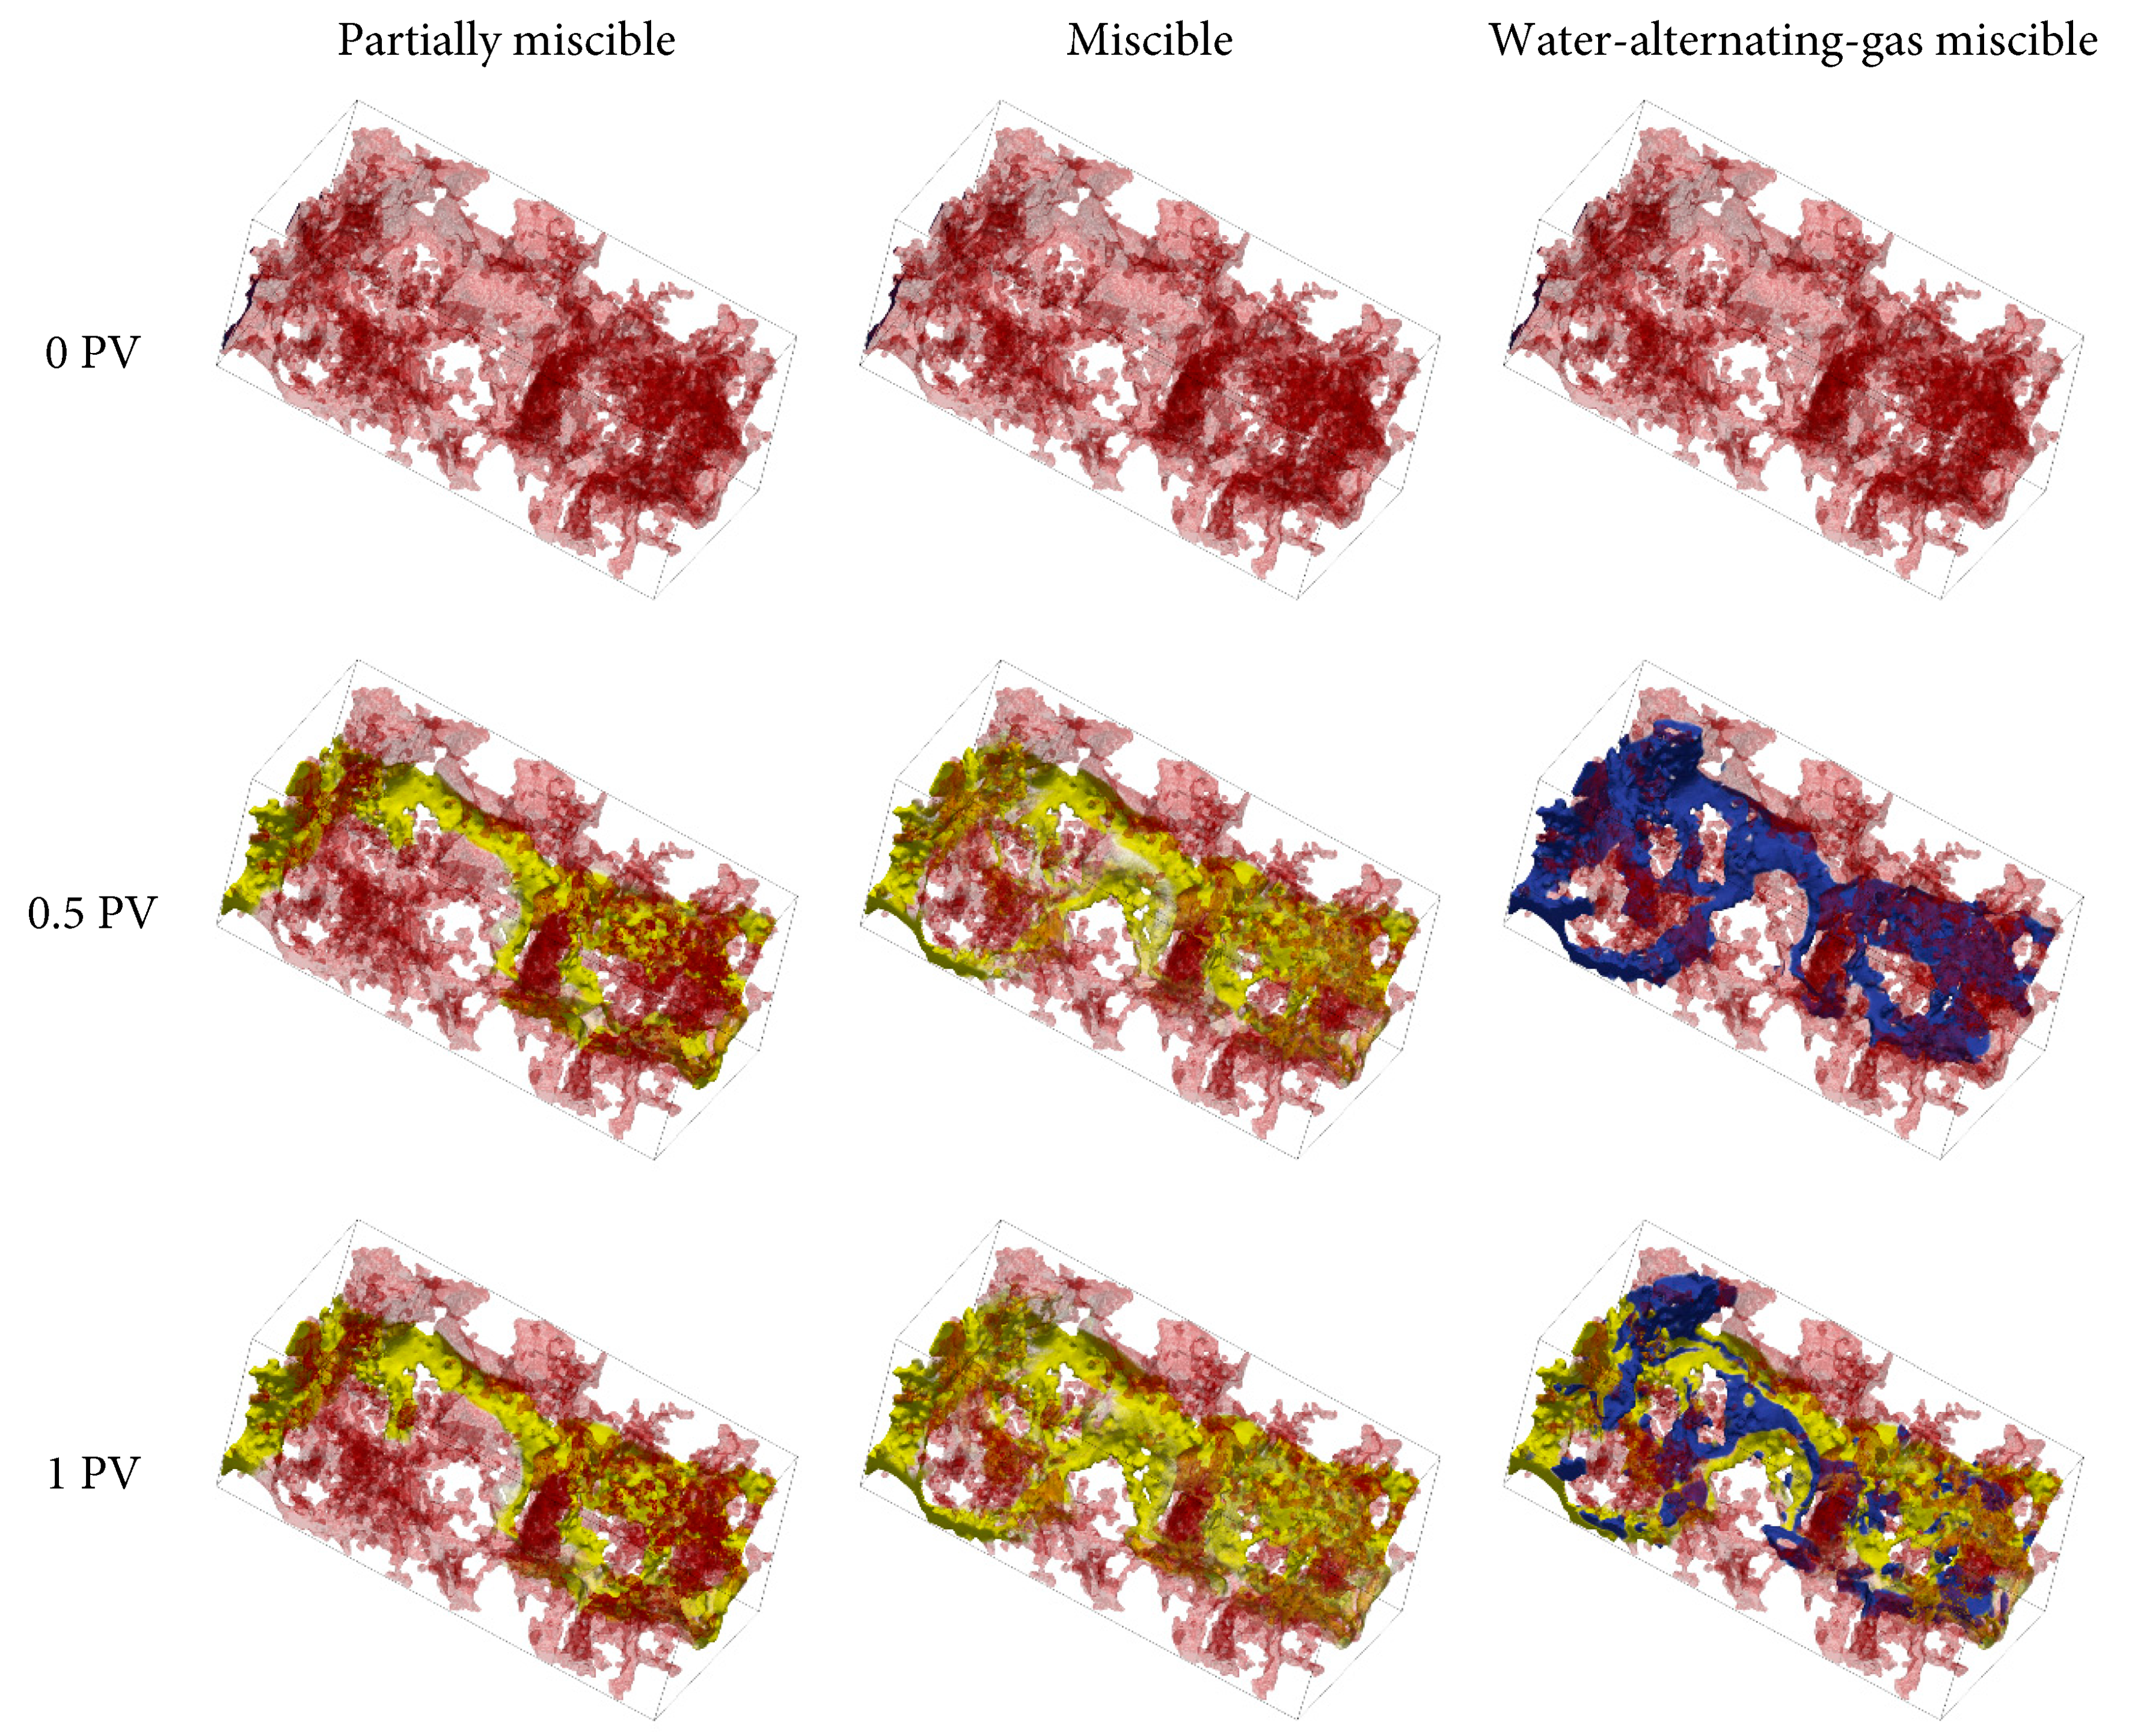
Figure 12: Oil–water (gas) phase distributions under different miscibility degrees and injection patterns, with water shown in blue and oil in red.
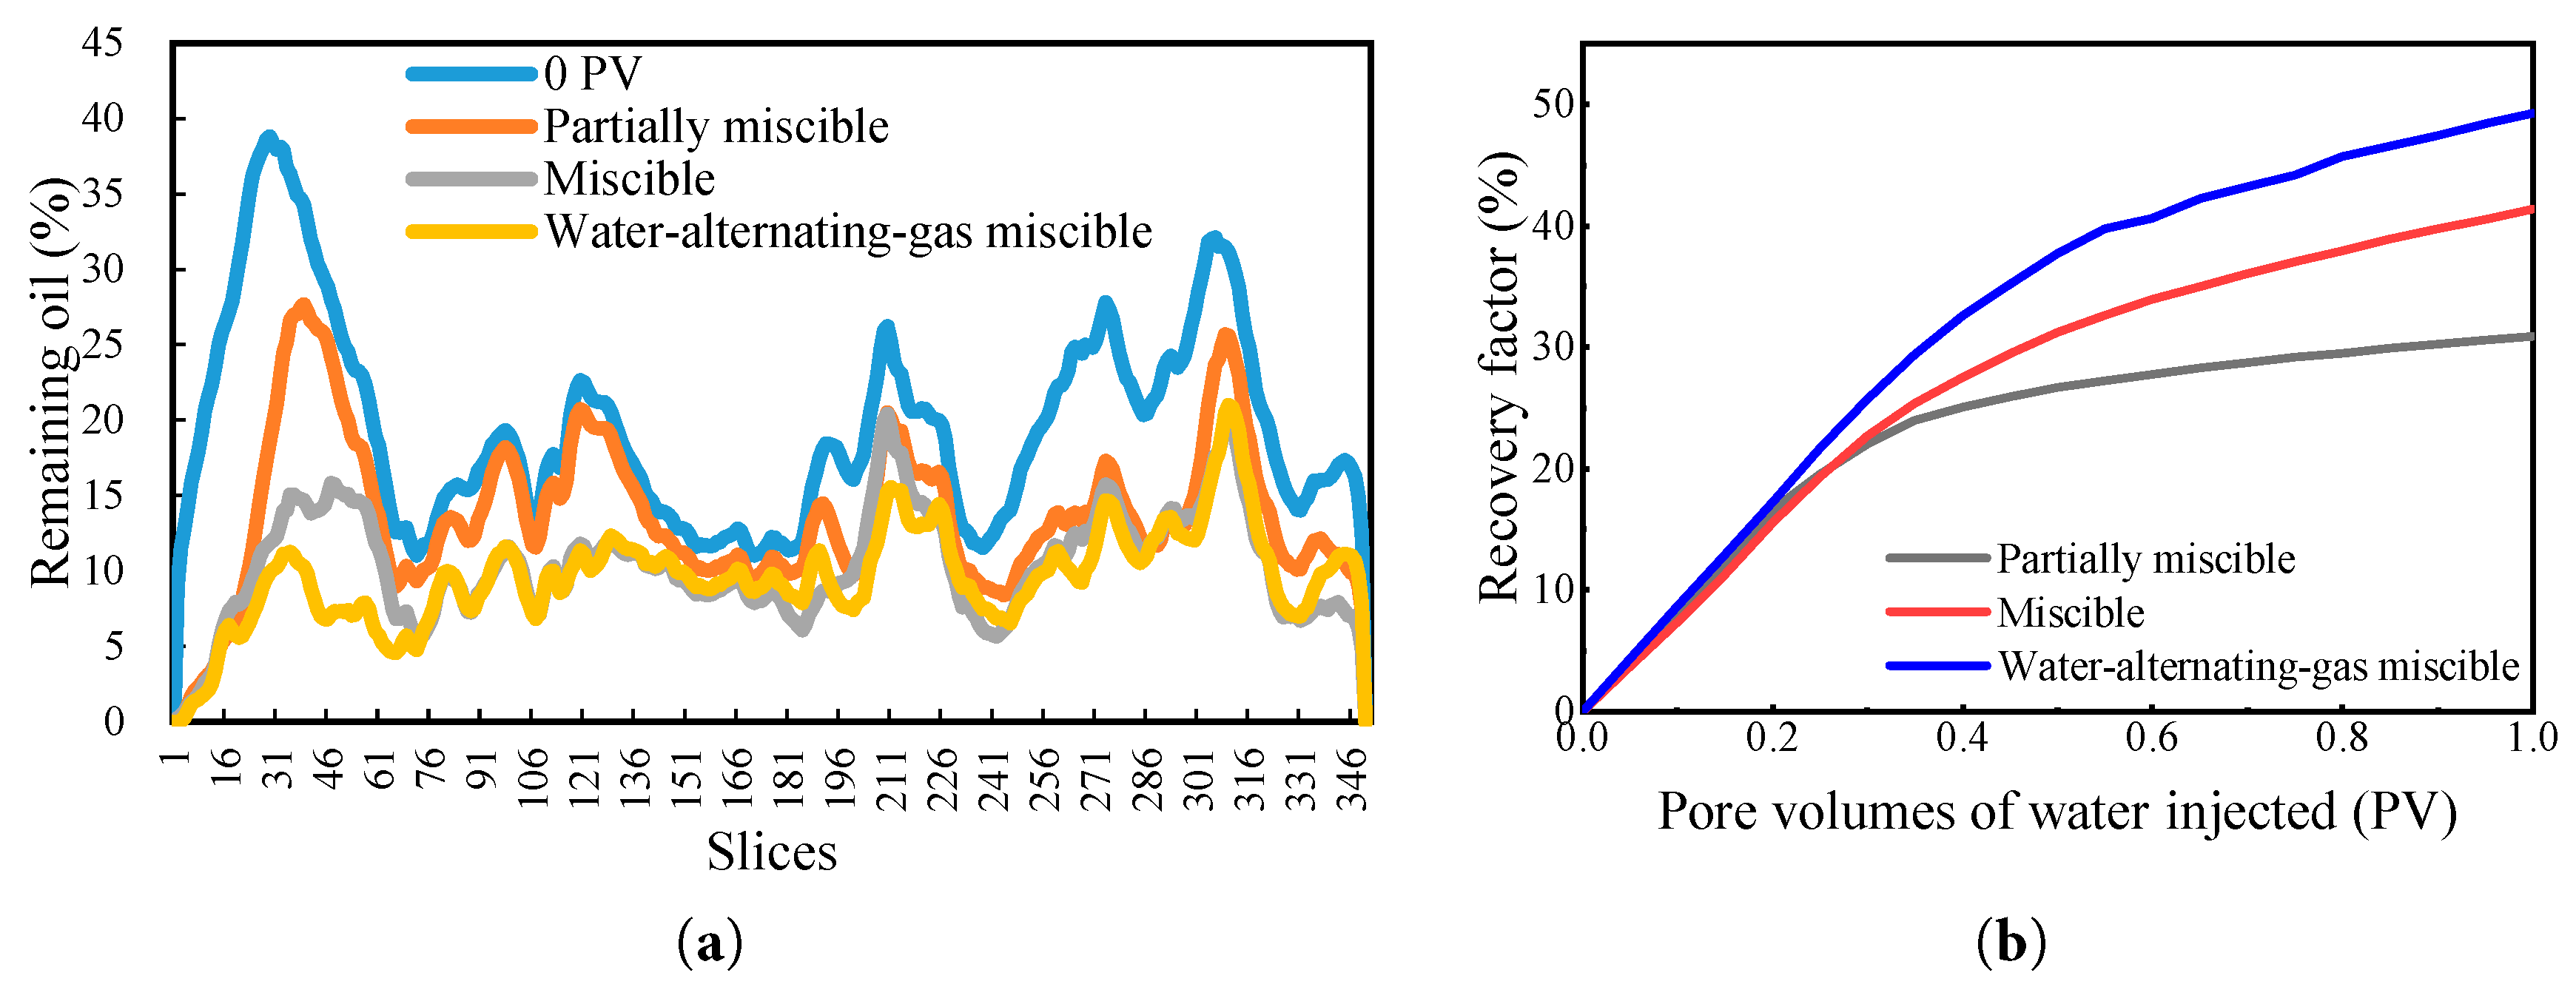
Figure 13: (a) Residual oil saturation profiles across slices; (b) Variation of recovery factor at different miscibility degrees and injection patterns.
The recovery factor under partially miscible flooding is the lowest, reaching only 30.9%. In the mid-to-late stages of development, the recovery curve slope decreases rapidly, and the residual oil distribution exhibits high peaks and large fluctuations, indicating an overall non-uniform displacement process with severe gas channeling, leaving substantial residual oil in the reservoir. Compared to water injection, the miscibility between CH4 and crude oil leads to the disappearance of the oil-gas interface, significantly enhancing the swept volume of CH4 and inhibiting CH4 breakthrough. During the transition from water flooding to gas injection, CH4 gradually dissolves in the crude oil, and the “Jia-Min effect” further contributes to improving the microscopic sweep efficiency in the transition process, achieving the optimal displacement effect with a recovery factor of 49.3%. Therefore, for areas with poor water injection development, transitioning from water flooding to gas injection presents significant application prospects.
As shown in Fig. 14, for immiscible displacement, the change in the volume sweep coefficient corresponds to the change in the recovery factor. However, the mass transfer and diffusion effects of CH4 miscibility enhance the CH4 sweep efficiency, and the highest recovery factor is achieved through the synergistic effect of gas and water. However, the water phase restricts the mass transfer miscibility, swelling, and viscosity reduction between CH4 and crude oil, resulting in a reduced CH4 sweep volume compared to miscible displacement.
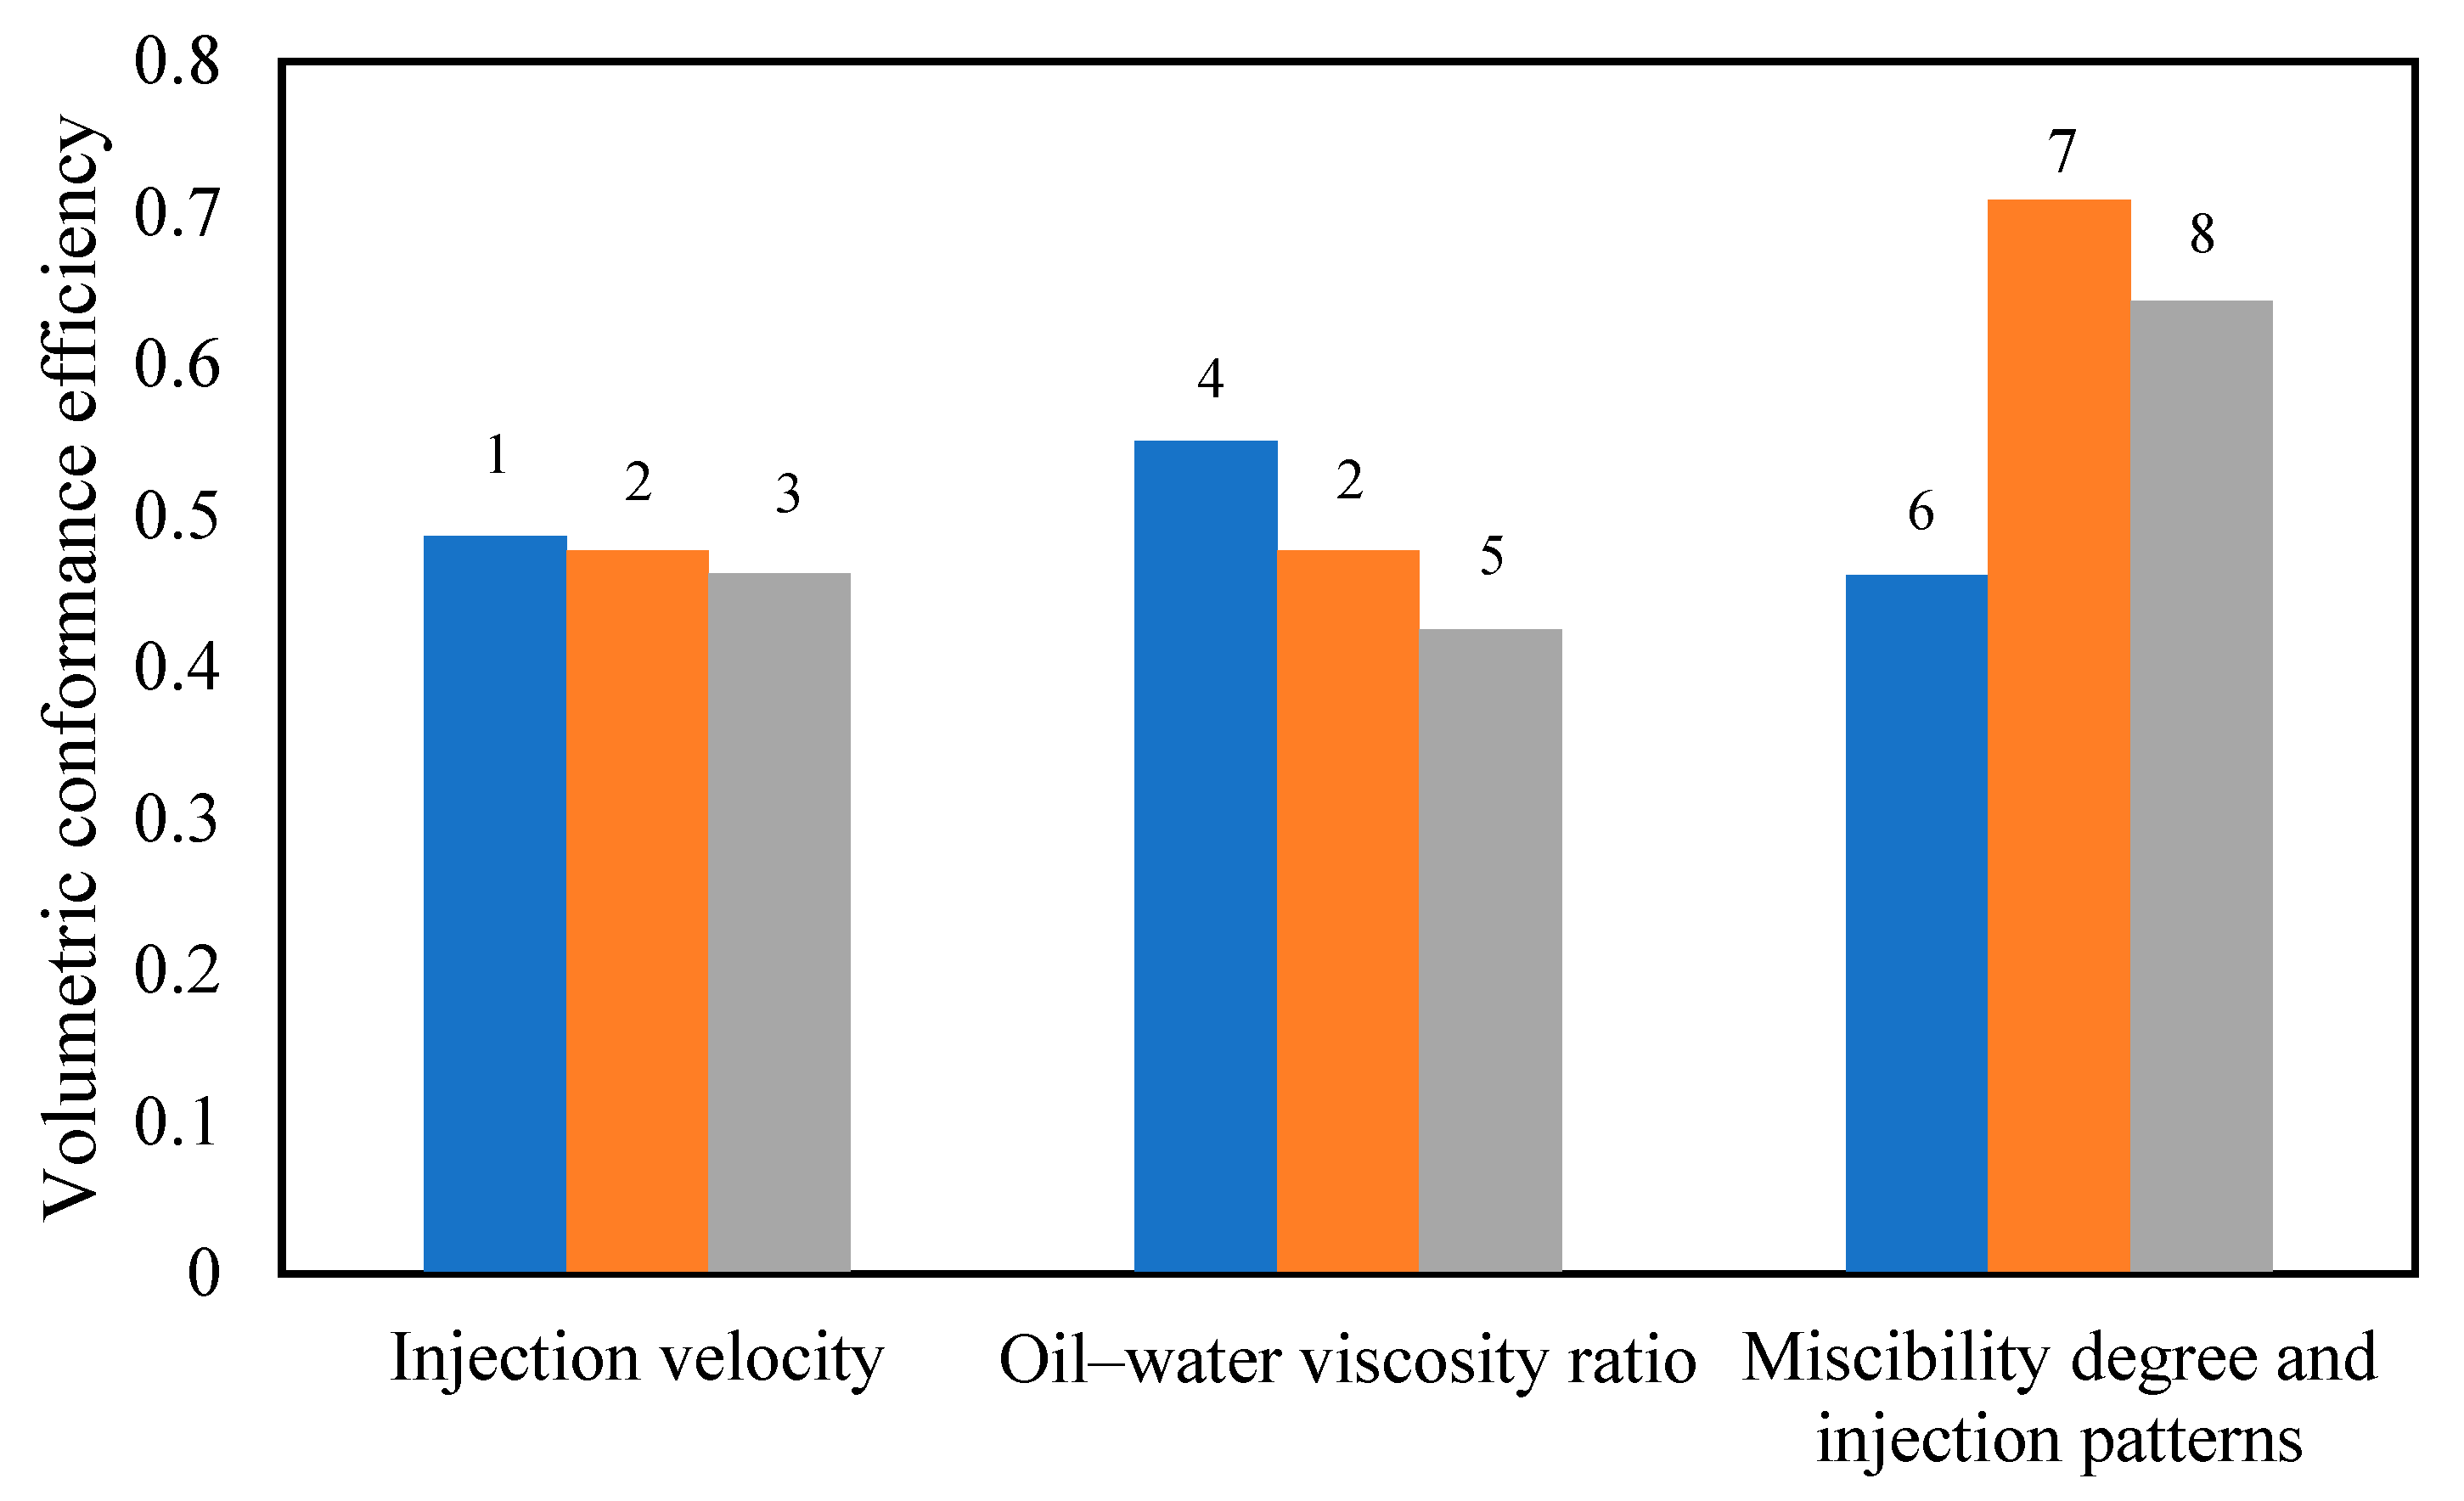
Figure 14: Volumetric conformance efficiency under 8 different schemes (corresponding to the 8 schemes described in Table 2).
This study investigated pore-scale multiphase flow simulations based on the VOF method within the OpenFOAM Finite Volume framework, using plug samples from the target reservoir. The research focused on optimizing water flooding development and identifying the most suitable development methods. The main conclusions are as follows:
- Injection velocity exerts a significant influence on fingering and channeling phenomena during the waterflooding process. Higher injection velocities promote the formation of preferential flow channels, resulting in non-uniform oil–water distributions. Conversely, lower injection velocities allow for more uniform water penetration and improved recovery. Although variations in residual oil saturation occur under different injection velocities, the overall differences remain relatively minor. A pronounced decrease in oil saturation is observed at the core inlet, while substantial residual oil remains near the outlet.
- With increasing oil–water viscosity ratio, water preferentially advances along high-permeability channels, leaving substantial residual oil in unswept regions and reducing displacement efficiency. At M = 1, the water phase advances uniformly, and residual oil is mainly concentrated in low-permeability dead-end regions. In contrast, at M = 8, the recovery factor is the lowest, owing to severe instability of the displacement front and a marked increase in residual oil, which together lead to poor displacement efficiency.
- Partially miscible flooding exhibits the lowest recovery factor, characterized by pronounced gas channeling and high residual oil peaks. Miscible flooding demonstrates better displacement efficiency; however, residual oil still remains in low-permeability regions. The recovery factor during the water-alternating-gas (WAG) flooding process reached 0.49, representing absolute increases of 18.4% and 8.0% compared with the partially miscible and miscible flooding cases (0.31 and 0.41), respectively. This process improves sweep uniformity by blocking high-permeability channels with the water phase and enabling the gas phase to displace unswept regions, thereby significantly enhancing oil recovery and microscopic displacement efficiency.
Current research primarily focuses on multiphase flow simulations at the pore scale. In the future, it should integrate both micro and macro scales to develop more accurate multiscale models. By combining key parameters at the micro scale with those at the macro scale, upscaled mathematical models can be constructed to more accurately describe the flow characteristics of reservoirs, thereby improving the prediction accuracy of oil recovery efficiency and the effectiveness of different development strategies.
Acknowledgement:
Funding Statement: This research was funded by the Research Project of CNOOC (China) Co., Ltd. Shanghai Branch, grant number 202417716474 and Research Project of CNOOC Limited, grant number KJZX-2024-0102.
Author Contributions: Conceptualization, Xianke He and Yuansheng Li; methodology, Hengjie Liao; software, Zhehao Jiang; validation, Meixue Shi; formal analysis, Zhe Hu; investigation, Yaowei Huang; resources, Keliu Wu; writing—original draft preparation, Zhe Hu; writing—review and editing, Keliu Wu. All authors reviewed and approved the final version of the manuscript.
Availability of Data and Materials: Data available on request from the authors. The data that support the findings of this study are available from the corresponding author, Keliu Wu, upon reasonable request.
Ethics Approval: Not applicable.
Conflicts of Interest: The authors declare no conflicts of interest.
References
1. Xu C , Zhang G , Huang S , Shan X , Liu T , Li J . Formation of large- and medium-sized Cretaceous volcanic reservoirs in the offshore Bohai Bay Basin, East China. Petrol Explor Dev. 2024; 51( 3): 535– 47. doi:10.1016/S1876-3804(24)60486-6. [Google Scholar] [CrossRef]
2. Hu WR , Zhang ST , Xu SY , Wang X . Practice, challenges and prospects of oil and gas field development in China. China Petrol Explor. 2024; 29( 5): 1– 11. (In Chinese). [Google Scholar]
3. Chen L , He A , Zhao J , Kang Q , Li ZY , Carmeliet J , et al. Pore-scale modeling of complex transport phenomena in porous media. Prog Energy Combust Sci. 2022; 88: 100968. doi:10.1016/j.pecs.2021.100968. [Google Scholar] [CrossRef]
4. Qin X , Wang H , Xia Y , Ling B , Wang G , Cai J . Micro- and nanoscale flow mechanisms in porous rocks based on pore-scale modeling. Capillarity. 2024; 13( 1): 24– 8. doi:10.46690/capi.2024.10.03. [Google Scholar] [CrossRef]
5. Sun Z , Liang Z , Chen HW , Li Y . Pore-scale flow simulation of high-viscosity crude oil in anisotropic pore channels. Can J Chem Eng. 2025; 103( 12): 6253– 64. doi:10.1002/cjce.25728. [Google Scholar] [CrossRef]
6. Wu XH , Deng JF , Chang HJ , Sun GY , Wang Y . Quantitative characterization of effective water flooding sweep ratio in out-of-edge water injection reservoir. Geosyst Eng. 2025: 1– 10. doi:10.1080/12269328.2025.2528664. [Google Scholar] [CrossRef]
7. Daramola GO , Jacks BS , Ajala OA , Akinoso AE . Ai applications in reservoir management: optimizing production and recovery in oil and gas fields. Comput Sci IT Res J. 2024; 5( 4): 972– 84. doi:10.51594/csitrj.v5i4.1083. [Google Scholar] [CrossRef]
8. Safaei A , Kazemzadeh Y , Riazi M . Mini review of miscible condition evaluation and experimental methods of gas miscible injection in conventional and fractured reservoirs. Energy Fuels. 2021; 35( 9): 7340– 63. doi:10.1021/acs.energyfuels.0c04384. [Google Scholar] [CrossRef]
9. Bahrami P , Sahari Moghaddam F , James LA . A review of proxy modeling highlighting applications for reservoir engineering. Energies. 2022; 15( 14): 5247. doi:10.3390/en15145247. [Google Scholar] [CrossRef]
10. Wang J , Qi X , Liu H , Yang M , Li X , Liu H , et al. Mechanisms of remaining oil formation by water flooding and enhanced oil recovery by reversing water injection in fractured-vuggy reservoirs. Petrol Explor Dev. 2022; 49( 5): 1110– 25. doi:10.1016/S1876-3804(22)60336-7. [Google Scholar] [CrossRef]
11. Leng R , Lv J , Cheng H , Wang X , Li H . Effect of front water flooding injection-production parameters on polymer flooding recovery in a conglomerate reservoir. Chem Technol Fuels Oils. 2022; 57( 6): 1030– 4. doi:10.1007/s10553-022-01340-4. [Google Scholar] [CrossRef]
12. Zhou R , Zhang D , Wei J . Experimental investigation on remaining oil distribution and recovery performances after different flooding methods. Fuel. 2022; 322: 124219. doi:10.1016/j.fuel.2022.124219. [Google Scholar] [CrossRef]
13. Li L , Zhang D , Su Y , Hao Y , Zhang X , Huang Z , et al. Investigation of oil/water two-phase flow behavior in laminated shale porous media considering heterogeneous structure and fluid-solid interaction. Phys Fluids. 2024; 36( 3): 033315. doi:10.1063/5.0192714. [Google Scholar] [CrossRef]
14. Blunt MJ . Flow in porous media—pore-network models and multiphase flow. Curr Opin Colloid Interface Sci. 2001; 6( 3): 197– 207. doi:10.1016/S1359-0294(01)00084-X. [Google Scholar] [CrossRef]
15. Joekar-Niasar V , Hassanizadeh SM . Analysis of fundamentals of two-phase flow in porous media using dynamic pore-network models: a review. Crit Rev Environ Sci Technol. 2012; 42( 18): 1895– 976. doi:10.1080/10643389.2011.574101. [Google Scholar] [CrossRef]
16. Purswani P , Johns RT , Karpyn ZT . Impact of wettability on capillary phase trapping using pore-network modeling. Adv Water Resour. 2024; 184: 104606. doi:10.1016/j.advwatres.2023.104606. [Google Scholar] [CrossRef]
17. Aidun CK , Clausen JR . Lattice-Boltzmann method for complex flows. Annu Rev Fluid Mech. 2010; 42: 439– 72. doi:10.1146/annurev-fluid-121108-145519. [Google Scholar] [CrossRef]
18. Krüger T , Kusumaatmaja H , Kuzmin A , Shardt O , Silva G , Viggen EM . The Lattice Boltzmann method: principles and practice. Berlin/Heidelberg, Germany: Springer; 2017. doi:10.1007/978-3-319-44649-3. [Google Scholar] [CrossRef]
19. Raeini AQ , Blunt MJ , Bijeljic B . Modelling two-phase flow in porous media at the pore scale using the volume-of-fluid method. J Comput Phys. 2012; 231( 17): 5653– 68. doi:10.1016/j.jcp.2012.04.011. [Google Scholar] [CrossRef]
20. Zhou Y , Guan W , Zhao C , Zou X , He Z , Zhao H . Numerical methods to simulate spontaneous imbibition in microscopic pore structures: a review. Capillarity. 2024; 11( 1): 1– 21. doi:10.46690/capi.2024.04.01. [Google Scholar] [CrossRef]
21. Wang Y , Song R , Liu J , Qin M , Zheng Z , Qin Y . Comprehensive investigation of the petrophysical and two-phase flow properties of the tight sandstone in Yanchang Formation, Ordos Basin, China: insights from computed tomography imaging and pore scale modelling. Lithosphere. 2022; 2022( Special 12): 8766247. doi:10.2113/2022/8766247. [Google Scholar] [CrossRef]
22. Jettestuen E , Helland JO , Prodanović M . A level set method for simulating capillary-controlled displacements at the pore scale with nonzero contact angles. Water Resour Res. 2013; 49( 8): 4645– 61. doi:10.1002/wrcr.20334. [Google Scholar] [CrossRef]
23. Osher S , Fedkiw RP . Level set methods: an overview and some recent results. J Comput Phys. 2001; 169( 2): 463– 502. doi:10.1006/jcph.2000.6636. [Google Scholar] [CrossRef]
24. Nimvari ME , Persoons T , Gibbons M . Pore-scale simulation of two-phase flow in biporous media. Phys Fluids. 2024; 36( 10): 107157. doi:10.1063/5.0232694. [Google Scholar] [CrossRef]
25. Frank F , Liu C , Alpak FO , Berg S , Riviere B . Direct numerical simulation of flow on pore-scale images using the phase-field method. SPE J. 2018; 23( 5): 1833– 50. doi:10.2118/182607-PA. [Google Scholar] [CrossRef]
26. Li B , Yu H , Ji D , Wang F , Lei Z , Wu H . Pore-scale imbibition patterns in layered porous media with fractures. Phys Fluids. 2024; 36: 012120. doi:10.1063/5.0182210. [Google Scholar] [CrossRef]
27. Khormali A , Ahmadi S , Aleksandrov AN . Analysis of reservoir rock permeability changes due to solid precipitation during waterflooding using artificial neural network. J Petrol Explor Prod Technol. 2025; 15( 1): 17. doi:10.1007/s13202-024-01898-1. [Google Scholar] [CrossRef]
28. Huang C , Zhang J , Lu X , Li J , Huang Y , Liu L , et al. Pore-scale simulation of water flooding using volume of fluid method. Geofluids. 2023; 2023( 1): 6479378. doi:10.1155/2023/6479378. [Google Scholar] [CrossRef]
29. Song K , Zhang Y , Wang D , Chen J , Zhang M . Pore-scale modeling of miscible CO2-SAG (soaking-alternating-gas) flooding in heterogeneous porous media. Energy Fuels. 2025; 39( 3): 1559– 69. doi:10.1021/acs.energyfuels.4c05406. [Google Scholar] [CrossRef]
30. Temam R , Chorin A . Navier stokes equations: theory and numerical analysis. J Appl Mech. 1978; 45( 2): 456. doi:10.1115/1.3424338. [Google Scholar] [CrossRef]
31. Shams M , Raeini AQ , Blunt MJ , Bijeljic B . A numerical model of two-phase flow at the micro-scale using the volume-of-fluid method. J Comput Phys. 2018; 357: 159– 82. doi:10.1016/j.jcp.2017.12.027. [Google Scholar] [CrossRef]
32. Hirt CW , Nichols BD . Volume of fluid (VOF) method for the dynamics of free boundaries. J Comput Phys. 1981; 39( 1): 201– 25. doi:10.1016/0021-9991(81)90145-5. [Google Scholar] [CrossRef]
33. Soh GY , Yeoh GH , Timchenko V . A CFD model for the coupling of multiphase, multicomponent and mass transfer physics for micro-scale simulations. Int J Heat Mass Transf. 2017; 113: 922– 34. doi:10.1016/j.ijheatmasstransfer.2017.06.001. [Google Scholar] [CrossRef]
34. Denner F , Evrard F , van Wachem B . Breaching the capillary time-step constraint using a coupled VOF method with implicit surface tension. J Comput Phys. 2022; 459: 111128. doi:10.1016/j.jcp.2022.111128. [Google Scholar] [CrossRef]
35. Issa RI , Ahmadi-Befrui B , Beshay KR , Gosman AD . Solution of the implicitly discretised reacting flow equations by operator-splitting. J Comput Phys. 1991; 93( 2): 388– 410. doi:10.1016/0021-9991(91)90191-M. [Google Scholar] [CrossRef]
36. Chen RP , Liu P , Liu XM , Wang PF , Kang X . Pore-scale model for estimating the bimodal soil–water characteristic curve and hydraulic conductivity of compacted soils with different initial densities. Eng Geol. 2019; 260: 105199. doi:10.1016/j.enggeo.2019.105199. [Google Scholar] [CrossRef]
37. Chang W , Liu P , Kang X , Chen R . Water transfer in granite residual soil: a dual-porosity SWCC model in stage-divided drying. J Geotech Geoenviron Eng. 2026; 152: 04025165. doi:10.1061/JGGEFK.GTENG-13159. [Google Scholar] [CrossRef]
38. Raeini AQ , Bijeljic B , Blunt MJ . Numerical modelling of sub-pore scale events in two-phase flow through porous media. Transp Porous Medium. 2014; 101( 2): 191– 213. doi:10.1007/s11242-013-0239-6. [Google Scholar] [CrossRef]
39. Deshpande SS , Anumolu L , Trujillo MF . Evaluating the performance of the two-phase flow solver interFoam. Comput Sci Discov. 2013; 5( 1): 014016. doi:10.1088/1749-4699/5/1/014016. [Google Scholar] [CrossRef]
40. Wu K , Zhu Q , Chen Z , Li J , Feng D , Wang M , et al. Microscopic gas displacement efficiency of enhanced gas recovery in carbonate gas reservoirs with edge and bottom water. Nat Gas Ind B. 2023; 10( 4): 372– 82. doi:10.1016/j.ngib.2023.07.006. [Google Scholar] [CrossRef]
41. Kwok DY , Neumann AW . Contact angle measurement and contact angle interpretation. Adv Colloid Interface Sci. 1999; 81( 3): 167– 249. doi:10.1016/S0001-8686(98)00087-6. [Google Scholar] [CrossRef]
42. Liu H , Valocchi AJ , Werth C , Kang Q , Oostrom M . Pore-scale simulation of liquid CO2 displacement of water using a two-phase lattice Boltzmann model. Adv Water Resour. 2014; 73: 144– 58. doi:10.1016/j.advwatres.2014.07.010. [Google Scholar] [CrossRef]
43. Singh K , Jung M , Brinkmann M , Seemann R . Capillary-dominated fluid displacement in porous media. Annu Rev Fluid Mech. 2019; 51: 429– 49. doi:10.1146/annurev-fluid-010518-040342. [Google Scholar] [CrossRef]
44. Liu H , Zhang Y , Valocchi AJ . Lattice Boltzmann simulation of immiscible fluid displacement in porous media: homogeneous versus heterogeneous pore network. Phys Fluids. 2015; 27( 5): 052103. doi:10.1063/1.4921611. [Google Scholar] [CrossRef]
Cite This Article
 Copyright © 2026 The Author(s). Published by Tech Science Press.
This work is licensed under a Creative Commons Attribution 4.0 International License , which permits unrestricted use, distribution, and reproduction in any medium, provided the original work is properly cited.
 Downloads
 Citation Tools