
 Submit a Paper
 Propose a Special lssue
 Open Access
ARTICLE
Low-Reynolds-Number Performance of Micro Radial-Flow Turbines at High Altitudes
1 College of Mechanical and Electrical Engineering, Taizhou University, Taizhou, China
2 Pipe China West Pipeline Company, Urumqi, China
3 School of Mechanical Engineering, Xijing University, Xi’an, China
4 School of Chemical Engineering, Xinjiang University, Urumqi, China
5 College of Clean Energy and Electrical Engineering, Xizang Agricultural and Animal Husbandry University, Linzhi, China
* Corresponding Author: Haifeng Zhai. Email:
Fluid Dynamics & Materials Processing 2026, 22(1), 4 https://doi.org/10.32604/fdmp.2026.075227
Received 27 October 2025; Accepted 26 January 2026; Issue published 06 February 2026
 View Full Text
 Download PDF
Abstract
The low-pressure and low-density conditions encountered at high altitudes significantly reduce the operating Reynolds number of micro radial-flow turbines, frequently bringing it below the self-similarity critical threshold of 3.5 × 10⁴. This departure undermines the applicability of conventional similarity-based design approaches. In this study, micro radial-flow turbines with rotor diameters below 50 mm are investigated through a combined approach integrating high-fidelity numerical simulations with experimental validation, aiming to elucidate the mechanisms by which low Reynolds numbers influence aerodynamic and thermodynamic performance. The results demonstrate that decreasing Reynolds number leads to boundary-layer thickening on blade surfaces, enhanced flow separation on the suction side, and increased secondary-flow losses within the blade passages. These effects jointly produce a pronounced and non-linear deterioration of turbine efficiency. Geometric scaling analysis further indicates that efficiency losses intensify with decreasing turbine size, and become particularly severe at low rotational speeds and high expansion ratios. Detailed flow-field analyses reveal a direct link between the degradation of blade loading distribution and the amplification of transverse pressure gradients under low-Reynolds-number conditions, providing physical insight into the observed performance decline.Keywords
High-altitude and cold regions—such as the Qinghai–Tibet Plateau and the Arctic Circle—constitute some of the most extreme natural environments on Earth. These areas typically exceed 4000 m in elevation, where atmospheric pressure falls to only 40–60% of sea-level conditions and winter temperatures can remain below −40°C for prolonged periods [1,2]. As the primary power-producing component in micro gas turbines (MGTs), the micro radial-flow turbine plays a decisive role in determining the overall system performance under high-altitude operating conditions [3,4]. Owing to its ability to achieve high expansion ratios within a single stage and to maintain considerable efficiency even at low flow rates, the micro radial-flow turbine has garnered increasing interest for applications in aerospace propulsion, waste heat recovery, and distributed energy systems [5]. However, when deployed in low-pressure environments, the internal flow behavior of such turbines diverges markedly from design expectations developed under standard sea-level conditions. The fundamental physical origin of this deviation lies in the drastic reduction of the Reynolds number [6]. On one hand, to achieve higher power density and system compactness, the characteristic dimensions of micro turbines—typically with rotor diameters below 50 mm—have been greatly reduced; on the other, low ambient pressure inherently increases the relative aerodynamic viscosity of air [7,8]. The coupled effects of geometric miniaturization and reduced ambient pressure jointly cause the internal flow Reynolds number to fall well below the self-similarity critical threshold observed in conventional turbines (≈3.5 × 10⁴) [9].
Once the flow falls within this low-Reynolds-number regime, viscous effects become dominant, fundamentally altering the nature of the flow. Traditional design theories grounded in high-Reynolds-number assumptions and ideal similarity principles become increasingly unreliable under these conditions [10]. This manifests as boundary-layer thickening along the blade surface, enhanced flow separation, and amplified viscous dissipation mechanisms—such as secondary flow and end-wall losses—culminating in a pronounced nonlinear deterioration of turbine aerodynamic performance [11,12]. Early investigations, such as that by Cartwright et al. [13], employed a three-dimensional streamline-curvature method to reveal the inherent complexity of internal flow structures in a radial-flow turbine and to highlight the nonlinear performance variations occurring under low-Reynolds-number conditions. Subsequent research reinforced these findings. Wagner et al. [14], in developing a 35 W-class micro gas turbine, observed that geometric miniaturization rendered turbine efficiency highly sensitive to diverse flow losses, with low-Reynolds-number conditions markedly intensifying boundary-layer separation and secondary-flow phenomena. In recent years, the rapid development of miniaturized power systems—such as micro gas turbines and unmanned aerial vehicle (UAV) propulsion units—has driven continued advancements in understanding the aerodynamic behavior of turbines and turbomachinery under low-Reynolds-number conditions. In their experimental investigation of airfoil boundary-layer transition at low Reynolds numbers (Re = 7 × 10⁴), Toppings and Yarusevych [15] demonstrated that under conditions of strong, large-scale free-stream turbulence, the transition point fluctuates significantly and can induce intermittent large-scale flow separation—analogous to the separation phenomena occurring on turbine blade suction surfaces in high-altitude, low-Reynolds-number environments. Likewise, Li et al. [16], in their investigation of vortex pumps operating as turbines in viscous media, observed that when the impeller Reynolds number fell below 104, hydraulic, volumetric, and mechanical losses increased substantially, causing a steep decline in efficiency—thereby confirming the nonlinear influence of multiple loss mechanisms under low-Reynolds-number conditions. Further underscoring the design challenges in specific applications, Wu et al. [17] performed optimum design and simulation of a radial-inflow turbine for geothermal power generation, highlighting the performance sensitivities in non-standard environments. Similarly, Fu et al. [18] experimentally validated an integrated optimization design methodology for a radial turbine within a micro gas turbine system, reinforcing the importance of holistic design approaches under constrained operating conditions. Numerical analysis by Yang et al. [19] revealed that decreasing Reynolds numbers lead to extensive flow separation along the blade suction surface, with markedly intensified secondary-flow and radial-mixing effects, thereby deteriorating overall turbine performance. Collectively, these studies highlight that within the low-Reynolds-number regime, the intricate coupling among flow separation, transition, and loss mechanisms represents a fundamental challenge to enhancing the performance of micro-scale turbomachinery.
Although existing studies have provided preliminary insights into the detrimental influence of low Reynolds numbers on micro radial-flow turbine performance, significant limitations remain in the current body of research. Most existing works have concentrated on performance evaluation at specific operating points or on flow visualization of individual components, without developing a unified theoretical framework to elucidate the intricate coupling among three-dimensional unsteady flow structures, geometric scaling effects, and viscous dissipation mechanisms characteristic of low-Reynolds-number regimes. In particular, systematic investigations—from fundamental flow physics to design methodologies—remain scarce for extreme application scenarios such as high-altitude and low-temperature environments.
However, a systematic investigation that integrates high-fidelity three-dimensional flow analysis with experimental validation under realistic high-altitude, low-Reynolds-number conditions remains scarce. In particular, the coupled effects of geometric scaling, rotational speed, and viscous loss mechanisms in micro radial turbines (rotor diameter < 50 mm) have not been fully quantified. To enable the reliable deployment of micro gas turbine technology in high-altitude and cold environments, it is imperative to transcend the theoretical constraints imposed by conventional similarity principles. This study, set against the engineering background of micro gas turbines designed for high-altitude and low-temperature applications, focuses on micro radial-flow turbine with rotor diameters below 60 mm, with the aim of elucidating the aerodynamic performance evolution and intrinsic physical mechanisms under low-Reynolds-number conditions. A combined methodology integrating high-fidelity numerical simulations with independently developed multi-physics coupled full-speed experimental validation (target rotational speed: 160,000 rpm) is employed to uncover the three-dimensional viscous flow structures, unsteady behaviors, and the generation and evolution mechanisms of energy losses within the turbine under low-Reynolds-number conditions. The outcomes of this work are expected to establish a robust scientific foundation and data-driven basis for developing high-efficiency micro turbine design theories and methodologies tailored to extreme operating environments.
2 Experimental Setup and Test Methodology
To accurately capture the aerodynamic performance of the micro radial-flow turbine with a rotor diameter of 57.8 mm operating under low Reynolds number conditions, a dedicated experimental test rig was developed in this study (Fig. 1). The rig features two independent gas circuits: a turbine circuit supplied with high-temperature, high-pressure gas, and a separate compressor circuit using ambient air. The central component is a millimeter-scale radial-flow turbine coupled coaxially with a radial compressor, which serves as an aerodynamic brake (load) to absorb the turbine’s output power. The rotor assembly is supported by an oil-film bearing system to ensure dynamic stability during high-speed operation. Performance mapping across various operating conditions was achieved by precisely and independently controlling the turbine inlet gas pressure and the compressor outlet back pressure, thereby regulating the rotational speed of the rotor system and the load on the turbine.
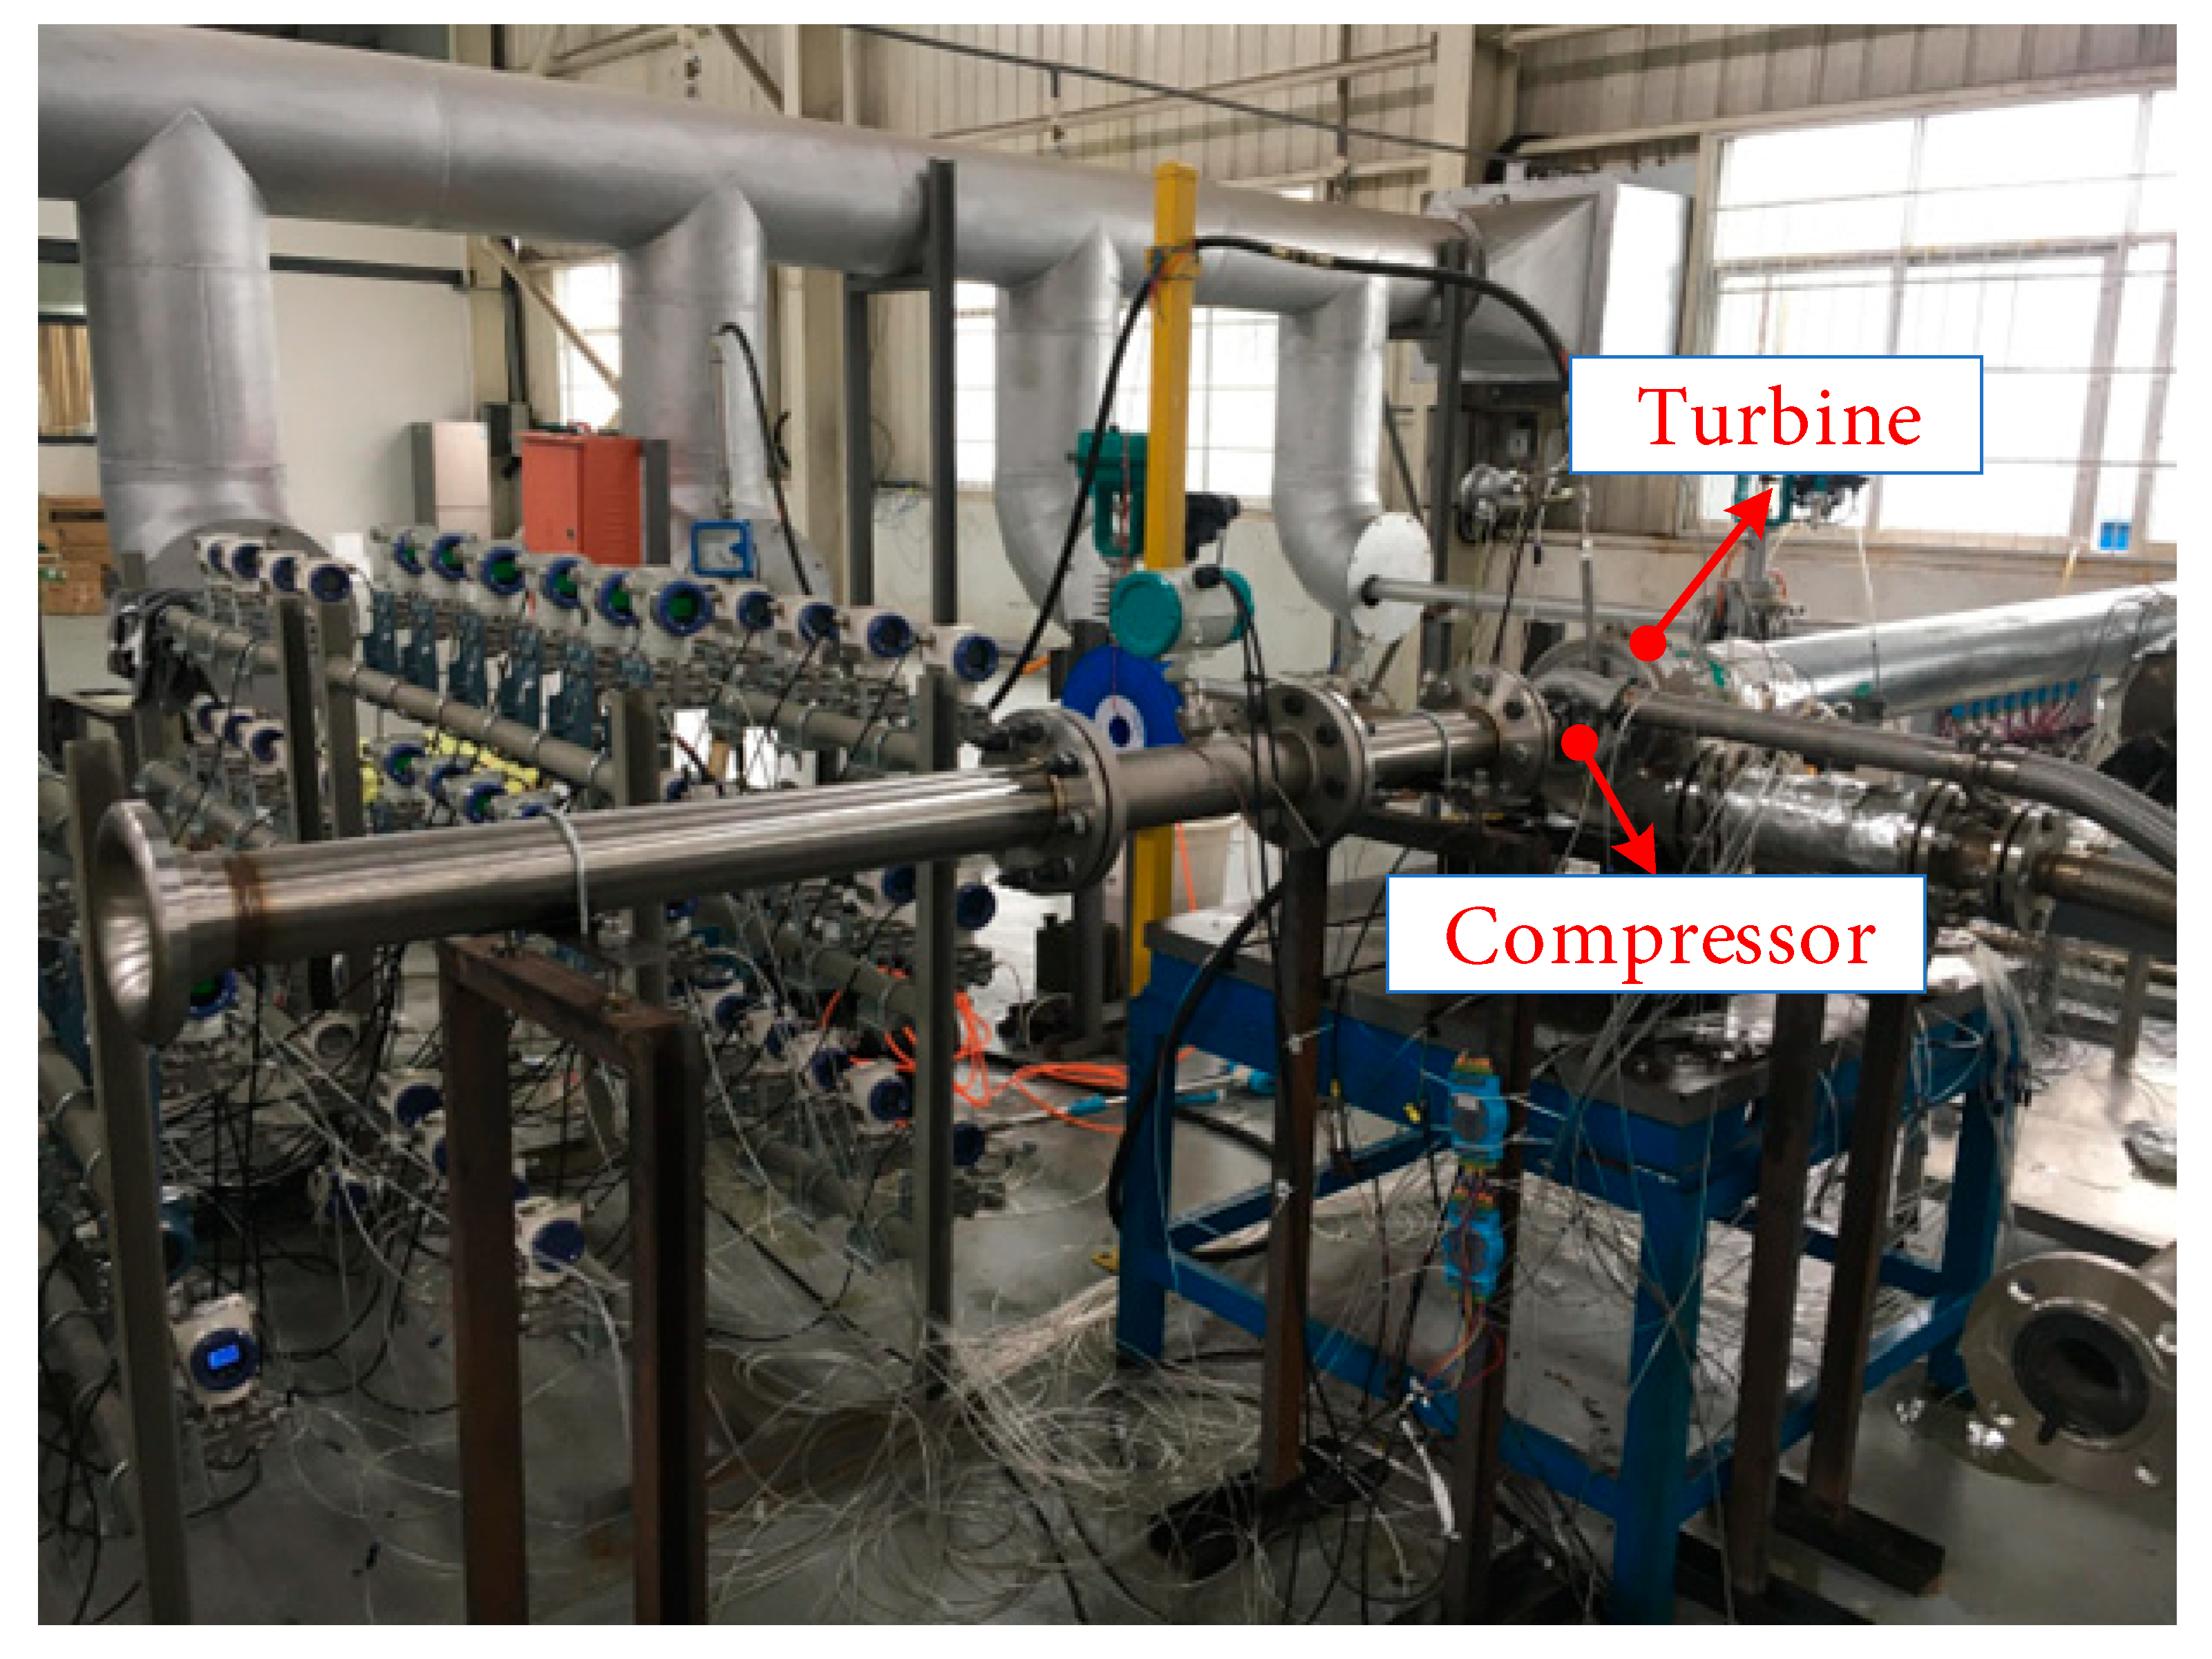
Figure 1: Testing rig for the RIT.
The overall structural arrangement of the test rig is presented as an exploded view in Fig. 2. The rig is sequentially assembled from key components: the compressor volute, compressor impeller, rotor core integrated with the lubrication and cooling system, turbine volute, and turbine impeller. The turbine impeller is precision-machined from a nickel-based superalloy via micro-milling, with blade chords on the millimeter scale, embodying the characteristic flow features associated with low Reynolds numbers. All components were meticulously verified using laser metrology, maintaining cumulative assembly tolerances within ±5 μm, thus ensuring a high degree of geometric fidelity between the experimental setup and the corresponding numerical models.
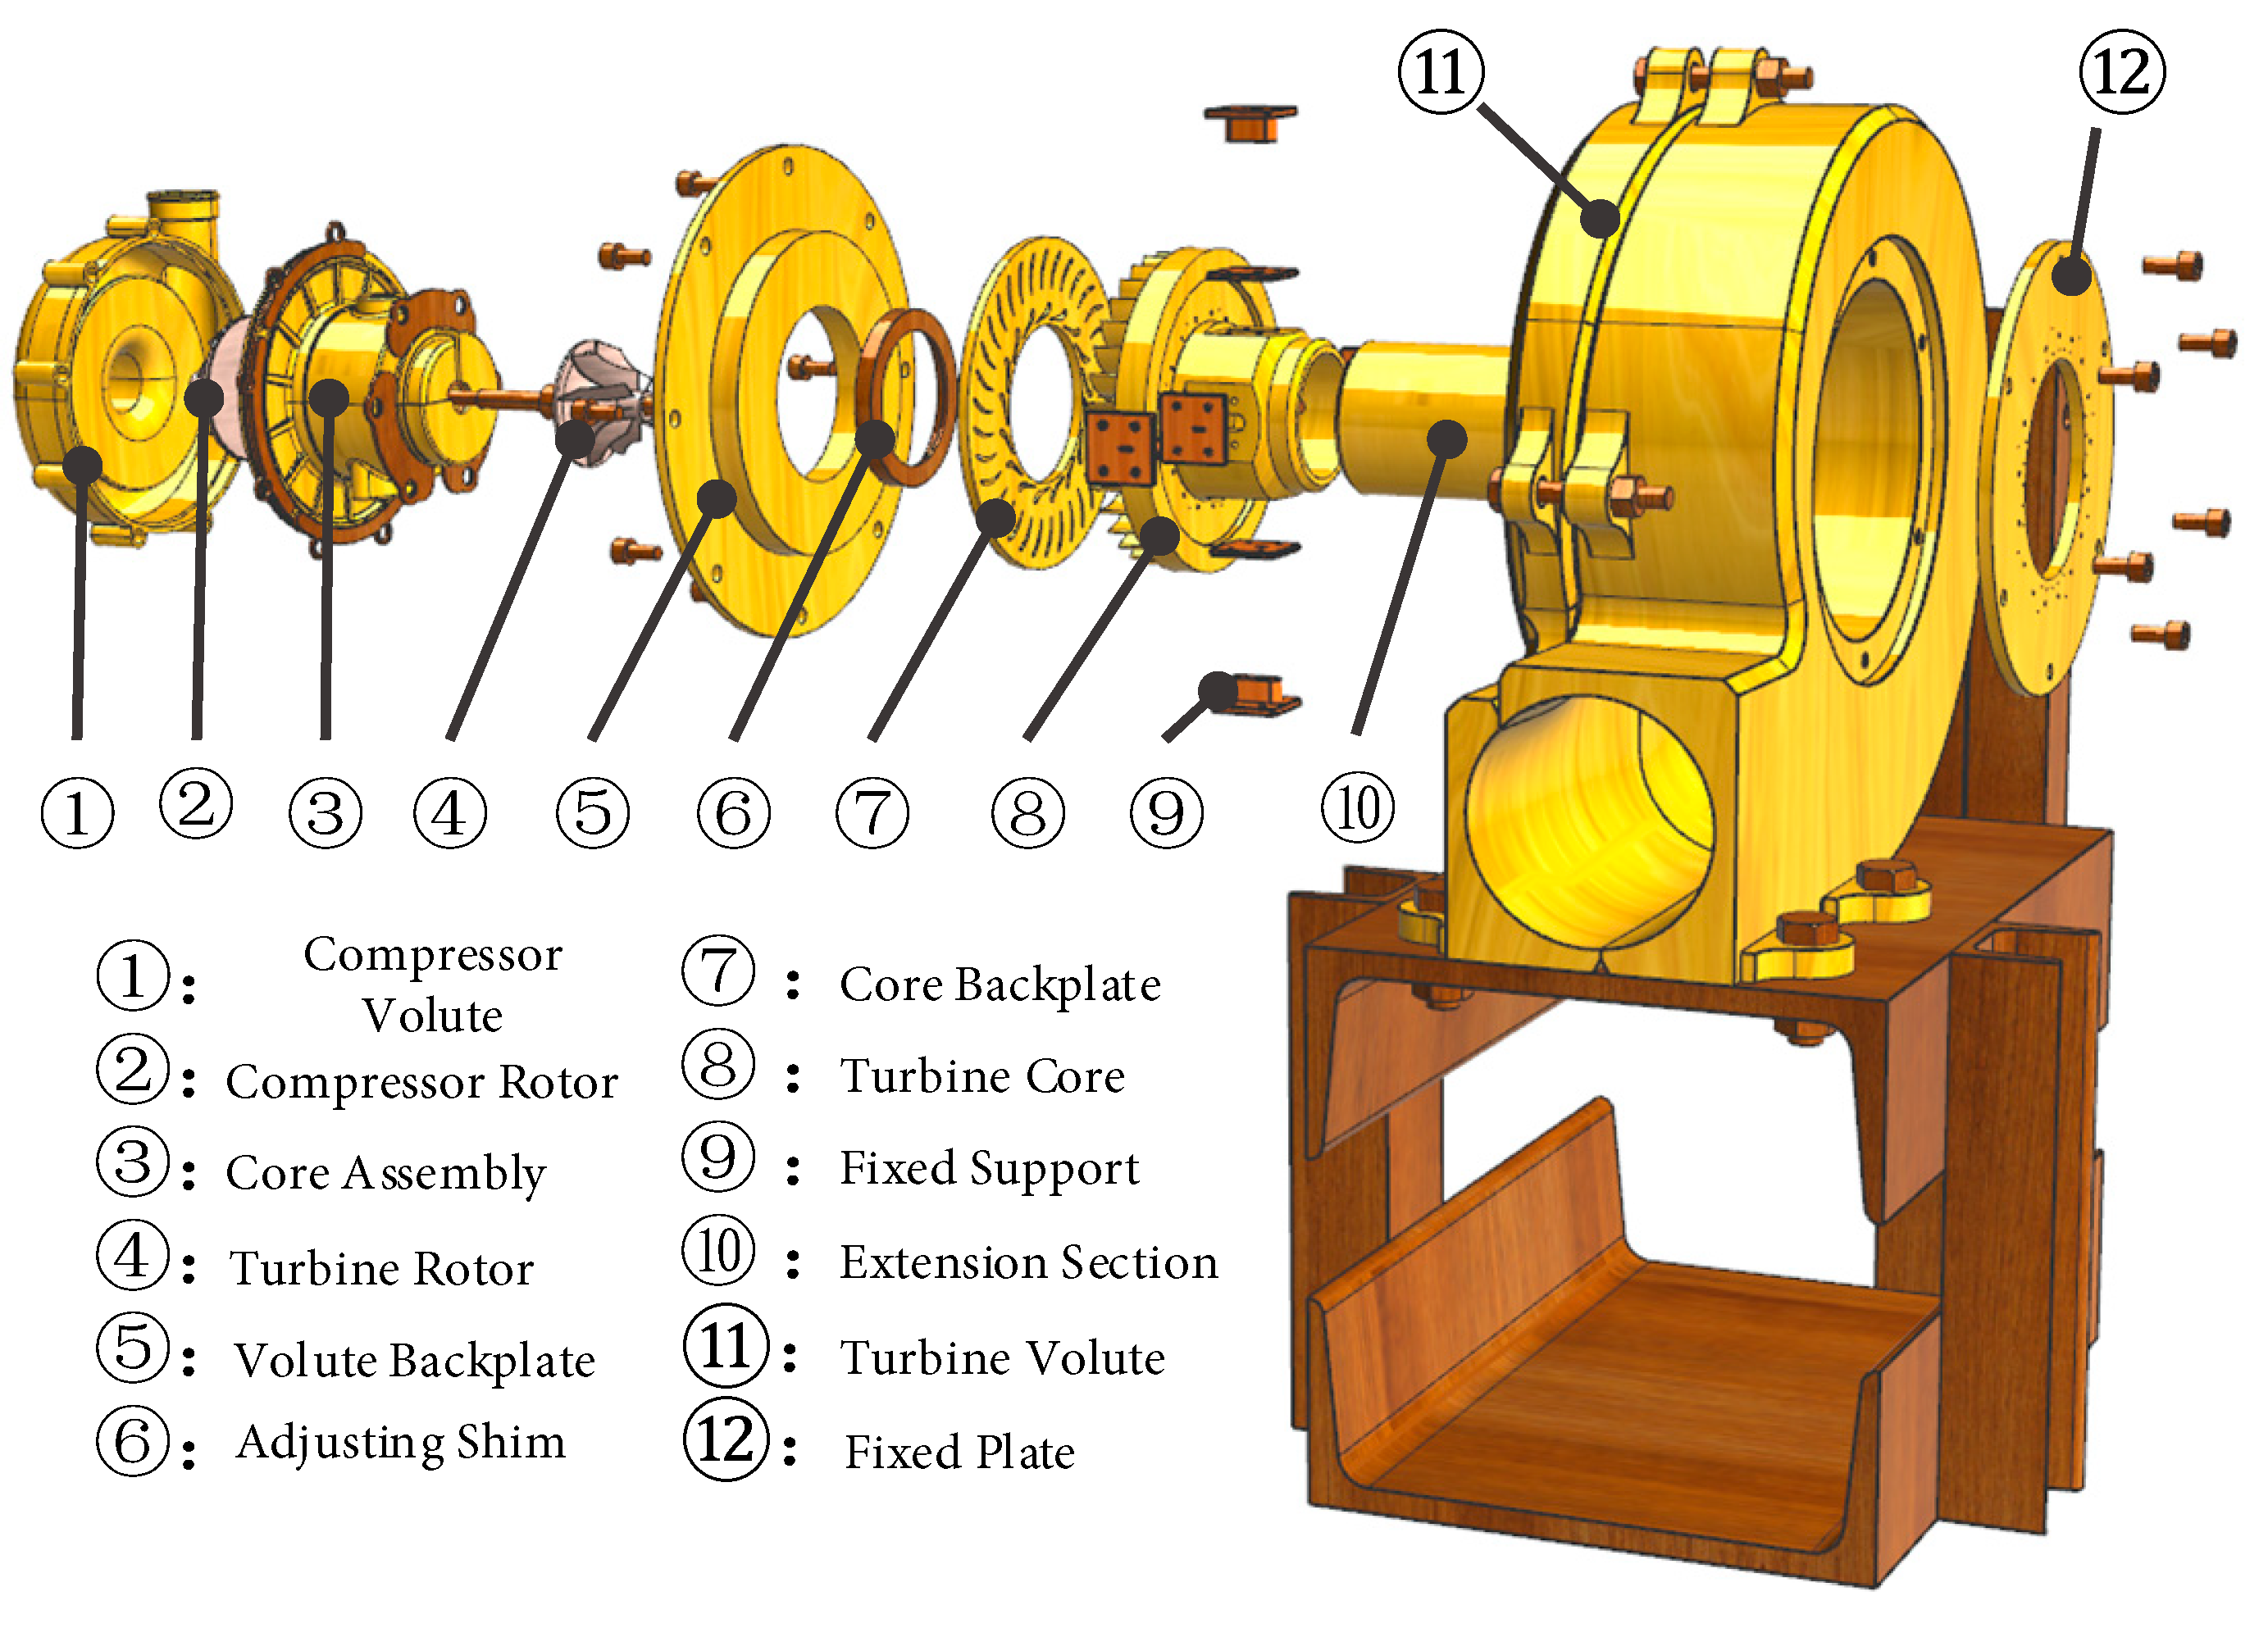
Figure 2: Frame structure of test rig for micro radial inflow turbine.
Fig. 3 presents the actual turbine rotor and core assembly. The turbine core comprises the turbine stator, casing, extension section, and instrumentation ports. The ports allow for the extraction of temperature and pressure measurements, while the extension section accommodates the layout of outlet ports and provides a smooth connection to the downstream segment.
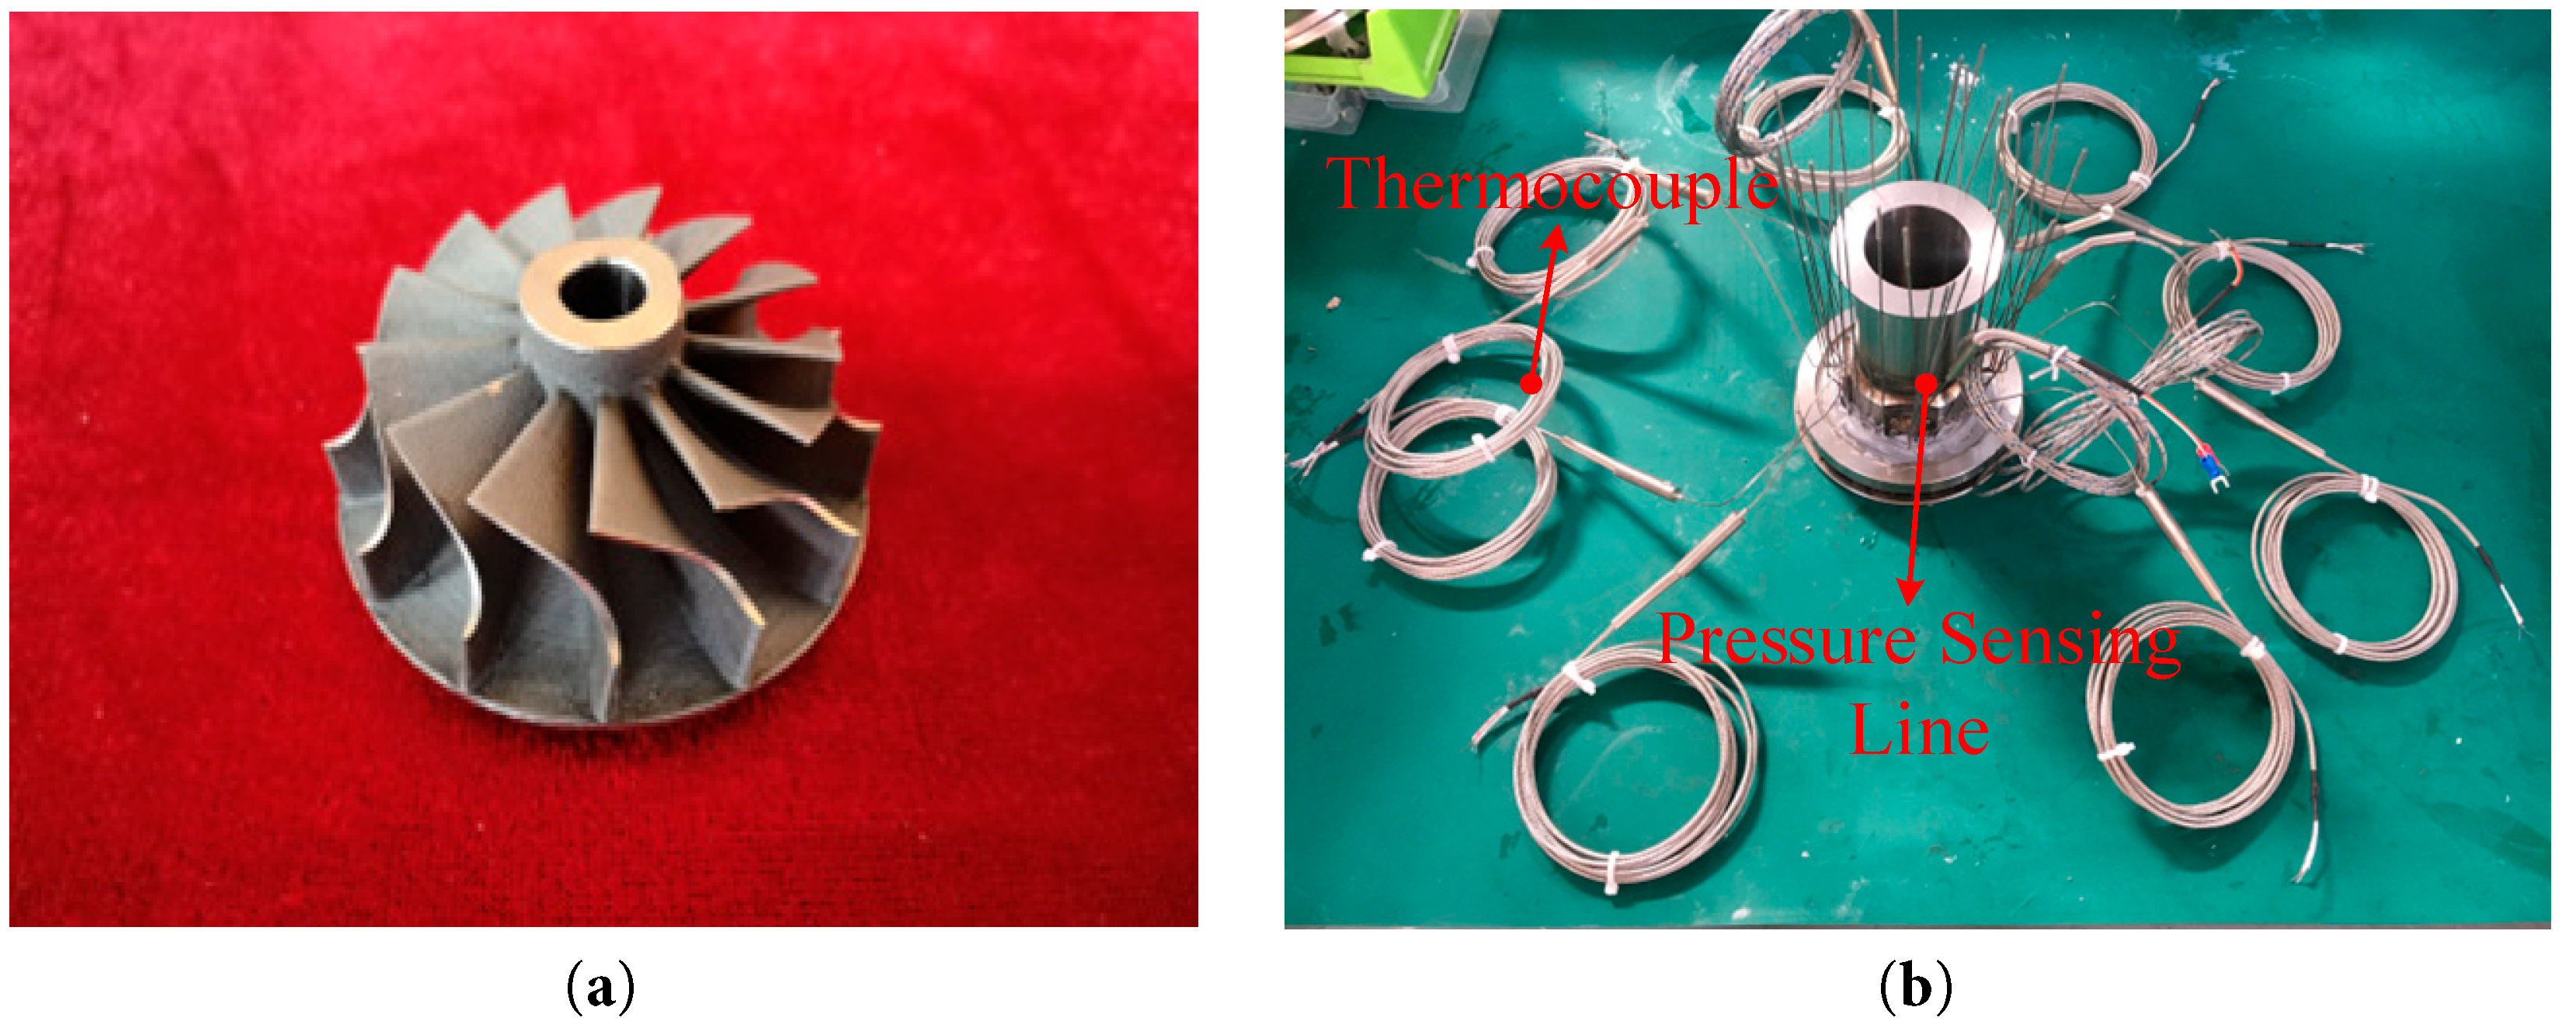
Figure 3: Main equipment and apparatus of the RIT. (a) Turbine rotor; (b) Turbine core.
2.1 Temperature and Pressure Measurement
As shown in Fig. 4, to enable precise monitoring of key aerodynamic parameters at the turbine inlet and outlet, the experimental rig was instrumented with 33 pressure taps and 12 temperature measurement points. Pressure signals were conveyed through 3 mm OD capillaries and 4 mm OD polyurethane tubing to high-precision pressure transmitters (model: JYB-D31510AH4), achieving a measurement accuracy of ±0.075%. Temperature was measured using K-type thermocouples with diameters of 0.8 mm at the turbine inlet and 1 mm at the turbine outlet.
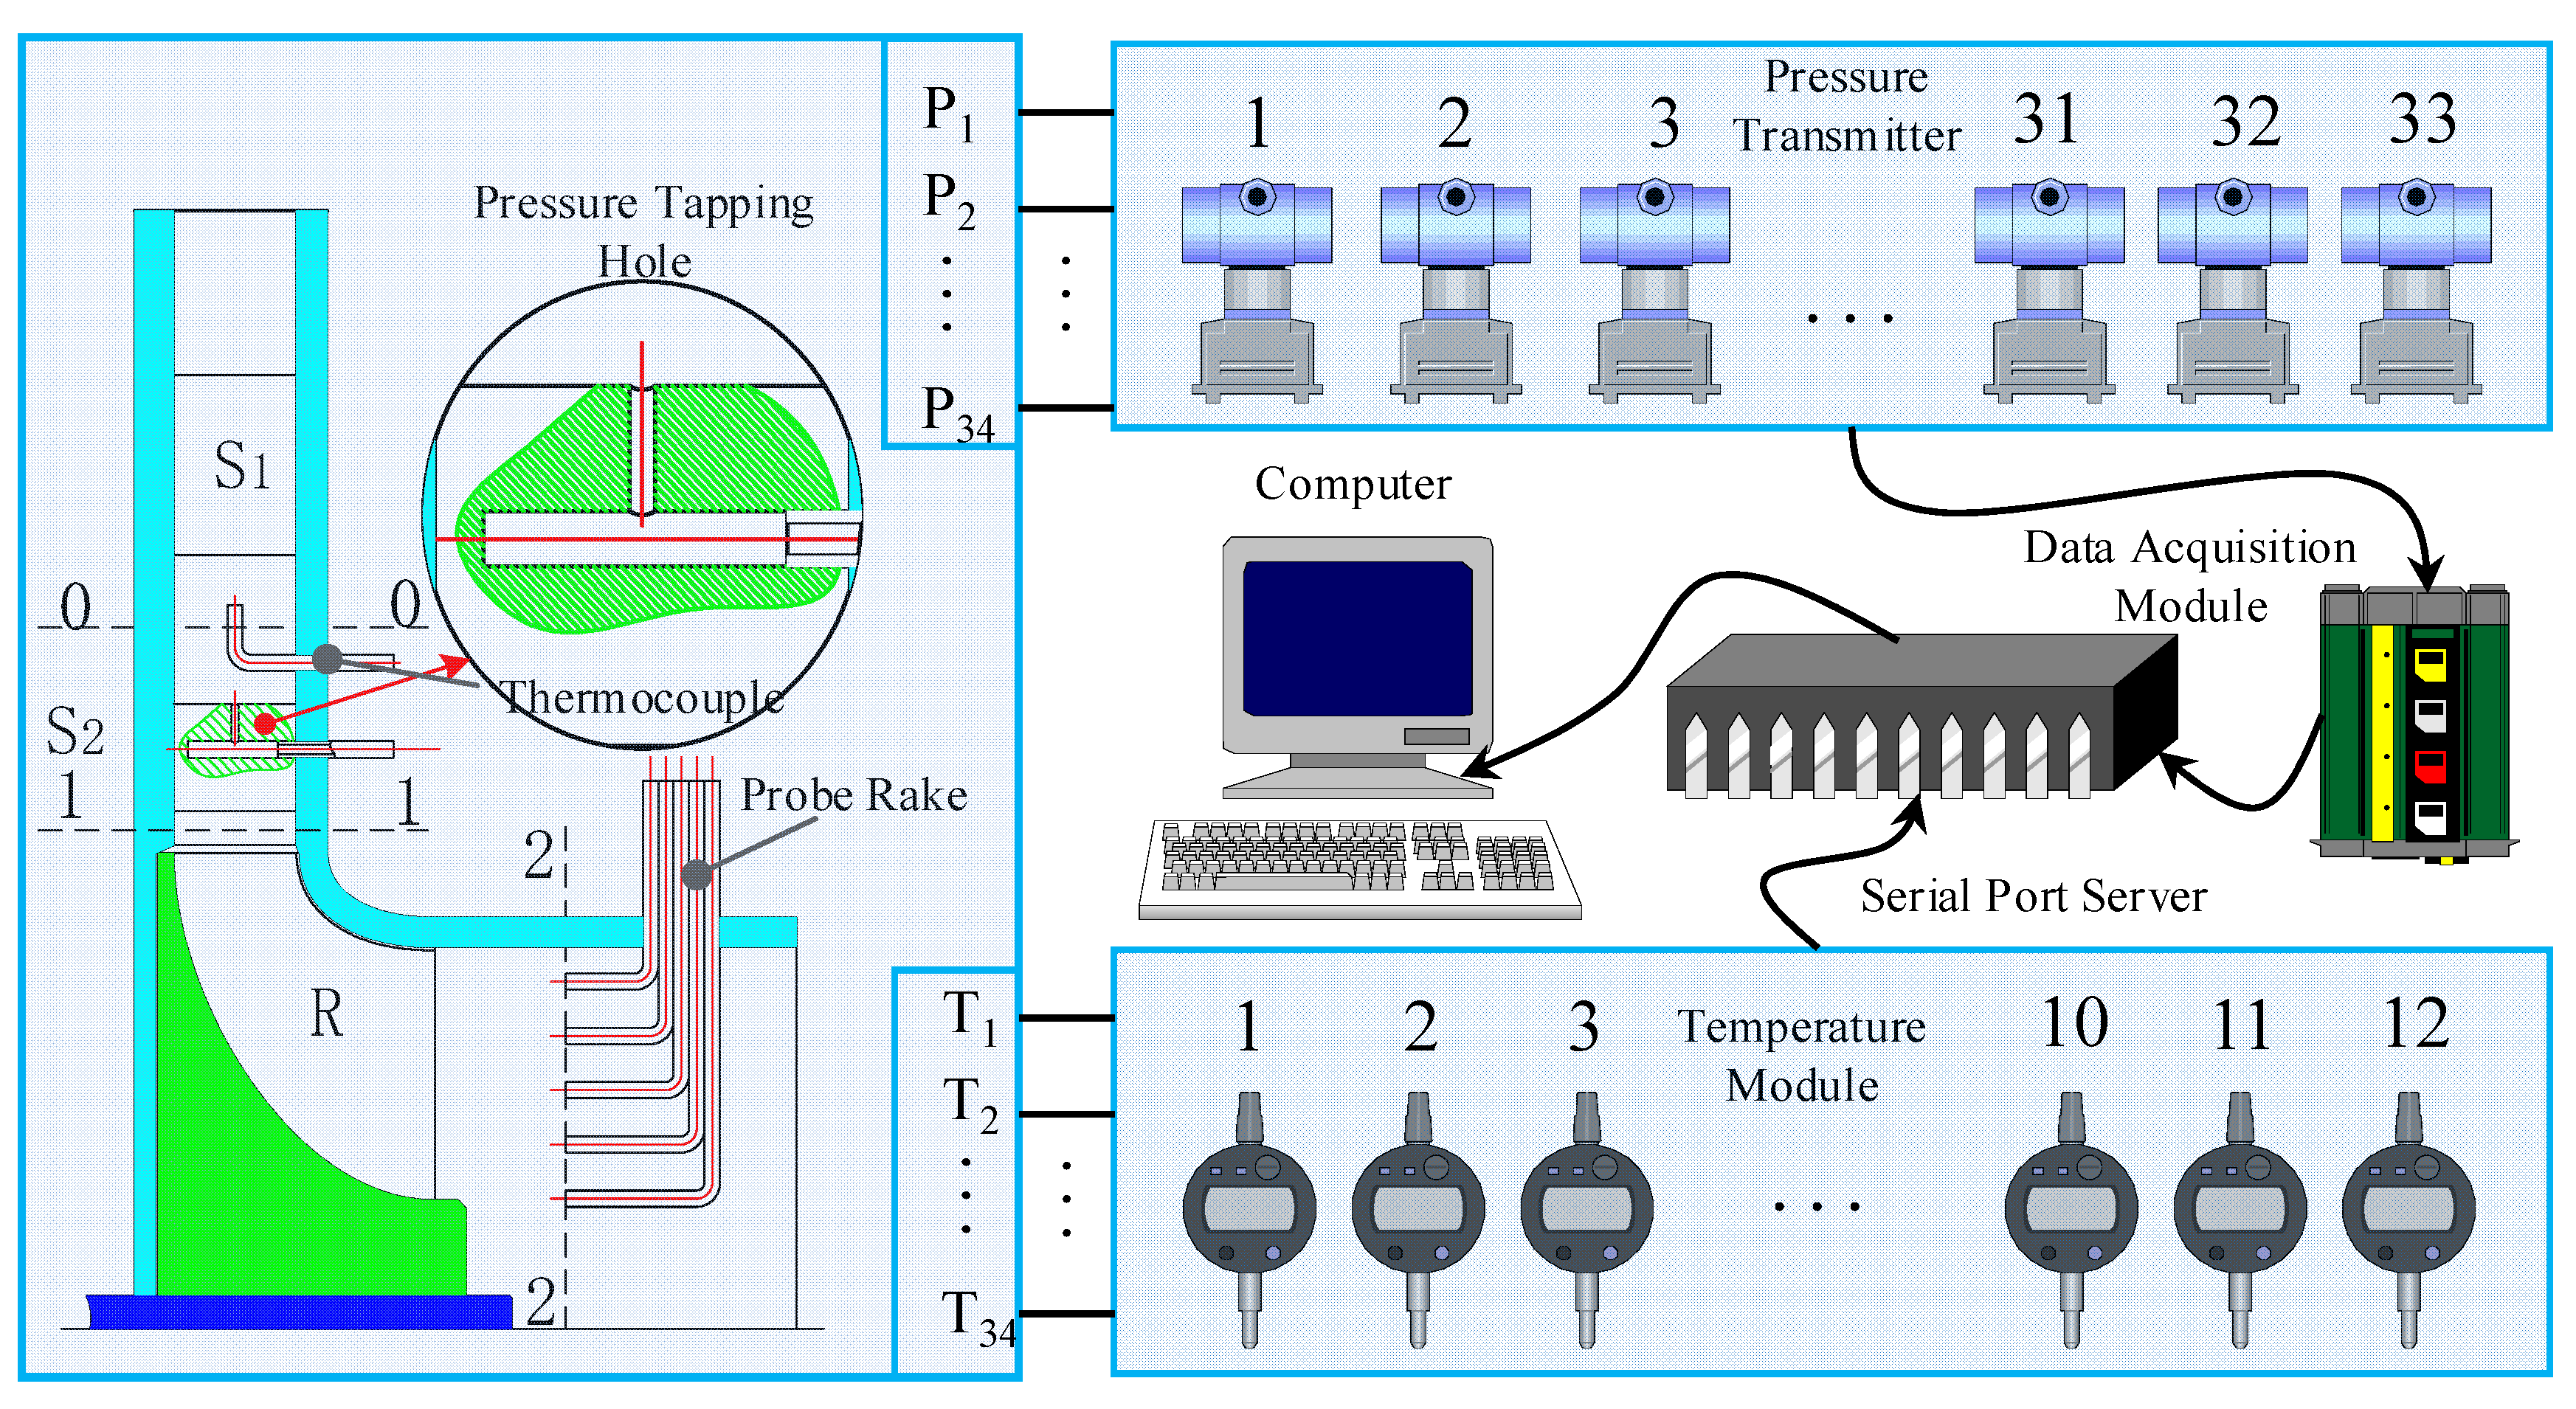
Figure 4: Schematic diagram of data acquisition system for temperature and pressure.
The configuration of the data acquisition system is illustrated in Fig. 4. Pressure transmitters convert the physical signals into digital outputs, which are subsequently digitized by a data acquisition module (model: 4202). Thermocouple voltage signals are transmitted directly to a dedicated temperature acquisition module (model: 4203). All signals are ultimately aggregated via a serial server to the host computer, enabling remote automatic data acquisition and system control through the LabVIEW platform using the Model Bus protocol. The temperature acquisition module incorporates dedicated compensation, ensuring an overall temperature measurement accuracy better than ±1.5 K. The actual hardware used for pressure and temperature signal acquisition is displayed in Fig. 5, respectively.
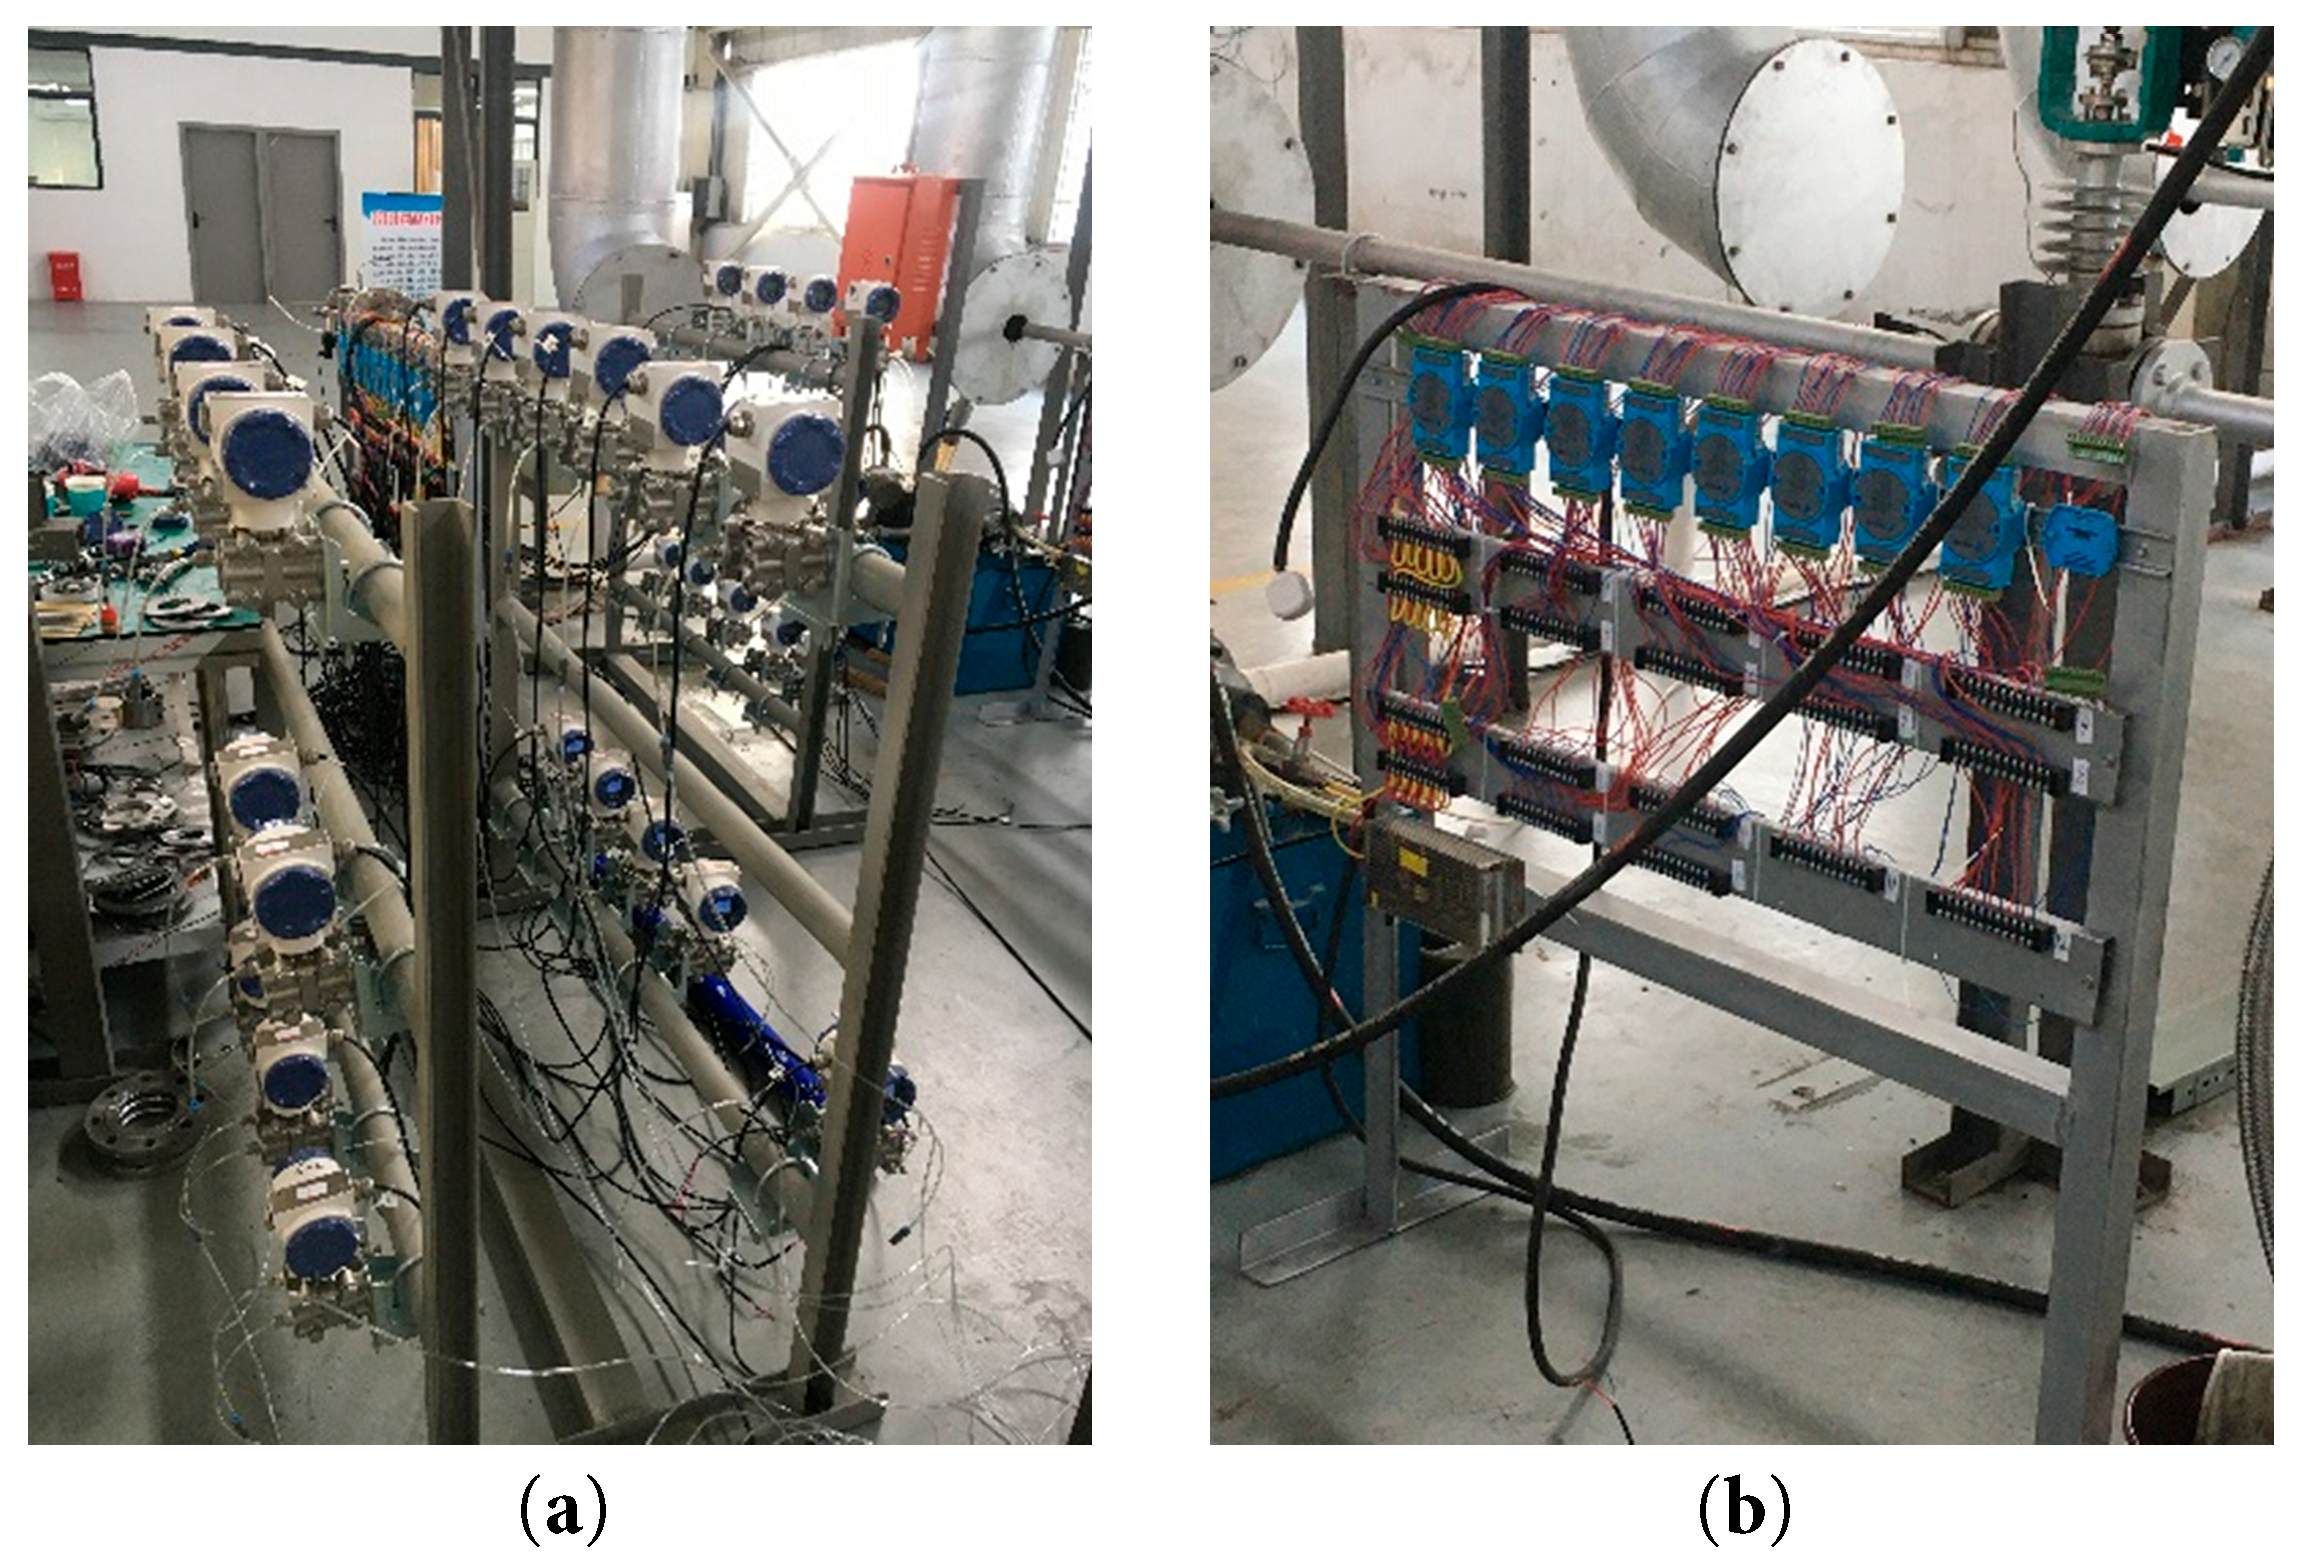
Figure 5: Temperature and pressure acquisition equipment at inlet and outlet of micro radial inflow turbine: (a) Pressure acquisition equipment; (b) Temperature acquisition equipment.
2.2 Test Procedure and Control Strategy
The experimental process is managed by two interrelated yet functionally distinct subsystems: a high-temperature, high-pressure gas supply subsystem and a turbine performance control subsystem. The operational workflow is depicted in Fig. 6. The gas supply subsystem generates and regulates the high-temperature, high-pressure working fluid via dedicated gas lines. Prior to each experiment, the subsystem preconditions the gas to match the turbine’s designed inlet temperature. During testing, precise and stable control of the turbine inlet pressure is achieved through coordinated adjustment of the gas bypass valve and the outlet back-pressure valve. During the performance evaluation, a “constant-speed, variable-expansion-ratio” strategy is implemented.
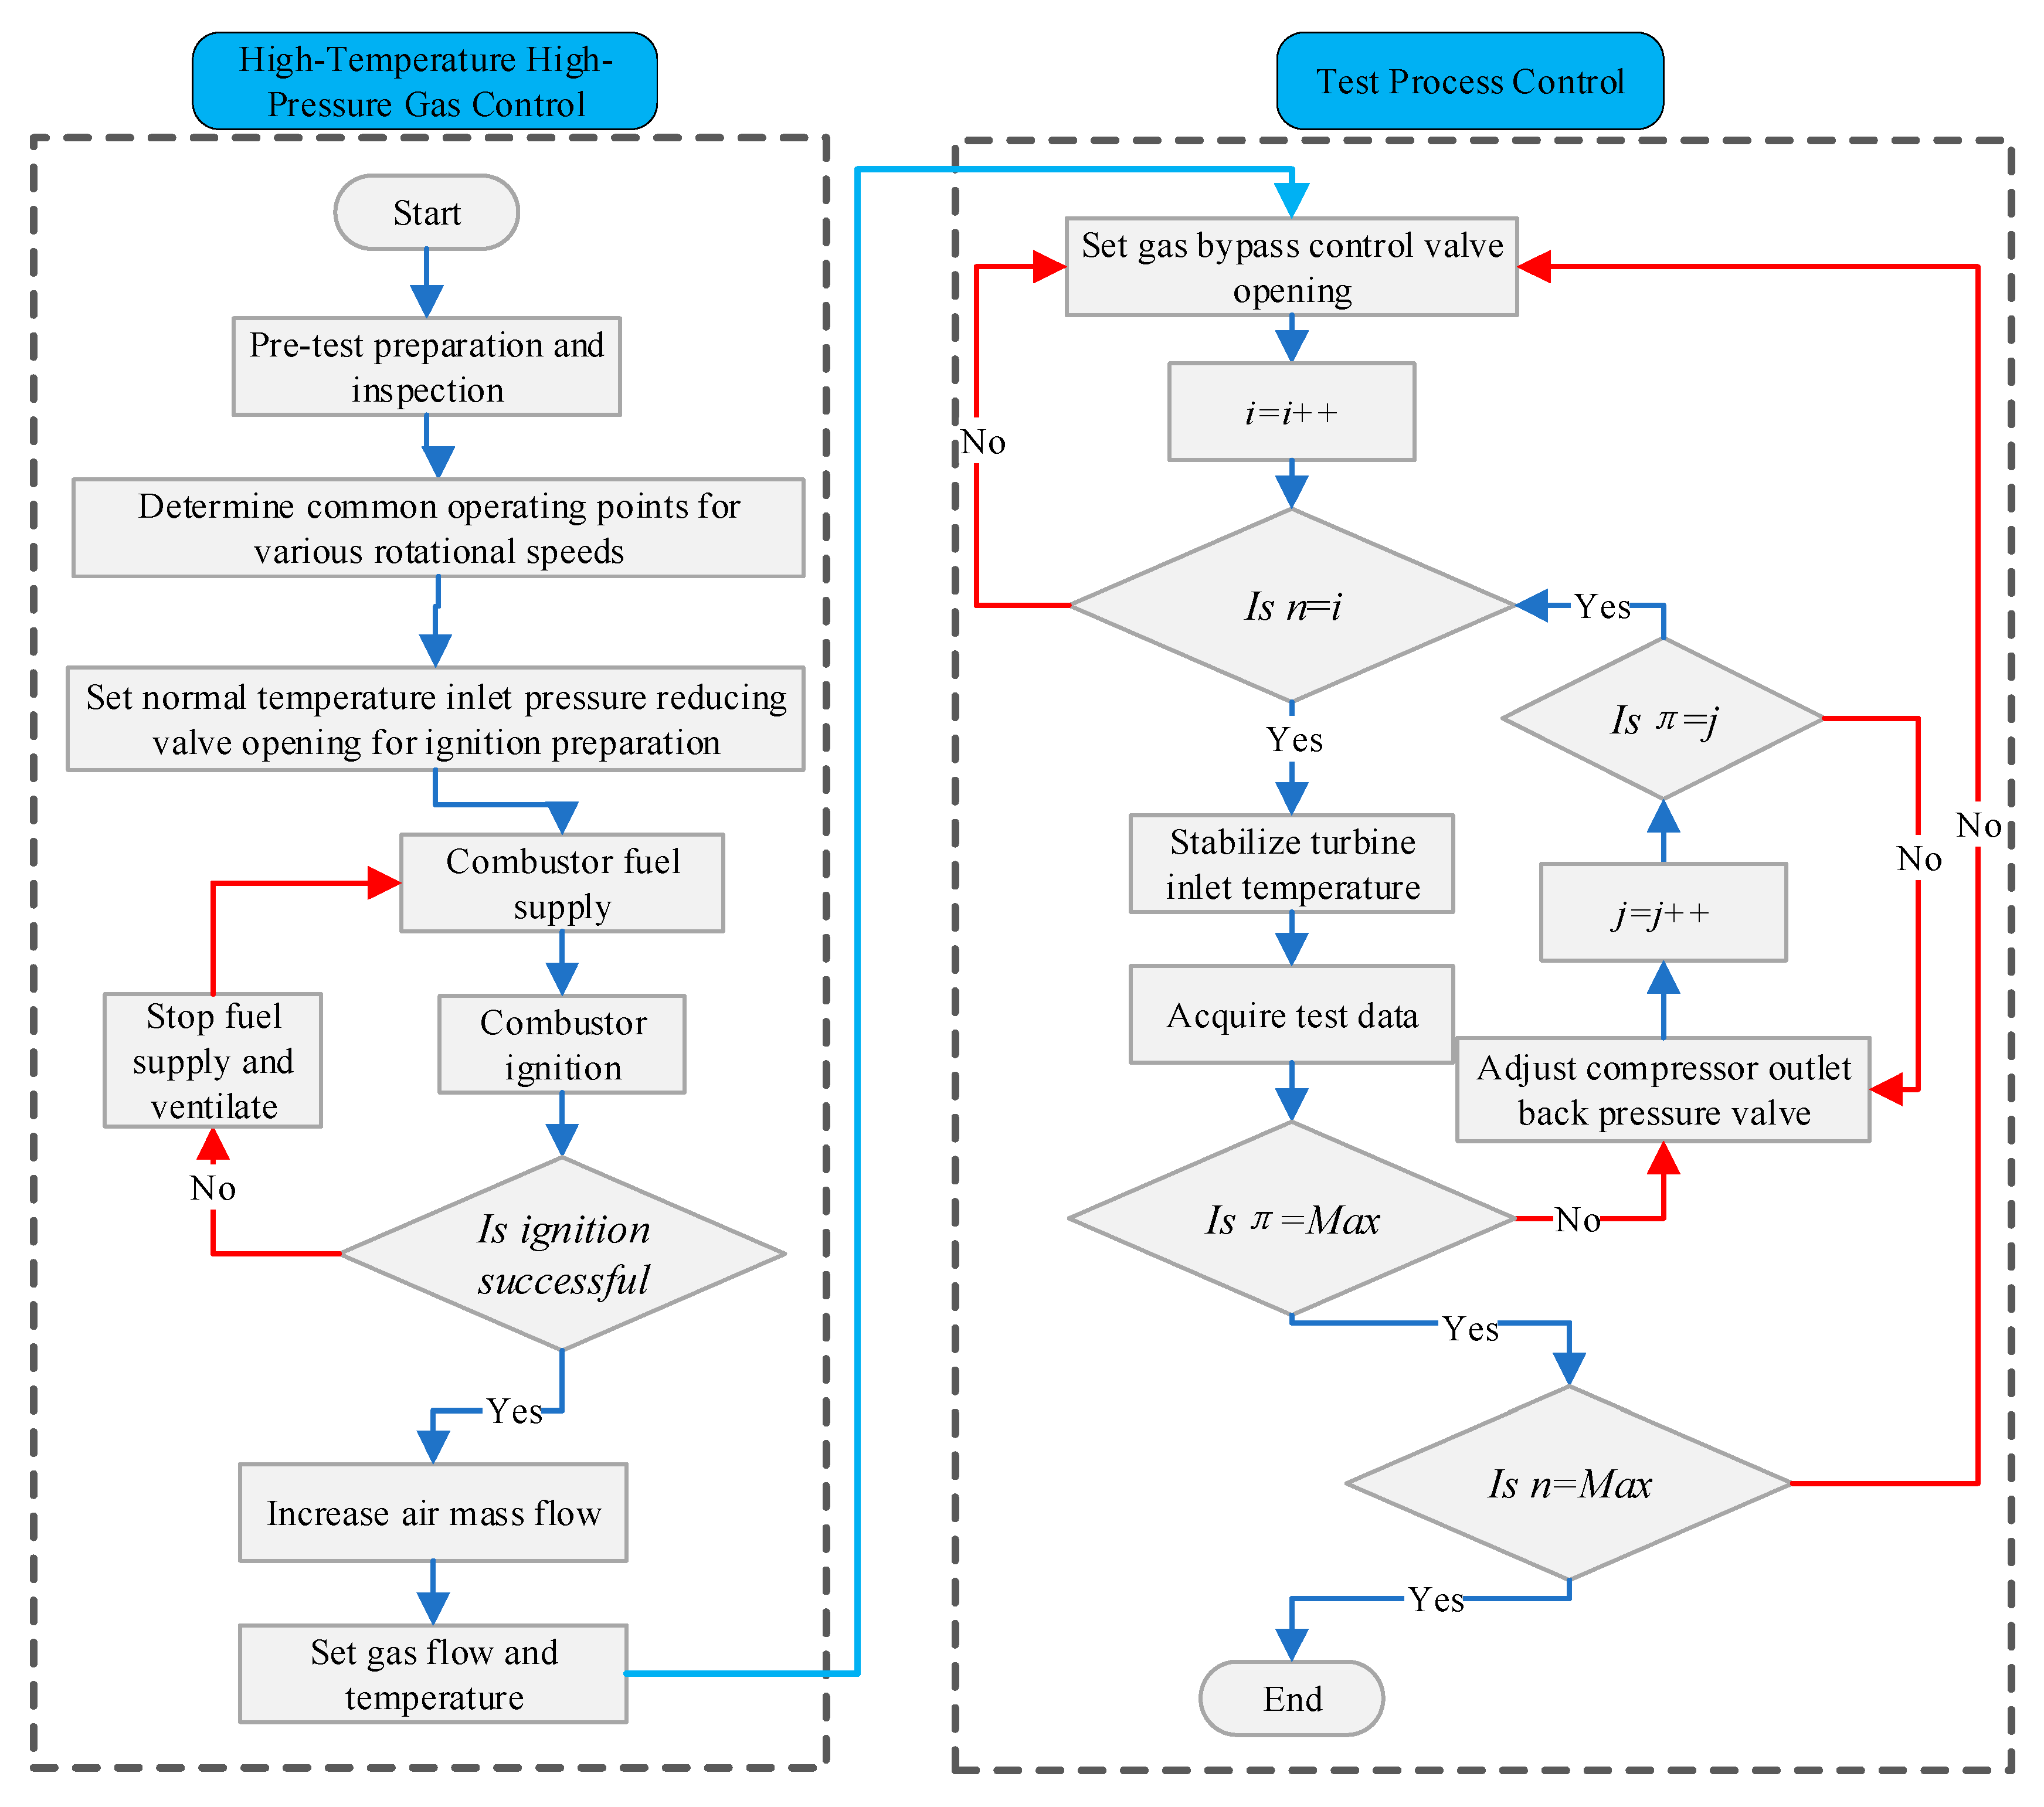
Figure 6: Flow chart of test process for micro radial inflow turbine.
At each preset rotational speed, the turbine back-pressure is adjusted to systematically vary the operating expansion ratio, with the corresponding mass flow rate and efficiency data recorded synchronously. Once the characteristic curve at a given speed is obtained, the procedure is repeated at subsequent speed points. The experimental performance mapping was conducted under defined inlet conditions: a total temperature (T01) of 1020 K and a total pressure of 291 kPa. A baseline rotational speed of 160,000 rpm was selected, and measurements were taken at 60%, 70%, 80%, 90%, and 100% of this speed. At each constant speed point, the load on the turbine—provided by the coaxial compressor—was varied by adjusting the compressor outlet back-pressure to span a range of expansion ratios. This approach aims to comprehensively characterize the turbine’s performance across varying rotational speeds and load conditions, providing a robust experimental dataset to support the validation of numerical models.
3.1 Geometric Model and Boundary Condition
Given the circumferentially periodic arrangement of vanes and rotor blades in the micro radial-flow turbine and the nearly uniform inlet flow conditions, it is reasonable to assume that flow characteristics are identical across all passages. To substantially reduce computational costs, a periodic single-passage model was adopted for three-dimensional steady-state flow simulations. Fig. 7 illustrates the geometric model of the single stator and rotor passage and the associated three-dimensional computational domain. In the model, the stator inlet was specified with total temperature and total pressure boundary conditions, whereas the rotor outlet was defined using an average static pressure boundary condition. To resolve the mismatch between the numbers of stator and rotor passages, the interface was treated using the hybrid plane method available in commercial CFD software. Furthermore, in line with the guidance from [20,21], appropriate inlet and outlet extensions were incorporated into the turbine stage fluid domains to minimize boundary-induced flow disturbances, thereby improving the computational stability and accuracy within the core regions of the stator and rotor.
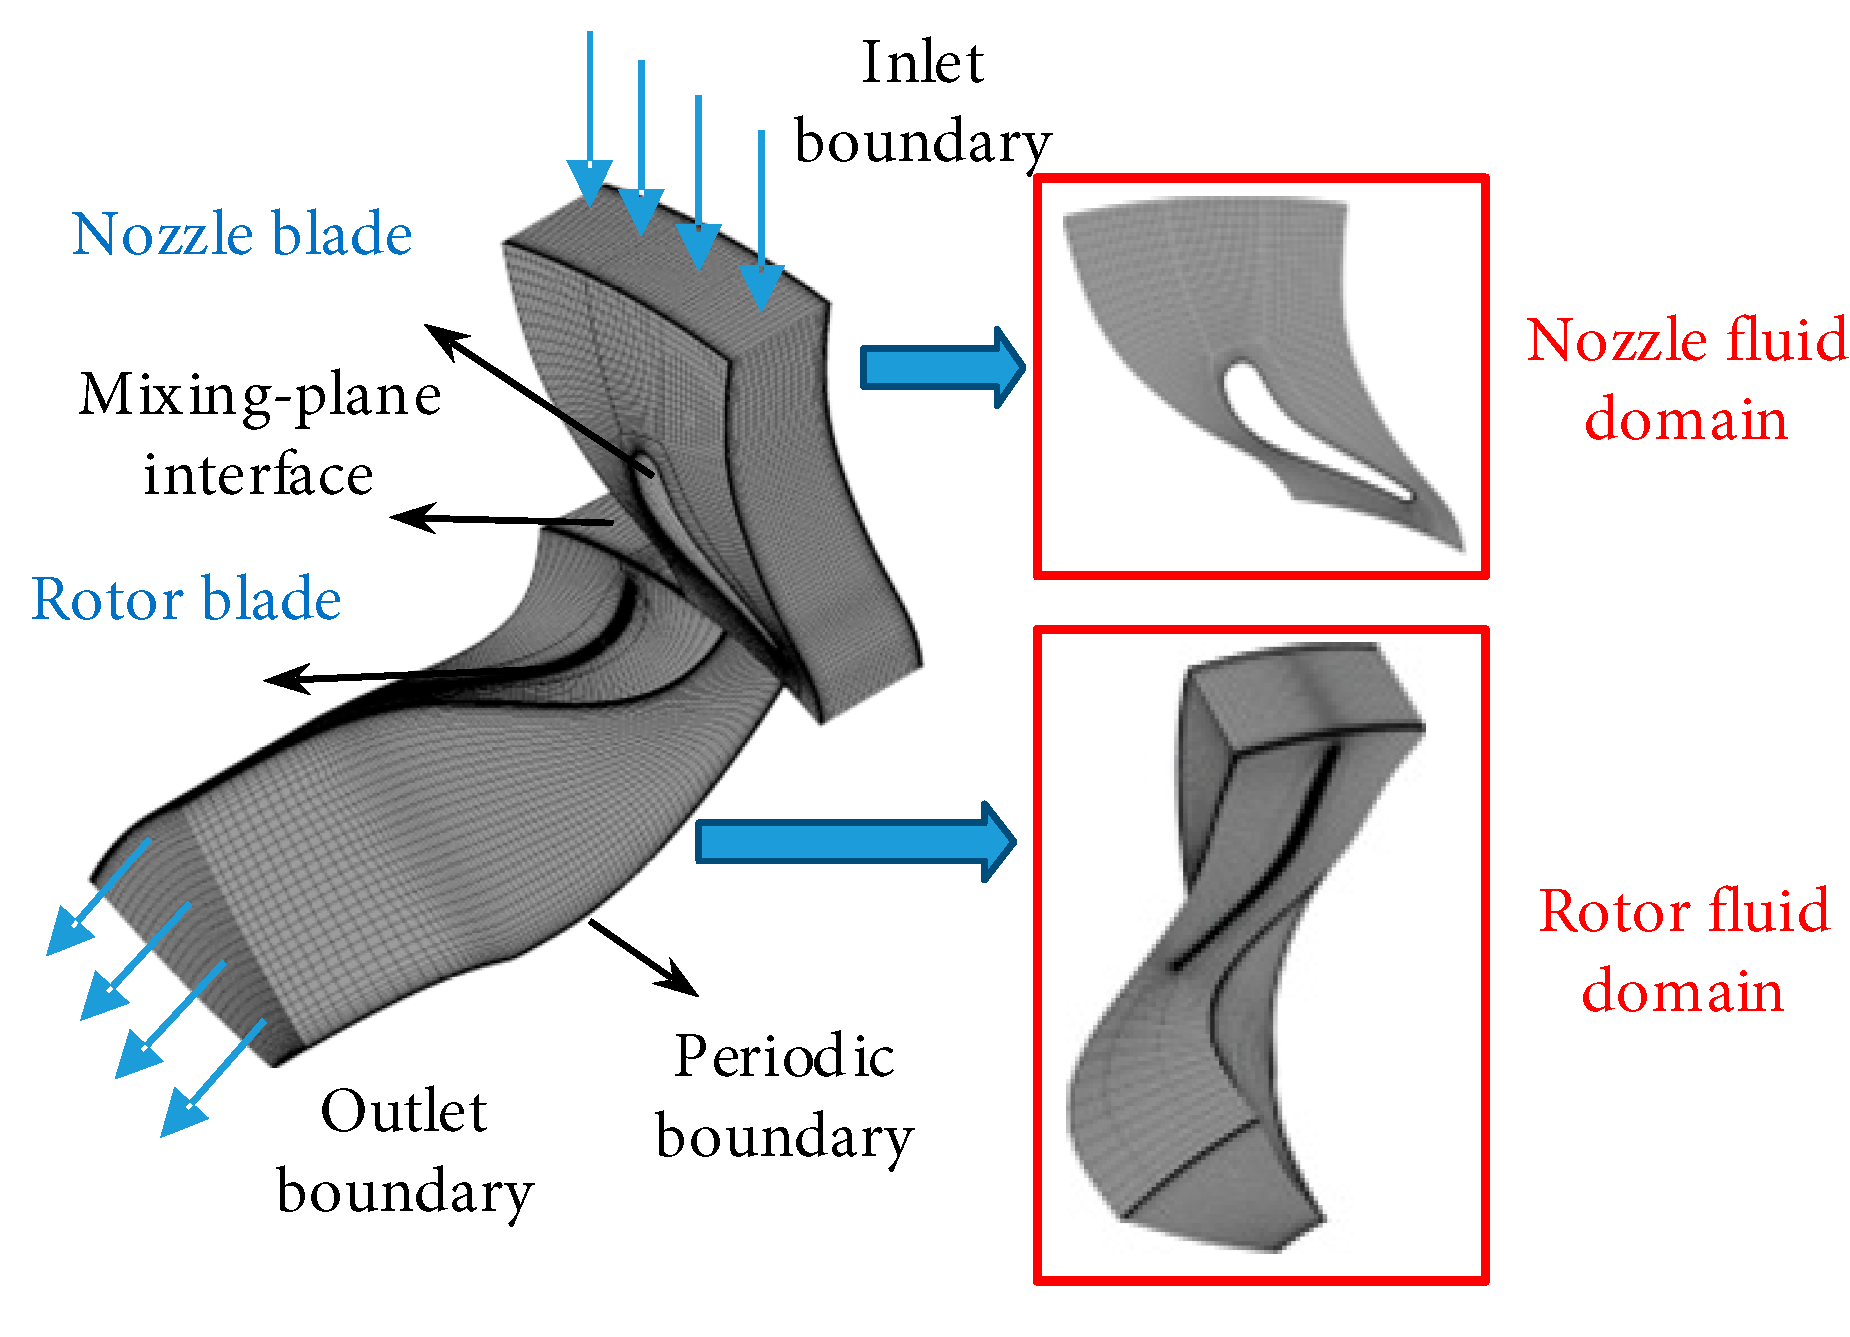
Figure 7: The geometric model and numerical model of single passages for the nozzle and rotor.
Table 1 presents the key boundary condition parameters employed in the numerical simulations of the micro radial-flow turbine. The total-to-static expansion ratio of the turbine is defined as the ratio of the stator inlet total pressure to the rotor outlet static pressure. Accordingly, the turbine inlet was specified with a total pressure of 291,488 Pa and a total temperature of 1020 K. The outlet static pressure was dynamically varied to achieve target expansion ratios. This approach enabled the generation of complete turbine characteristic curves. Given the moderate expansion ratios and resulting low subsonic Mach numbers (Ma < 0.3) in the rotor passages, the high-temperature working fluid was treated as an incompressible ideal gas. This assumption is valid as density variations are negligible under these conditions [22].
The three-dimensional steady-state simulations were performed using the Shear Stress Transport (SST) k-ω turbulence model. This model provides accurate predictions for boundary layer development and flow separation at low Reynolds numbers [22]. A second-order upwind scheme was employed for spatial discretization. The SIMPLEC algorithm was used for pressure–velocity coupling [23]. All simulations were conducted under steady-state conditions. The near-wall mesh was refined to ensure Y+ ≈ 30 for all simulations. This adequately resolves the viscous sublayer. Convergence of the steady-state solution was ensured by monitoring residuals below 10−5. The stabilization of key performance parameters, such as mass flow rate and efficiency, was also monitored.
Table 1: Boundary conditions of numerical model for micro radial inflow turbine.
| Parameters | Value | |
|---|---|---|
| Turbine Inlet | Total Pressure (P01) | 291,488 (Pa) |
| Total Temperature (T01) | 1020 (K) | |
| Turbine Outlet | Static Pressure (P2) | Reasonable value |
3.2 Grid Independence Analysis
Grid independence was verified by systematically varying the mesh density along both the blade span and chord directions. Table 2 presents a comparison of the simulation results across five different mesh sizes, focusing on the total-to-static expansion ratio and mass flow rate as key evaluation metrics. Considering the trade-off between computational cost and simulation accuracy, mesh configuration 4, comprising approximately 1.37 million cells, was chosen for all subsequent simulations.
Table 2: The grid independence study for the micro-RIT CFD.
| No. | Number of Grids | Expansion Ratio π(q, ts) j | Flow Mass m (kg/s) |
|---|---|---|---|
| 1 | 421,521 | 2.7913 | 0.1114 |
| 2 | 571,298 | 2.8407 | 0.1116 |
| 3 | 863,902 | 2.8482 | 0.1121 |
| 4 | 1,356,902 (Opti) | 2.8513 | 0.1125 |
| 5 | 1,853,245 | 2.8515 | 0.1126 |
3.3 Comparison of Experimental and Numerical Results
Fig. 8 presents the comparison of mass flow rate and total-to-static efficiency with experimental measurements across varying expansion ratios. The numerical predictions demonstrate strong agreement with the experimental results. Across the examined expansion ratio range, the simulated mass flow rates deviate from experimental measurements by no more than ±3%, providing strong validation for the accuracy and reliability of the employed numerical methodology. The numerical predictions of total-to-static efficiency show reasonable agreement with the experimental measurements, with deviations within ±10%. The primary sources of this discrepancy are attributed to unmodeled heat losses from the experimental hardware to the ambient and the measurement uncertainty associated with the high-temperature thermocouples, as discussed in Section 2.1.
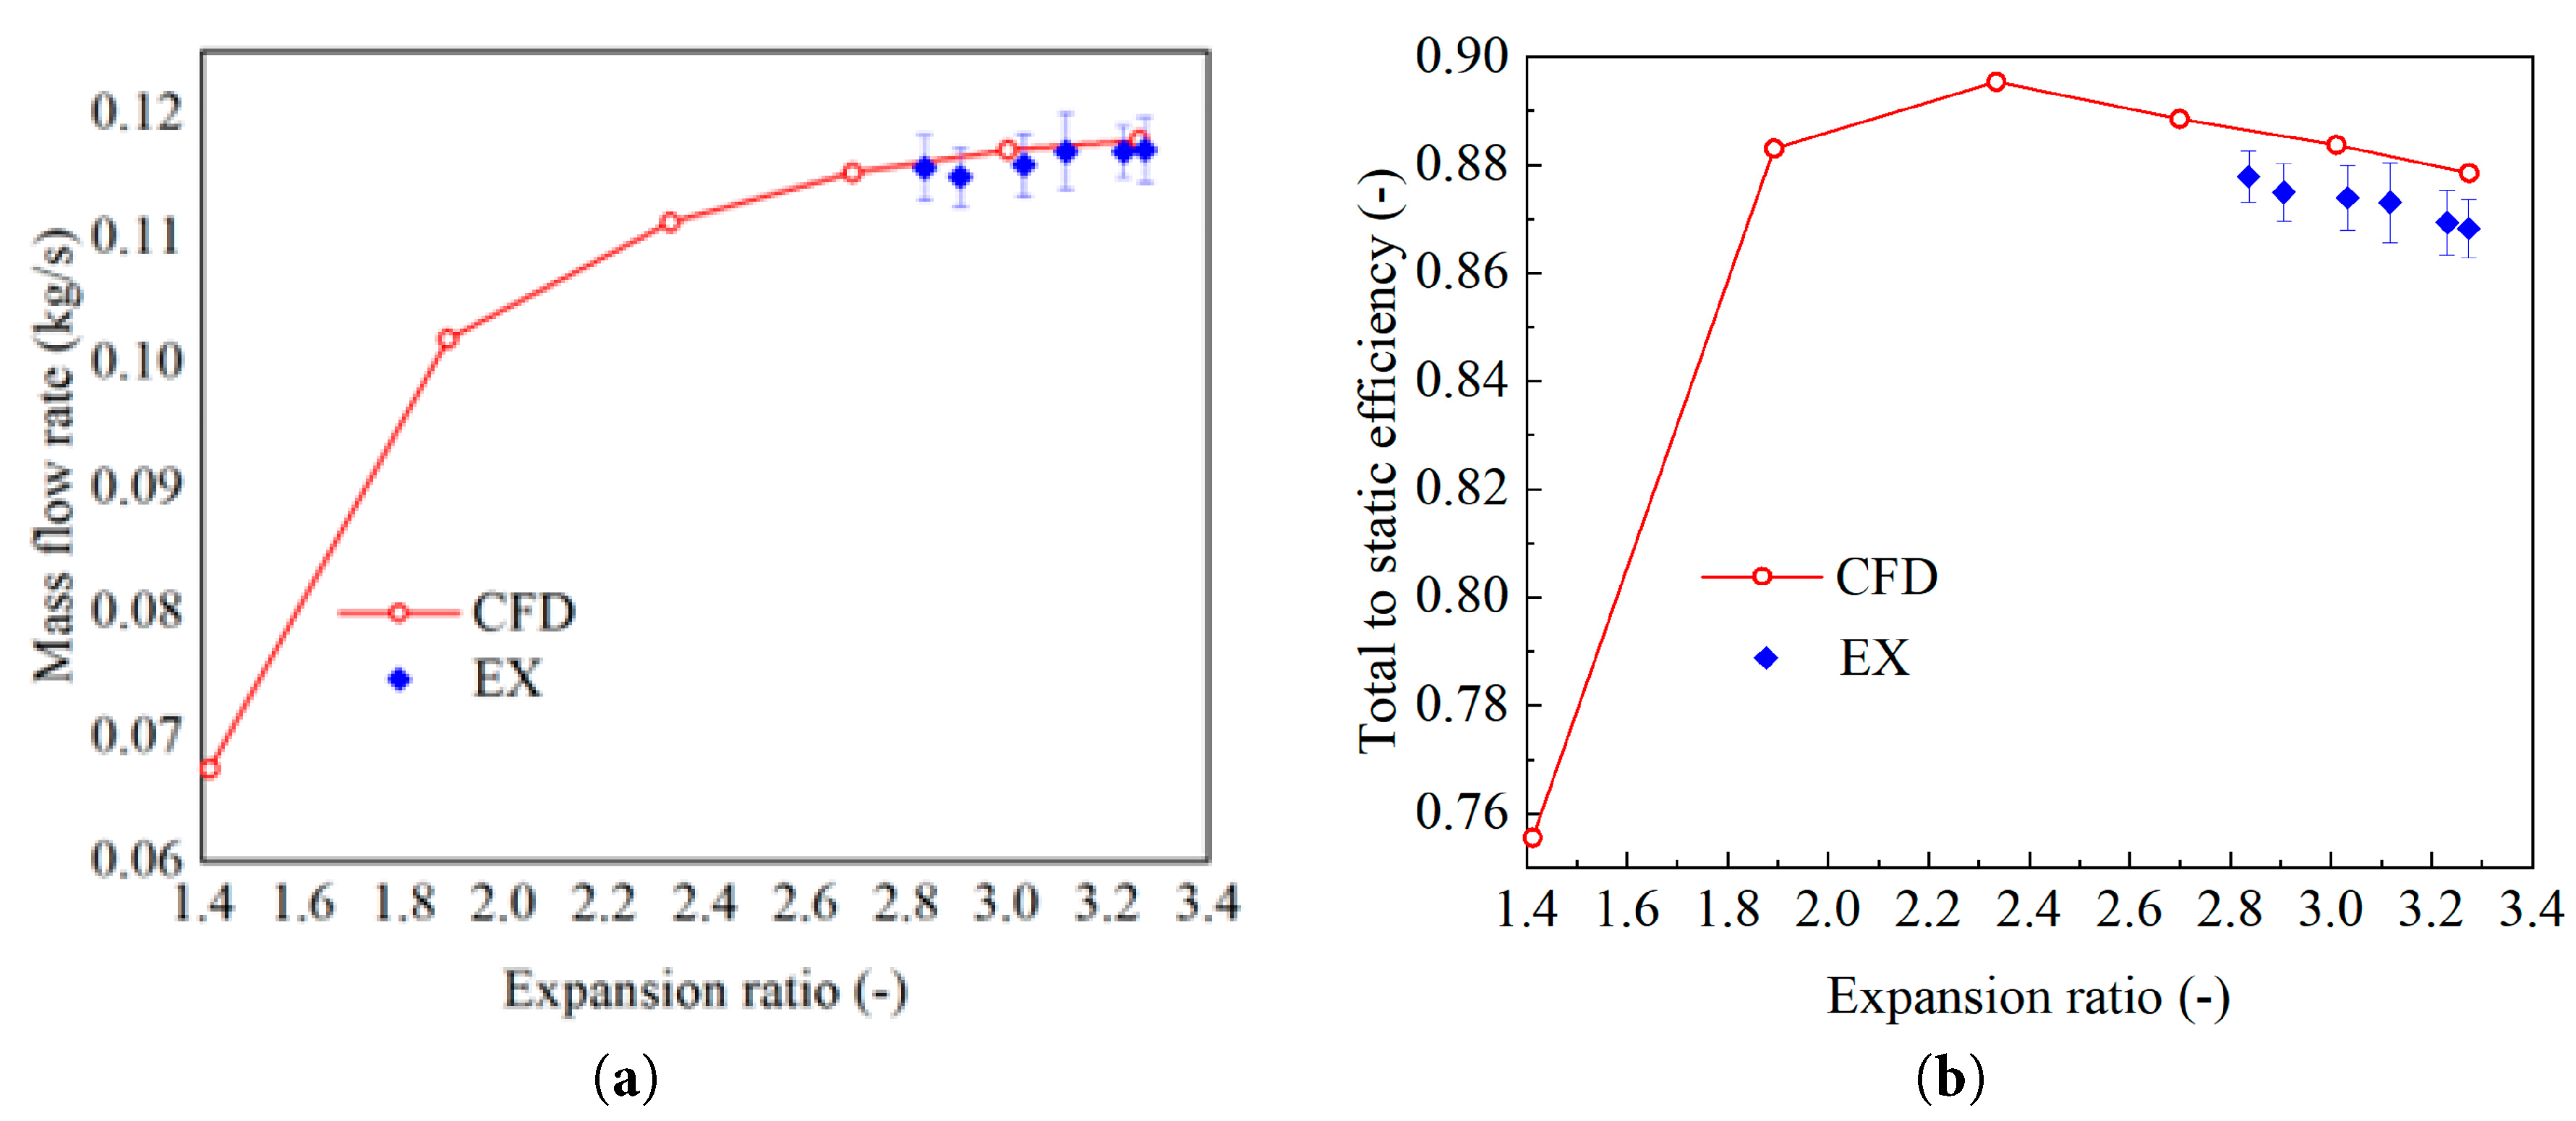
Figure 8: Mass flow rate and total to static efficiency of different expansion ratio. (a) Mass flow rate; (b) total to static efficiency.
4 Effect of Reynolds Number on the Aerodynamic Performance of a Micro Radial Turbine
4.1 Physical Model Development at Different Reynolds Numbers
The Reynolds number is a critical factor influencing the performance of micro radial-flow turbine, as it dictates the interplay between inertial and viscous forces within the flow passages. Conventional radial-flow turbine usually operates at relatively high Reynolds numbers. As the turbine dimensions decrease, the internal fluid Reynolds number correspondingly declines, and below a certain size, the gas Reynolds number drops beneath the self-similar threshold of 3.5 × 10⁴. Under these conditions, laminar flow dominates most of the rotor blade surfaces, reducing the ability to suppress flow separation. This promotes separation near the trailing edge of the suction side, ultimately leading to a decrease in the efficiency of the micro radial-flow turbine. To examine the effects of Reynolds number on the aerodynamic performance of micro radial-flow turbine, a three-dimensional baseline model was constructed according to the design parameters, with its scaling factor set as SF = 1.0. Building on this, the baseline model was uniformly scaled by factors of 1.6, 1.3, 0.7, and 0.4, corresponding to scaling factors of SF = 1.6, 1.3, 0.7, and 0.3, respectively. Based on prior micro radial-flow turbine design data, the baseline model (SF = 1.0) has a radius of 28.9 mm. Accordingly, turbines with scaling factors SF = 1.6, 1.3, 0.7, and 0.3 possess radii of 46.24 mm, 37.57 mm, 20.23 mm, and 8.67 mm, respectively. Fig. 9 illustrates the three-dimensional models of the micro radial-flow turbine corresponding to the various scaling factors.
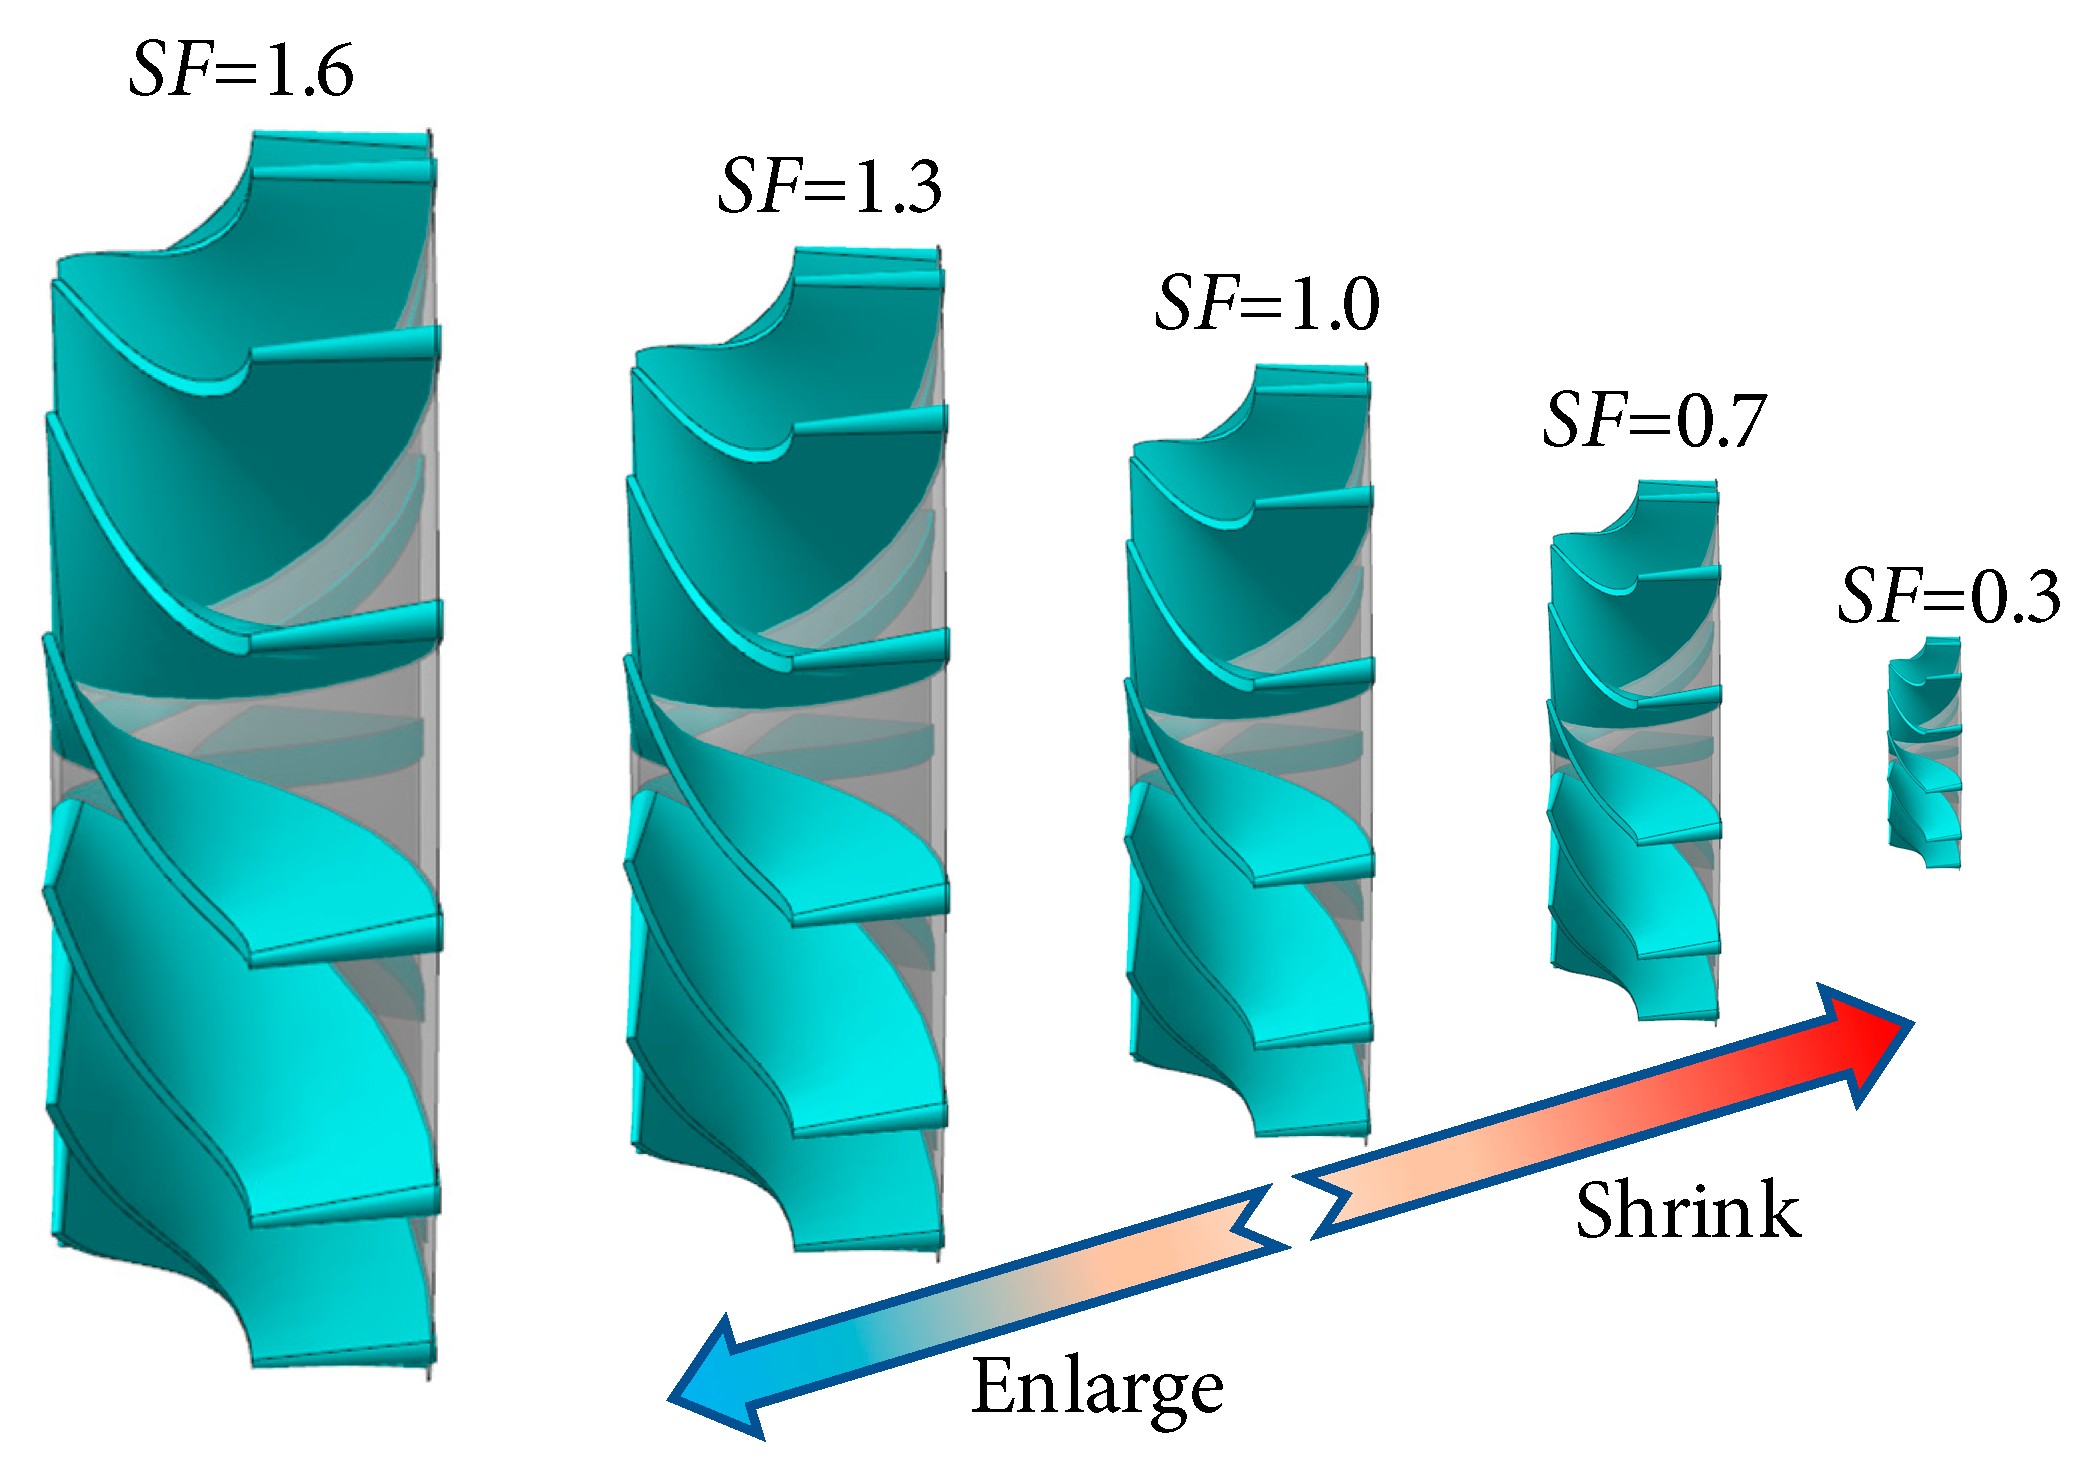
Figure 9: Physical model of micro radial inflow turbine impeller with different scale factors.
The rotor speed was adjusted in accordance with the scaling factor SF to maintain a constant blade-tip tangential velocity. Consequently, as the scaling factor decreases, the rotor rotational speed increases. Based on the similarity principles of radial-flow turbine, when the geometry is scaled proportionally, the gas flow within the turbine must satisfy dynamic similarity; that is, the Mach and Reynolds numbers at corresponding locations in the flow field must be identical. By the definition of the Mach number, ensuring equal Mach numbers implies that the dimensionless parameters
In this context, the turbine inlet total temperature and total pressure are 1020 K and 291,948 Pa, respectively. Therefore, maintaining constant values at corresponding points in the flow field ensures that the radial-flow turbine similarity criteria are met. In this context, the turbine inlet total temperature and total pressure are 1020 K and 291,948 Pa, respectively. Therefore, maintaining constant values at corresponding points in the flow field ensures that the radial-flow turbine similarity criteria are met. Considering the operating temperature, pressure, and structural features of the micro radial-flow turbine, the blade-tip tangential velocity was designed at 484 m/s. Fig. 10 illustrates the rotational speed models of micro radial-flow turbine rotors with varying scaling factors, with the blade-tip tangential velocity consistently maintained at 484 m/s for all models. Accordingly, the design rotational speeds for the micro radial-flow turbine rotors with scaling factors SF = 1.6, 1.3, 1.0, 0.7, and 0.3 are 100,000 rpm, 123,076 rpm, 160,000 rpm, 228,571 rpm, and 400,000 rpm, respectively.
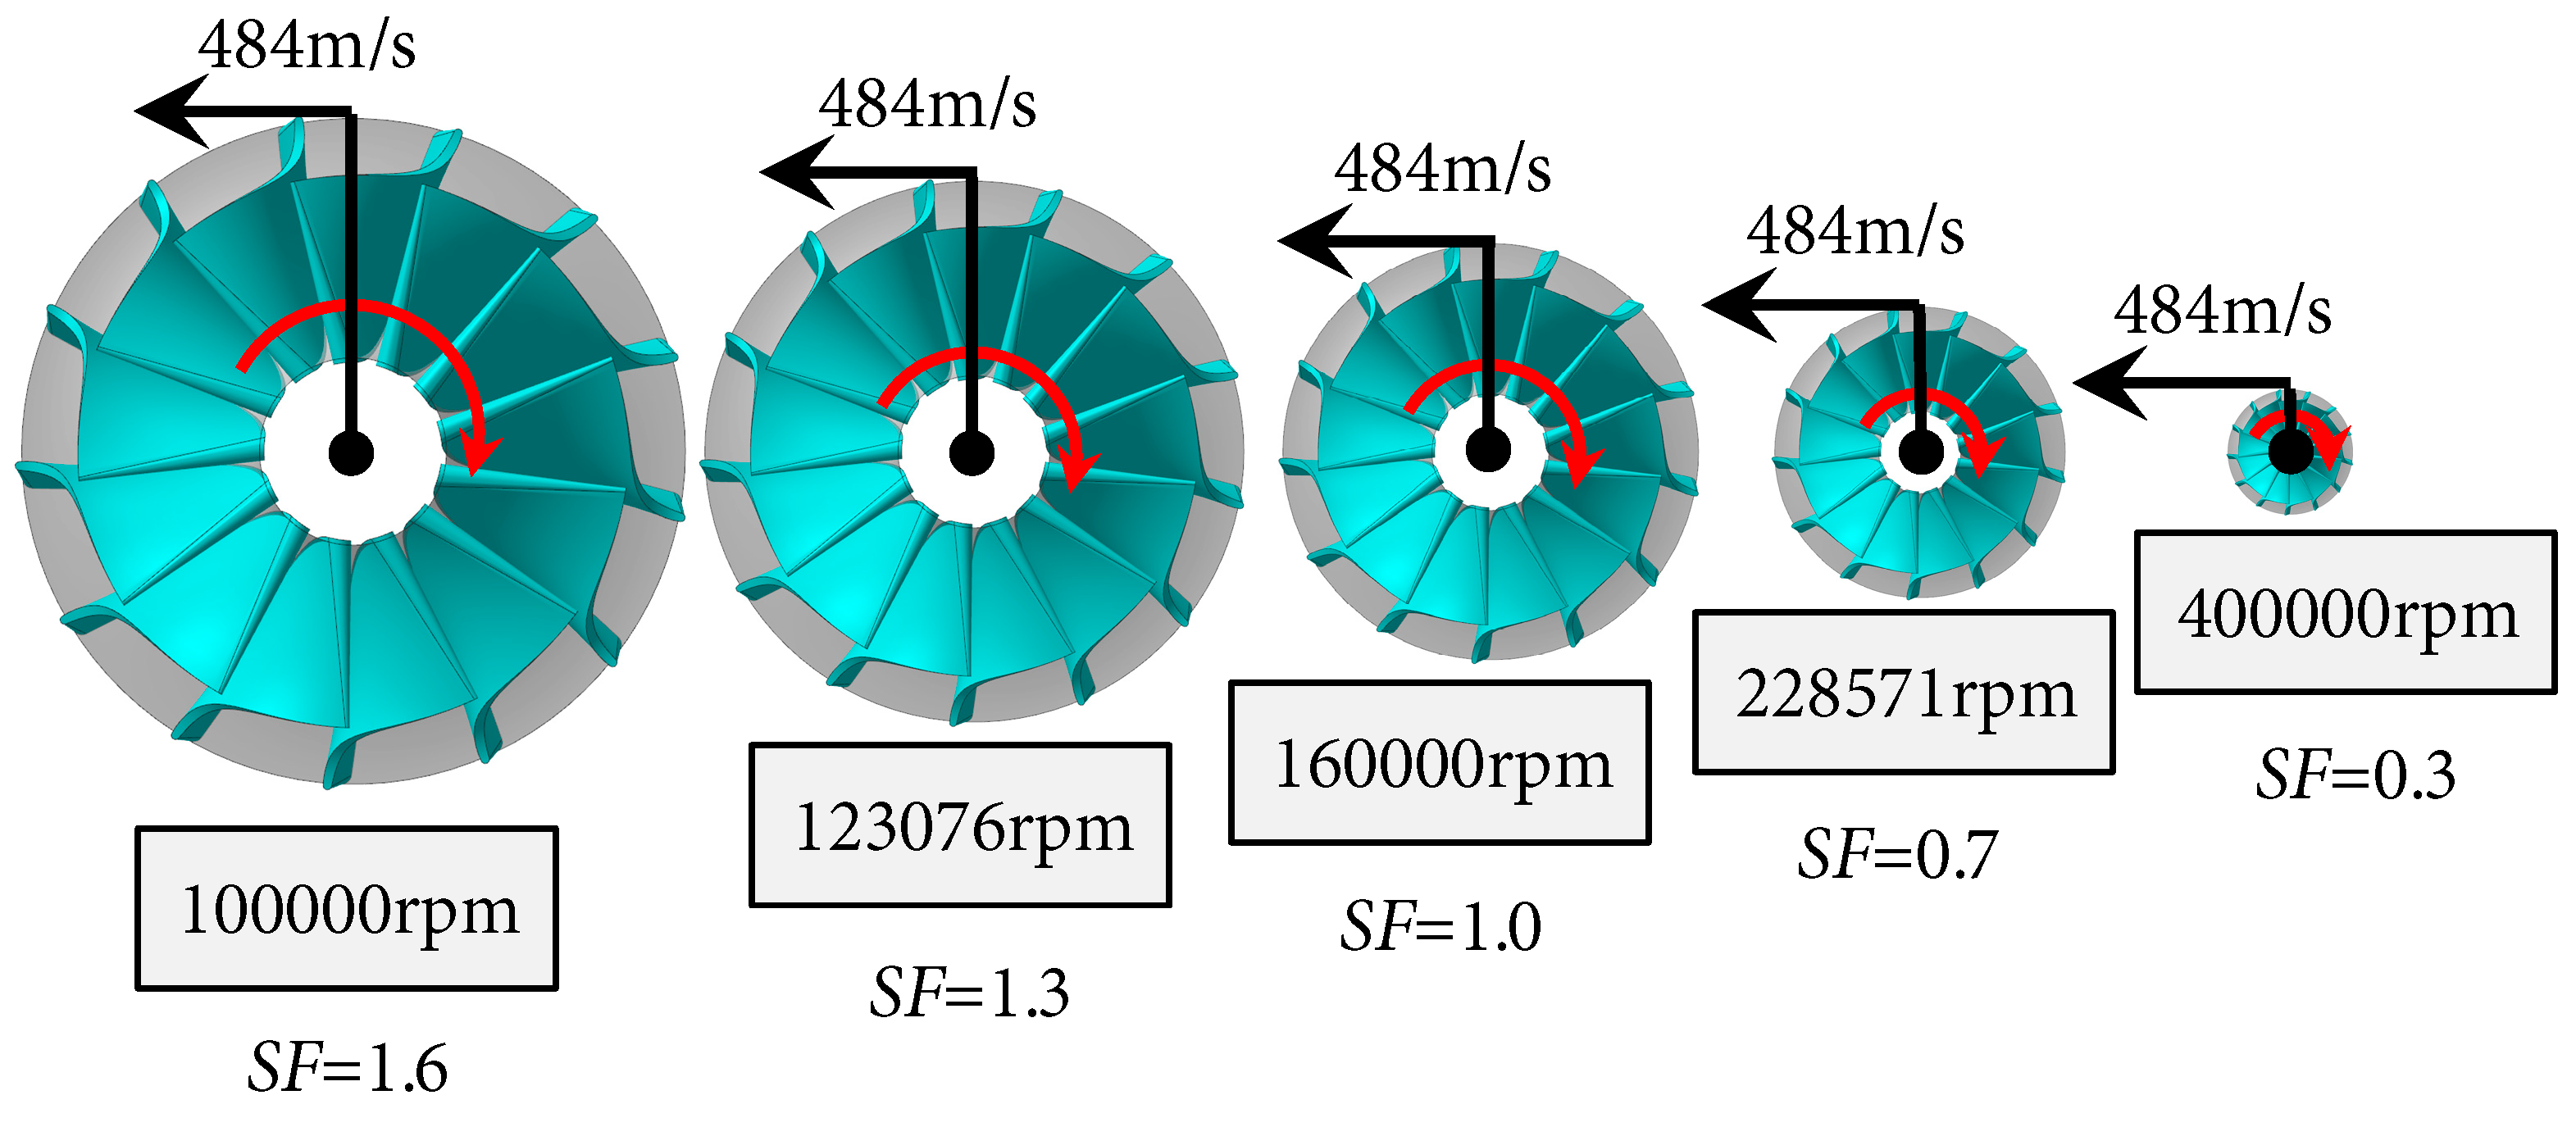
Figure 10: Rotation speed setting of micro radial inflow turbine impeller with different scale factors.
According to the similarity principles of micro radial-flow turbine, assuming uniform aerodynamic parameters and consistent working fluid properties at the turbine inlet, the inlet mass flux per unit area remains constant. Variations in the Reynolds number within the turbine passages can therefore be controlled solely by adjusting the hydraulic diameter (DH), which is usually taken as the rotor inlet blade height (h1), itself determined by the scaling factor SF. Consequently, Table 3 summarizes the rotor inlet hydraulic diameter, inlet mass flux per unit area, and inlet Reynolds number for various scaling factors. Owing to the size reduction, the inlet Reynolds numbers listed are already below the self-similar range for radial-flow turbine (Re > 3.5 × 10⁴). As the scaling factor SF of the micro radial-flow turbine decreases, the Reynolds number correspondingly decreases, mirroring the trend of the rotor inlet hydraulic diameter. Hence, the influence of Reynolds number on the performance of micro radial-flow turbine is non-negligible. The subsequent analysis will focus on how the shift to a viscosity-dominated flow regime under low Reynolds numbers fundamentally alters the flow physics. This includes the thickening of boundary layers, the exacerbation of flow separation due to reduced momentum in the near-wall region, and the consequent amplification of secondary flow losses, all of which collectively drive the nonlinear performance degradation observed.
Table 3: Relationship between Reynolds number and scale factor.
| Scaling Factor (SF) | Inlet Hydraulic Diameter | Inlet Mass Flow Rate per Unit Area (kg/m2s) | Inlet Reynolds Number (Re) |
|---|---|---|---|
| 1.6 | 0.0128 | 79.2 | 2.18 × 10⁴ |
| 1.3 | 0.0104 | 79.2 | 1.77 × 10⁴ |
| 1.0 | 0.008 | 79.2 | 1.36 × 10⁴ |
| 0.7 | 0.0056 | 79.2 | 9.52 × 10³ |
| 0.4 | 0.0032 | 79.2 | 5.44 × 10³ |
4.2 Effect of Reynolds Number on Output Performance
The results demonstrate that reduced Reynolds numbers induce a systematic deterioration in total-to-static efficiency, an effect particularly pronounced under conditions of low rotational speed and high expansion ratio. This performance degradation is primarily attributable to augmented viscous losses and enhanced flow separation, as will be elaborated subsequently. As illustrated in Fig. 11, which depicts the influence of Reynolds number on micro radial-flow turbine performance, the distributions of total-to-static efficiency and mass flow rate are presented as functions of the expansion ratio. Across the range of rotational speeds investigated, the general trends in total-to-static efficiency for turbines with different scaling factors remain consistent. Specifically, at 60% of the nominal rotational speed, the efficiency declines rapidly with increasing pressure ratio. Conversely, at 80% and 100% of the nominal speed, the efficiency initially increases before gradually decreasing after reaching an optimum point. This indicates that the Reynolds number does not alter the fundamental characteristic trend of the total-to-static efficiency curve. However, a clear systematic effect is observed: as the scaling factor decreases, corresponding to lower Reynolds numbers, the total-to-static efficiency progressively declines across the operational range. This systematic reduction is a direct consequence of intensified viscous effects within the flow passage under low Reynolds number conditions. The thickened boundary layer reduces the effective flow area and, with its lower momentum, becomes more prone to separate on the suction surface, constituting a primary loss mechanism. With increasing pressure ratio, the disparity in total-to-static efficiency among turbines of different scaling factors tends to widen, yet this disparity diminishes progressively as the rotational speed increases. This indicates that at lower Reynolds numbers, the influence on total-to-static efficiency becomes more pronounced. As illustrated in the figure, across different rotational speeds, the mass flow rates for various scaling factors display similar trends, generally increasing with rising pressure ratio. This suggests that Reynolds number exerts minimal influence on the overall trend of mass flow rate variation. As the scaling factor decreases, the Reynolds number declines, leading to increased boundary layer thickness on the blade surfaces and reduced passage flow capacity, which in turn lowers the mass flow rate. This reduction becomes more pronounced at higher rotational speeds and follows a similar trend to that of the pressure ratio.
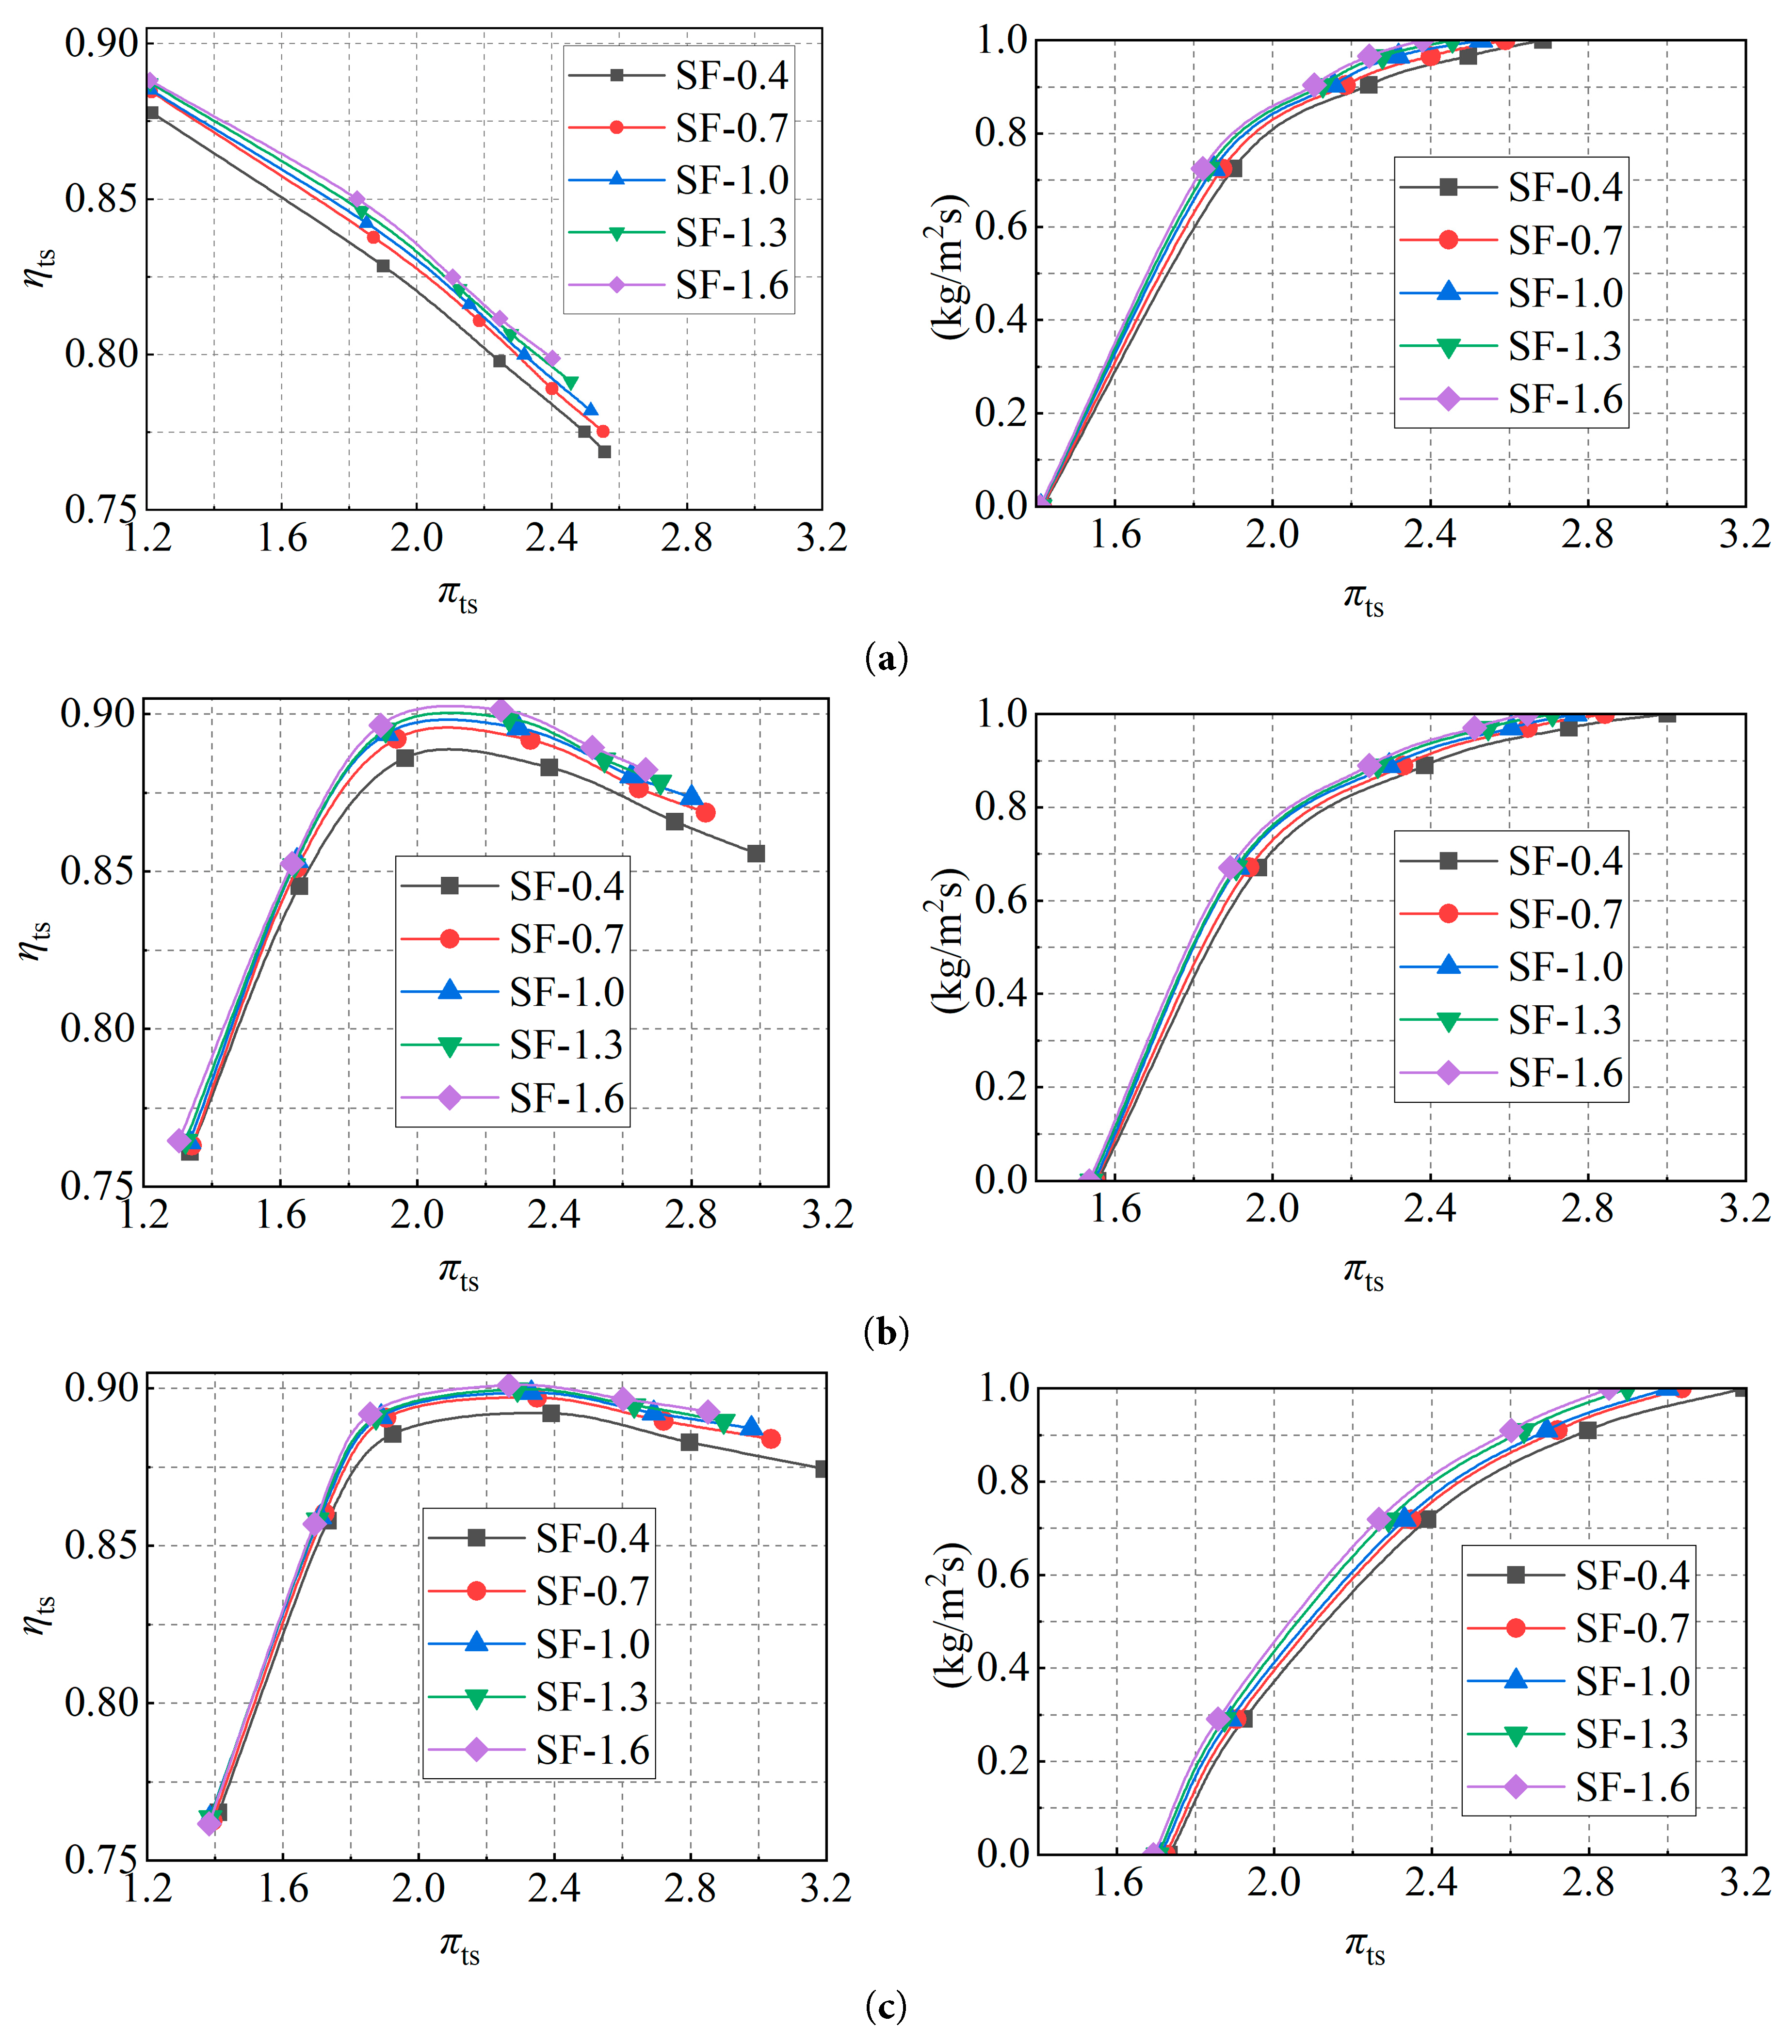
Figure 11: Effect of Reynolds number on performance of MGT. (a) Speed of 60%; (b) Speed of 80%; (c) Speed of 100%.
4.3 Effect of Reynolds Number on Flow Similarity
The flow similarity under varying Reynolds numbers is assessed through expansion ratio deviations and Mach number distributions. The analysis reveals that lower Reynolds numbers exacerbate deviations from ideal similarity, primarily due to enhanced viscous effects.
As illustrated in Fig. 12, at a constant turbine inlet mass flux per unit area, the expansion ratio of the turbine decreases as the Reynolds number increases. At varying pressure ratios, the percentage deviation of the turbine expansion ratio for other scaling factors relative to SF = 1.0 progressively increases as the Reynolds number rises. According to the total-to-static efficiency formulation for radial-flow turbine, an increase in the expansion ratio results in a decrease in efficiency. The total-to-static efficiency formulation for a radial-flow turbine is defined as the ratio of the actual work output to the isentropic work available between the inlet total conditions and the exit static pressure [24], an increase in the expansion ratio results in a decrease in efficiency. Consequently, as the scaling factor decreases, the efficiency of the micro radial-flow turbine progressively declines. Consequently, as the scaling factor decreases, the efficiency of the micro radial-flow turbine progressively declines.
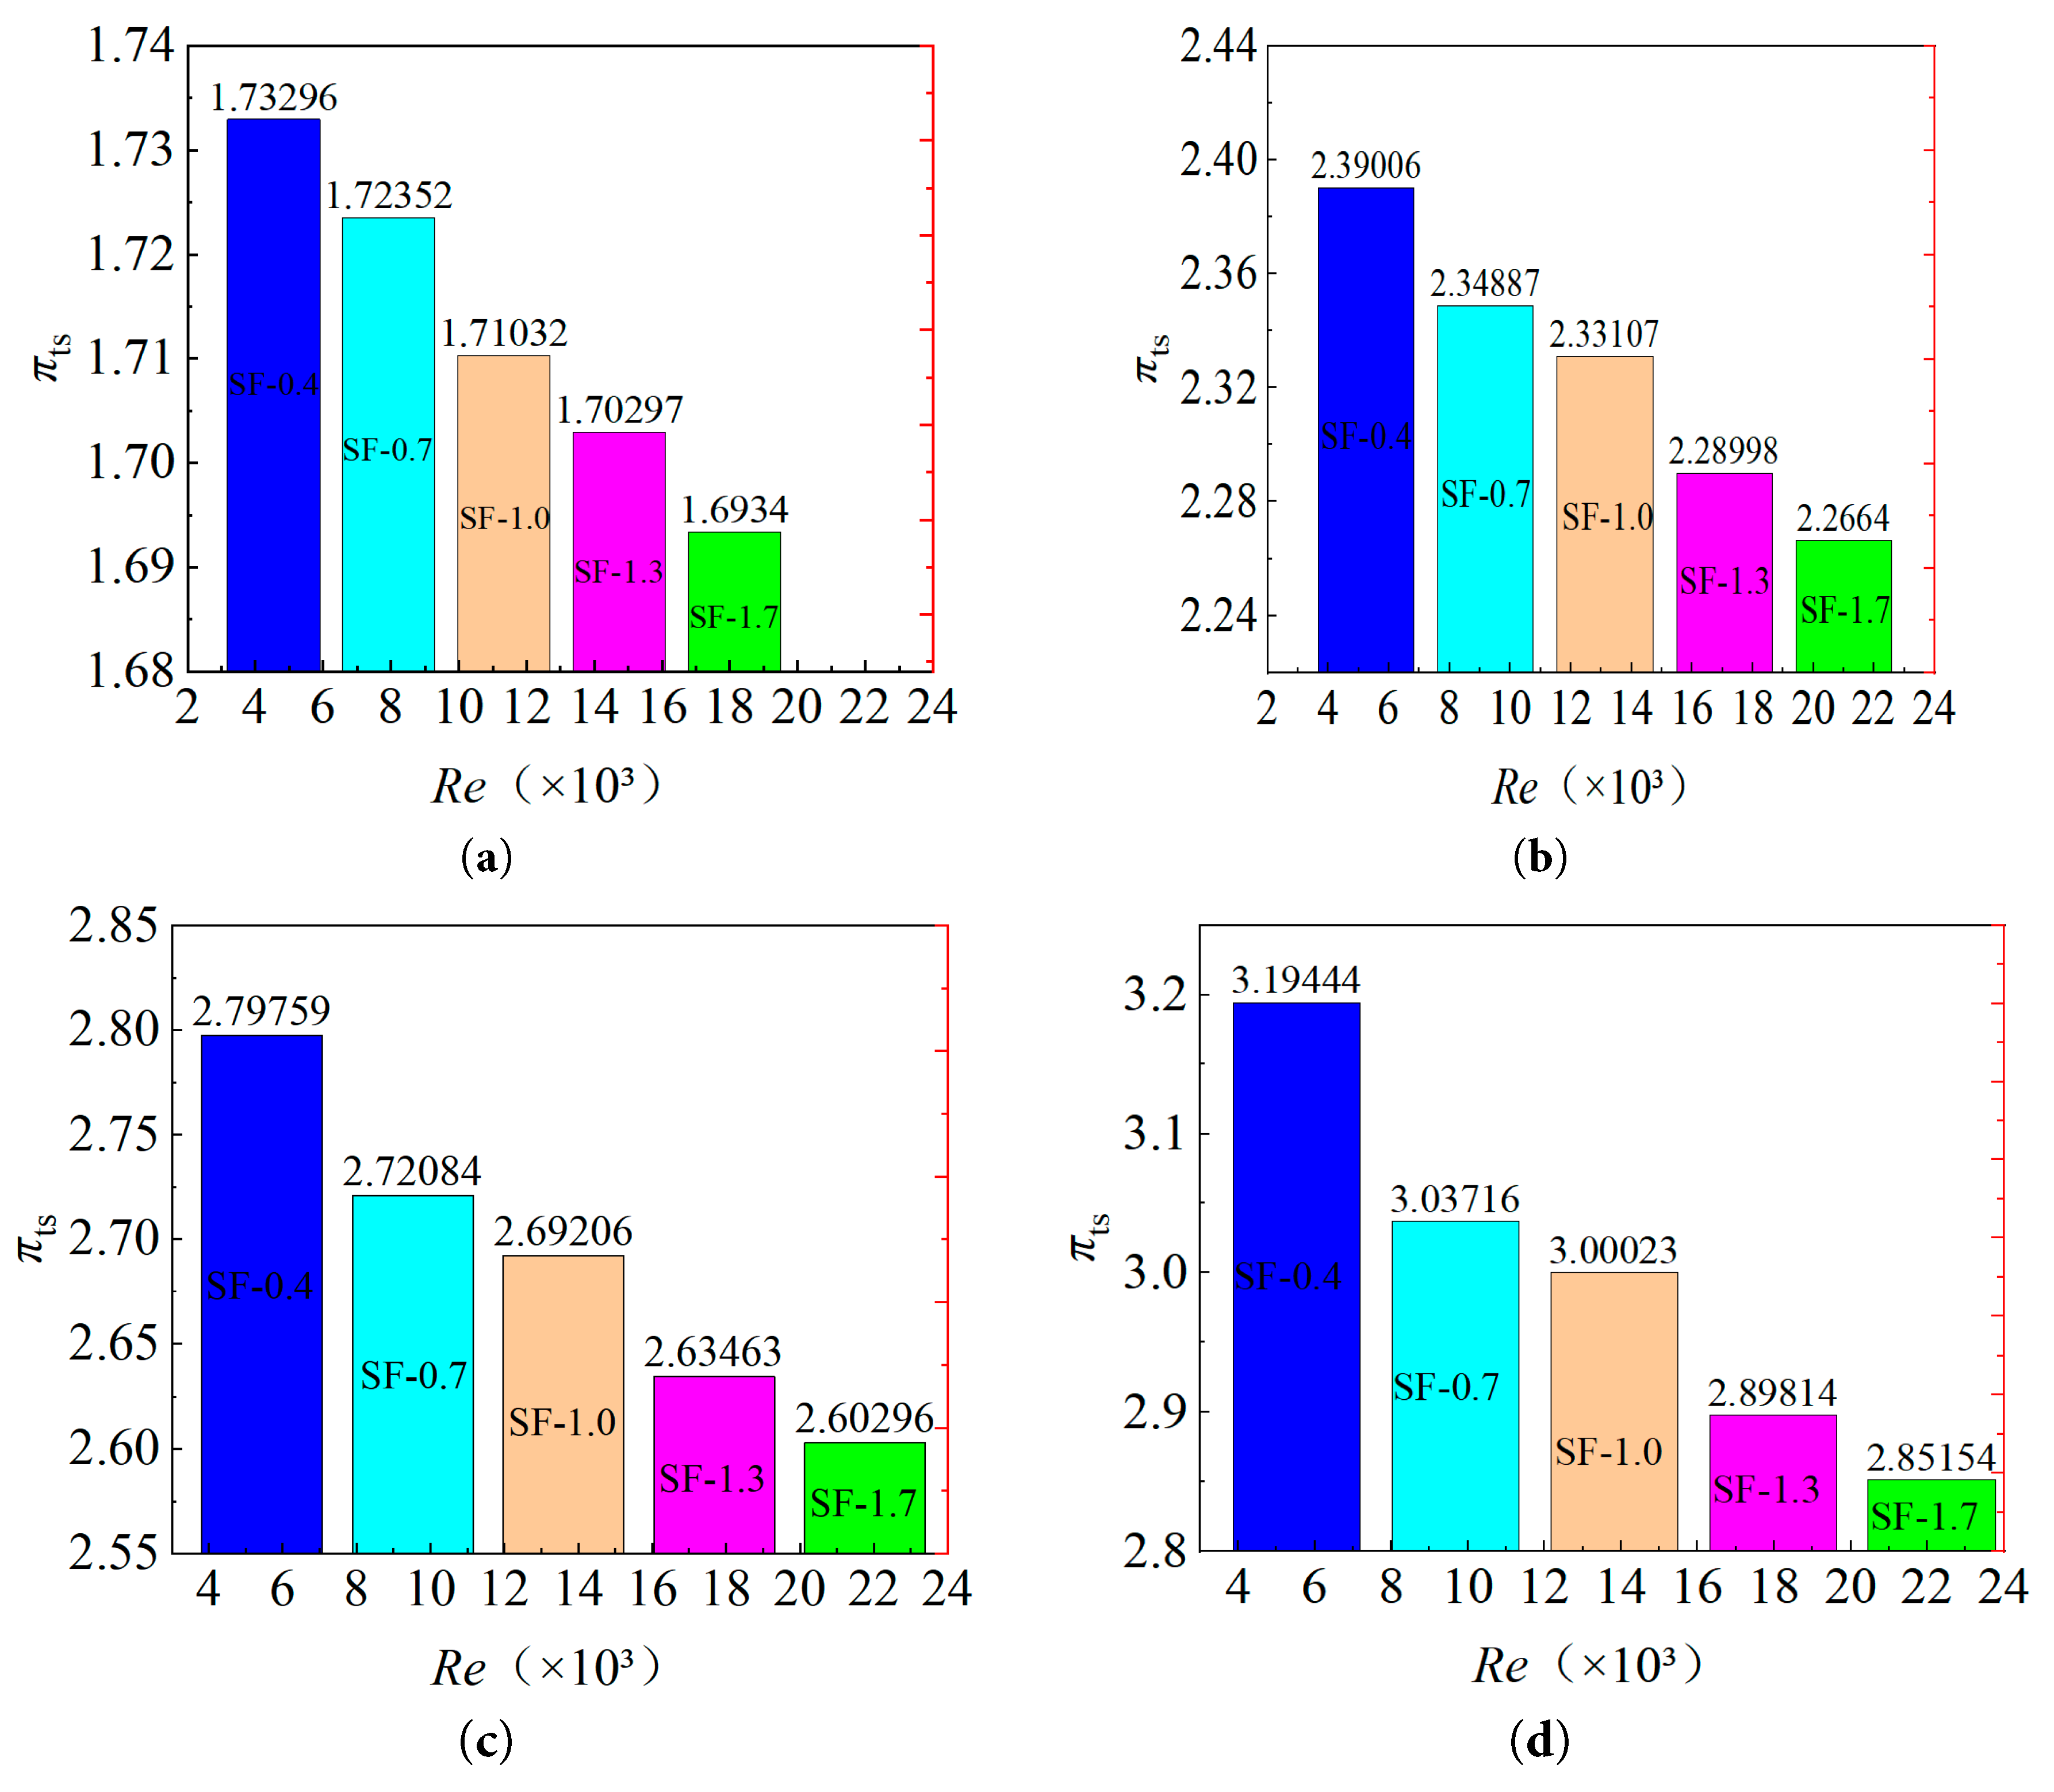
Figure 12: Effect of Reynolds number on expansion ratio (100% speed). (a) expansion ratio πts = 2.0; (b) expansion ratio πts = 2.5; (c) expansion ratio πts = 3.0; (d) expansion ratio πts = 3.5.
Fig. 13 illustrates the effect of Reynolds number on the Mach number in Meridional channel various rotational speeds. The analysis considers scaling factors SF = 0.4, 1.0, and 1.6, at rotational speeds of 60%, 80%, and 100% of the design speed. With increasing scaling factor, the overall Mach number tends to decrease, and the disparity in Mach number among different scaling factors diminishes with higher rotational speeds, indicating that the influence of Reynolds number on rotor Mach number gradually weakens as speed increases. In accordance with the similarity principles of radial-flow turbine, smaller Mach number differences between models correspond to more closely matched aerodynamic characteristics. Hence, the influence of Reynolds number on the performance of micro radial-flow turbine is expected to weaken at higher rotational speeds, corroborating the findings presented in Section 4.1. These deviations in flow similarity stem from fundamental changes in the internal velocity and pressure fields under low Reynolds number conditions. The root cause of these changes—the altered blade loading distribution—is analyzed next in Section 4.4. The figure further indicates that high Mach number (HMN) regions occur at the rotor throat, and as rotational speed increases, these regions progressively migrate from the blade root toward the blade tip, accompanied by a reduction in Mach number. This behavior is attributed to the reduction in mass flow rate with increasing rotational speed at a constant expansion ratio.
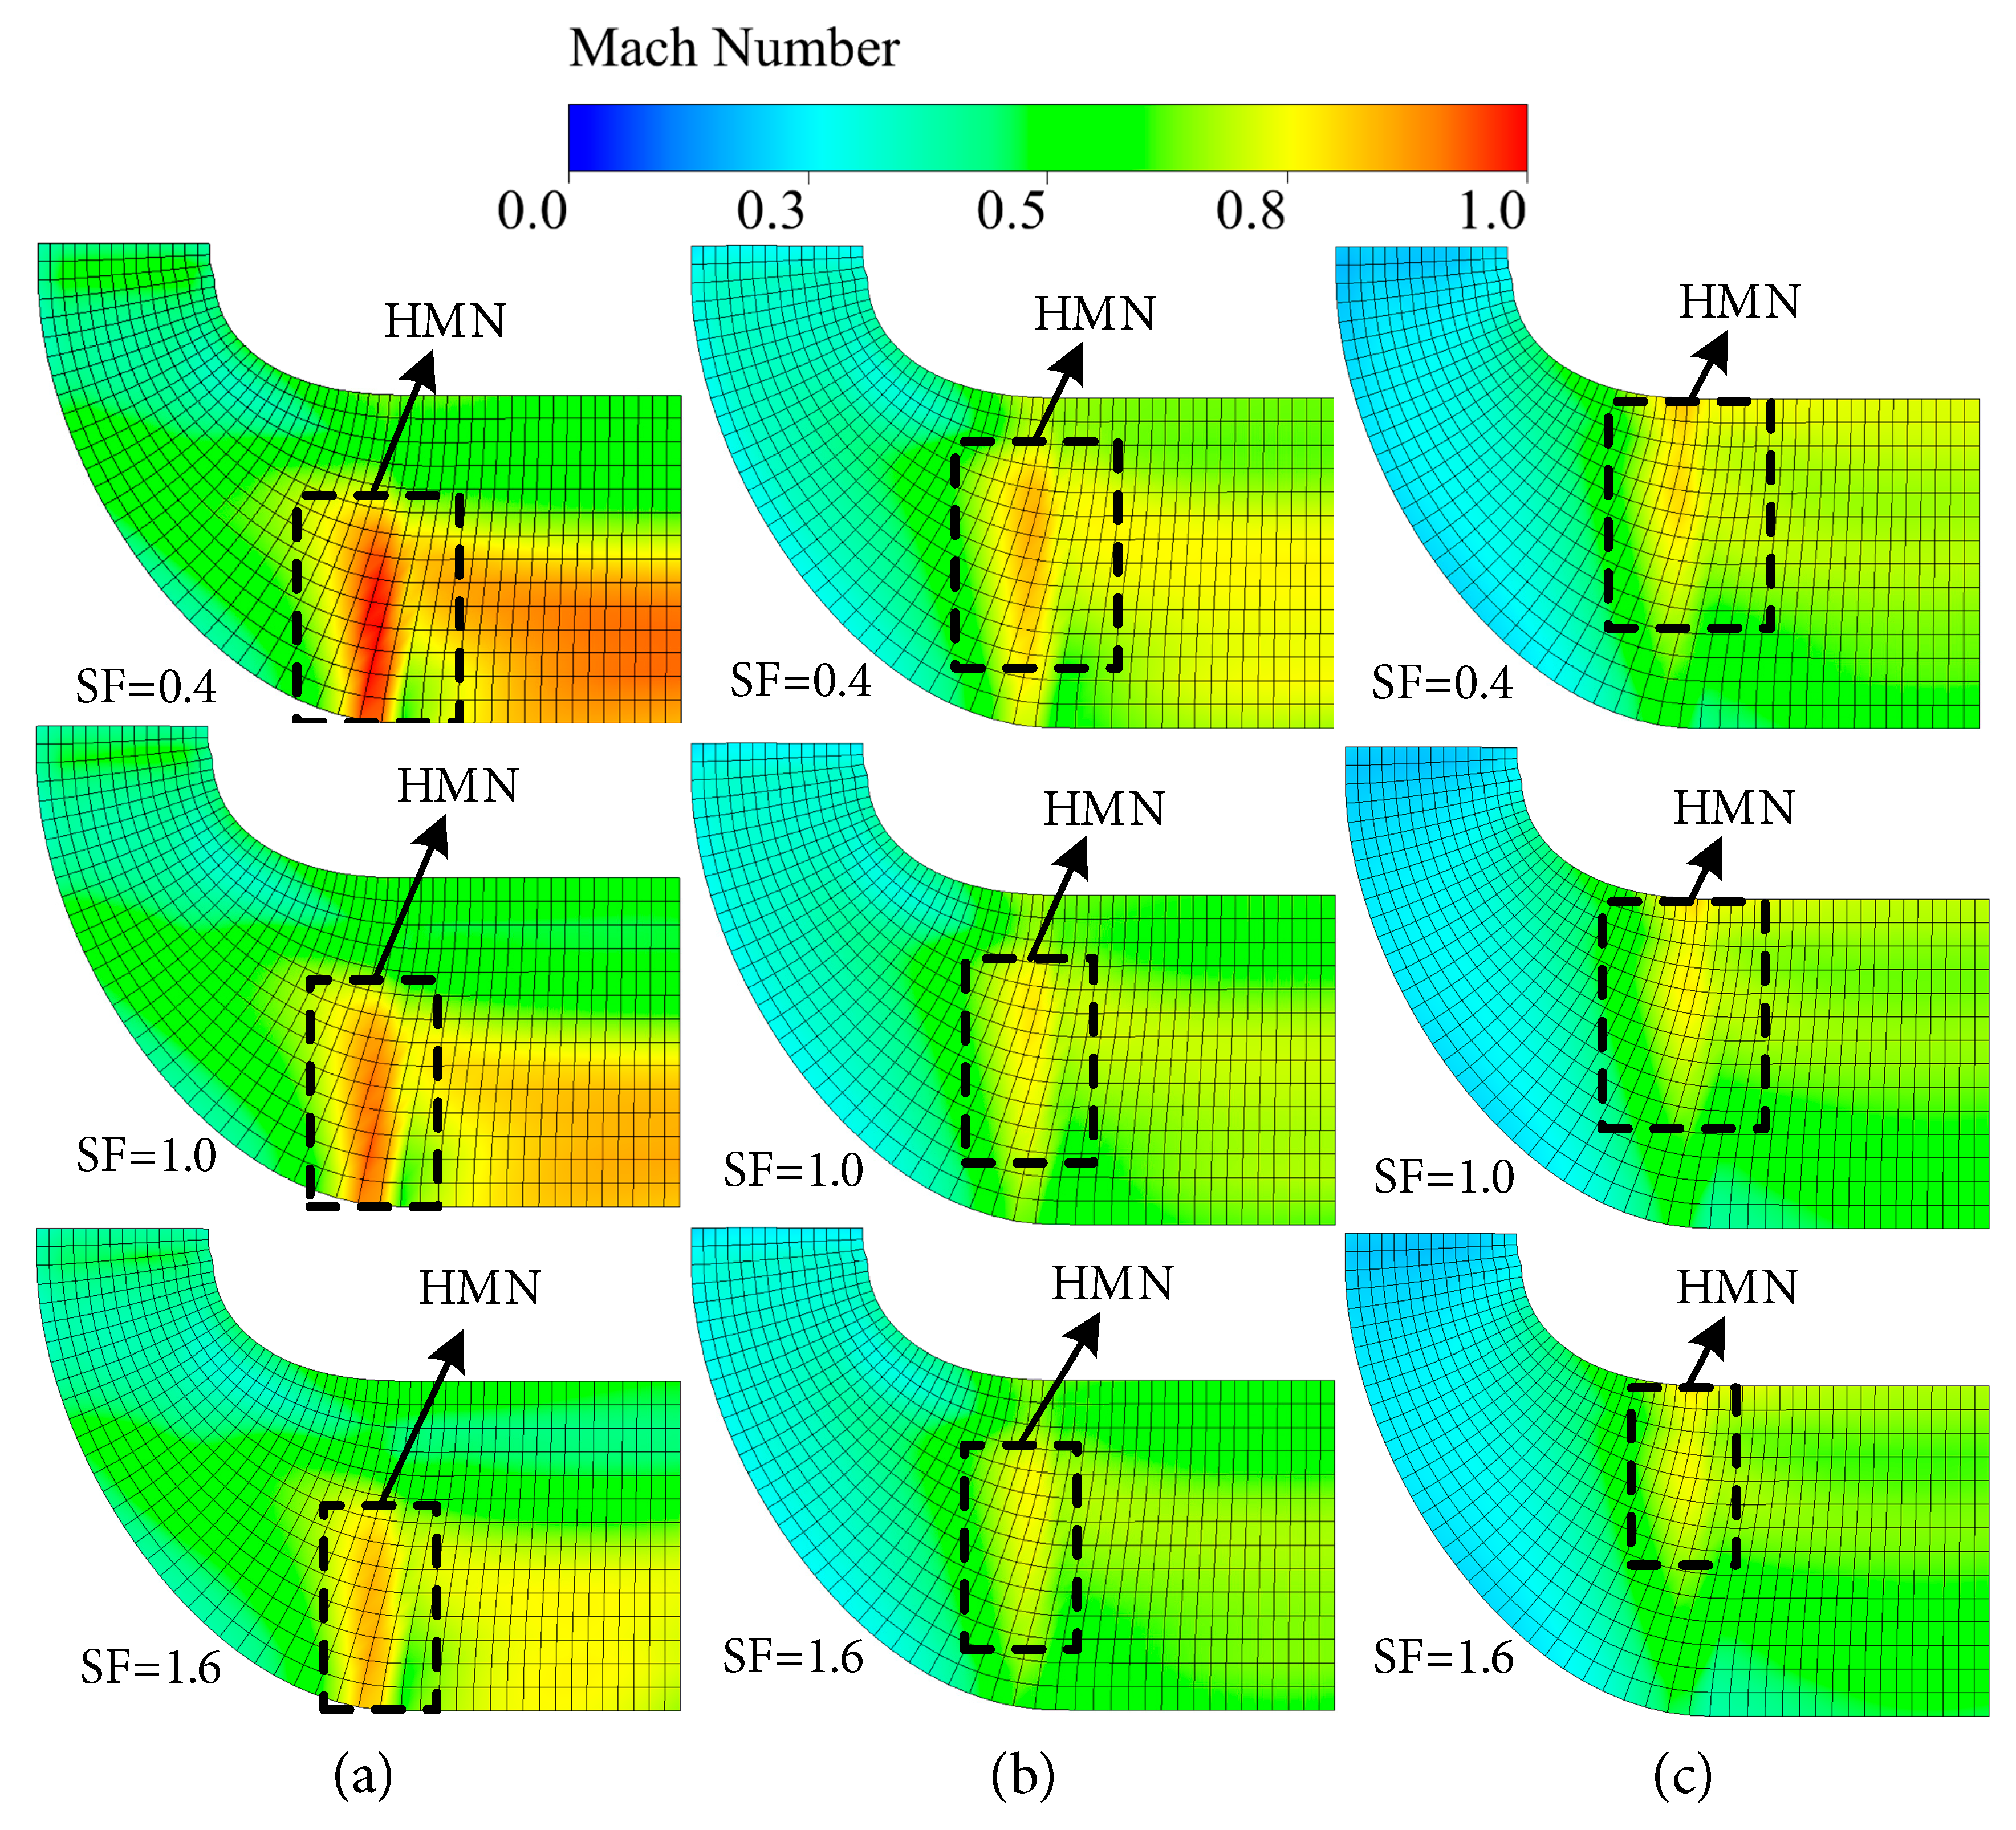
Figure 13: Effect of Reynolds number on Mach number in Meridional channel (πts = 3.0). (a) Speed of 60%; (b) Speed of 80%; (c) Speed of 100%.
Fig. 14 illustrates the influence of Reynolds number on the Mach number distribution at 50% span height of the rotor blades across various rotational speeds. The scaling factors and rotational speeds analyzed are identical to those in Fig. 9, and the trends of Mach number variation with scaling factor and rotational speed remain consistent with the previous observations. With increasing scaling factor, the separation zone (SZ) on the suction surface of the rotor blades tends to shrink, whereas it enlarges at lower rotational speeds, mainly near the blade leading edge. This phenomenon significantly reduces the efficiency of the micro radial-flow turbine: a lower Reynolds number causes an expansion of the leading-edge separation zone on the blade suction surface, and the impact of this effect lessens as the rotational speed increases.
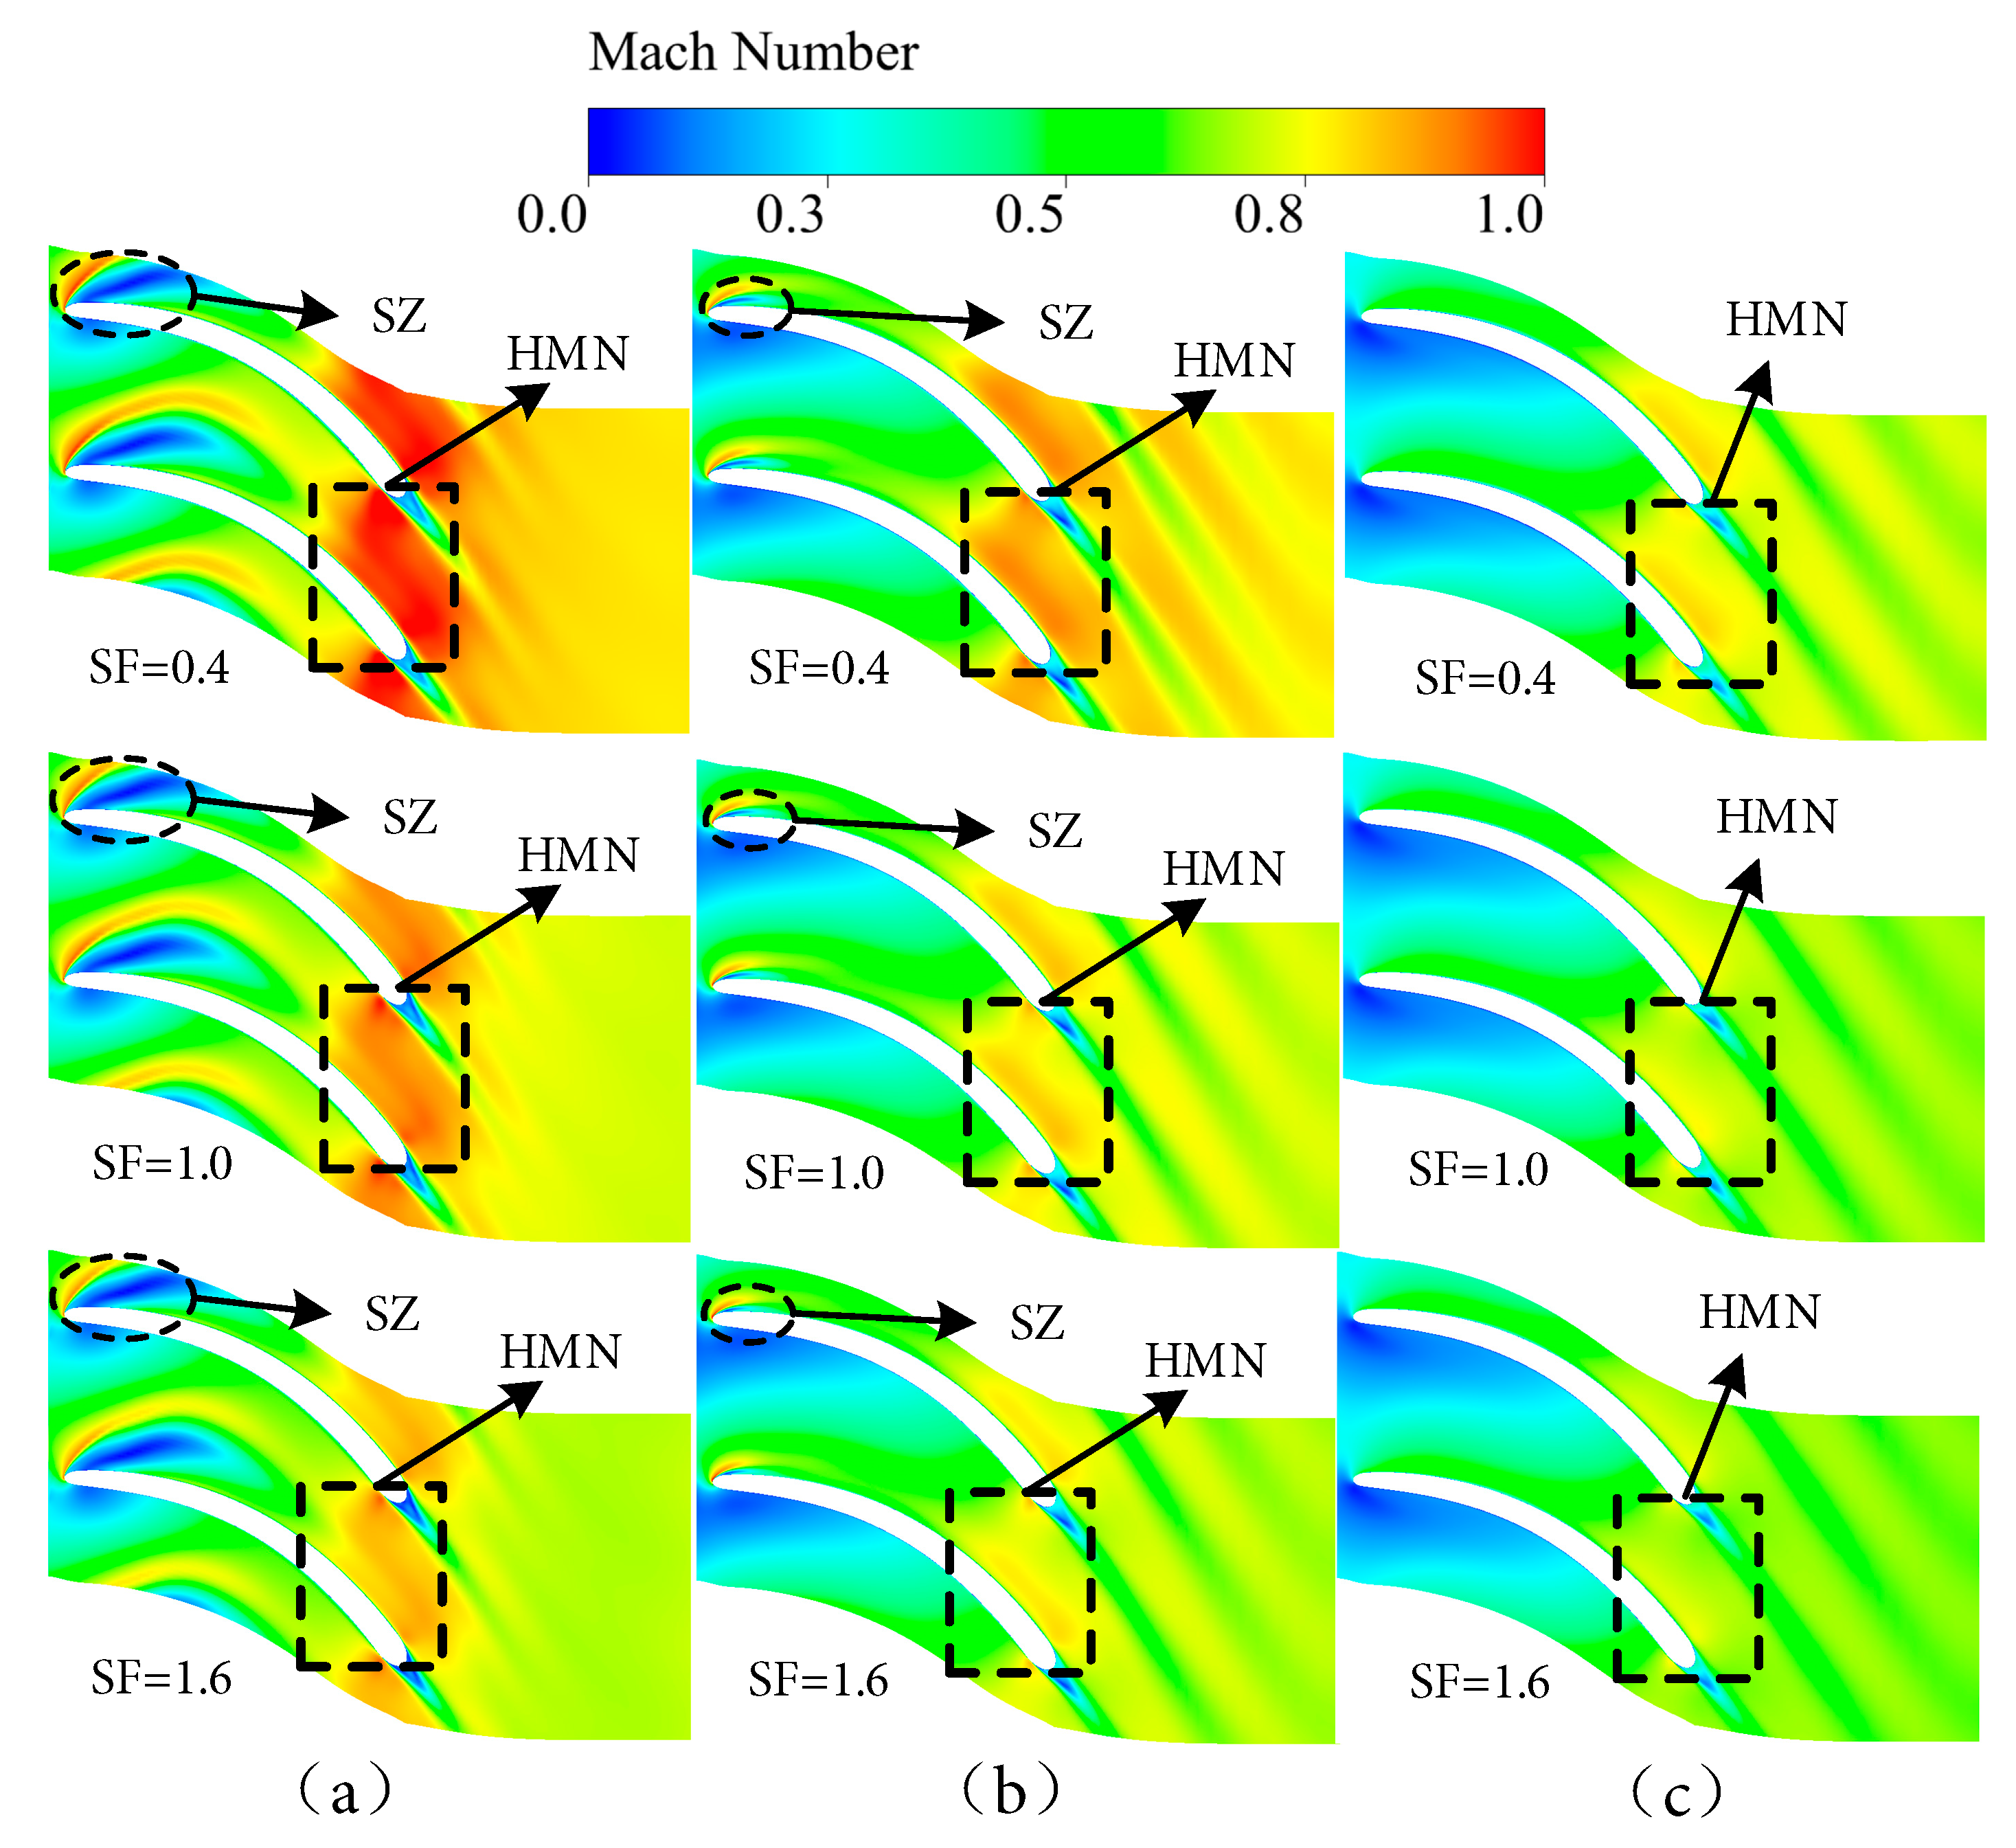
Figure 14: Effect of Reynolds number on Mach number distribution at 50% span (πts = 3.0). (a) Speed of 60%; (b) Speed of 80%; (c) Speed of 100%.
Fig. 15 illustrates the Mach number distribution along the flow path inside the rotor passage at various Reynolds numbers. The Mach number distribution along the passage exhibits similar patterns across different scaling factors, suggesting that Reynolds number exerts only a limited influence on the overall distribution trend. As the scaling factor SF increases, the Mach number within the rotor passage gradually rises, and this increase becomes progressively more significant from the inlet to the outlet. Moreover, the impact of Reynolds number on the Mach number distribution inside the passage diminishes as the rotational speed increases.
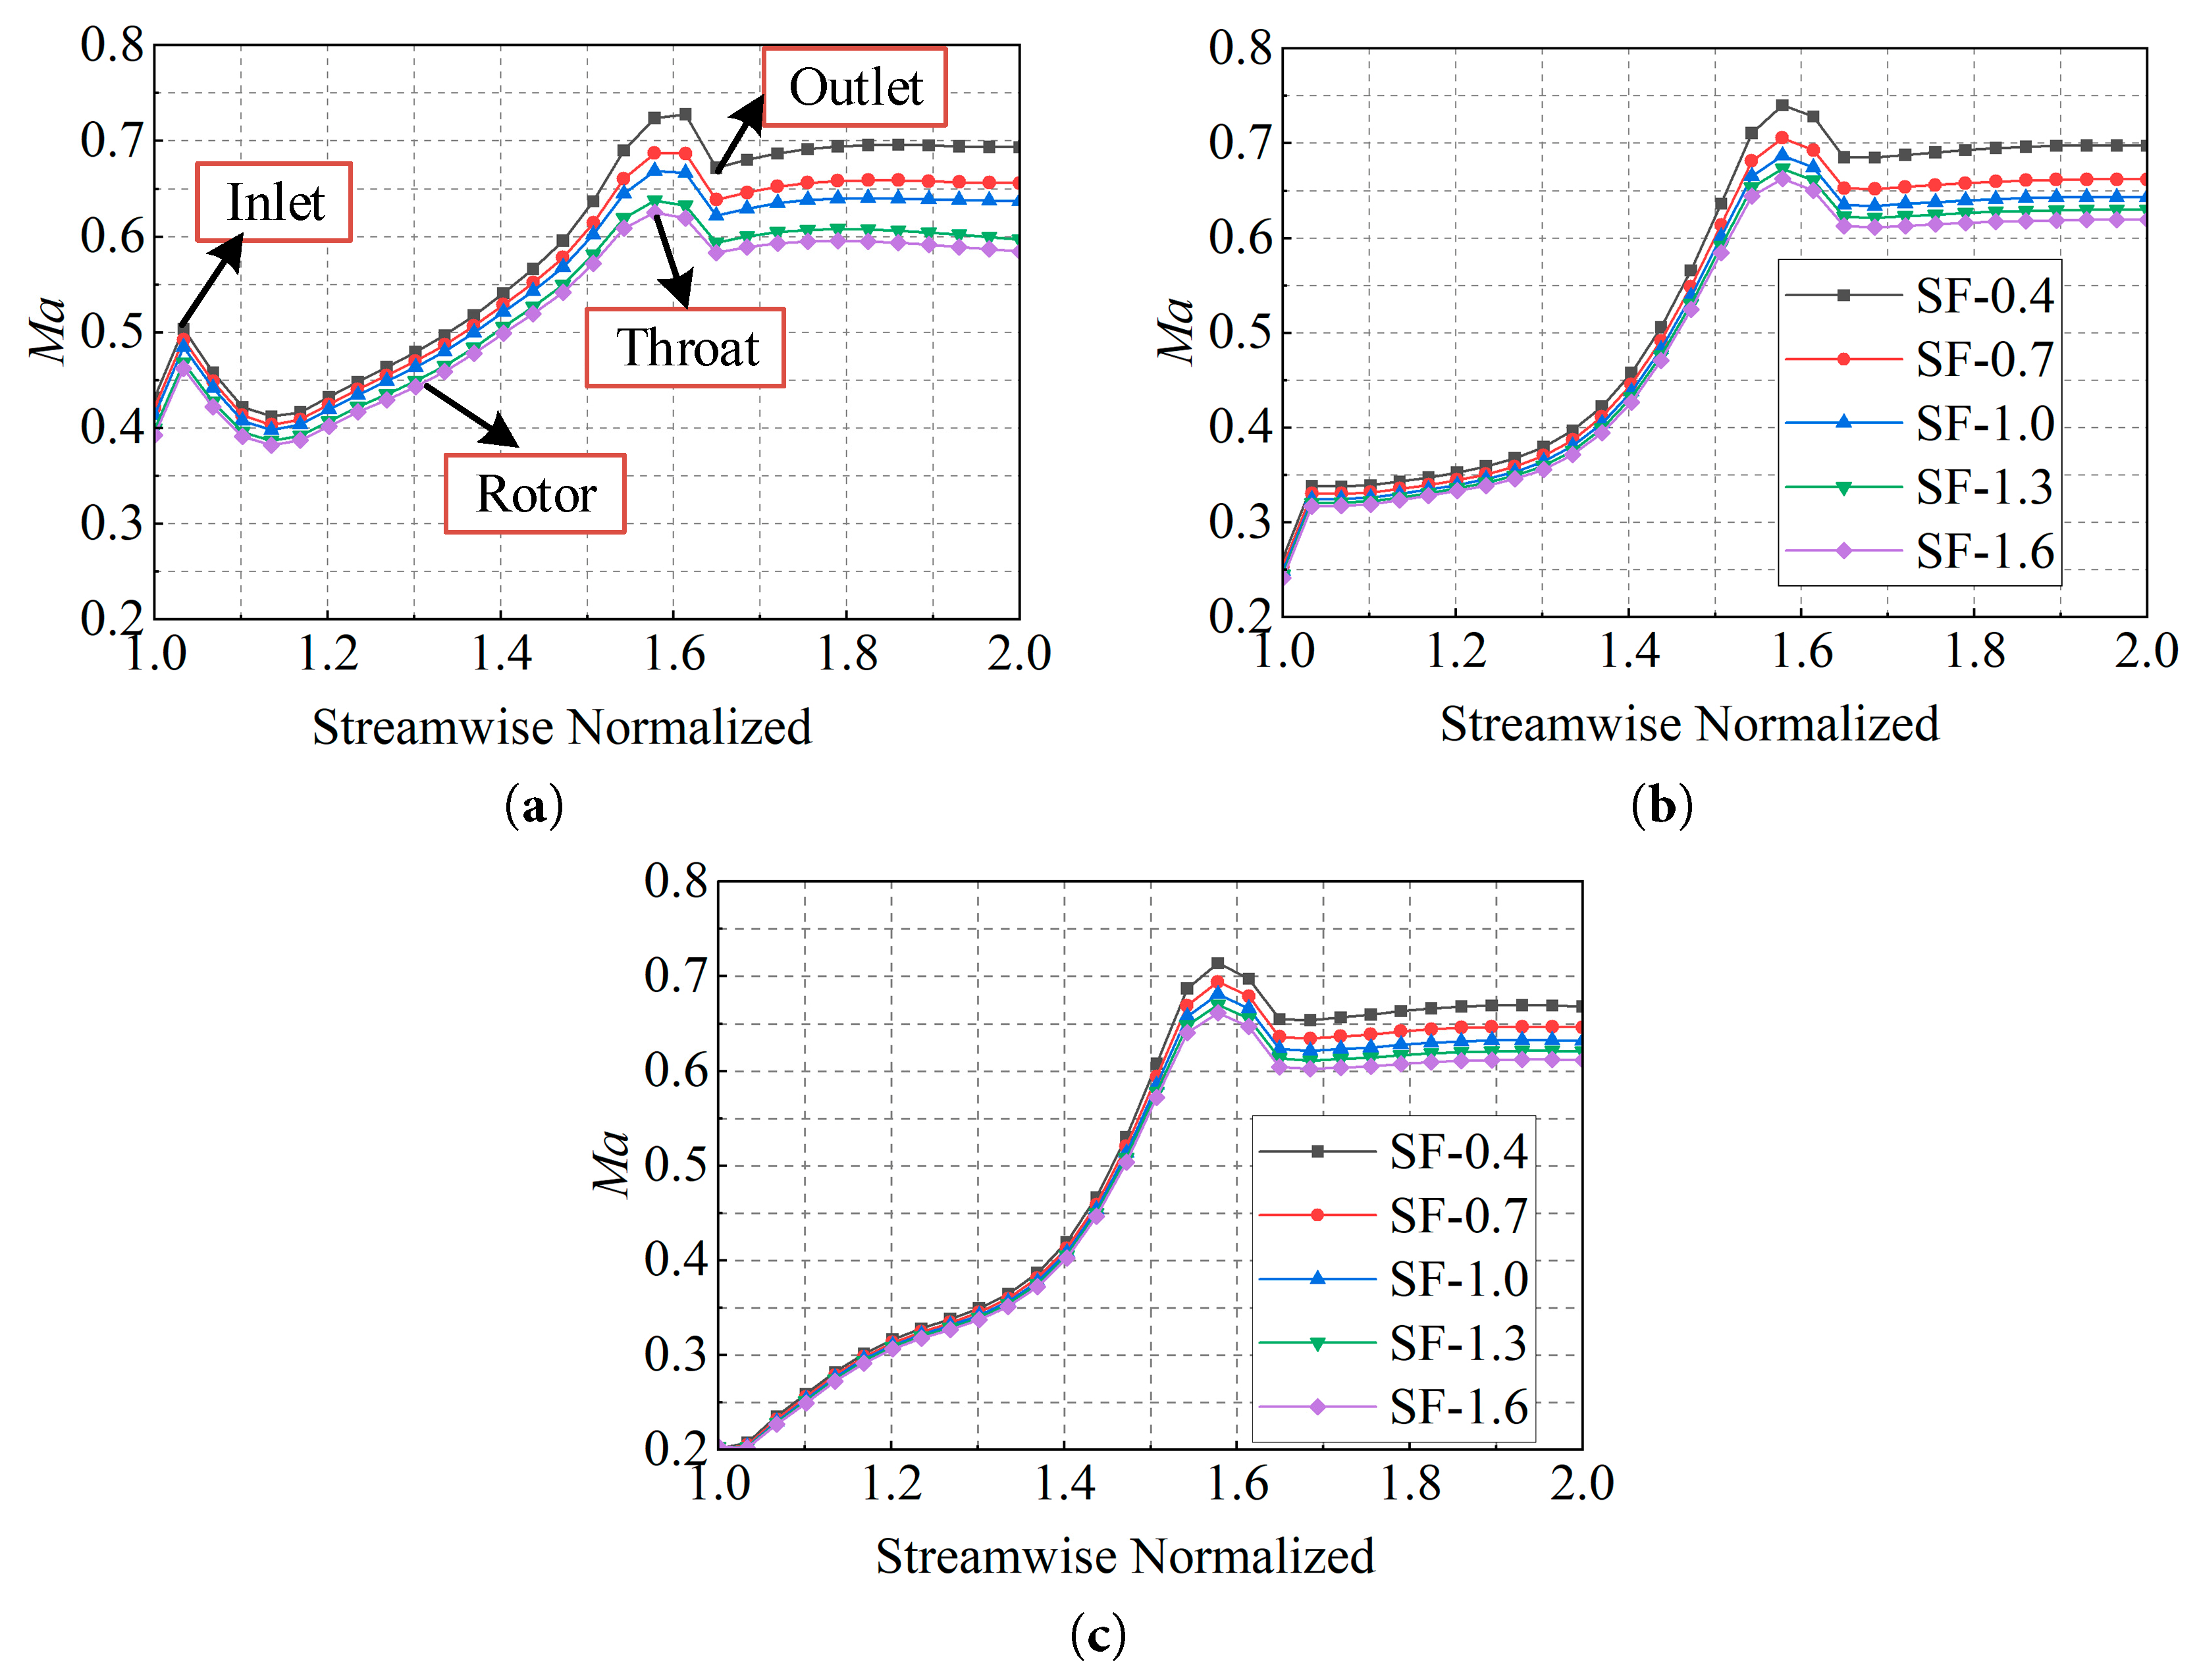
Figure 15: Mach number distribution of rotor at different Reynolds numbers (πts = 3.0). (a) at speed of 60%; (b) at speed of 80%; (c) at speed of 100%.
4.4 Effect of Reynolds Number on Blade Loading Distribution
As the Reynolds number decreases, viscous forces exert a progressively stronger influence on the flow field, leading to an increase in boundary layer thickness on the blade surfaces, which in turn alters the blade loading distribution. The isentropic Mach number, isentropic Mach number Maisentropic, corresponds to the Mach number in an ideal, lossless flow, assuming smooth, frictionless walls, and can be determined using the following equation,
Fig. 16 presents the isentropic Mach number distributions along the blade surfaces at three representative spanwise locations—namely, Span = 0.1, 0.5, and 0.9—for a series of scaling factors (SF). The comparative results reveal that although the overall shape and trends of the Mach number distributions remain broadly consistent across different scaling factors, a systematic reduction in SF induces a discernible upward shift in Mach number levels on both the pressure and suction surfaces. This elevation becomes progressively more pronounced as SF decreases, indicating a clear sensitivity of the aerodynamic loading to scale reduction. Notably, the magnitude of the increase is consistently more substantial on the pressure surface compared to the suction surface, where the rise is comparatively moderated. This differential amplification of Mach numbers between the two surfaces signifies that under low Reynolds number conditions, the transverse pressure gradient across the blade passage is intensified relative to high Reynolds number operations. This heightened pressure gradient constitutes a primary driving mechanism for secondary flow development within the passage of micro radial-flow turbines. Consequently, the strengthened secondary flows inevitably lead to an augmentation of associated loss mechanisms, thereby adversely affecting turbine performance. This process is identified as a key contributor to the degradation of efficiency observed in micro radial-flow turbines operating at low Reynolds numbers. Furthermore, the disparity in Mach number distributions among various scaling factors exhibits a span-dependent behavior: the variations become increasingly marked with greater span height. This trend implies that the influence of Reynolds number effects on the blade loading distribution is not uniform along the span and is particularly accentuated in the tip region. Thus, the blade tip section demonstrates a heightened sensitivity to scaling, underscoring the critical role of Reynolds number in defining the endwall aerodynamics and loss generation in scaled turbine configurations.
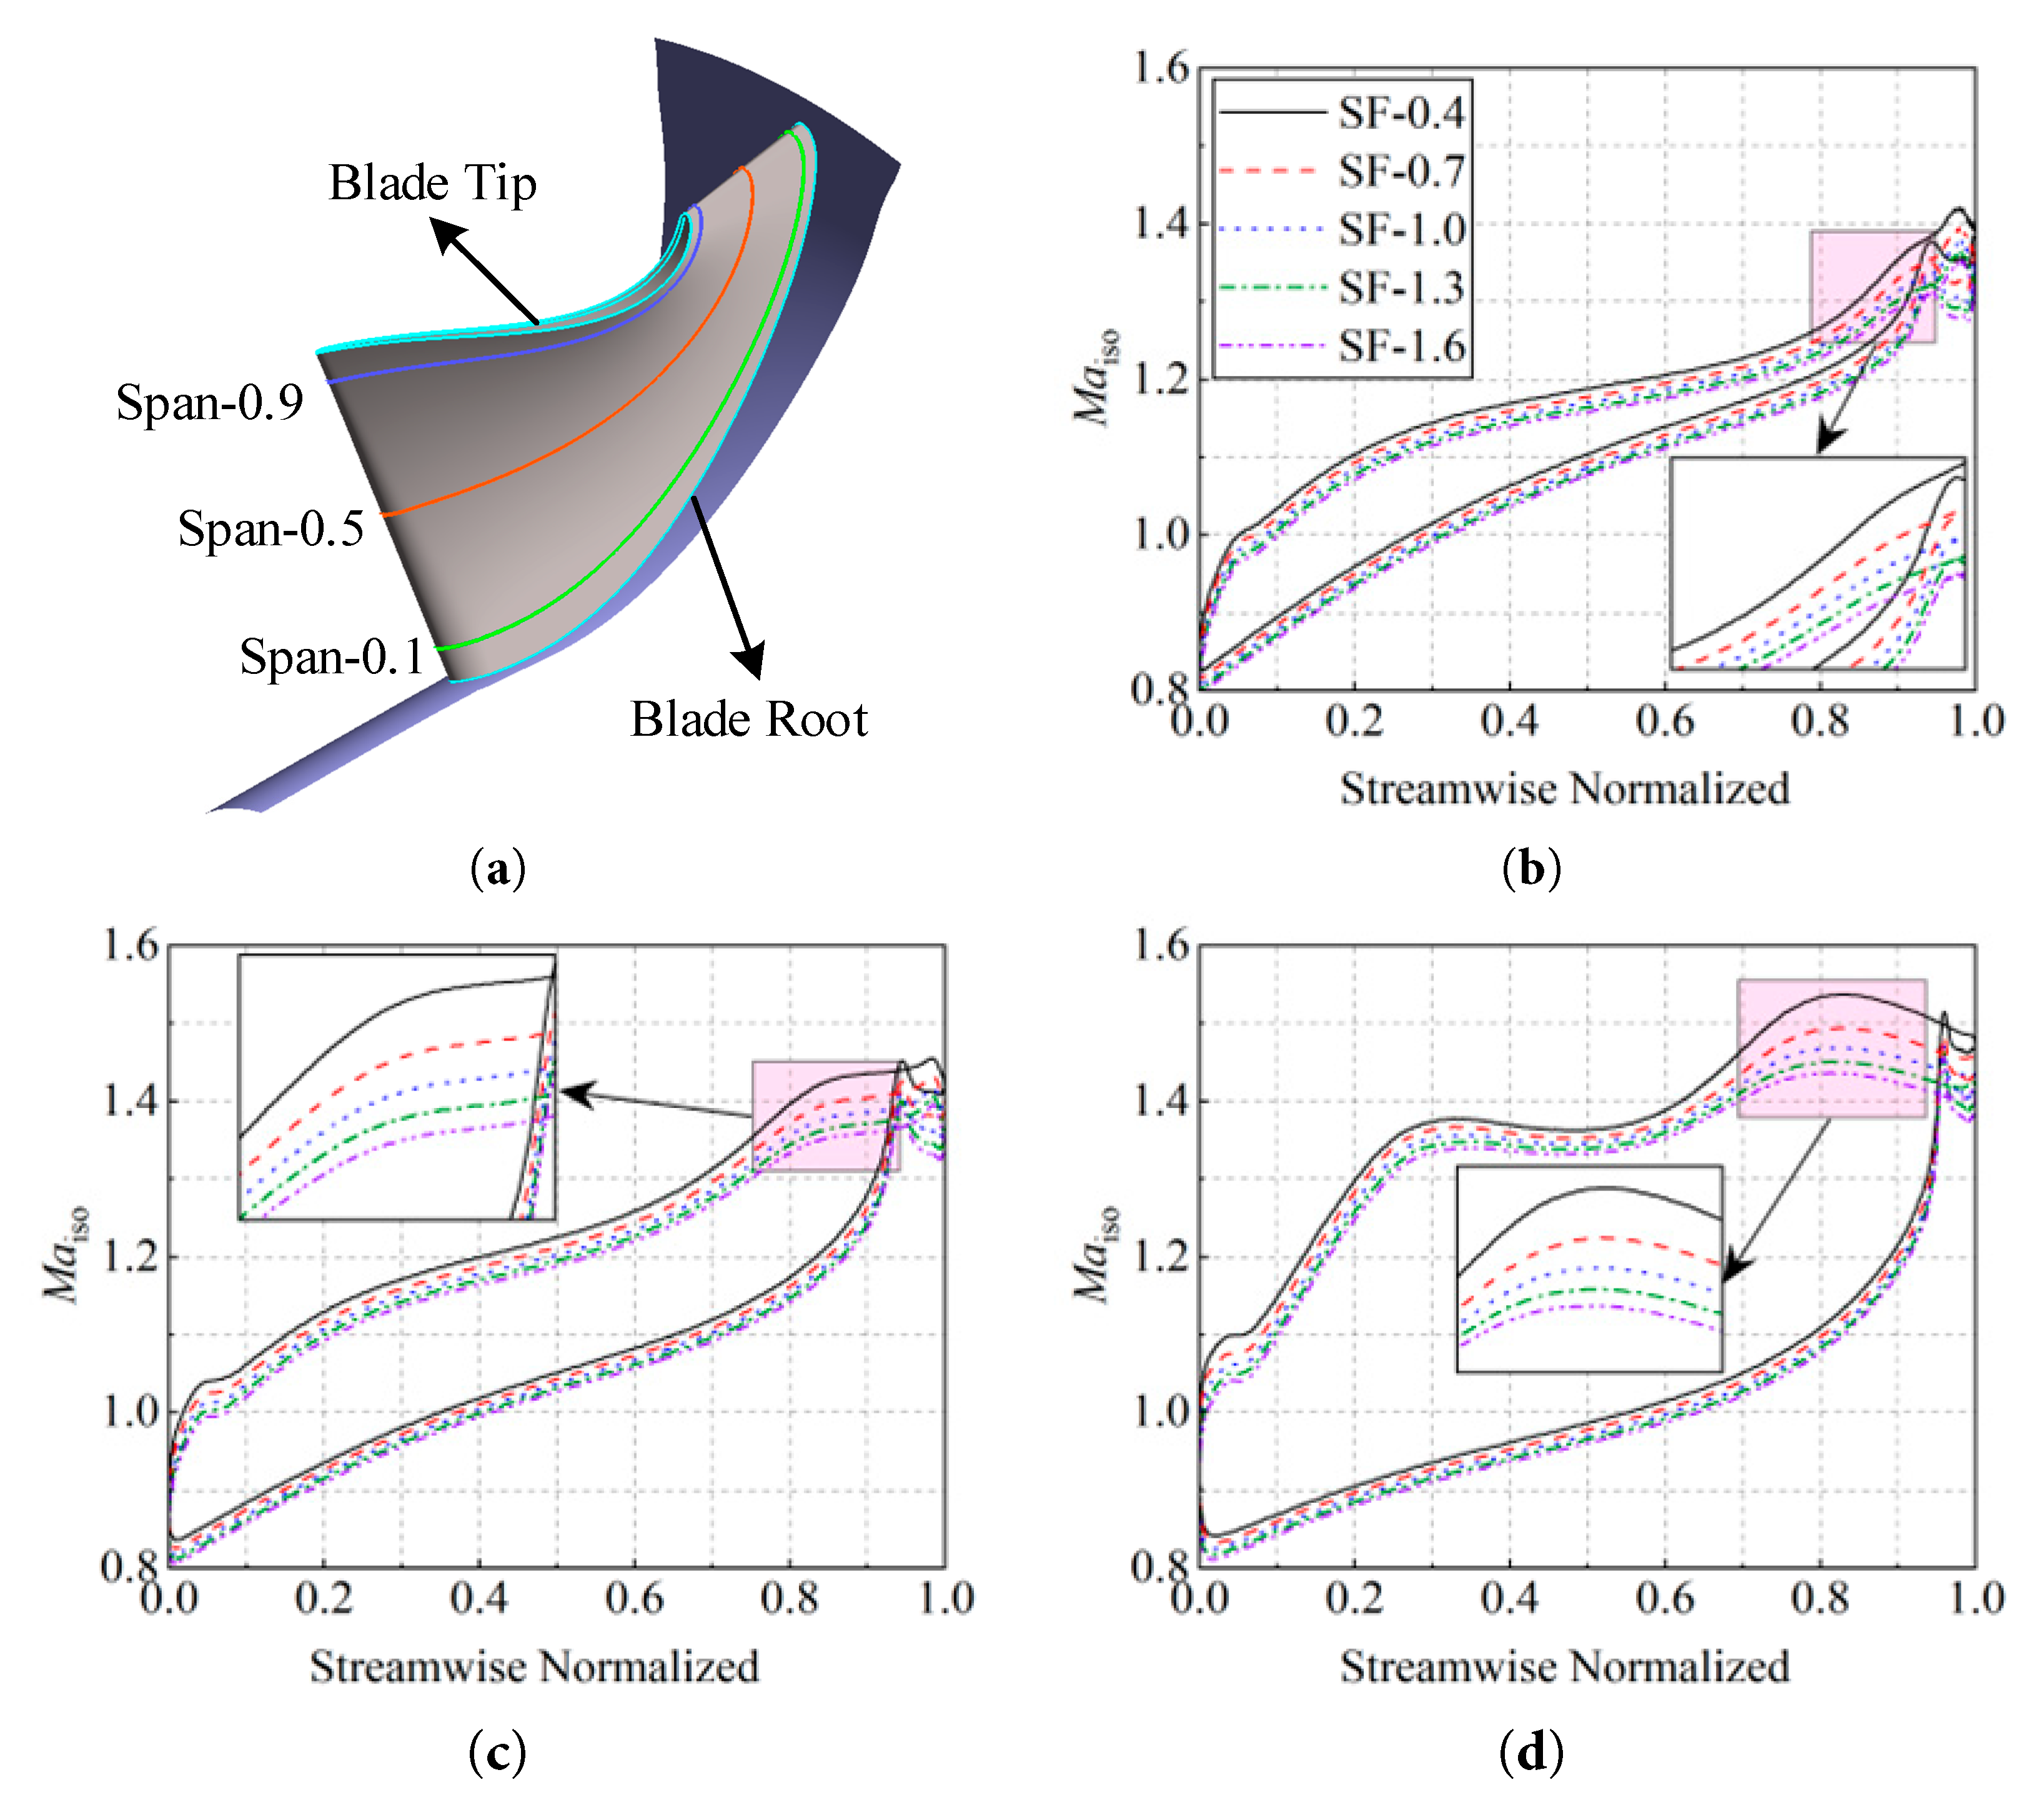
Figure 16: Isentropic Mach number distribution of blade at different Reynolds numbers (πts = 3.0). (a) location of different span heights; (b) Span = 0.1; (c) Span = 0.5; (d) Span = 0.9.
Fig. 17 depicts the pressure distribution along the blade suction surface for various scaling factors (SF) at three distinct rotational speeds. The results demonstrate observable variations in the distribution profiles between different scaling factors under each operating condition. A key feature is that the discrepancy in pressure distribution is more significant near the trailing edge region compared to the leading edge. This spatial trend is directly attributed to the progressively accumulating difference in Mach number along the flow passage from the inlet to the outlet. Furthermore, comparative analysis reveals that the suction surface pressure for SF = 1.6 is elevated relative to that for SF = 0.4. This indicates that a reduction in the Reynolds number, associated with a smaller scaling factor, leads to a corresponding decrease in the static pressure on the blade suction surface.
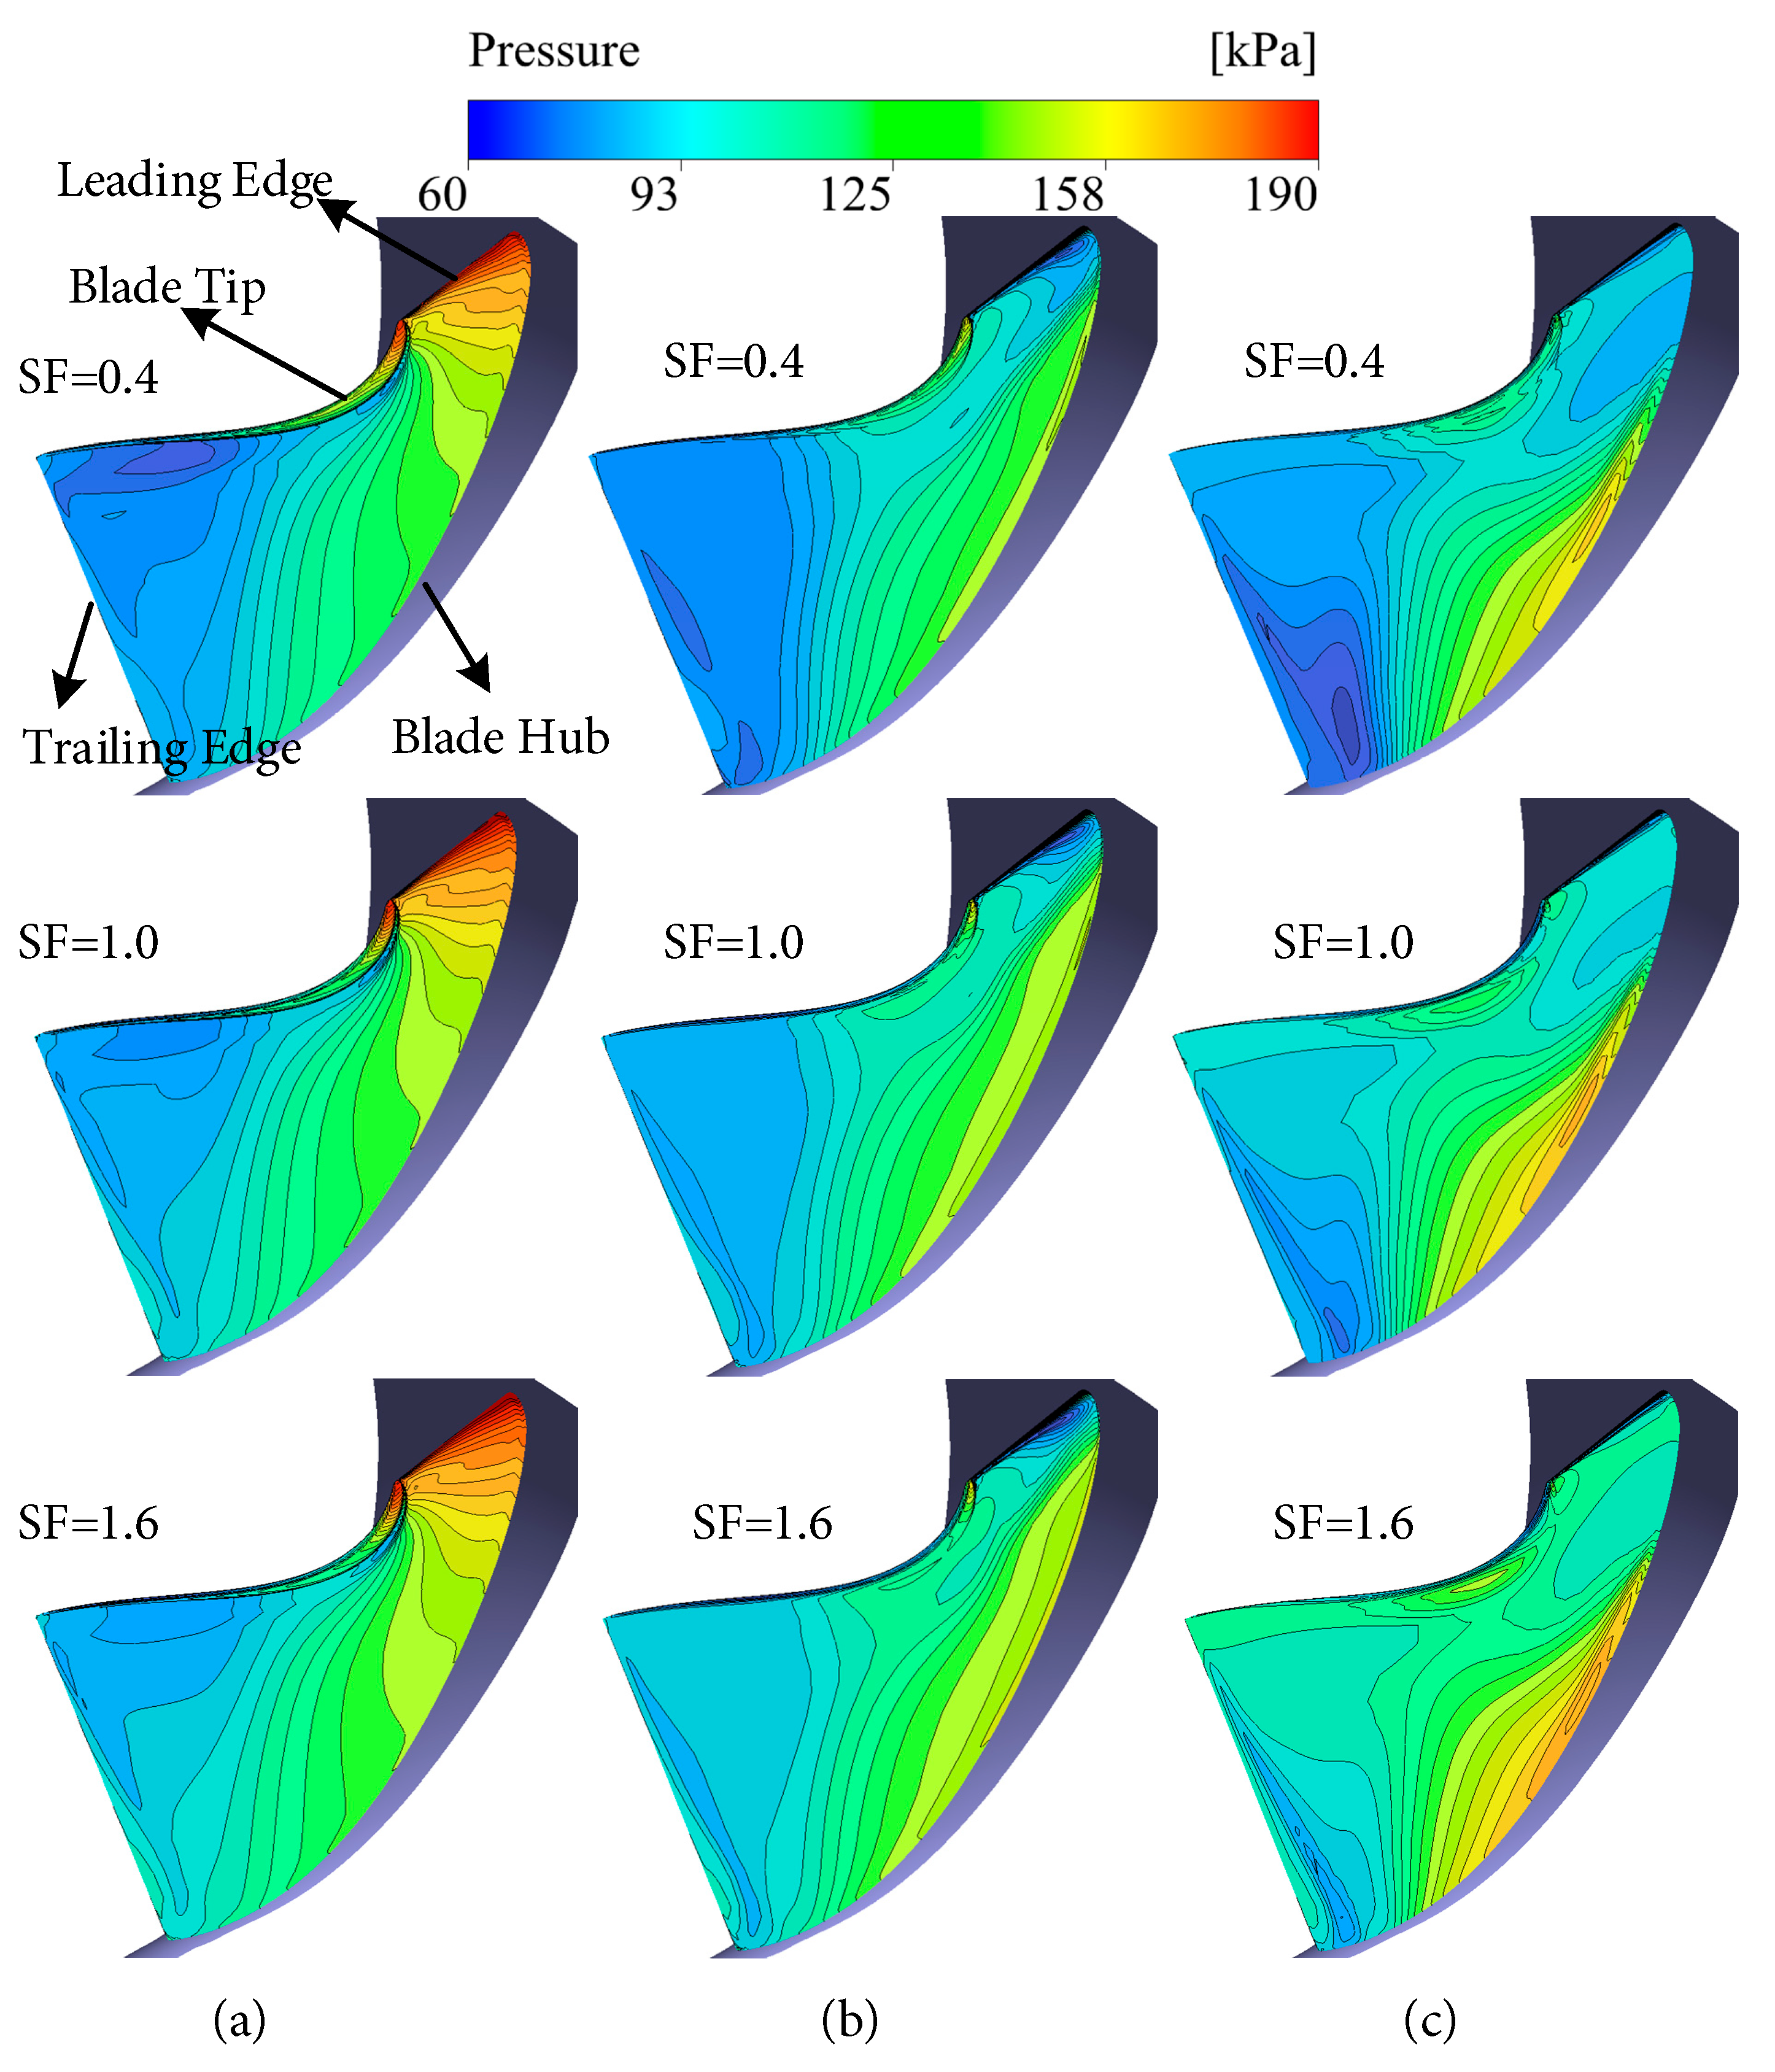
Figure 17: Pressure distribution on suction surface at different Reynolds numbers (πts = 3.0). (a) at speed of 60%; (b) at speed of 80%; (c) at speed of 100%.
This study systematically examines the aerodynamic performance of micro radial-flow turbines under low Reynolds number conditions, providing critical insights for their design in high-altitude and cold environments where conventional similarity principles falter. The combined numerical and experimental approach reveals the mechanisms behind performance loss, directly informing strategies for efficiency preservation in viscosity-dominated flows. The results demonstrate that reductions in Reynolds number markedly degrade turbine performance, primarily due to increased viscous effects that thicken boundary layers, exacerbate flow separation, and amplify secondary flow losses. The key findings are summarized as follows:
- 1.Lower Reynolds numbers cause a pronounced decrease in efficiency, most severe at low speeds and high expansion ratios. This underscores a core design challenge: maintaining performance in viscous-dominated flows. Addressing this may require optimizing blade profiles and flow paths specifically for low-Re conditions to manage boundary layer growth and delay separation.
- 2.The intensification of flow separation on the suction surface, forming leading-edge zones, is a primary loss source. This highlights the need for design features that enhance flow attachment, such as tailored leading-edge geometry or surface treatments that energize the near-wall flow. The weakened effect at higher speeds suggests rotational inertia can be leveraged in operational strategies.
- 3.The altered blade loading and increased transverse pressure gradients under low Re directly amplify secondary flow losses. Therefore, designs must mitigate these losses by controlling end-wall flows and optimizing the three-dimensional blade stacking, particularly near the tip where effects are strongest.
Acknowledgement:
Funding Statement: This research is supported by the Tiangsu Association for Science and Technology (Grant No. JSKX 0225 089).
Author Contributions: The authors confirm contribution to the paper as follows: Writing—Original Draft and Funding Acquisition: Yanzhao Yang; Data Curation: Fengsuo Jiang, Luyi Lu, Hua Ji; Methodology: Sheng Xu; Investigation: Lei Chen, Luyi Lu, Senhao Wang; Formal Analysis, Writing—Review & Editing: Junwei Zhang, Kai Yang; Conceptualization: Jun Bai; Experiment: Haifeng Zhai, Zhihao Jing, Jingjing Zheng; Supervision: Haifeng Zhai. All authors reviewed and approved the final version of the manuscript.
Availability of Data and Materials: The data that support the findings of this study are available from the corresponding author upon reasonable request.
Ethics Approval: Not applicable.
Conflicts of Interest: The authors declare no conflicts of interest.
References
1. Zhang C , Cassano JJ , Seefeldt MW , Wang H , Ma W , Tung WW . Quantifying the impacts of atmospheric rivers on the surface energy budget of the Arctic based on reanalysis. Cryosphere. 2025; 19( 10): 4671– 99. doi:10.5194/tc-19-4671-2025. [Google Scholar] [CrossRef]
2. Karalis M , Svensson G , Wendisch M , Tjernström M . Lagrangian single-column modeling of Arctic air mass transformation during HALO-(???? ????)3. Atmos Chem Phys. 2025; 25( 20): 13177– 98. doi:10.5194/acp-25-13177-2025. [Google Scholar] [CrossRef]
3. Su P , He W , Adam A , Musa O , Chen W , Lou Z . Design and performance optimization of a radial turbine using hydrogen combustion products. Aerospace. 2024; 11( 12): 1051. doi:10.3390/aerospace11121051. [Google Scholar] [CrossRef]
4. Litim SA , Benzaama H , Hamel M , Hamidou MK , Debab A . Performances evaluation and blade number optimization of radial inflow turbine. Int J Adv Res Eng Technol. 2021; 12( 11): 85– 97. [Google Scholar]
5. Xu Q , Wang L . Low speed dynamic model on singed-shaft mixed exhaust micro turbofan engine. Model Simul. 2023; 12( 1): 60– 6. doi:10.12677/MOS.2023.121006. [Google Scholar] [CrossRef]
6. Zhao X , Wang Y , Ma X , Zhang Y , Yue L , Zheng B . Effects of Reynolds number on the flow field in a low-pressure turbine with incoming wakes. J Mech Sci Technol. 2023; 37( 11): 5891– 900. doi:10.1007/s12206-023-1027-z. [Google Scholar] [CrossRef]
7. Lemma E , Deam RT , Toncich D , Collins R . Characterisation of a small viscous flow turbine. Exp Therm Fluid Sci. 2008; 1( 33): 96– 105. doi:10.1016/j.expthermflusci.2008.07.009. [Google Scholar] [CrossRef]
8. Peirs J , Reynaerts D , Verplaetsen F . A microturbine for electric power generation. Sens Actuators A Phys. 2004; 1( 13): 86– 93. doi:10.1016/j.sna.2004.01.003. [Google Scholar] [CrossRef]
9. Rim Kim H , Stania L , Maroldt N , Oettinger M , Seume JR . Characterizing the unsteady flow field in low-flow turbine operation. J Turbomach. 2024; 146( 10): 101003. doi:10.1115/1.4065243. [Google Scholar] [CrossRef]
10. Omri M , Fréchette LG . Computational Investigation of the Three-Dimensional Flow Structure and Losses in a Low Reynolds Number Microturbine. In: Proceedings of the ASME Turbo Expo: Turbine Technical Conference and Exposition; 2021 Jun 7–11; Online. [Google Scholar]
11. Ji X , Li X , Tong F , Yu C . Large eddy simulation of shock wave/turbulent boundary layer interaction under incipient and fully separated conditions. Phys Fluids. 2023; 35( 4): 046106. doi:10.1063/5.0147829. [Google Scholar] [CrossRef]
12. Bi WT , Du TT , Chen J , She ZS . Mean-flow structures of the turbulent boundary layers bounding a two-dimensional separation bubble. Phys Fluids. 2024; 36( 8): 085197. doi:10.1063/5.0225020. [Google Scholar] [CrossRef]
13. Cartwright WG , editor . A comparison of calculated flows in radial turbines with experiment. In: ASME 1972 International Gas Turbine and Fluids Engineering Conference and Products Show; 1972 Mar 26–30; San Francisco, CA, USA. doi:10.1115/72-GT-50. [Google Scholar] [CrossRef]
14. Wagner PH , Wuillemin Z , Constantin D , Diethelm S , Van herle J , Schiffmann J . Experimental characterization of a solid oxide fuel cell coupled to a steam-driven micro anode off-gas recirculation fan. Appl Energy. 2020; 262: 114219. doi:10.1016/j.apenergy.2019.114219. [Google Scholar] [CrossRef]
15. Toppings C , Yarusevych S . Low-Reynolds-number aerofoil boundary layer transition in large-scale free stream turbulence. J Fluid Mech. 2025; 1021: A46. doi:10.1017/jfm.2025.10747. [Google Scholar] [CrossRef]
16. Li W . Vortex Pump as turbine for energy recovery in viscous fluid flows with Reynolds number effect. J Fluids Eng. 2022; 144( 2): 021207. doi:10.1115/1.4051313. [Google Scholar] [CrossRef]
17. Wu HY , Pan KL . Optimum design and simulation of a radial-inflow turbine for geothermal power generation. Appl Therm Eng. 2018; 130: 1299– 309. doi:10.1016/j.applthermaleng.2017.11.103. [Google Scholar] [CrossRef]
18. Fu L , Feng ZP , Li GJ , Deng QH , Shi Y , Gao TY . Experimental validation of an integrated optimization design of a radial turbine for micro gas turbines. J Zhejiang Univ SCI A. 2015; 16( 3): 241– 9. doi:10.1631/jzus.A1400073. [Google Scholar] [CrossRef]
19. Yang L , Feng T , Zou Z , Li W . Analysis of turbine flow field under low Reynolds number condition. J Beijing Univ Aeronaut Astronaut. 2005; 31( 11): 1194– 7. (In Chinese). [Google Scholar]
20. Saha AK , Chowdhury S , Chowdhury SP , Gaunt CT . Integration of wind turbine, SOFC and microturbine in distributed generation. In: 2009 IEEE Power & Energy Society General Meeting; 2009 Jul 26–30; Calgary, AB, Canada. p. 1– 8. doi:10.1109/PES.2009.5275268. [Google Scholar] [CrossRef]
21. Watanabe N , Teramoto S , Nagashima T . Numerical analysis of 2.5 dimensional geometry turbine performance. In: Proceedings of the International Gas Turbine Congress; 2003 Nov 2–7; Tokyo, Japan. [Google Scholar]
22. Dufau A , Marty J , Man D , Piot E . High-fidelity simulations of the flow around T106C cascade at low Reynolds number: the effects of freestream turbulence and stagger angle. In: Proceedings of the ASME Turbo Expo 2022: Turbomachinery Technical Conference and Exposition; 2022 Jun 13–17; Rotterdam, The Netherlands. doi:10.1115/GT2022-82109. [Google Scholar] [CrossRef]
23. Frey Marioni Y , Adami P , Vazquez Diaz R , Cassinelli A , Sherwin S , Montomoli F . Development of machine-learnt turbulence closures for wake mixing predictions in low-pressure turbines. In: Proceedings of the ASME Turbo Expo 2022: Turbomachinery Technical Conference and Exposition; 2022 Jun 13–17; Rotterdam, The Netherlands. doi:10.1115/GT2022-82531. [Google Scholar] [CrossRef]
24. Shao Z , Zhang H , Wang R . Development and loss mechanism of turbine secondary flows at a low Reynolds number: a synergy analysis. Phys Fluids. 2023; 35( 10): 105101. doi:10.1063/5.0166644. [Google Scholar] [CrossRef]
Cite This Article
 Copyright © 2026 The Author(s). Published by Tech Science Press.
This work is licensed under a Creative Commons Attribution 4.0 International License , which permits unrestricted use, distribution, and reproduction in any medium, provided the original work is properly cited.
 Downloads
 Citation Tools