
 Submit a Paper
 Propose a Special lssue
 Open Access
ARTICLE
Experimental Study of Sand Transport Assisted by Self-Suspended Proppant in Complex Fractures
1 China National Petroleum Corporation North China Oilfield Branch, Cangzhou, China
2 School of Petroleum and Natural Gas Engineering, Southwest Petroleum University, Chengdu, China
3 Wenzhou Vocational and Technical College, Wenzhou, China
* Corresponding Author: Zhengsheng Xia. Email:
Fluid Dynamics & Materials Processing 2026, 22(1), 8 https://doi.org/10.32604/fdmp.2026.075388
Received 30 October 2025; Accepted 28 January 2026; Issue published 06 February 2026
 View Full Text
 Download PDF
Abstract
Self-suspended proppants, which enable clear-water fracturing, represent a promising new class of materials for reservoir stimulation. Given the economic limitations associated with their exclusive use, this study investigates proppant transport behavior in hybrid systems combining self-suspended proppants with conventional 40/70 mesh quartz sand at various mixing ratios. A dedicated experimental apparatus was developed to replicate field-relevant complex fracture networks, consisting of a main fracture and two branching fractures with different deflection angles. Using this system, sand bank formation and proppant distribution were examined for both conventional quartz sand fracturing and fracturing augmented with self-suspended proppants. The effects of slurry discharge volume, proppant mixing ratio, sand ratio, and injection location of the self-suspended proppant on transport and placement behavior were systematically analyzed. According to the results, the incorporation of self-suspended proppants markedly enhances the proppant-carrying capacity of the slurry and substantially modifies sand bank morphology. Increasing the discharge volume raises the inlet slope angle and promotes greater proppant penetration into branch fractures. The proportion of self-suspended proppant governs slurry viscoelasticity and, consequently, proppant settling behavior. As the fraction of self-suspended proppant decreases, the equilibrium height of the sand bank increases, while the proppant mass fraction within branch fractures exhibits a non-monotonic response, initially decreasing and then increasing. Variations in sand ratio alter both overall proppant concentration and the self-suspended proppant-to-water ratio, thereby modulating slurry rheology and influencing proppant placement. In addition, changes in injection location affect near-wellbore vortex structures, leading to distinct sand bank morphologies.Keywords
Hydraulic fracturing is an important means to enable efficient exploration and development of unconventional oil and gas resources. The proppant is carried by the fracturing fluid into the formation and settles and accumulates in the fractures, and its placement pattern greatly affects the reservoir modification effect [1,2,3,4,5]. Unconventional oil and gas reservoirs usually use guanidine gel fracturing fluid or slickwater fracturing fluid [6,7]. However, guanidine gel fracturing fluid is complicated to formulate, costly and harmful to low-permeability reservoirs; slickwater fracturing fluid has low viscosity, poor sand-carrying capacity, and produces short effective fracture half-lengths; according to the research, both of them lead to a significant decrease in the inflow capacity of artificial fractures and natural fractures in reservoirs [8,9,10,11]. To address this critical issue, the core focus of this research shifted towards achieving effective proppant delivery while minimising impairment to fracture flow capacity. The solution lies in transferring part of the sand-carrying function from the fracturing fluid to the proppant itself [12,13,14]. Self-suspended proppant is prepared by wrapping a layer of polymer around quartz sand or ceramic grains. The key to its self-suspending ability lies in the hydration and swelling of this polymer layer upon contact with water, forming a viscous hydrogel shell around the grain. This shell significantly reduces the apparent density of the proppant and increases inter-particle drag, enabling it to remain suspended in low-viscosity fluids such as clear water, and this technology combines traditional proppant and fracturing fluid, which can realize clear water fracturing, reduce construction difficulty and improve fracturing efficiency [15,16,17,18]. At present, the self-suspended proppant has not been applied on a large scale, and there are fewer studies on its flow mechanism and particle settling law in the fracture [19,20,21].
At present, the research on self-suspended proppant mainly focuses on performance evaluation, and many scholars have evaluated and tested self-suspended proppant for its anti-shear performance, drag reduction performance, suspension performance, glue breaking ability, and temperature resistance. Zhang and Qin respectively prepared and studied the rheology of viscoelastic self-suspension proppant, particle settling law and principle of suspension, as well as the expansion type self-suspension proppant in the fracture transport and laying performance, the results show that the viscoelastic self-suspension proppant surface coating is dissolved when it meets water [22]. The solution is a power law fluid and has viscoelasticity, which is the dominant factor for the particles to levitate, and the effective density decreases and then reduces the settling ability after the swelling type self-suspension proppant meets water [23,24,25]. The density decreases which in turn reduces the settling rate and improves the proppant placement efficiency, but the final equilibrium height of the sand embankment is small [26]. Cao mixed the self-suspended proppant with ceramic grains, and tested the suspension performance of the mixed proppant with different ratios, and the results showed that, when the ratio of the self-suspended proppant is higher, the suspension time of the proppant is shortened, the settling time is increased and the self-suspension ability is improved. The authors suggested that this hybrid proppant can not only significantly reduce the cost, but also improve the reservoir adaptability of the self-suspended proppant [27].
A few scholars have conducted experimental or numerical simulation studies on the transport and placement law of self-suspended proppant. Li compared the movement of self-suspended proppant and ceramic proppant in a single fracture through experimental studies and found that self-suspended proppant can increase the height of the suspension zone and the sand dike, and improve the proppant placement effect [28]. Deng used the Eulerian-Eulerian method to establish a numerical model of self-suspended proppant transport and placement in complex fractures, simulated the transport of self-suspended proppant under different influencing factors and fracture morphology, and found that the flow performance of self-suspended proppant in branch joints is better compared with that in the main joints, which is favorable for proppant placement in complex fractures [29]. Zhang experimentally investigated the migration and distribution behaviour of self-suspended proppants within fractures, discovering that their self-suspension properties significantly enhance migration distance and enable directional adsorption onto fracture walls. This facilitates optimisation of proppant placement efficacy within complex fracture networks [30]. This study aims to identify the favourable conditions for effective proppant placement through comparative analysis of proppant distribution behaviour under different operating conditions. It provides a theoretical basis for the rational design and parameter optimisation of self-suspending proppants in fracturing operations.
2 Experimental Equipment and Methods
In order to investigate the influence of different factors on the sand-carrying capacity of self-suspended proppant, a large-scale experimental device for visualizing proppant transport in complex fractures was built. The device mainly consists of a visualized fracture, a liquid storage tank, a circulation tank, a sand agitator cage, a screw pump, a flowmeter, and a control console, among which the visualized fracture mainly consists of the main fracture and two branch fractures at different angles, with the width of the main fracture of 6 mm and the width of the branch fracture of 3 mm, which are shown in Fig. 1.
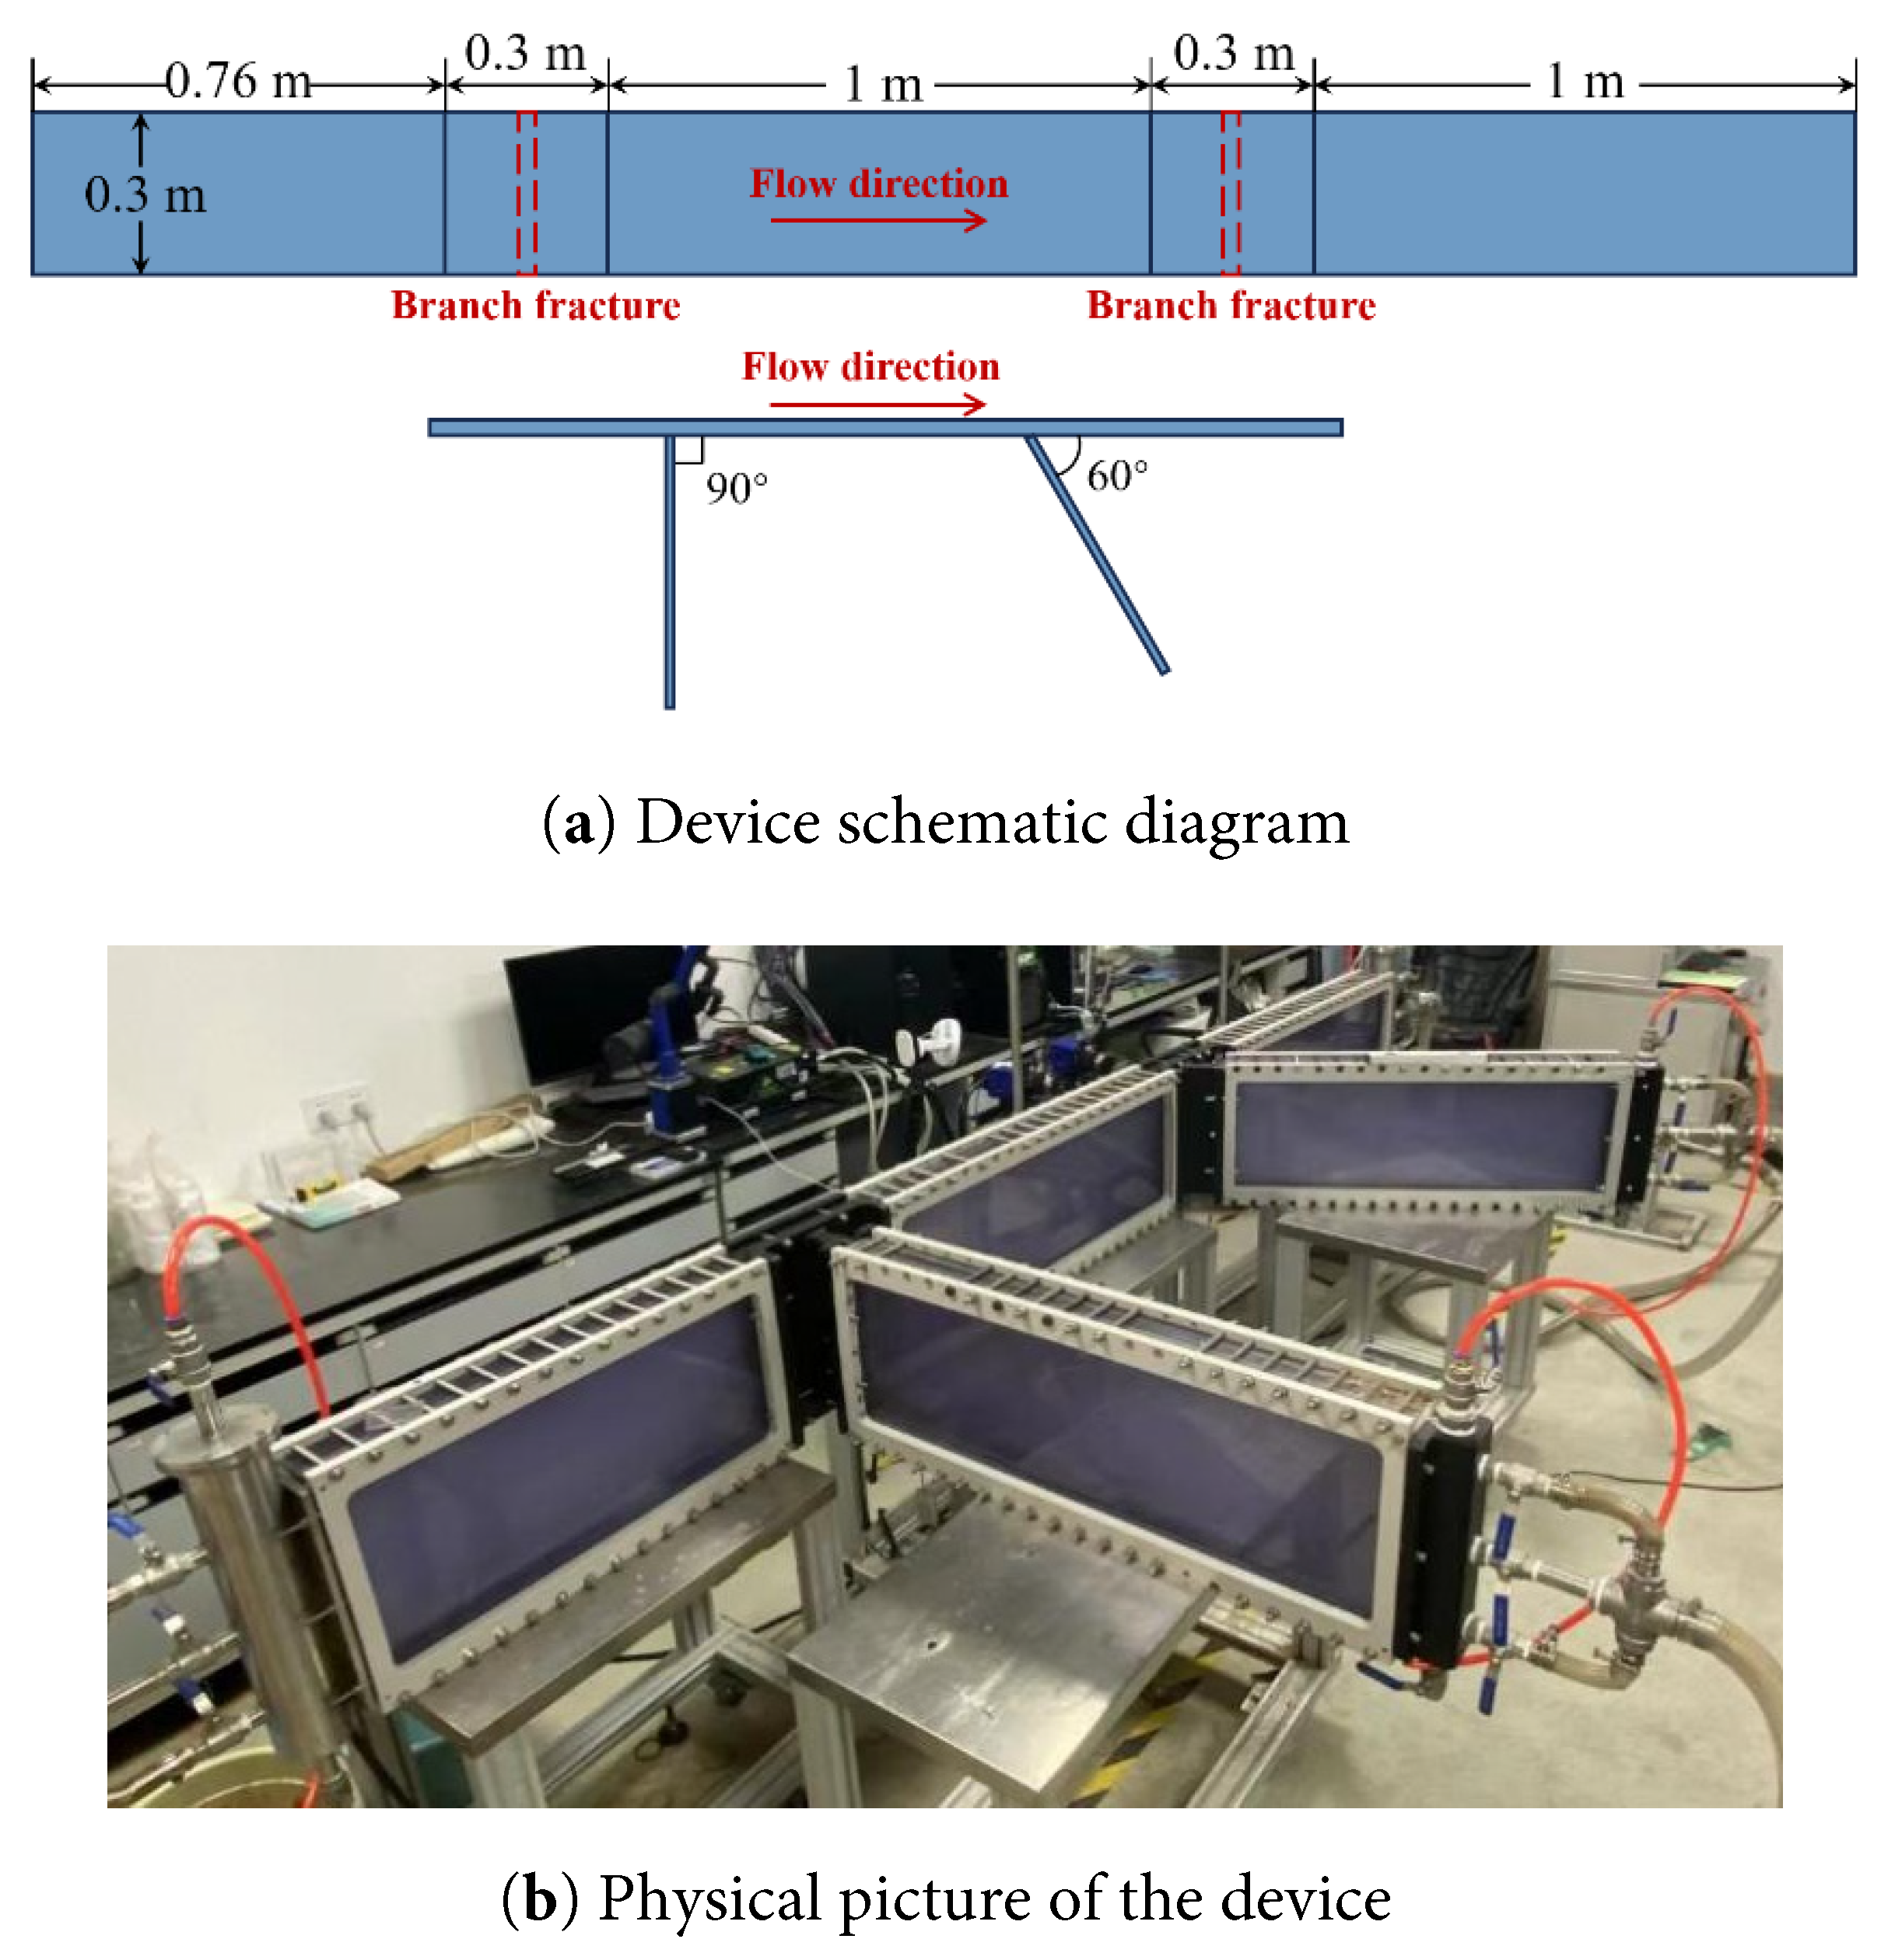
Figure 1: Schematic of complex fracture, (a) Device schematic diagram, (b) Physical picture of the device.
The experimental materials included water (viscosity of 1 mPa·s at room temperature), self-suspending proppant and 40/70 mesh quartz sand.
After mixing the self-suspended proppant with 40/70 mesh quartz sand according to a certain ratio, use the sand stirring cage to add it to the sand mixing tank at a certain rate and mix it with water, and inject it into the visualized fracture device through the sand pump, meanwhile, the proppant spreading process in the fracture device is recorded in real time.
In order to ensure that the experimental device can reflect the movement of the proppant in the fracture, the experimental parameters were determined based on the pumping parameters in the field according to the flow similarity criterion:
In this paper, with reference to the construction parameters of coalbed methane fracturing sites in North China Oilfield and based on the similarity criterion above, the experimental program shown in Table 1 was determined to study the injection rate volume, proppant configuration ratio, and injection sand ratio.
The injection rate refers to the volumetric flow rate of fracturing fluid pumped into the formation per unit of time. The proppant configuration ratio describes the compositional proportion of mixed proppants, which in this study specifically denotes the ratio of conventional proppants to self-suspending proppants. The sand ratio indicates the concentration of proppants in the carrying fluid.
Table 1 shows the experimental conditions, with displacements of 20, 30, 40, and 50 L/min, sand concentrations of 15%, 20%, 25%, and 30%, and ratios of conventional and self suspending proppants of 1:0, 4:1, 5:1, 6:1, 7:1, and 8:1. The inlet section is perforated with upper, middle, lower, and fully open holes.
Table 1: Experimental parameters.
| Injection Rate (L/min) | Sand Ratio (%) | Ratio of Conventional Proppants to Self-Suspending Proppants | Perforation Location |
|---|---|---|---|
| 20, 30, 40, 50 | 20 | 5:1 | fully open |
| 40 | 15, 20, 25, 30 | 5:1 | fully open |
| 40 | 20 | 1:0, 4:1, 5:1, 6:1, 7:1, 8:1 | fully open |
| 40 | 20 | 5:1 | fully open, middle, upper-middle, lower-middle |
3.1 Proppant Placement Pattern
In order to better analyze the experimental results, three quantitative parameters, namely, the equilibrium height of the sand dike, the inlet slope angle, and the initial sandbank distance (Fig. 2), were determined to characterize the variation of the sand dike morphology.
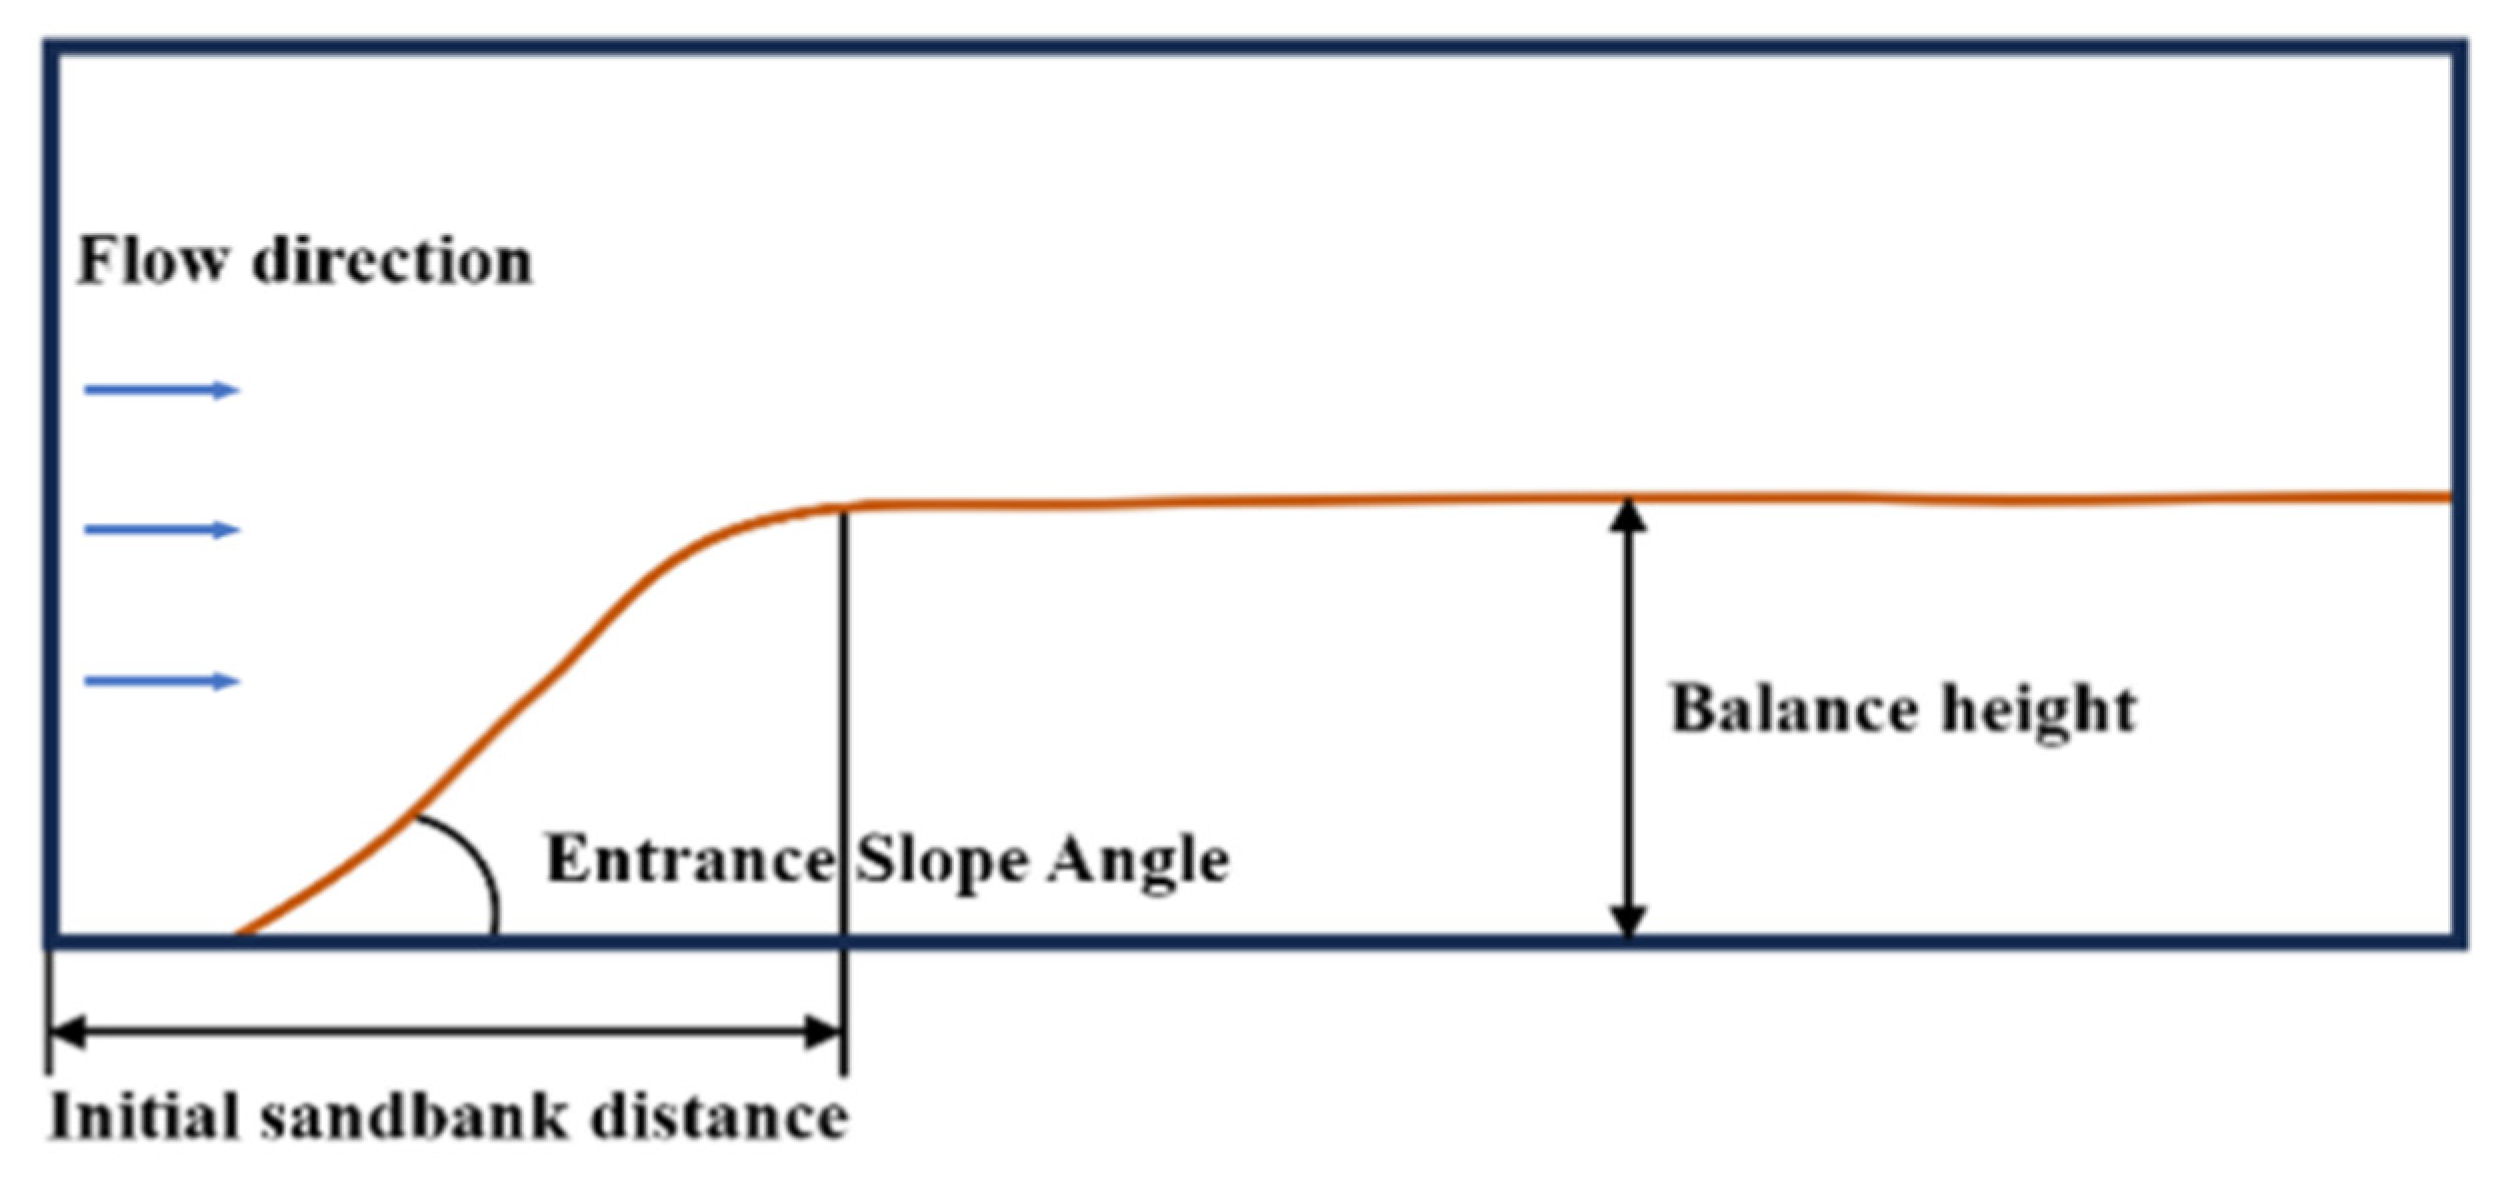
Figure 2: Key parameters for proppant placement.
The same time points of different experiments were selected to treat the sandbank profile to demonstrate the proppant placement effect. As shown in Fig. 3a, during the buildup of clear water carrying 40/70 quartz sand, at the initial stage (t1), due to the low viscosity and weak sand-carrying capacity of the clear water, the proppant’s gravity is greater than the buoyancy force and the resistance of the clear water in the vertical direction, and it is subject to the trailing force of the clear water and the resistance to flow in the horizontal direction. Therefore, the proppant settles rapidly after entering the fracture and forms a small sand mound at the bottom of the fracture; and in the middle of the laying period (t2), as the proppant continues to settle, the height of the sand mound at the inlet continues to increase until the equilibrium height; in the later stage (t3), the injected proppant is transported to the back of the sand dike, and the sand dike grows along the length of the fracture.
After the addition of self-suspended proppant for assisted sand transport, the sand-carrying capacity of the liquid is enhanced due to the dissolution of the surface coating of the self-suspended proppant, and the transport distance of the proppant is increased, and at this stage (t1) some of the proppant is transported out of the fracture due to the limitation of the length of the experimental setup. In the pre-proppant injection period (t2), a large amount of proppant is continuously transported in the fracture, and a small amount of proppant settles and spreads uniformly at the bottom of the fracture to form a thin layer of sand; with further injection of proppant (t3), the proppant continues to settle and grows along the direction of the fracture height until it reaches the equilibrium height, and the sand dike approximates to be planar in the middle of the fracture, which is shown in Fig. 3b.
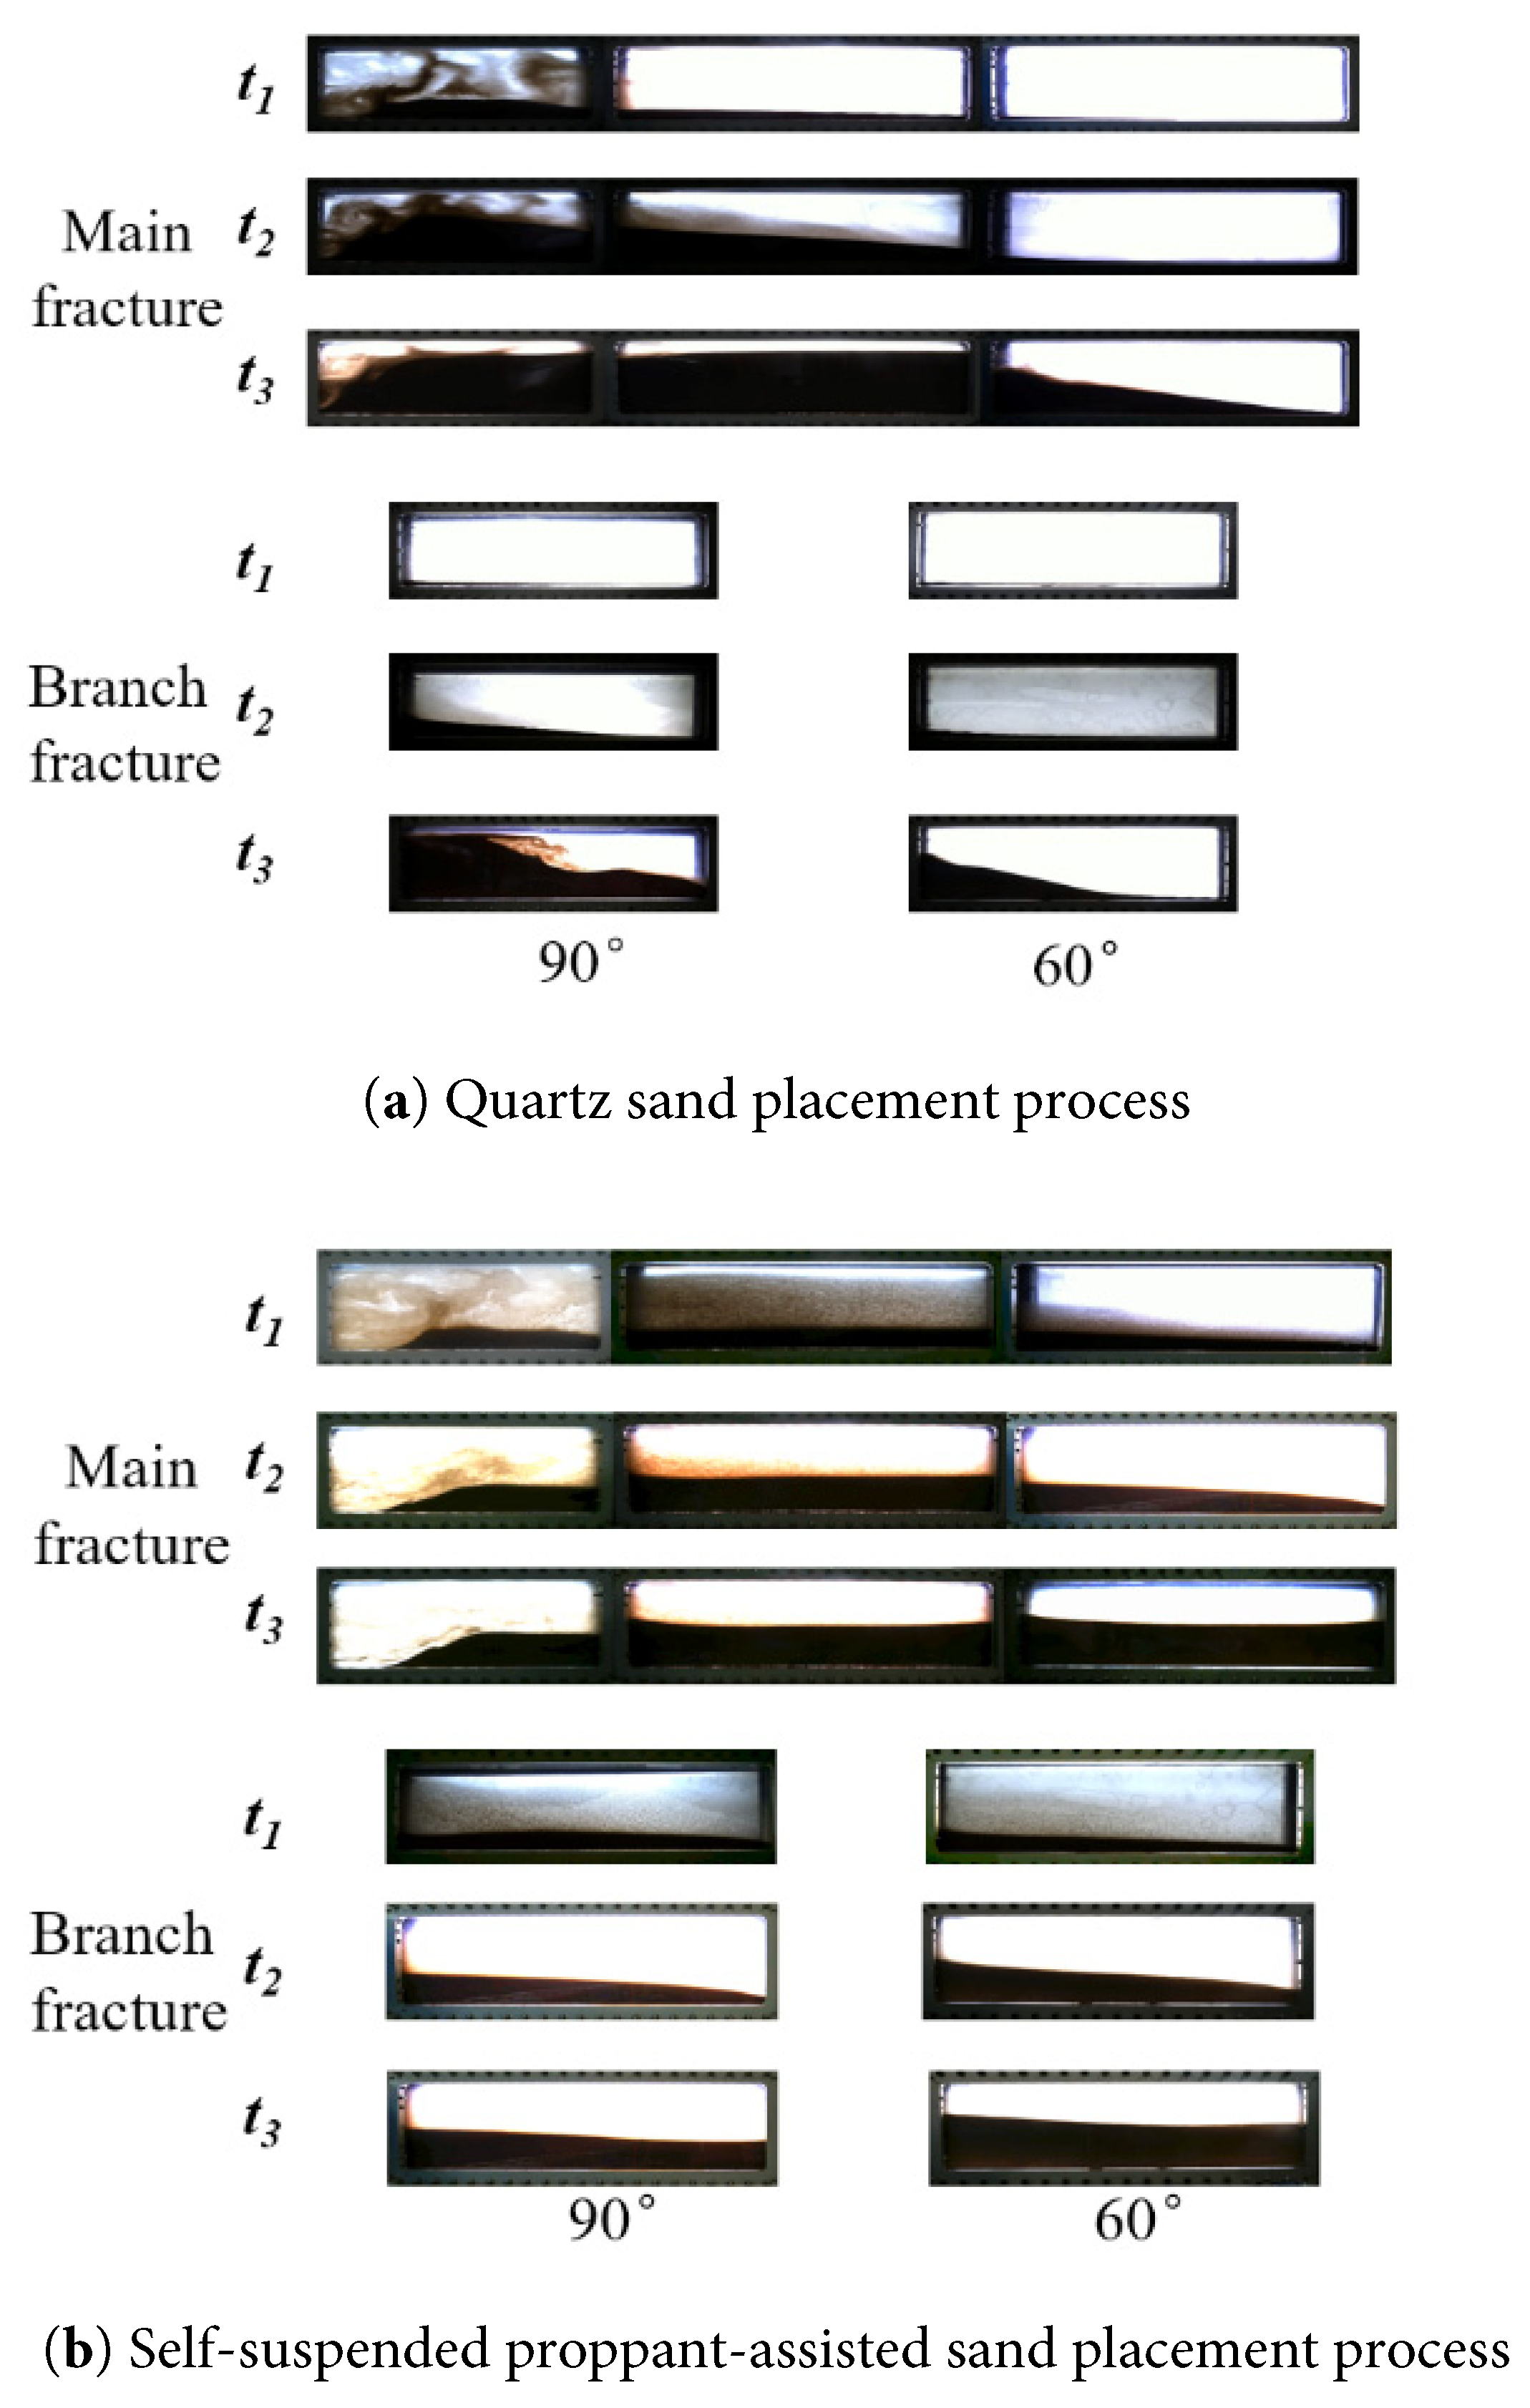
Figure 3: Quartz sand and self-suspended proppant placement patterns in main and branch fractures, (a) Quartz sand placement process, (b) Self-suspended proppant-assisted sand placement process.
3.2 Analysis of Influencing Factors
Fig. 4 shows the arrangement of proppant in the main and secondary fractures after increasing the injection rate from 20 L/min to 60 L/min. From the morphology of the main fracture sand embankment (in Fig. 4a), it can be seen that on the one hand, the height of the sand embankment decreases continuously with the increase of injection rate, indicating that the sand carrying capacity of the liquid increases with the increase of injection rate. At the same time, the injection rate also had a significant impact on the inlet of the main fracture. When the injection rate was low, the accumulation of fracture support agent easily blocked the lower hole, while this phenomenon did not occur after exceeding 40 L/min. The height of the sand embankment in the secondary fracture (Fig. 4b) also shows the same trend, that is, as the injection rate increases, the flow rate of the secondary fracture increases, and the height of the sand embankment decreases.
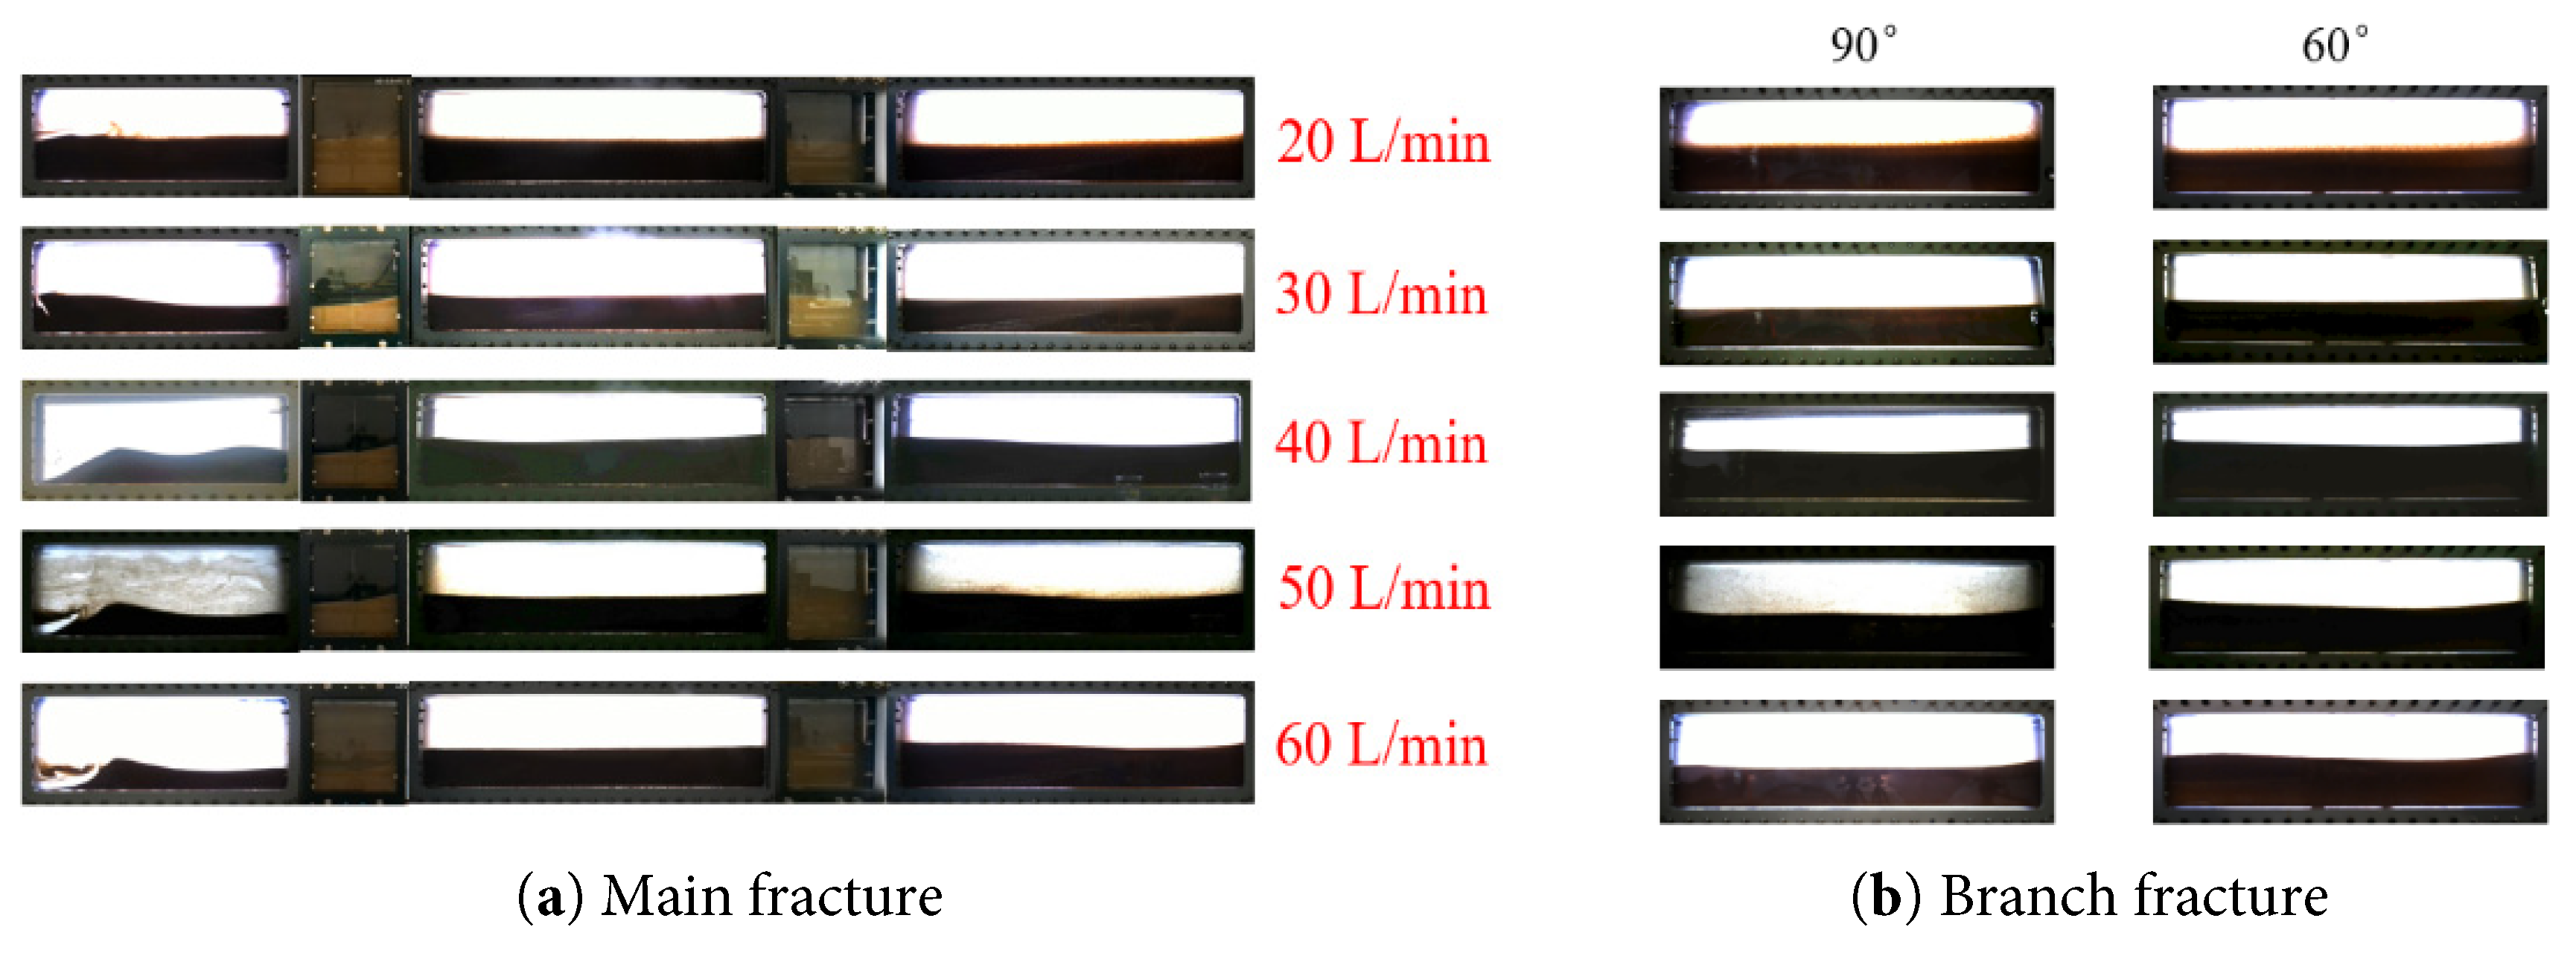
Figure 4: Proppant stacking pattern under different injection rate conditions, (a) Main fracture, (b) Branch fracture.
Fig. 5 shows the equilibrium height of the sand dike at each discharge rate, and the overall trend is decreasing with the increase of the discharge rate. At low discharge rates (20 L/min–30 L/min), the proppant will accumulate at the entrance of the fracture, increasing the risk of sand plugging, while at large discharge rates (40 L/min–60 L/min), the liquid scouring effect on the sand dike is significant, and a sand dike will be formed in the near-well area, and the slope angle of the entrance of the dike shows an exponential trend of increase with the increase of the discharge rate (Fig. 5). This indicates that there is a critical injection rate between 30 L/min and 40 L/min that can block the lower hole.
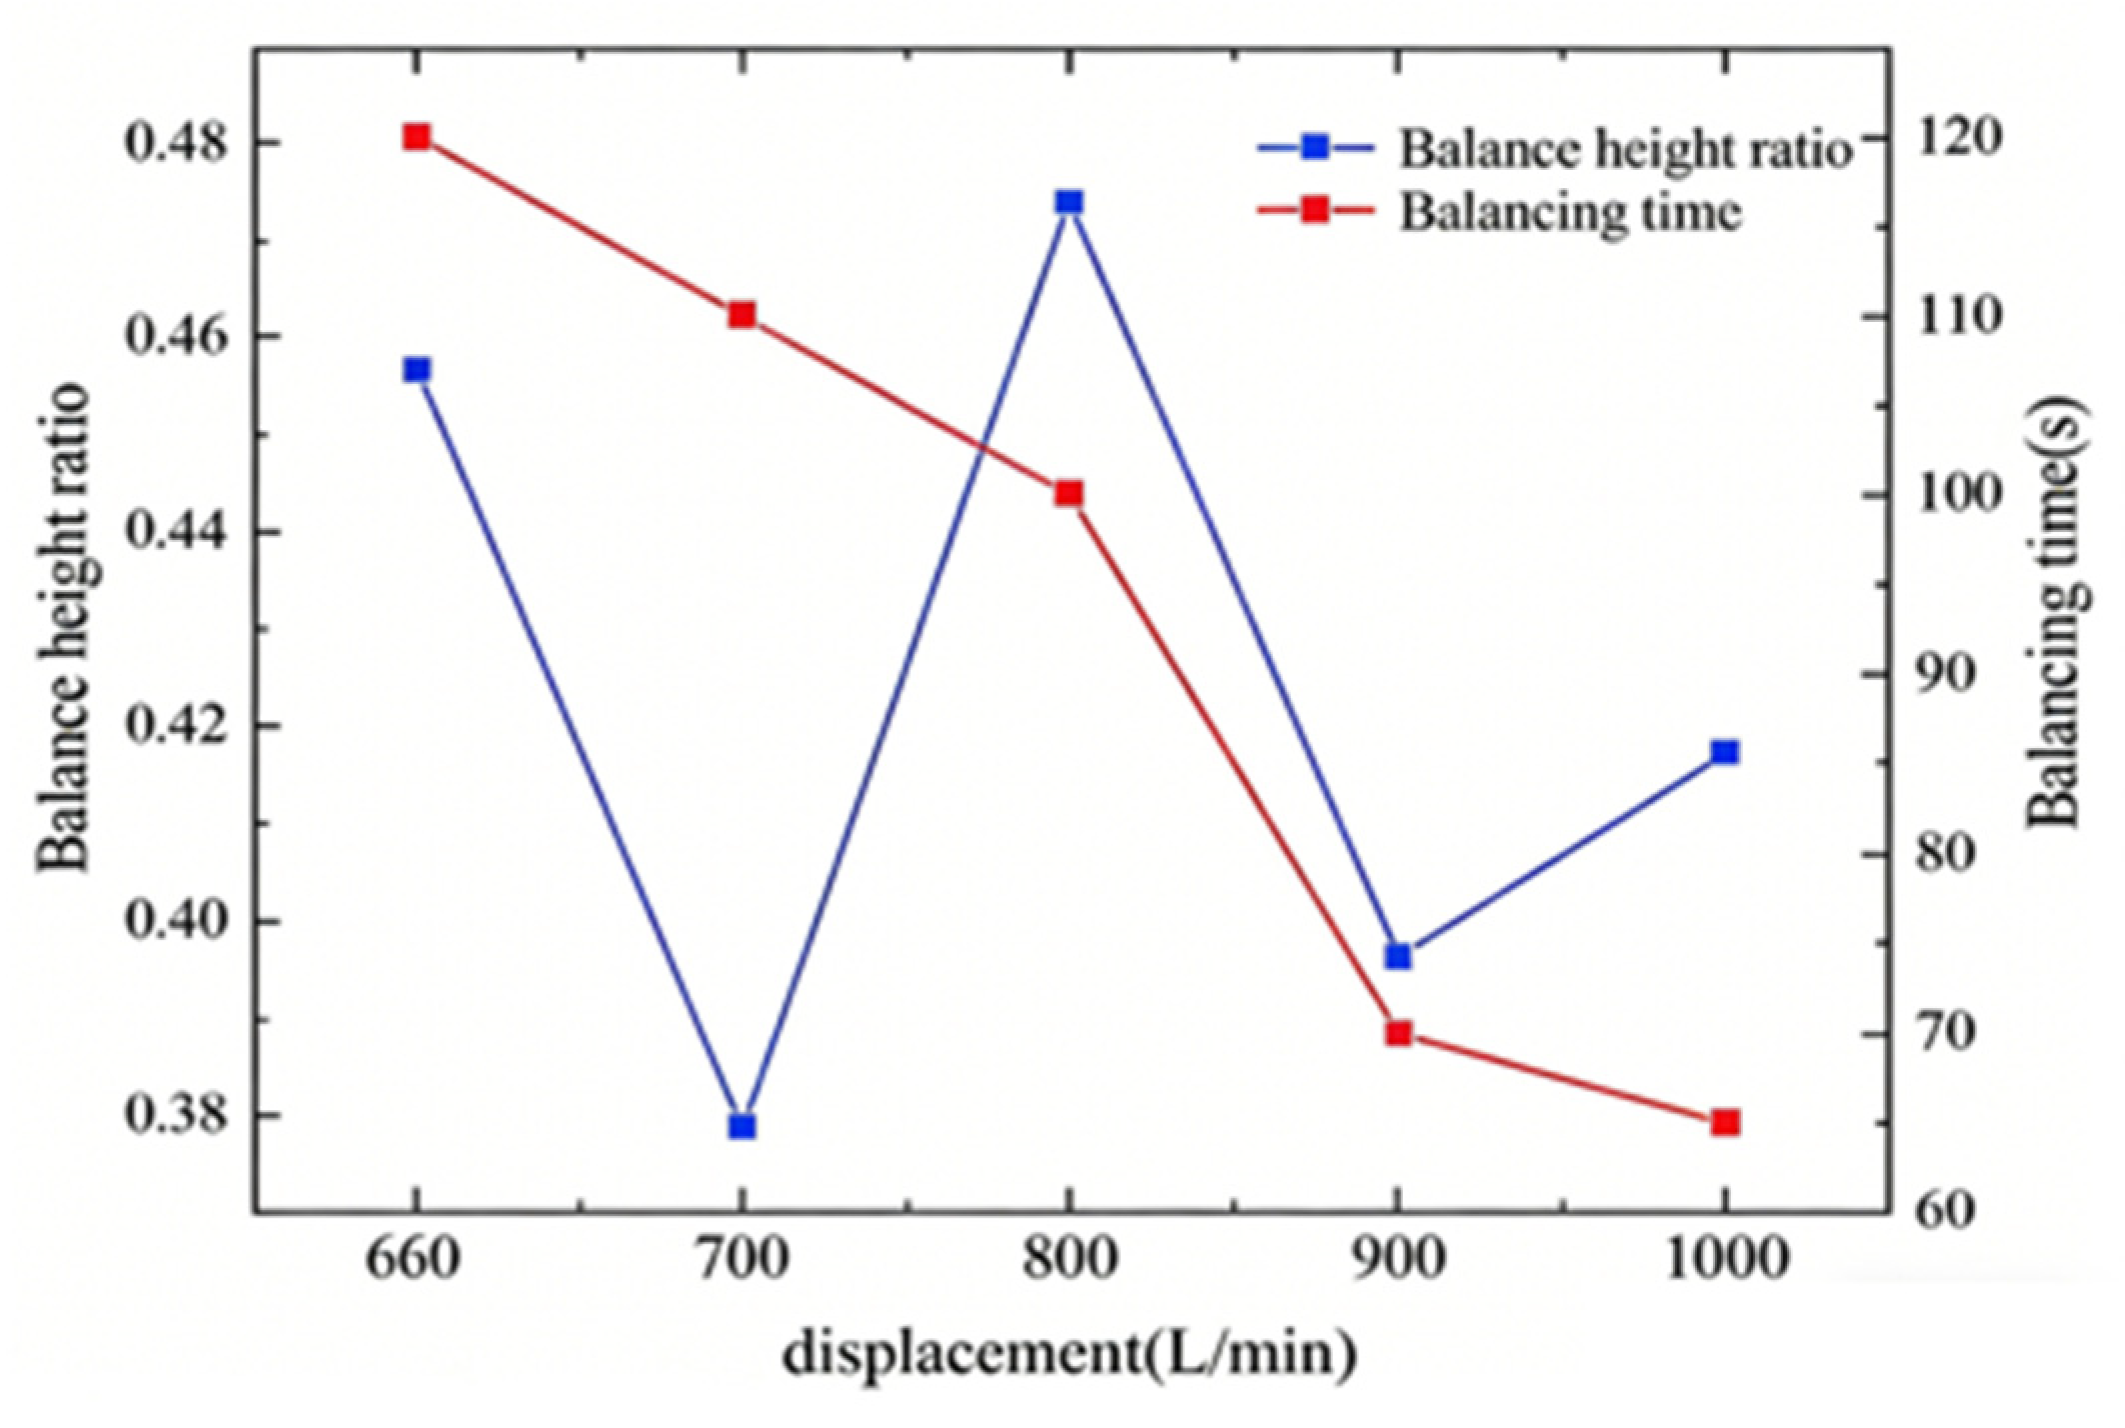
Figure 5: Sand dike equilibrium height percentage and inlet slope angle for different discharge conditions.
For proppant placement in complex fractures, the percentage of proppant mass in branch fractures is an important evaluation parameter. The equilibrium heights of the sand embankment at different discharges and the ratio of the proppant mass in the branch fractures to the total proppant mass in the complex fractures are statistically presented in Fig. 6. The percentage of proppant in the branch fractures increases with increasing discharge from 24.3% to 28.3%, and the largest increase in the percentage of proppant in the branch fractures is observed when the discharge rate is increased from 20 to 30 L/min, and the percentage of proppant in the branch fractures is increased from 30 to 30 L/min. to 60 L/min, the proportion of proppant in the branch fracture showed a linear increasing trend with the increase of injection rate.
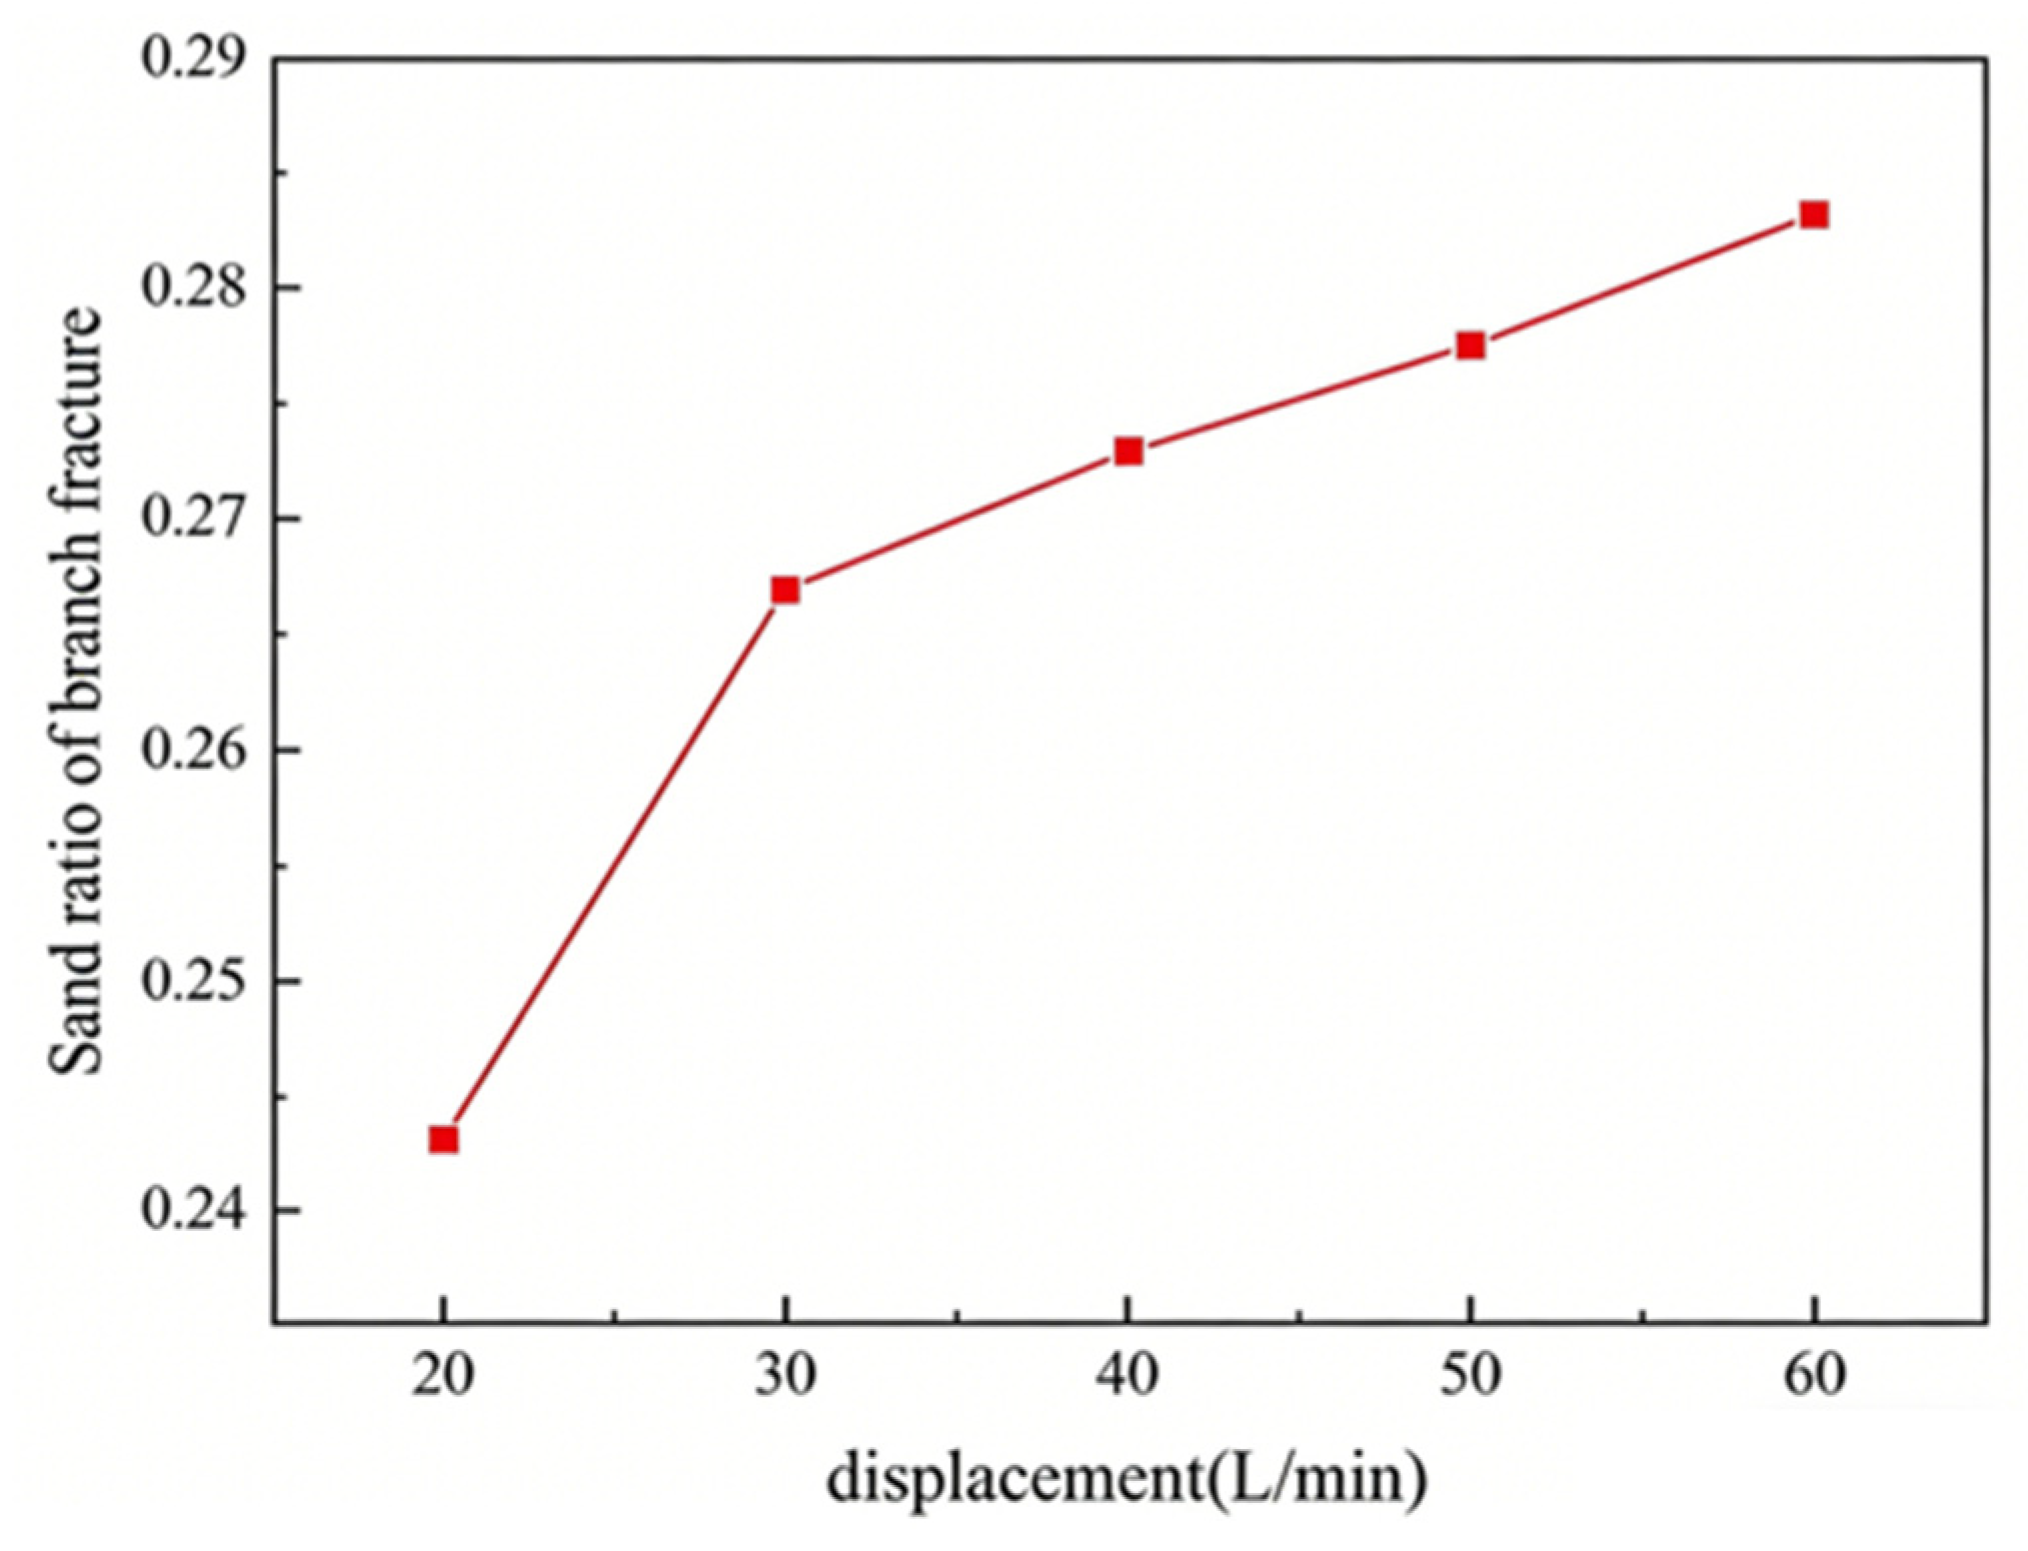
Figure 6: Mass percentage of proppant entering the support joints under different injection rate conditions.
Fig. 7 statistically shows the mass distribution of proppant in each plate. At a discharge rate of 20 L/min, the liquid is weak in sand-carrying capacity, and the proppant is prone to settle in the near-well region, so the proppant is significantly more distributed in the first plate compared to other injection rates, and it can be seen that the sand quantity in main1 is much higher than other injection rates. while for large injection rates, the liquid trails the particles with more force, enabling the proppant to overcome the flow resistance and transport to the end of the fracture, so the distribution of proppant is more in the end of the fracture, i.e., the third plate, and relatively less in the first plate. At the same time, it can be seen that there is not much difference in the amount of sand deposited at different displacements in main II, main III, and secondary fractures.
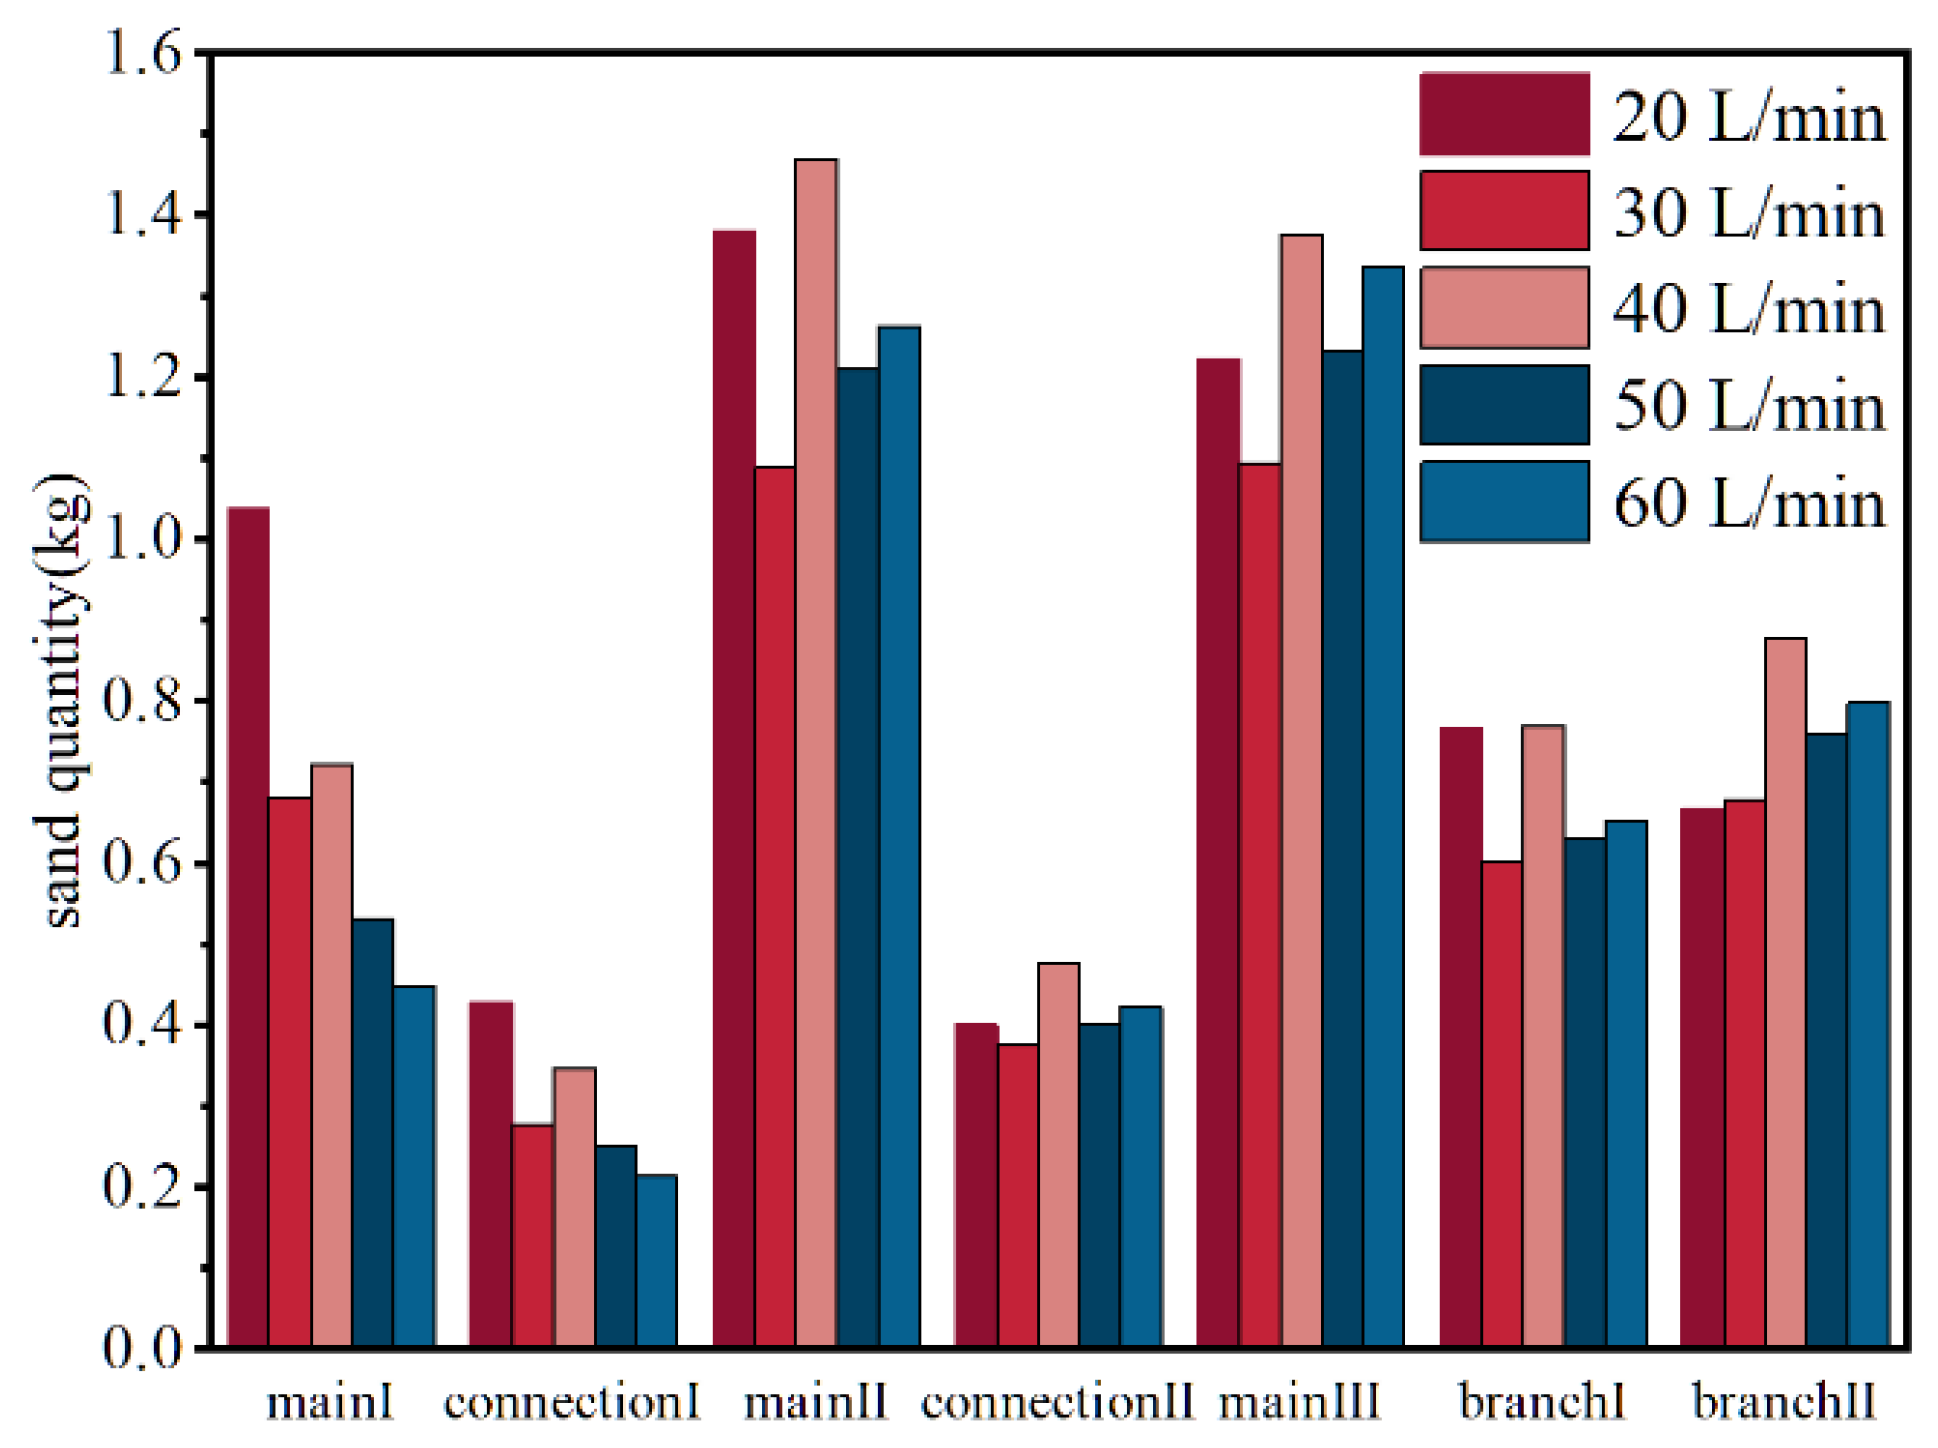
Figure 7: Proppant quantity distribution for different injection rate conditions.
3.2.2 Proppant Configuration Ratio
When the self-suspended proppant meets water, its surface coating dissolves, which increases the resistance coefficient of the liquid, improves the viscosity and elasticity of the liquid, and together increases the trailing force of the liquid on the proppant and reduces the settling speed of the proppant [31]. Therefore, the configuration ratio of the self-suspended proppant has an important influence on the proppant placement.
Fig. 8 shows the experimental results of transporting different conventional proppants and self suspended proppants at different mixing ratios. From Fig. 8a, it can be seen that as the proportion of conventional proppant increases, the height of the sand embankment in the main seam continues to increase, indicating that the higher the proportion of self suspended proppant, the stronger its sand carrying capacity. Similarly, the height of the sand embankment in the secondary seam also decreases with the increase of the proportion of self suspended proppant (Fig. 8b). Analyzing the reasons, as the proportion of self suspended proppants increases, the more compounds dissolve on the surface of the proppants, the higher the fluid viscosity, and the stronger the sand carrying capacity.
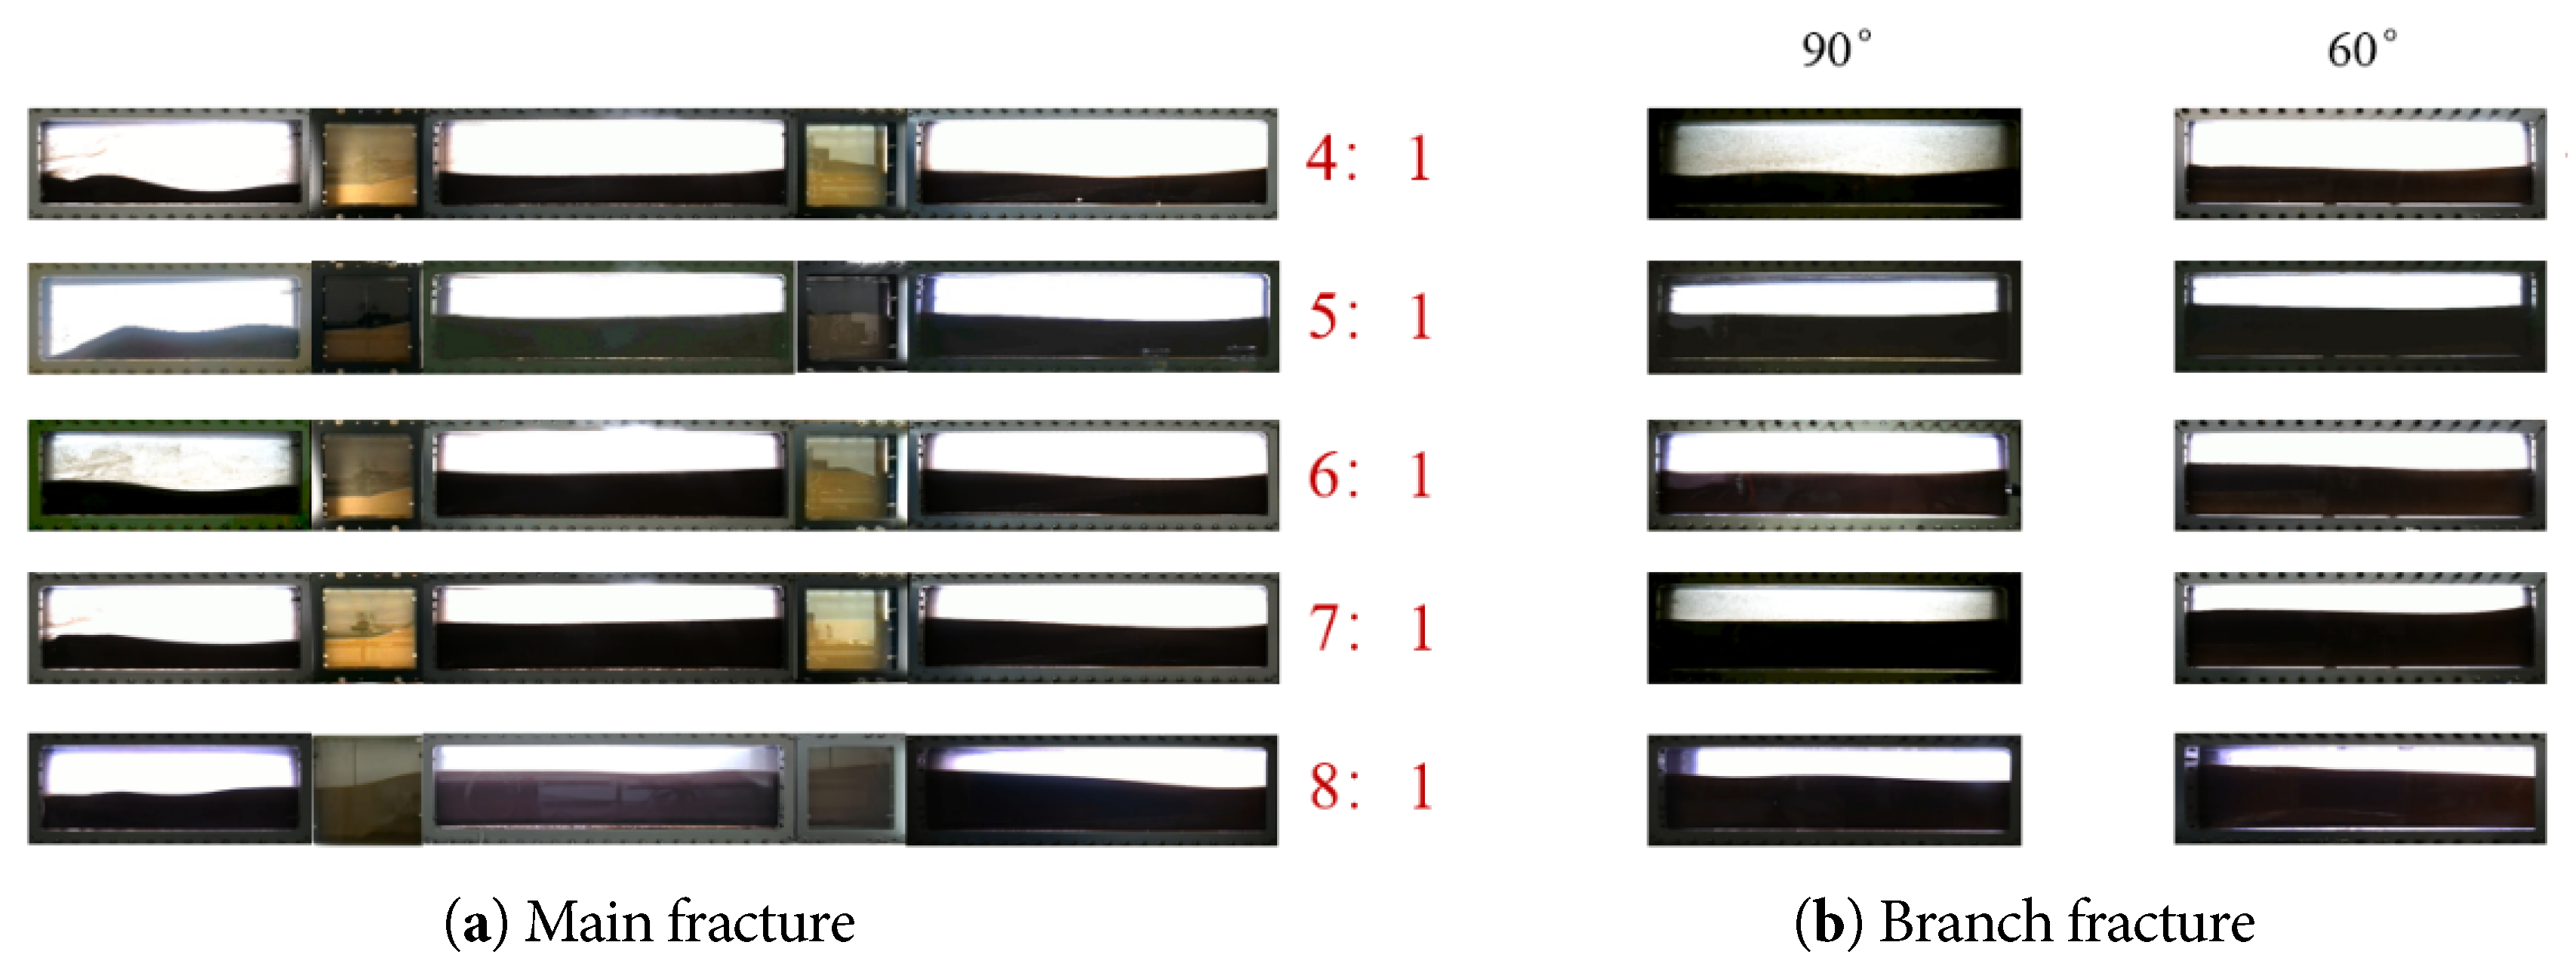
Figure 8: Proppant stacking pattern under different proportioning conditions, (a) Main fracture, (b) Branch fracture.
With a larger proportion of self-suspended proppant, the proppant is subjected to greater trailing forces and has a lower settling velocity, which makes it less likely to settle, and the liquid is more likely to carry the proppant to the far end of the bank, which in turn manifests itself as a lower equilibrium height of proppant spreading (Fig. 9). Fig. 10 demonstrates the distribution of proppant mass in each plate under different proportioning conditions, and it can be seen that as the proportion of self-suspended proppant configuration decreases, the mass of proppant in each plate increases, and the increase is the same as the trend of equilibrium height growth in Fig. 9.
And as the configuration ratio of self-suspended proppant decreases, the proppant mass percentage of the supported joints first decreases and then increases, reaching a minimum value of 26.46% at the configuration ratio of 6:1.
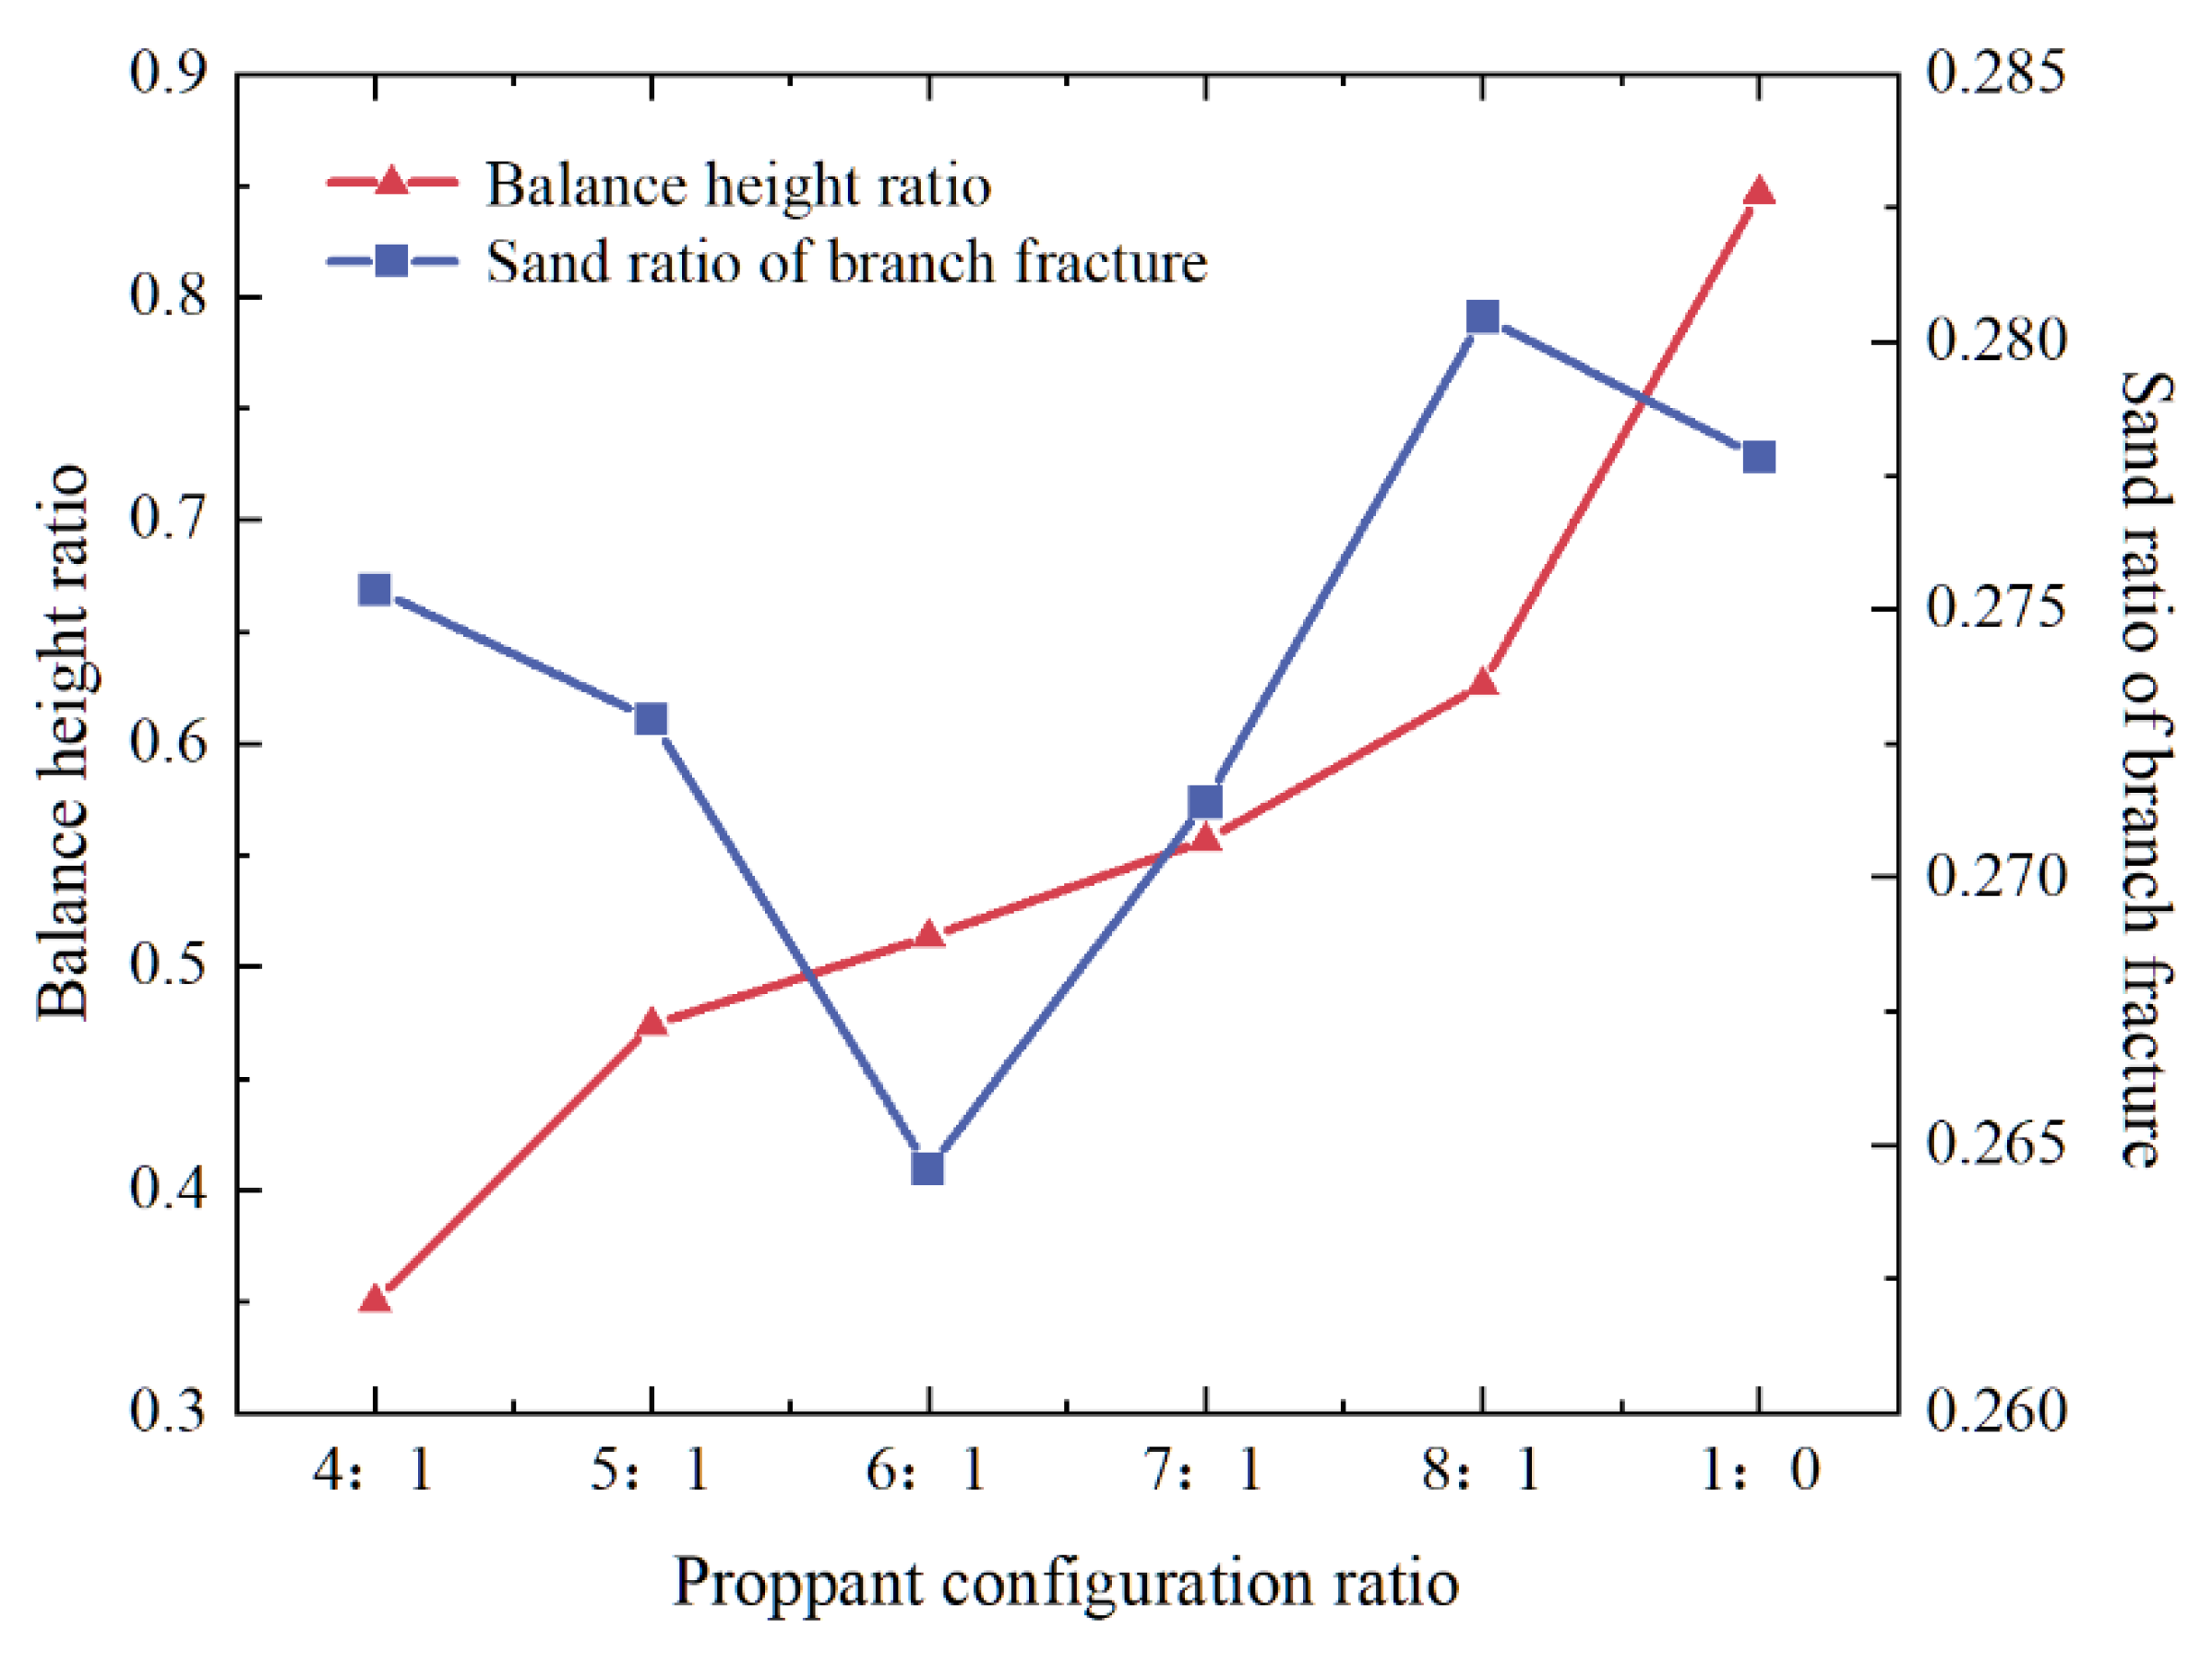
Figure 9: Percentage of balance height of sand and percentage of mass of proppant entering the support joints under different proportioning conditions.
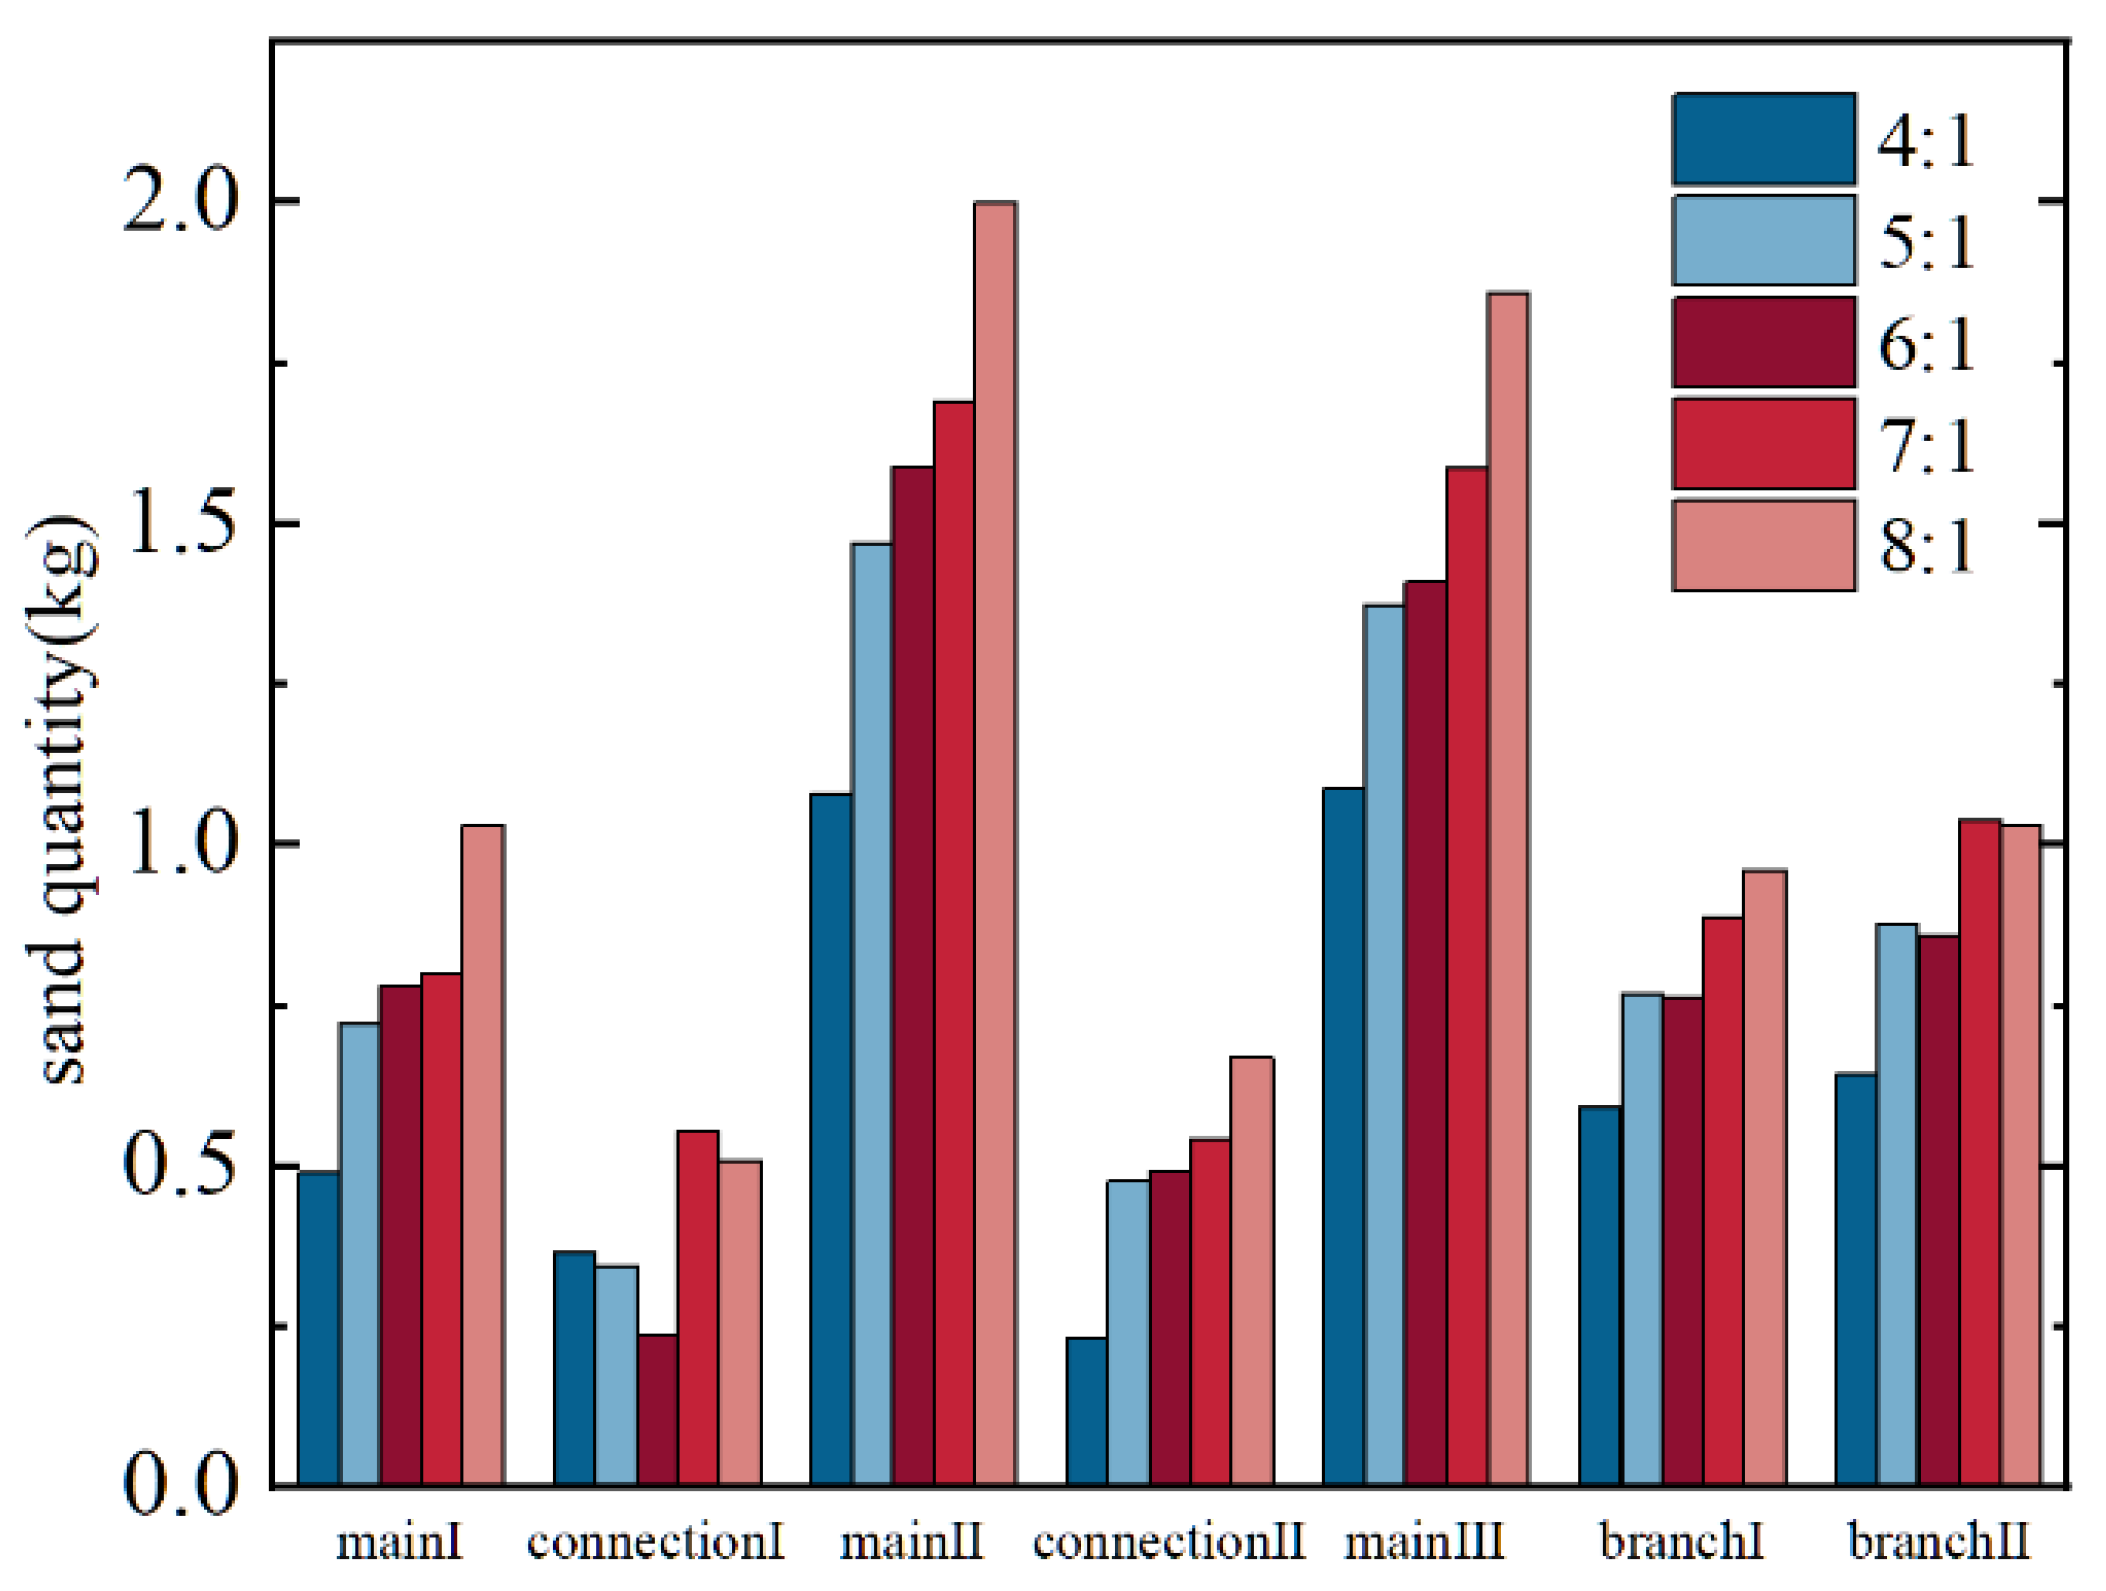
Figure 10: Mass distribution of proppant under different proportioning conditions.
Fig. 11 shows the proppant accumulation pattern within the complex fracture under different injected sand ratios, and it can be seen that the sand ratio has a significant effect on the proppant accumulation pattern in the near-well zone, and the proppant is uniformly spread in the first plate under the condition of sand ratio of 10%; when the sand ratio is 15%, the initial sand dike is furthest from the wellbore, and a large area of unpaved area occurs in the near-well zone. With the sand ratio further increasing, the initial distance between the initial sand dike and the wellbore decreases as shown in Fig. 11a. The same pattern is observed in the secondary fracture, where as the concentration of self suspending proppant increases, the height of the secondary seam sand embankment decreases, indicating an increase in its sand carrying capacity, as shown in Fig. 11b.
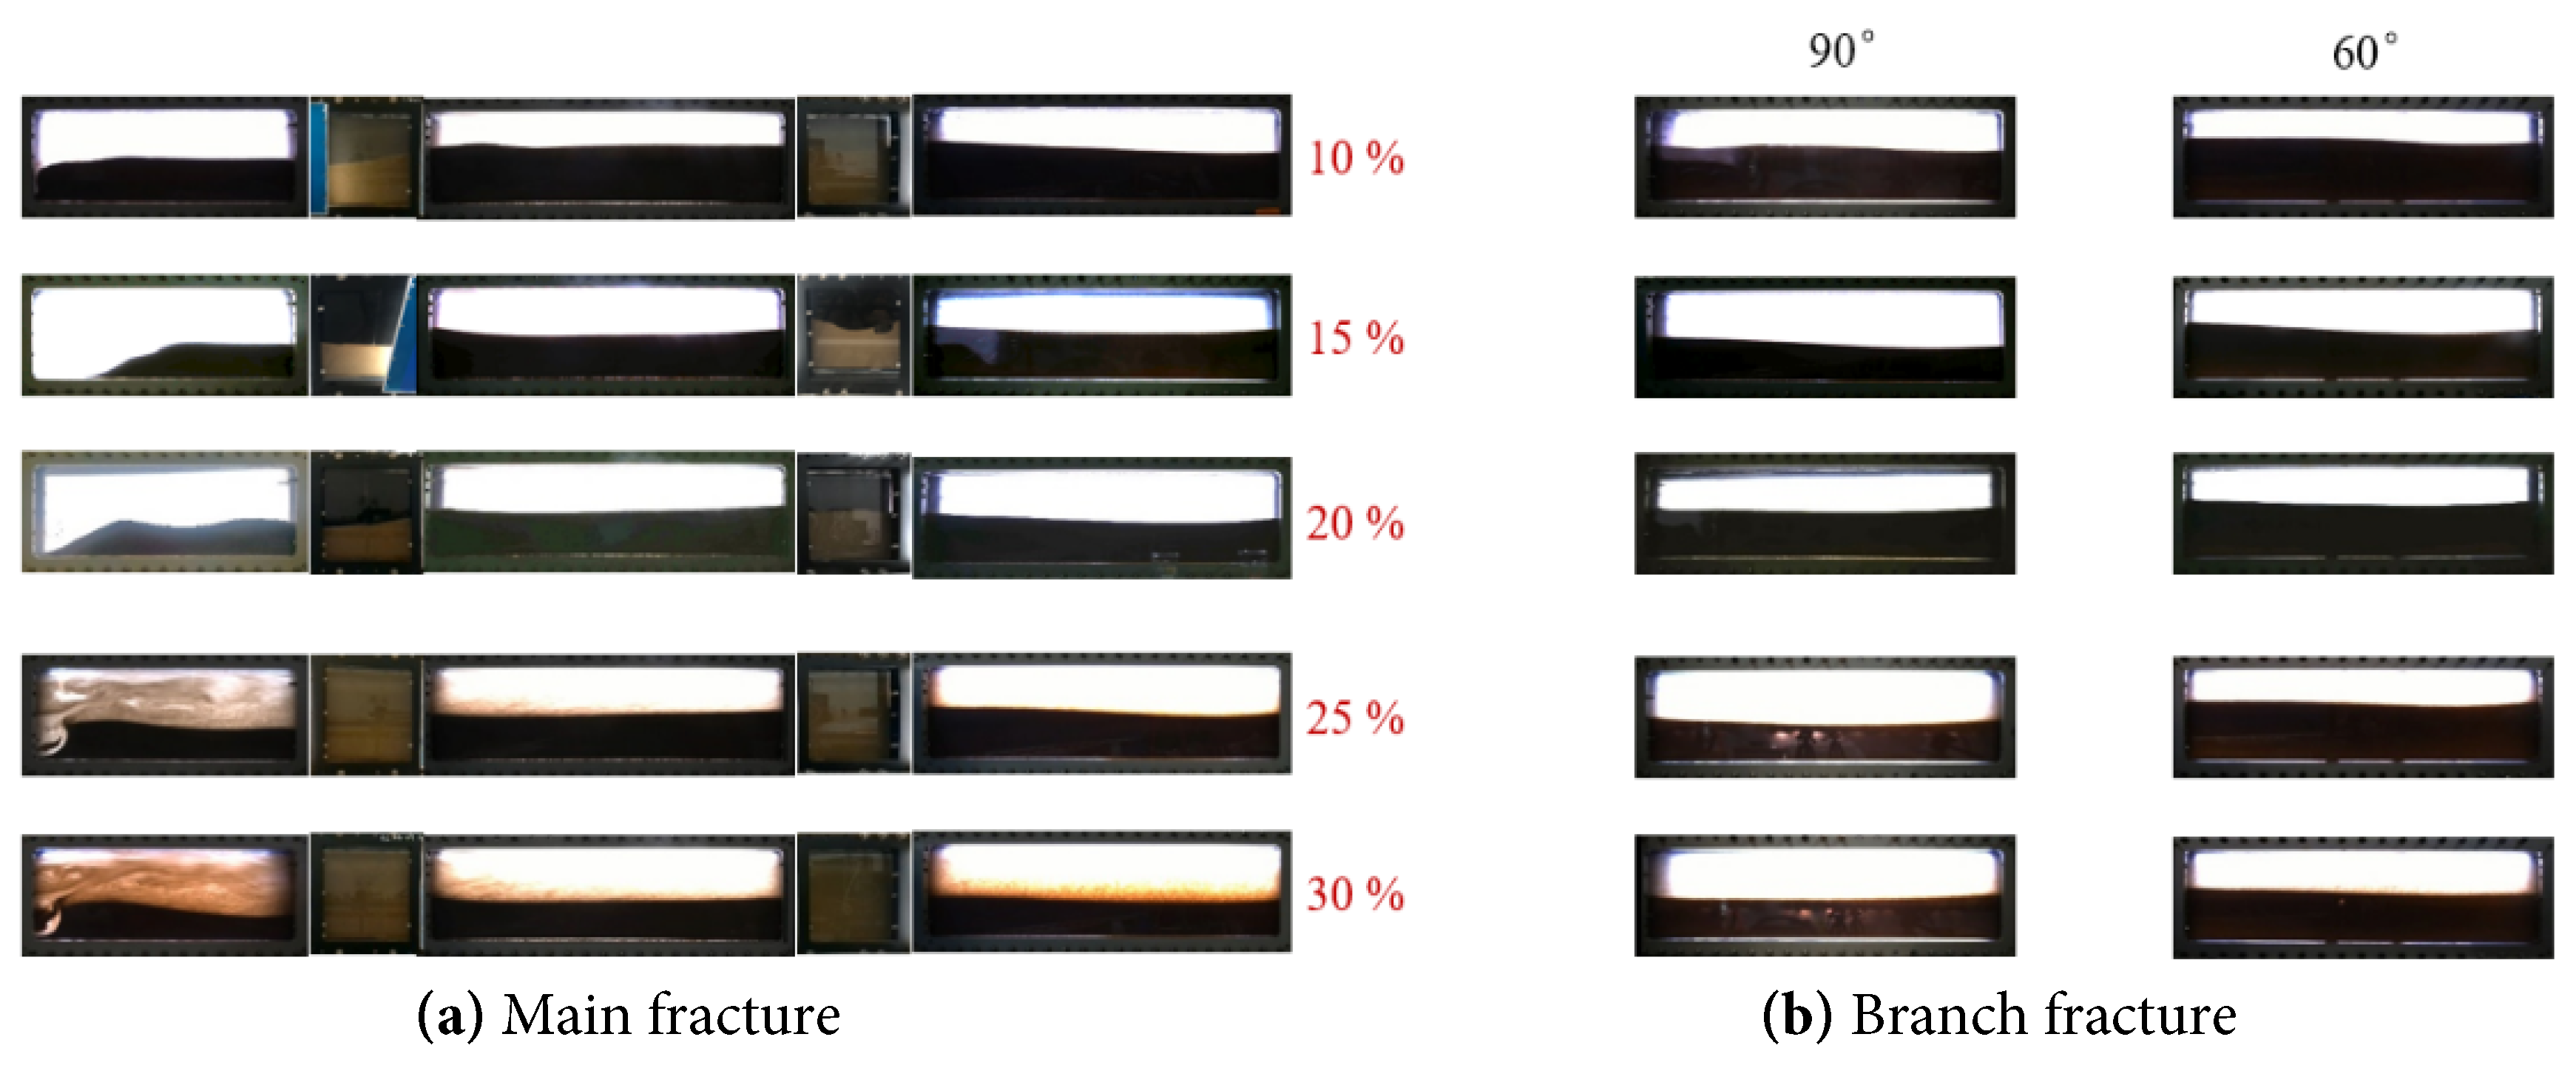
Figure 11: Proppant accumulation pattern under different injected sand ratio conditions, (a) Main fracture, (b) Branch fracture.
Fig. 12 demonstrates the percentage of equilibrium height of sand dykes, as the sand ratio increases from 10% to 30%, the equilibrium height of sand dykes within the complex fractures shows a decreasing trend from 63.8% to to 44.9%; when the sand ratio increases from 10% to 15%, the equilibrium height appears to be decreased substantially; when the sand ratio increases from 15% to 25%, the equilibrium height does not change much; when the sand ratio increases from 25% to 30%, the small decrease in equilibrium height.
For the proppant mass share of the support joints, it can be seen from Fig. 12 that, except for the case of sand ratio of 20%, the proppant mass share of the support joints under other conditions does not differ much, between 25.1% and 25.7%; when the sand ratio is 20%, the proppant mass share in the support joints is the highest, 27.3%. Analyzing the reason for this in conjunction with Fig. 13, when the sand ratio is 20%, the mass percentage of proppant in the first and second panels is similar to that in the sand ratio of 25%, while it is obviously lower in the third panel, but its percentage in the 90° branch fracture is higher, which indicates that proppant enters into a higher percentage of the 90° branch fracture.
The results of the equilibrium height and proppant mass distribution in Fig. 12 and Fig. 13 are quite different from the laying down law of conventional proppant fracturing, and usually, when using conventional proppant for fracturing, the larger the sand ratio is, the faster the proppant settles, and the higher the equilibrium height of the sand bank is; however, for the present experiments, the increase of the injected sand ratio also increases the ratio of injected self-suspended proppant to the liquid, which results in the change of the concentration of the sand feed at the same time, the sand-carrying capacity of the liquid is also changing, and the two together affect the proppant placement effect.
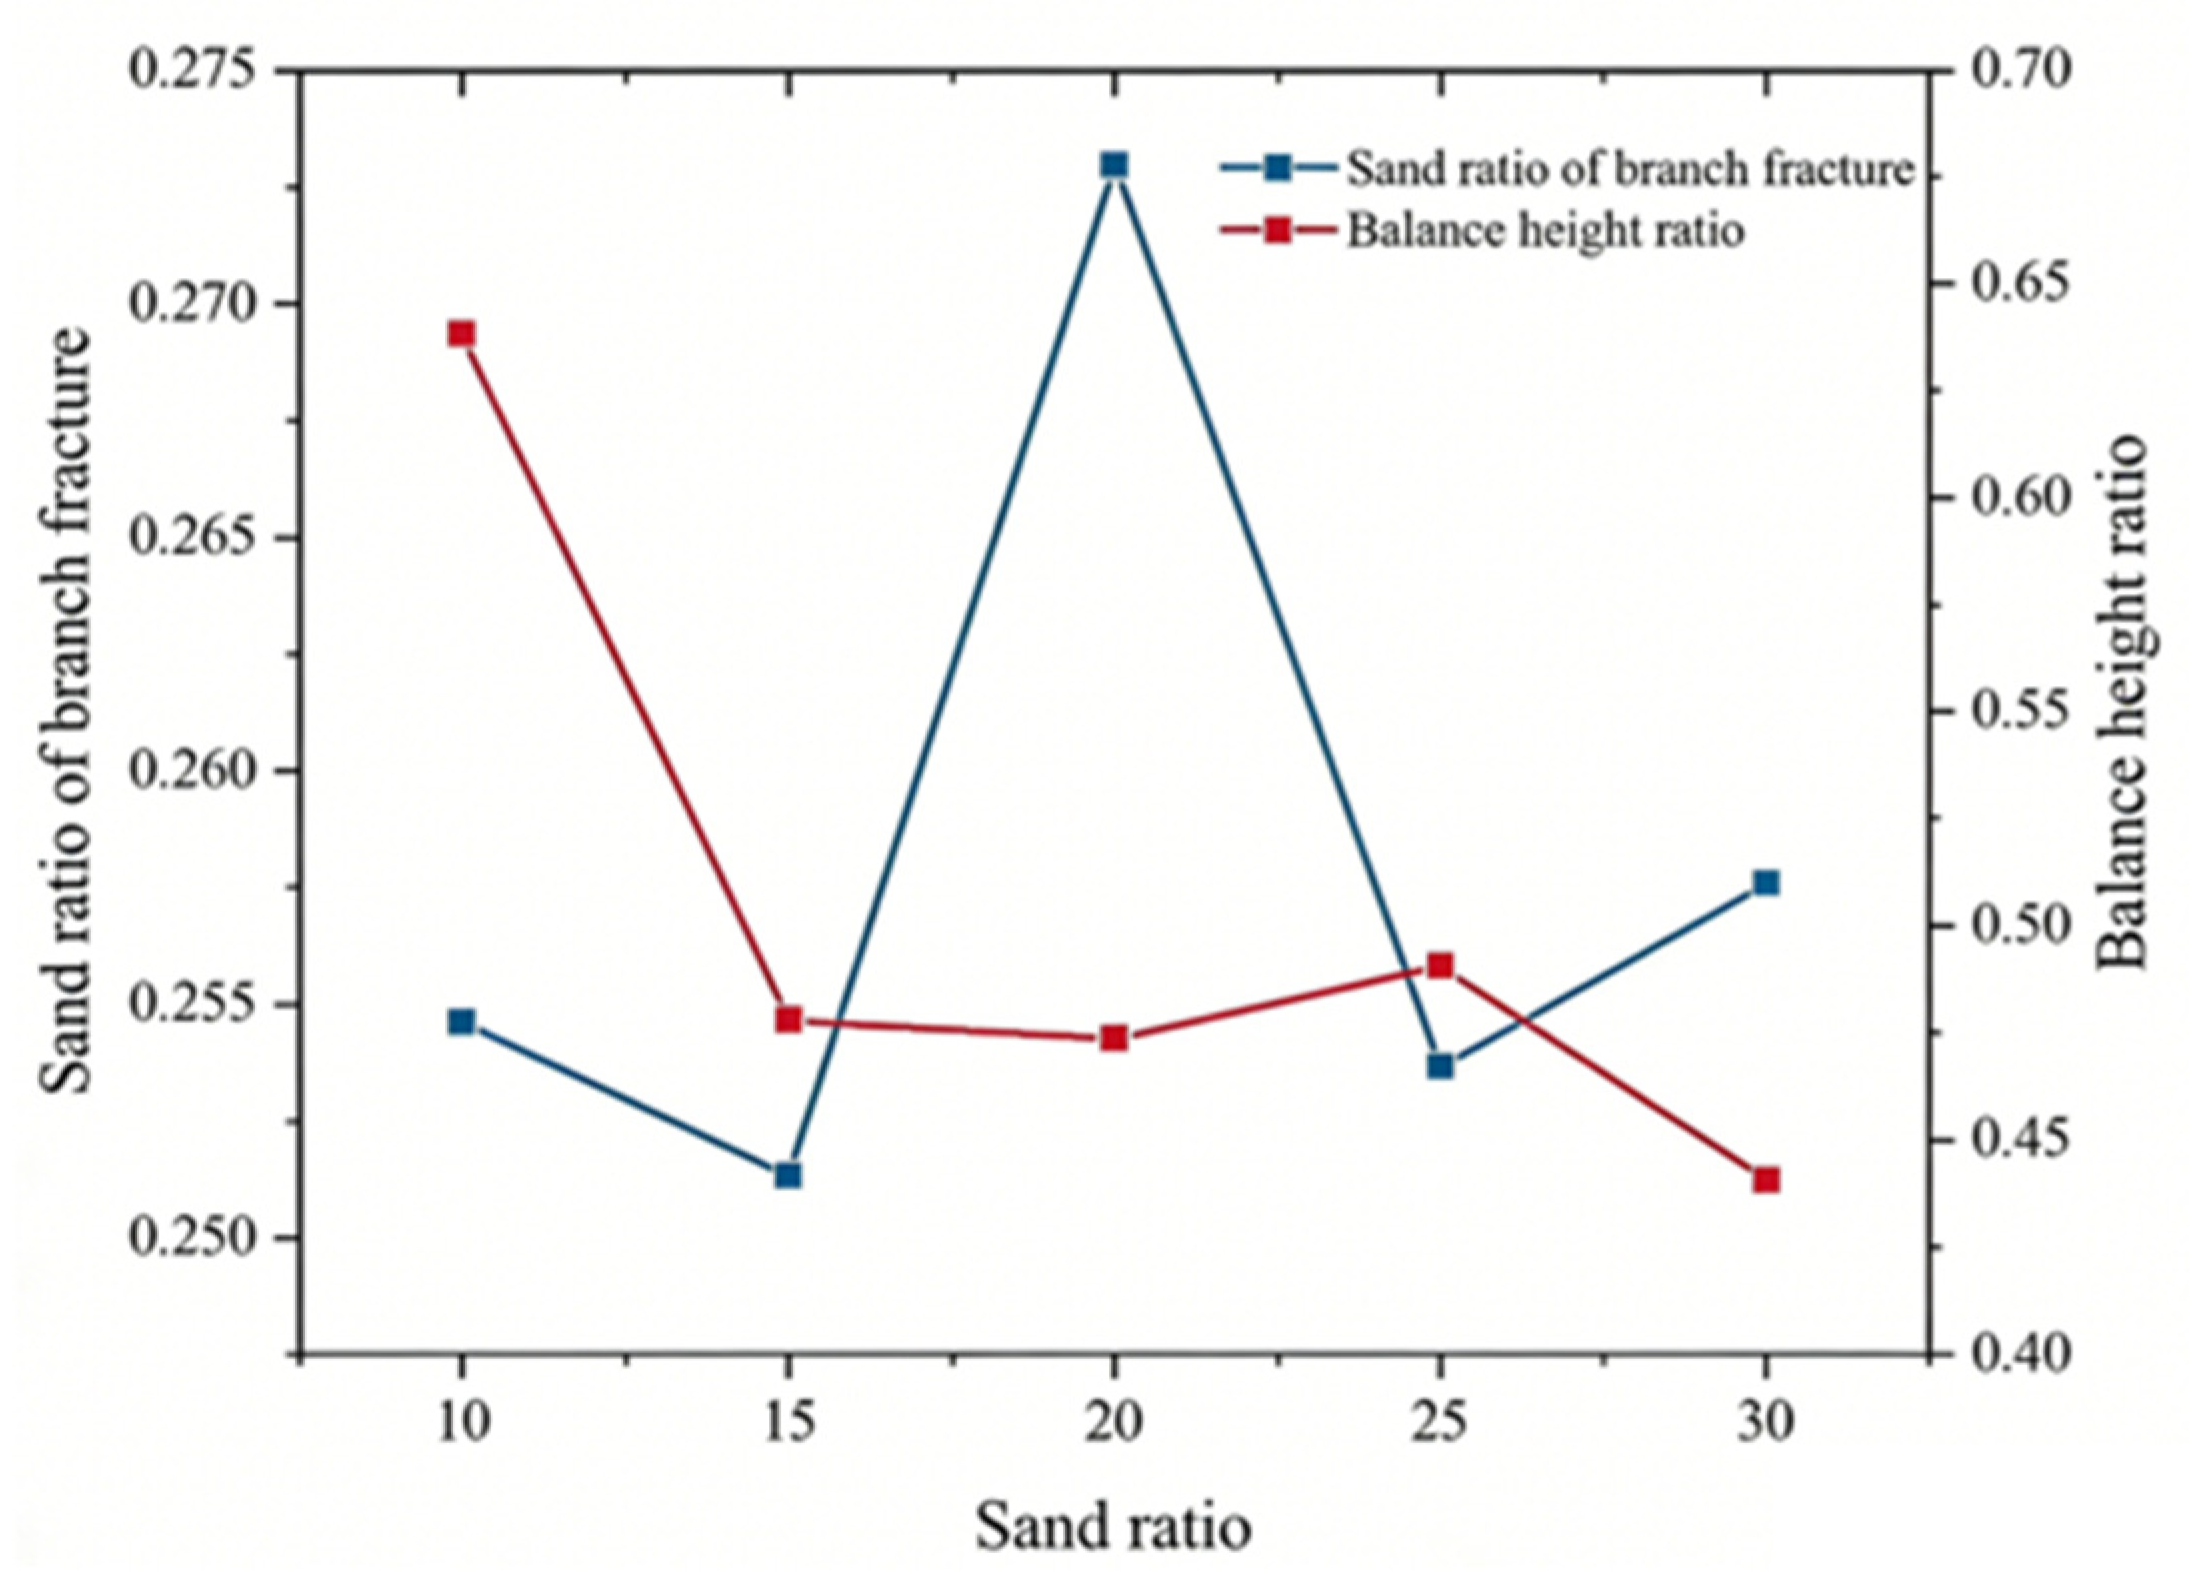
Figure 12: Percentage of equilibrium height of sand dikes and percentage of mass of proppant entering the support joints for different discharge conditions.
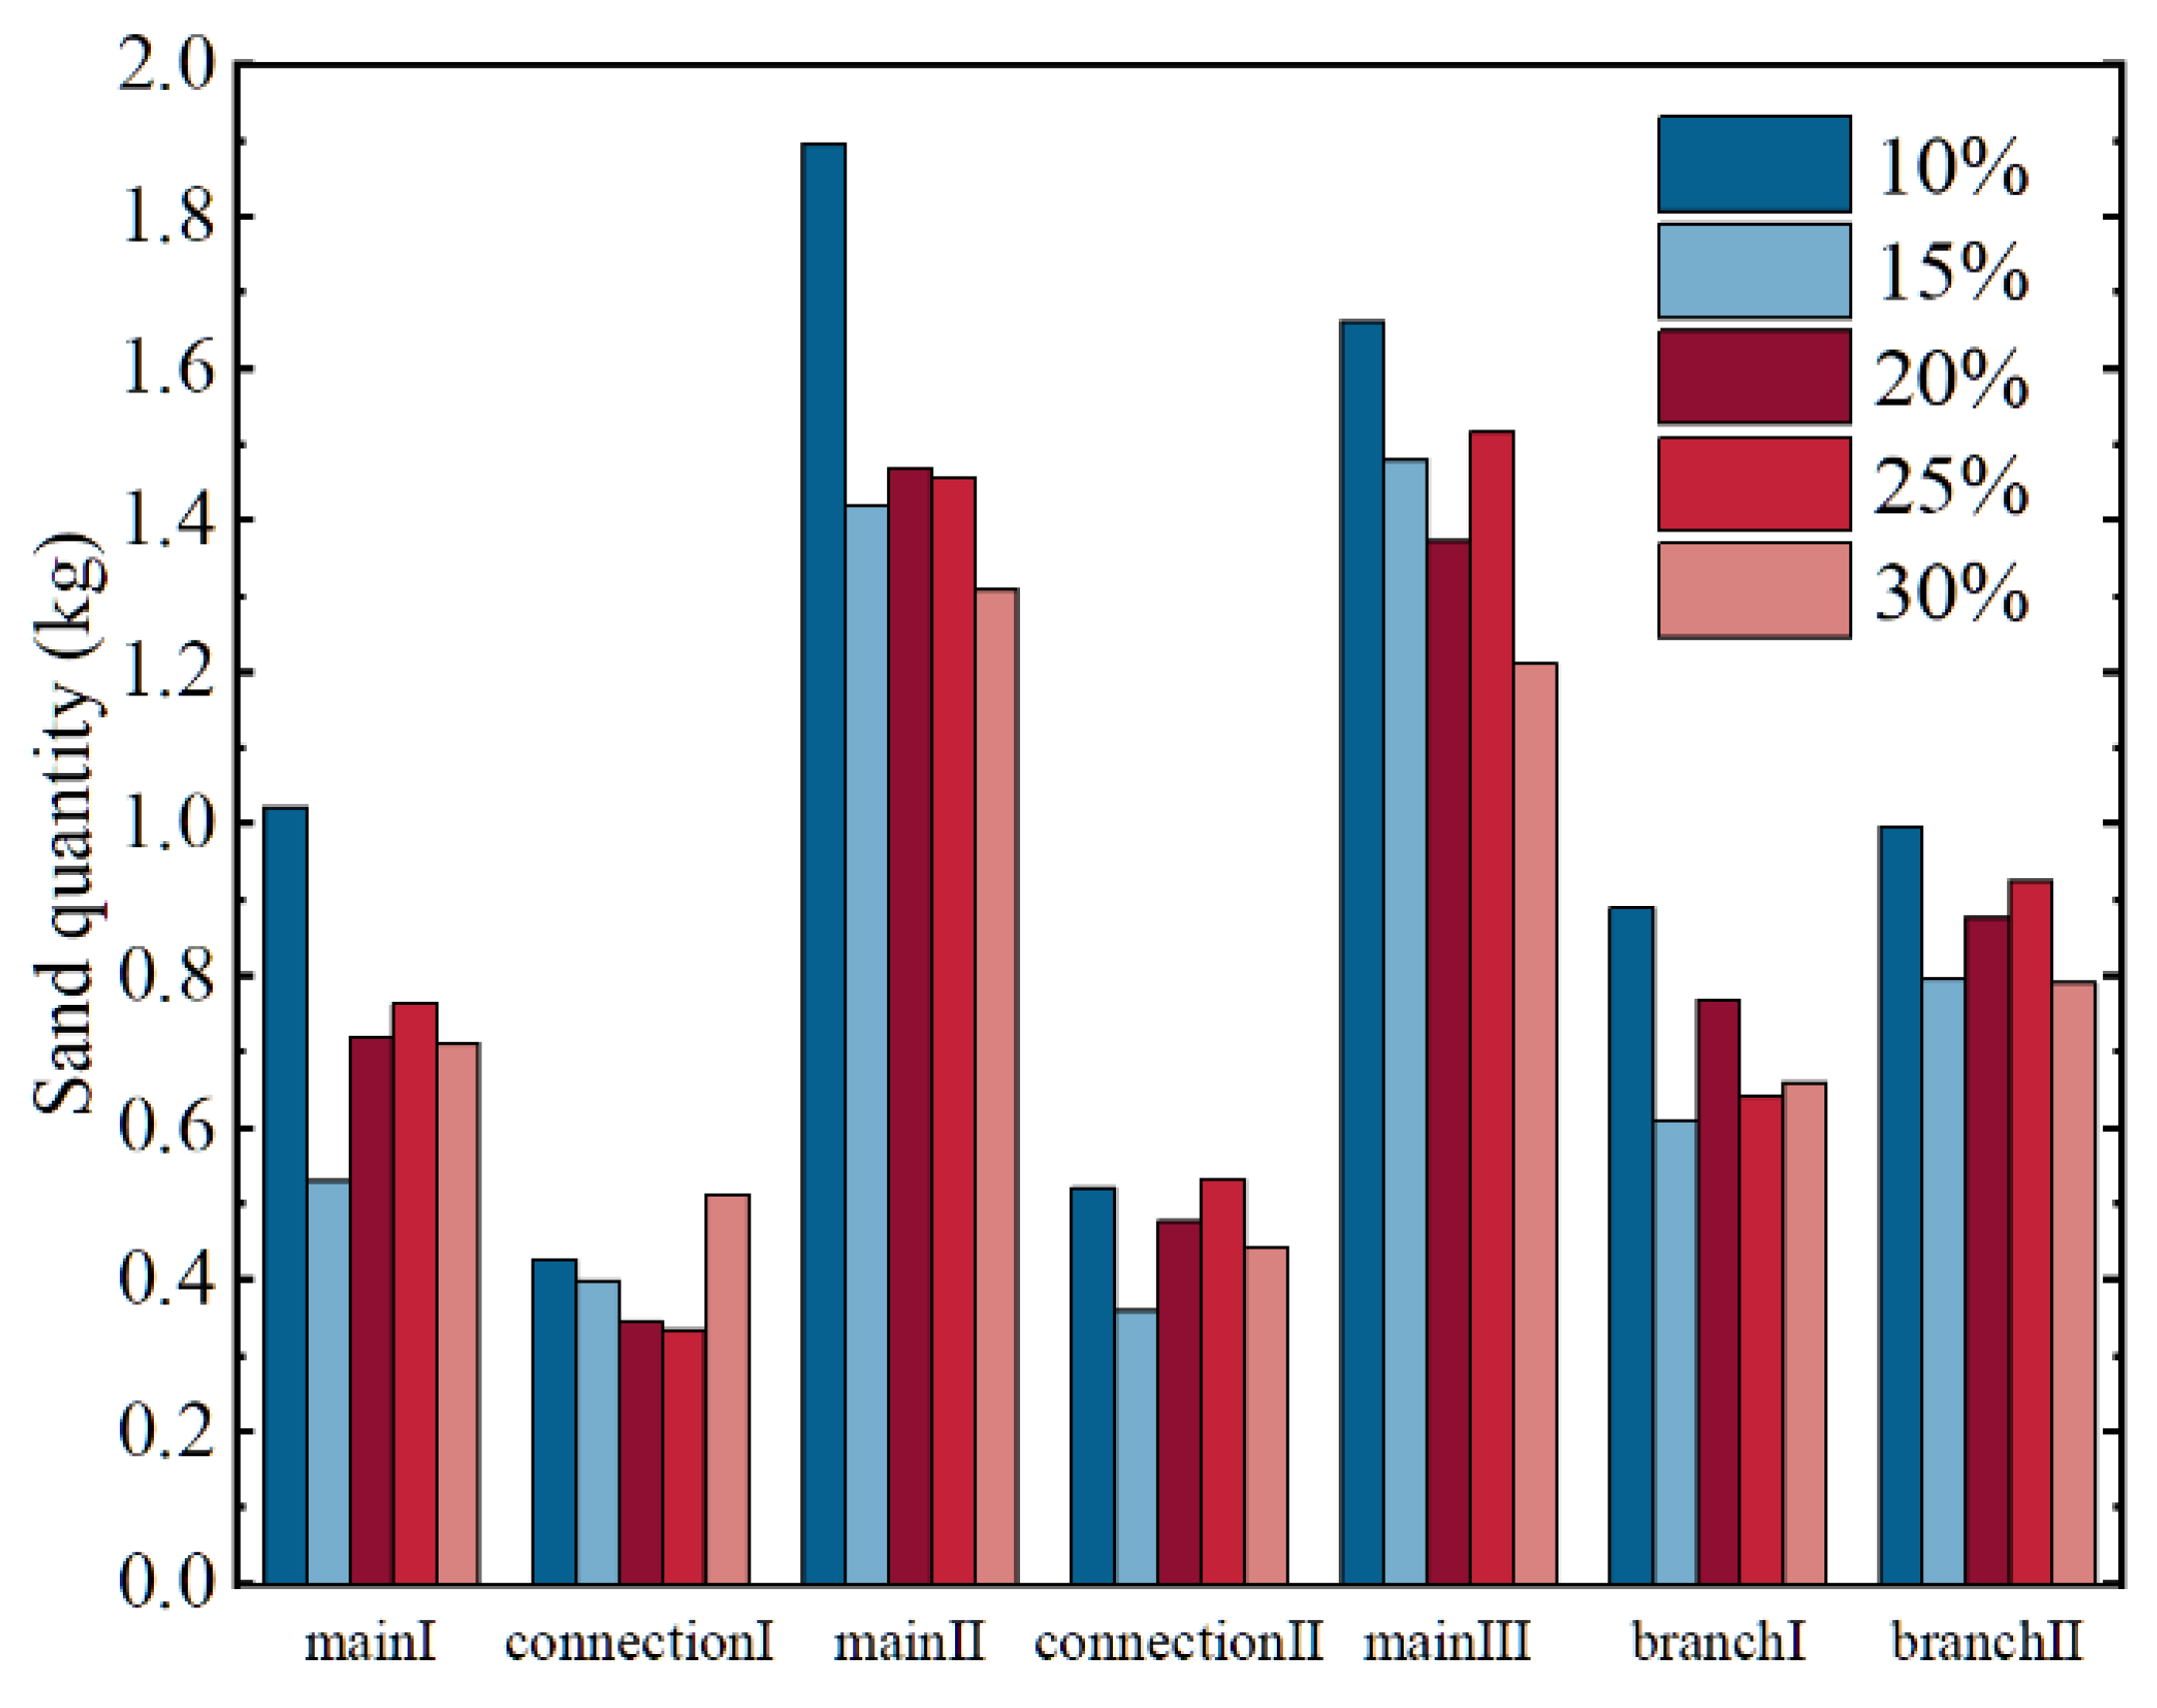
Figure 13: Proppant mass distribution for different sand ratio conditions.
Fig. 14 demonstrates the proppant buildup morphology under different perforation locations, and it can be clearly seen that the injection hole position mainly affects the sandbank morphology in the near-well region, while the buildup morphology is basically the same in other positions.
In this paper, the flow field in the near-well region during the placement process is intercepted, i.e., Fig. 15, and it can be found that the vortex morphology in the region changes significantly under different Perforation location; in the case of three-hole injection, i.e., with the upper, middle and lower holes fully open, the generation of large-scale vortices is suppressed due to the interaction of the three jets and the region is characterized by only small-scale disordered vortices, which are more in number; for the case of middle-hole injection, the region generates multiple small-scale vortices, and the downward separation of the jet separates the vortex to roll the proppant to the vicinity of the wellbore or to carry the proppant to the rear, resulting in no proppant buildup in the rear half of the first plate; for mid-upper borehole injection, due to the mutual interference of the two jets and the suppression of the vortex at the top of the fracture, the region generates a large-scale vortex that rolls the proppant back to the vicinity of the wellbore, while the tail of this region still has a small amount of However, the scouring effect of the large-scale vortex on the sand dike in the near-well region resulted in a lower height of the sand dike. During injection in the middle and lower holes, there was no large-scale vortex in the region due to the influence of the proppant buildup at the bottom of the fracture, and there was a vortex in the middle of the region that rolled the proppant back to the vicinity of the wellbore for buildup, while the lower holes were continuously scouring the sand dike.
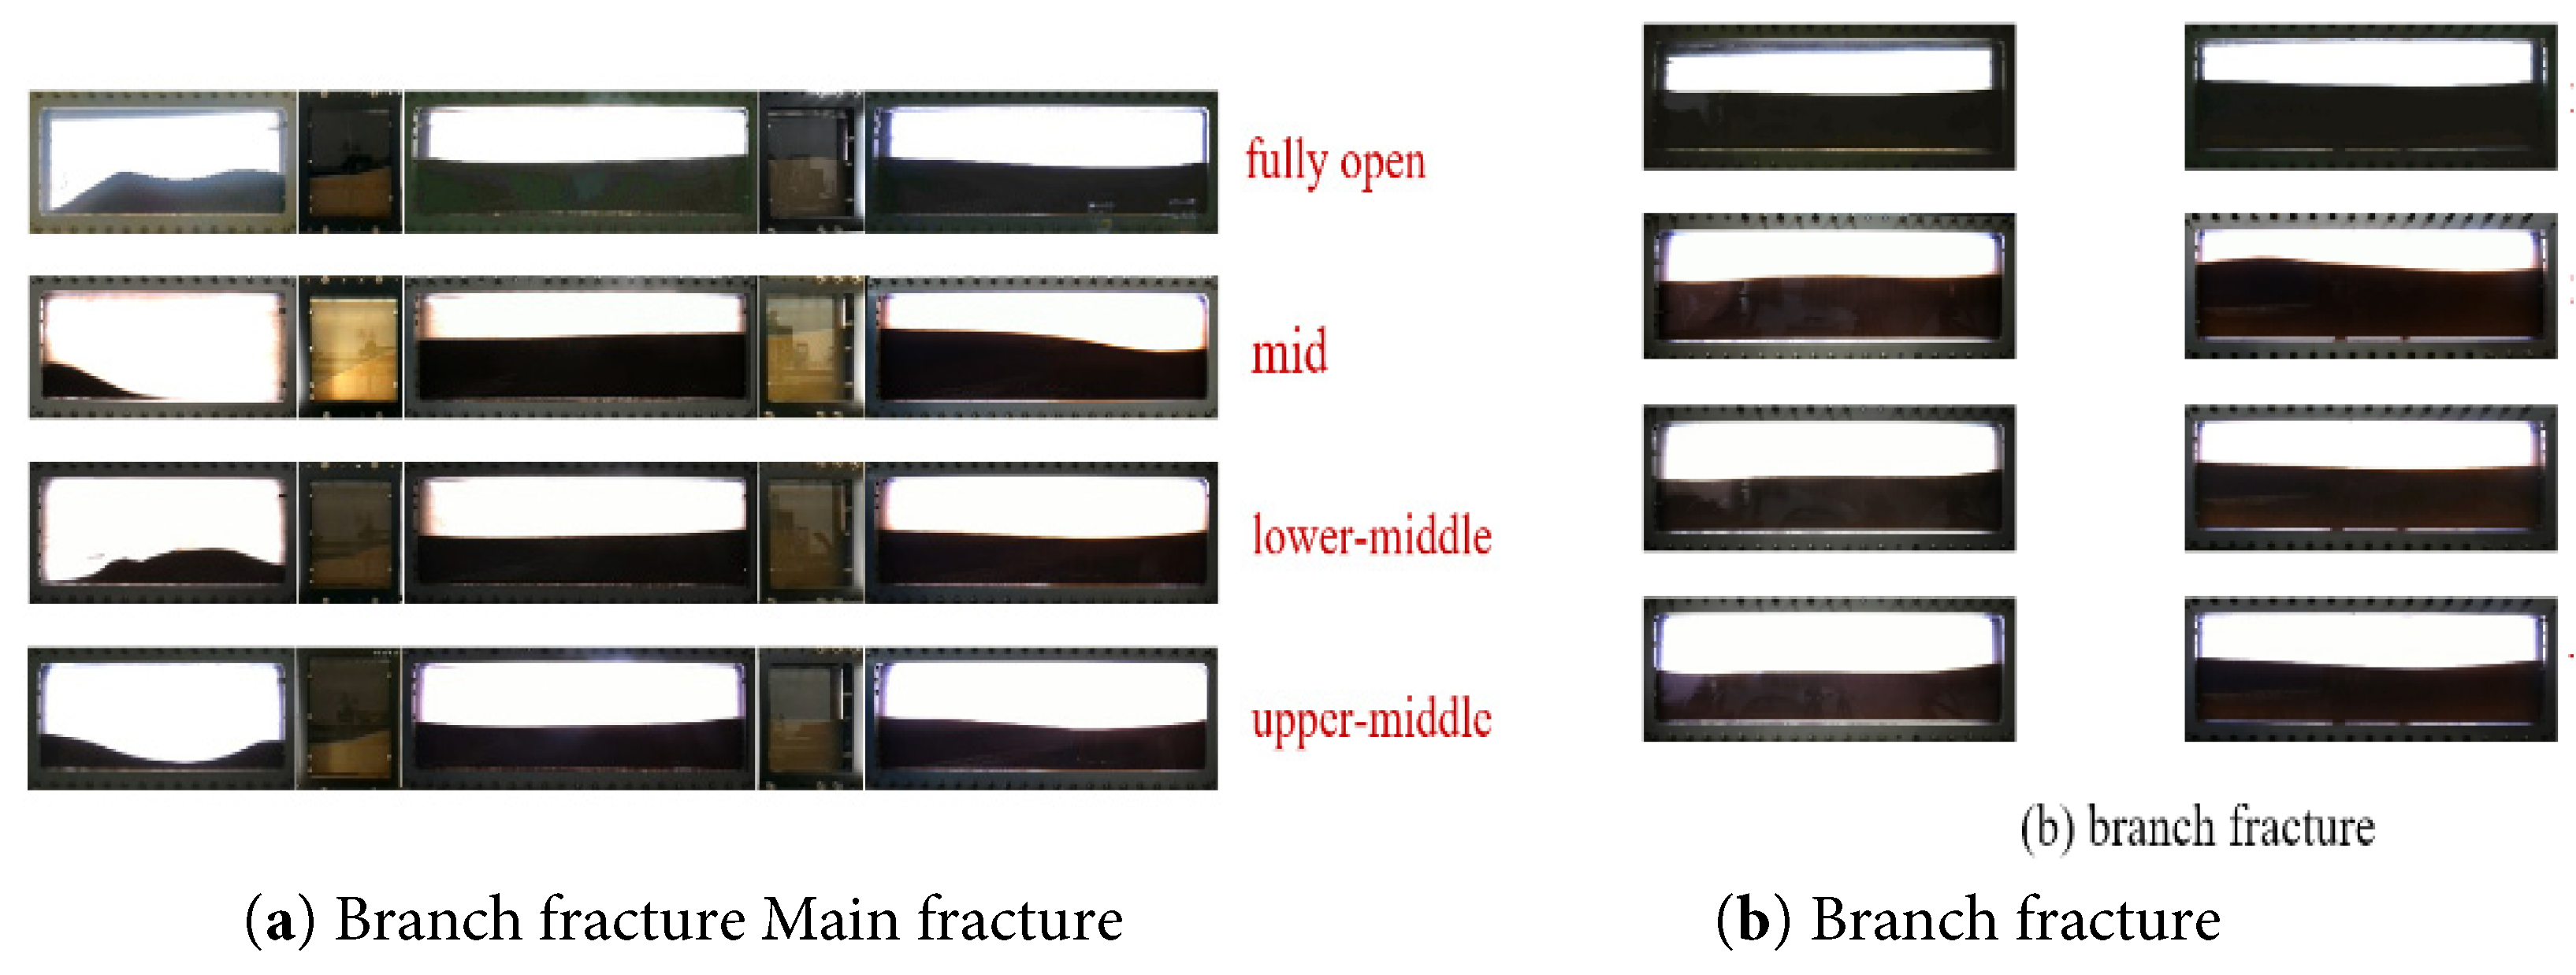
Figure 14: Proppant stacking pattern under different shot hole conditions, (a) Main fracture, (b) Branch fracture.
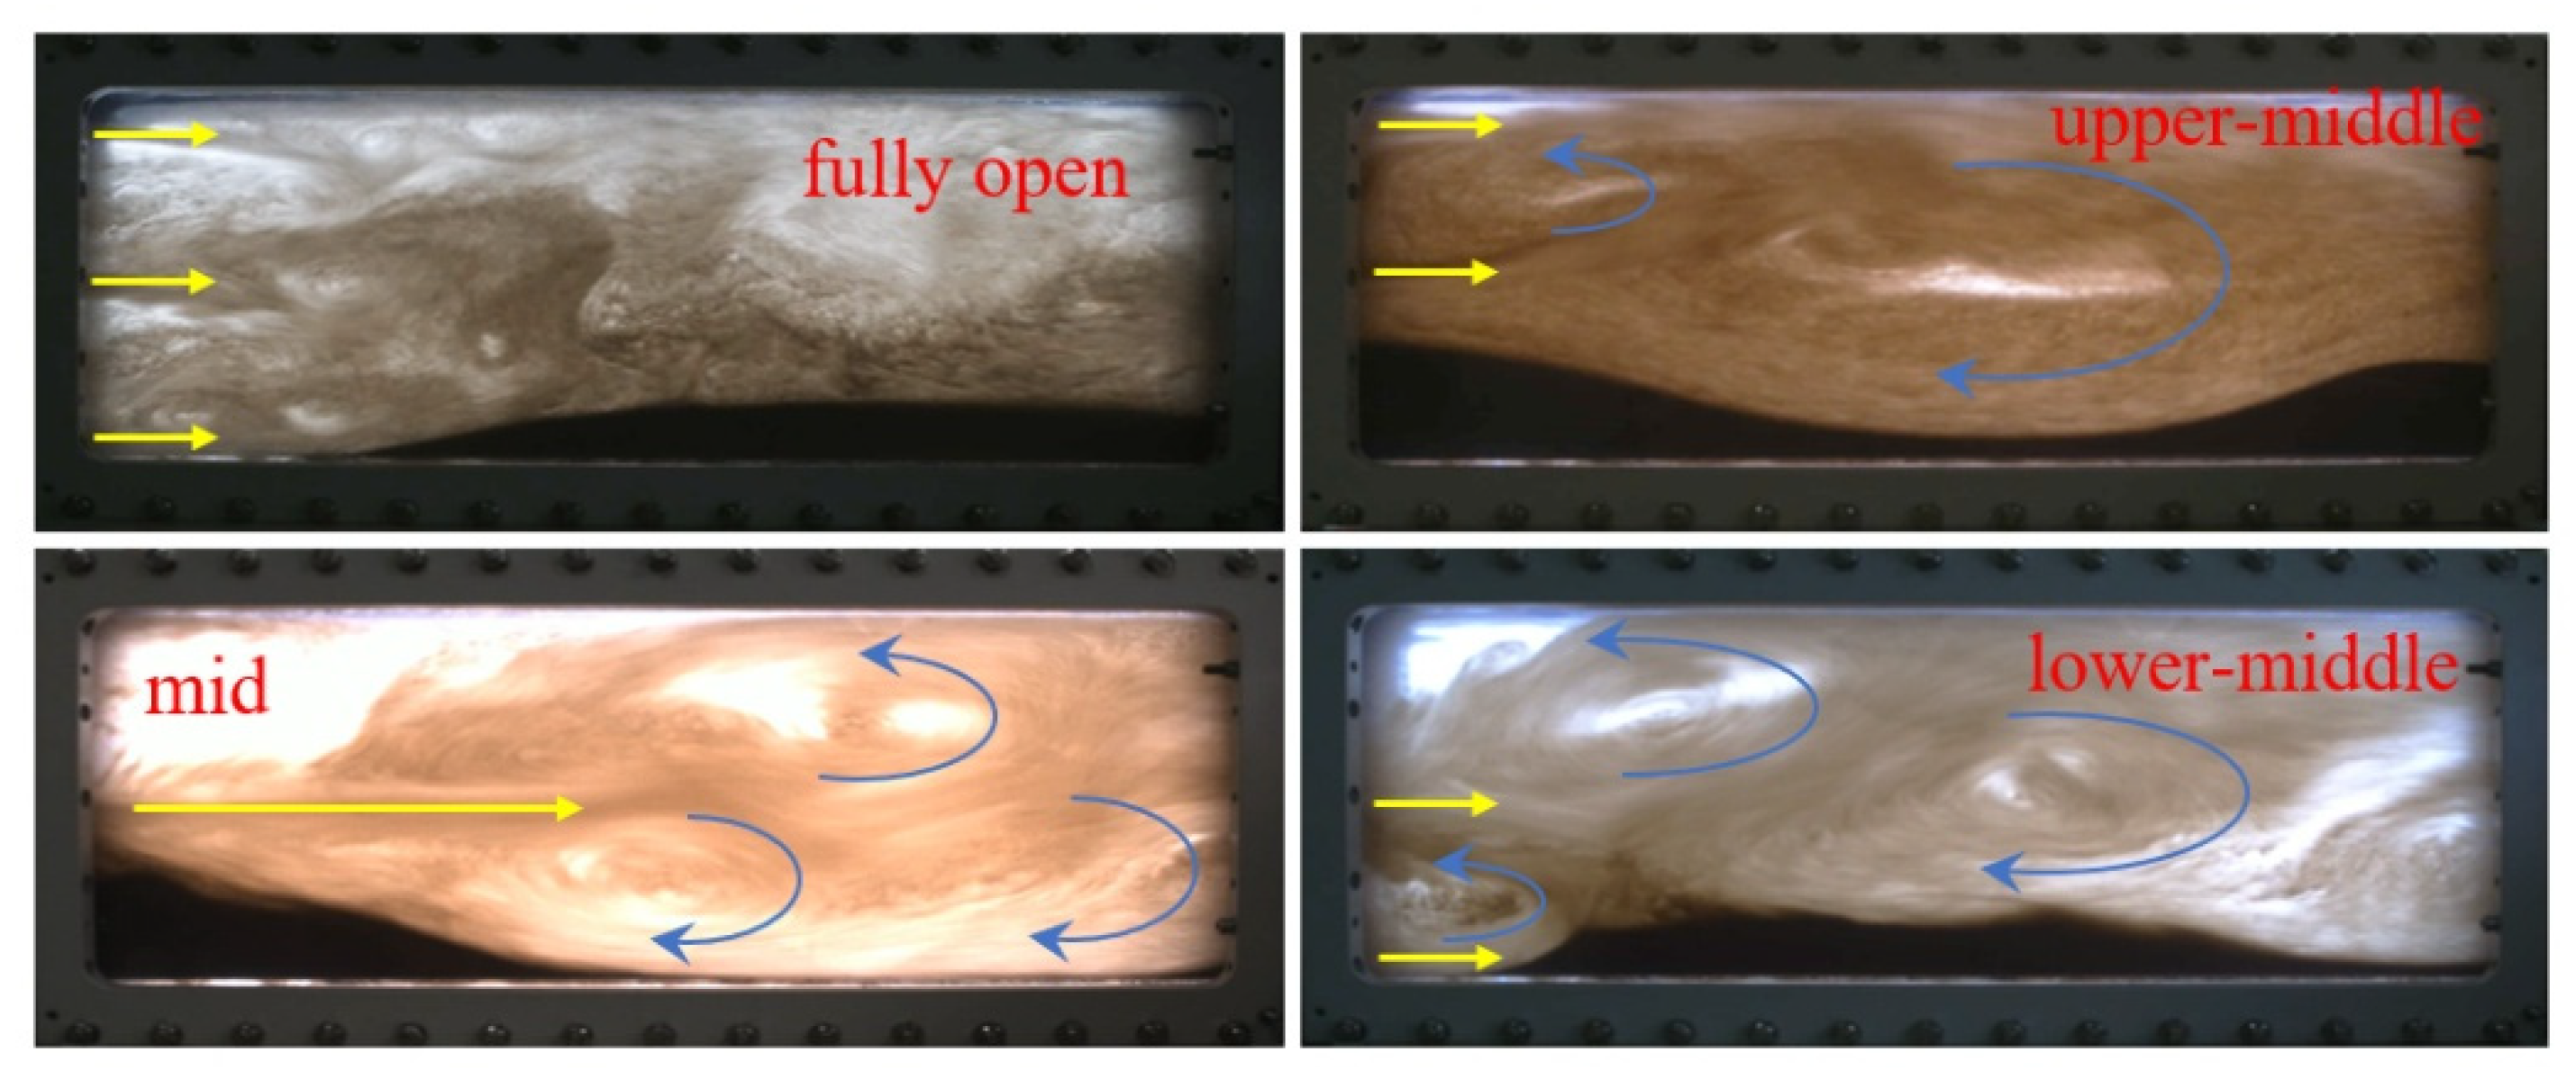
Figure 15: Flow field in the near-well region during layup under different injection conditions.
Different injection positions had little effect on the percentage of proppant mass entering the branch fracture, while the effect on the equilibrium height was more significant (Fig. 16). The equilibrium heights are similar for three-hole injection and lower-middle hole injection, with the largest percentage of equilibrium height for middle-hole injection and the smallest for upper-middle hole injection. In the case of mid-hole injection, the vortex is formed due to the shear of the fluid and there is no influence of other jets or walls, the energy dissipation is large, the maximum velocity of the fluid decreases [32], the trailing force on the proppant decreases, and settling is more likely to occur compared to the other injection hole locations, and therefore is more distributed in the other plates and the equilibrium height is higher. When injected in the upper and middle holes, the proppant takes longer to settle and travels farther due to the influence of the upper hole jet, and is less distributed in the individual plates (Fig. 17), resulting in a lower equilibrium height.
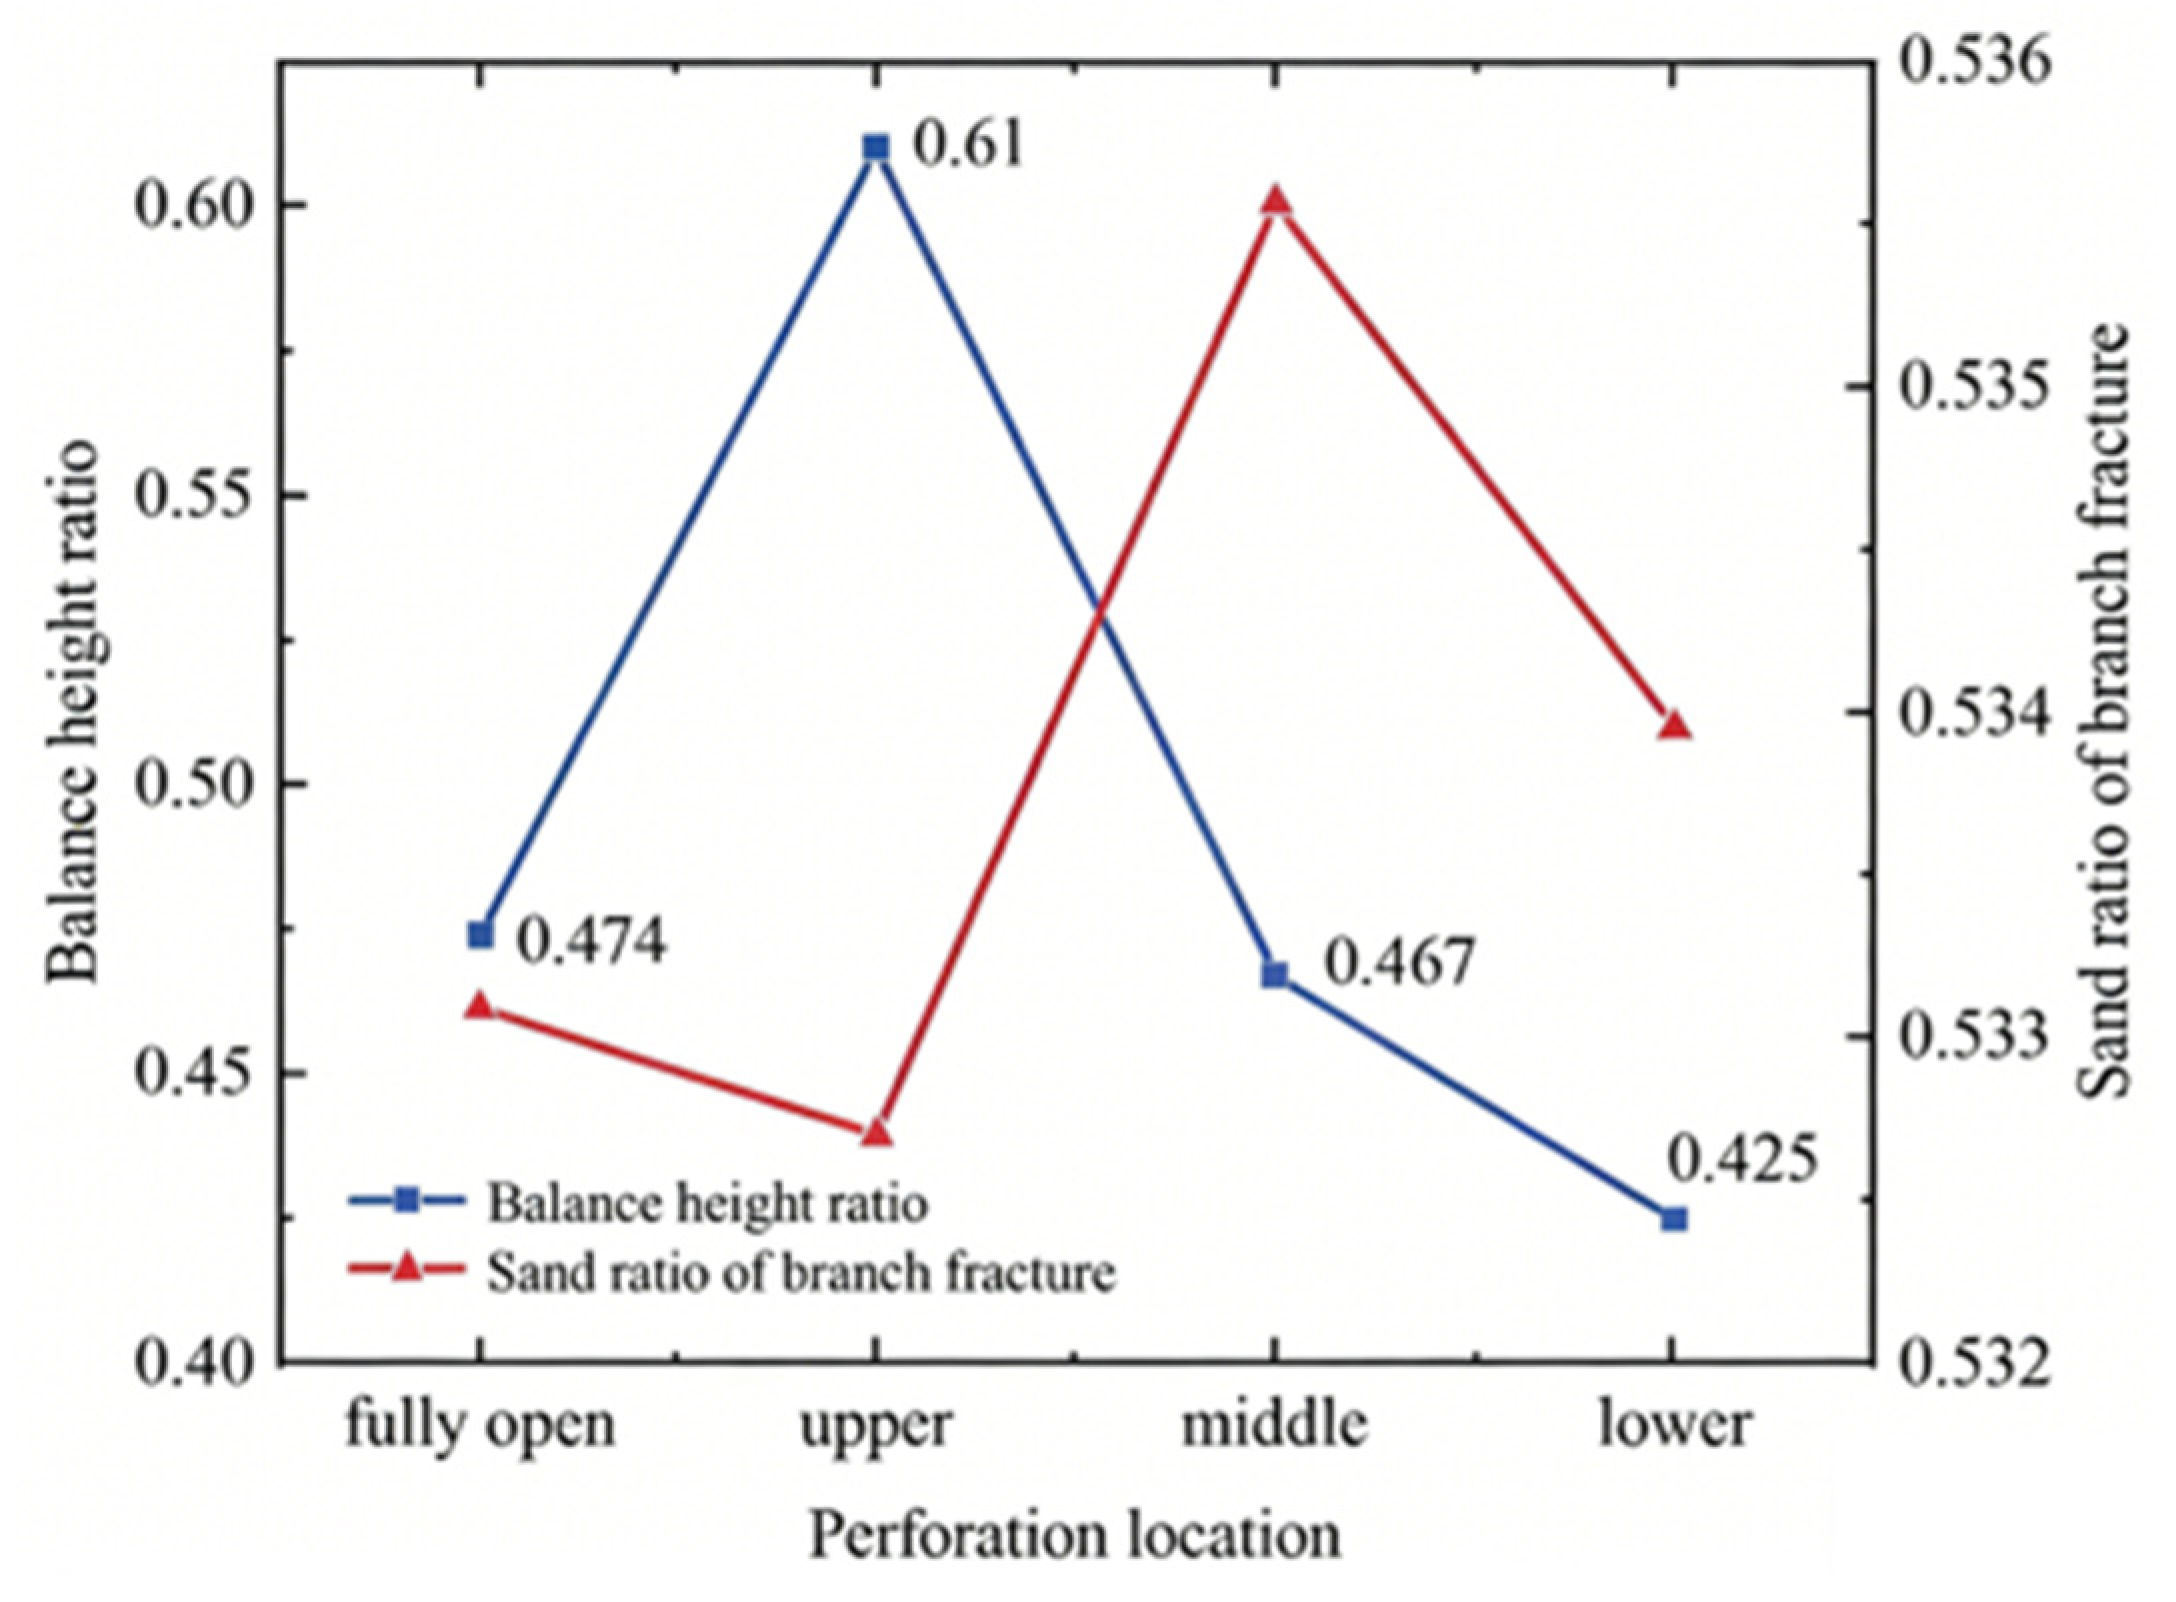
Figure 16: Percentage of equilibrium height of the sand dike and percentage of mass of proppant entering the support joints for different shot hole location conditions.
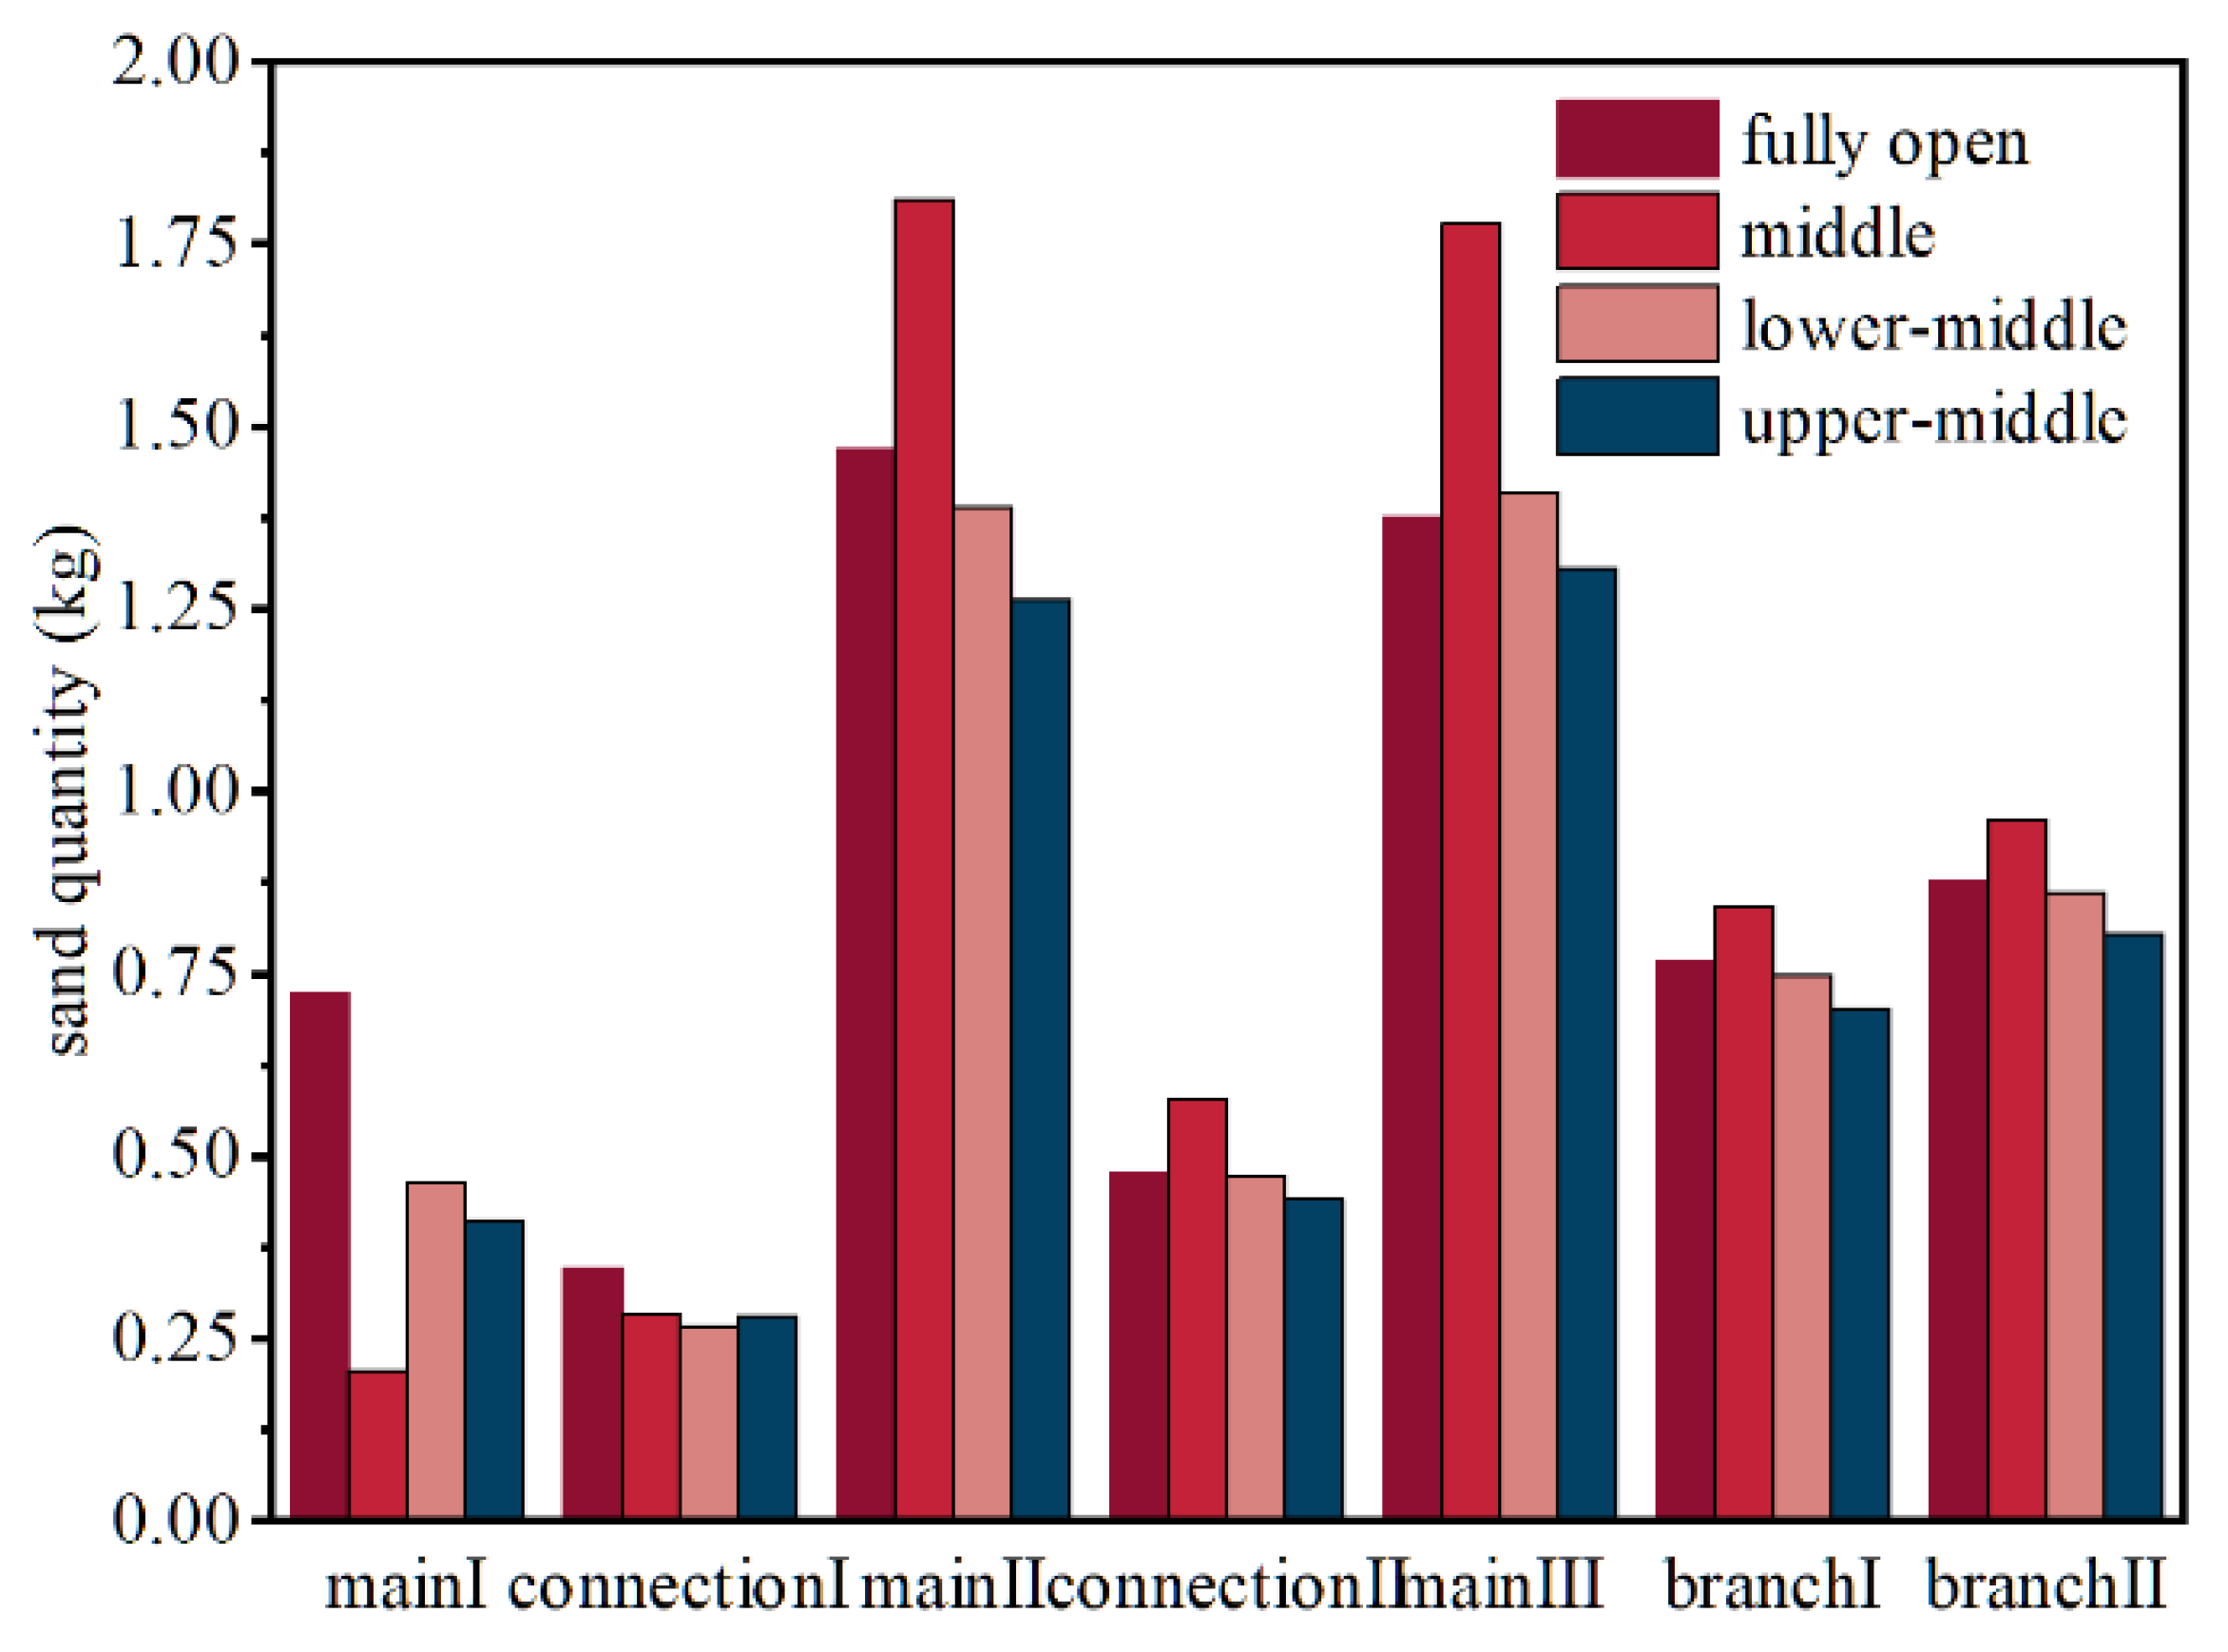
Figure 17: Proppant mass distribution under different shot hole conditions.
In this paper, the simulation experiment of indoor self-suspended proppant-assisted sand transportation was carried out, and the experimental conditions were determined based on the similarity principle according to the on-site construction parameters, to study the influence of injection rate, proppant ratio, and sand volume on the proppant placement pattern in complex fractures, and the main conclusions are as follows:
- (1)The use of self-suspended proppant for assisted sand carrying will change the sand bank placement pattern. The proppant first settles at the fracture entrance and gradually reaches the equilibrium height before piling up along the length of the fracture in the case of quartz sand freshwater fracturing, whereas in the case of self-suspended proppant-assisted sand carrying, the proppant is uniformly laid to the equilibrium height along the height direction of the fracture.
- (2)Discharge rate has a significant effect on the scouring of the sand dike in the near-well region, and it is expected that there is a critical discharge rate between 30 L/min and 40 L/min that will block the downhole. When the discharge rate is greater than 30 L/min, the inlet slope angle shows an exponential increase with the increase of the discharge rate, and the proportion of proppant in the support joint increases linearly.
- (3)The ratio affects the viscoelasticity of the liquid, which in turn affects the settlement of particles. The equilibrium height of sand embankment increased with the decrease of the proportion of self-suspended proppant, while the proportion of mass of proppant in the support joints decreased and then increased, and reached a minimum value of 26.46% at the ratio of 6:1.
- (4)The effect of sand ratio on the assisted sand transport of self-suspended proppant is different from that of conventional proppant in that changing the sand ratio will change the ratio of liquid to self-suspended proppant, which in turn affects the sand transport capacity of the liquid. As the sand ratio increases, the equilibrium height of the sand embankment shows an overall decreasing trend, and the proportion of the mass of the proppant entering the support joints is highest at a sand ratio of 20%.
Acknowledgement:
Funding Statement: This research originated from the China National Petroleum Corporation’s Forward-Looking Fundamental Technology Breakthrough Project (2021DJ2305).
Author Contributions: The authors confirm contribution to the paper as follows: Study conception and design, Yang Zhang; writing—original draff preparation, Xiaoping Yang, Yalan Zhang; writing—review and editing, Mingzhe Han; funding acquisition and supervision, Jiayi Sun; investigation, Zhengsheng Xia. All authors reviewed and approved the final version of the manuscript.
Availability of Data and Materials: The data that support the findings of this study are available from the corresponding author upon reasonable request.
Ethics Approval: Not applicable.
Conflicts of Interest: The authors declare no conflicts of interest.
References
1. Shafiq MU , Alajmei S , Aljawad MS , Wang L , Bahri A . A comprehensive review of proppant selection in unconventional reservoirs. ACS Omega. 2025; 10( 13): 13046– 59. doi:10.1021/acsomega.4c09936. [Google Scholar] [CrossRef]
2. Ding X , Wang T , Dong M , Chen N . Influence of proppant size on the proppant embedment depth. ACS Omega. 2022; 7( 39): 35044– 54. doi:10.1021/acsomega.2c03879. [Google Scholar] [CrossRef]
3. Xu J , Dong D , Zhao Y , Wang M , Chen T , Fu W , et al. Effects of uneven proppant distribution in multiple clusters of fractures on fracture conductivity in unconventional hydrocarbon exploitation. Sci Rep. 2025; 15( 1): 9409. doi:10.1038/s41598-025-94406-2. [Google Scholar] [CrossRef]
4. Zhou D , Zhang Z , Hui F , Shi Y , Zhao C , Zhou Y . Experiment and numerical simulation on transportation laws of proppant in major fracture during slick water fracturing. Oil Drill Prod Technol. 2017; 39( 4): 499– 508. (In Chinese). [Google Scholar]
5. Guan BS , Liu YT , Liang L , Liu Q . Shale oil reservoir reconstruction and efficient development technology. Oil Drill Prod Technol. 2019; 41( 2): 212– 23. (in Chinese). [Google Scholar]
6. Tong S , Mohanty KK . Proppant transport study in fractures with intersections. Fuel. 2016; 181: 463– 77. doi:10.1016/j.fuel.2016.04.144. [Google Scholar] [CrossRef]
7. Barati R , Liang JT . A review of fracturing fluid systems used for hydraulic fracturing of oil and gas wells. J Appl Polym Sci. 2014; 131( 16): 40735. doi:10.1002/app.40735. [Google Scholar] [CrossRef]
8. Wang S , Zhang Y , Guo J , Lai J , Wang D , He L , et al. A study of relation between suspension behavior and microstructure and viscoelastic property of guar gum fracturing fluid. J Petrol Sci Eng. 2014; 124: 432– 5. doi:10.1016/j.petrol.2014.09.016. [Google Scholar] [CrossRef]
9. Fredd CN , McConnell SB , Boney CL , England KW . Experimental study of fracture conductivity for water-fracturing and conventional fracturing applications. SPE J. 2001; 6( 3): 288– 98. doi:10.2118/74138-pa. [Google Scholar] [CrossRef]
10. Yang B , Zhao J , Mao J , Tan H , Zhang Y , Song Z . Review of friction reducers used in slickwater fracturing fluids for shale gas reservoirs. J Nat Gas Sci Eng. 2019; 62: 302– 13. doi:10.1016/j.jngse.2018.12.016. [Google Scholar] [CrossRef]
11. Bulova M , Nosova K , Willberg D , Lassek J . Benefits of the novel fiber-laden low-viscosity fluid system in fracturing low-permeability tight gas formations. In: Proceedings of the SPE Annual Technical Conference and Exhibition; 2006 Sep 24–27; San Antonio, TX, USA. Sugar Land, TX, USA: Richardson Society of Petroleum Engineers; 2006. p. SPE 102956-MS. doi:10.2118/102956-ms. [Google Scholar] [CrossRef]
12. Sedillos L , Saxena J , Convers C , Dean E , Roundtree R . Slickwater, hybrid, self-suspending proppant: practical use of data analytics to determine hydraulic fracture fluids. In: Proceedings of the SPE Western Regional Meeting; 2019 Apr 23–26; San Jose, CA, USA. Sugar Land, TX, USA: Richardson Society of Petroleum Engineers; 2019. p. SPE 195304-MS. doi:10.2118/195304-ms. [Google Scholar] [CrossRef]
13. Quintero HJ , Mattucci M , O’Neil B , Folkes G , Zhang K , Wang CZ , et al. Enhanced proppant suspension in a fracturing fluid through capillary bridges. In: Proceedings of the SPE Western Regional Meeting; 2018 Apl 22–26; Garden Grove, CA, USA. Sugar Land, TX, USA: Richardson Society of Petroleum Engineers; 2018. p. SPE 190055-MS. doi:10.2118/190055-ms. [Google Scholar] [CrossRef]
14. Huang J , Lin L , Lin G , Richardi B , Liu F , Li J , et al. Measurement of the static proppant-settling velocity in fracturing fluids through digital image analysis. In: Proceedings of the SPE Annual Technical Conference and Exhibition; 2023 Oct 16–18; San Antonio, TX, USA. Sugar Land, TX, USA: Richardson Society of Petroleum Engineers; 2023. p. SPE 214965-MS. doi:10.2118/214965-ms. [Google Scholar] [CrossRef]
15. Guo K , Kang Y , Xu C , Lin C , Xie Z , You L , et al. A quantitative evaluation method for lost circulation materials in bridging plugging technology for deep fractured reservoirs. SPE J. 2025; 30( 8): 4706– 25. doi:10.2118/228302-pa. [Google Scholar] [CrossRef]
16. Zhang J , Liu K , Cao M . Experimental study on modified polyacrylamide coated self-suspending proppant. Fuel. 2017; 199: 185– 90. doi:10.1016/j.fuel.2017.02.103. [Google Scholar] [CrossRef]
17. Luo Z , Li J , Zhao L , Zhang N , Chen X , Miao W , et al. Preparation and characterization of a self-suspending ultra-low density proppant. RSC Adv. 2021; 11( 52): 33083– 92. doi:10.1039/d1ra05611e. [Google Scholar] [CrossRef]
18. Zhang Q , Zhang Z , Zhang B , Sun T , Chen X , Hou B . Research and application of self-suspending proppants based on block copolymer modification in coalbed methane wells. Phys Fluids. 2025; 37( 7): 077162. doi:10.1063/5.0277558. [Google Scholar] [CrossRef]
19. Luo Y , Li N , Zheng J , Yang S , Wu Y . Secondary utilization of self-suspending proppant’s coating polymer: enhance oil recovery. Geoenergy Sci Eng. 2024; 243: 213301. doi:10.1016/j.geoen.2024.213301. [Google Scholar] [CrossRef]
20. Mahoney RP , Soane D , Kincaid KP , Herring M , Snider PM . Self-suspending proppant. In: Proceedings of the SPE Hydraulic Fracturing Technology Conference; 2013 Feb 4–6; The Woodlands, TX, USA. Sugar Land, TX, USA: Richardson Society of Petroleum Engineers; 2013. p. SPE 163818-MS. doi:10.2118/163818-ms. [Google Scholar] [CrossRef]
21. Goldstein B , VanZeeland A . Self-suspending proppant transport technology increases stimulated reservoir volume and reduces proppant pack and formation damage. In: Proceedings of the SPE Annual Technical Conference and Exhibition; 2015 Sep 28–30; Houston, TX, USA. Sugar Land, TX, USA: Richardson Society of Petroleum Engineers; 2015. p. SPE 174867-MS. doi:10.2118/174867-ms. [Google Scholar] [CrossRef]
22. Dong L , Chen X . Performance evaluation and field application of a self-suspending proppant. Pet Drill Tech. 2018; 46( 6): 90– 4. (In Chinese). [Google Scholar]
23. Zhou H , Guo J , Zhang T , Zeng J . Friction characteristics of proppant suspension and pack during slickwater hydraulic fracturing. Geoenergy Sci Eng. 2023; 222: 211435. doi:10.1016/j.geoen.2023.211435. [Google Scholar] [CrossRef]
24. Ren H , Dong J , Gao J , Liu K , Zhang J , Yin S . Field test of self-suspending proppant at Mahu sandstone reservoir in Xinjiang Oilfield. Pet Reserv Eval Dev. 2023; 13( 4): 513– 8. (In Chinese). [Google Scholar]
25. Wang G , Ma Q , Ren L , Hou J . A comprehensive review of multifunctional proppants. ACS Omega. 2024; 9( 44): 44120– 33. doi:10.1021/acsomega.4c06941. [Google Scholar] [CrossRef]
26. Zhang X . Preparation and performance evaluation of self-suspending proppant [ master’s thesis]. Qingdao, China: Qingdao University of Science & Technology; 2017. (In Chinese). [Google Scholar]
27. Cao W , Xie K , Lu X , Chen Q , Tian Z , Lin W . Self-suspending proppant manufacturing method and its property evaluation. J Petrol Sci Eng. 2020; 192: 107251. doi:10.1016/j.petrol.2020.107251. [Google Scholar] [CrossRef]
28. Li P , Zhang X , Lu X , Su J , Huang Z , Fan X . Experimental study on the self-suspending proppant-laden flow in a single fracture. REM Int Eng J. 2018; 71( 2): 191– 6. doi:10.1590/0370-44672016710133. [Google Scholar] [CrossRef]
29. Deng Q . Study on performance evaluation of self-suspending proppant and transportation law in fractures [ master’s thesis]. Chengdu, China: Southwest Petroleum University; 2019. (In Chinese). [Google Scholar]
30. Zhang X , Wang Z , Deng J , Zhao H , Zhuang Y , Zhang Z , et al. High-temperature and salt-resistant self-suspending proppant for hydraulic fracturing. Energy Fuels. 2024; 38( 10): 8620– 30. doi:10.1021/acs.energyfuels.4c00001. [Google Scholar] [CrossRef]
31. Geri MB , Flori R , Sherif H . Comprehensive study of elasticity and shear-viscosity effects on proppant transport using HFVRs on high-TDS produced water. In: Proceedings of the 7th Unconventional Resources Technology Conference; 2019 Jul 22–24; Denver, CO, USA. Tulsa, OK, USA: American Association of Petroleum Geologists; 2019. p. URTEC-2019-99-MS. doi:10.15530/urtec-2019-99. [Google Scholar] [CrossRef]
32. Li M , Guo J , Zhang T , Zeng X , Yang R , Gou H . Quantitative experimental study on the rule of fluid flow and its influencing factors in hydraulic fractures. J Petrol Sci Eng. 2022; 214: 110505. doi:10.1016/j.petrol.2022.110505. [Google Scholar] [CrossRef]
Cite This Article
 Copyright © 2026 The Author(s). Published by Tech Science Press.
This work is licensed under a Creative Commons Attribution 4.0 International License , which permits unrestricted use, distribution, and reproduction in any medium, provided the original work is properly cited.
 Downloads
 Citation Tools