
 Submit a Paper
 Propose a Special lssue
 Open Access
ARTICLE

Numerical Investigation of Support-Induced Upstream Flow Disturbances in a Subsonic-Transonic Wind Tunnel
1 Wuhan Second Ship Design and Research Institute, Wuhan, China
2 Key Laboratory of Flexible Optoelectronic Materials and Technology, Ministry of Education, Jianghan University, Wuhan, China
* Corresponding Author: Bing Wang. Email:
Fluid Dynamics & Materials Processing 2026, 22(3), 7 https://doi.org/10.32604/fdmp.2026.073369
Received 16 September 2025; Accepted 17 March 2026; Issue published 31 March 2026
 View Full Text
 Download PDF
Abstract
In wind tunnel experiments, support devices inevitably disturb the surrounding flow field, thereby degrading the accuracy of measured aerodynamic data. A new subsonic and transonic wind tunnel has recently been constructed, and the support system for dynamic six degree of freedom experiments is currently under conceptual design. A key challenge is to optimize the support configuration while satisfying stringent flow quality requirements. In this study, the influence of different support configurations on the flow field is investigated numerically by analyzing velocity and pressure distributions. The results show that the optimized six degree of freedom support significantly reduces disturbances in both pressure and velocity fields, with the improvement becoming more pronounced as the Mach number increases. The main optimization measures include the addition of a tail fairing, reduction of the thickness of the connecting bases between the support rods and the sting, and downsizing of the anchor feet. In contrast, the effect of the tail support poles is found to be negligible. It is shown that, overall, the extent of upstream flow disturbance is governed primarily by the separation region and associated momentum loss induced by the support sting, the connecting bases and the anchor feet. Flow separation originates from spiral points or separation lines on the model surface, resulting from viscous effects combined with shock waves generated by the support system.Keywords
In the wind tunnel experiments, the support devices inevitably disturb the surrounding flow field. It would degrade the accuracy of the measured aerodynamic data of the wind tunnel test model. From the last centrury, this problem started to be investigated [1,2,3,4]. Researchers [5,6,7,8,9] have made progress in the investigations on the aerodynamic performance of the influence caused by the support in the wind tunnel.
ECKERT et al. [3] decomposed the interference into near-field and far-field based on the physical model analysis of the supports in the DNW-LLF wind tunnel.
Fan et al. [10] tried to develop a series of supporting facilities to improve test efficiency and capability in an 8 m by 6 m wind tunnel. After the improvement, the aircraft test data reached an advanced international level.
Chen et al. [11] calibrated the flow quality under different conditions by parameter optimization in a 0.6 m continuous transonic wind tunnel. The optimization parameters included the walls (slotted or perforated), acoustics treatments on the compressor tailor and the forth corner, re-adjusting the expansion angles of the test section walls and the re-entry slots, controlling the semi-flexible nozzle, the second throat and the plenum chamber pumping system and so on. From the study results, it was demonstrated that the total pressure control precision and Mach number control precision met the requirements.
Liu et al. [12] conducted an experimental study on the influence of the cantilever support device in an 8 m by 6 m low-speed wind tunnel. An effective method for correcting the support interference was reported. The aerodynamic interference on the test model in the wind tunnel was divided into near-field and far-field interferences. The aerodynamic interference of the cantilever support-device was studied by the flow field and force measurements of typical models in the wind tunnel. Based on the analysis of the interference characteristics of the cantilever support device, an effective method for correcting the support interference was proposed.
Vav, Mouton and Garcia et al. [13,14,15] tried to use the CFD method to investigate the model support interference in subsonic and transonic wind tunnels. An effective CFD numerical simulation method for investigating the influence of the support interference was reported. The effectiveness of CFD numerical simulation was proved. Xu et al. [16] conducted a numerical simulation and experimental research on the flow field of an automobile in an environmental wind tunnel.
Although existing studies have provided preliminary insights into the influence on the flow field quality by the supports in the wind tunnels, there are still some insufficient understandings in the aerodynamic mechanisms research.
A new subsonic-transonic wind tunnel has recently been constructed, and the support system for the dynamic six degrees of freedom experiments is currently under conceptual design. There is a key challenge to optimize the support configuration to satisfy the stringent flow quality requirements of the flow quality. To investigate the influence characteristics of the support configurations on the upstream field in the subsonic-transonic wind tunnel, four typical configurations are developed as the research subjects by numerical method in this study. The main objectives of this study are:
- (1)Detecting the influence of the support configurations in the subsonic-transonic wind tunnel. The aerodynamic disturbance could be reduced by optimizing the support configurations. Then the investigation is conducted to explore some patterns of optimization in this study.
- (2)Detecting the flow structure around the supports in the subsonic-transonic wind tunnel. The flow structure is investigated to try to discover the aerodynamic reasons for the influence of the support configurations.
However, there are some limitations in this study as follows:
- (1)Only four typical configurations are chosen in this study.
- (2)The angle of attack and sideslip angle are set 0 degree.
- (3)The monitor points in the upstream of the support sting nose are on the center line along the flow direction.
In this study, the investigated support configurations and the numerical investigation are illustrated in Section 2 and Section 3, respectively. Then the results and discussions are described in Section 4. At last, the conclusion is given in Section 5.
2 The Investigated Support Models
To investigate the influence characteristics of the support configurations on the upstream field in the subsonic-transonic wind tunnel, four models of the supports are constructed as illustrated in Fig. 1 and Fig. 2.
The configuration of the static experimental support is shown in Fig. 1a. It includes a bending mechanism with a height of 5.5 m and a support sting with a diameter of 540 mm. The configuration of initial model of Dynamic 6-DOF Support is established in Fig. 1b. It consists of a support sting with a diameter of 540 mm and 6 tail support rods with a diameter of 150 mm. Each support rod has an anchor foot connected to the wall of the wind tunnel through hinge. On the basis of the configuration in Fig. 1b, the optimized one is designed as shown in Fig. 2. It comprises a support sting with a tail fairing, thinner tail support rods and smaller anchor feet. The diameter of the support sting is also 540 mm, and that of the tail support rod is 110 mm. To investigate the effect of the tail support rod on the upstream flow field of the wind tunnel, the configuration without any tail support rod is constructed on the basis of the model in Fig. 2a. It is illustrated in Fig. 2b. As shown in Fig. 3, the model of dynamic six degree of freedom support would be installed in the same section with the static experimental one in the wind tunnel.
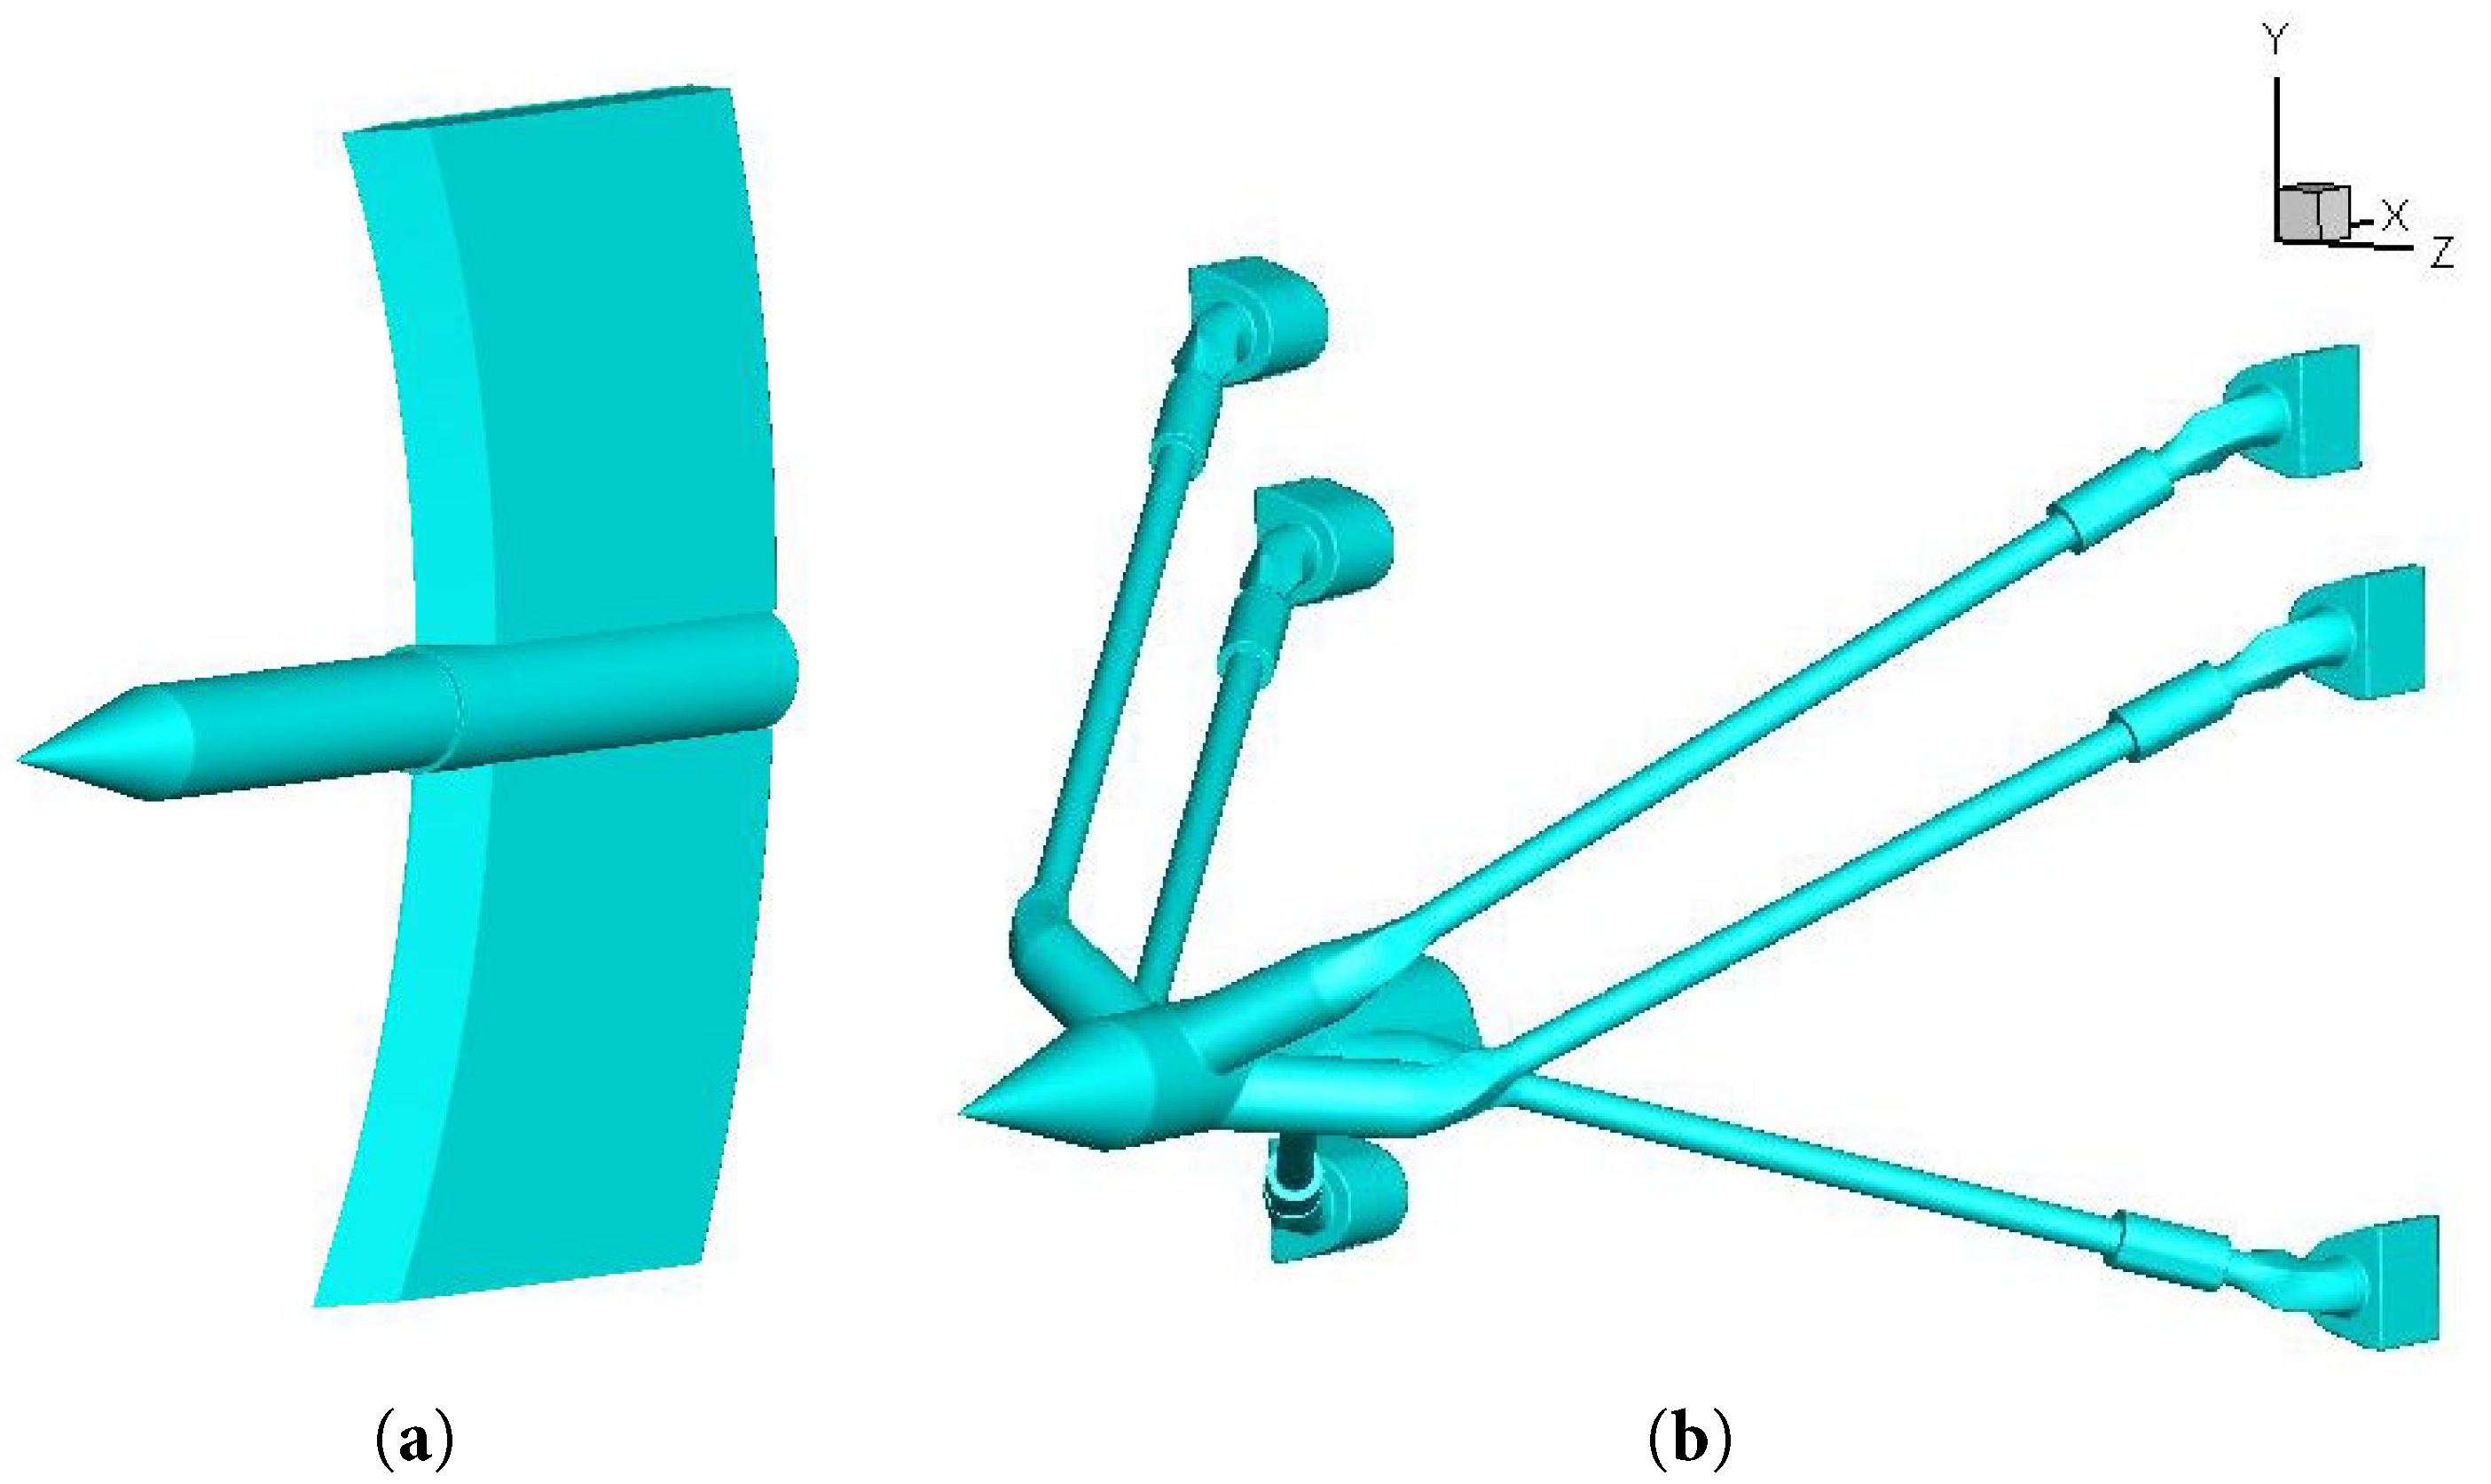
Figure 1: Initial experimental support models: (a) Static Experimental Support; (b) Initial model of Dynamic 6-DOF Support.
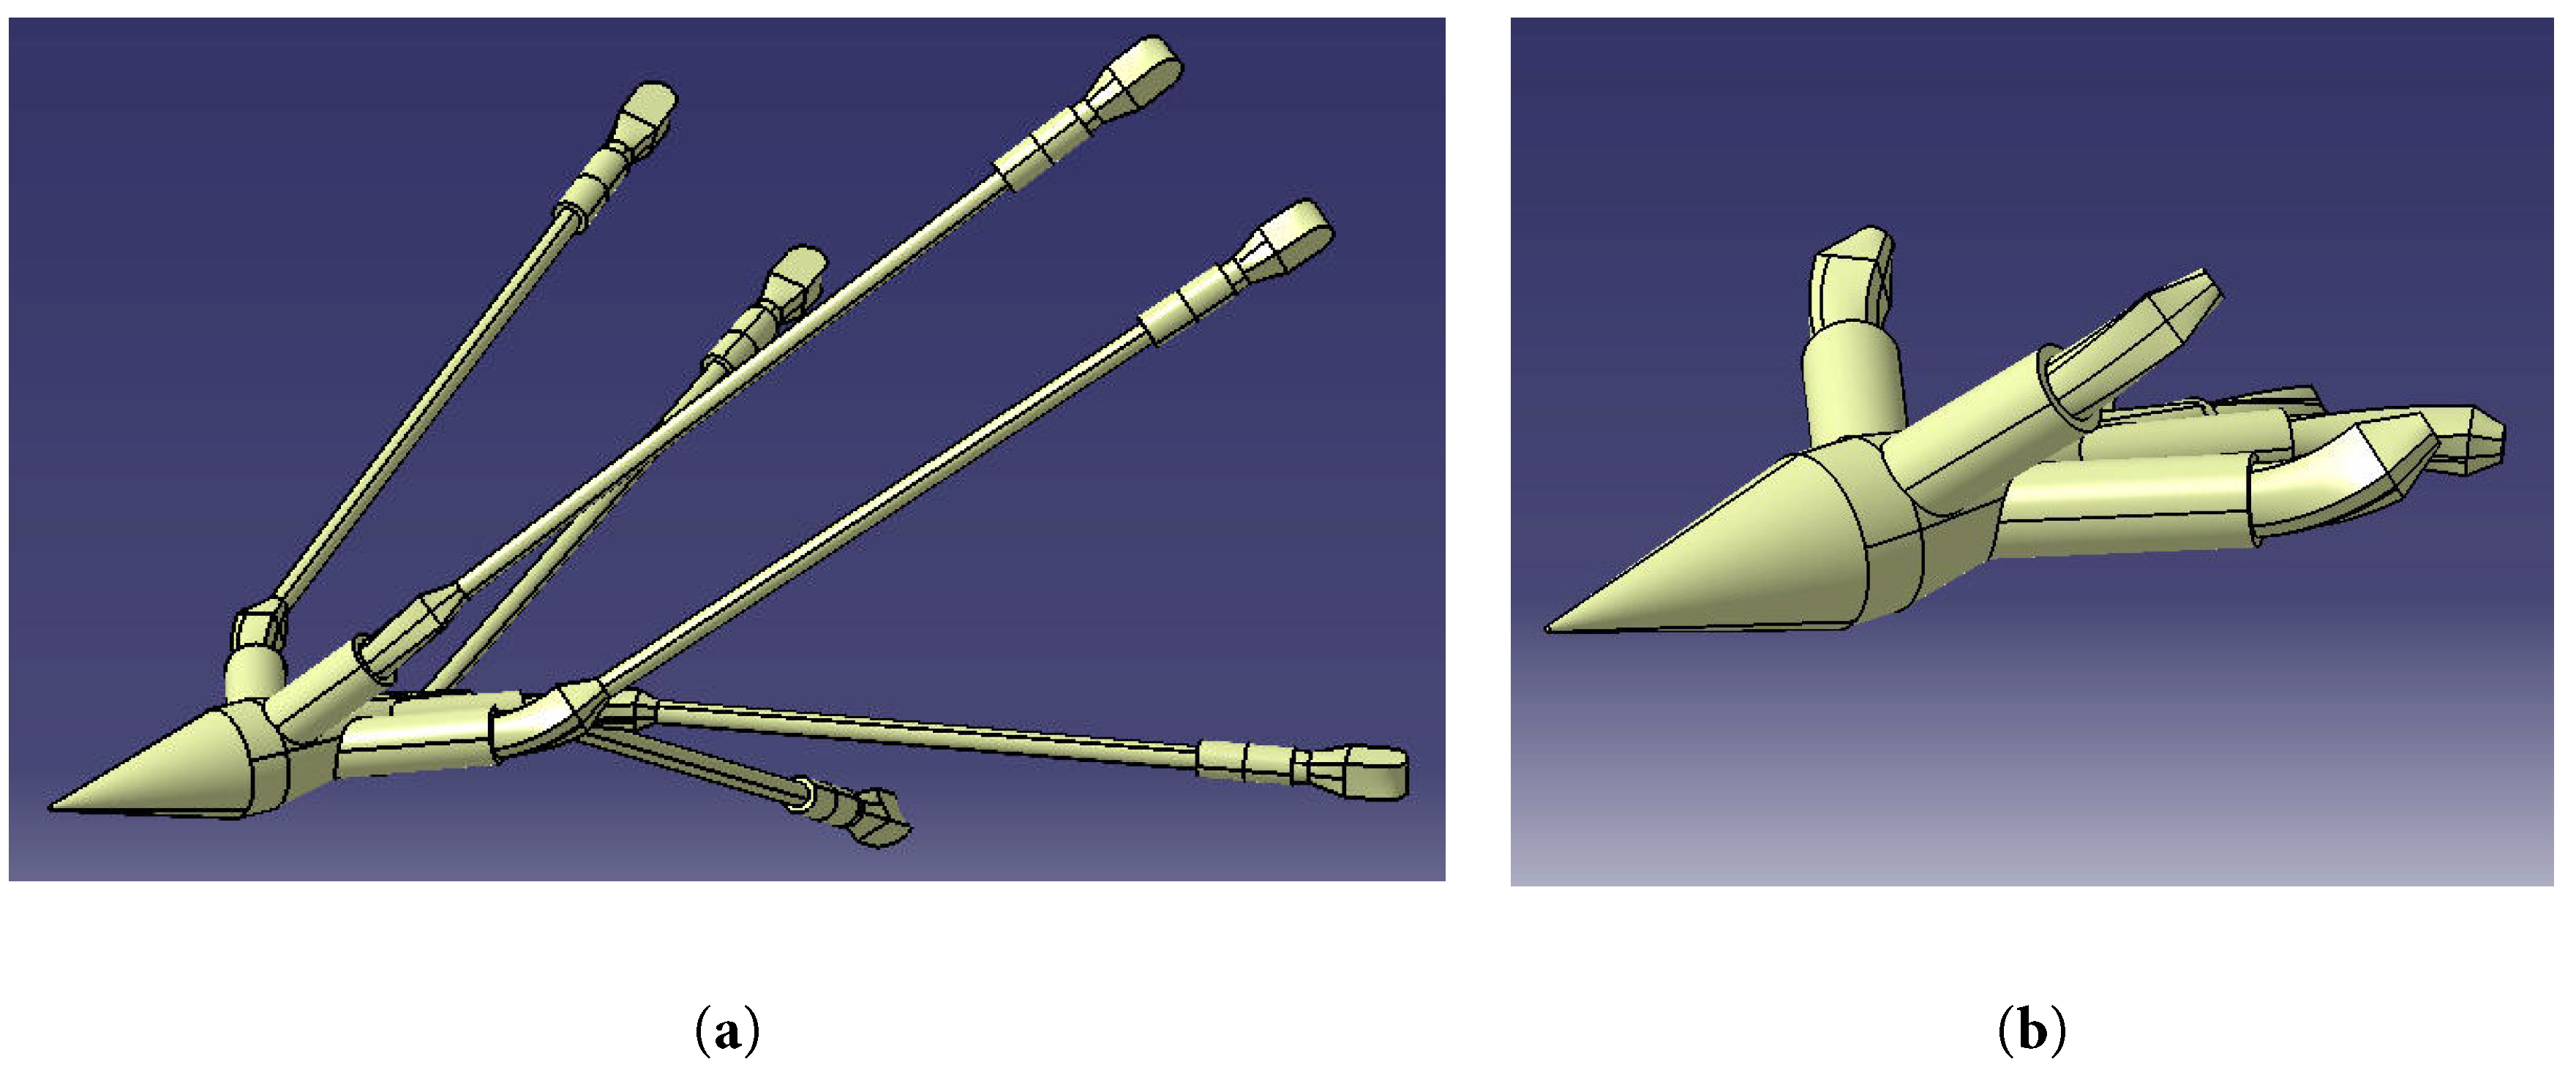
Figure 2: Optimized model of Dynamic 6-DOF Supports: (a) Optimized Support; (b) Optimized Support without any tail support rod.
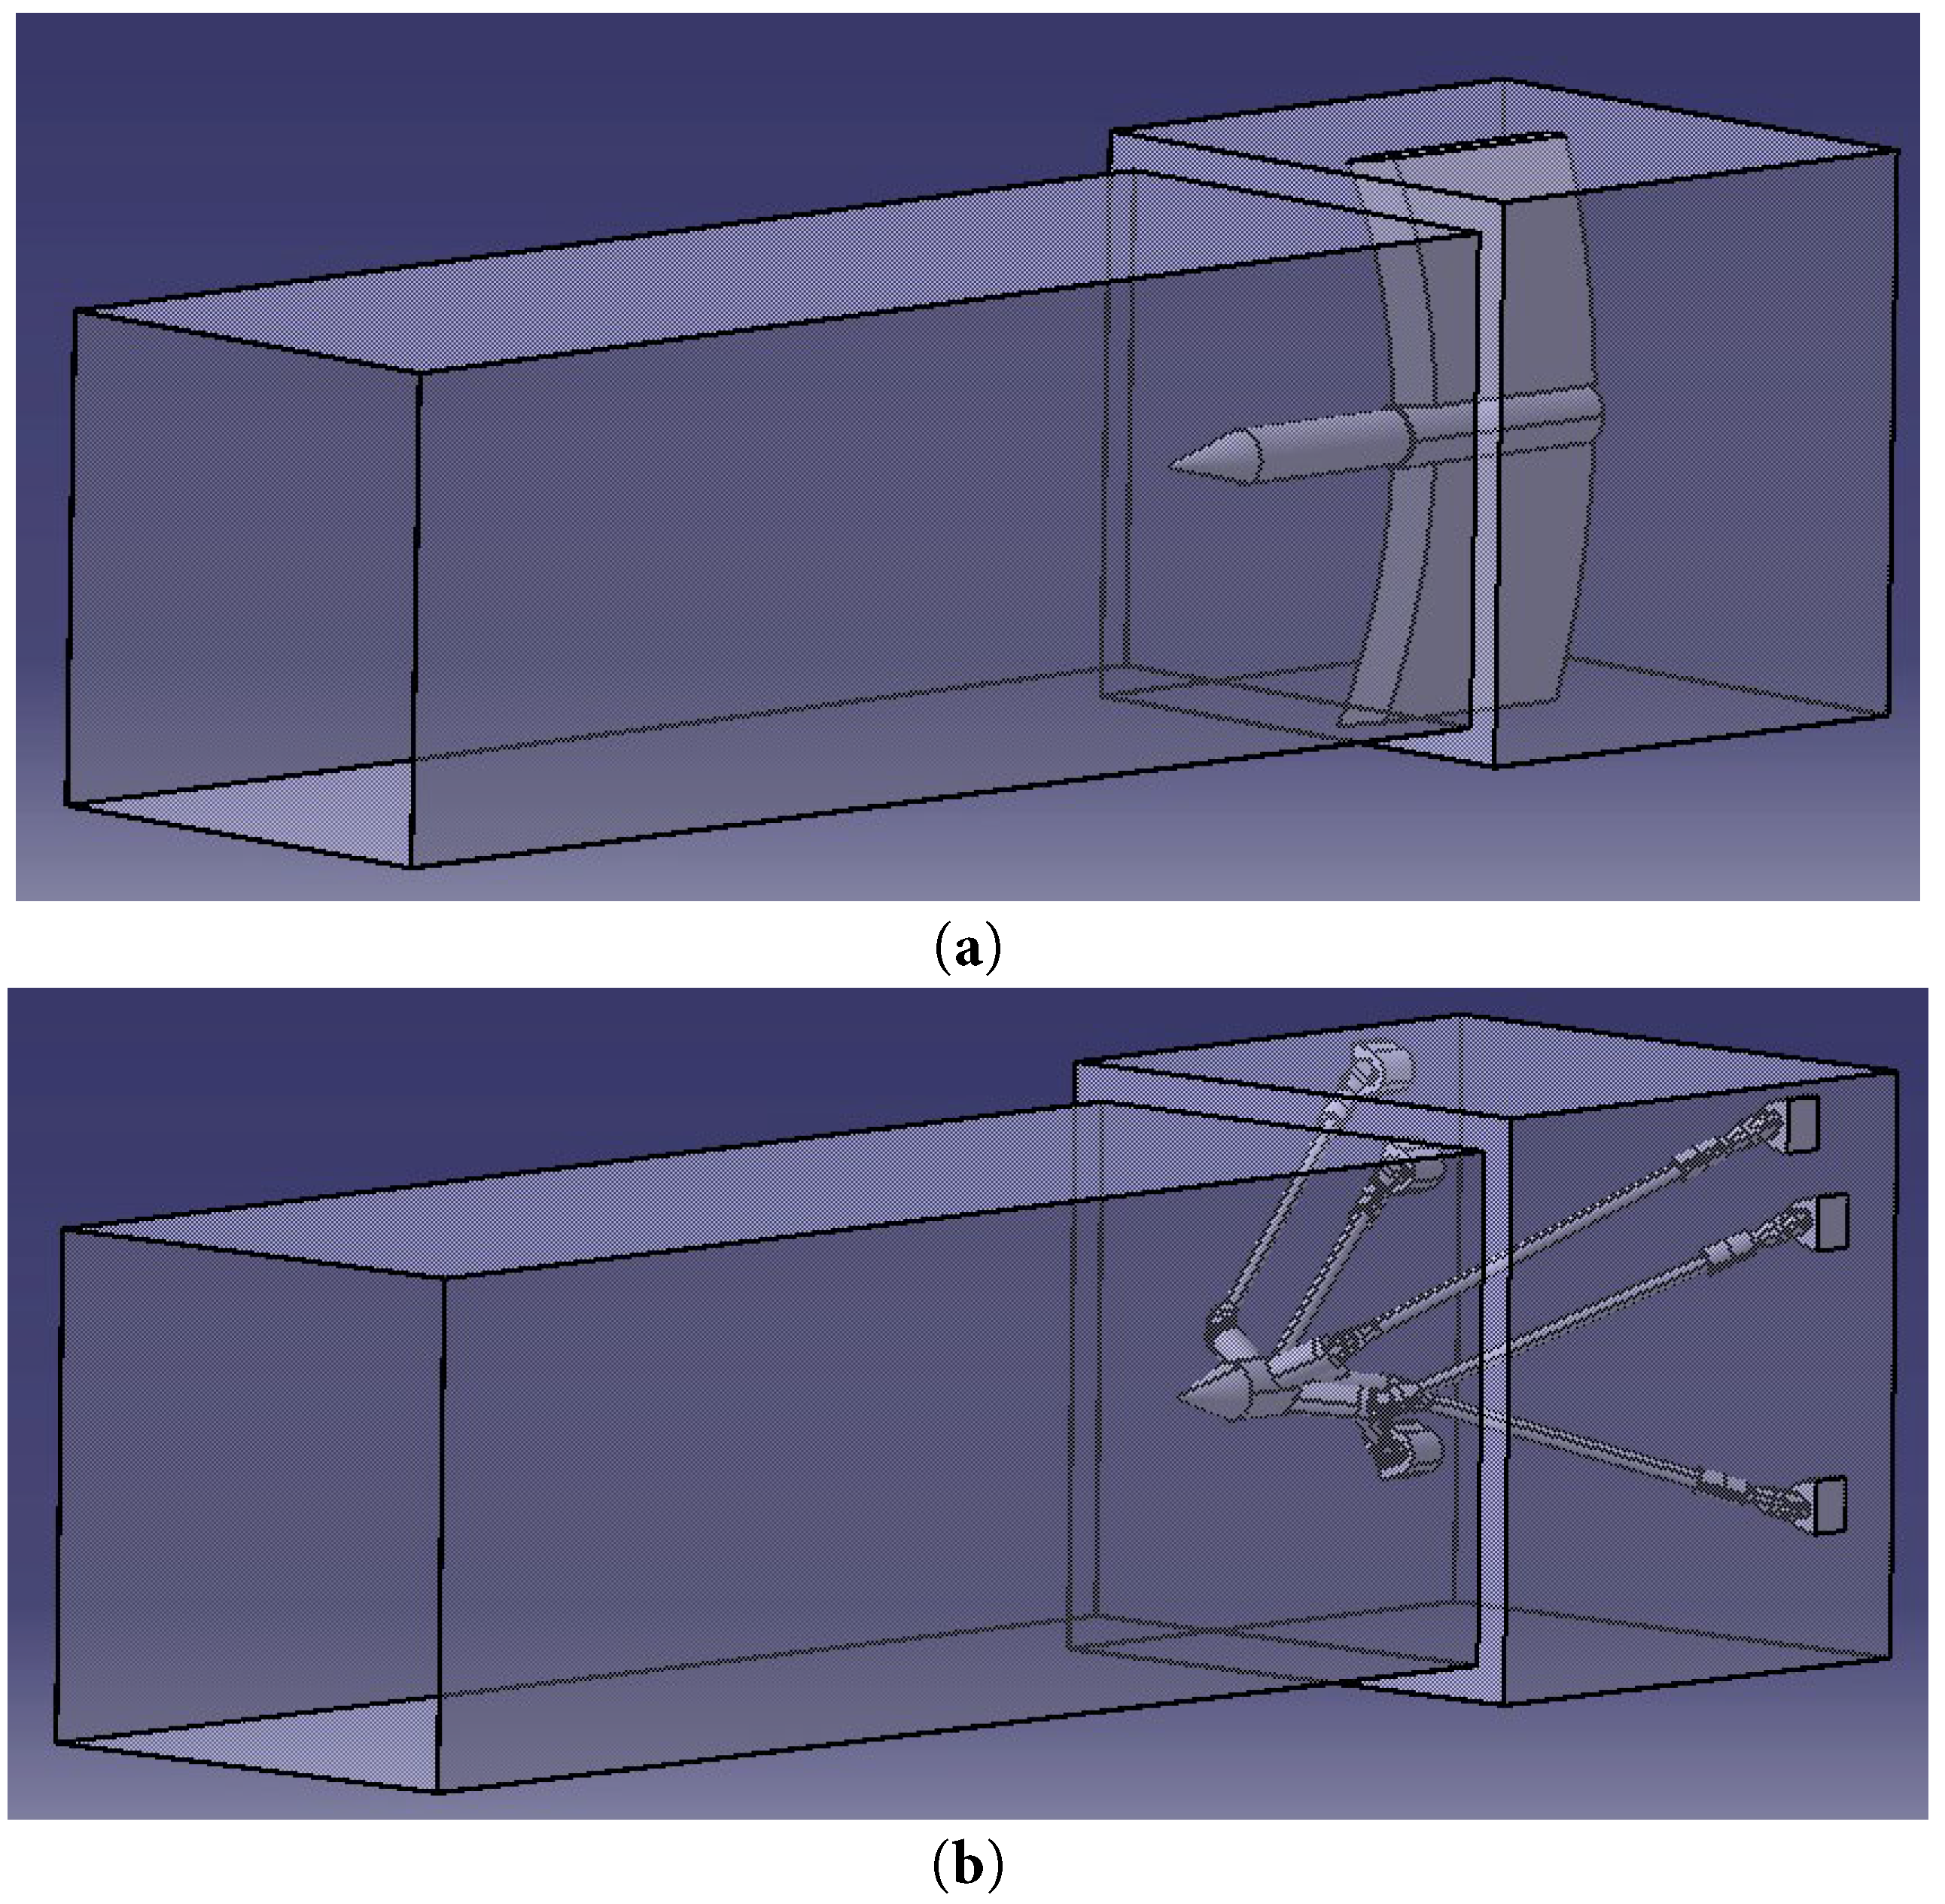
Figure 3: Installed location in the wind tunnel: (a) Static Experimental Support; (b) Dynamic 6-DOF Support.
The coordinate definition in the flow field is given in Fig. 4a. The coordinate origin is at the nose point of the model. The monitor points in the upstream flow field are on the center line along the x-direction. The numerical simulation field boundary is depicted in Fig. 4b. The distance between the plane of inlet and the nose point of the model is 50 m, while that between the nose point of the model and the plane of outlet is 80 m. The wall surface of the model is set to no-slip wall. The flow direction is opposite to the x-direction in the coordinate system. It is illustrated in Fig. 4b.
In this study, Mach number0.4, 0.85 and 0.95 are set as the investigating velocities of the inlet flow, respectively. The mesh is divided into four parts. The first one is an unstructured grid for the model. The other three ones are structured grids for the main flow domain around the first one.
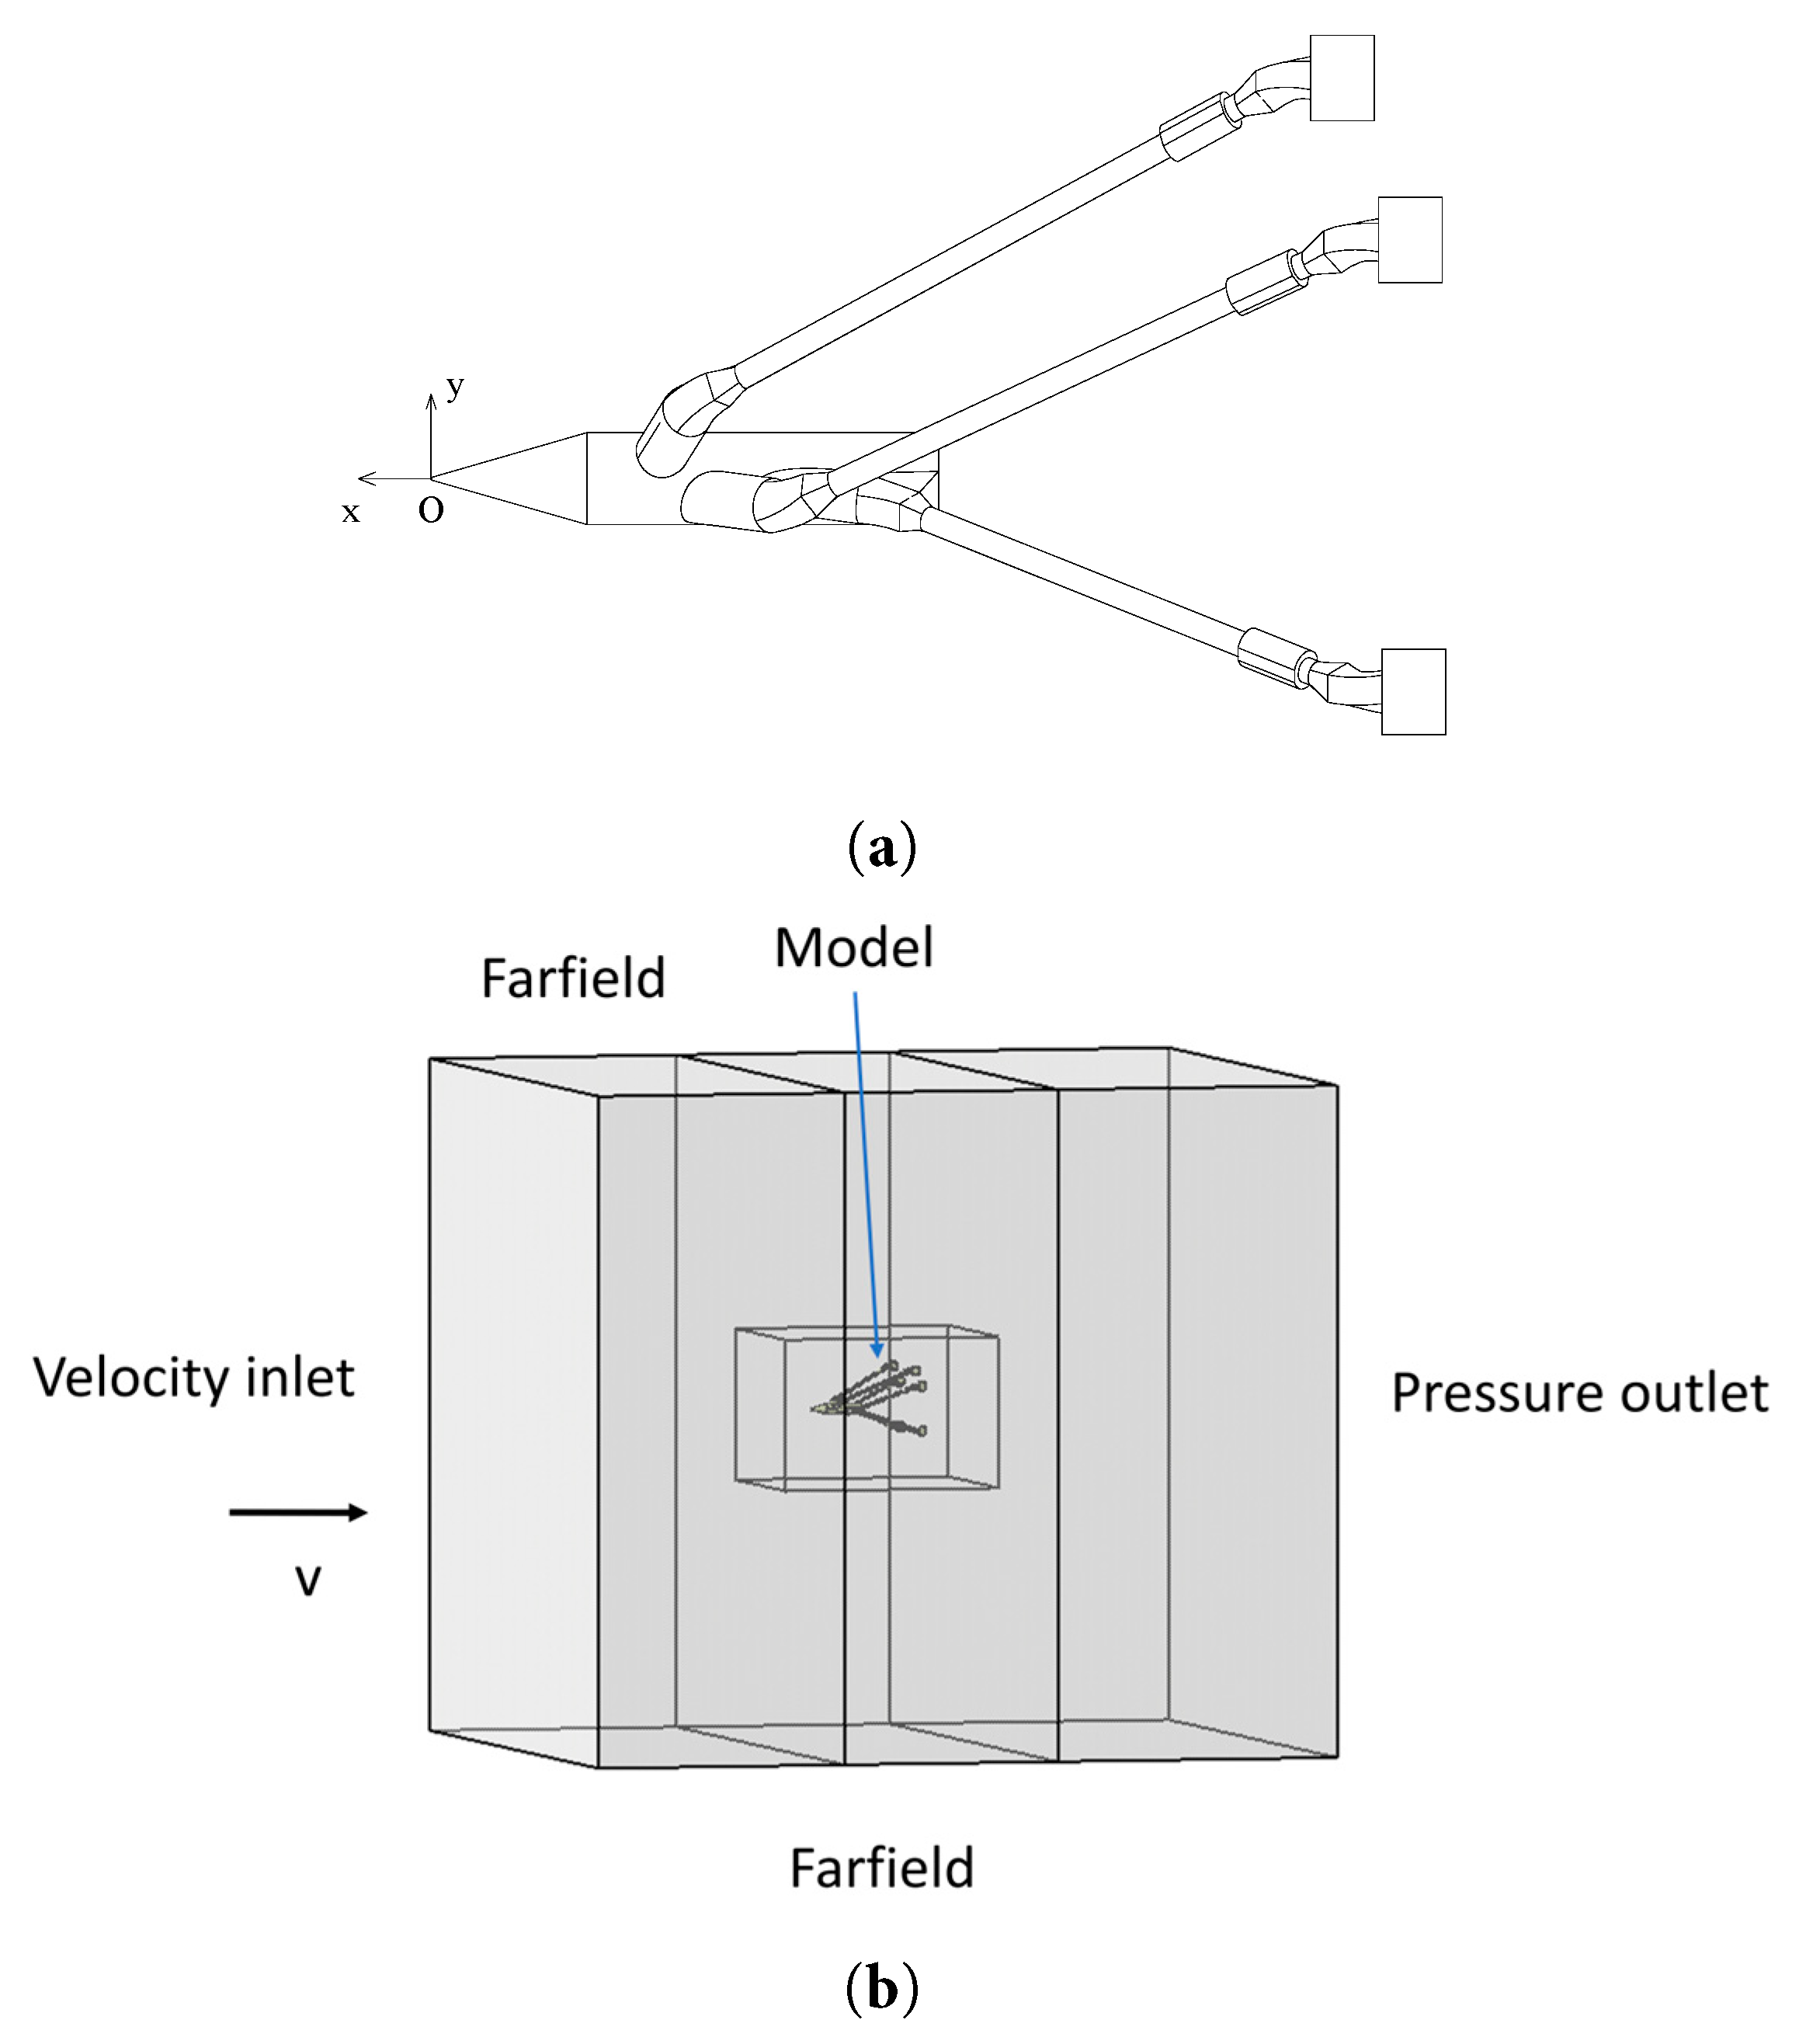
Figure 4: Coordinate definition and simulation field of the flow domain: (a) Coordinate definition; (b) Simulation field.
The CFD simulation grids are generated using the software ICEM CFD. Three-dimensional hybrid grids are created for the models. The region around the model is filled with unstructured grids, and the other three areas are occupied by block-structured grids. The total grids consist of about 10 million cells. Numerical analysis in this study is steady CFD simulations performed using ANSYS Fluent.
The flow is assuming to be isothermal in this study. Then, no boundary condition for the temperature is set. Besides, the gravity term is not considered. The second-order upwind scheme is used to represent the convection terms of the governing equations. The semi-implicit method for pressure-based equation (SIMPLE) [17] is used to solve the discrete equations. The velocities of the inlet flow are larger than Mach number 0.3, so the flow is considered as compressible. The turbulent intensity is set as 2%. The turbulent length is set as 1 m [17].
As for the steady CFD simulation in this study, Reynolds-Averaged Navier-Stokes equations (RANS) are solved on the grids. The RANS momentum conservation equations for a steady, compressible Newtonian fluid are summarized in tensor notation as [18]:
In the steady CFD simulations, the transition SST k–ω [19,20] is utilized as the turbulence model, whose accuracy is relatively high in transonic flow and separated flow. According to the recommendation of the ANSYS Fluent19.2 [17], the maximum y+ should be smaller than 1 for the turbulence model utilized in this study. Then the maximum heights of the first layers of the cells from the walls are set as 0.005 mm. In this study, ICEM CFD is used to create the three-dimensional grids. The overall mesh is illustrated in Fig. 5. The region around the model is filled with unstructured grids, and the other three areas are filled with structural grids. To improve the CFD simulation accuracy, the grids in the vicinity of the wall boundary layer are refined. The refined ones on the walls of the models are shown in Fig. 6.
Figure 5: Overall Grids.
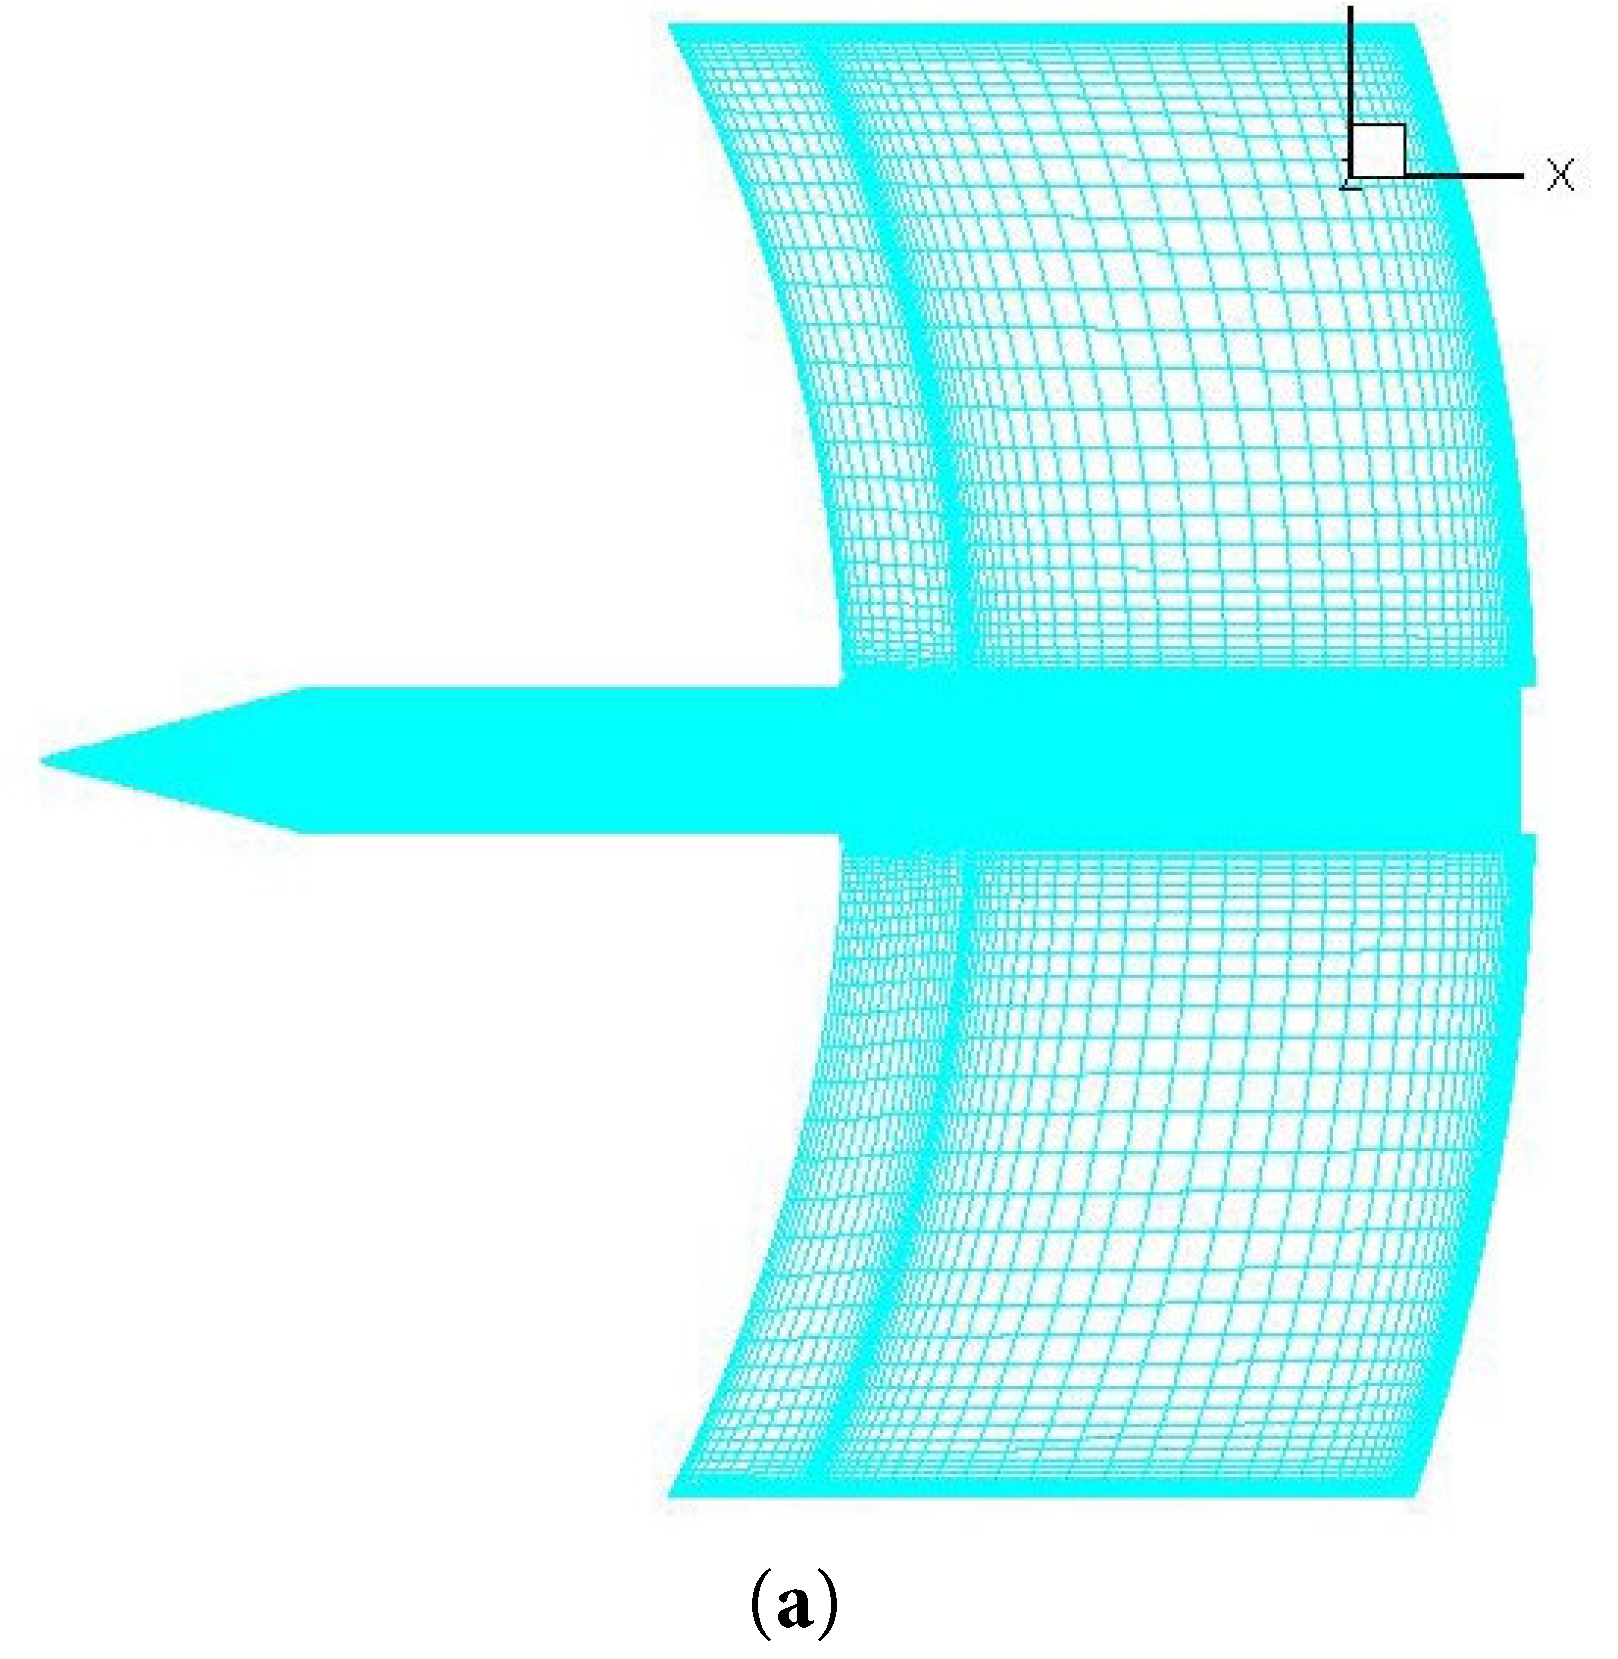
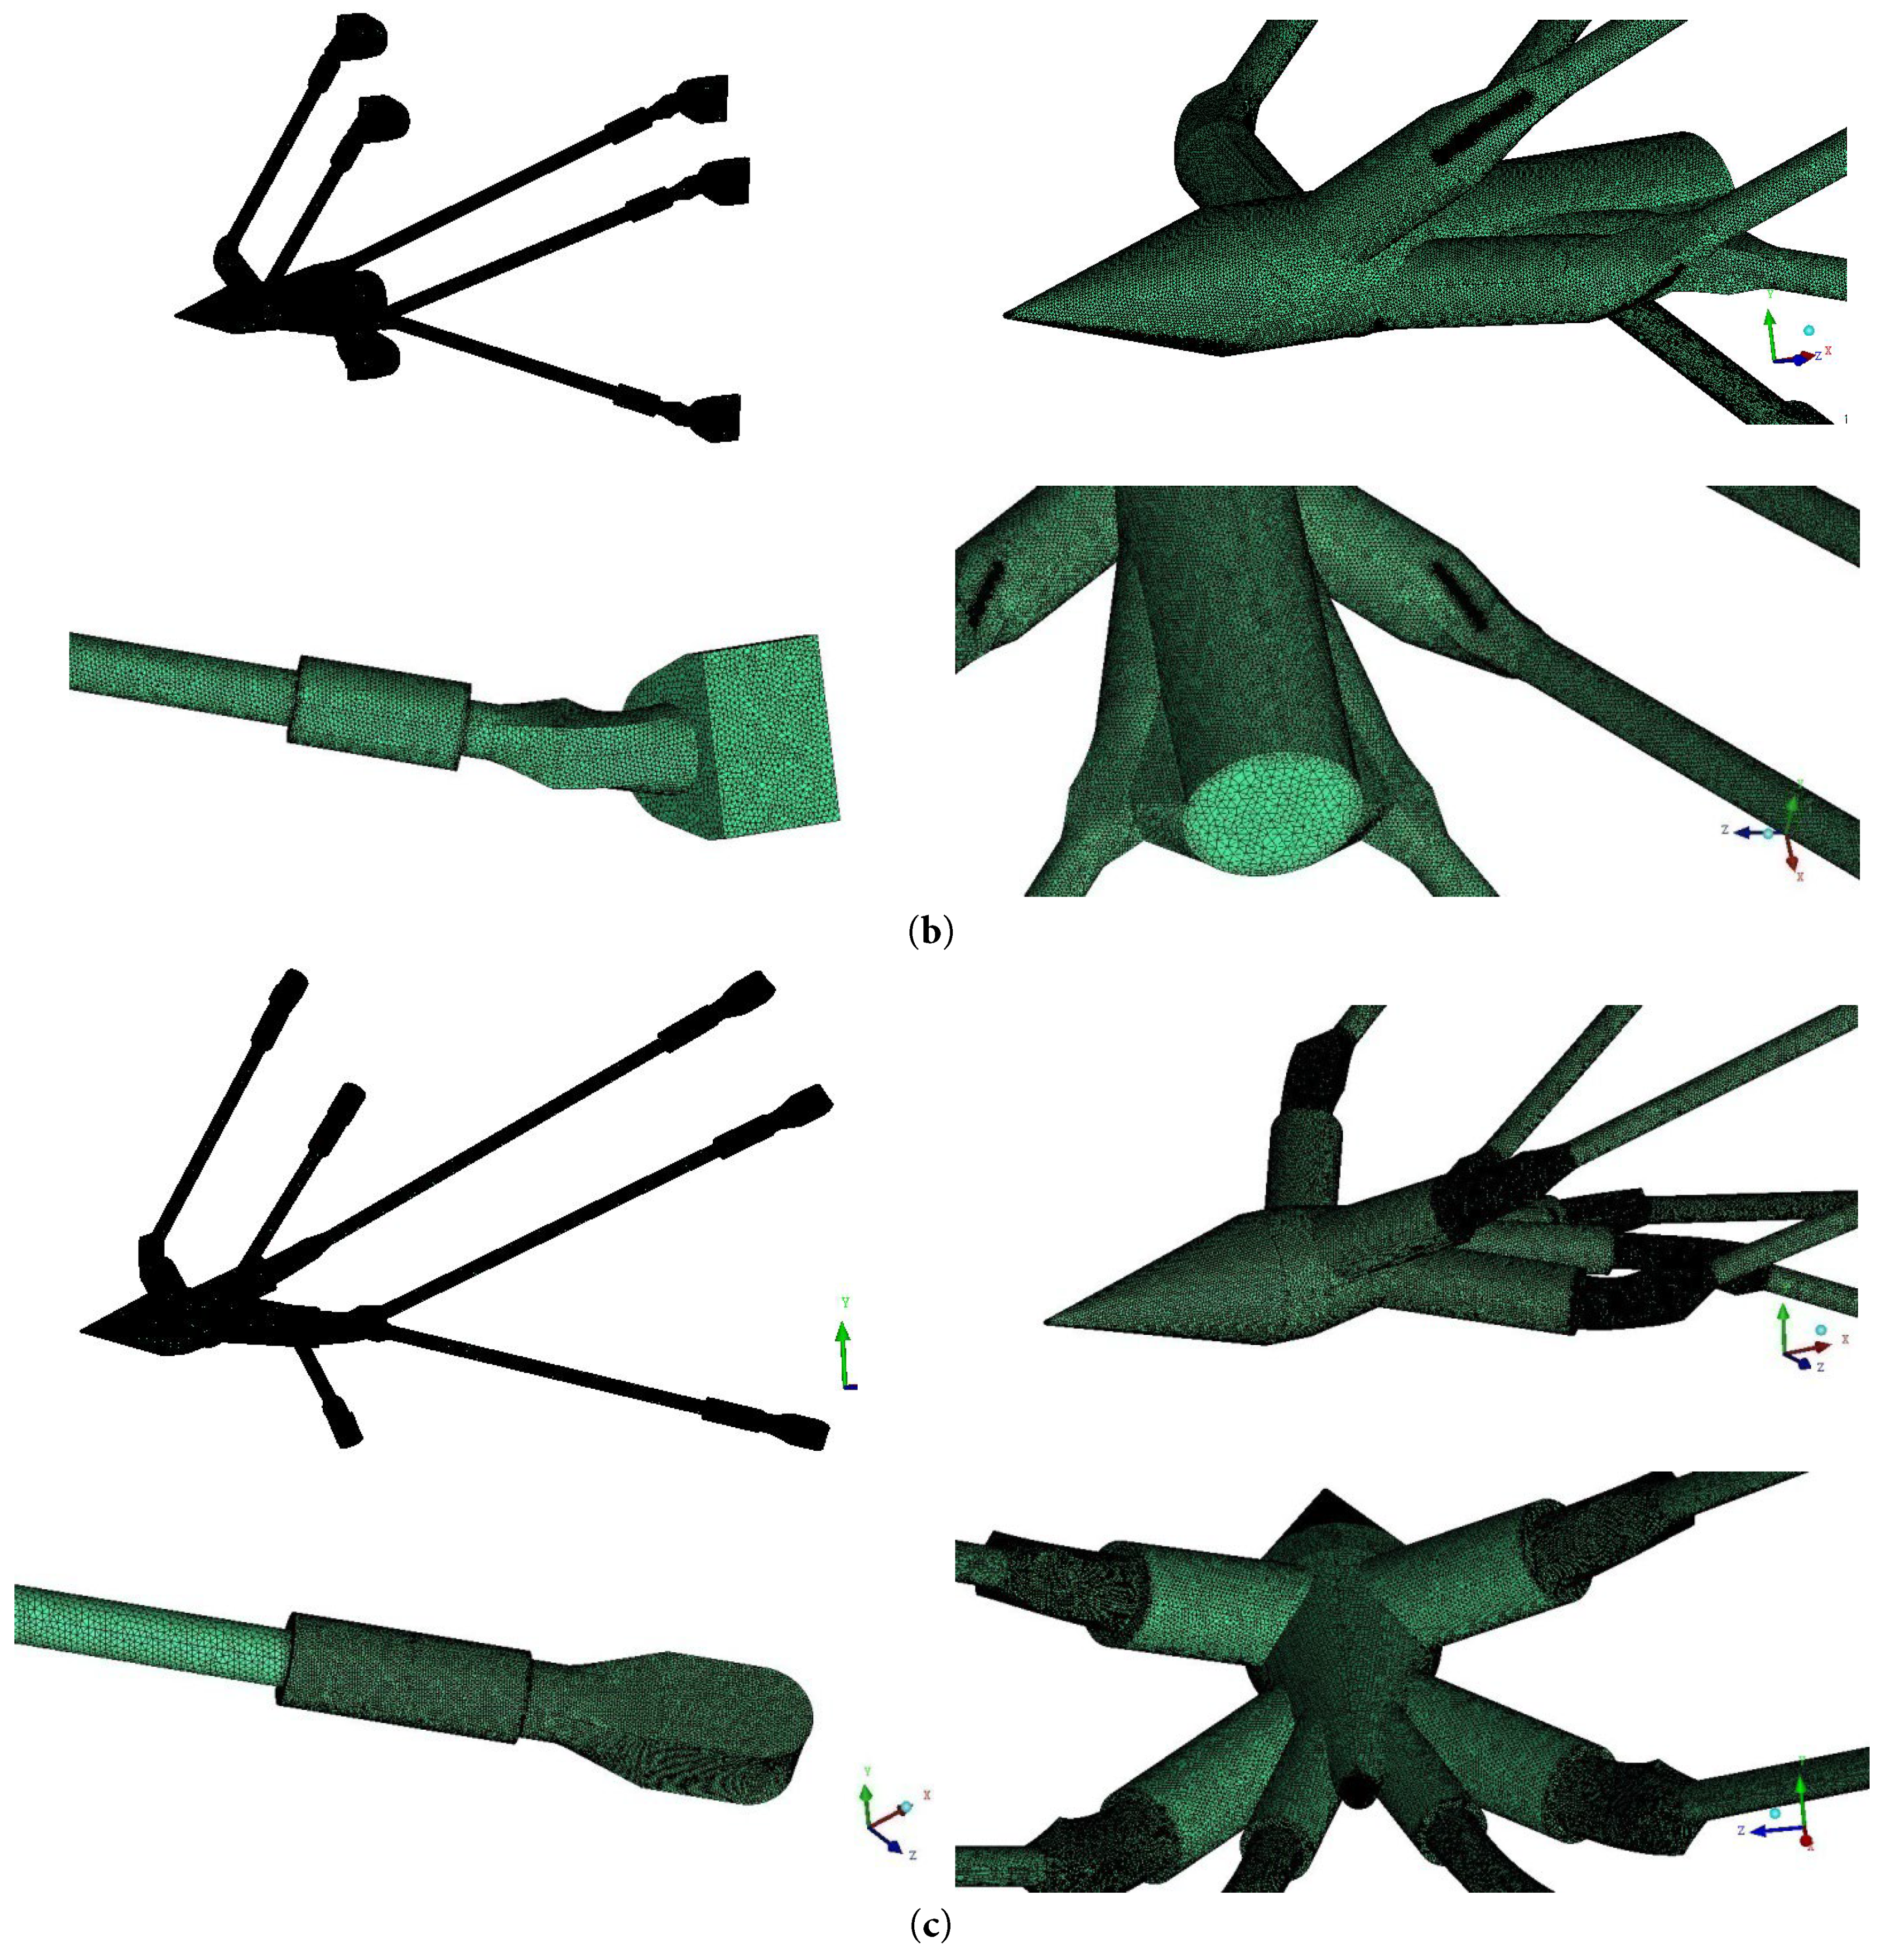
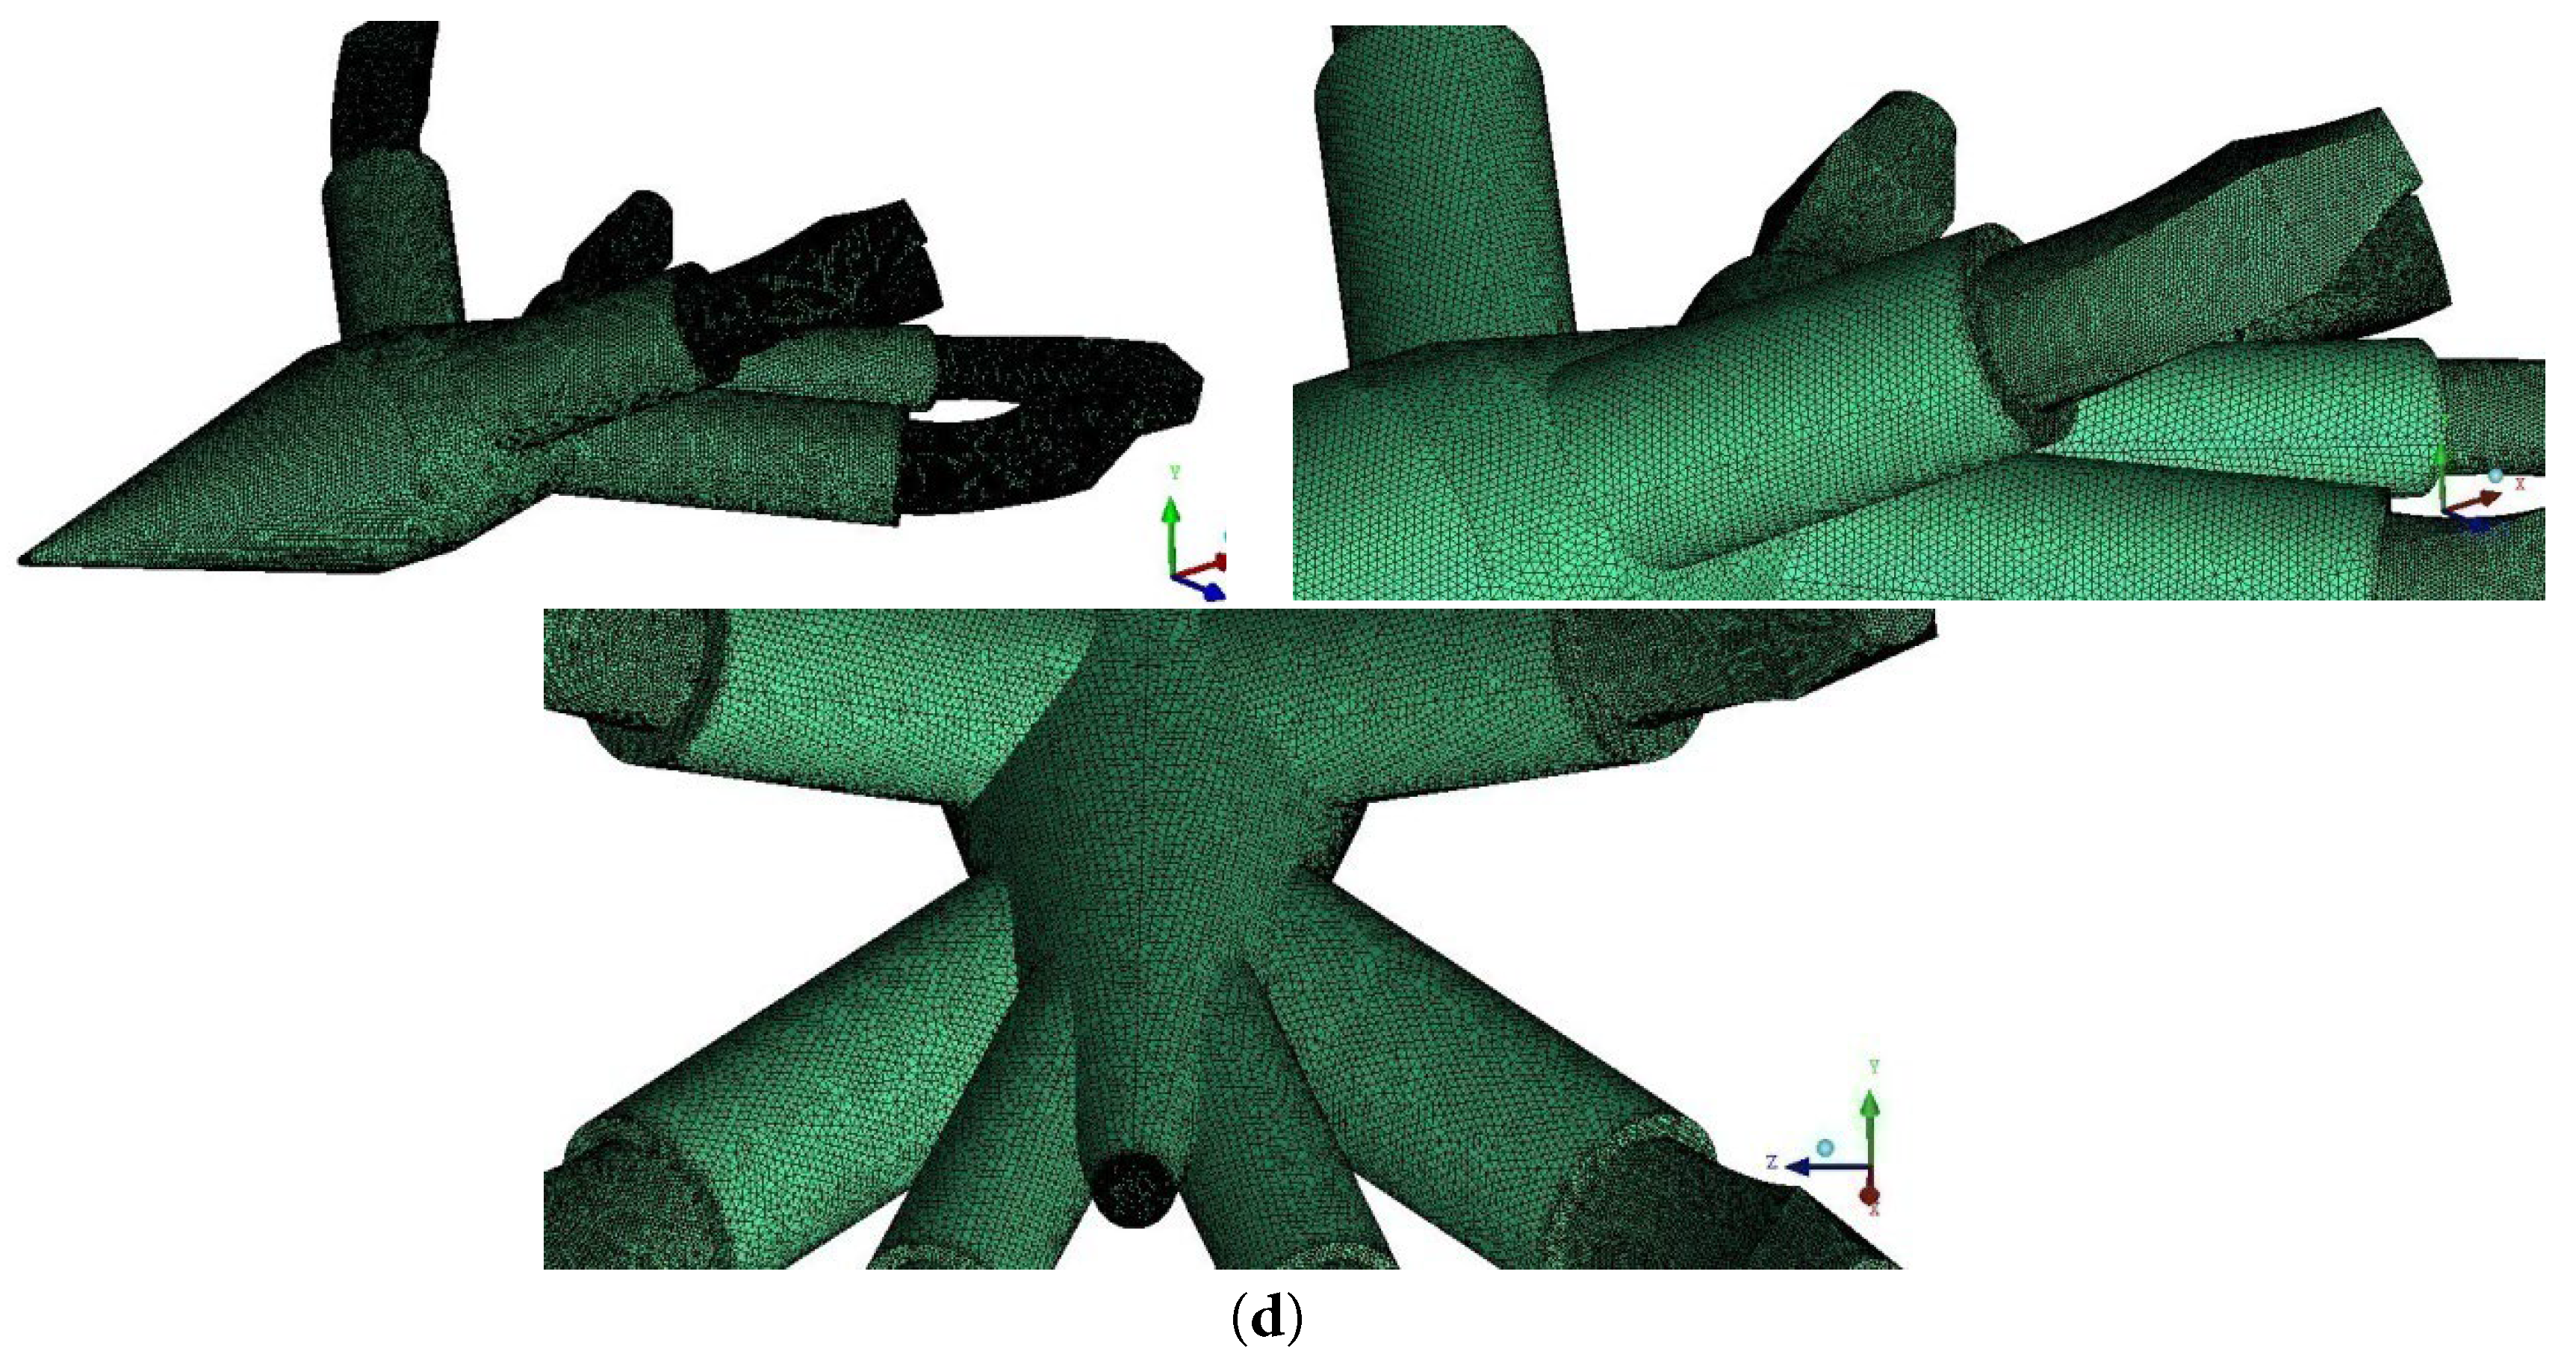
Figure 6: Grids detail near the wall: (a) The mesh of the static experimental support; (b) The mesh of the initial model of dynamic 6-DOF support; (c) The mesh of the optimized support; (d) The mesh of the optimized support without any tail support rod.
The experiments were performed to validate the CFD simulation results for the cascade-blades in our lab. The measurements were conducted in the cascade wind tunnel in Jianghan University [21,22,23]. It was indicated that the numerical results and the experimental results for the cascade-blade were in a good agreement.
Grid independence isverified by changing the grid density near the wall in this study. The testing objects are the grids for the initial dynamic 6-DOF support, as shown in Fig. 1b. To investigate the influence of the grids on the CFD simulation results, the tests are focused on the distributions of Mach number along the center line in front of the support. A comparison of the numerical results across 3 different cell numbers is presented in Fig. 7 and Table 1. The cell numbers of the grids are varied near the wall, to check whether the grid resolutions are sufficient for the simulation work. From grid 1 to grid 3 in Fig. 7 and Table 1, the cell numbers are about 10.07 million, 12.06 million and 15.09 million, respectively. It is indicated that the cell numbers of the girds have no significant effect on the simulation results, when the grid density near the wall achieve denser than Grid 1 in the test. Then considering the trade-off between computational cost and simulation accuracy, the grid density for Grid 1 is employed as reference for the simulations in this study.
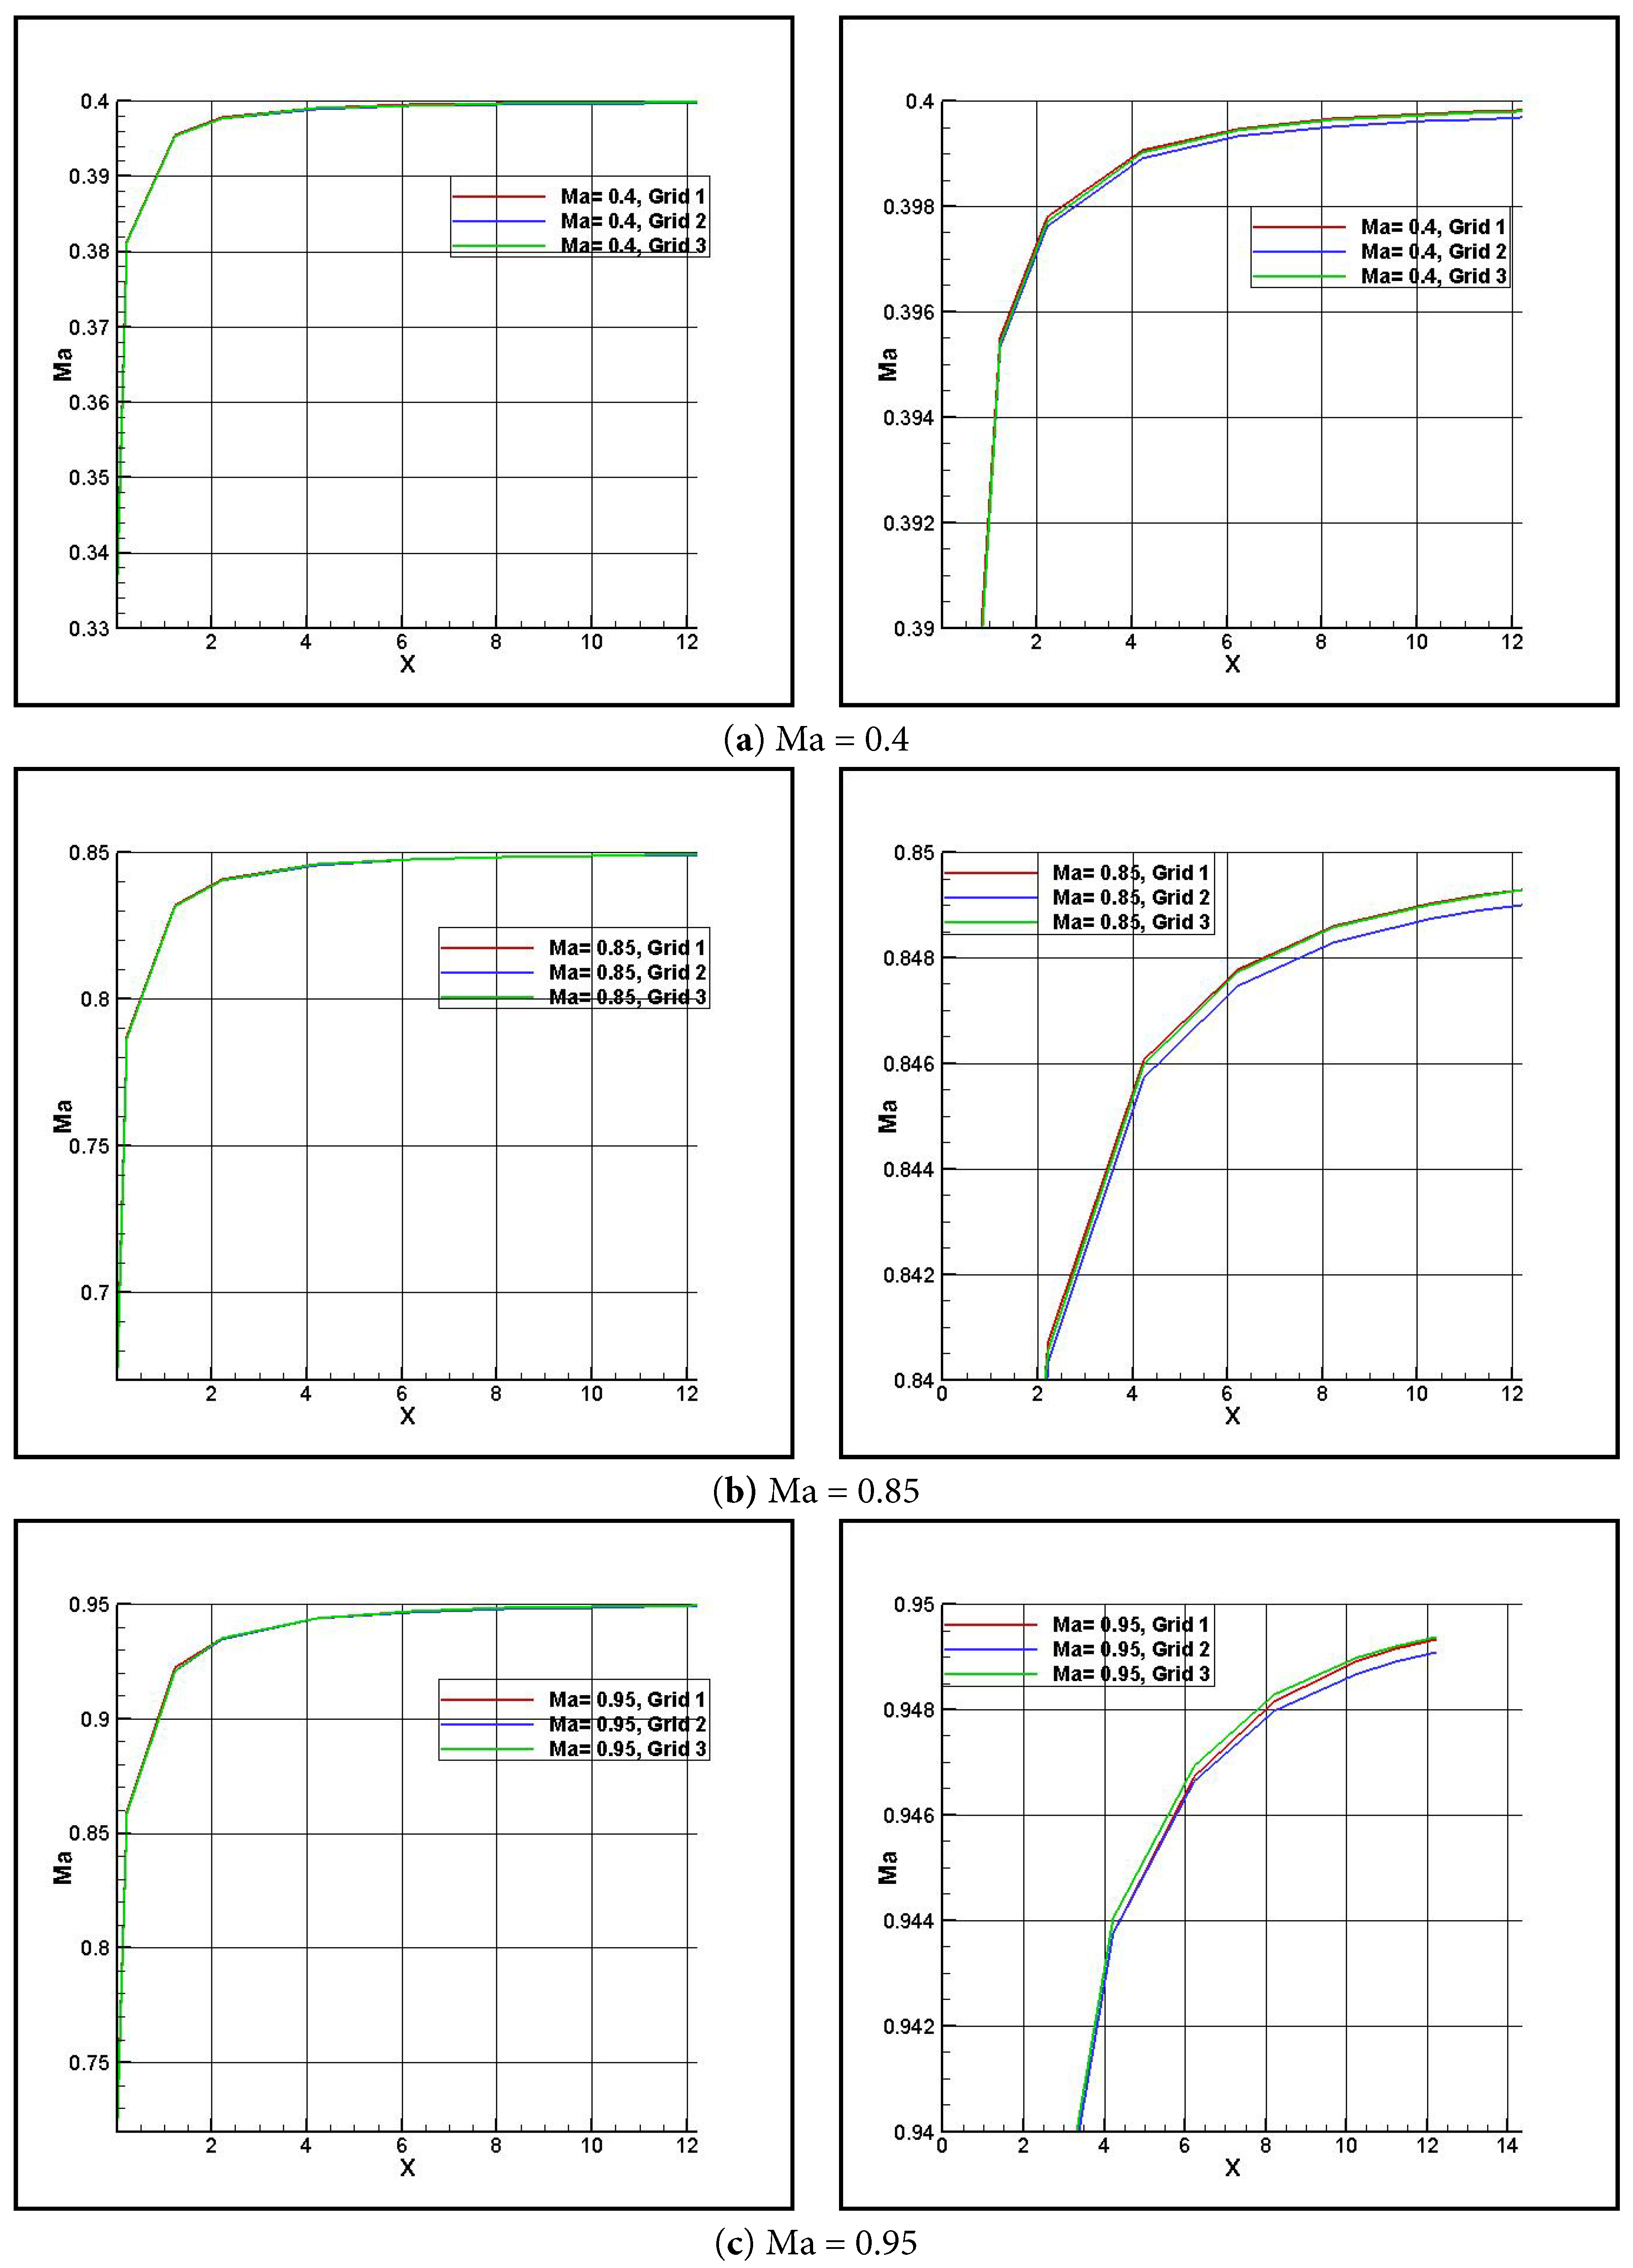
Figure 7: The test of the simulation grid independence.
Table 1: The mesh sensitivity analysis.
| (a) Ma = 0.4 | |||||||
| Grid | The Ma distributions along the axis line in front of the support | ||||||
| X = 2.225 | X = 4.225 | X = 6.225 | X = 8.225 | X = 10.225 | X = 11.225 | X = 12.225 | |
| 1 | 0.39779 | 0.39907 | 0.39948 | 0.39966 | 0.39976 | 0.39980 | 0.39982 |
| 2 | 0.39763 | 0.39892 | 0.39933 | 0.39952 | 0.39962 | 0.39966 | 0.39968 |
| 3 | 0.39772 | 0.39903 | 0.39944 | 0.39964 | 0.39975 | 0.39978 | 0.39981 |
| Standard deviation | 8.02 × 10⁻⁵ | 7.77 × 10⁻⁵ | 7.77 × 10⁻⁵ | 7.57 × 10⁻⁵ | 7.81 × 10⁻⁵ | 7.57 × 10⁻⁵ | 7.81 × 10⁻⁵ |
| (b) Ma = 0.85 | |||||||
| Grid | The Ma distributions along the axis line in front of the support | ||||||
| X = 2.225 | X = 4.225 | X = 6.225 | X = 8.225 | X = 10.225 | X = 11.225 | X = 12.225 | |
| 1 | 0.84072 | 0.84606 | 0.84778 | 0.84860 | 0.84903 | 0.84918 | 0.84930 |
| 2 | 0.84035 | 0.84573 | 0.84747 | 0.84830 | 0.84874 | 0.84889 | 0.84901 |
| 3 | 0.84058 | 0.84599 | 0.84774 | 0.84857 | 0.84901 | 0.84916 | 0.84928 |
| Standard deviation | 1.87 × 10⁻⁴ | 1.74 × 10⁻⁴ | 1.69 × 10⁻⁴ | 1.65 × 10⁻⁴ | 1.62 × 10⁻⁴ | 1.62 × 10⁻⁴ | 1.62 × 10⁻⁴ |
| (c) Ma = 0.95 | |||||||
| Grid | The Ma distributions along the axis line in front of the support | ||||||
| X = 2.225 | X = 4.225 | X = 6.225 | X = 8.225 | X = 10.225 | X = 11.225 | X = 12.225 | |
| 1 | 0.93501 | 0.94376 | 0.94674 | 0.94816 | 0.94890 | 0.94915 | 0.94934 |
| 2 | 0.93492 | 0.94376 | 0.94664 | 0.94798 | 0.94868 | 0.94891 | 0.94908 |
| 3 | 0.93516 | 0.94403 | 0.94693 | 0.94828 | 0.94898 | 0.94921 | 0.94938 |
| Standard deviation | 1.21 × 10⁻⁴ | 1.56 × 10⁻⁴ | 1.47 × 10⁻⁴ | 1.51 × 10⁻⁴ | 1.55 × 10⁻⁴ | 1.59 × 10⁻⁴ | 1.63 × 10⁻⁴ |
4.1 Surface Static Pressure Distribution on the Supports
The surface static pressure distributions of the 4 support configurations are investigated from Mach number 0.4 to 0.95. They are illustrated from Fig. 8, Fig. 9 and Fig. 10.
Of the pressure distributions of the 4 support configurations in the 3 different flow velocities, it is seen that the areas of the high pressure fields on the surface of the initial 6-DOF support are all the biggest. Comparing with the geometric disturbances to the sting from the bending mechanism for the static experimental support, the connecting bases of the tail support rods are closer to the nose of the sting for the initial 6-DOF support. Also, the diameters of the connecting bases and tail support rods connecting with the sting of the initial 6-DOF support are nearly 1.5 times of those of the optimized 6-DOF model. Then, comparing with the static experimental support and the optimized 6-DOF support, the initial 6-DOF support has 6 additional feet outside of the wind tunnel wall. The high pressure areas on the feet of the initial 6-DOF support are kept. These high-pressure fields on their surface cause momentum loss of the flow around the supports, and the pressure disturbance waves propagate upstream, as shown in Fig. 11, Fig. 12 and Fig. 13. Meanwhile, it is indicated that the high-pressure areas on the windward sides of connecting bases and the tail support rods become clearly smaller, with the diameter of the support rods decreasing from Fig. 8, Fig. 9 and Fig. 10. Moreover, with the Mach number increasing from 0.4 to 0.95, the high pressure are as significantly decrease. This phenomenon is particularly evident at the surface pressure distribution of the connecting bases on the stings for the dynamic 6-DOF supports.
Furthermore, the areas of the high pressure fields on the tail support poles are much smaller than those on the connecting bases on the sting. It is demonstrated that the momentum loss caused by the tail support poles is much lower than that caused by the latter. Comparing with the upstream pressure distributions of the flow around the optimized 6-DOF support, there is little difference when the support poles are removed. It is indicated that the impacts of the tail support poles on the upstream pressure field are almost negligible. It is corresponding to the characteristics from Fig. 11, Fig. 12 and Fig. 13.
It means that the connecting bases of the support rods on the sting and the feet outside of the wall cause the main momentum loss of the flow.
The upstream pressure distributions in front of the static experimental support are chosen as baseline. Then the relative impact quantities on the pressure distributions by the otherthree6-DOFsupports are investigated from Fig. 11, Fig. 12 and Fig. 13. At x = 0.225 m on the center line, the relative pressure impact quantities (dP_rate) caused by the initial 6-DOF supportachieve respectively about 0.1%, 1.5% and 2.2% at Mach number 0.4, 0.85 and 0.95. Within a 3 m range upstream of the sting nose, from the initial 6-DOF support to the optimized one, the relative impacts on the pressure distribution are improved by more than 50%. While, at the same monitor point, the corresponding relative impact quantities (dP_rate) caused by the optimized one amount to respectively about 0.01%, 0.7% and 0.9% at Mach number 0.4, 0.85 and 0.95. Besides, as the Mach number increasing in the subsonic-transonic range, the impact quantities are greater and the improvement is more meaningful.
In a word, with the diameter of connecting bases on the support sting decreasing and removing the feet outside of the wall, the momentum loss becomes smaller.
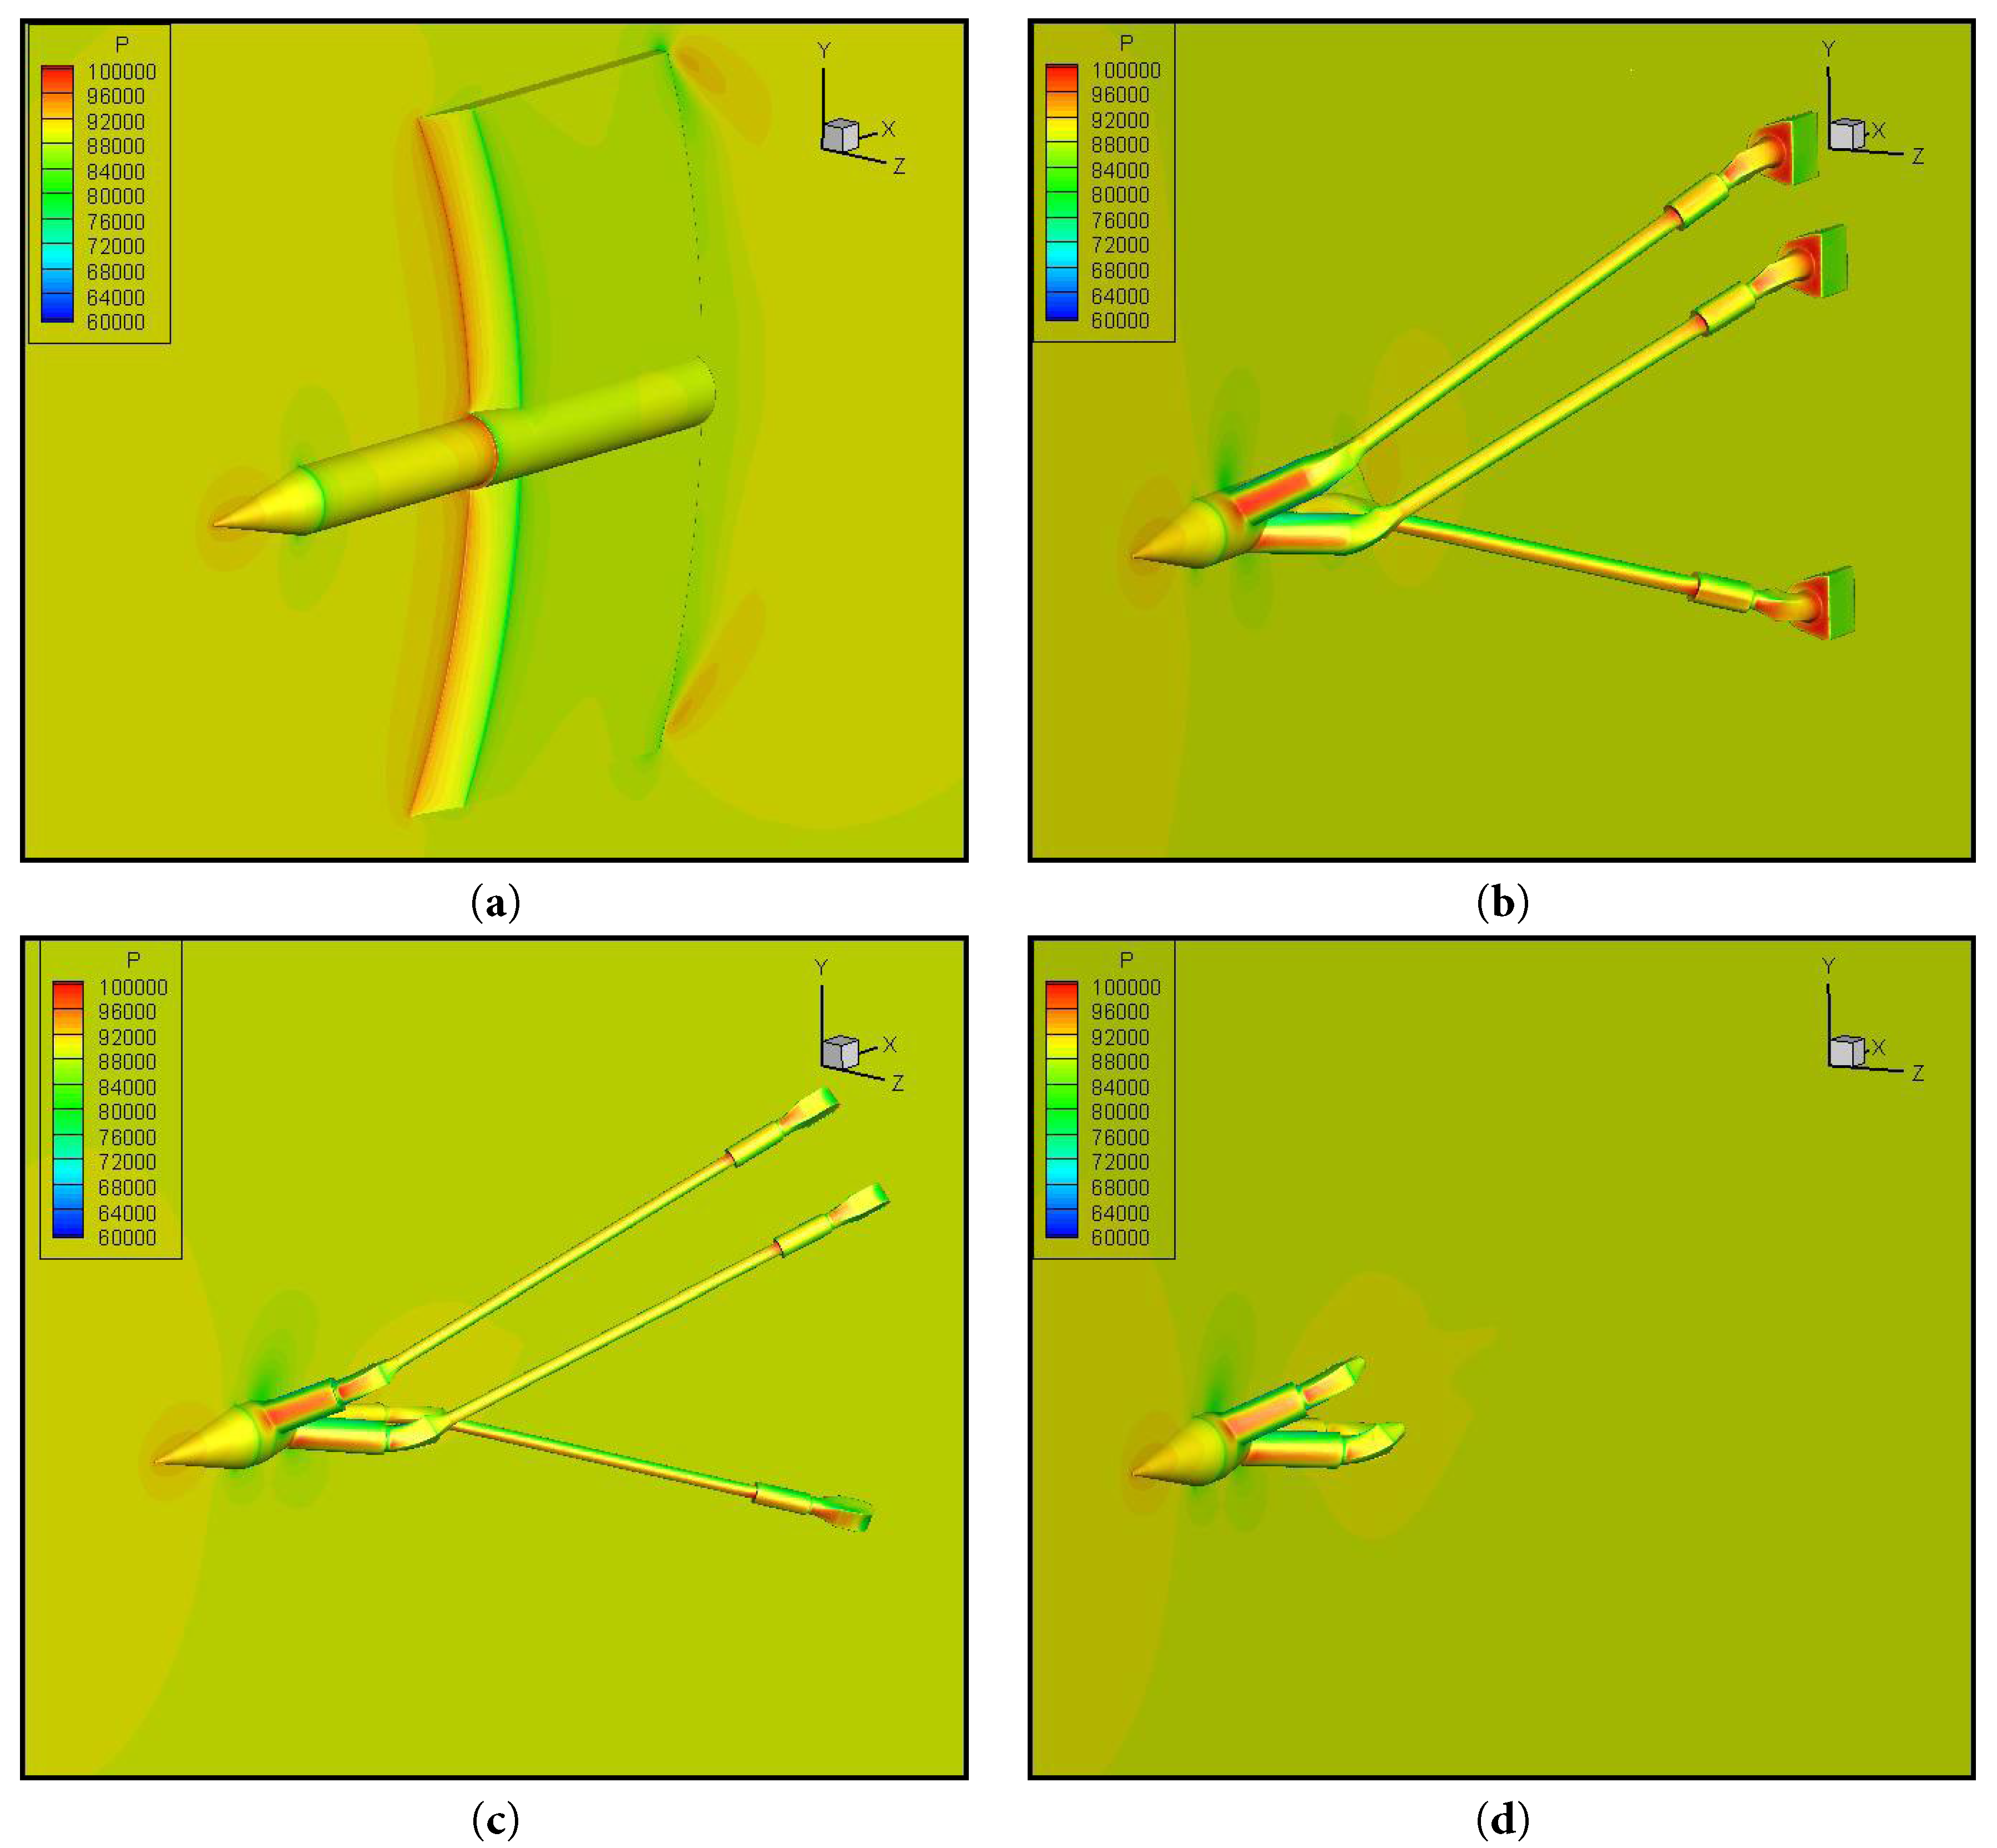
Figure 8: Static surface pressure distribution of the supports (Ma = 0.4): (a) The static experimental support; (b) The initial model of dynamic 6-DOF support; (c) The optimized support; (d) The optimized support without any tail support rod.
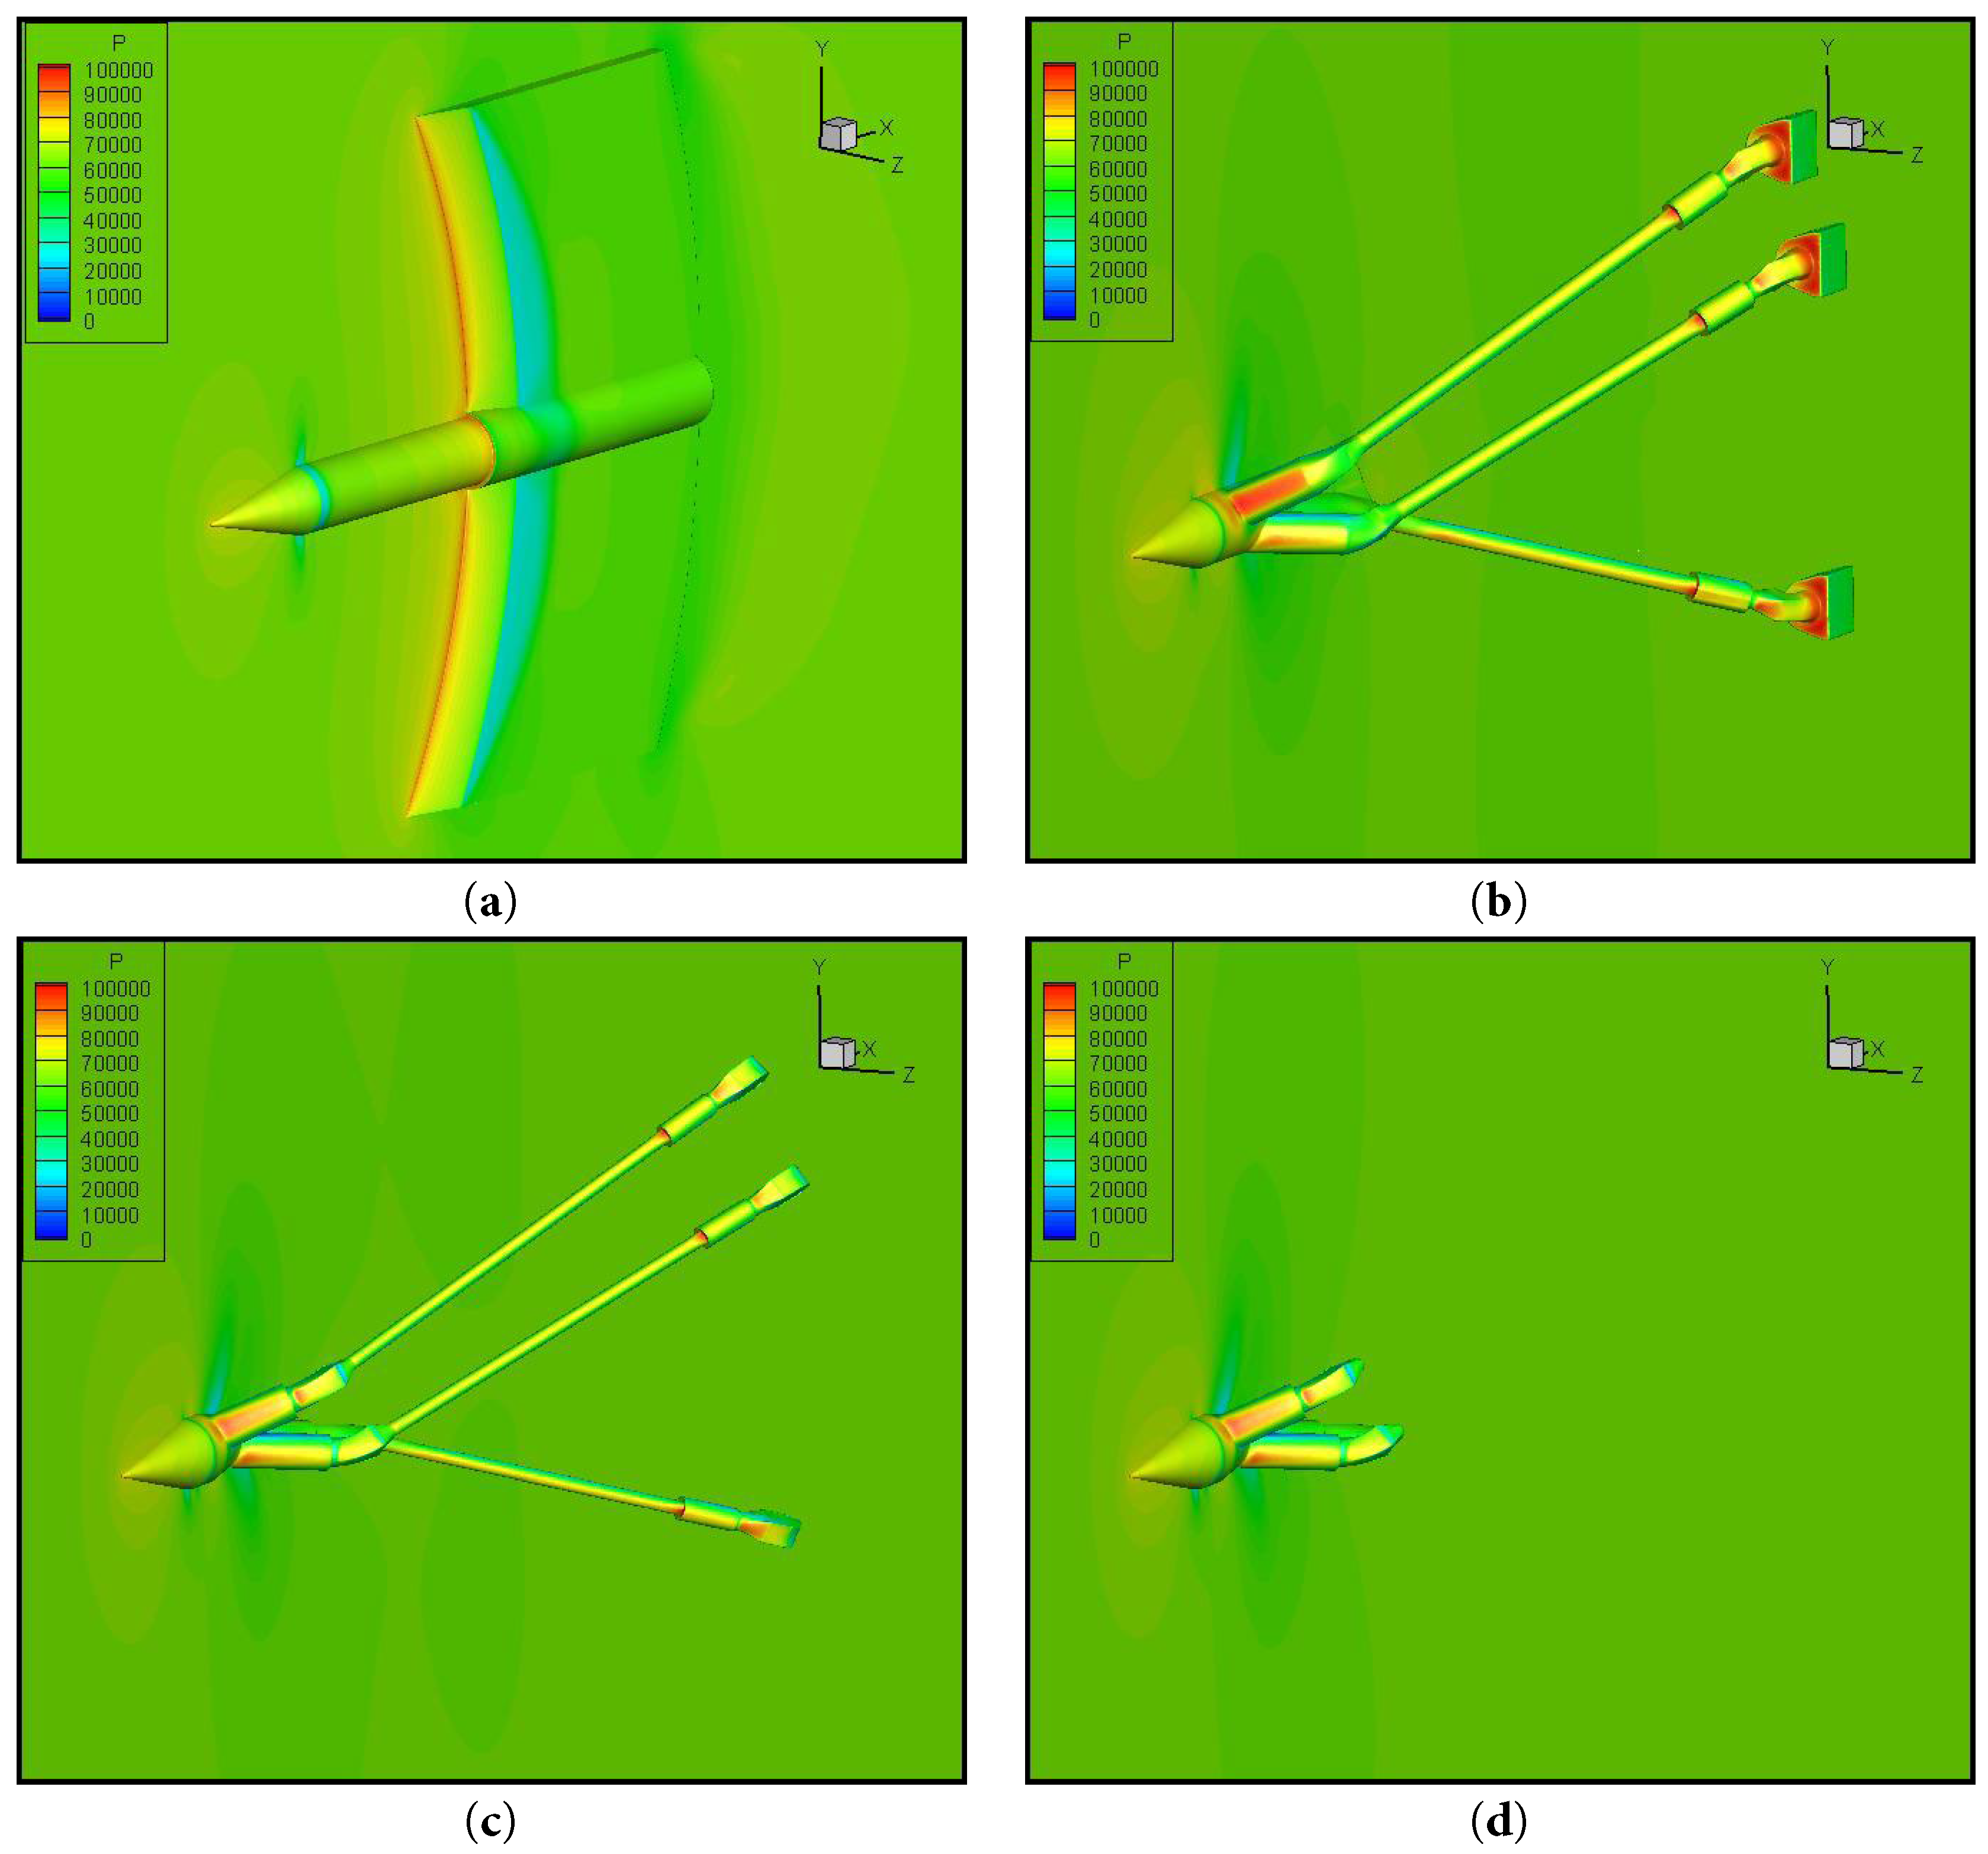
Figure 9: Static surface pressure distribution of the supports (Ma = 0.85): (a) The static experimental support; (b) The initial model of dynamic 6-DOF support; (c) The optimized support; (d) The optimized support without any tail support rod.

Figure 10: Static surface pressure distribution of the supports (Ma = 0.95): (a) The static experimental support; (b) The initial model of dynamic 6-DOF support; (c) The optimized support; (d) The optimized support without any tail support rod.
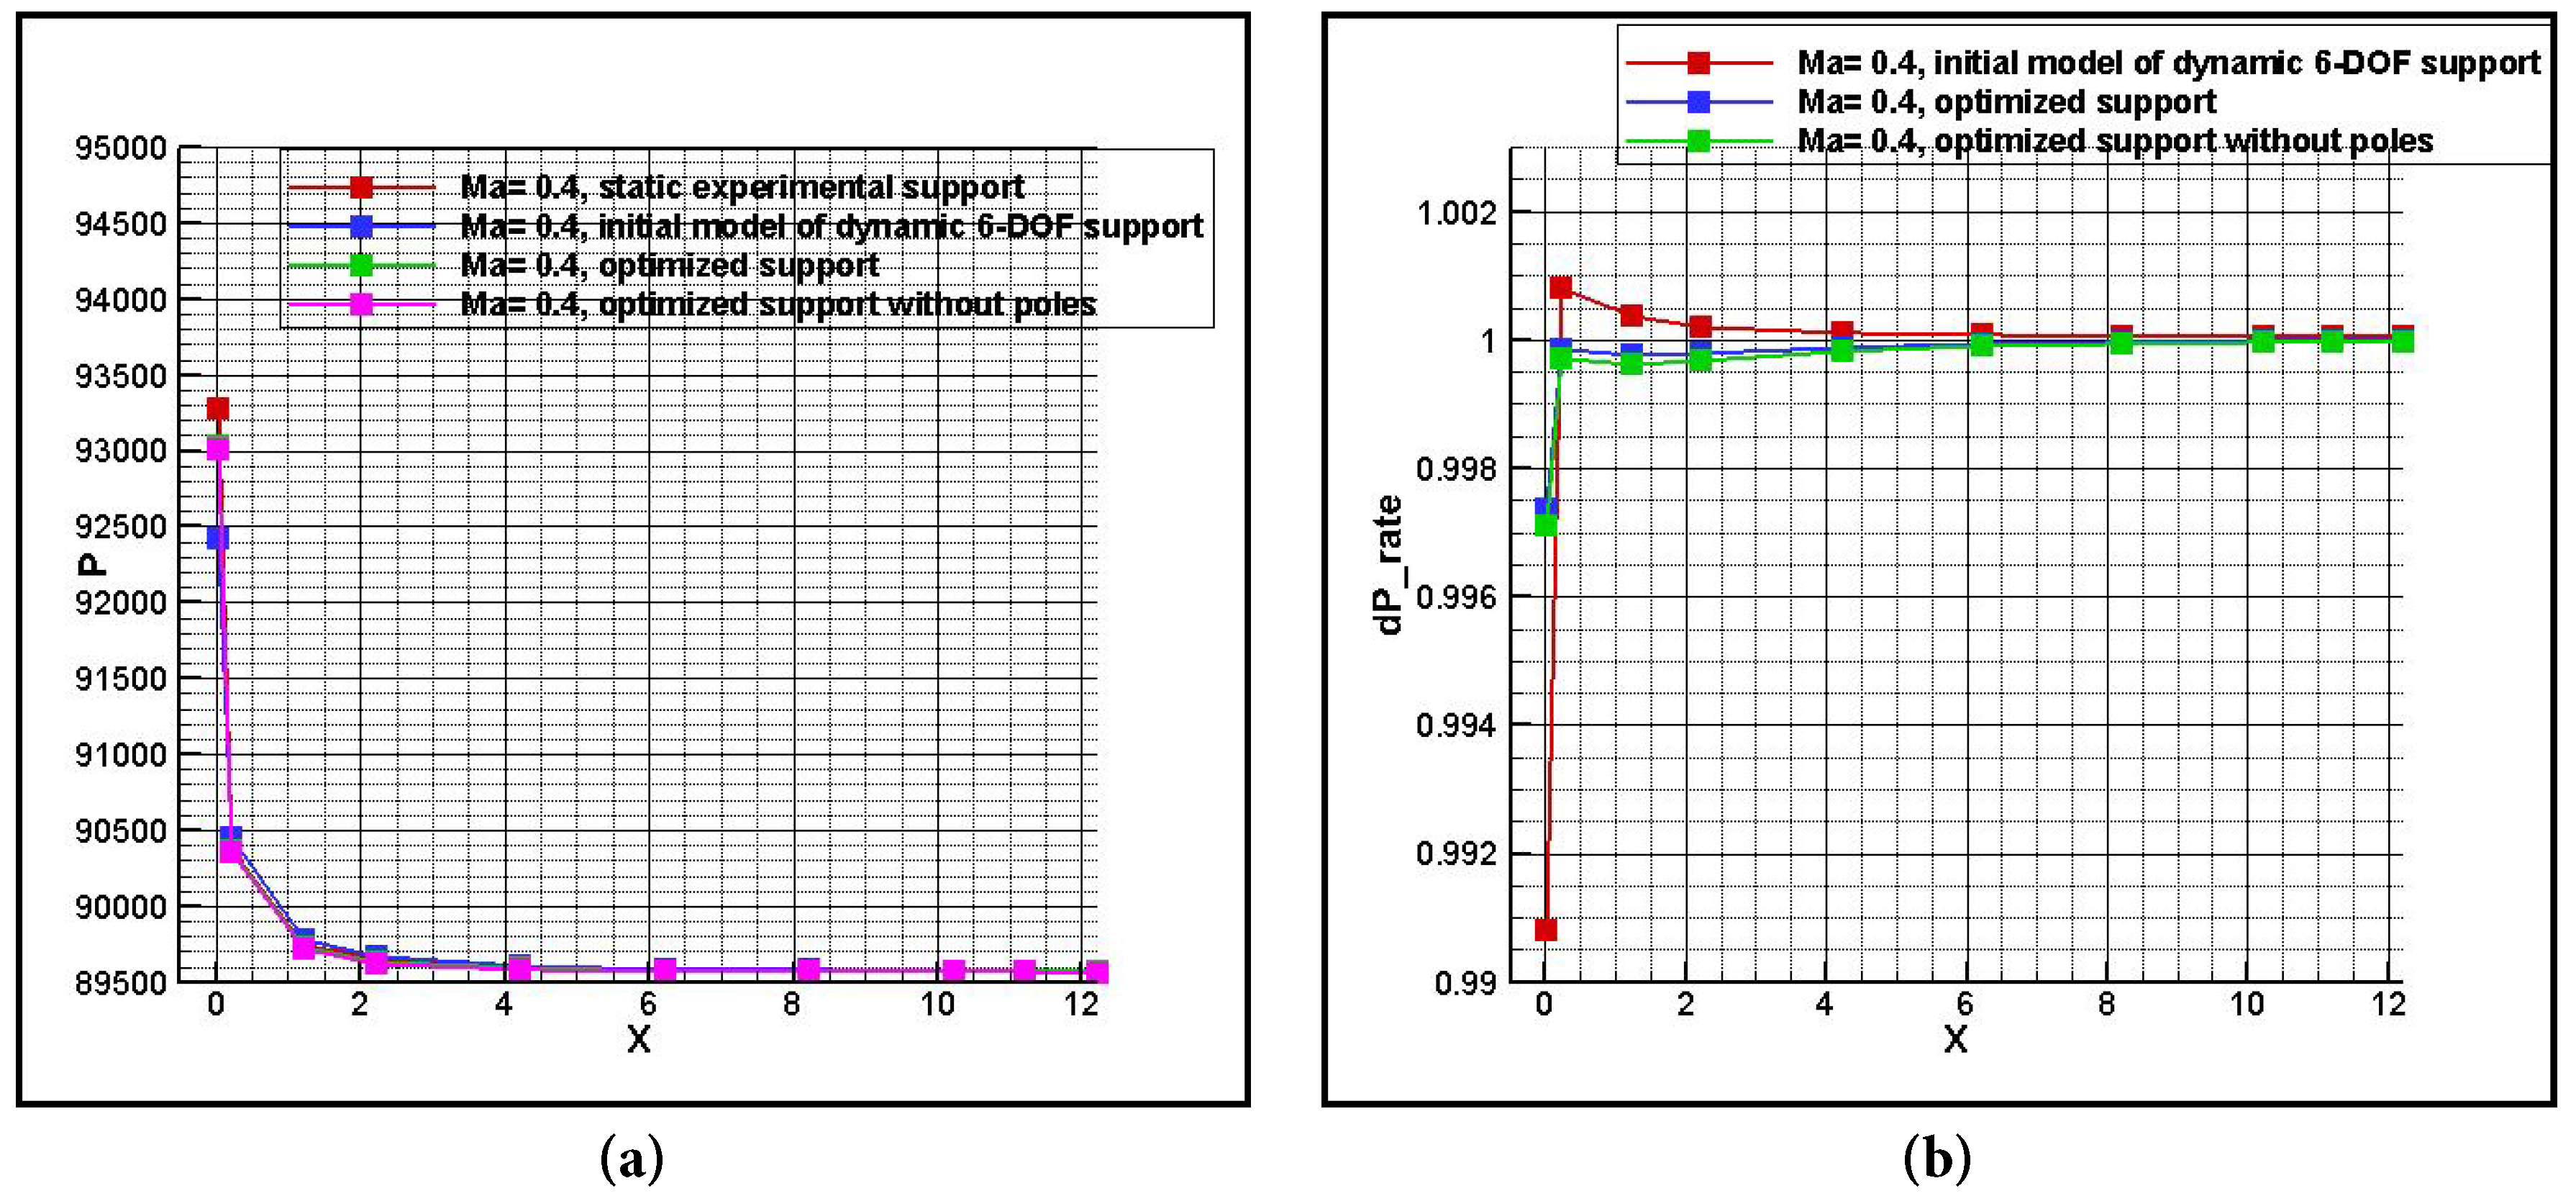
Figure 11: Pressure distribution along the axis line in front of the supports (Ma = 0.4): (a) Pressure distribution; (b) Relative pressure impact quantities distribution.
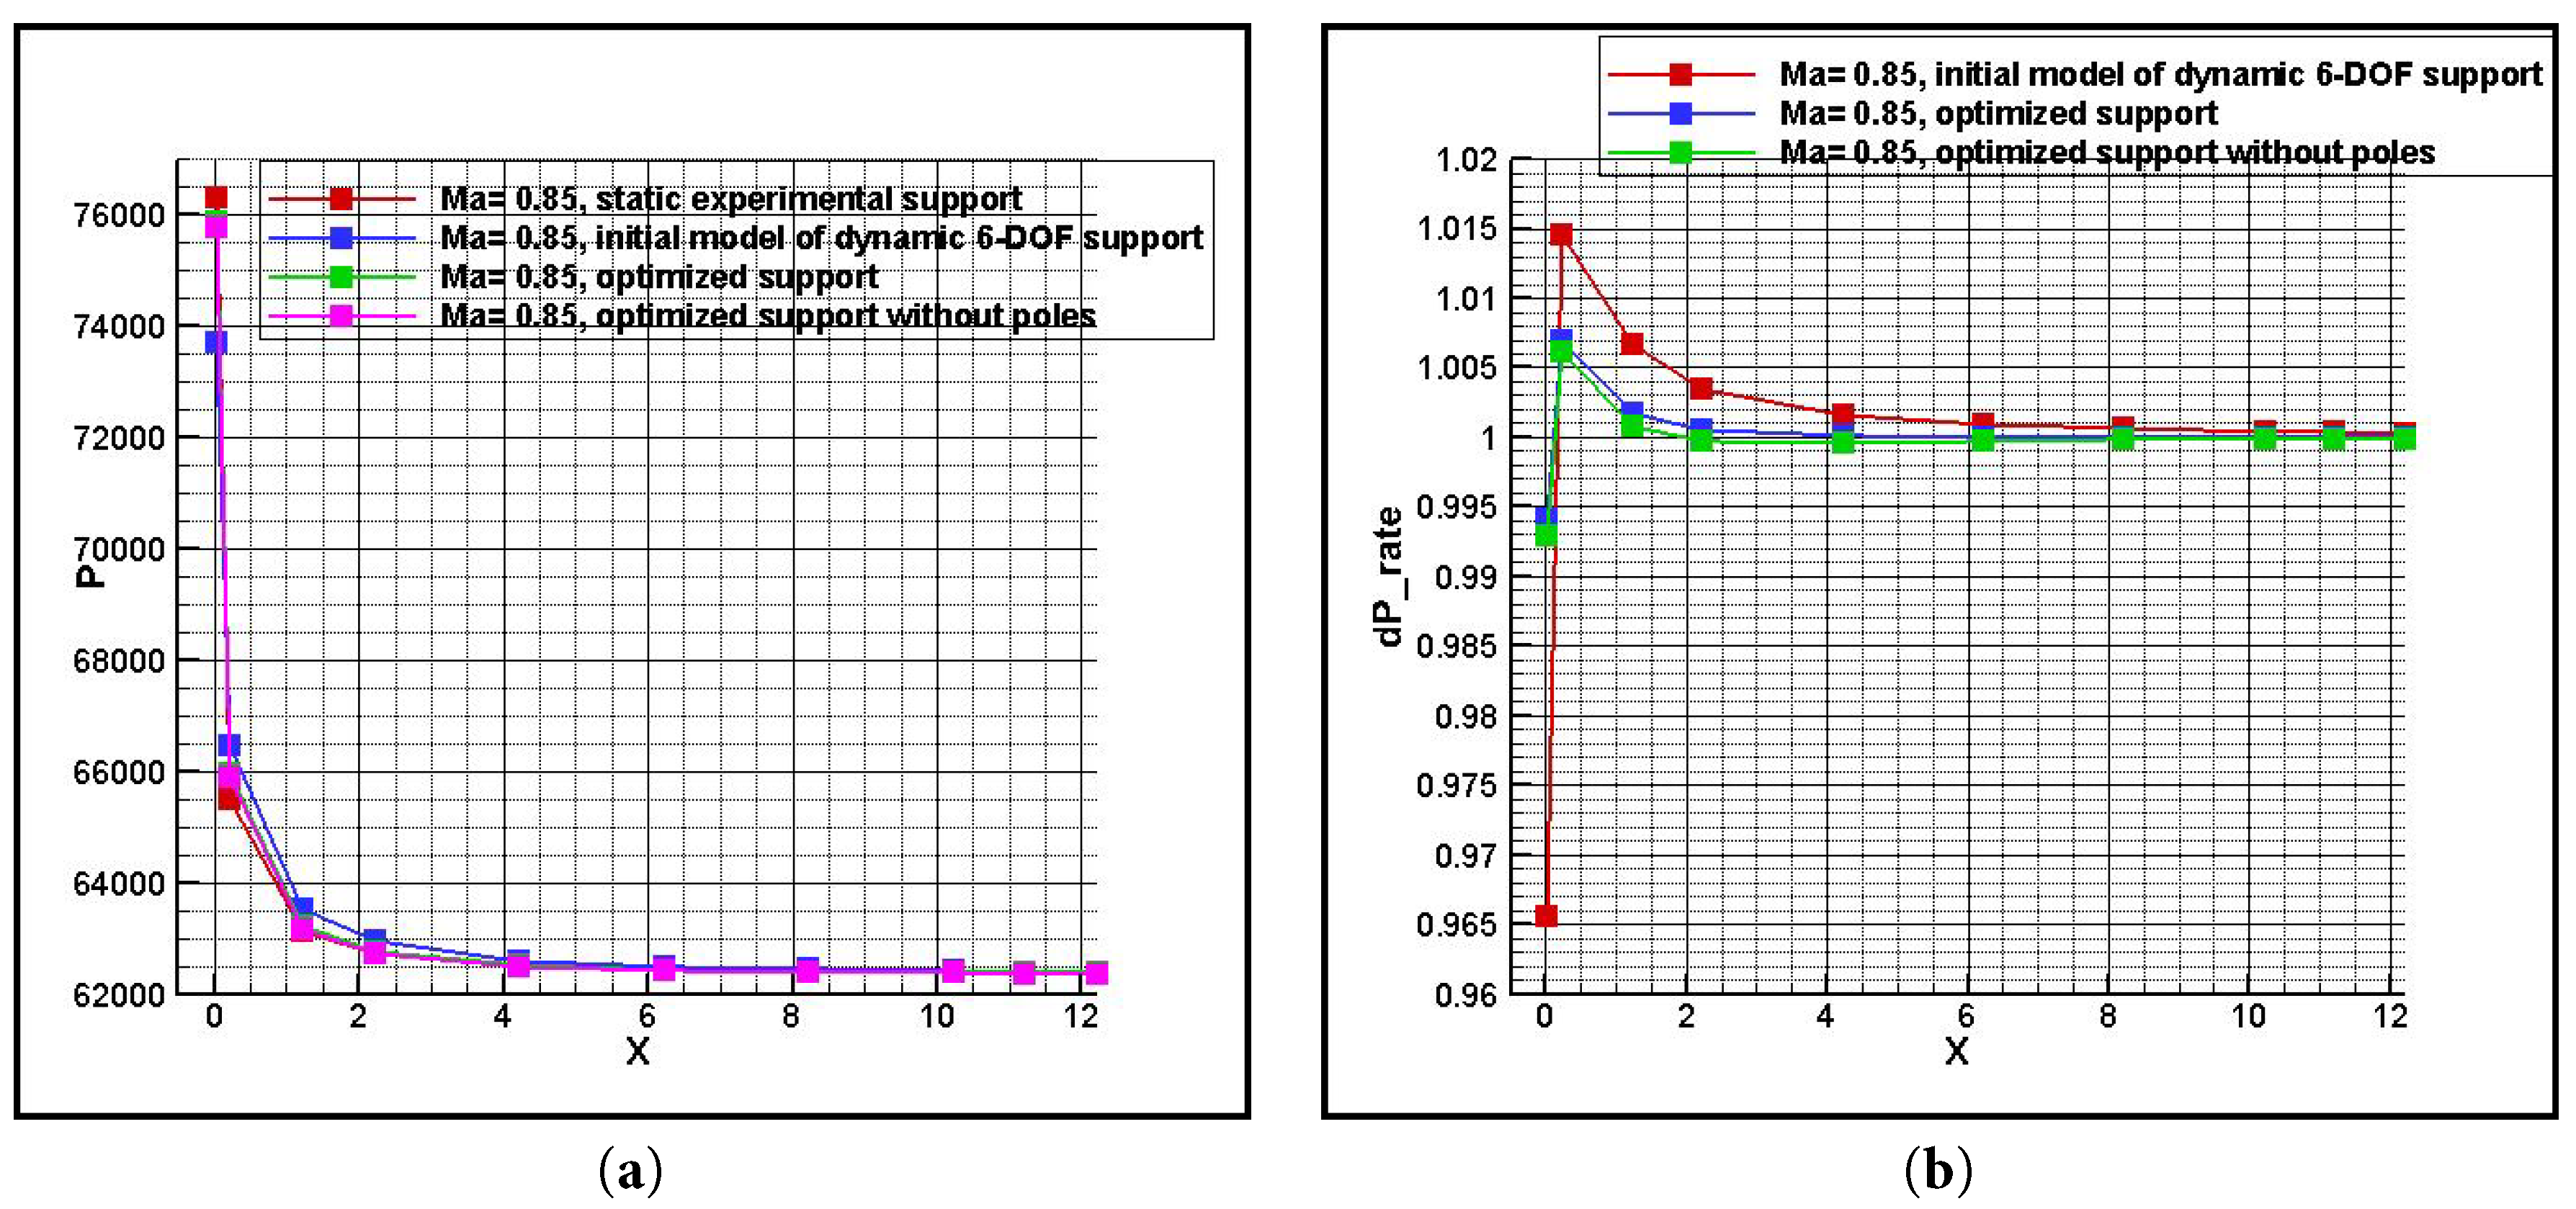
Figure 12: Pressure distribution along the axis line in front of the supports (Ma = 0.85): (a) Pressure distribution; (b) Relative pressure impact quantities distribution.
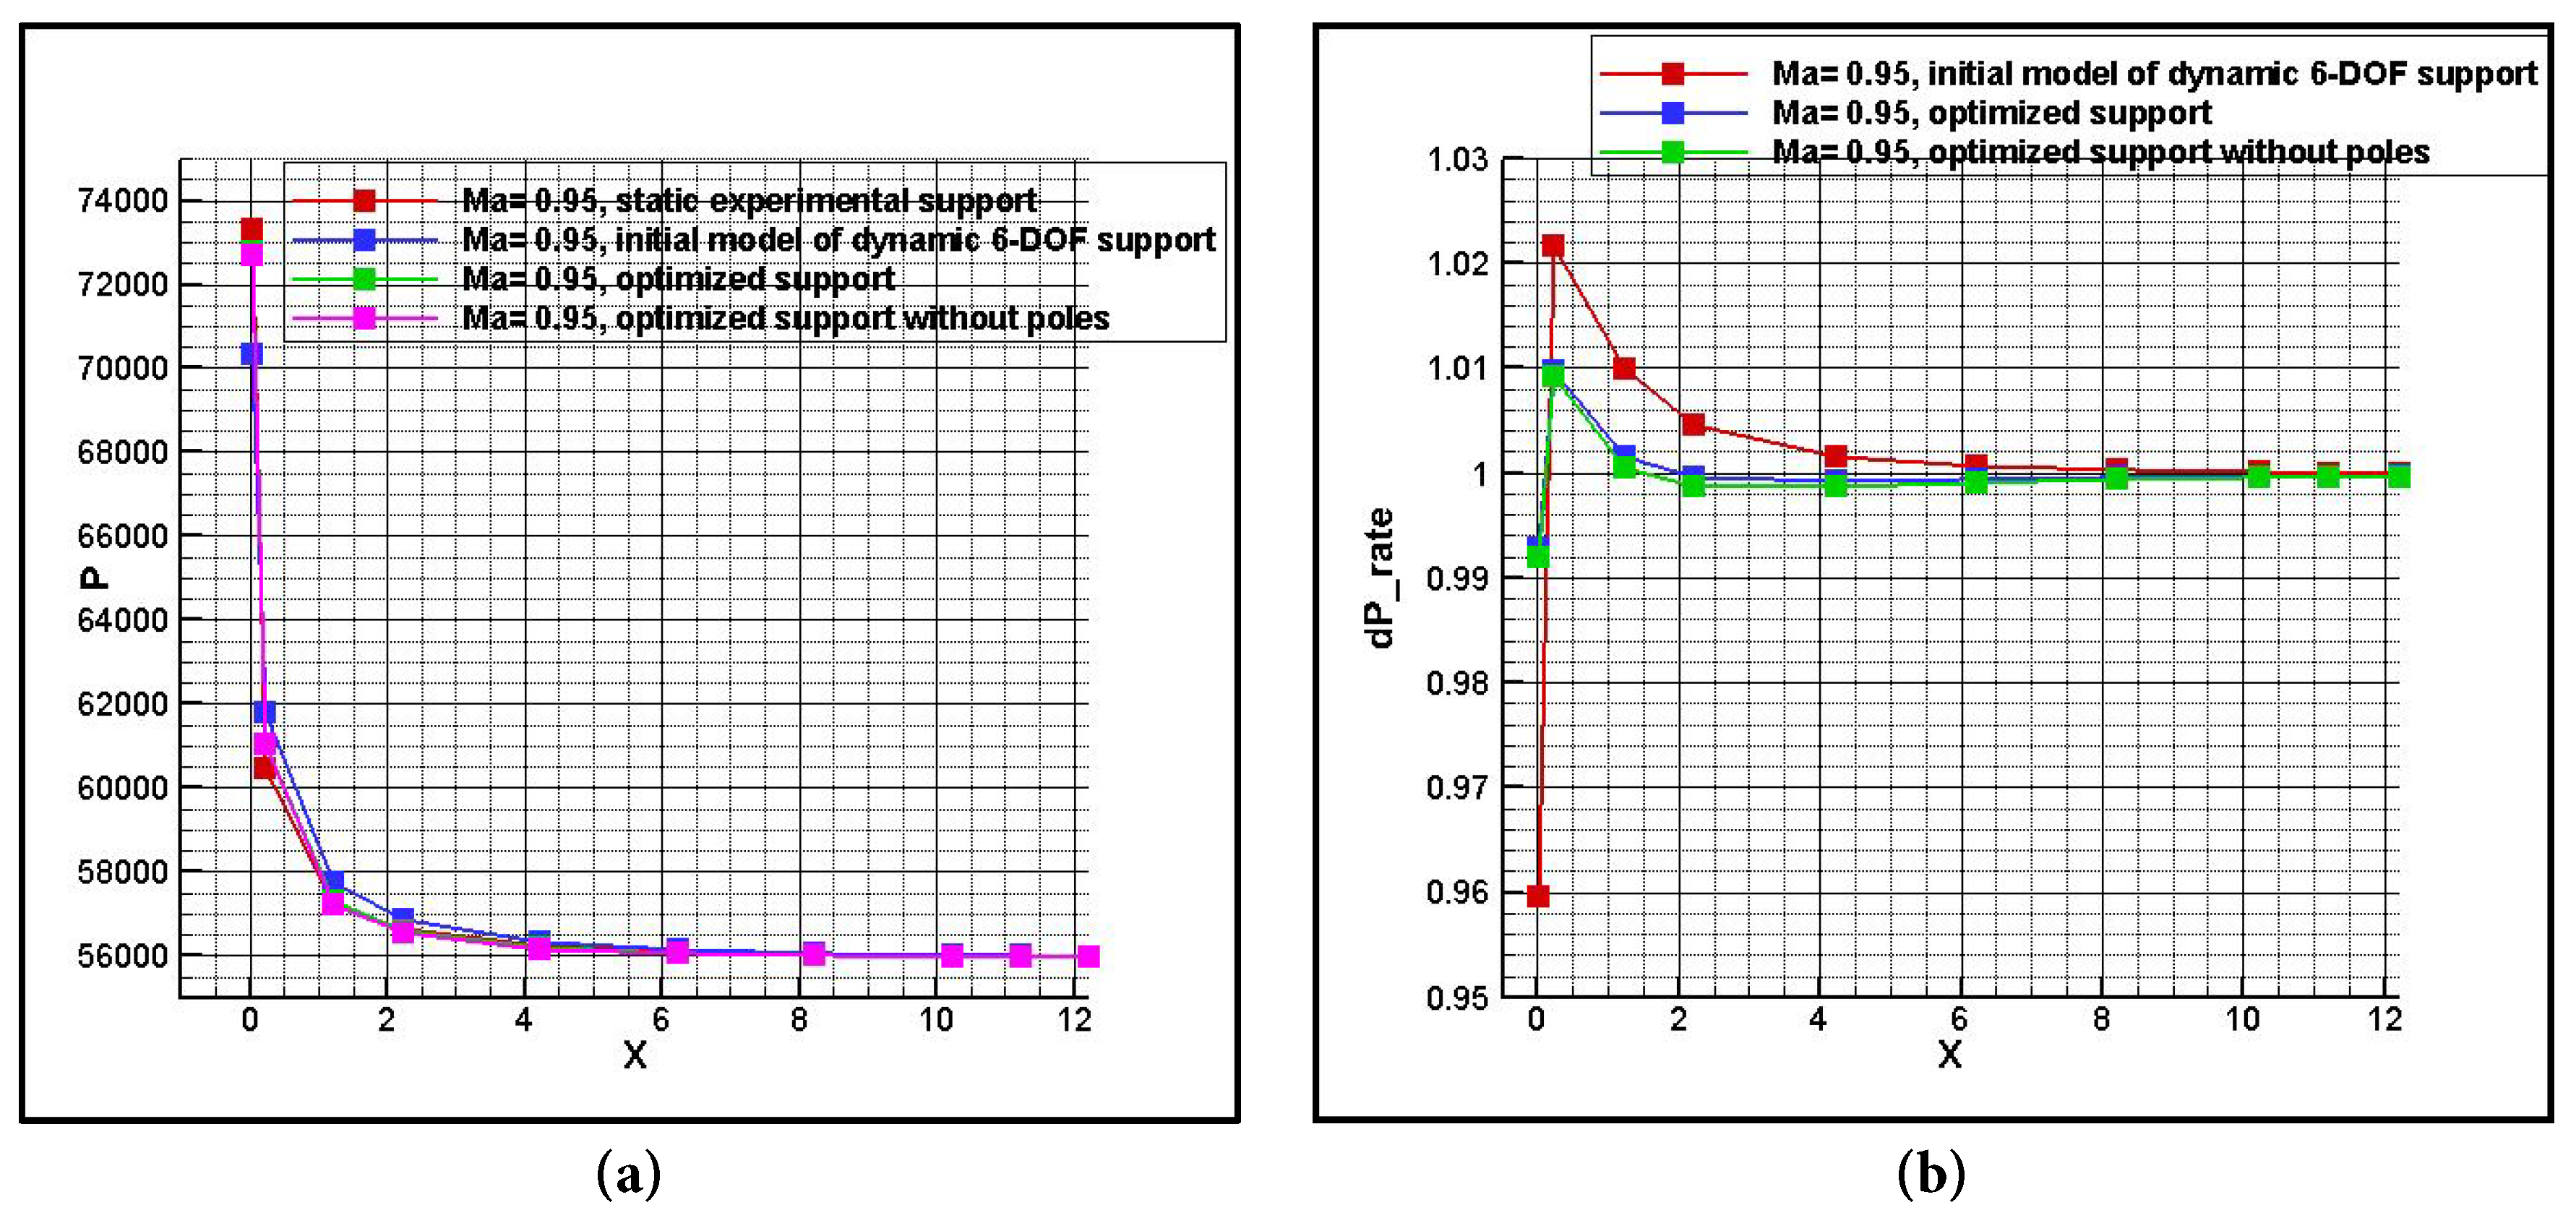
Figure 13: Pressure distribution along the axis line in front of the supports (Ma = 0.95): (a) Pressure distribution; (b) Relative pressure impact quantities distribution.
4.2 Velocity Field Distribution Influenced by the Supports
The velocity distributions in the flow fields around the 4 support configurations are investigated from Mach number 0.4 to 0.95. They are depicted from Fig. 14, Fig. 15 and Fig. 16.
Of the flow fields around the 4 support configurations, the area of the wake separate zone behind the static experimental support is seen to be the biggest. Meanwhile, that behind the optimized 6-DOF support is smallest because of the support sting with a tail fairing. At varying flow velocity, the impact field on the upstream caused by the static experimental support is biggest at Mach number 0.4. While, at Mach number 0.85 and 0.95, the initial 6-DOF support causes the biggest impact field on the upstream. Fig. 15 and Fig. 16 illustrate that the impact field on the upstream caused by the initial 6-DOF support is evidently bigger than that caused by the static experimental support at transonic. The shocks exist at two junctions in the transonic flow. One of them is the junction of the nose and the cylinder. And the other one is the junction of the sting and the connecting bases of the support rods. Moreover, with the Mach number increasing from 0.4 to 0.95, the impact level of the disturb field to the upstream distinctly increases. It means that separate fields and the momentum loss of the flow caused by the shocks would influence the impact level of the disturb field to the upstream.
Furthermore, comparing with the velocity distributions of the flow around the optimized 6-DOF support, there is little difference when the support poles are removed. It is demonstrated that the impacts of the support poles on the upstream velocity field are almost negligible comparing with those of the support sting. It is corresponding to the characteristics from Fig. 17, Fig. 18 and Fig. 19.
The upstream velocity distributions in front of the static experimental support are chosen as reference. Then the relative impact quantities on the velocity distributions by the other three 6-DOF supports are analyzed from Fig. 17, Fig. 18 and Fig. 19. At x = 0.225 m on the center line, the relative velocity impact quantities (dMa) caused by the initial 6-DOF support reach respectively about 0.002, 0.015 and 0.02 at Mach number 0.4, 0.85 and 0.95. Within a 3 m range upstream of the sting nose, from the initial 6-DOF support to the optimized one, the relative impacts on the velocity distributions are improved by more than 50%. While, at the same monitor points, the corresponding relative impact quantities (dMa) caused by the optimized one amount to respectively about 0.0002, 0.008 and 0.01 at Mach number 0.4, 0.85 and 0.95. Besides, as the Mach number increasing in the subsonic-transonic range, the impacts on the velocity distribution are greater.
In brief, the separate field and momentum loss of the flow both influence the impact level of the disturbance field to the upstream together.
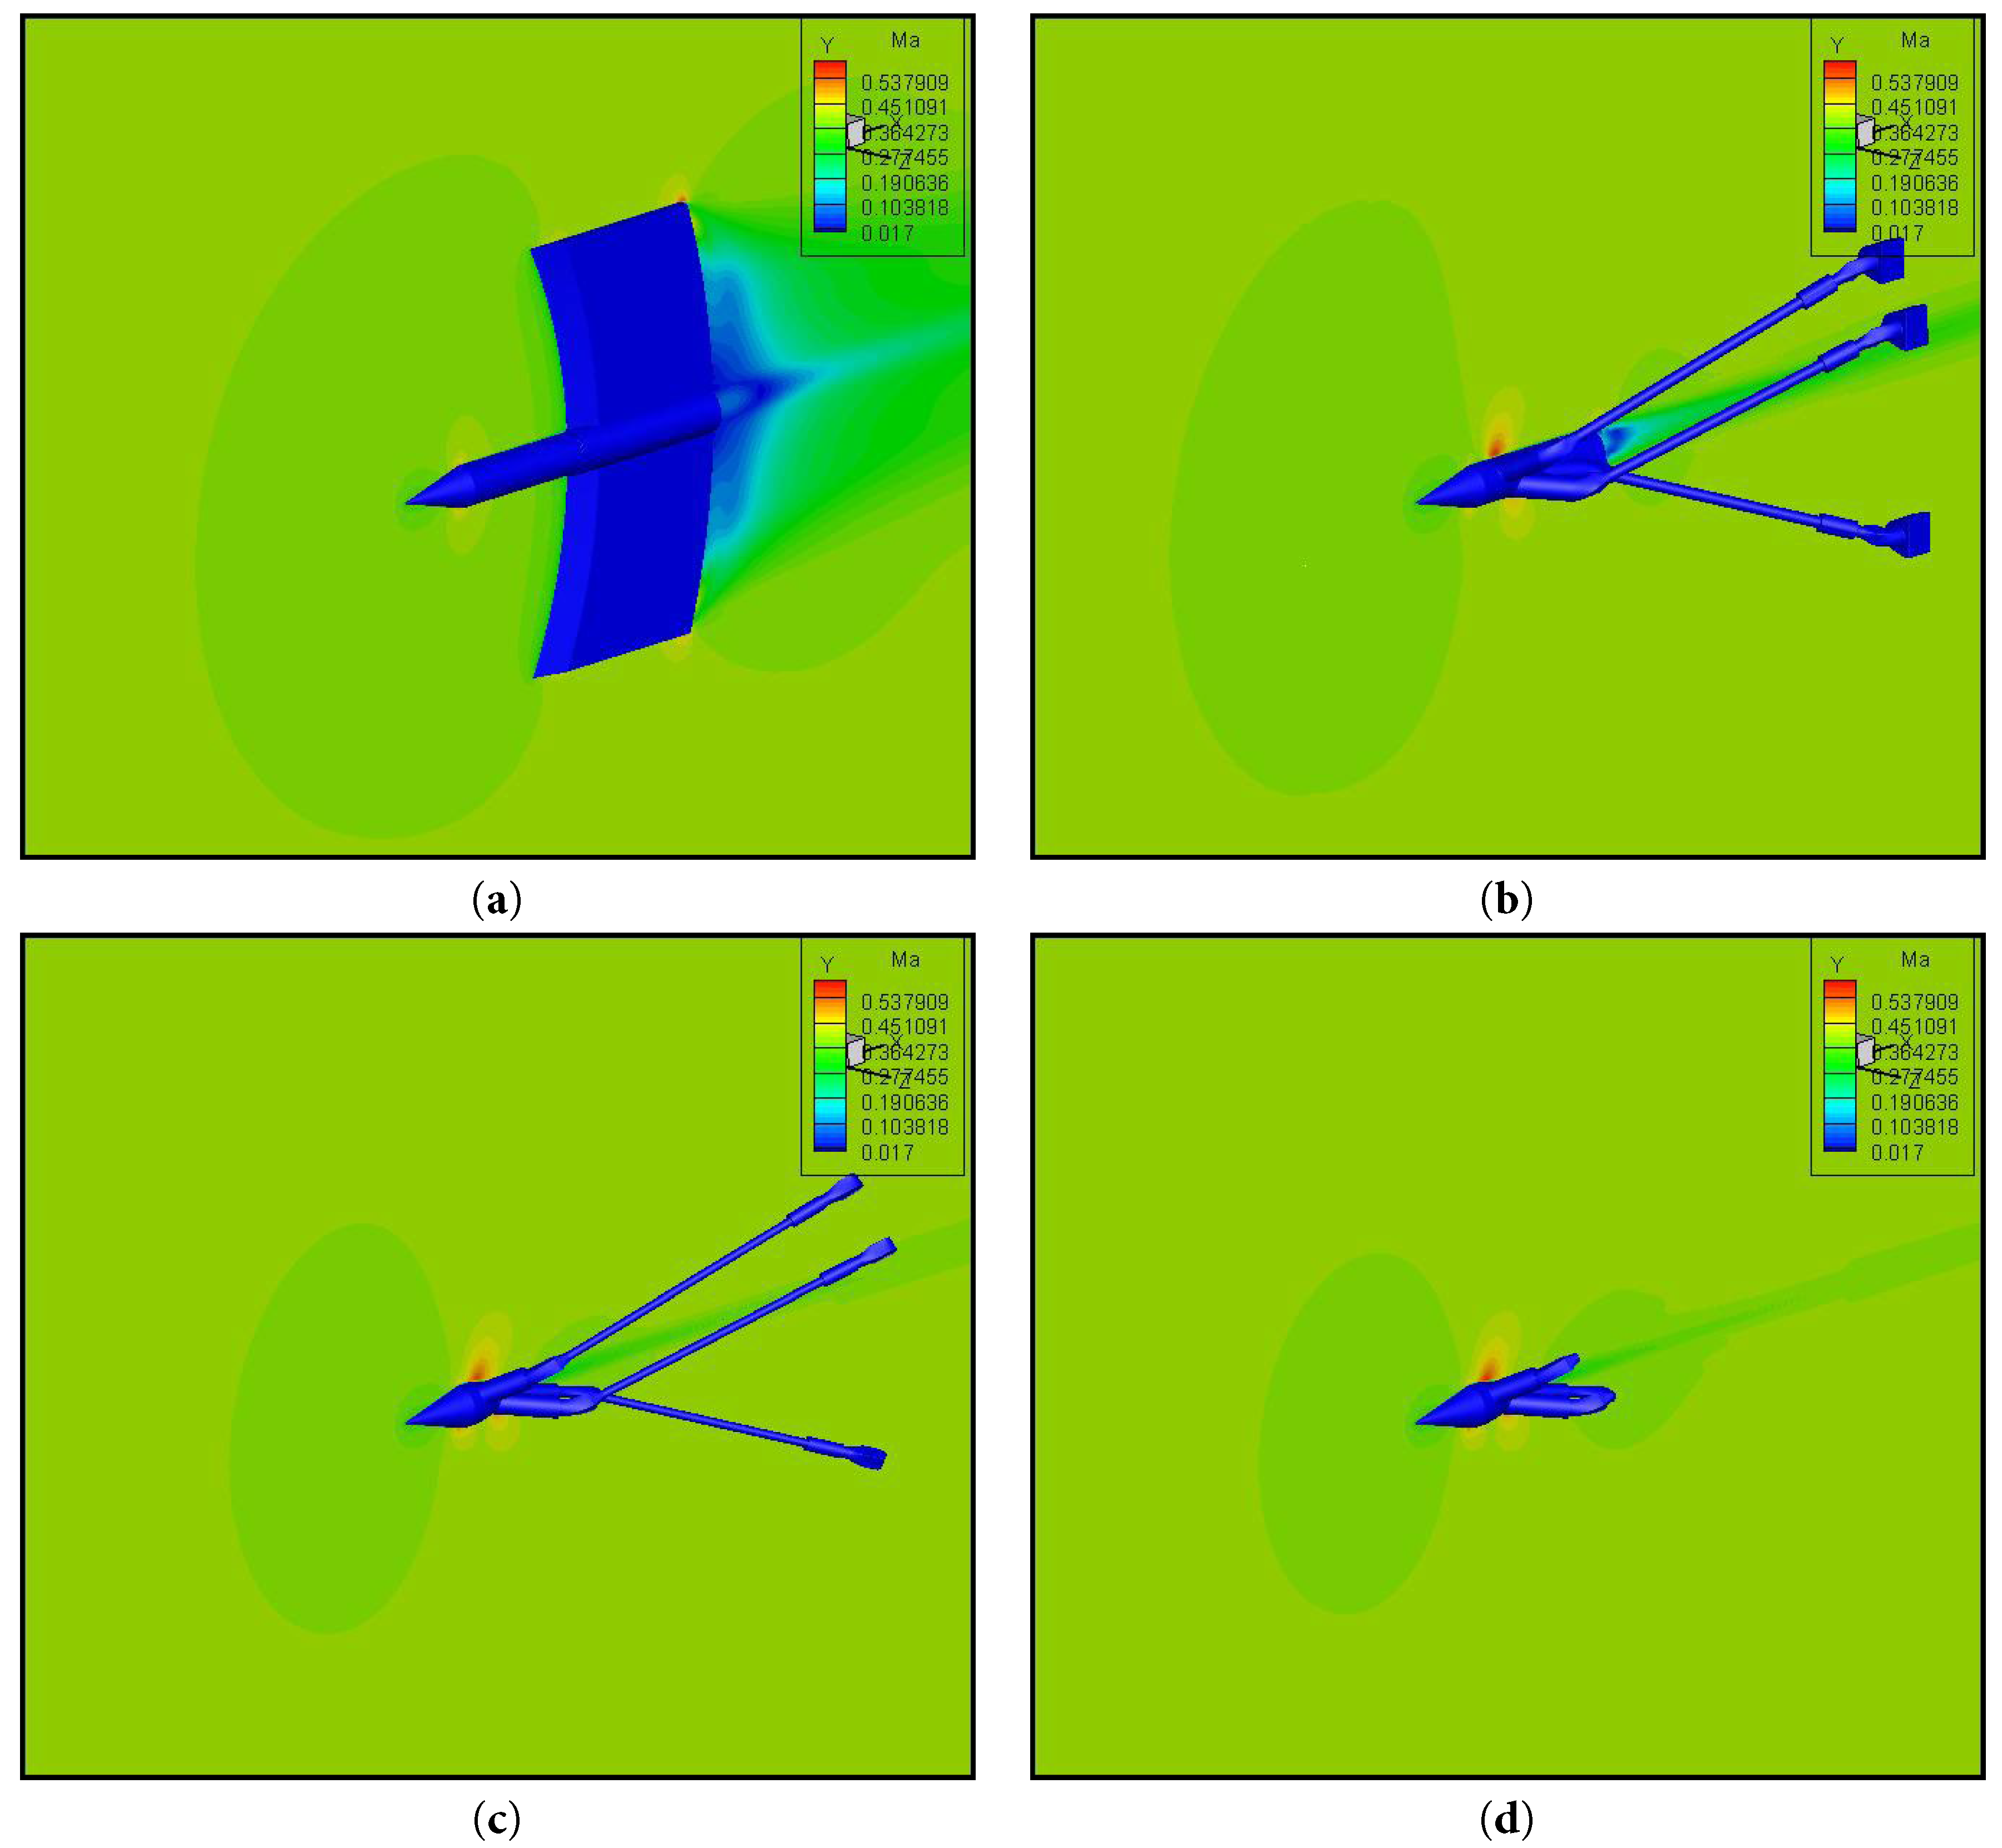
Figure 14: Velocity distribution around the supports (Ma = 0.4): (a) The static experimental support; (b) The initial model of dynamic 6-DOF support; (c) The optimized support; (d) The optimized support without any tail support rod.
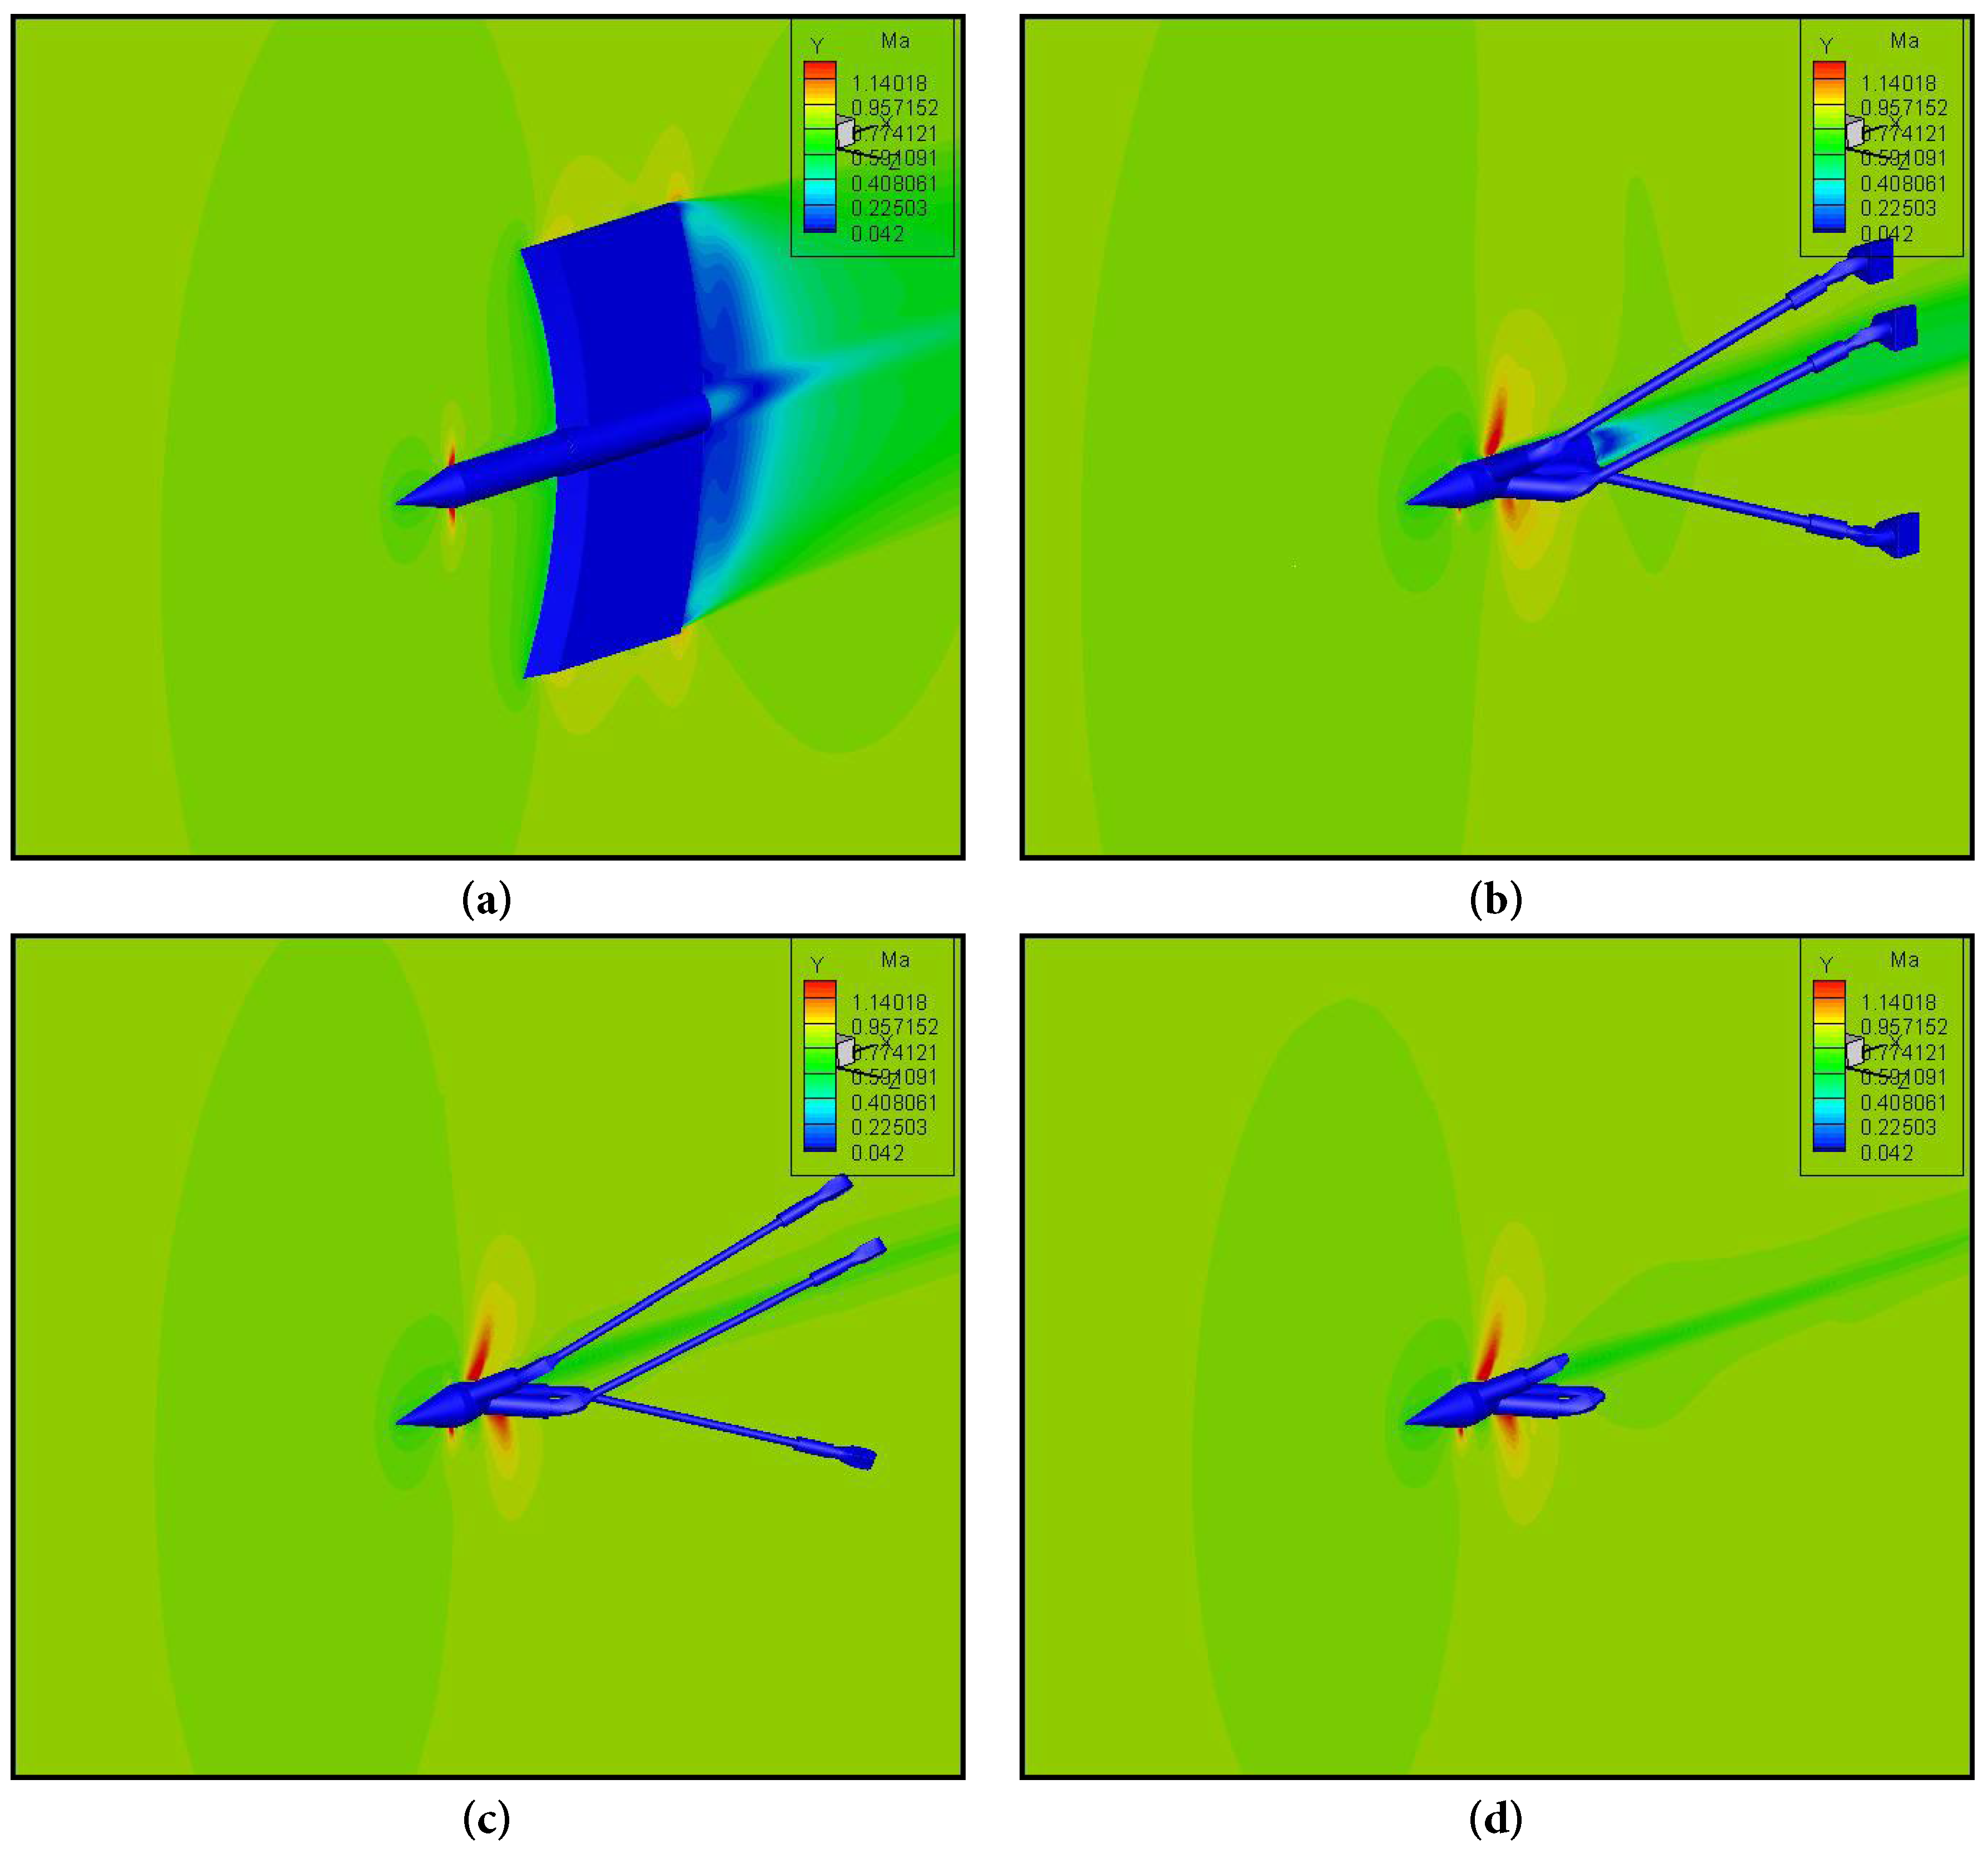
Figure 15: Velocity distribution around the supports (Ma = 0.85): (a) The static experimental support; (b) The initial model of dynamic 6-DOF support; (c) The optimized support; (d) The optimized support without any tail support rod.
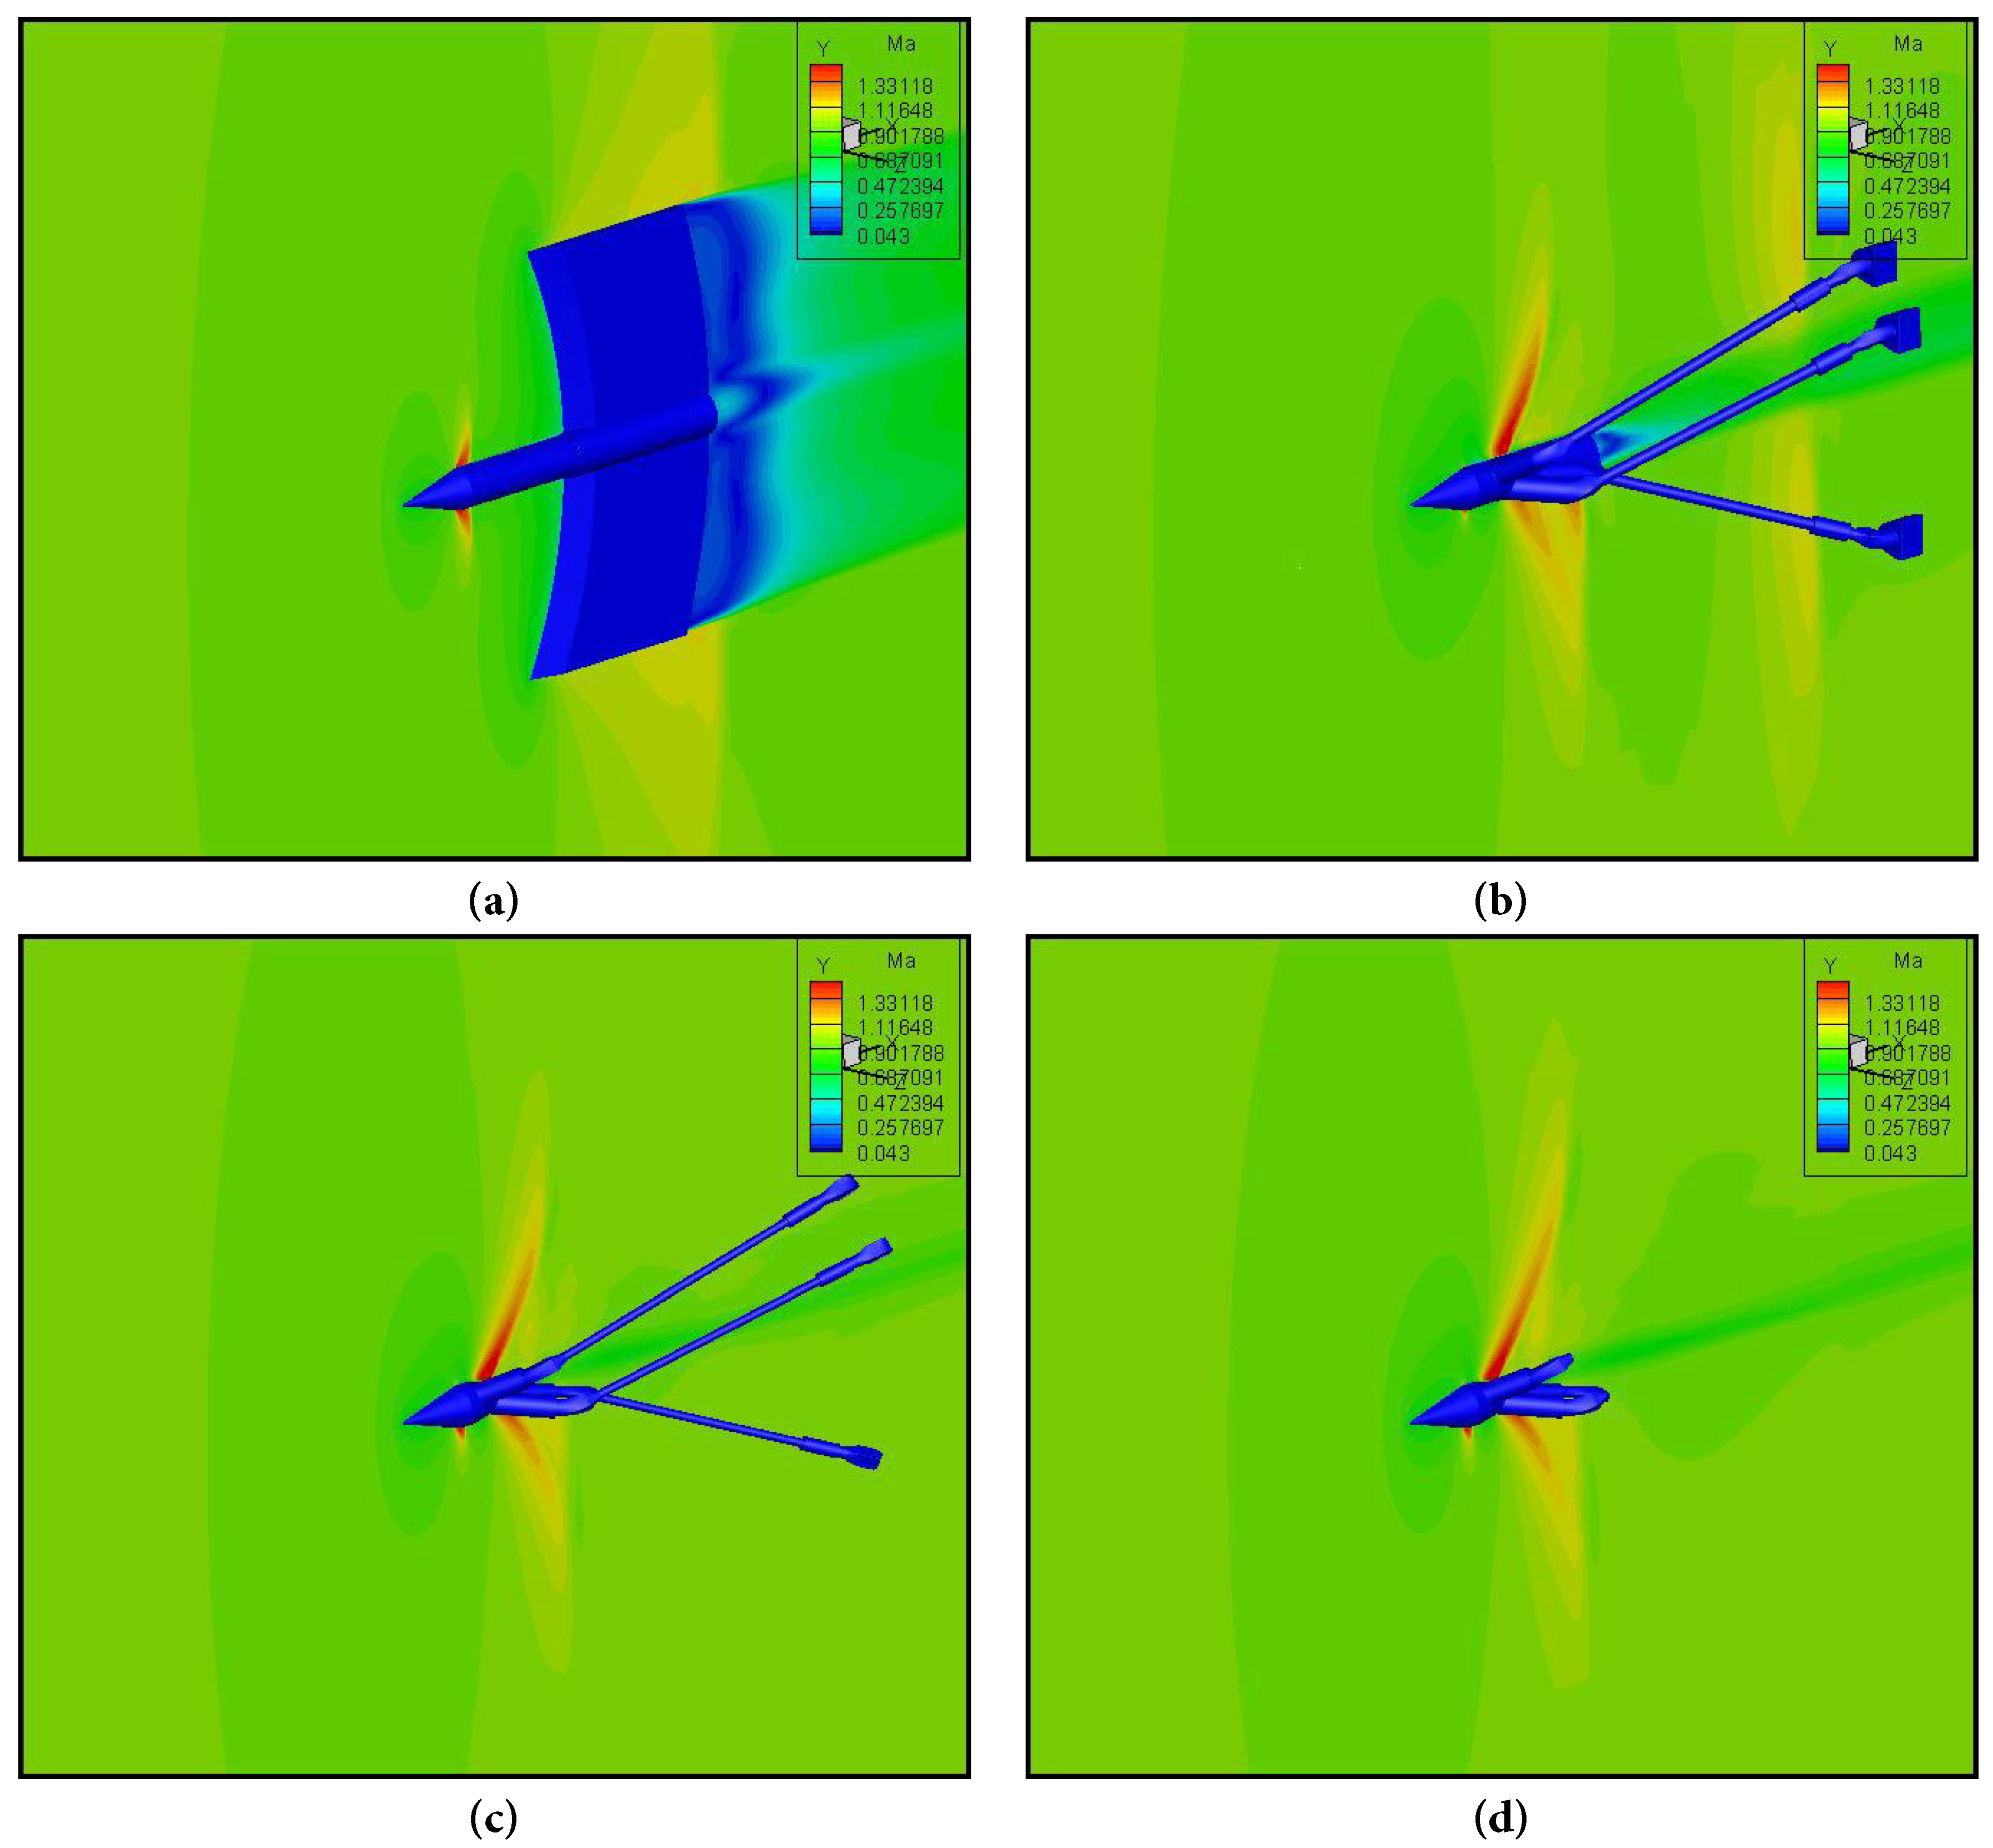
Figure 16: Velocity distribution around the supports (Ma = 0.95): (a) The static experimental support; (b) The initial model of dynamic 6-DOF support; (c) The optimized support; (d) The optimized support without any tail support rod.
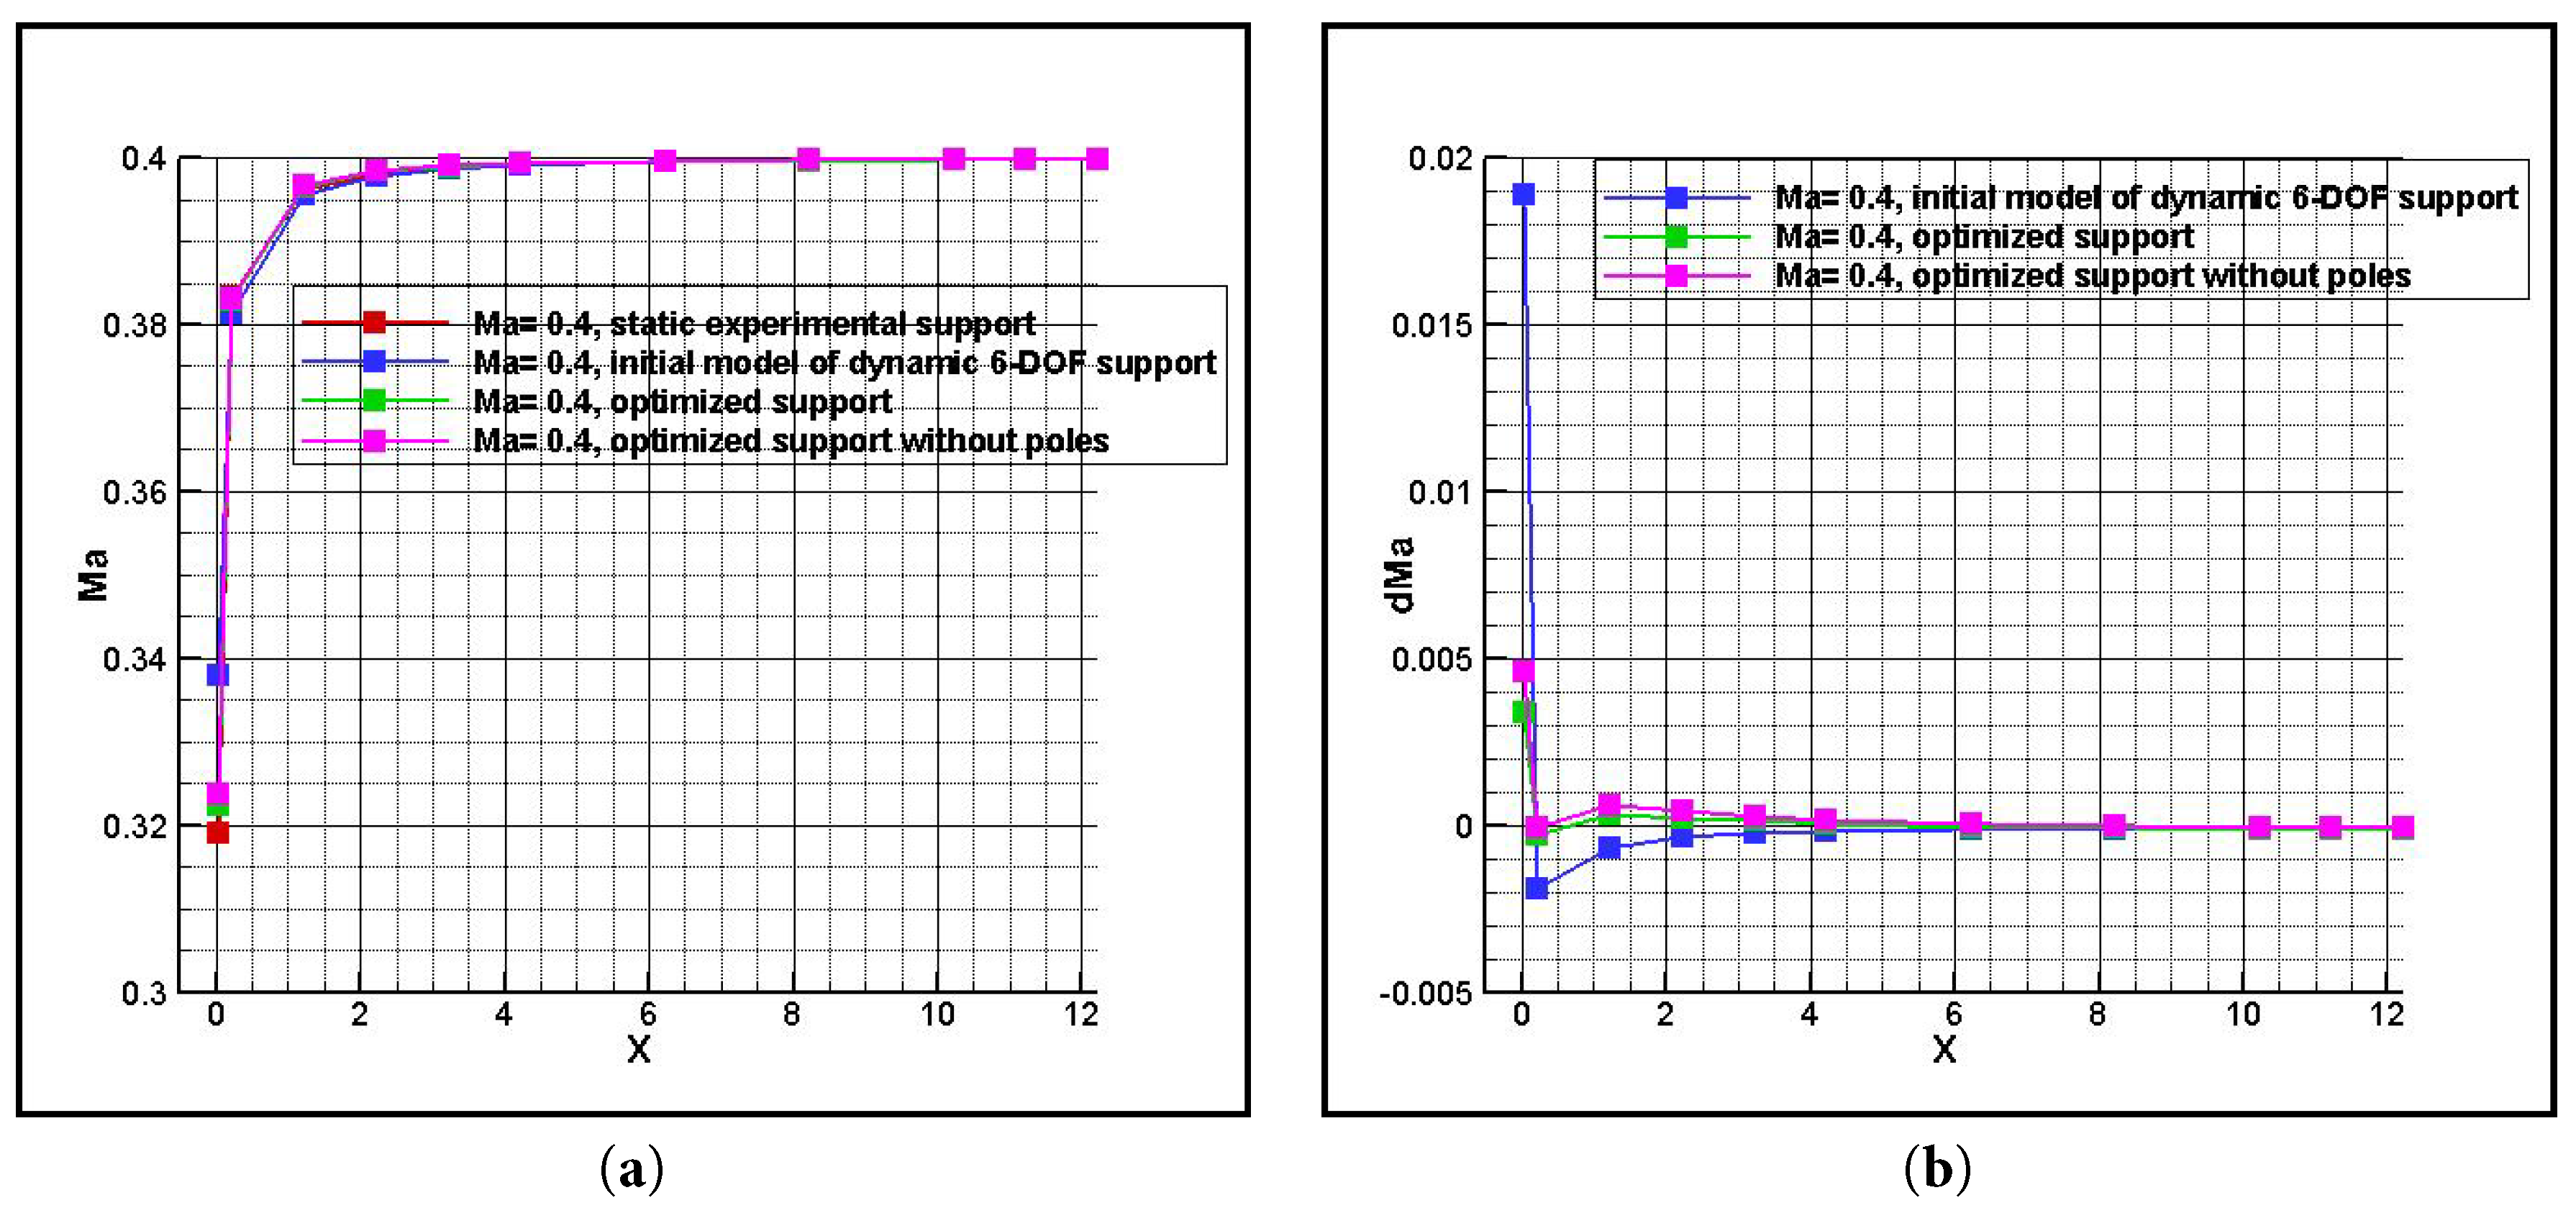
Figure 17: Velocity distribution along the axis line in front of the supports (Ma = 0.4): (a) Mach number distribution; (b) Relative Mach number impact quantities distribution.
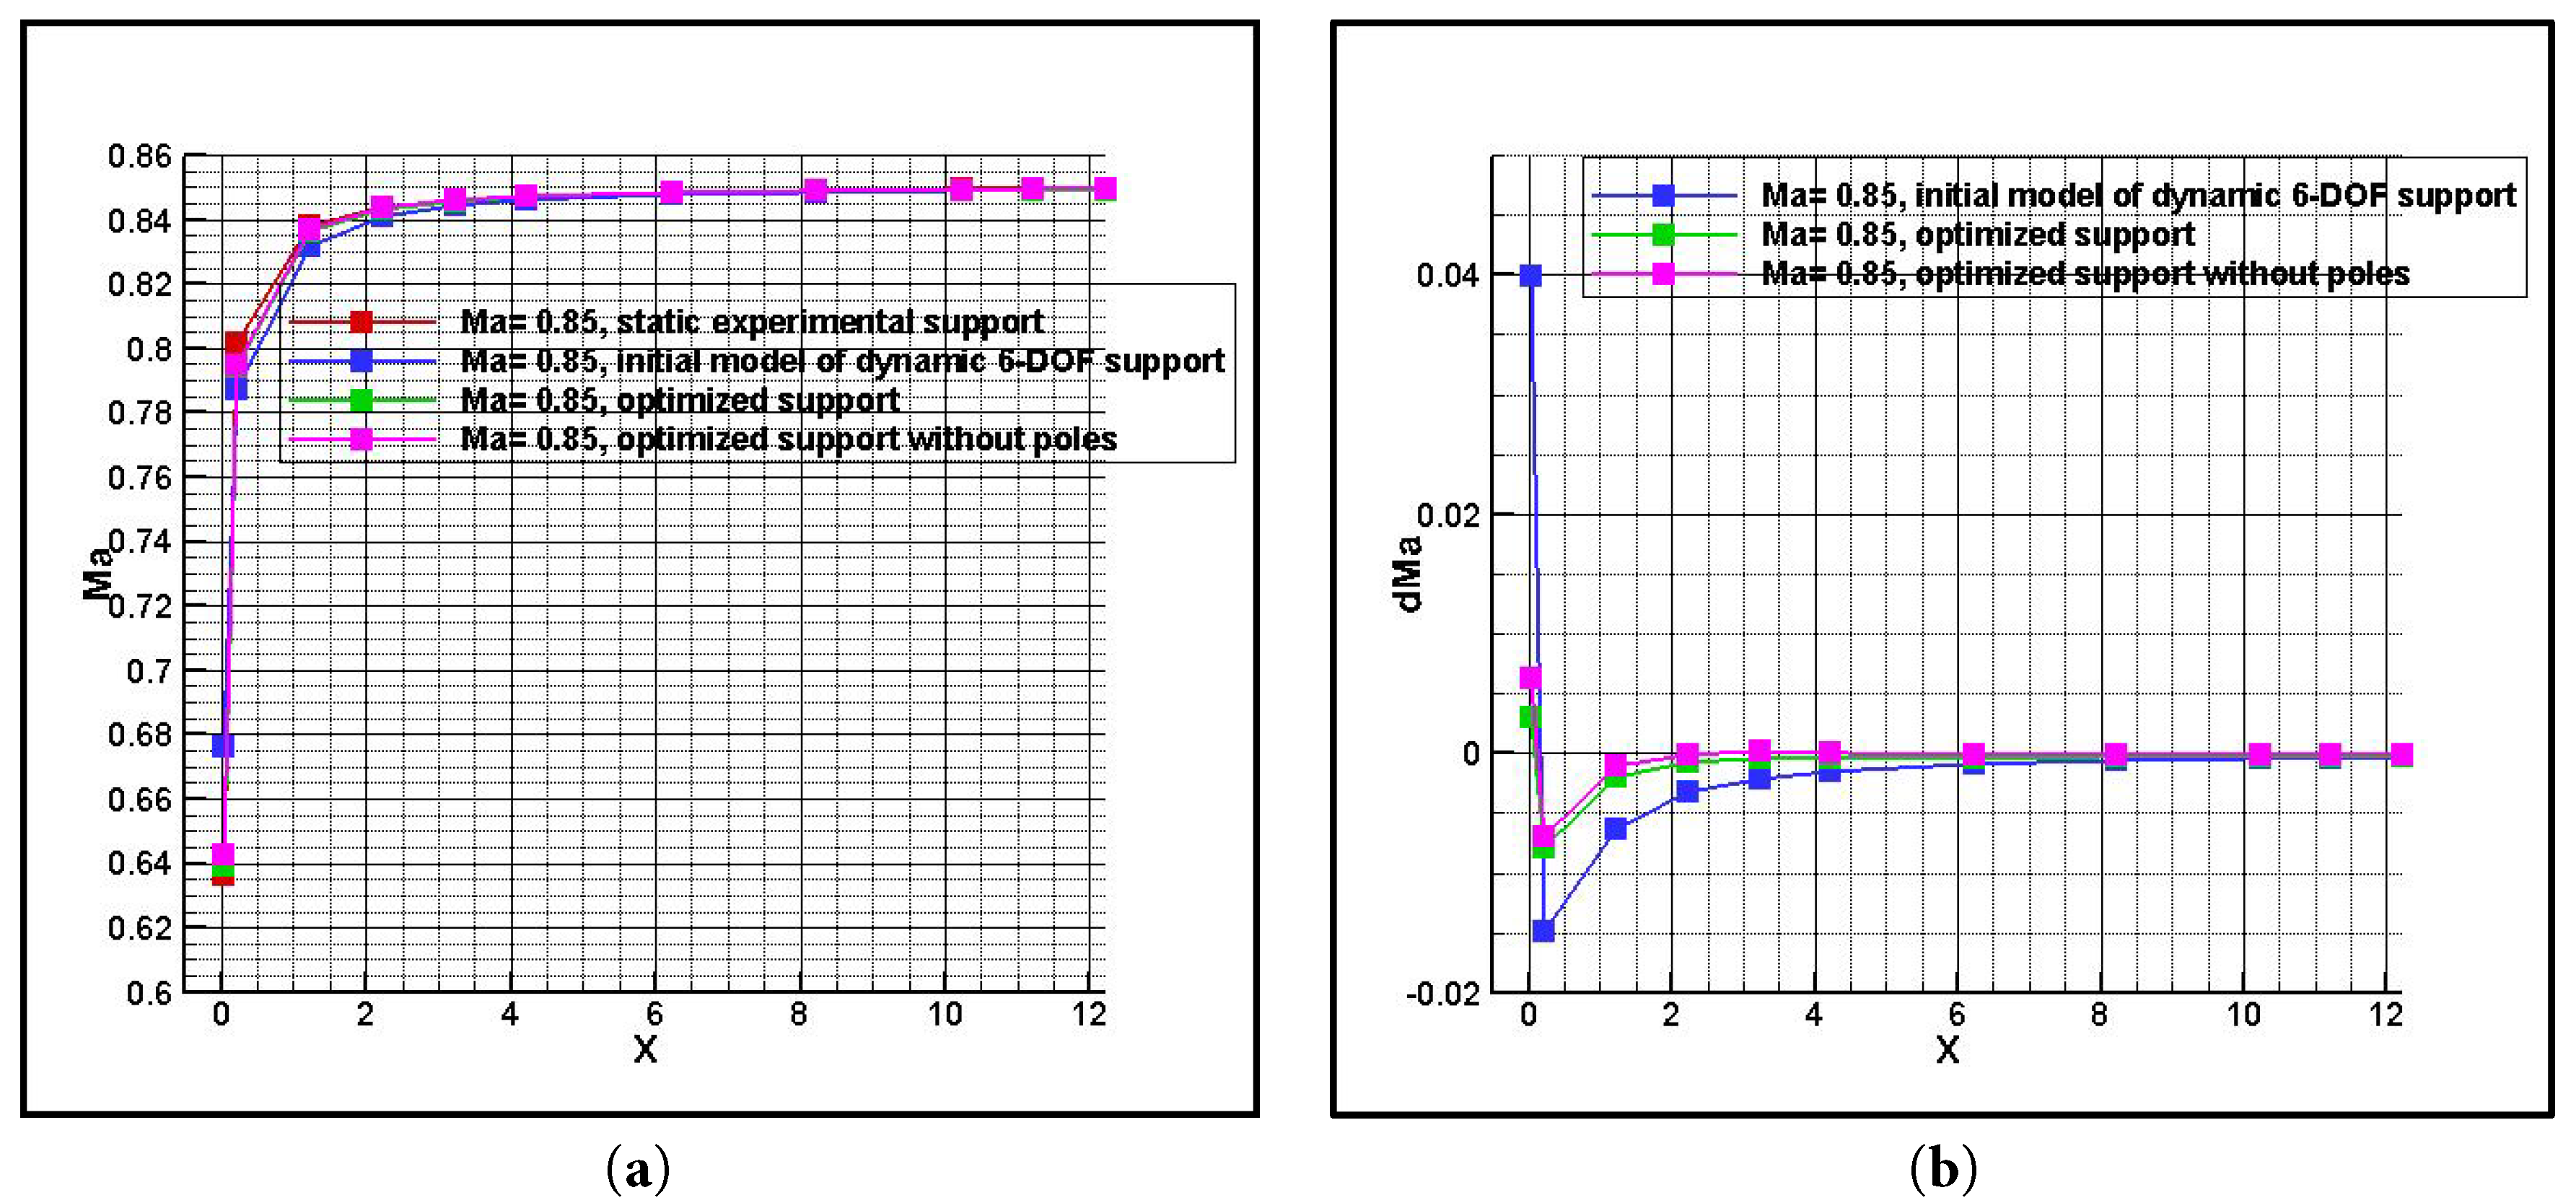
Figure 18: Velocity distribution along the axis line in front of the supports (Ma = 0.85): (a) Mach number distribution; (b) Relative Mach number impact quantities distribution.
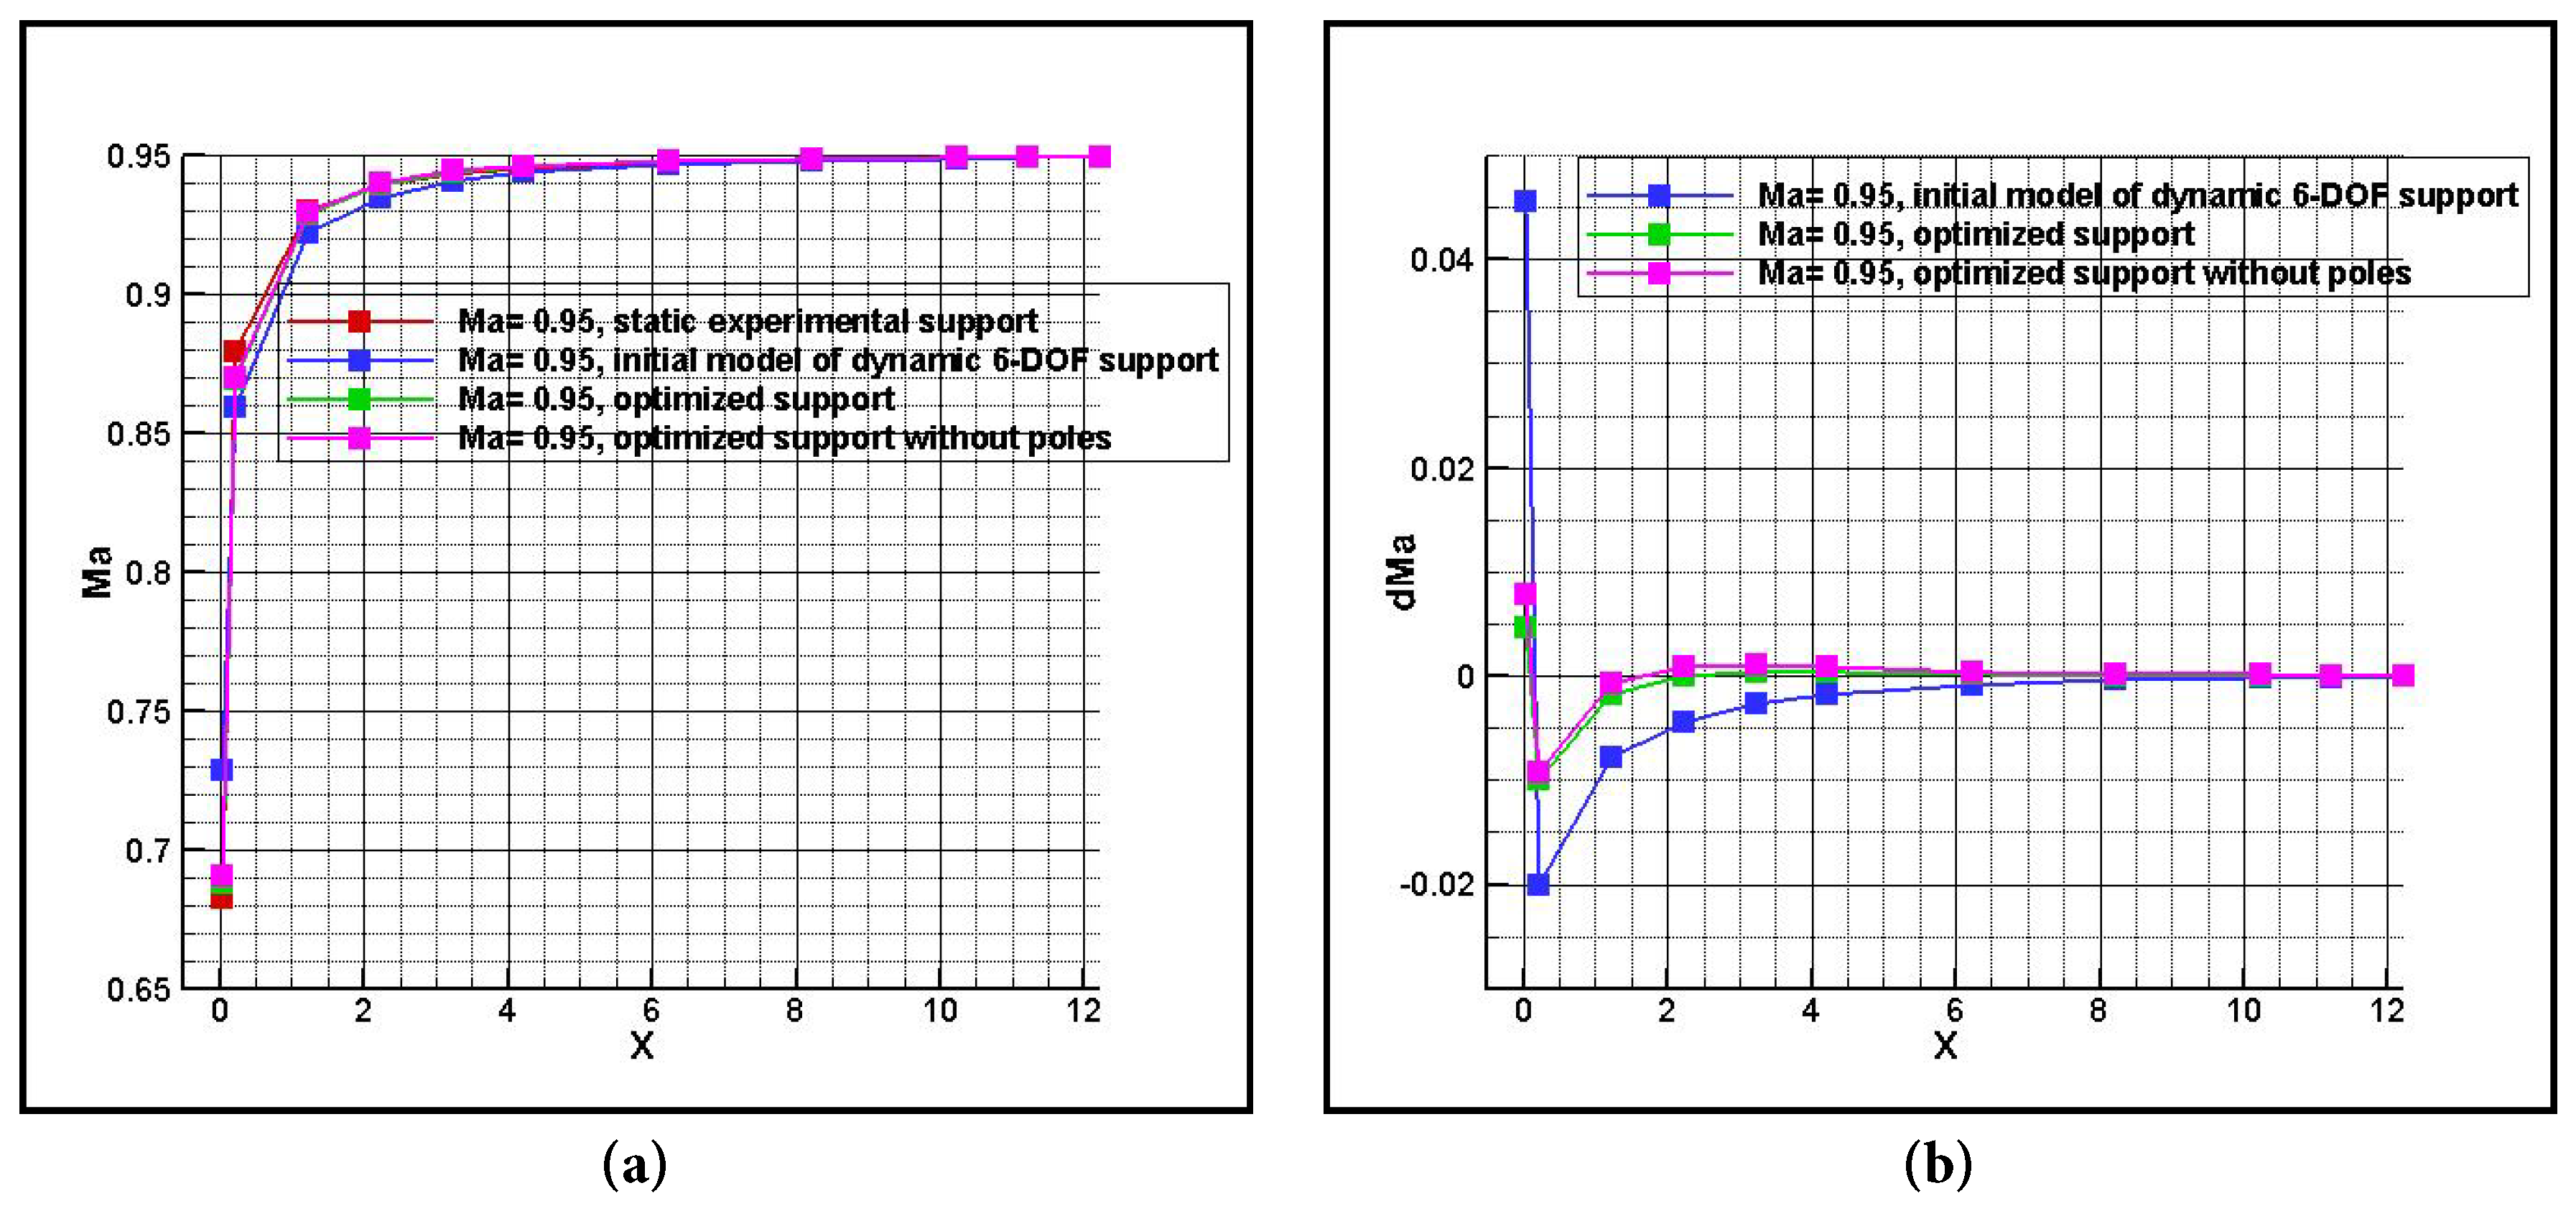
Figure 19: Velocity distribution along the axis line in front of the supports (Ma = 0.95): (a) Mach number distribution; (b) Relative Mach number impact quantities distribution.
4.3 Surface Shear Stress Lines on the Supports
To investigate the viscosity effect of the supports, the surface shear stress lines on the 4 support configurations are depicted from Mach number 0.4 to 0.95. They are shown from Fig. 20, Fig. 21 and Fig. 22.
Of surface shear stress lines on the 4 support configurations, the surface shear stress lines on the surfaces of the support configurations appear to be parallel to the direction of the flow in most cases. While, the surface shear stress lines on the supports are curved in certain local regions, the spiral points and separated lines occur. The phenomena are illustrated from Fig. 23 and Fig. 24.
Furthermore, with the connecting bases of the support rods on the sting moving forward to the nose, the skin friction become distinctly smaller on the nose. Then, the surface shear stress lines stretch out from the spiral points or separated lines on the surfaces of the supports. It is corresponding to the phenomenon that the flow separates from the spiral points or separated lines as shown from Fig. 23 and Fig. 24. This type of separation often occurs at the regions where the surface shear stress lines gather together. It is caused by the viscous effect and the supports shocks.
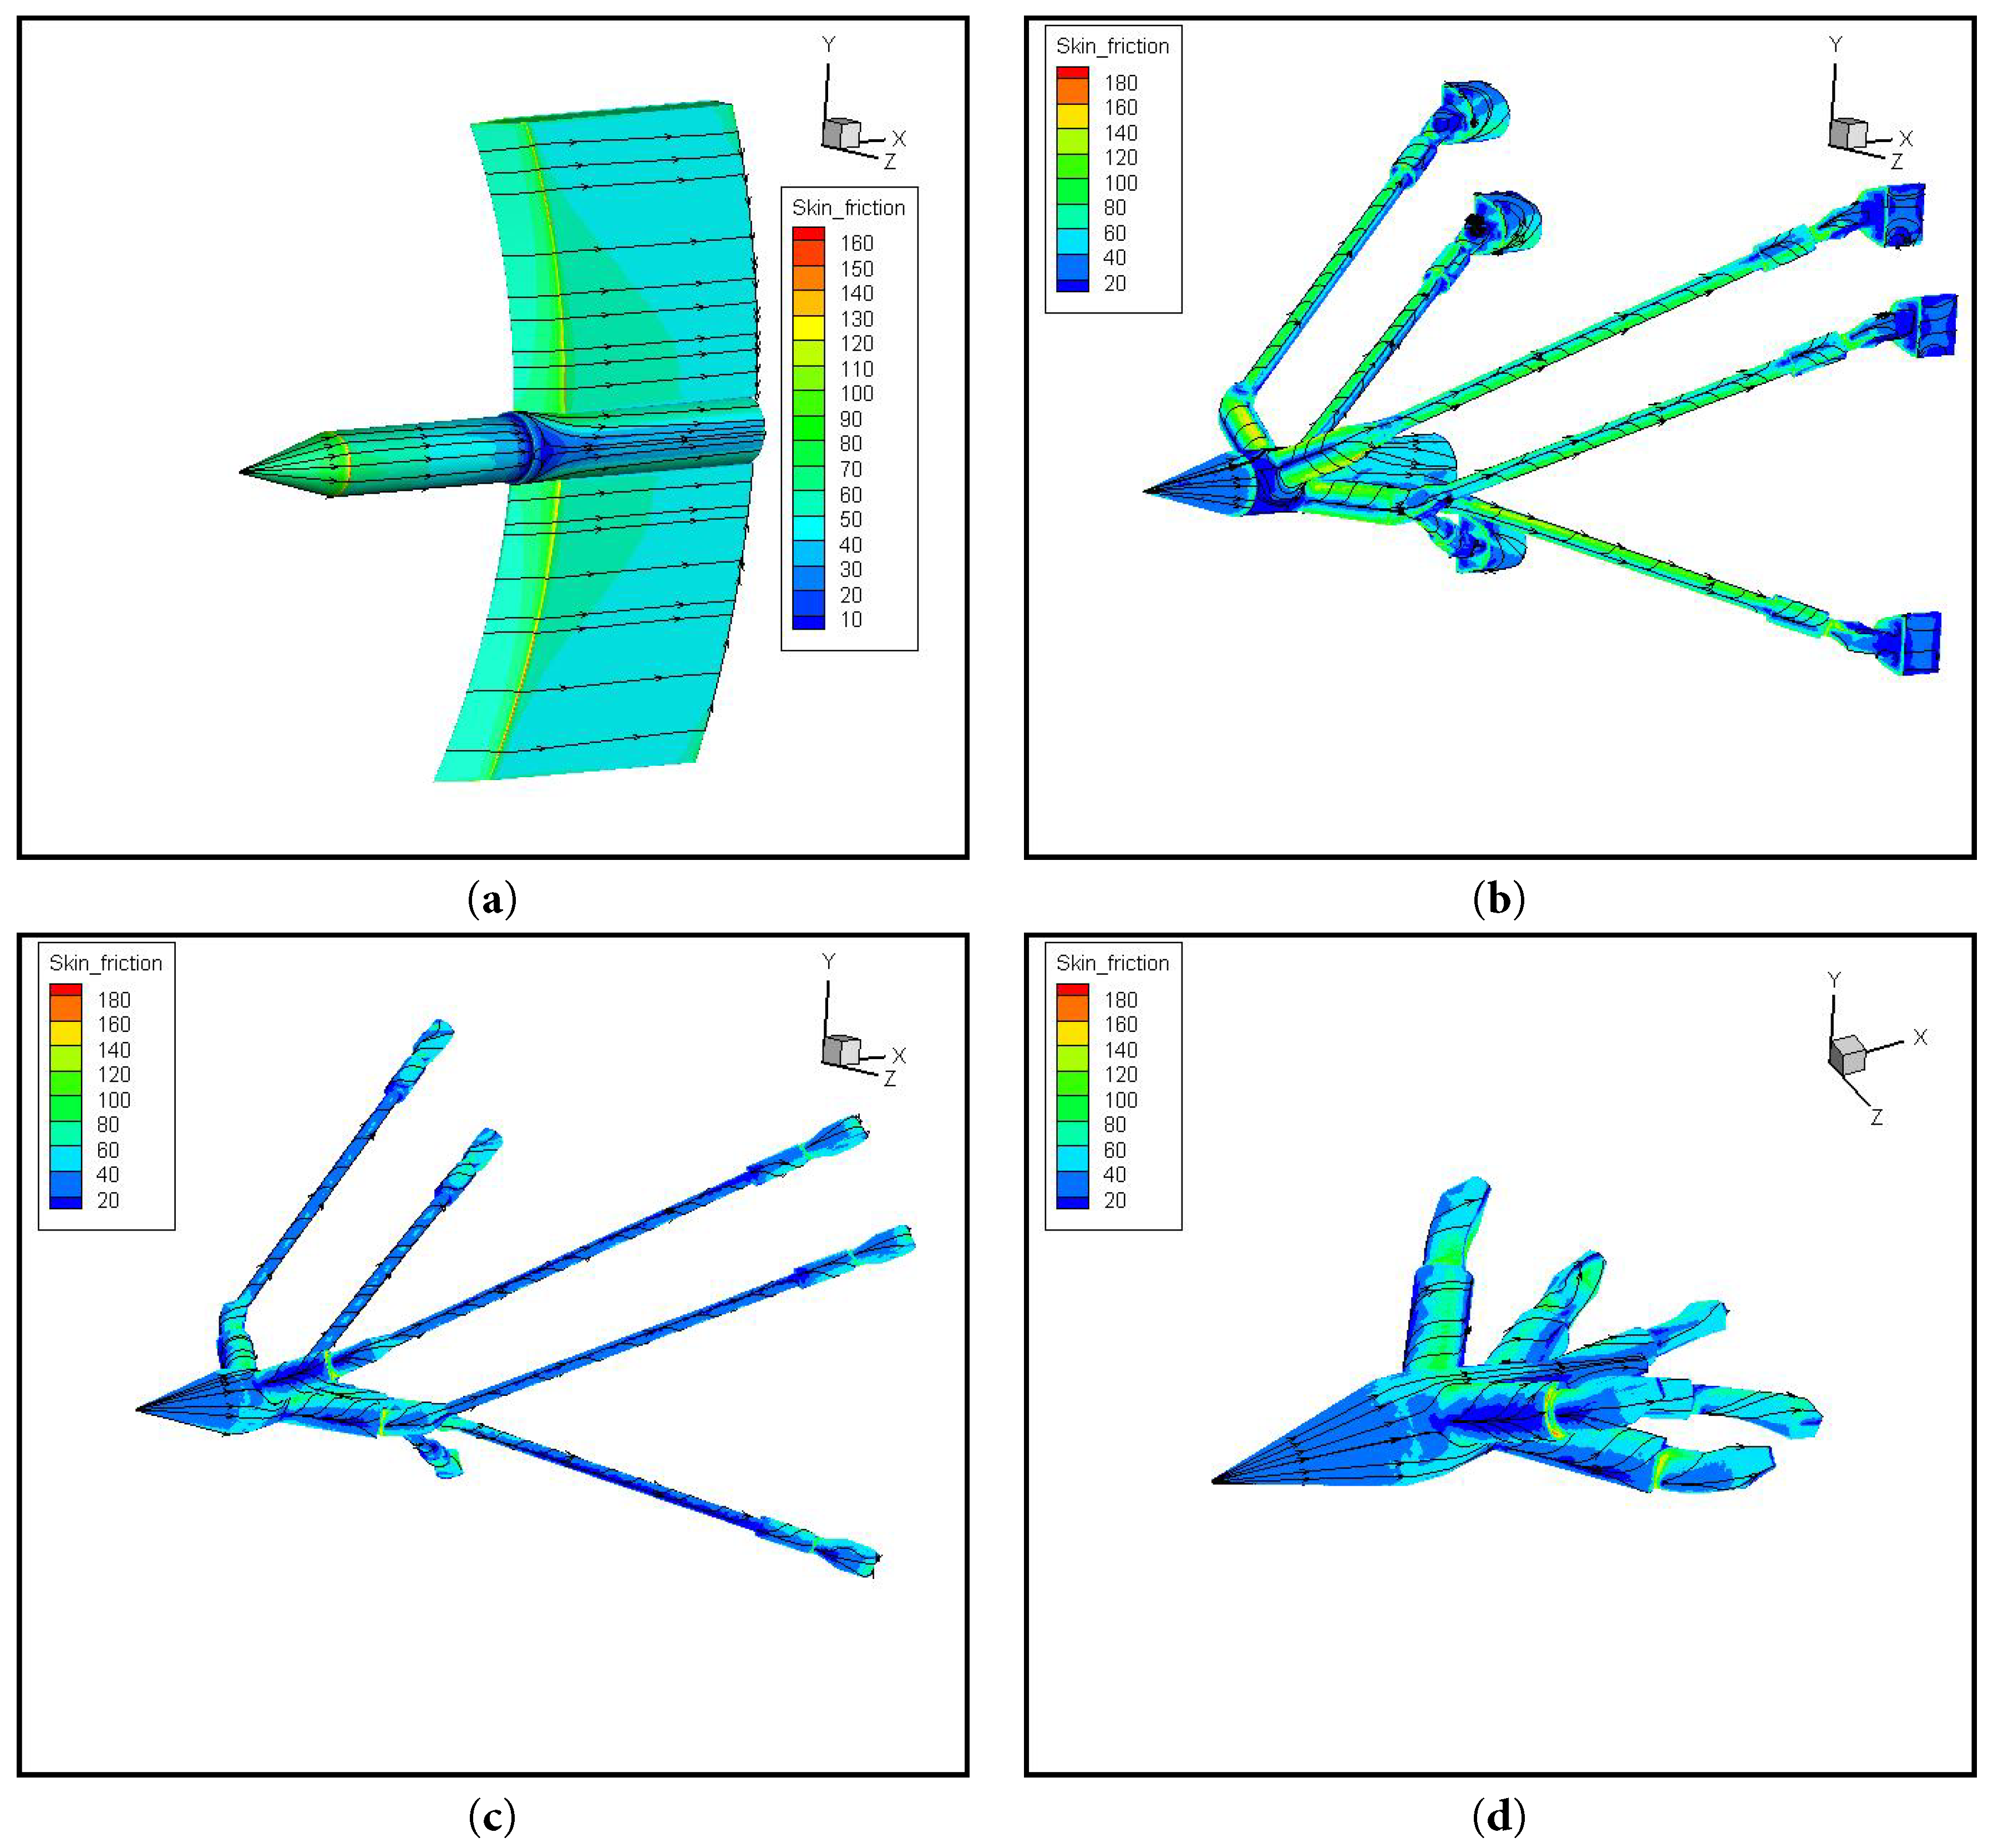
Figure 20: Surface shear stress lines of the models (Ma = 0.4): (a) The static experimental support; (b) The initial model of dynamic 6-DOF support; (c) The optimized support; (d) The optimized support without any tail support rod.
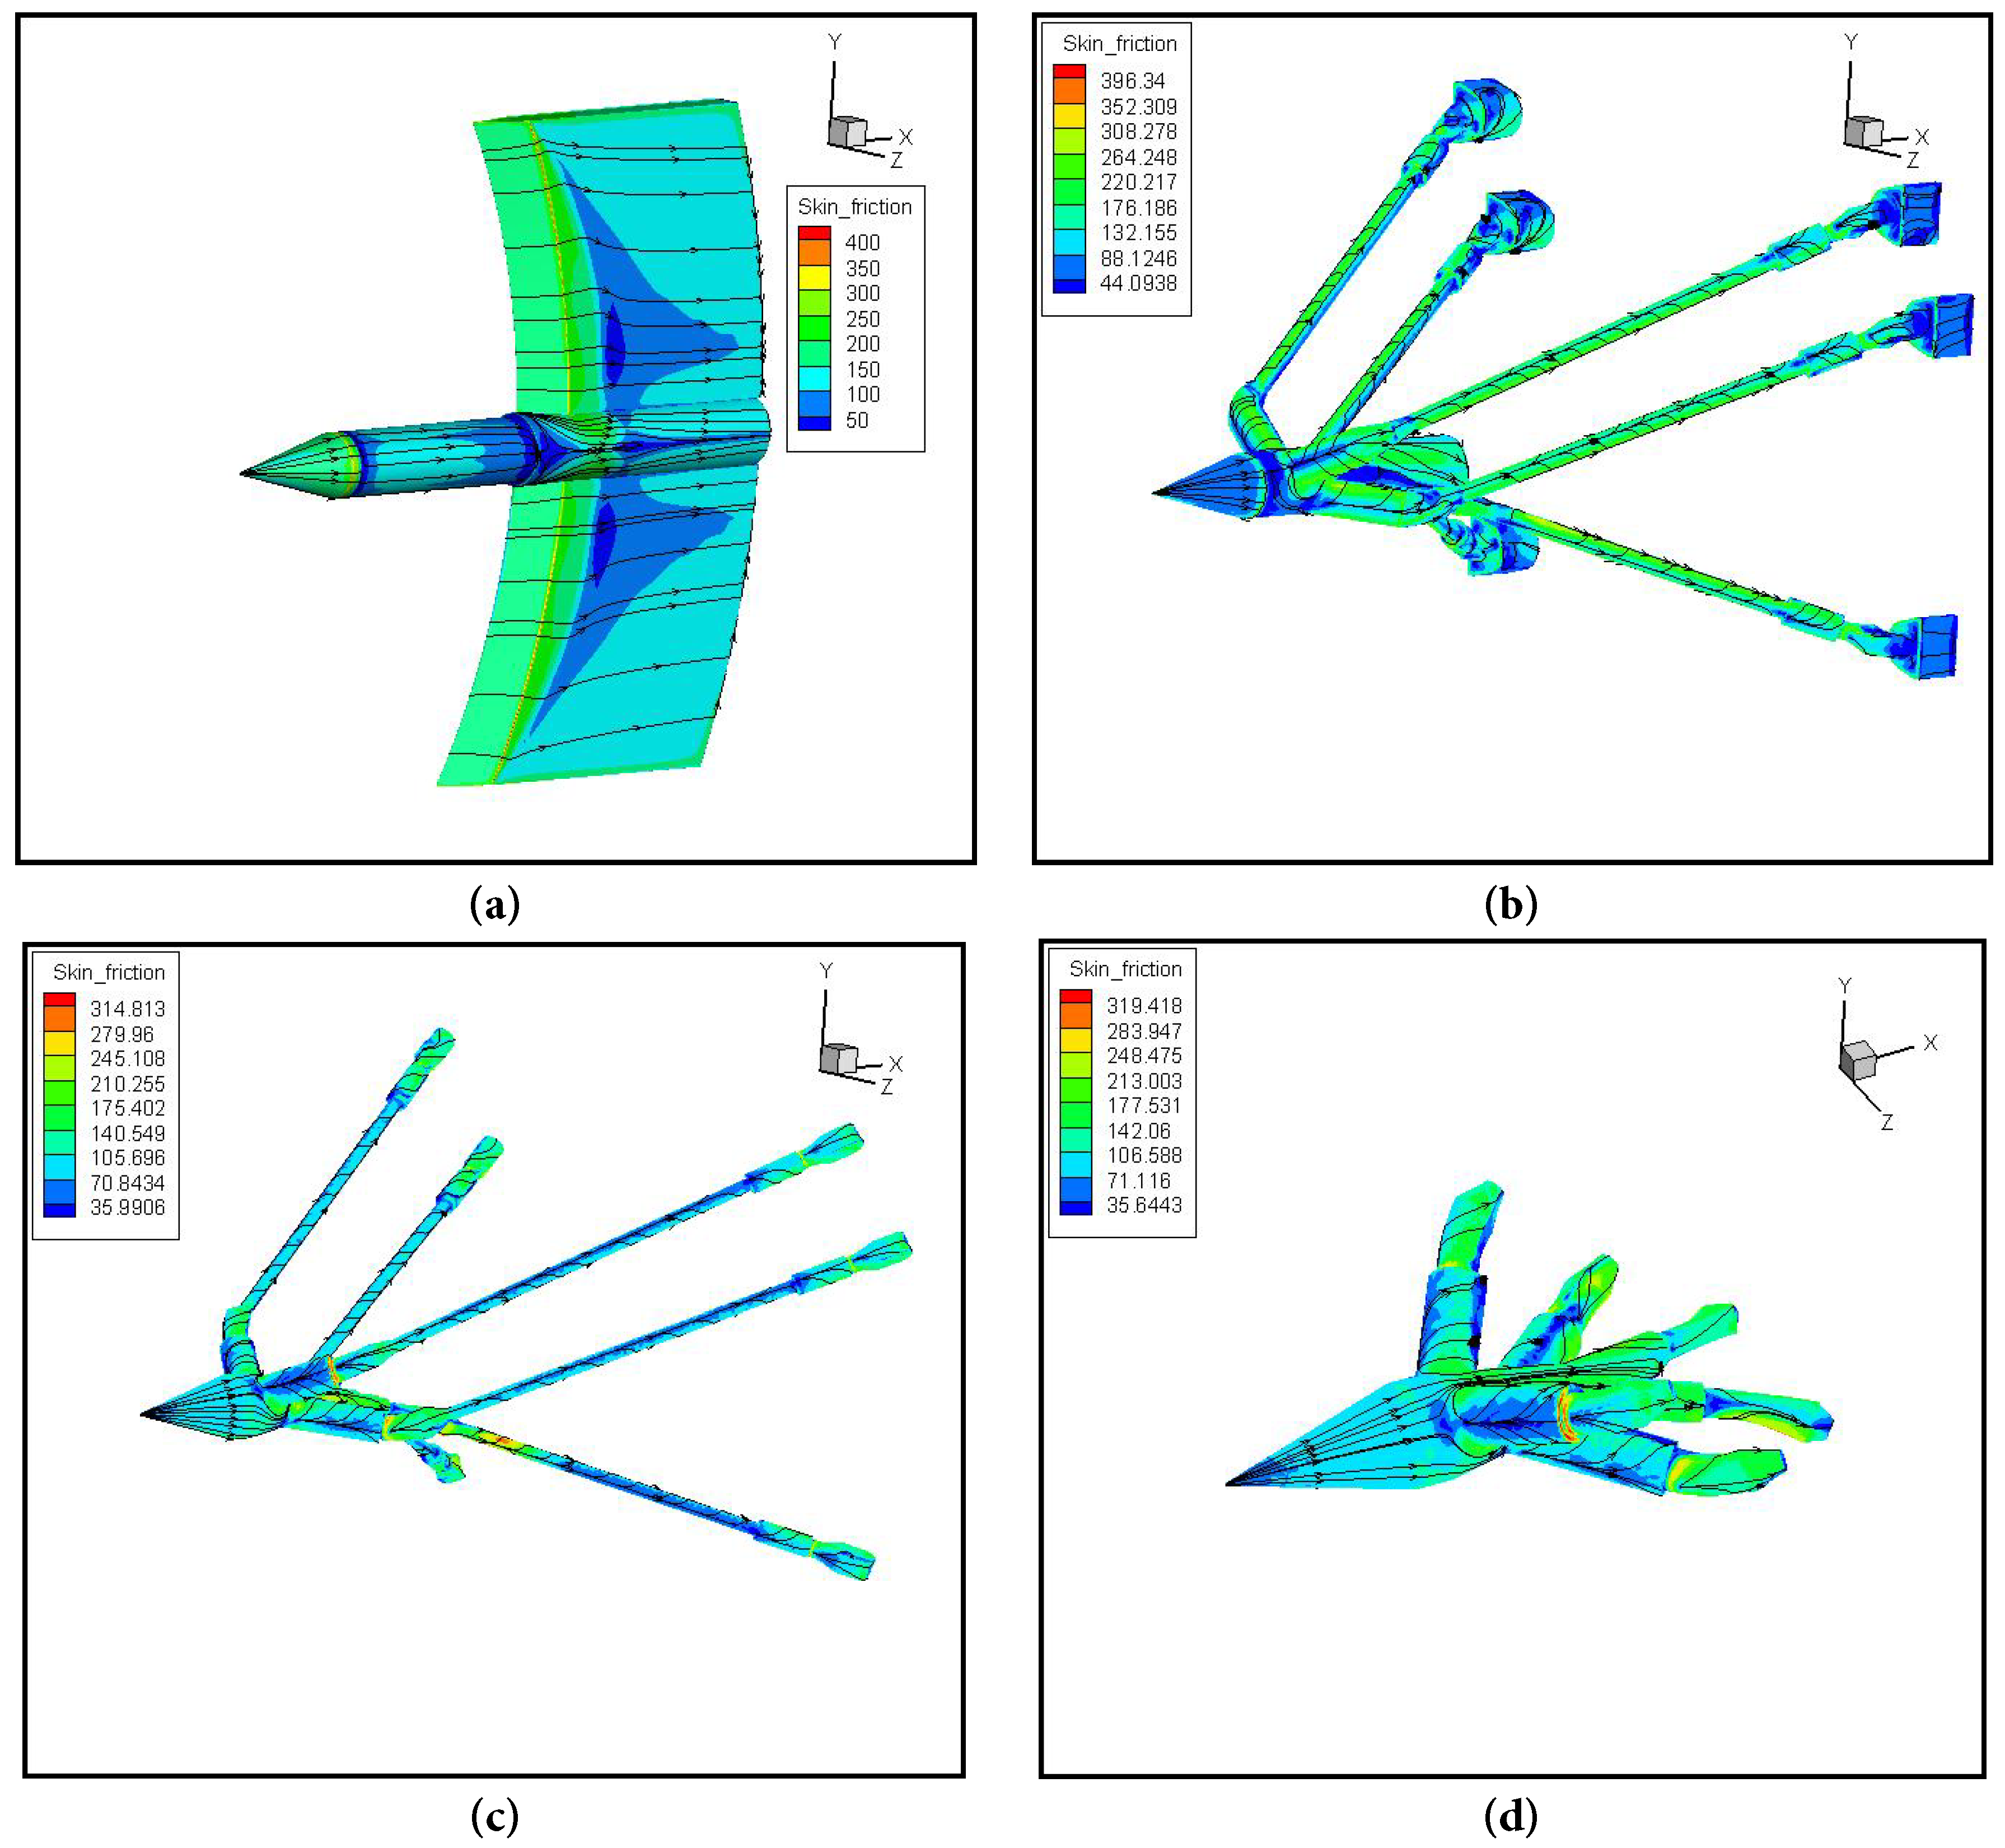
Figure 21: Surface shear stress lines of the models (Ma = 0.85): (a) The static experimental support; (b) The initial model of dynamic 6-DOF support; (c) The optimized support; (d) The optimized support without any tail support rod.
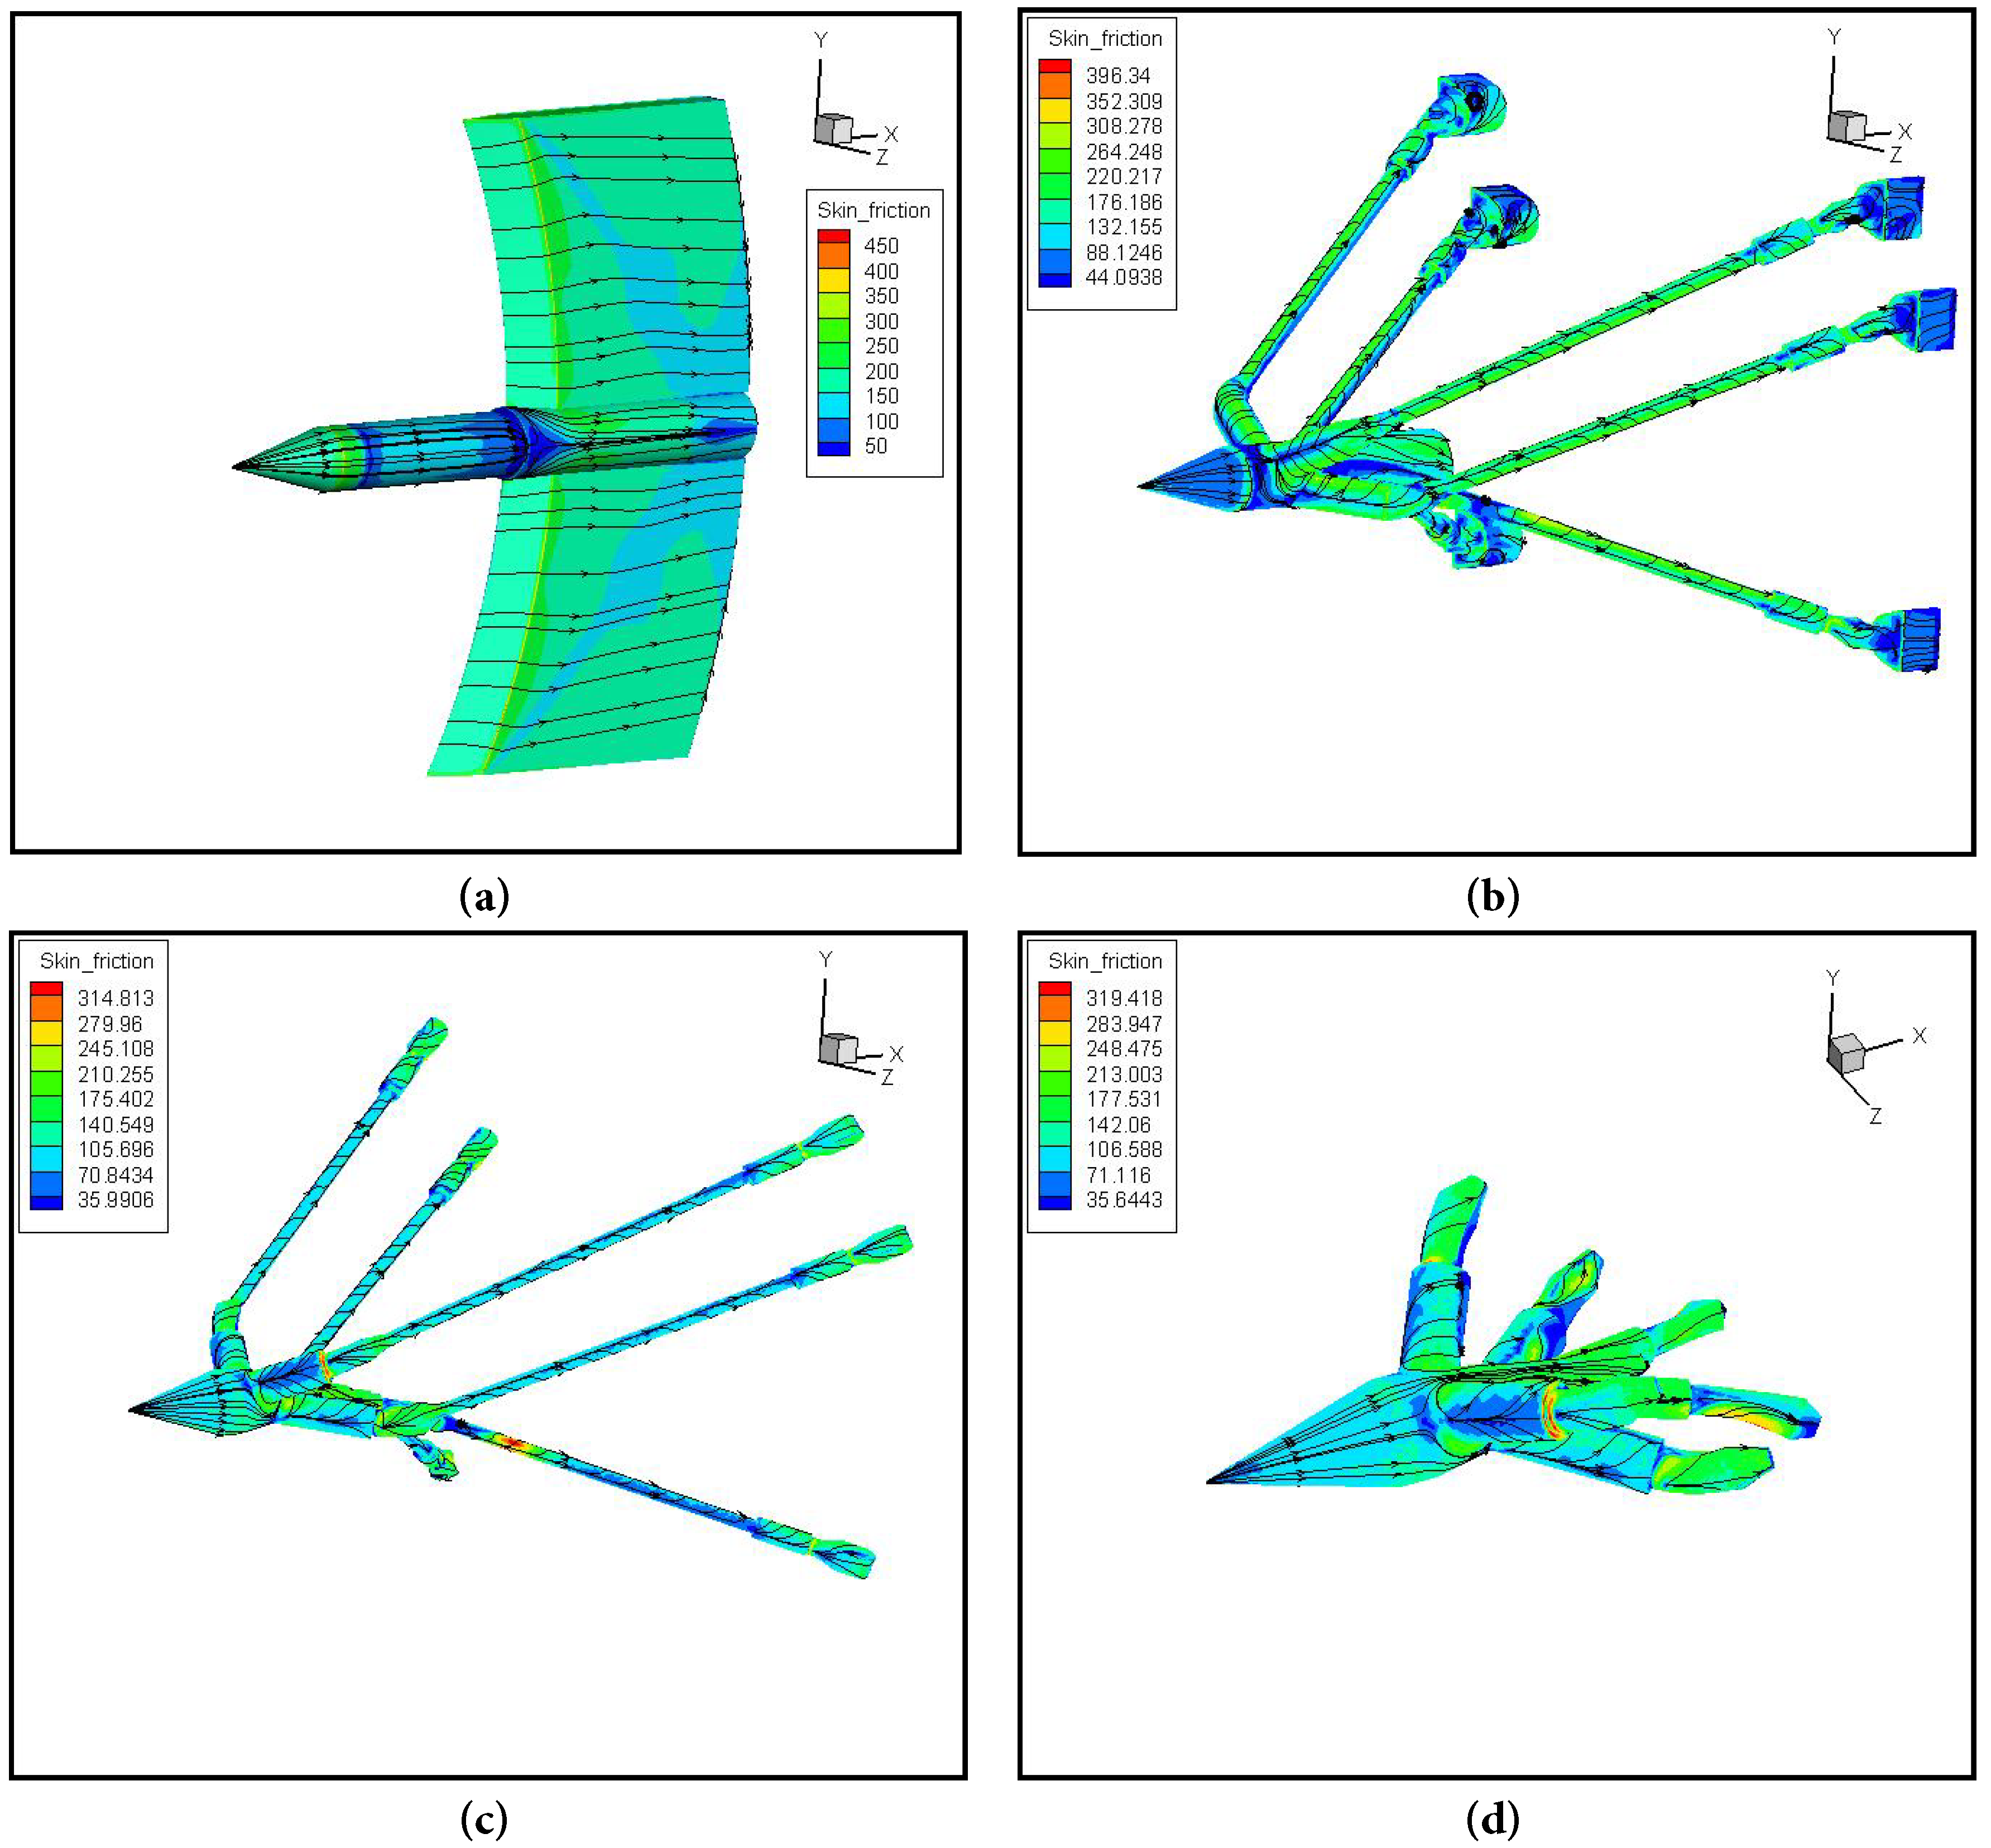
Figure 22: Surface shear stress lines of the models (Ma = 0.95): (a) The static experimental support; (b) The initial model of dynamic 6-DOF support; (c) The optimized support; (d) The optimized support without any tail support rod.
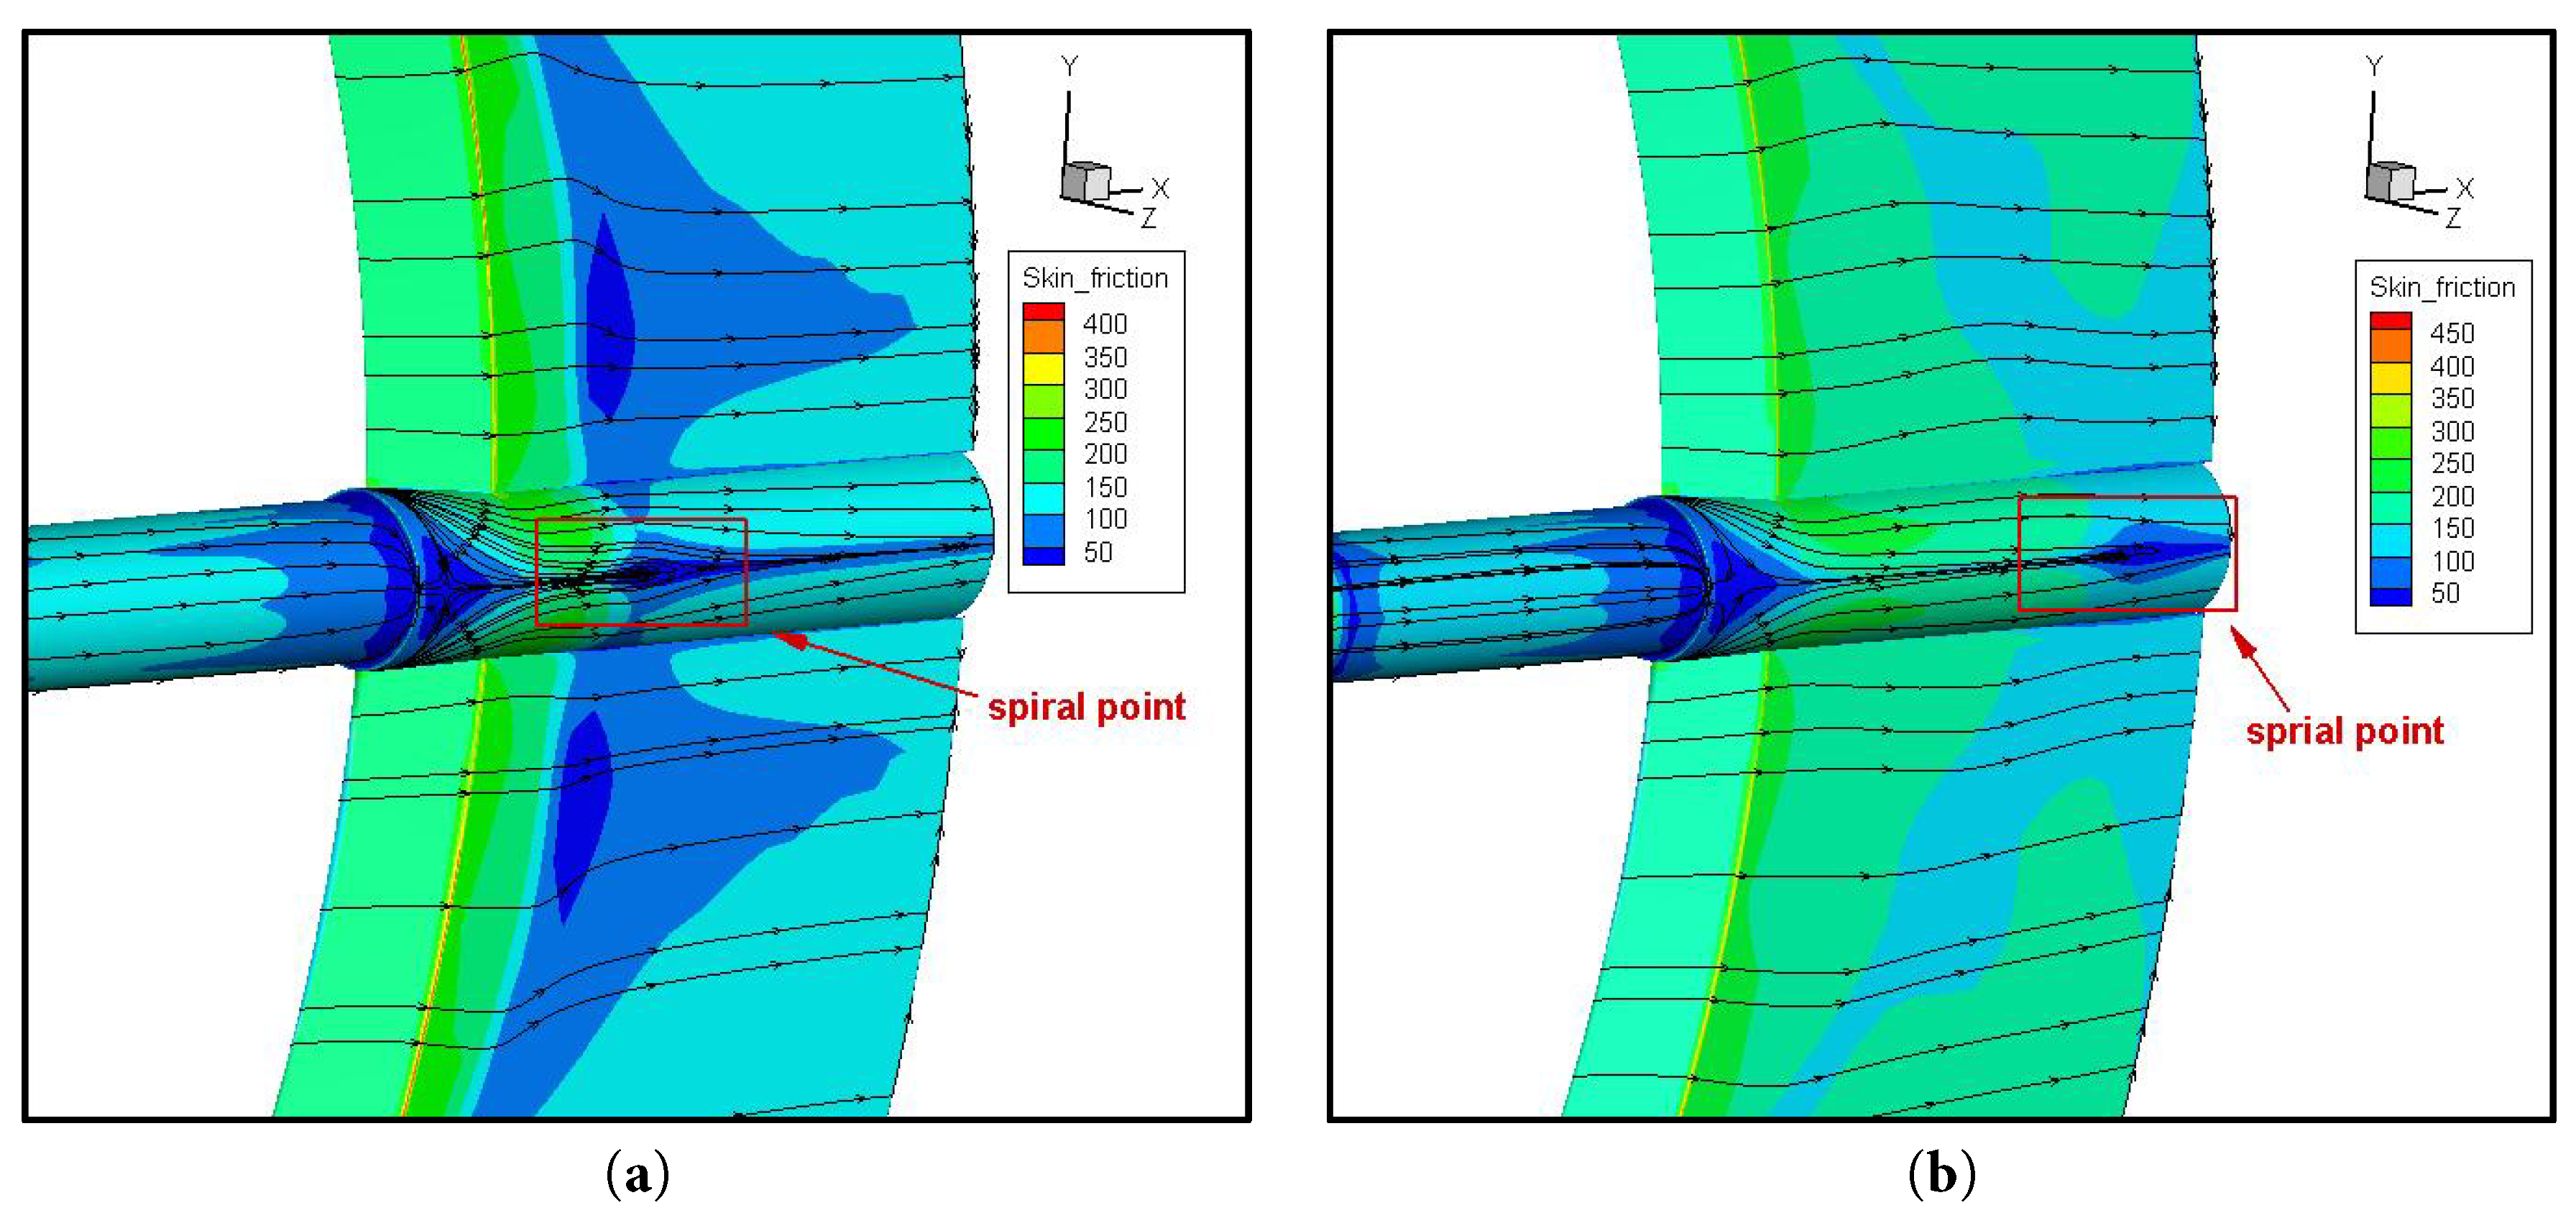
Figure 23: Spiral points on the static experimental support: (a) Ma = 0.85; (b) Ma = 0.95.
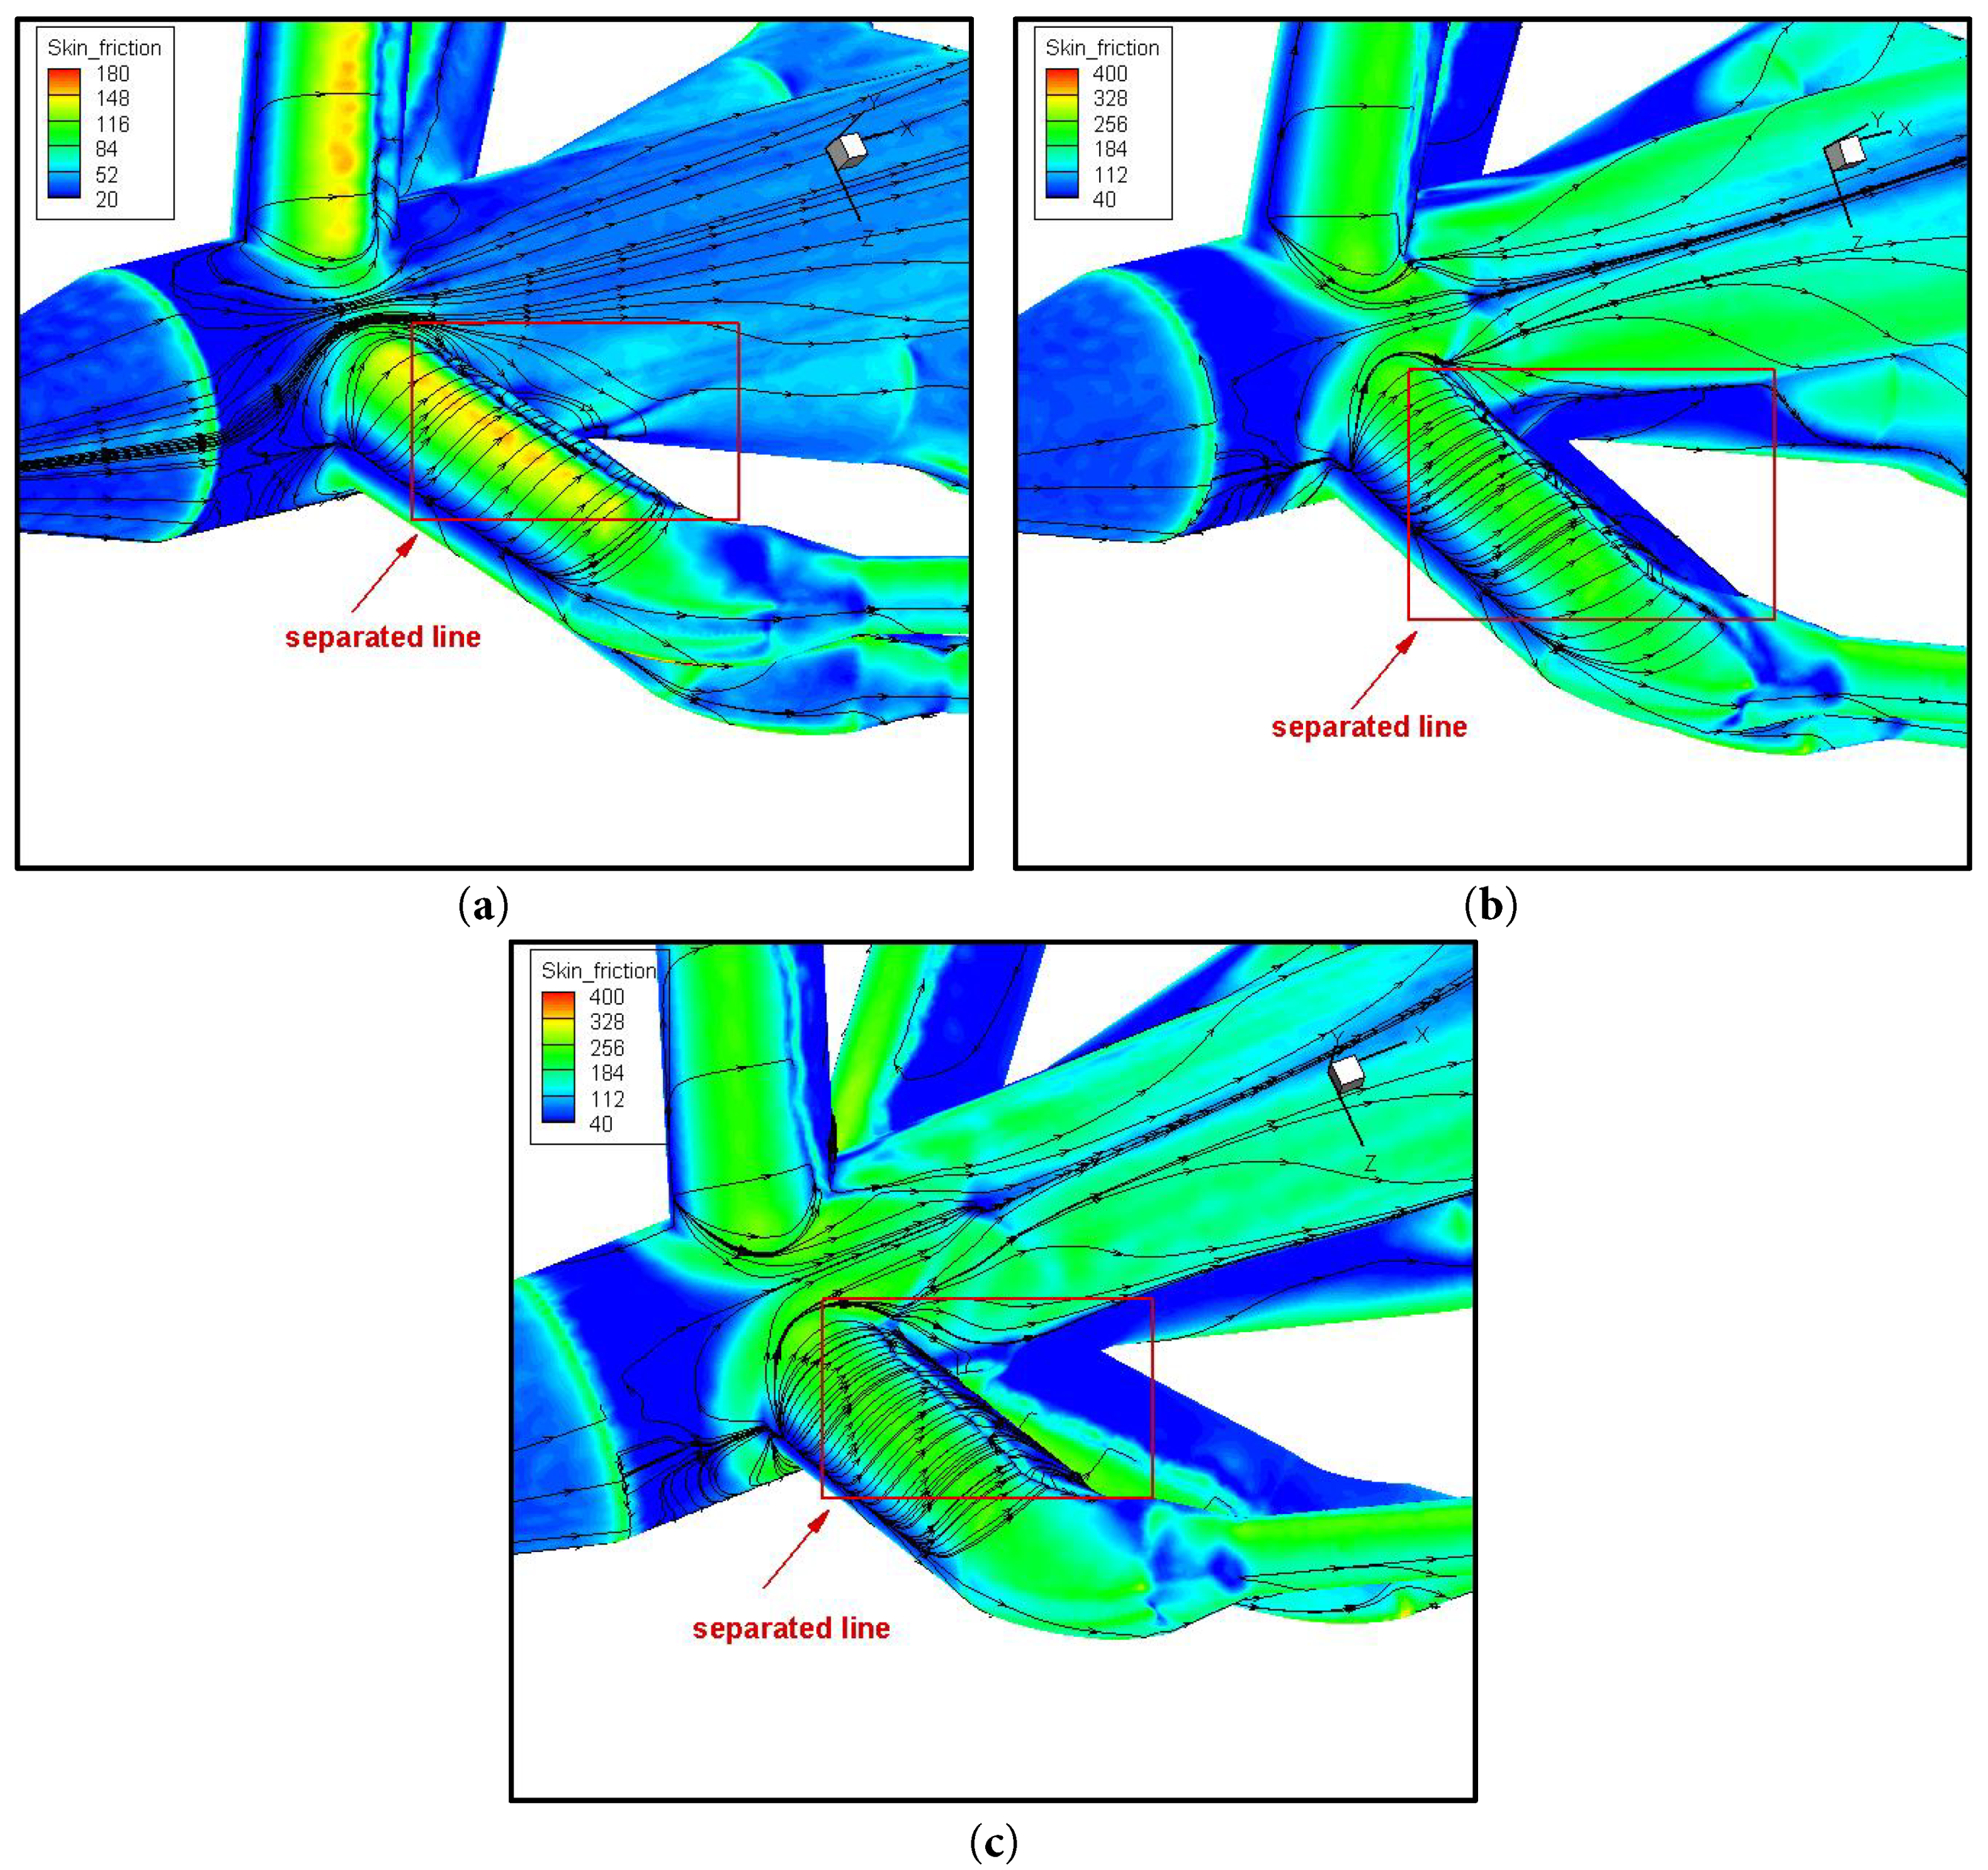
Figure 24: Separated lines on the static experimental support: (a) Ma = 0.4; (b) Ma = 0.85; (c) Ma = 0.95.
4.4 The Remark of the Supports
From Mach number 0.4 to 0.95, the influences of 4 different support configurations on the flow field are numerically investigated. The results indicate that the optimized 6-DOF support significantly reduces disturbances in both pressure and velocity fields, with the improvement becoming more pronounced as the Mach number increases. Within a 3 m range upstream of the sting nose, the relative impacts on the pressure and velocity distribution are improved by more than 50%. The sting, the connecting bases of the support rods on the sting and the anchor feet mainly cause the impacts on the upstream flowfields. In contrast, the impacts of the tail support poles are found to be negligible. Overall, it is indicated that, the extent of upstream flow disturbance is governed primarily by the separation region and associated momentum loss induced by the support sting, the connecting bases and the anchor feet. Flow separation originates from spiral points or separation lines on the support surface, which is caused by viscous effects combined with shock waves generated by the support system.
The influence of 4 different support configurations on the flow field is investigated numerically by analyzing velocity and pressure distributions in subsonic-transonic flow in this study. Then it comes to the conclusion as follows:
- (1)The optimized six degree of freedom support significantly reduces disturbances in both pressure and velocity fields, with the improvement becoming more pronounced as the Mach number increases.
- (2) The impacts on the upstream flow are mainly caused by the sting, the connecting bases between the tail support rods and the sting, and the anchor feet mainly. So the main optimization measures include the addition of a tail fairing, reduction of the thickness of the connecting bases between the support rods and the sting, and downsizing of the anchor feet. In contrast, the effect of the support poles is found to be negligible.
- (3) Overall, the extent of upstream flow disturbance is governed primarily by the separation region and associated momentum loss induced by the support sting, the connecting bases and the anchor feet. Flow separation starts from spiral points or separation lines on the model surface, caused by viscous effects combined with shock waves induced by the support system.
However, there are still some limitations in this study. In the future, more support configurations would be investigated. Further study is still required whether the conclusion could be extended to the other type of support configurations and a larger scope at the higher angle of attack and sideslip angle.
Acknowledgement:
Funding Statement: This study is supported by the Guiding Project of Scientific Research Plan of Hubei Education Department of China [Grant No. B2020227].
Author Contributions: The authors confirm contribution to the paper as follows: study conception and design: Yong Wu, Zhen Fang; data collection: Bing Wang; analysis and interpretation of results: Yong Wu, Zhen Fang, Bing Wang; draft manuscript preparation: Yong Wu, Zhen Fang, Bing Wang. All authors reviewed and approved the final version of the manuscript.
Availability of Data and Materials: Readers can access the data by CFD method introduced in the study.
Ethics Approval: Not applicable.
Conflicts of Interest: The authors declare no conflicts of interest.
Nomenclature
| u | Flow velocity |
| ρ | Density of fluid |
| μ | Dynamic viscosity |
| Mean velocity of the flow | |
| Fluctuating velocity of the flow | |
| Ma | Mach number |
| P | Static pressure |
| Pss | Static pressure in the field of the static experiment support |
| dP_rate | (P − Pss)/Pss, relative pressure impact quantities |
References
1. Mabey DG . Some remarks on the design of transonic tunnels with low levels of flow unsteadiness. Washington, DC, USA: NASA; 1976. [Google Scholar]
2. Barnwell R , Edwards C , Kilgore R , Dress D . Optimum transonic wind tunnel. In: Proceedings of the 14th Aerodynamic Testing Conference; 1986 Mar 5–7; West Palm Beach, FL, USA. doi:10.2514/6.1986-755. [Google Scholar] [CrossRef]
3. Eckert D . Correction of support influences on measurements with sting mounted wind tunnel models. In: Proceedings of the AGARD Meeting on Wall Interference, Support Interference and Flow Field Measurements; 1993 Oct 4–7; Brussels, Belgium. [Google Scholar]
4. Lowenberg M , Kyle H . Development of a pendulum support rig dynamic wind tunnel apparatus. In: Proceedings of the AIAA Atmospheric Flight Mechanics Conference and Exhibit; 2002 Aug 5–8; Monterey, CA, USA. doi:10.2514/6.2002-4879. [Google Scholar] [CrossRef]
5. Gatto A , Lowenberg MH . Evaluation of a three degree of freedom test rig for stability derivative estimation. J Aircr. 2006; 43( 6): 1747– 61. doi:10.2514/1.19821. [Google Scholar] [CrossRef]
6. Pattinson J , Lowenberg M , Goman M . A multi-degree-of-freedom rig for the wind tunnel determination of dynamic data. In: Proceedings of the AIAA Atmospheric Flight Mechanics Conference; 2009 Aug 10–13; Chicago, IL, USA. doi:10.2514/6.2009-5727. [Google Scholar] [CrossRef]
7. Gong Z , Araujo-Estrada S , Lowenberg MH , Neild SA , Goman MG . Experimental investigation of aerodynamic hysteresis using a five-degree-of-freedom wind-tunnel maneuver rig. J Aircr. 2019; 56( 3): 1029– 39. doi:10.2514/1.C034995. [Google Scholar] [CrossRef]
8. Mamou M , Broughton CA . Investigation of aerodynamic support interference for testing a semispan T tail aircraft model. J Aircr. 2023; 60( 3): 915– 34. doi:10.2514/1.C036818. [Google Scholar] [CrossRef]
9. Liu JT , Gong XQ , Zhou NC . Equipment interference and correction method in dynamic pressure field verification of low-speed wind tunnel. J Beijing Univ Aeronaut Astronaut. 2025; 51( 5): 1651–661. (In Chinese). [Google Scholar]
10. Fan LT , Duan XF , Xue W . Advances in test techniques based on multifunctional sting support system for 8 m × 6 m wind tunnel. Appl Mech Mater. 2013; 336–338: 880– 4. doi:10.4028/www.scientific.net/AMM.336-338.880. [Google Scholar] [CrossRef]
11. Chen JM , Wu SH , Liao DX . Experimental study for improving flow-field quality for 0.6 m continuous transonic wind tunnel. J Nanjing Univ Aeronaut Astronaut. 2021; 53( 2): 236–42. (In Chinese). [Google Scholar]
12. Liu L , Huang Z , Chen H . Experiment of far-field interference of cantilever support device in 8 m × 6 m low speed wind tunnel. Acta Aerodyn Sin. 2023; 41( 7): 102–11. (In Chinese). [Google Scholar]
13. Vav Muijden J . CFD support to wind tunnel experiments. In: Proceedings of the European Wind Tunnel Association 2nd Joint Workshop; 2006 Mar 20–24; Farnborough, UK. [Google Scholar]
14. Mouton S . Numerical investigations of model support interference in subsonic and transonic wind tunnels. In: Proceedings of the ODAS 2007-8th ONERA-DLR Aerospace Symposium; 2007 Oct 17; Göttingen, Germany. [Google Scholar]
15. Garcia JA , Melton J , Schuh MJ , James K , Long K , Vicroy DD , et al. NASA ERA integrated CFD for wind tunnel testing of hybrid wing-body configuration (invited). In: Proceedings of the 54th AIAA Aerospace Sciences Meeting; 2016 Jan 4–8; San Diego, CA, USA. doi:10.2514/6.2016-0262. [Google Scholar] [CrossRef]
16. Xu X , Wang Y , Yu YL . Numerical Simulation and Experimental Research on the Flow Field of Automobile in Environmental Wind Tunnel. Automot Eng. 2024; 46( 3): 536–45. (In Chinese). doi:10.19562/j.chinasae.qcgc.2024.03.018. [Google Scholar] [CrossRef]
17. ANSYS Inc. ANSYS fluent user’s guide release 19.2. Canonsburg, PA, USA: ANSYS Inc.; 2019. [Google Scholar]
18. John JD . Anderson, computational fluid dynamics: The basic with applications. Beijing, China: Tsinghua University Press; 2012. [Google Scholar]
19. Menter F . Zonal two equation k-w turbulence models for aerodynamic flows. In: Proceedings of the 23rd Fluid Dynamics, Plasmadynamics, and Lasers Conference; 1993 Jul 6–9; Orlando, FL, USA. doi:10.2514/6.1993-2906. [Google Scholar] [CrossRef]
20. Feng J , Bian T , Han Q , Wang B . A numerical investigation on the influence of the circular ring on the aerodynamic noise generated by a cooling fan. Fluid Dyn Mater Process. 2023; 19( 1): 1– 14. doi:10.32604/fdmp.2023.018275. [Google Scholar] [CrossRef]
21. Bian T , Shen X , Feng J . Numerical study of the influence of splitter geometry on secondary flow control. Proc Inst Mech Eng Part A J Power Energy. 2021; 235( 4): 643– 50. doi:10.1177/0957650920962247. [Google Scholar] [CrossRef]
22. Bian T , Shen X , Wang B , Feng J , Han Q . Numerical and experimental investigation of flow loss and flow structure of circular arc cambered plate blade cascade. Proc Inst Mech Eng Part A J Power Energy. 2019; 233( 8): 961– 73. doi:10.1177/0957650919846006. [Google Scholar] [CrossRef]
23. Bian T , Shen X , Feng J , Wang B . Numerical investigation on the secondary flow control by using splitters at different positions with respect to the main blade. Fluid Dyn Mater Process. 2021; 17( 3): 615– 28. doi:10.32604/fdmp.2021.014902. [Google Scholar] [CrossRef]
Cite This Article
 Copyright © 2026 The Author(s). Published by Tech Science Press.
This work is licensed under a Creative Commons Attribution 4.0 International License , which permits unrestricted use, distribution, and reproduction in any medium, provided the original work is properly cited.
 Downloads
 Citation Tools