
 Submit a Paper
 Propose a Special lssue
 Open Access
ARTICLE

Biomimetic Volute Tongue Design for Combined Hydraulic and Acoustic Optimization in Centrifugal Pumps
1 School of Energy and Power Engineering, Lanzhou University of Technology, Lanzhou, China
2 Key Laboratory of Fluid Machinery and Systems, Gansu Province, Lanzhou University of Technology, Lanzhou, China
3 Key Laboratory of Advanced Pumps, Valves and Fluid Control System of the Ministry of Education, Lanzhou, China
4 State-owned Sida Machinery Manufacturing Company, Xianyang, China
* Corresponding Author: Rong Guo. Email:
Fluid Dynamics & Materials Processing 2026, 22(3), 11 https://doi.org/10.32604/fdmp.2026.077602
Received 12 December 2025; Accepted 11 March 2026; Issue published 31 March 2026
 View Full Text
 Download PDF
Abstract
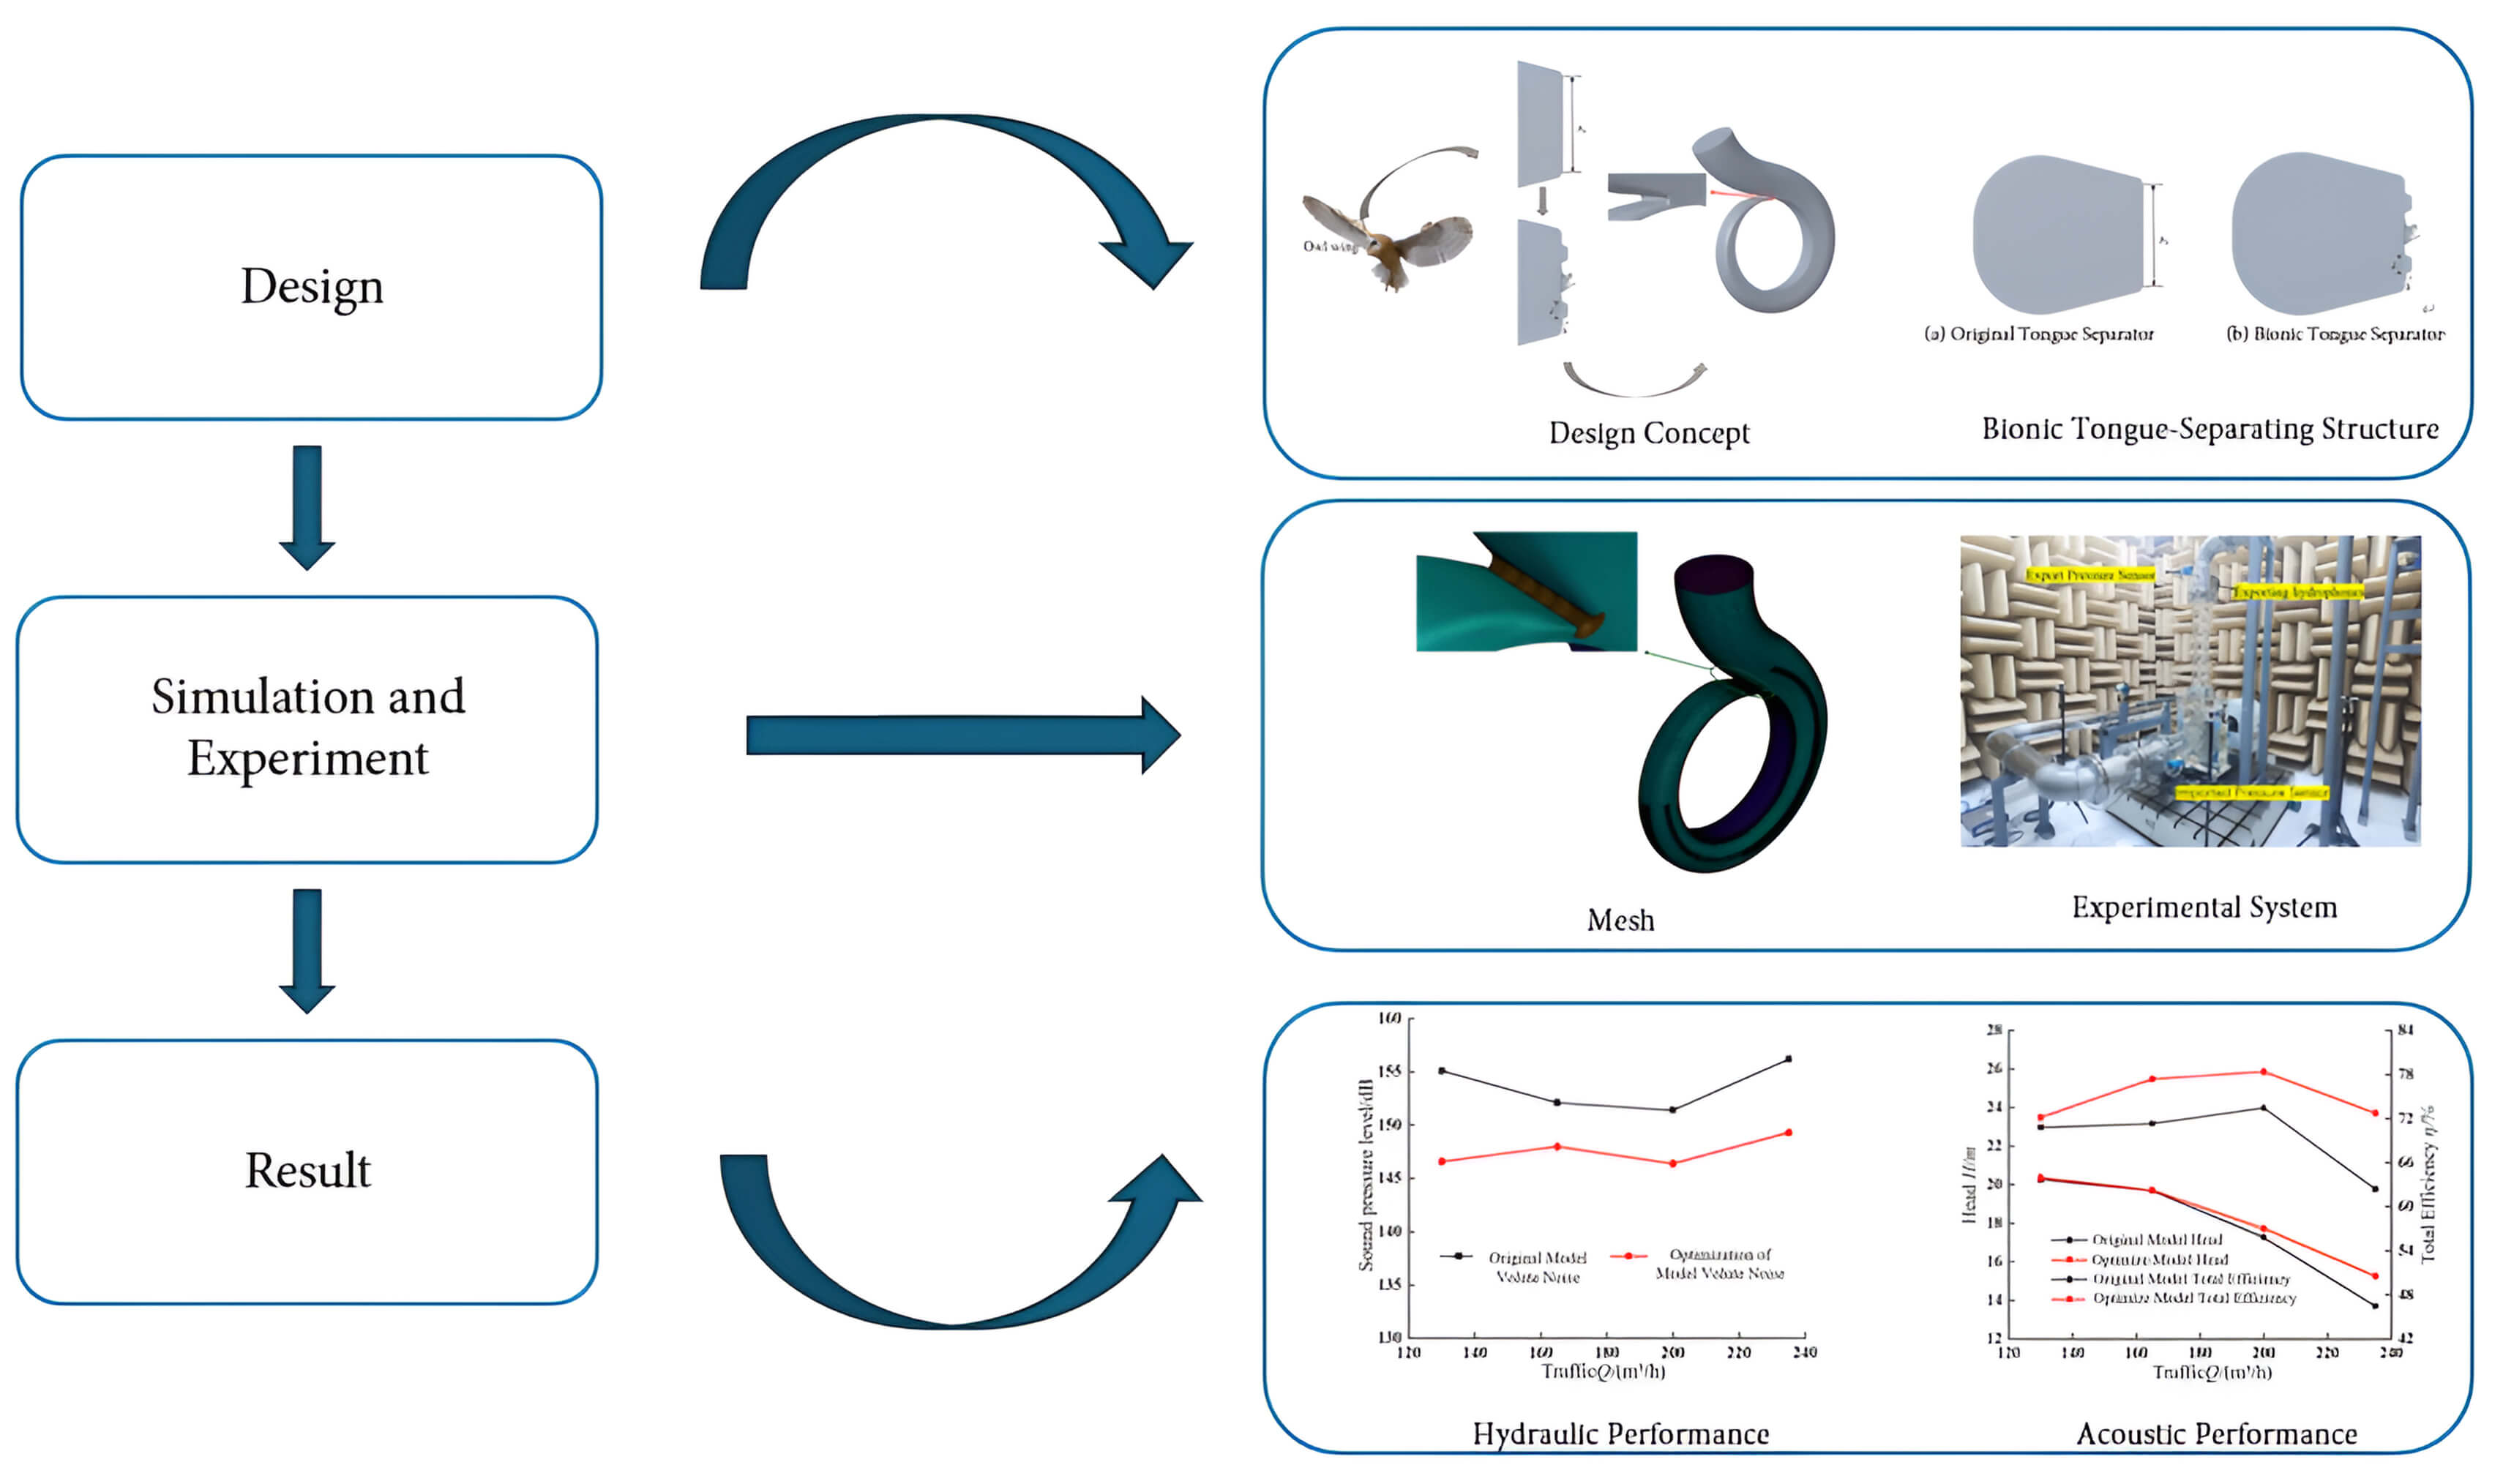
To simultaneously reduce flow-induced noise and enhance hydraulic performance in centrifugal pumps, this study proposes a bionic volute tongue inspired by the serrated trailing-edge morphology of the long-eared owl wing. Hydraulic performance and volute-induced noise are integrated into a unified evaluation framework, enabling multi-objective optimization of the tongue geometry. An orthogonal experimental design coupled with Computational Fluid Dynamics (CFD) and Computational Fluid Acoustics (CFA) is employed to systematically assess the influence of serration parameters. A matrix-based decision method is then used to identify the optimal configuration balancing efficiency, head, and acoustic performance. The optimized design reduces the area fraction of extremely high-velocity regions (>18 m/s) from 15.21% to 5.38%, corresponding to a 64.63% decrease, while the flow non-uniformity coefficient ζ is reduced by 26.1%. Under rated operating conditions, the pump head increases by 0.5 m, hydraulic efficiency improves by 5%, and volute-induced noise is reduced by approximately 5 dB. Flow-field analysis indicates that volute-induced noise is the dominant source of hydrodynamic noise, and that the serrated bionic tongue effectively suppresses its intensity. The noise reduction mechanism is attributed to improved rotor-stator interaction, decomposition of large-scale vortical structures, and delayed flow separation, which collectively reduce pressure pulsation at the rotor-stator interface.Graphic Abstract
Keywords
Centrifugal pumps, serving as critical components in fluid transport systems, are extensively employed across industries such as power generation, petrochemicals, and aerospace [1,2,3,4]. During operation, these pumps generate mechanical vibration noise and flow-induced noise. With continuous advancements in manufacturing and assembly precision, the impact of mechanical vibration noise has been progressively mitigated, shifting research focus toward flow-induced noise, which has become a primary subject of current investigations. Noise control strategies generally address the source, propagation path, and receiver; among these, controlling the source represents the most fundamental and effective approach [5,6,7]. In terms of research methodologies, significant progress has been achieved in analytical, experimental, and numerical simulation methods [8,9,10,11,12].
As a key hydraulic component of centrifugal pumps, the volute plays an essential role in energy conversion and flow guidance. The complex unsteady flow in the tongue region is recognized as a major source of pressure pulsations and noise [13,14]. Consequently, structural optimization of the tongue has emerged as a crucial direction for noise control and performance enhancement in centrifugal pumps. Dehghan et al. [15] combined experimental performance curves with CFD simulations to systematically optimize key volute geometric parameters by solving the Navier–Stokes equations and analyzing flow-field features, including contour maps, streamlines, and recirculation regions. The study identified a circular cross-section as the optimal design (η = 87.6%, H = 14.55 m). Guided by the angular-momentum conservation principle, the tongue angle was set to 10°, with a tongue diameter of 3 mm, a base-circle diameter of 220 mm, and an inlet width of 23 mm, increasing the efficiency to approximately 88.93%. The authors also noted that an excessively long diffuser can reduce efficiency. Dong et al. [16] demonstrated that adjusting structural parameters of the impeller blades and the tongue—such as reducing the clearance between them—can effectively suppress noise. Similarly, Wan et al. [17] conducted numerical simulations on solid-liquid two-phase centrifugal pumps with different tongue placement angles. Their findings indicated that appropriately increasing the tongue angle improves internal flow characteristics, reduces pressure pulsations in the spiral section of the volute, and promotes a more uniform distribution of radial forces on the tongue. Nevertheless, existing studies often rely on empirical adjustments of isolated parameters and lack systematic multiparameter optimization approaches. Moreover, a comprehensive understanding of the flow-acoustic coupling effects resulting from alterations in tongue geometry remains insufficient. Mohammed et al. [18] developed a prediction-and-optimization model for centrifugal-pump efficiency by integrating a long short-term memory (LSTM) network with the response surface methodology (RSM), using experimental data on suction/discharge pressures, rotational speed, and torque. The results showed that RSM achieved higher predictive accuracy (R2 = 0.999) than LSTM (R2 = 0.995), and the pump efficiency was optimized to 62.57%. Ebada et al. [19] established a vibration-monitoring test rig for a centrifugal pump with a transparent casing (piezoelectric sensors combined with envelope analysis) and achieved early cavitation detection using piezoelectric sensing and envelope analysis. Early cavitation was identified by adjusting the suction-valve opening angle and rotational speed. The study reported that at 3003 rpm and a valve angle of 22.5°, the spectrum exhibited pronounced high-frequency cavitation signature peaks (approximately 1445 and 1806 Hz), and the damage index reached 2.5. After reducing the speed to 2196 rpm, these high-frequency components disappeared and the damage index dropped below 0.2, indicating that cavitation was effectively mitigated. Integrating experimental testing with ZGB-based CFD simulations, Dehghan et al. [20] evaluated NPSHr, η (3% efficiency drop) as a diagnostic threshold for cavitation in centrifugal pumps. The results highlight that NPSHr, η offers superior predictive safety margins over traditional head-drop metrics. By capturing the significant efficiency losses (peaking at 8.92%) triggered by early-stage cavitation, this criterion provides a robust framework for enhancing the hydraulic reliability and energy performance of pumps.
Inspired by biological structures in nature, bionic design has been gradually introduced into related research and demonstrates promising potential. Mou Jie gang et al. [21] conducted a comparative numerical study of the full flow field in centrifugal pumps with standard and bionic volutes. Their results indicated that the bionic volute can significantly reduce the amplitude of pressure pulsations in the tongue region, improve the internal flow patterns, and enhance operational stability. Song Pengfei et al. [22] employed the SST turbulence model to investigate the influence of a bionic tongue structure on the hydraulic performance of a centrifugal pump. They concluded that the bionic tongue improves pump performance, reduces energy loss, and increases internal flow stability. Dai Cui et al. [23], using the SST k-ω turbulence model combined with the Proudman method and acoustic analogy equations, studied the effect of a V groove bionic blade surface structure on the flow field and noise in a centrifugal pump. They found that this approach effectively suppresses near-wall flow, with both efficiency and noise reduction improving as the flow rate increases. However, current research predominantly focuses on localized or individual bionic features, and a systematic modeling of key geometric parameters of the bionic tongue, as well as a comprehensive understanding of their integrated effects on hydraulic and acoustic characteristics, remains insufficient.
Current biomimetic design studies are primarily focused on optimizing impeller/blade configurations, whereas applications to the volute tongue are comparatively limited. In particular, collaborative (coupled) optimization of the flow field and acoustic field targeting biomimetic volute tongues remains largely unexplored. To address this gap, this study takes an IS150-125-250 centrifugal pump as the target and conducts a coupled hydraulic–acoustic optimization based on an orthogonal experimental design and CFD/CFA analyses. By comparatively analyzing the internal flow field, pressure pulsations, and noise-radiation characteristics across different design schemes, this work elucidates how the geometric parameters of the biomimetic volute tongue govern pump performance. Ultimately, an optimal configuration that balances hydraulic efficiency and noise reduction is identified, and specific recommendations for engineering applications are provided.
2 Research Object and Methodology
The study focuses on an IS150-125-250 type centrifugal pump, with a structural schematic shown in Fig. 1 The primary design parameters are as follows: Head Hd = 20 m, Flow Rate Qd = 200 m3/h, Rotational Speed nd = 1450 r/min, Shaft Frequency fa = 24.17 Hz, Blade Passing Frequency fb = 145.02 Hz. Key structural parameters are listed in Table 1.
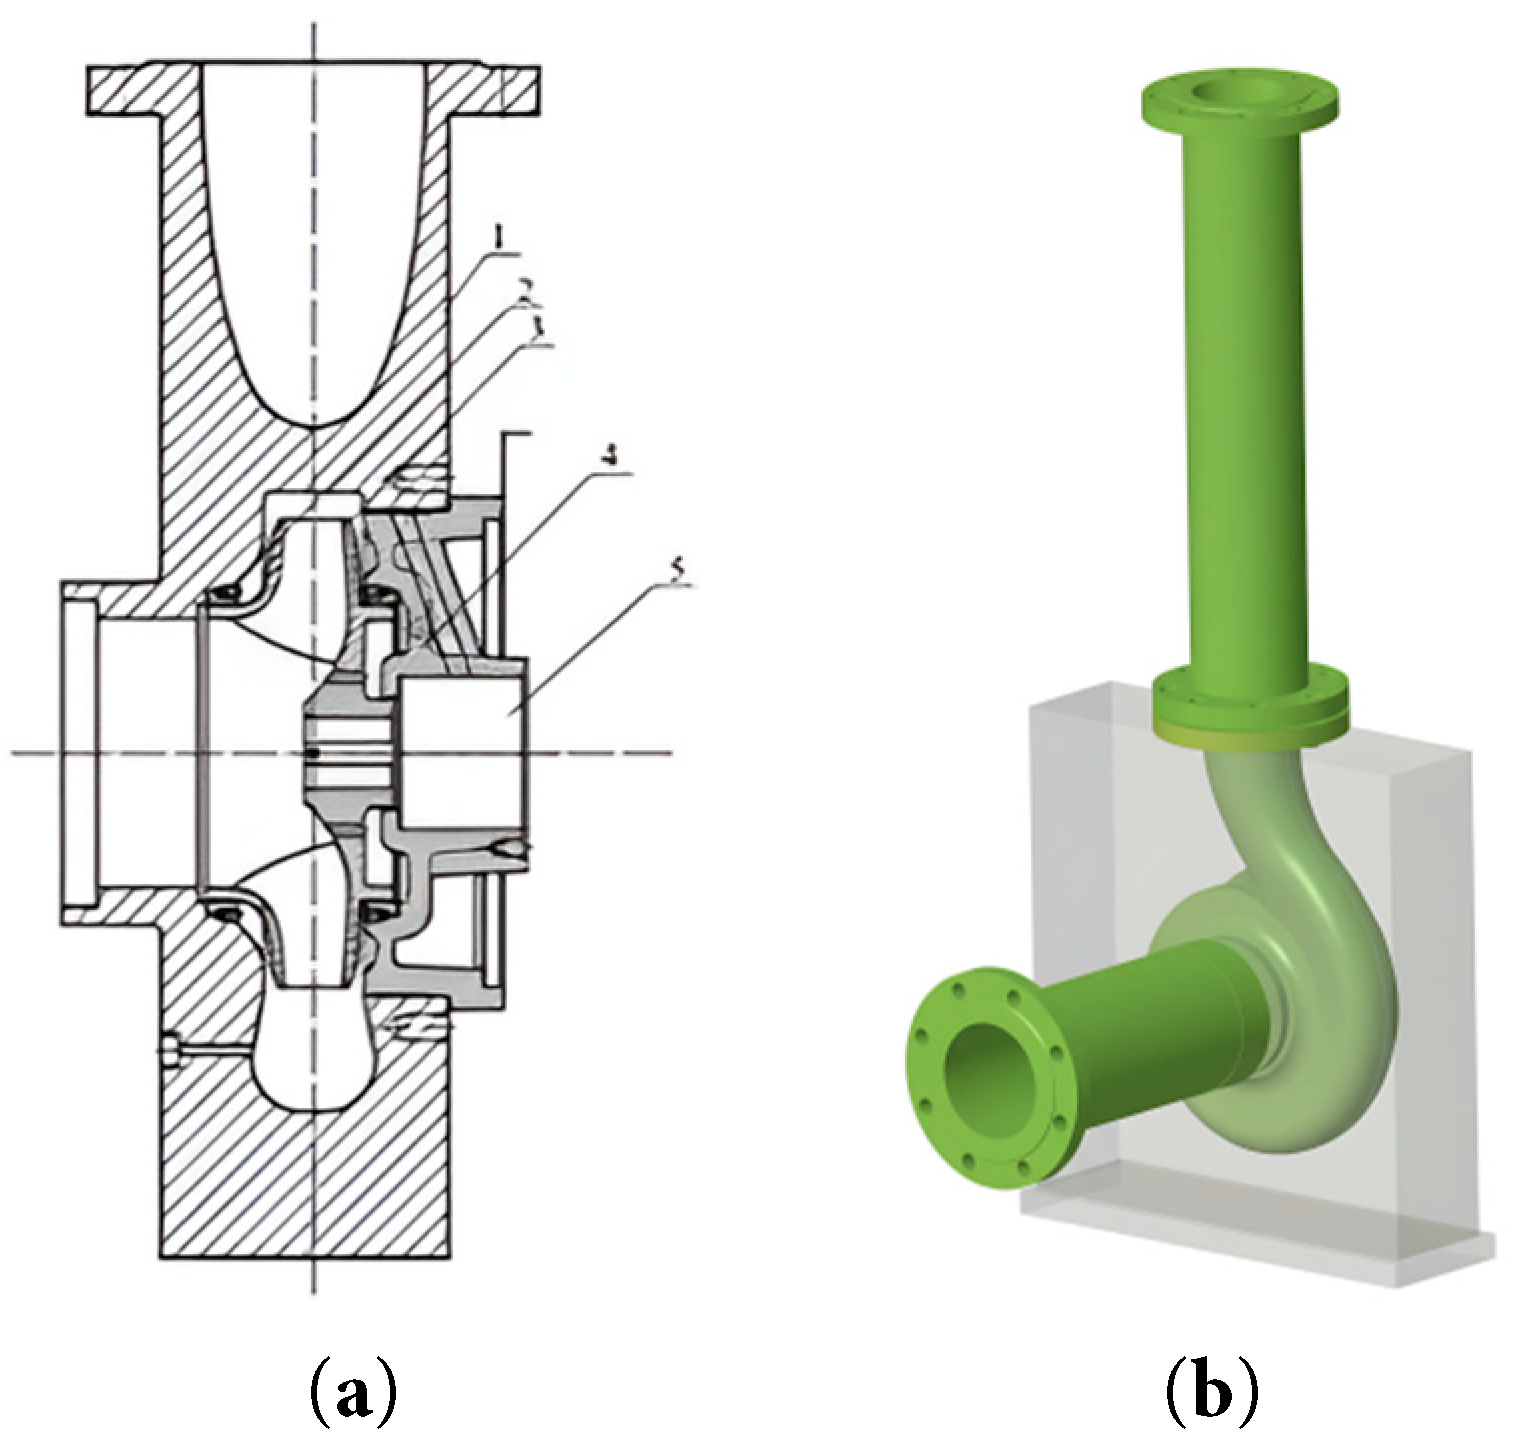
Figure 1: Model Pump Structural Diagram, (a) model pump two-dimensional structural diagram, (b) model pump three-dimensional structural diagram. 1: pump body; 2: sealing ring; 3: impeller; 4: pump cover; 5: shaft.
Table 1: Main structural parameters of centrifugal pumps.
| Structural Parameters | Numerical Value |
|---|---|
| Ds/mm | 170 |
| Dd/mm | 150 |
| D1/mm | 150 |
| D2/mm | 260 |
| Z | 6 |
| b2/mm | 33 |
| D3/mm | 260 |
The discrete-frequency noise of a centrifugal pump primarily arises from the rotor–stator interaction between impeller wakes and the volute tongue, manifesting as periodic pressure pulsations and vortex shedding at the blade passing frequency (BPF) and its harmonics. A conventional cylindrical-surface volute tongue readily induces severe flow-field distortion in the tongue region, making it a primary source of flow-induced noise. In contrast, the serrated biomimetic volute tongue introduces a geometric phase offset that disrupts the coherence of the interaction, promoting a transition toward three-dimensional, dissipative flow structures and thereby markedly reducing the peak pressure pulsations in the tongue region. Moreover, streamwise vortices induced by the serrated edge can effectively break up the large-scale shed vortices near the blade tip. By reducing the turbulence intensity in the tongue region, this mechanism enables simultaneous suppression of discrete tonal noise and broadband background noise. The design concept is illustrated in Fig. 2.
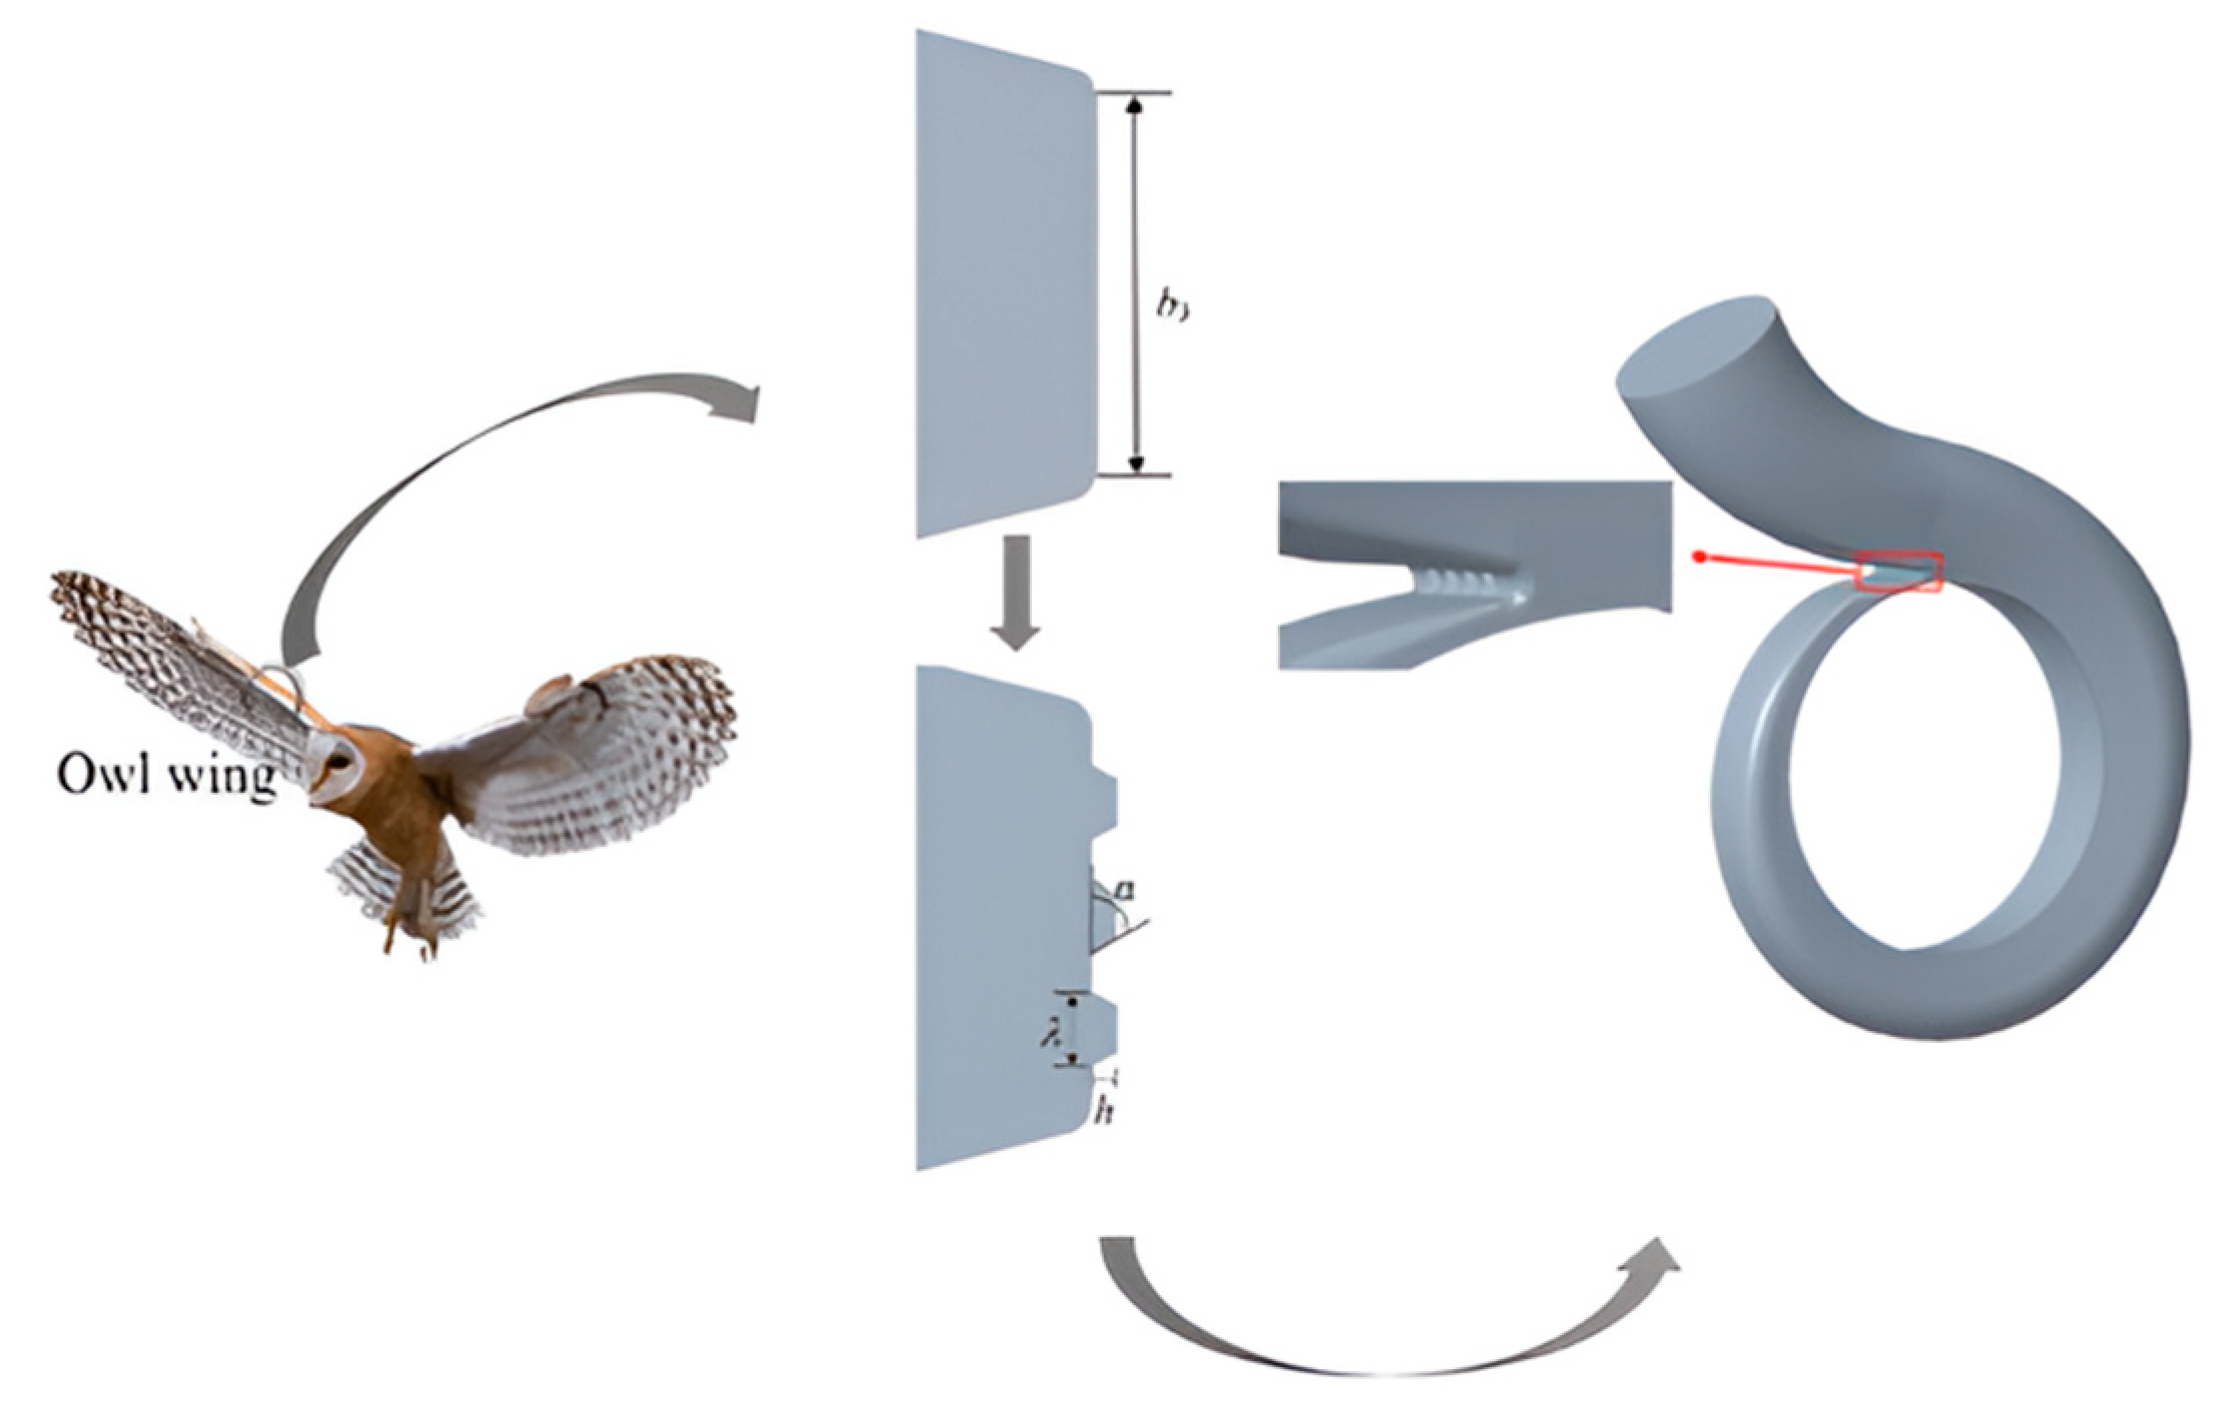
Figure 2: Design concept.
While maintaining a constant tongue width (b3) for the model pump, a bionic modification based on trapezoidal serrations was implemented. This involves four key parameters: number of serrations (Z), serration height (h), base length (λ), and base angle (α). As summarized in Fig. 3.
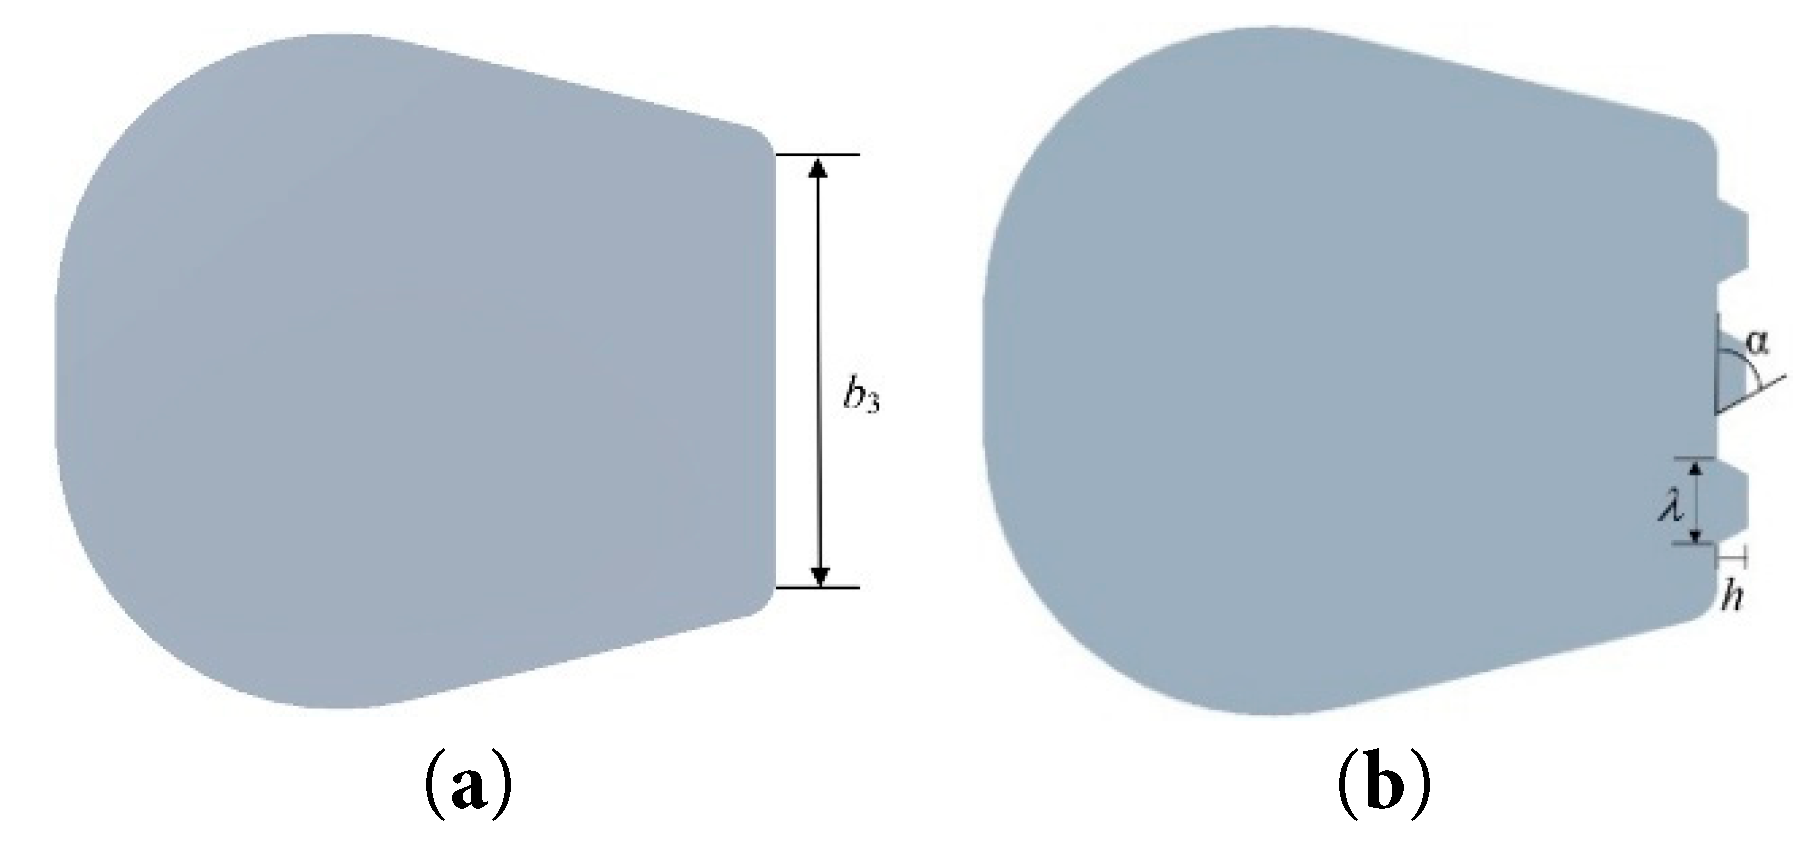
Figure 3: Bionic tongue-separating structure, (a) original tongue separator, (b) bionic tongue separator.
The Taguchi method (Orthogonal Experimental Design) was employed for the experimental design. This methodology enables a comprehensive and systematic analysis of the influence of multiple factors and levels on the results with a relatively small number of experimental trials, significantly enhancing the efficiency and reliability of the optimization process [24]. Three levels were selected for each factor, as detailed in Table 2.
Table 2: Factor levels for biomimetic serration-related parameters.
| Factor | A/Z (numble) | B/h (mm) | C/λ (mm) | D/α (°) | |
|---|---|---|---|---|---|
| Level | |||||
| 1 | Z = 4 | h = 2 | λ = 4 | α = 63.4 | |
| 2 | Z = 5 | h = 3 | λ = 5 | α = 71.6 | |
| 3 | Z = 6 | h = 4 | λ = 6 | α = 76.0 | |
During the design process, parameters such as the volute base circle diameter and width were kept constant. An L9 (34) standard orthogonal array was selected, resulting in a total of nine distinct design scheme combinations, which are listed in Table 3 The selected ranges of C(λ) and D(α) were determined by the available geometric space, manufacturing feasibility, and non-interference constraints. After using single-factor tests to identify the effective ranges, the factor levels were specified according to a three-level orthogonal design. With a baseline value of 5 mm, λ was set to 4/5/6 mm (approximately 0.8/1.0/1.2 times the baseline). Within the machinable range, α was set around 71.6° as 63.4°/71.6°/76.0°. This setup ensures that the parameter space is both representative and practically realizable in engineering applications.
Table 3: Orthogonal test plan.
| Solution | A/Z | B/h | C/λ | D/α |
|---|---|---|---|---|
| 1 | 4 | 2 | 4 | 63.4 |
| 2 | 4 | 3 | 5 | 71.6 |
| 3 | 4 | 4 | 6 | 76.0 |
| 4 | 5 | 2 | 6 | 71.6 |
| 5 | 5 | 3 | 4 | 76.0 |
| 6 | 5 | 4 | 5 | 63.4 |
| 7 | 6 | 2 | 5 | 76.0 |
| 8 | 6 | 3 | 6 | 63.4 |
| 9 | 6 | 4 | 4 | 71.6 |
2.4 Multi-Objective Optimization Scheme
The Matrix Analysis Method provides a systematic and mathematical tool for multi-objective optimization. It facilitates the efficient handling and analysis of multi-objective optimization problems by quantitatively calculating the degree of influence of various factors on the experimental indicators [24]. This method constructs a three-dimensional data model based on the data structure, encompassing n factors each with m levels, enabling the scientific evaluation and rational optimization of complex problems, as conceptually represented in Table 4.
Table 4: Matrix analysis method data structure.
| Layer 1 (Indicator Layer) | Test Indicators | |||
|---|---|---|---|---|
| Layer 2 (Factor Layer) | A | B | C | D |
| Layer 3 (Horizontal Layer) | ||||
In the constructed model: The first layer is the Experimental Indicator Layer. A matrix M, as shown in Eq. (1), is established for these indicators. If the average result of the experimental indicator for Factor i at Level j is
The internal flow in the centrifugal pump was governed by the continuity equation and the Navier–Stokes equations, with room-temperature clean water as the working fluid.
u is the velocity vector,
v is the molecular viscosity,
vt is the DES-modified turbulent viscosity, calculated according to the RANS or LES model according to the considered region.
The detached eddy simulation (DES) [25] turbulence model was adopted. Its core idea is to retain the RANS behavior in the near-wall boundary-layer region, while switching to an LES-like resolution in regions dominated by large-scale separated vortices. The transition is achieved by applying a DES limiter to the length scale in the underlying RANS model. The DES characteristic length scale is defined as:
lDES denotes the turbulence length scale inherited from the underlying RANS model, CDES is a model constant, and Δ is the grid length scale, which can be taken as Δ = max(Δx, Δy, Δz). Within this framework, the turbulence dissipation/length-scale term is governed by lDES, enabling an adaptive RANS–LES transition across different flow regions. This improves the capability to resolve rotor–stator-interaction-induced unsteady separation and large-scale vortex structures. In the LES regions where the grid is sufficiently fine, the sub-grid scale (SGS) effects are modeled using the eddy viscosity μt (8). where Cs is the Smagorinsky constant and
The entire computational domain was divided into the impeller, volute, and inlet/outlet extension sections. Unstructured tetrahedral meshing was performed using ICEM 19.0. A grid independence study confirmed that the simulation results essentially converged when the total number of elements reached 16.9 million, with further mesh refinement having a negligible impact on the outcomes (Fig. 4). Consequently, this grid resolution was adopted for all subsequent numerical simulations. Fig. 5 illustrates the mesh details in the tongue region.
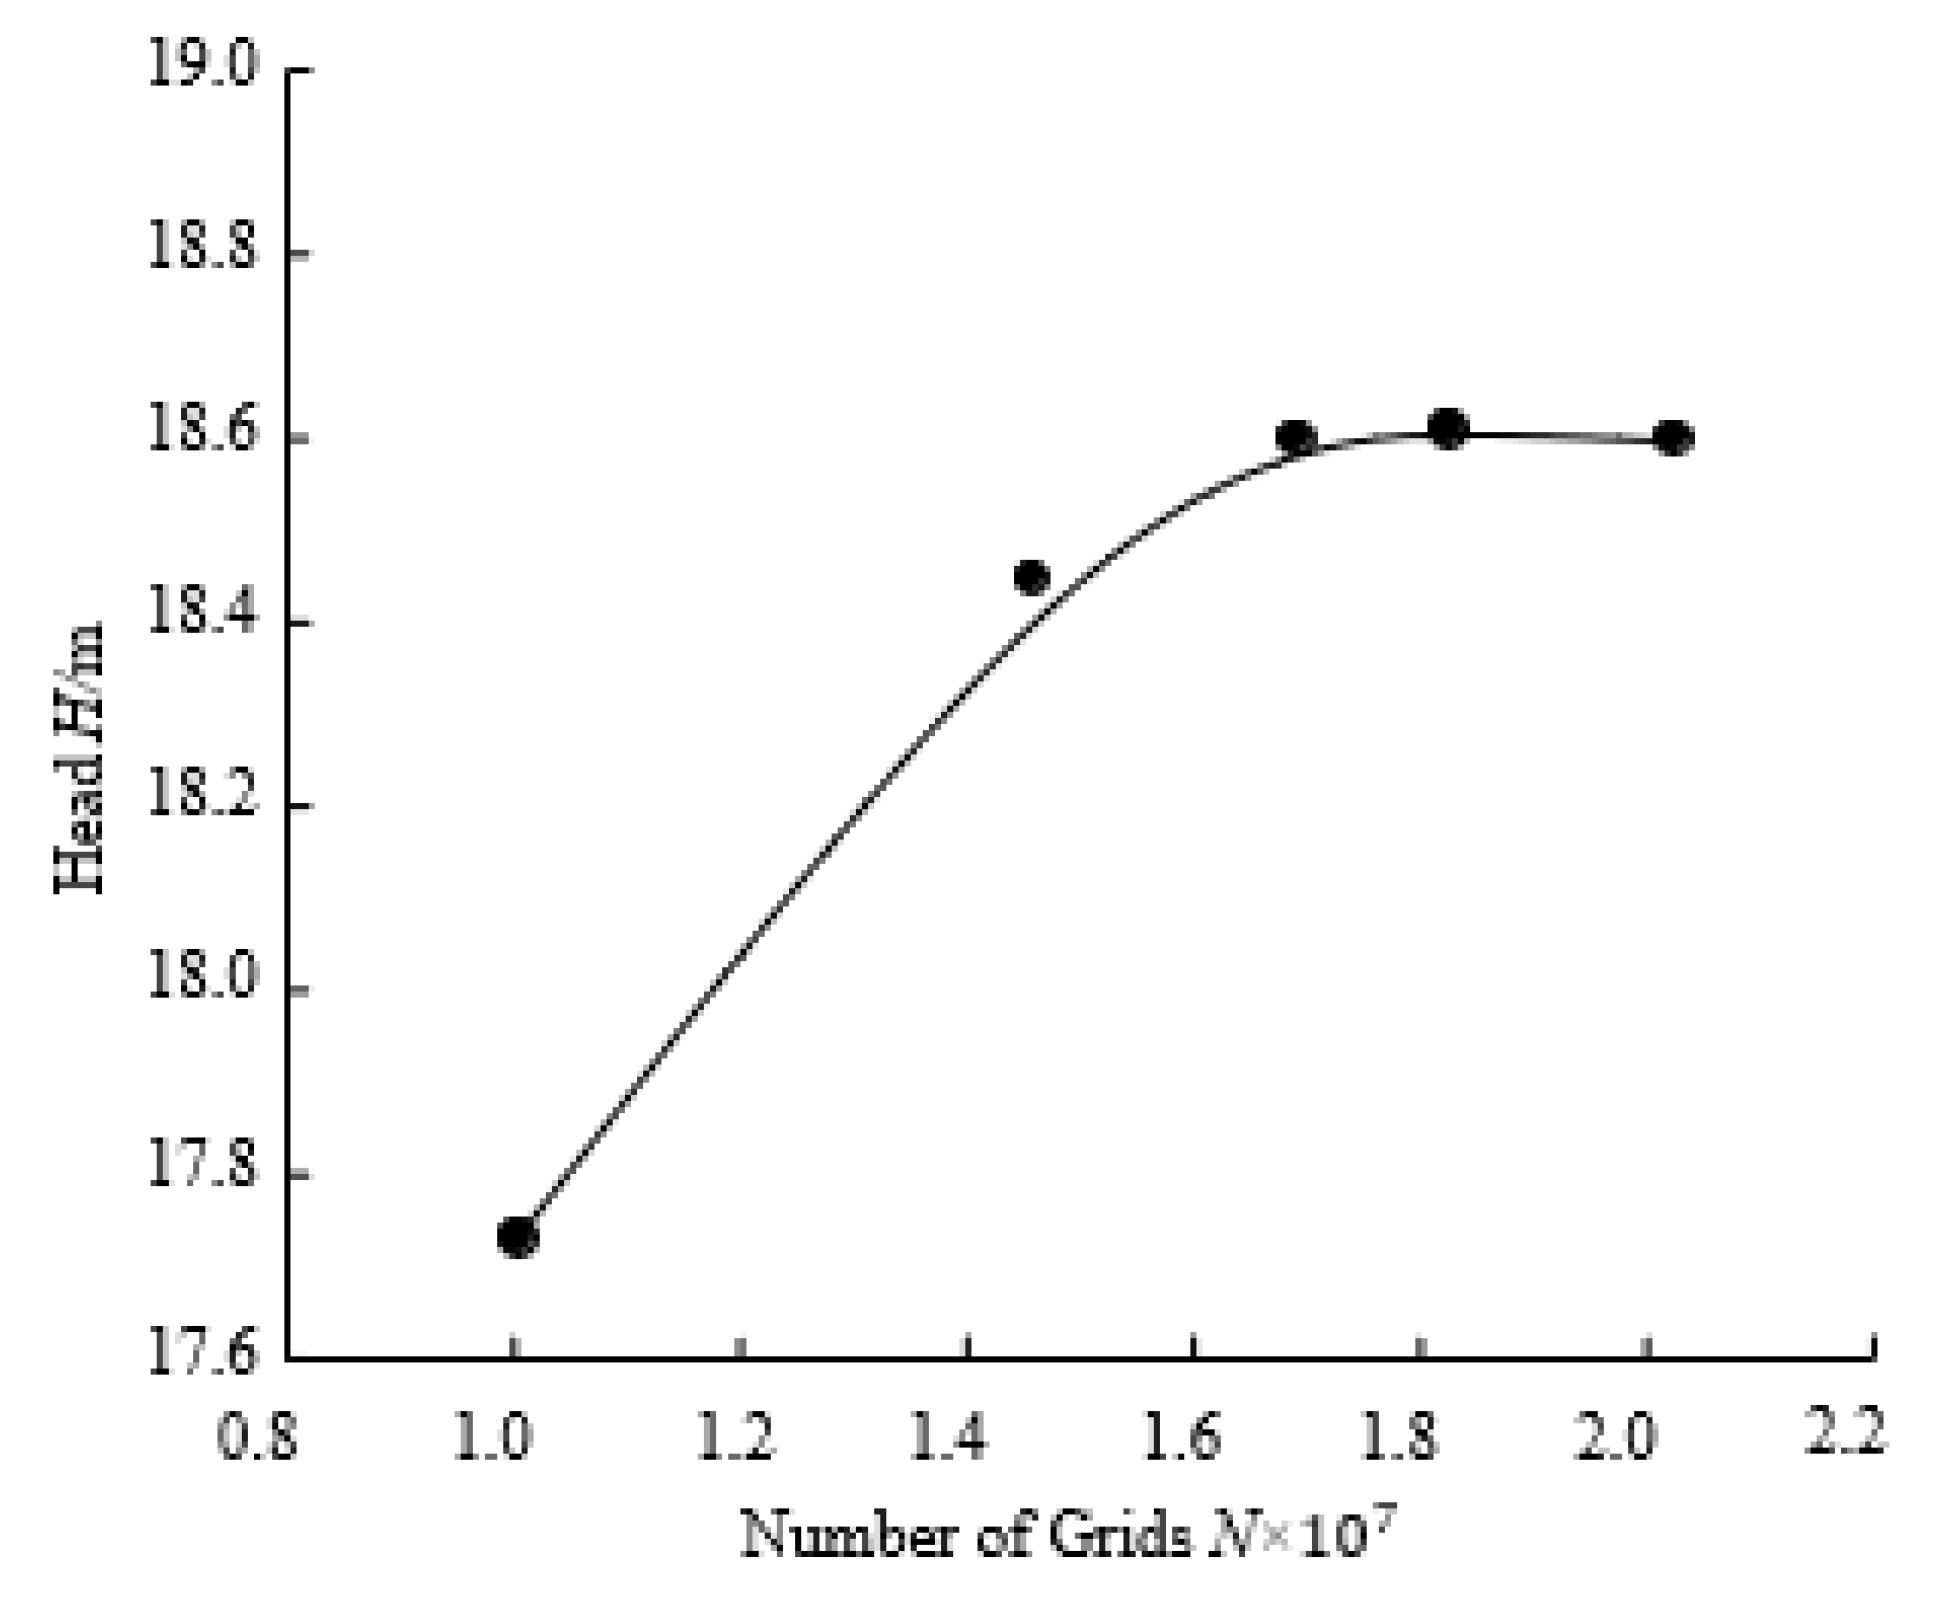
Figure 4: Grid-independent verification curve.
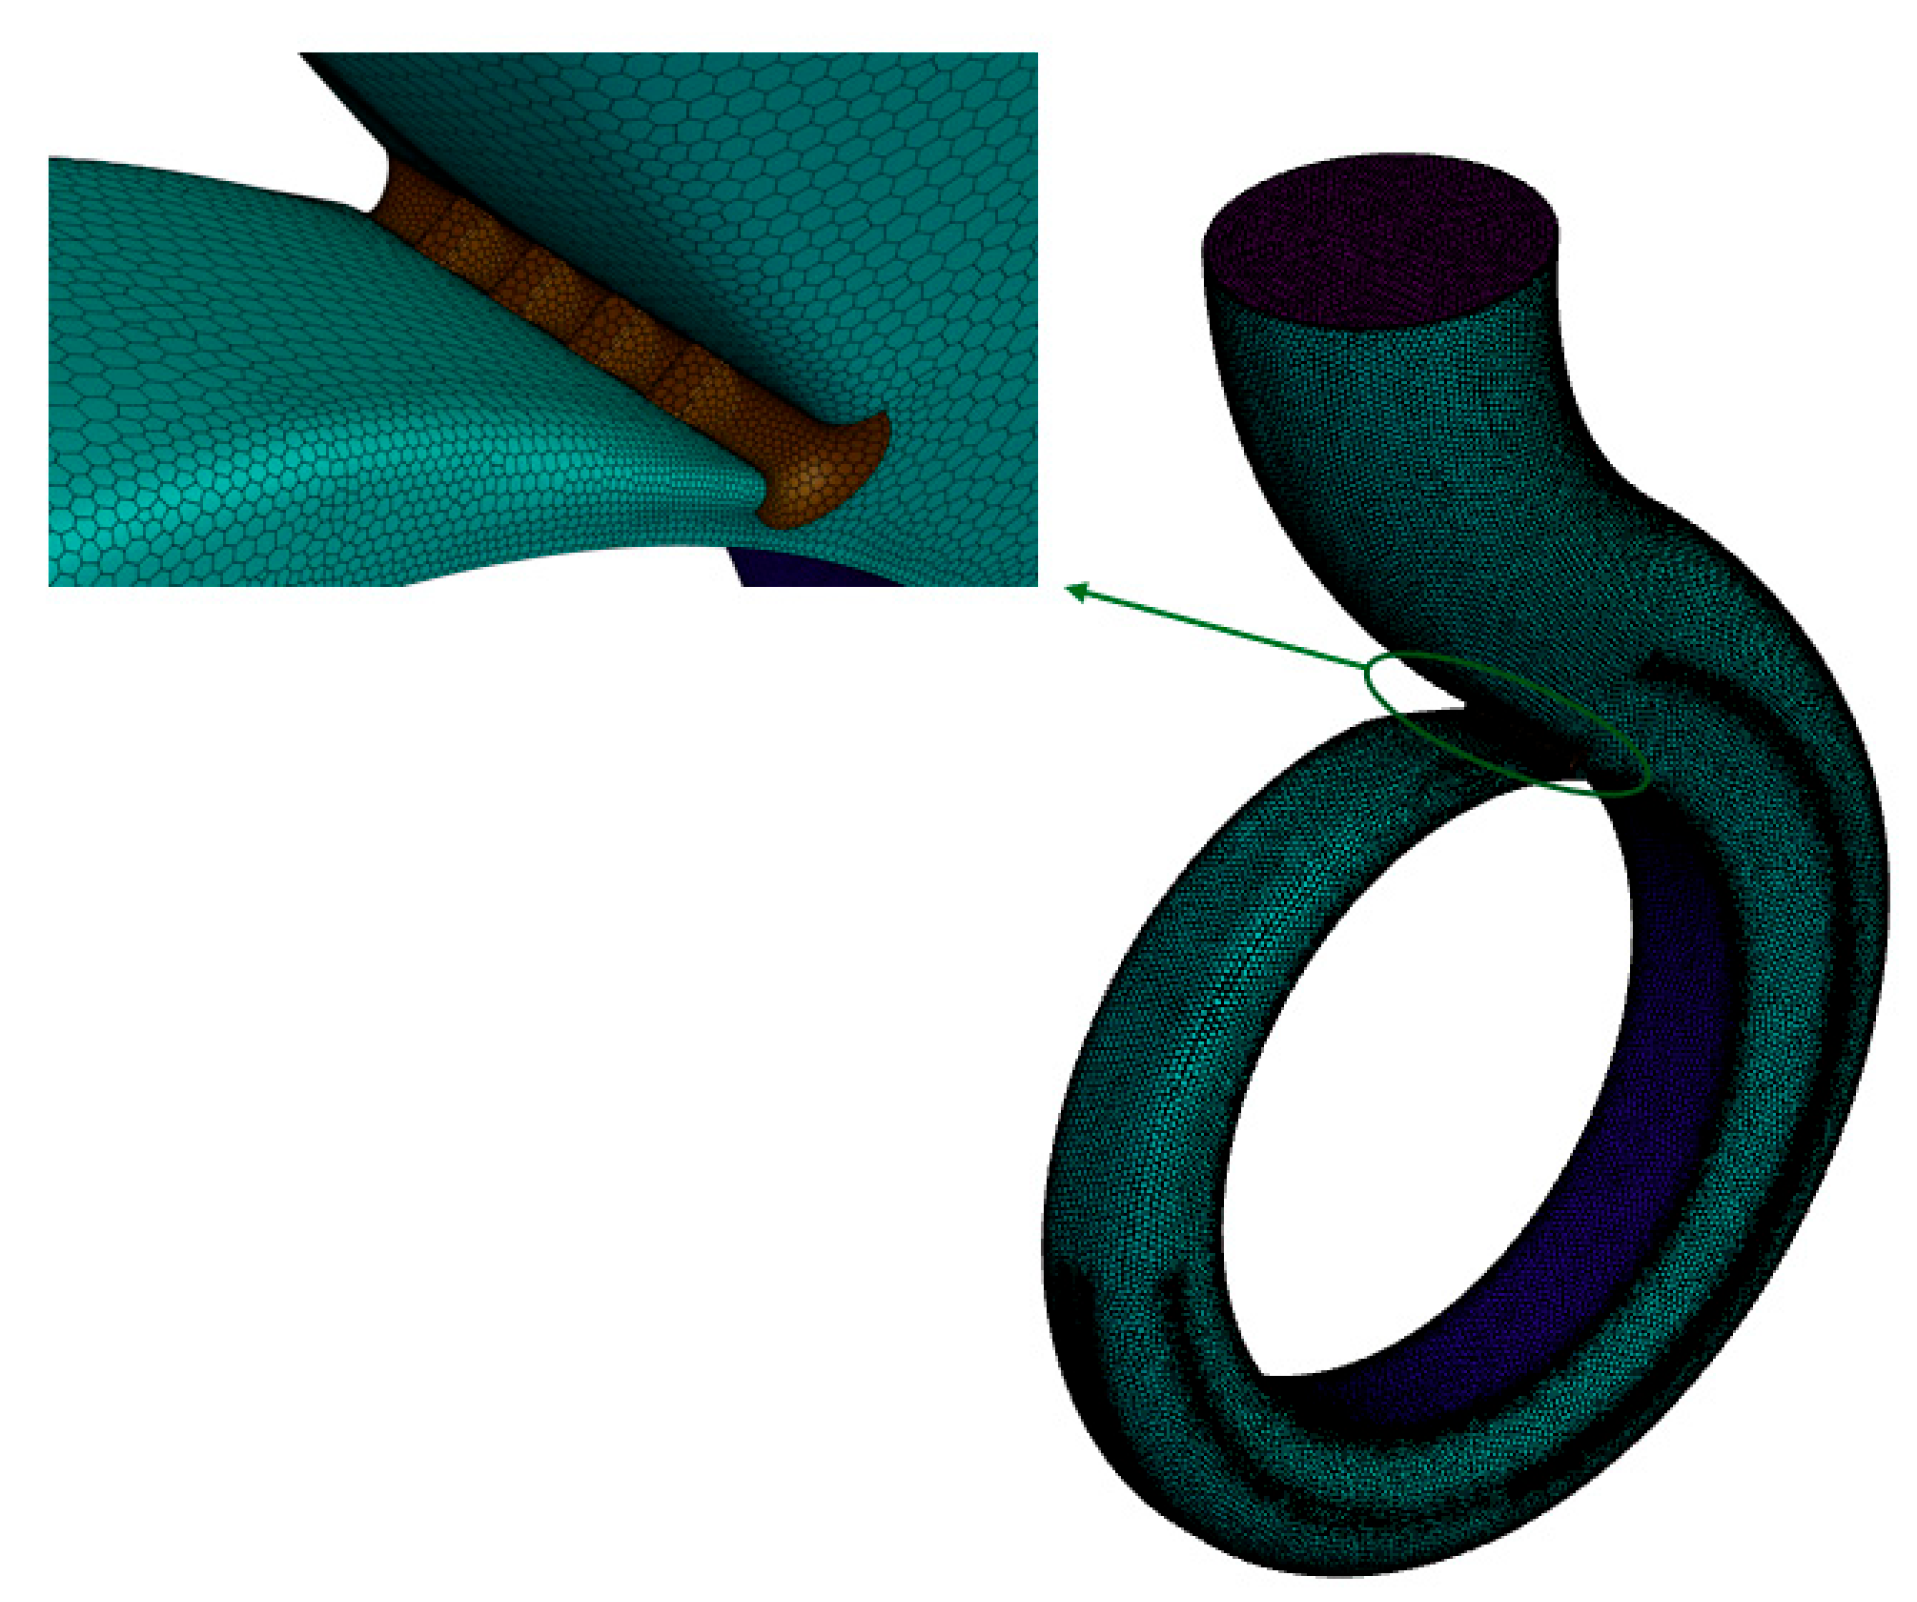
Figure 5: Schematic diagram of bionic tongue-separating mesh.
To ensure reproducibility, steady and unsteady flow-field simulations were performed using ANSYS CFX 19.0. On this basis, pressure pulsation signals were extracted and used as inputs for CFA-based acoustic analysis. To accurately capture the unsteady flow characteristics within the centrifugal pump, the governing equations were discretized using the Finite Volume Method (FVM). Pressure-velocity coupling was resolved via the SIMPLEC [26] algorithm, which demonstrates superior convergence and computational efficiency for transient flow fields compared to the conventional SIMPLE scheme. Regarding spatial discretization, a second-order upwind scheme was assigned to the turbulence terms to strike an optimal balance between numerical stability and resolved precision. Furthermore, a second-order implicit scheme (Backward Euler) was implemented for temporal discretization to ensure second-order accuracy during the transient evolution. To accurately capture wall-dipole acoustic sources, detached eddy simulation (DES) was employed. A mesh with y+ ≈ 1 was used to resolve the viscous sublayer near the wall, while large-scale vortical structures were resolved in free-shear regions, thereby balancing computational accuracy and efficiency. All walls were treated as no-slip boundaries, with the wall roughness set to 0.002 m according to the actual condition, and the working medium was clean water at 25°C. The steady-state solution was used to initialize the unsteady simulation once the residuals reduced to 1 × 10⁻⁵. The unsteady simulation was run for a total of 10 complete impeller revolutions. The first five revolutions were used to eliminate initial transients and reach a quasi-periodic state. After the performance parameters exhibited stable periodic behavior, wall-pressure pulsation data from the subsequent five revolutions were continuously extracted and saved in CGNS format. The unsteady time step was set to Δt = 0.00023 s (corresponding to an impeller rotation of approximately 2° per step), yielding a sampling frequency of fs ≈ 4348 Hz (fs = 1/Δt). According to the Nyquist sampling criterion, the Nyquist (cutoff) frequency of the present sampling setup is 2174 Hz, which is well above the 10th blade passing frequency harmonic of interest (approximately 1450 Hz). This effectively avoids frequency aliasing in the frequency domain and ensures adequate resolution of higher-order harmonics. Data covering five revolutions (total duration: 0.207 s) were recorded. Finally, the sampled signals were processed using phase-locked (cycle) averaging, which improves the statistical robustness of the FFT-based spectral analysis and further suppresses spurious spectral components. The resulting temporal and spatial resolutions fully satisfy the requirements for unsteady acoustic analysis.
3.2 Acoustic Field Calculation
Flow-induced noise was predicted using the Ffowcs Williams–Hawkings (FW–H) acoustic analogy. Under the low-Mach-number operating conditions of the centrifugal pump, the acoustic field is dominated primarily by dipole (loading) sources. The governing equation can be written as:
The acoustic finite element method (FEM) was employed to solve the dipole noise generated by the centrifugal pump operation, encompassing both the rotating dipole from the impeller blades and the wall dipole from the volute. The acoustic computations were performed using LMS Virtual. Lab 12.0 software. The element length for the acoustic FEM mesh is determined by the following formula:
L—Mesh cell length, m;
c—Speed of sound, m/s;
f—Maximum operating frequency, Hz.
The sampling frequency for the unsteady flow field calculation at the rated condition was 4348 Hz. According to the Nyquist theorem, the maximum analyzable frequency is 2174 Hz. Given the sound speeds of approximately 1500 m/s in water and 340 m/s in air, the maximum allowable acoustic mesh element length is calculated to be 115 mm. Considering the structural characteristics and ensuring computational accuracy, the acoustic mesh element size was determined to be 20 mm. For calculating the impeller-induced noise, the Fan Broadband Noise Source method was applied. For the volute-induced noise, the wall pressure pulsation data required processing via Fourier Transform. An acoustic monitoring point S was positioned at a distance equivalent to three times the outlet pipe diameter, and a pressure pulsation monitoring point P was placed at the tongue location, as shown in Fig. 6. It should be noted that the absolute-value prediction bias at low frequencies is a known limitation of this approach. Because all volute-tongue configurations employed identical mesh topology, boundary conditions, and acoustic-solver settings, this bias is expected to remain systematic and consistent across cases. Therefore, this offset in absolute levels does not compromise the relative performance comparison or the assessment of trends among different design schemes. The conclusions of this study remain highly reliable for design screening and selection purposes.
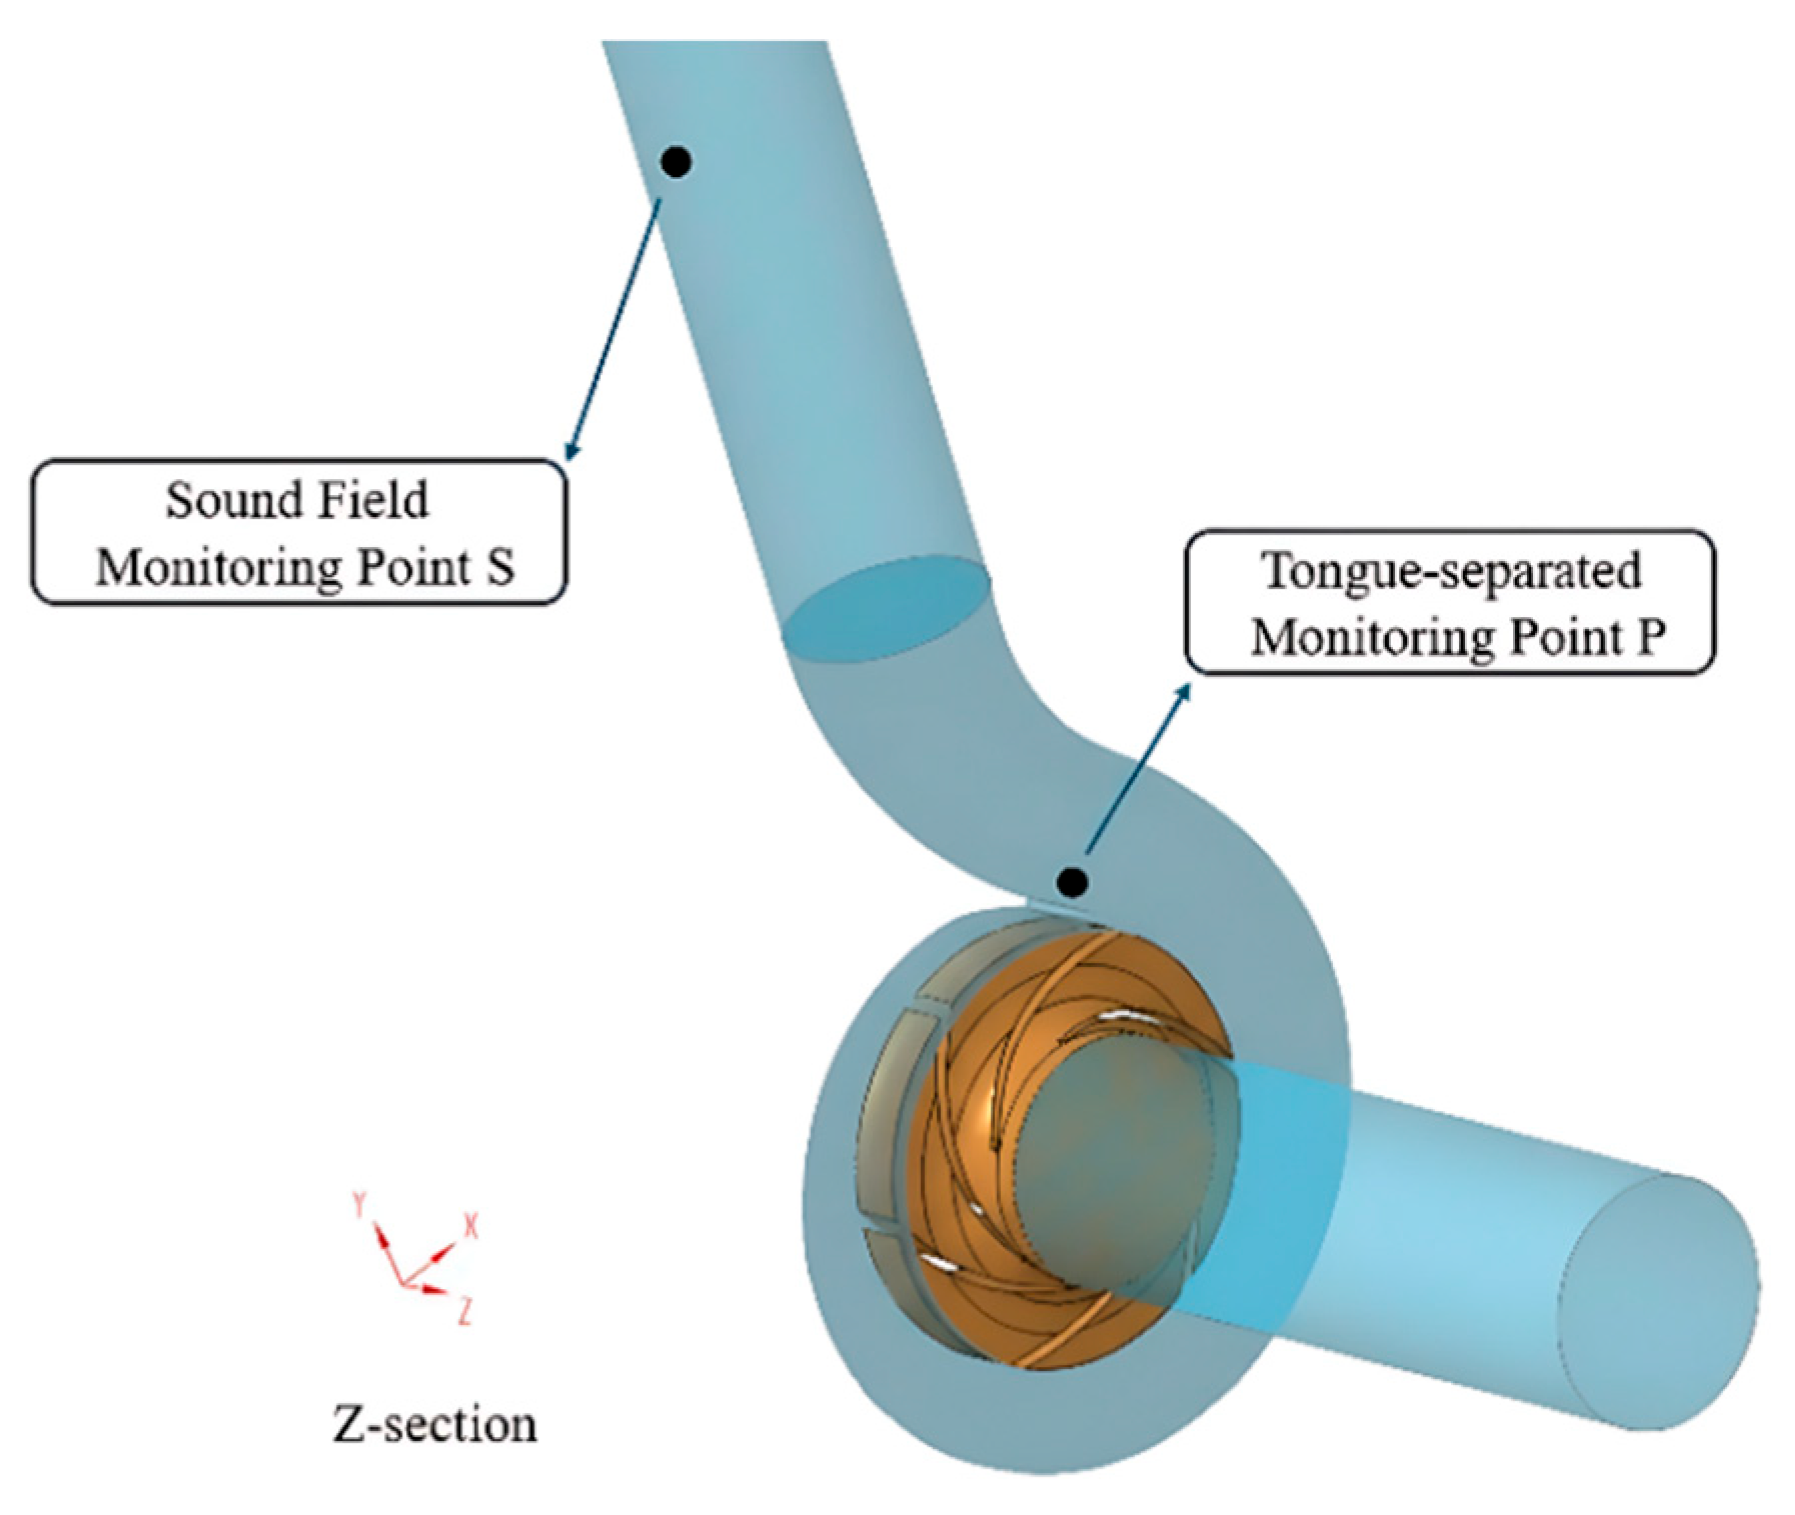
Figure 6: Monitoring Point Schematic Diagram.
3.3 Validation of Numerical Methodology
The accuracy of the numerical simulations for both the flow and acoustic fields was validated against experimental data obtained from a semi-anechoic chamber with a closed-loop piping system at Lanzhou University of Technology, depicted in Fig. 7.
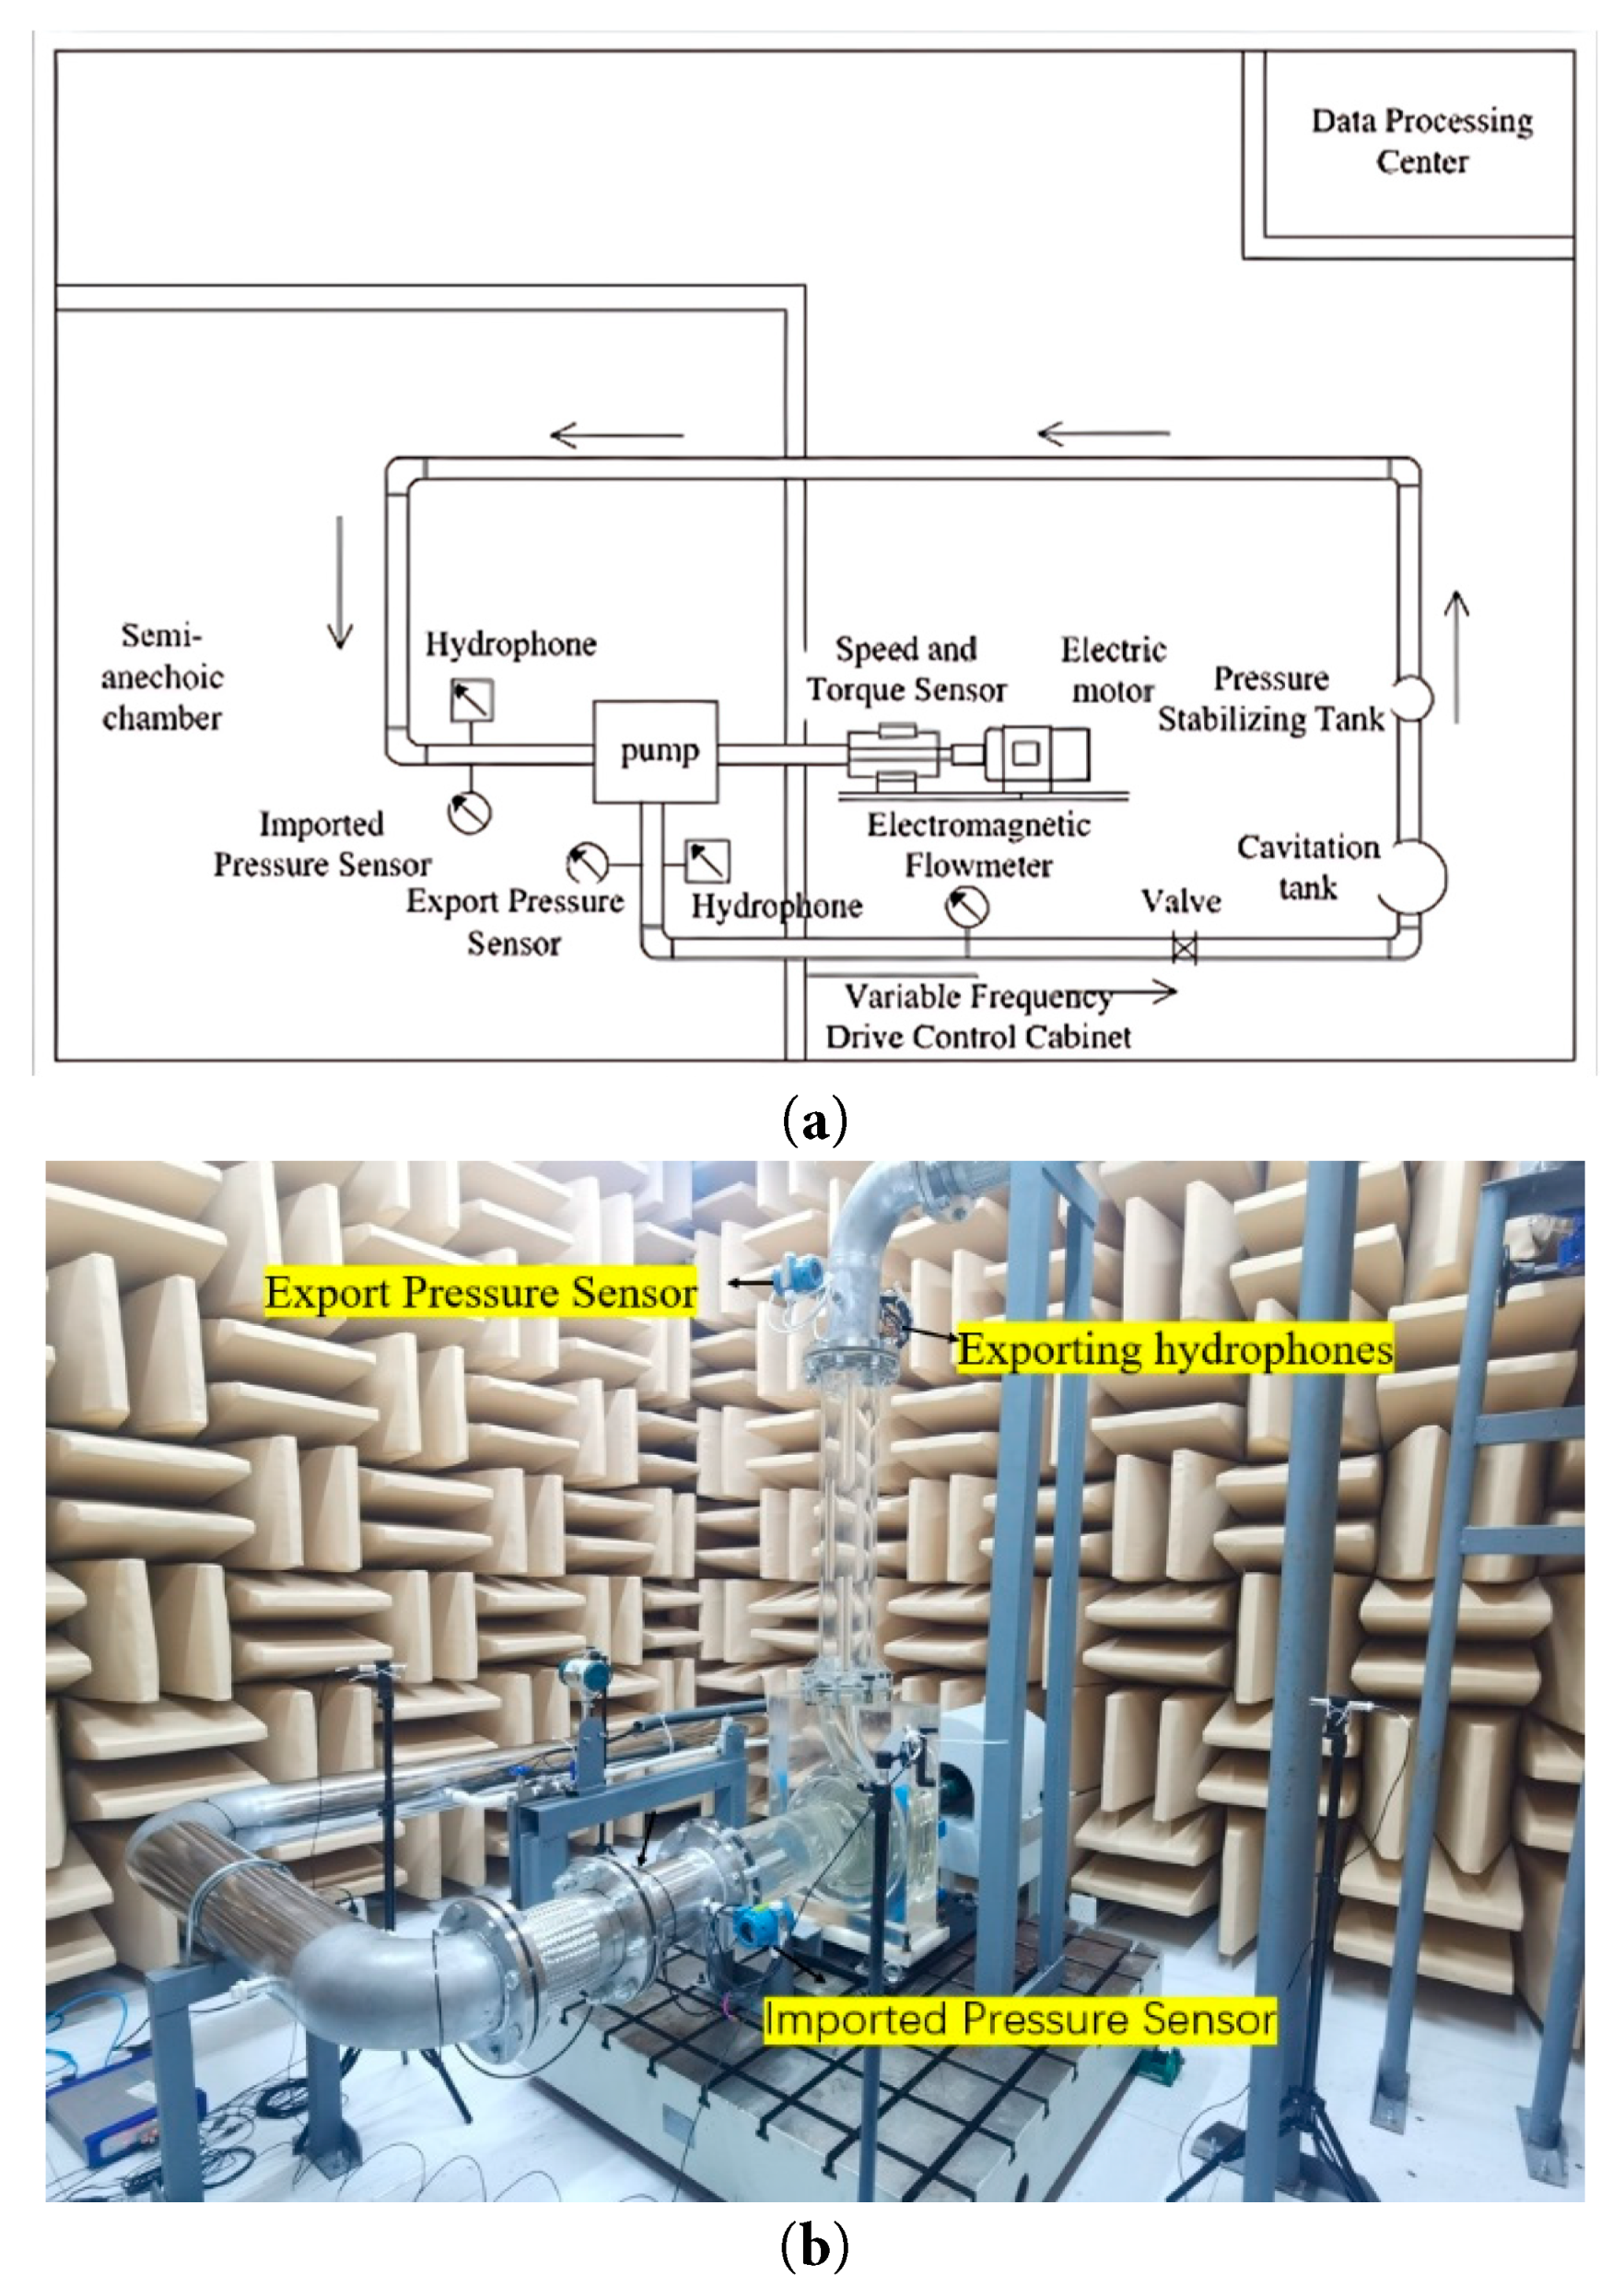
Figure 7: Experimental system, (a) schematic diagram, (b) inside the anechoic chamber.
The CFD-calculated hydraulic efficiency (ηh) was refined via the correlation η = ηhηvηm to bridge the discrepancy between simulation and experiment. This correction rigorously incorporates the parasitic effects of leakage-induced volumetric loss and the mechanical resistance of bearings and seals. To bolster the empirical grounding of our model, we adopted the benchmarks established by Dehghan et al. [20], setting ηv = 0.96 and ηm = 0.97. This parameterization accounts for the influence of the pump’s specific speed, thereby ensuring that the efficiency corrections are representative of the specific hydraulic design. As illustrated in Fig. 8 the refined efficiency curves closely mirror the experimental data throughout the operating envelope. This significant alignment in both magnitude and trend rigorously confirms that the current CFD framework is a high-fidelity surrogate for downstream design optimization.
A comparison between the numerical and experimental results for the model pump’s hydraulic performance curves is presented in Fig. 8. The graph shows that the trends of both sets of results with varying flow rates are generally consistent. Across all operating conditions, the experimental head values are slightly lower than the numerical predictions, with an average error within 3%. This discrepancy is primarily attributed to the empirical modeling of mechanical and volumetric losses in the simulations. Overall, the agreement confirms the reasonable accuracy of the employed flow field numerical methods.
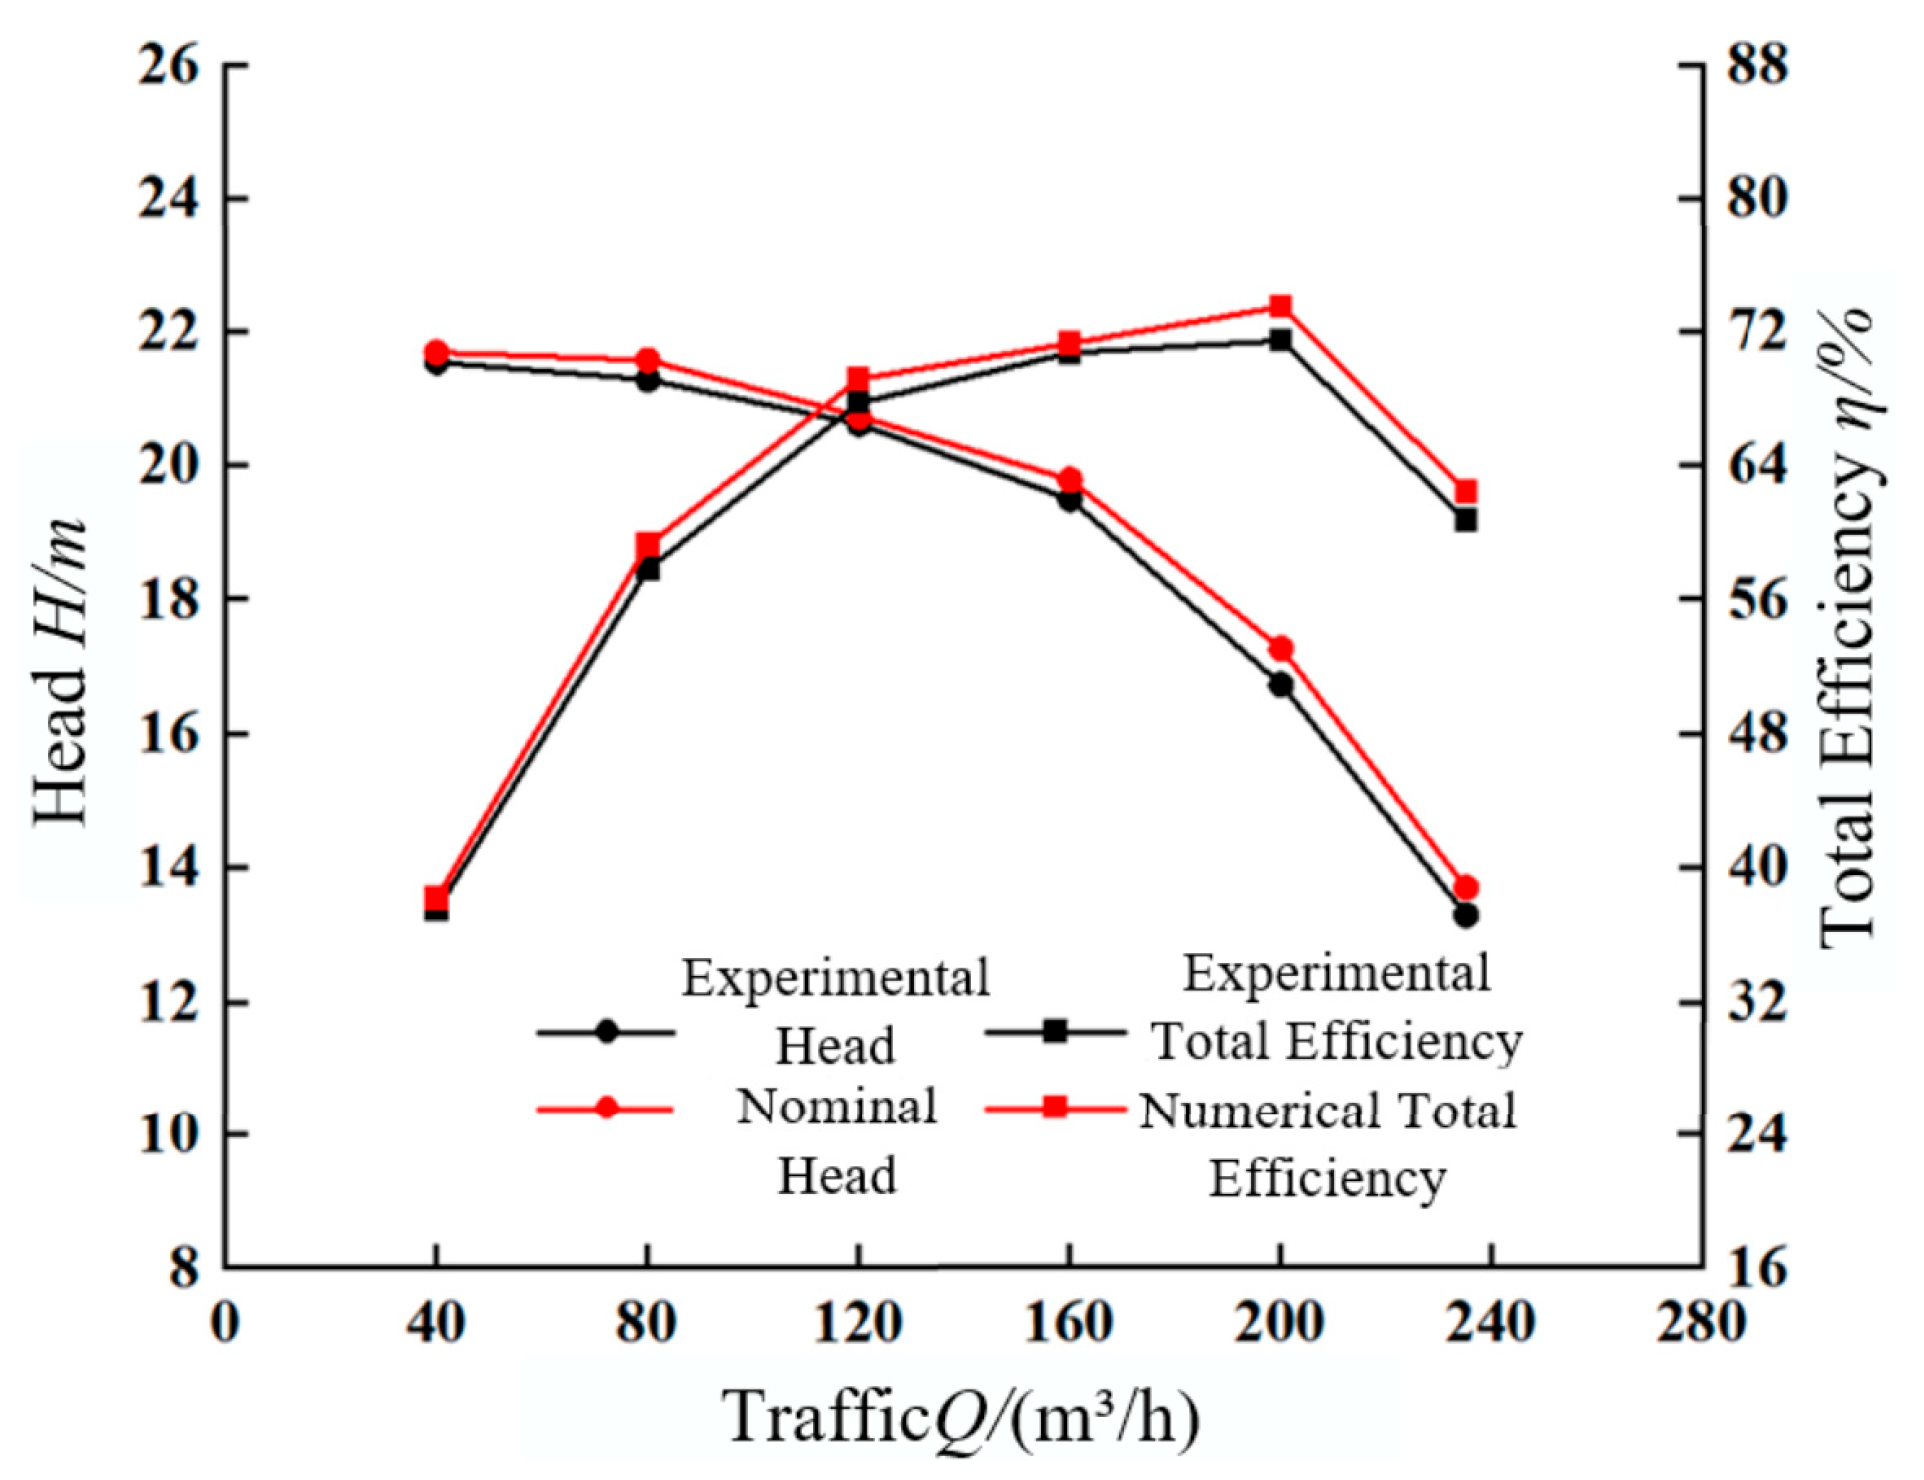
Figure 8: Comparison of numerical values and experimental results for the hydraulic performance curve of the model pump.
Fig. 9 compares the numerical and experimental results for the flow-induced noise at the acoustic monitoring point under the rated condition. The experimentally measured sound pressure level (SPL) spectrum of the centrifugal pump noise exhibits broadband fluctuations in the mid-to-high-frequency range (above 200 Hz), while distinct peaks are observed in the low-frequency range. The numerically predicted SPL trends for both the impeller-induced and volute-induced noise in the mid-to-high-frequency range align generally well with the experimental data, with deviations controlled within ±5 dB, demonstrating satisfactory predictive accuracy. The numerical predictions deviate substantially from the experimental results in the low-frequency range, which is mainly attributed to the local acoustic environment of the test rig. Owing to spatial constraints, the outlet hydrophone had to be installed in the vicinity of a pipe bend. This specific location can induce complex secondary flows, vortex shedding, and strong acoustic reflections, which markedly elevate the measured low-frequency background noise. These effects were not included in the numerical model, leading to the larger discrepancy. Given the high computational cost, the quantitative validation of the numerical model was therefore explicitly limited to frequencies above 200 Hz. For frequencies below 200 Hz, the numerical results are used only to indicate qualitative trends and are not adopted as quantitative criteria for assessing optimization performance.
Furthermore, it is evident that the SPL of the volute-induced noise is significantly higher than that of the impeller-induced noise across the entire frequency spectrum and aligns more closely with the experimental results. This identifies the volute as the dominant noise source for the model pump.
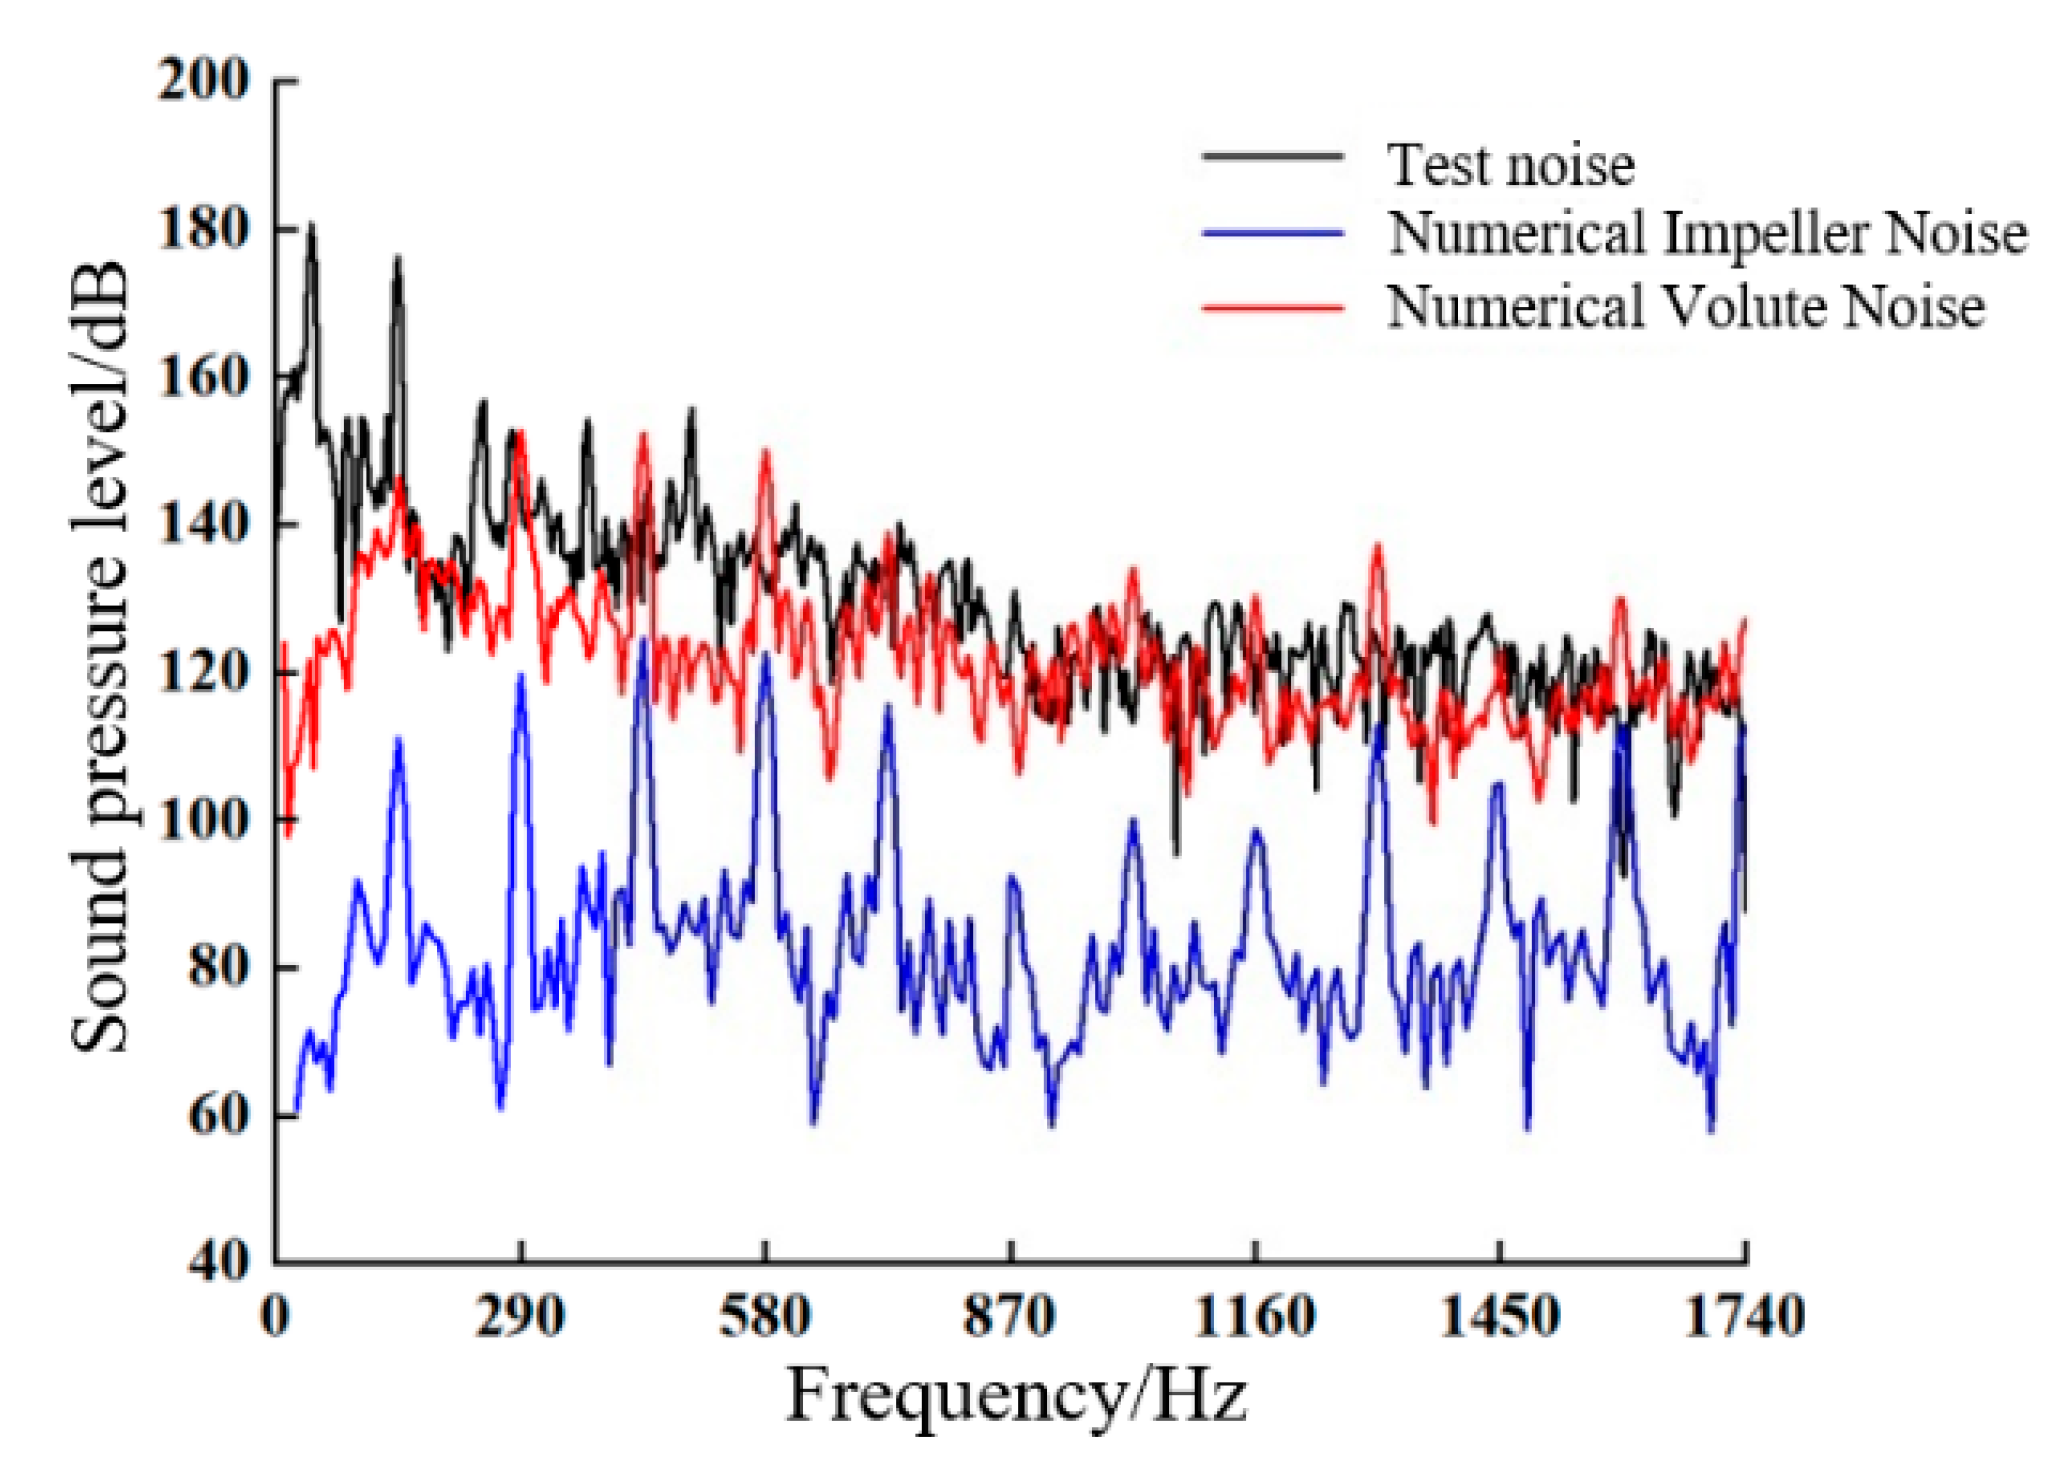
Figure 9: Comparison of numerical results for flow-induced noise of the s-position model pump at rated conditions with experimental noise results.
A source analysis was conducted based on the FW–H equation. Under the rated operating condition, the extracted contributions of the impeller and volute at monitoring point S indicate that, due to strong rotor–stator interaction, the volute-induced noise exhibits linear sound pressure levels (SPL) at the blade passing frequency (BPF) and its harmonics that are more than 25 dB higher than those of the impeller source (a difference of 32.3 dB at the first BPF). According to the acoustic superposition principle, when the difference in sound level exceeds 15 dB, the contribution of the weaker source to the overall sound pressure level can be neglected. To ensure physical consistency, all acoustic results in this study were evaluated using A-weighted sound pressure level (P0 = 1μPa). Although the impeller noise objectively contributes to certain high-frequency broadband components, the volute source remains overwhelmingly dominant within the BPF-dominated characteristic frequency bands. Therefore, concentrating the optimization weighting on volute noise not only targets the primary acoustic driver with high fidelity, but also markedly improves computational convergence efficiency in the multi-objective optimization.
Numerical simulations of the flow and acoustic fields were conducted for all experimental schemes listed in Table 3 under the rated condition. Given that the frequency response curve of the volute noise exhibits distinct discrete noise characteristics periodic at the blade passing frequency, the overall SPL was calculated using the superposition method outlined in Eq. (6).
LP—Total sound pressure level after superposition;
n—Frequency Overlay Count;
LPi—Sound pressure level amplitude at frequency and harmonic points.
The calculation results are summarized in Table 5. A preliminary analysis of the data confirms the consistency with the findings presented in Fig. 9: the SPL of the volute-induced noise is substantially higher than that of the impeller-induced noise, indicating its dominant role. According to the SPL superposition principle, when the difference between two SPLs exceeds 15 dB, the contribution of the quieter source to the total sound level becomes negligible [27]. Consequently, the multi-objective optimization considers only three key indicators: head, efficiency, and the SPL of the volute-induced noise. The noise metric in this study is the A-weighted sound pressure level (dBA), with the reference sound pressure in water taken as P0 = 1μPa.
Table 5: Numerical calculation results for the model pump under each scenario.
| Solution | Head H/m | Efficiency η/% | Impeller Noise/dBA | Volute-Induced Noise/dBA |
|---|---|---|---|---|
| 1 | 17.3 | 73.8 | 131.9 | 161.3 |
| 2 | 17.3 | 73.6 | 132.2 | 149.6 |
| 3 | 17.3 | 74.4 | 143.3 | 154.9 |
| 4 | 17.2 | 76.6 | 136.4 | 149.5 |
| 5 | 17.1 | 72.9 | 134.2 | 164.7 |
| 6 | 17.2 | 73.4 | 140.7 | 154.0 |
| 7 | 17.2 | 73.3 | 144.1 | 169.2 |
| 8 | 16.6 | 69.0 | 151.2 | 155.1 |
| 9 | 17.2 | 73.3 | 145.9 | 166.1 |
| Original model | 17.3 | 73.5 | 145.3 | 151.4 |
A range analysis was performed on the results in Table 5, with the outcomes detailed in Table 6. Here, K1, K2, and K3 represent the sums of the experimental indicators for the same factor level, while k1, k2, and k3 denote the average values of the indicator for that specific factor level. The range R reflects the magnitude of the indicator’s variation across the levels of a factor. A larger R value signifies a greater influence of the factor on the indicator, and vice versa.
Table 6: Range analysis.
| (a) Head Variation Analysis | ||||
| Parameters | Head H/m | |||
| A/Z | B/h | C/λ | D/α | |
| 51.89 | 51.72 | 51.63 | 51.09 | |
| 51.53 | 50.95 | 51.65 | 51.63 | |
| 50.92 | 51.67 | 51.06 | 51.62 | |
| 17.30 | 17.24 | 17.21 | 17.03 | |
| 17.18 | 16.98 | 17.22 | 17.21 | |
| 16.97 | 17.22 | 17.02 | 17.20 | |
| R | 0.33 | 0.26 | 0.20 | 0.18 |
| (b) Analysis of Extremely Low Efficiency | ||||
| Parameters | Efficiency η/% | |||
| A/Z | B/h | C/λ | D/α | |
| 221.83 | 220.55 | 219.96 | 216.30 | |
| 219.65 | 215.52 | 220.38 | 220.28 | |
| 215.64 | 221.05 | 216.78 | 220.54 | |
| 73.94 | 73.52 | 73.32 | 72.10 | |
| 73.22 | 71.84 | 73.46 | 73.43 | |
| 71.88 | 73.68 | 72.26 | 73.51 | |
| R | 2.06 | 1.84 | 1.2 | 1.41 |
| (C) Housing-Induced Noise Performance Analysis | ||||
| Parameters | Volute-Induced Noise/dBA | |||
| A/Z | B/h | C/λ | D/α | |
| 465.8 | 480.0 | 492.1 | 470.4 | |
| 468.2 | 469.4 | 472.8 | 465.2 | |
| 490.4 | 475.0 | 459.5 | 488.8 | |
| 155.3 | 160.0 | 164.0 | 156.8 | |
| 156.1 | 156.5 | 157.6 | 155.1 | |
| 163.5 | 158.3 | 153.2 | 162.9 | |
| R | 8.2 | 3.5 | 10.8 | 7.8 |
As evidenced in Table 6, the degree of influence of each factor’s level variation on the hydraulic and acoustic performance of the model pump differs. The primary-to-secondary order of factors affecting head is: A > B > C > D. For efficiency, the order is: A > B > D > C. Regarding volute-induced noise, the influencing factors follow the order: C > A > D > B.
The analysis of variance (ANOVA; Table 7) shows that the influence patterns of each factor on performance are in close agreement with those indicated by the range analysis. In terms of hydraulic performance, the tooth number Z contributes more than 34% to both head and efficiency, confirming it as the dominant factor governing energy-conversion effectiveness. For acoustic performance, the bottom width λ exhibits the largest contribution (42.47%), strongly indicating that optimizing this biomimetic geometric parameter is a key strategy for suppressing volute-induced noise. This quantitative distribution of contribution ratios effectively rules out the possibility that random numerical noise—such as sampling-induced variability or residual oscillations in the unsteady simulations—has distorted the observed optimization trends. From a statistical standpoint, it supports the soundness of the experimental design and the credibility of the results.
Table 7: Analysis of Variance (ANOVA) Table for Hydraulic and Acoustic Performance.
| Performance Index | Source (Factor) | Sum of Squares (SS) | Mean Square (MS) | Contribution Rate (%) | Rank |
|---|---|---|---|---|---|
| Head H | A (No. of blades Z) | 0.1656 | 0.0828 | 38.57% | 1 |
| B (Serration height h) | 0.1260 | 0.0630 | 29.35% | 2 | |
| C (Bottom width λ) | 0.0762 | 0.0381 | 17.75% | 3 | |
| D (Base angle α) | 0.0615 | 0.0308 | 14.33% | 4 | |
| Efficiency η | A (No. of blades Z) | 6.56 | 3.28 | 34.02% | 1 |
| B (Serration height h) | 6.38 | 3.19 | 33.09% | 2 | |
| D (Base angle α) | 3.76 | 1.88 | 19.50% | 3 | |
| C (Bottom width λ) | 2.58 | 1.29 | 13.38% | 4 | |
| Volute-induced noise | C (Bottom width λ) | 178.5 | 89.25 | 42.47% | 1 |
| A (No. of blades Z) | 122.6 | 61.30 | 29.17% | 2 | |
| D (Base angle α) | 100.8 | 50.40 | 23.98% | 3 | |
| B (Serration height h) | 18.4 | 9.20 | 4.38% | 4 |
To examine the variation trends of the experimental indicators with factor levels, relationship curves were plotted with factor levels on the horizontal axis and indicator values on the vertical axis, as shown in Fig. 10.
For hydraulic performance, higher values of head and efficiency are desirable. From Fig. 10a,b, the influences of the number of serrations (Z), serration height (h), and base length (λ) on both head and efficiency generally follow similar trends: both head and efficiency decrease with an increasing number of serrations (Z); they first decrease and then increase with increasing serration height (h); and they first increase and then decrease with longer base lengths (λ). In contrast, as the base angle (α) increases, head initially rises and then falls, whereas efficiency shows a gradual increasing trend. The optimal level combination for maximizing head is A1B1C2D2, corresponding to Z = 4, h = 2 mm, λ = 5 mm, and α = 71.6°. The optimal combination for maximizing efficiency is A1B3C2D3, corresponding to Z = 4, h = 4 mm, λ = 5, and α = 76°.
For acoustic performance, a lower indicator value signifies better performance. Fig. 10c reveals that the volute-induced noise varies consistently with serration height (h) and base angle (α), showing an initial decrease followed by an increase. The noise increases progressively with a greater number of serrations (Z), but decreases gradually with a longer base length (λ). The optimal level combination for minimizing noise is A1B2C3D2, corresponding to Z = 4, h = 3 mm, λ = 6 mm, and α = 71.6°.
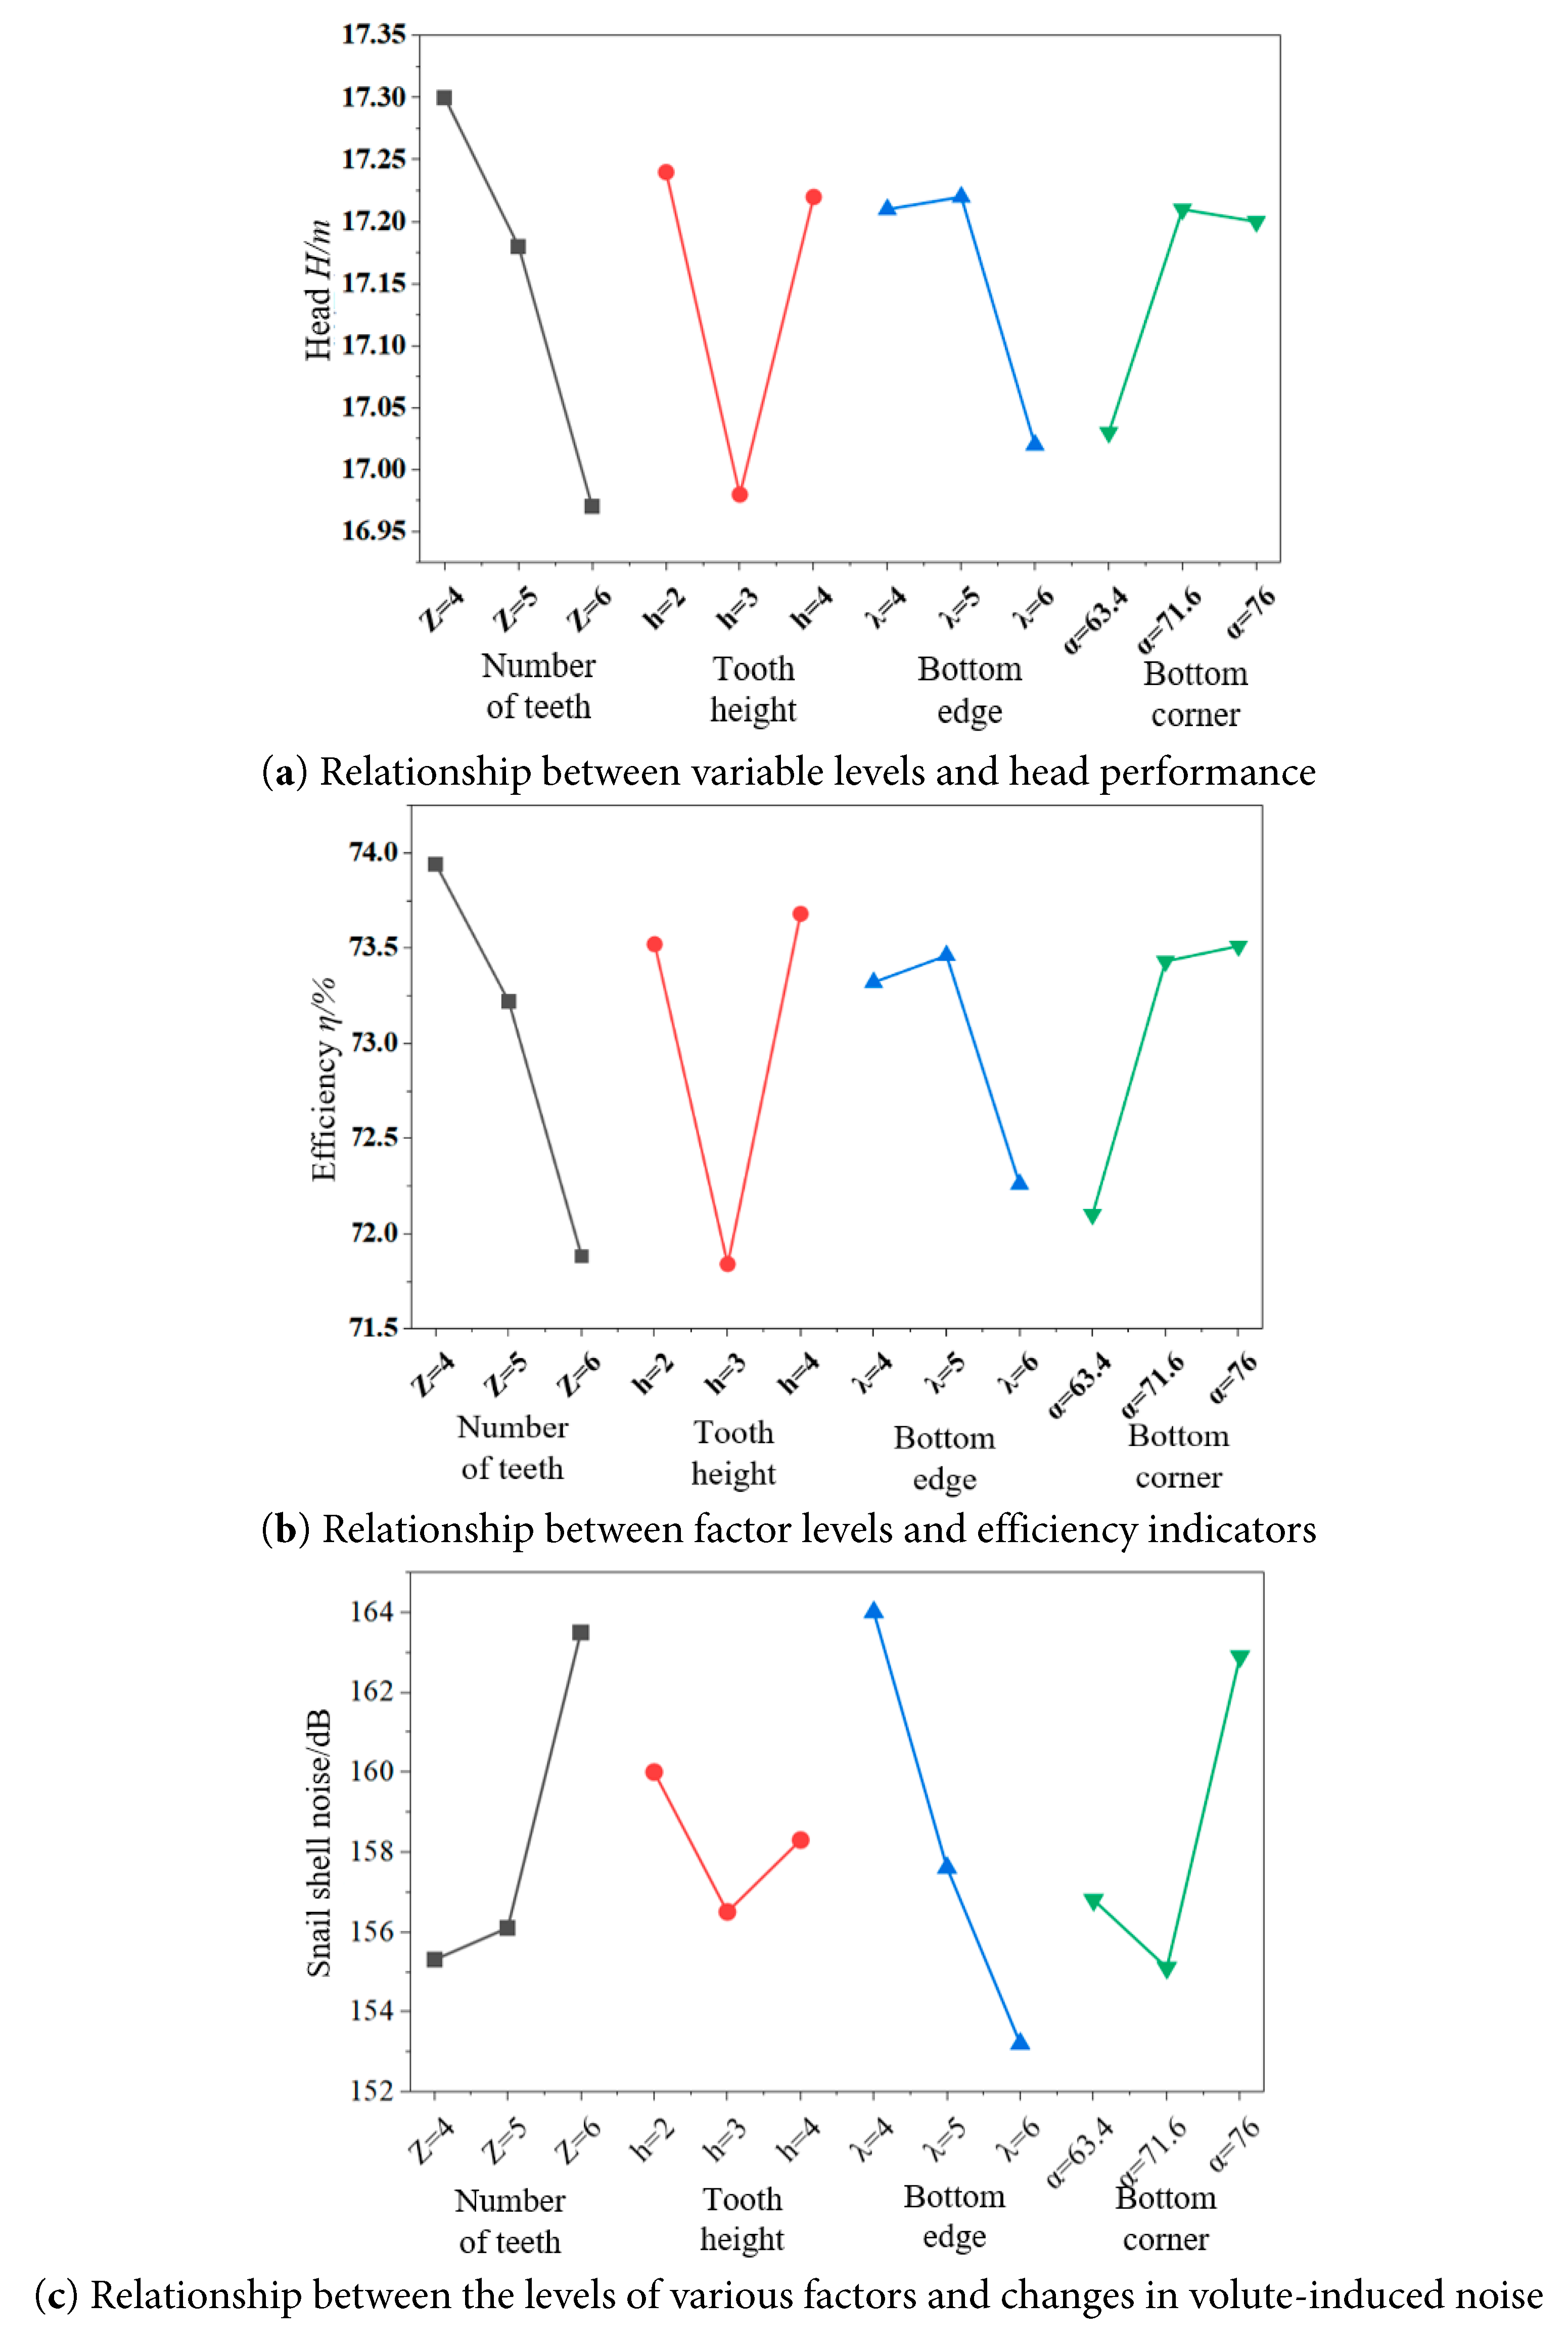
Figure 10: Relationship between factor levels and experimental indicators (a)–(c).
4.3 Comprehensive Performance Optimization
The optimal scheme for overall performance, balancing both hydraulic and acoustic objectives, was determined using the weight matrix analysis method. Eqs. (1)–(4) were applied to calculate the weight matrix for the three evaluation indicators: head, efficiency, and volute-induced noise. For head and efficiency, where higher values are better,
Table 8: Worked example of the matrix-analysis method (calculation case).
| Z | Mean Volute Noise at Each Level KZ,j | 1/KZ,j |
|---|---|---|
| 4 | KZ,1 = 155.3 dBA | 0.006439 |
| 5 | KZ,2 = 156.1 dBA | 0.006406 |
| 6 | KZ,3 = 163.5 dBA | 0.006116 |
The sum of the reciprocals is 0.018961; therefore, the acoustic evaluation score for Z = 4 is: 0.006439/0.018961 × 100 ≈ 33.96. By combining the contributions of factor Z to head and efficiency with its range-based weight R, the final composite weight for Z = 4 was obtained via matrix superposition as 10.44, The complete results are summarized in Table 9.
Table 9: Calculation results of power matrix.
| Factor Level | | |||
|---|---|---|---|---|
| /(×10−2) | /(×10−2) | /(×10−2) | /(×10−2) | |
| Z = 4 | 11.44 | 10.68 | 9.19 | 10.44 |
| Z = 5 | 11.36 | 10.58 | 9.14 | 10.36 |
| Z = 6 | 11.22 | 10.38 | 8.73 | 10.11 |
| h = 2 | 8.98 | 9.49 | 3.81 | 7.43 |
| h = 3 | 8.85 | 9.27 | 3.89 | 7.34 |
| h = 4 | 8.97 | 9.51 | 3.85 | 7.44 |
| λ = 4 | 6.89 | 6.17 | 11.46 | 8.17 |
| λ = 5 | 6.90 | 6.18 | 11.92 | 8.33 |
| λ = 6 | 6.82 | 6.08 | 12.26 | 8.39 |
| | 6.14 | 7.13 | 8.66 | 7.31 |
| | 6.21 | 7.26 | 8.75 | 7.41 |
| | 6.20 | 7.27 | 8.33 | 7.27 |
Analysis of the data in Table 9 indicates that the primary-to-secondary order of factors affecting the comprehensive performance is: Number of Serrations Z > Base Length λ > Serration Height h > Base Angle α. Across the three evaluation dimensions, the tooth number Z exhibits pronounced optimization consistency. At Z = 4, the composite weight reaches 10.44, establishing this level as the baseline for the overall optimal design. For the bottom-width parameter λ, which exhibits performance trade-offs, the weight-matrix method clearly differentiates its contributions across dimensions. It is highly beneficial for noise reduction (score: 12.26) and causes only a slight penalty in efficiency (score: 6.08). Based on the overall weighted assessment, λ = 6 mm is identified as the optimal compromise that balances the competing performance objectives. Consequently, the optimal scheme for comprehensive performance is identified as A1B3C3D2. This corresponds to: Number of Serrations Z = 4, Serration Height h = 4 mm, Base Length λ = 6 mm, and Base Angle α = 71.6°. A mathematical weighting approach was employed to achieve a dynamic balance in the multi-objective design. By selecting Z = 4 and λ = 6 mm, the core noise-reduction benefit were secured, while h = 4 mm was used to compensate for hydraulic efficiency. As a result, a balanced trade-off between acoustic performance and hydraulic characteristics was achieved, supported by both statistical assessment and the underlying physical mechanisms.
An supplementary validation simulation was performed for the combination A1B3C3D3 identified by the weight-matrix method. The results indicate that this case achieves a head of 17.3 m, an efficiency of 74.4%, and an overall sound pressure level of 154.9 dBA. The overall optimal scheme performs better across all three metrics simultaneously. This confirmation run therefore supports the effectiveness of the orthogonal experimental design and demonstrates the repeatability of the numerical results.
5 Optimization Verification and Analysis
5.1 Overall Performance Characteristics
Fig. 11 presents a comparative analysis of the hydraulic and acoustic performance of the model pump before and after optimization. As illustrated in Fig. 11a, the optimized pump demonstrates an increased head, with the degree of improvement rising alongside the flow rate. Furthermore, efficiency is markedly enhanced across all operating conditions, accompanied by a broader high-efficiency operating range. Hd denotes the design head obtained from the initial semi-empirical/semi-theoretical method. However, due to the inherent in the conventional design approach, subsequent numerical simulations and experiments indicate that the pump’s actual head at the rated operating condition is approximately 17.3 m. Accordingly, the baseline model (H = 17.3 m, η = 73.5%) was used for comparison. Relative to this baseline, the head increased by 0.5 m and improves the efficiency from 73.5% to 78.4% (Table 10). The full-operating-range assessment indicates that performance is improved across all conditions, with no evident drop in efficiency or head. Moreover, no overall increase in SPL is observed within the tested frequency band. These results suggest that the noise reduction is not achieved at the expense of hydraulic performance; instead, a synergistic hydraulic–acoustic optimization is realized. Fig. 11b reveals that the characteristic curve of the volute-induced noise exhibits a “first decrease, then increase” trend with increasing flow rate. Following optimization, the level of volute-induced noise is significantly reduced under all operating conditions. At the rated condition, a reduction of 5.0 dBA is achieved. These results substantiate that the serrated bionic tongue design successfully accomplishes the dual objective of enhancing the hydraulic performance of the centrifugal pump while effectively mitigating flow-induced noise.
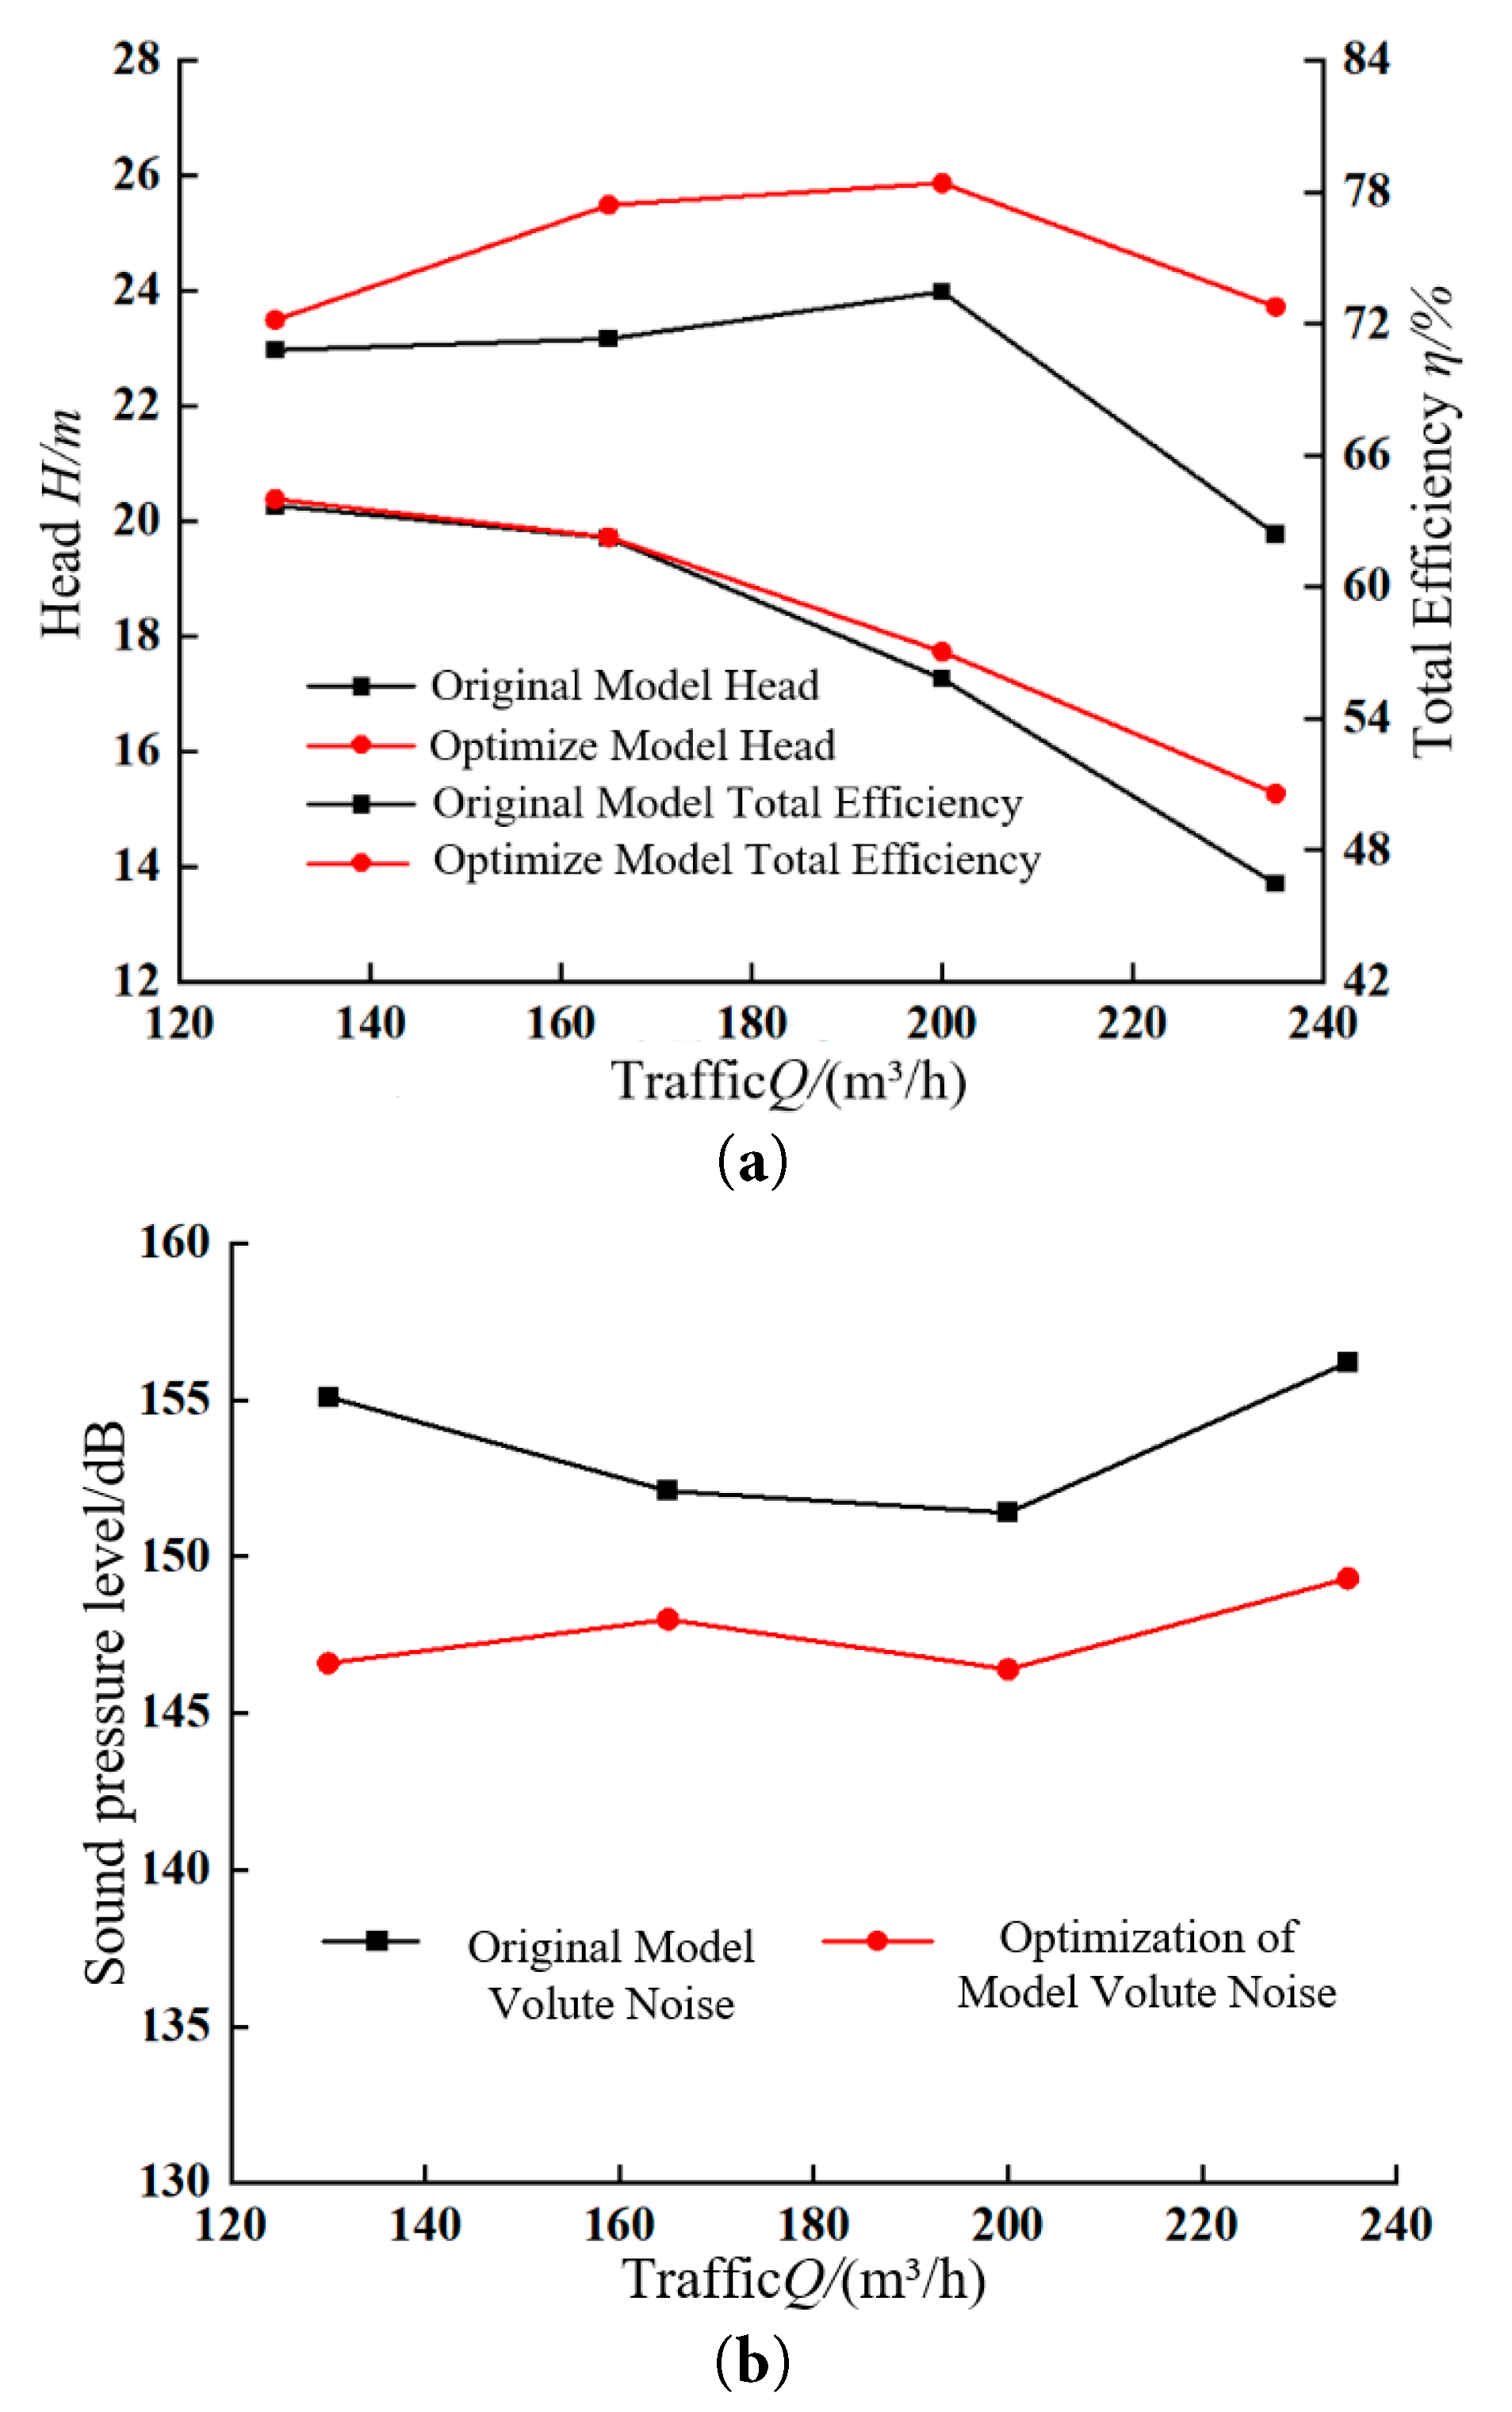
Figure 11: Comparison of (a) hydraulic and (b) acoustic performance of model pumps before and after optimization.
Table 10: Performance comparison before and after optimization at the rated operating condition.
| Model Type | Head H/m | Efficiency η/% | Volute-Induced Noise/dBA |
|---|---|---|---|
| Original Model | 17.3 | 73.5 | 151.4 |
| Optimization Model | 17.7 | 78.4 | 146.4 |
5.2 Flow Field and Acoustic Field Analysis
Fig. 12 displays comparative streamline plots of the internal flow field at the rated condition. The original model exhibits distinctly irregular streamlines and large-scale vortex structures near the junction of the tongue and the impeller outlet. The streamlines display an asymmetric distribution, biased towards the volute side wall. In contrast, the optimized model shows smoother streamlines, with vortex structures nearly eliminated in the tongue region and a significant improvement in the circumferential symmetry of the flow pattern. This improvement is attributed to the fact that the original model’s smooth, curved tongue profile readily promotes kinetic energy loss within the boundary layer, triggering flow separation. The grooved features of the serrations, however, facilitate lateral momentum exchange within the boundary layer, suppress the generation of separation vortices, and break down large-scale vortices into smaller structures, thereby reducing their disturbance to the main flow.
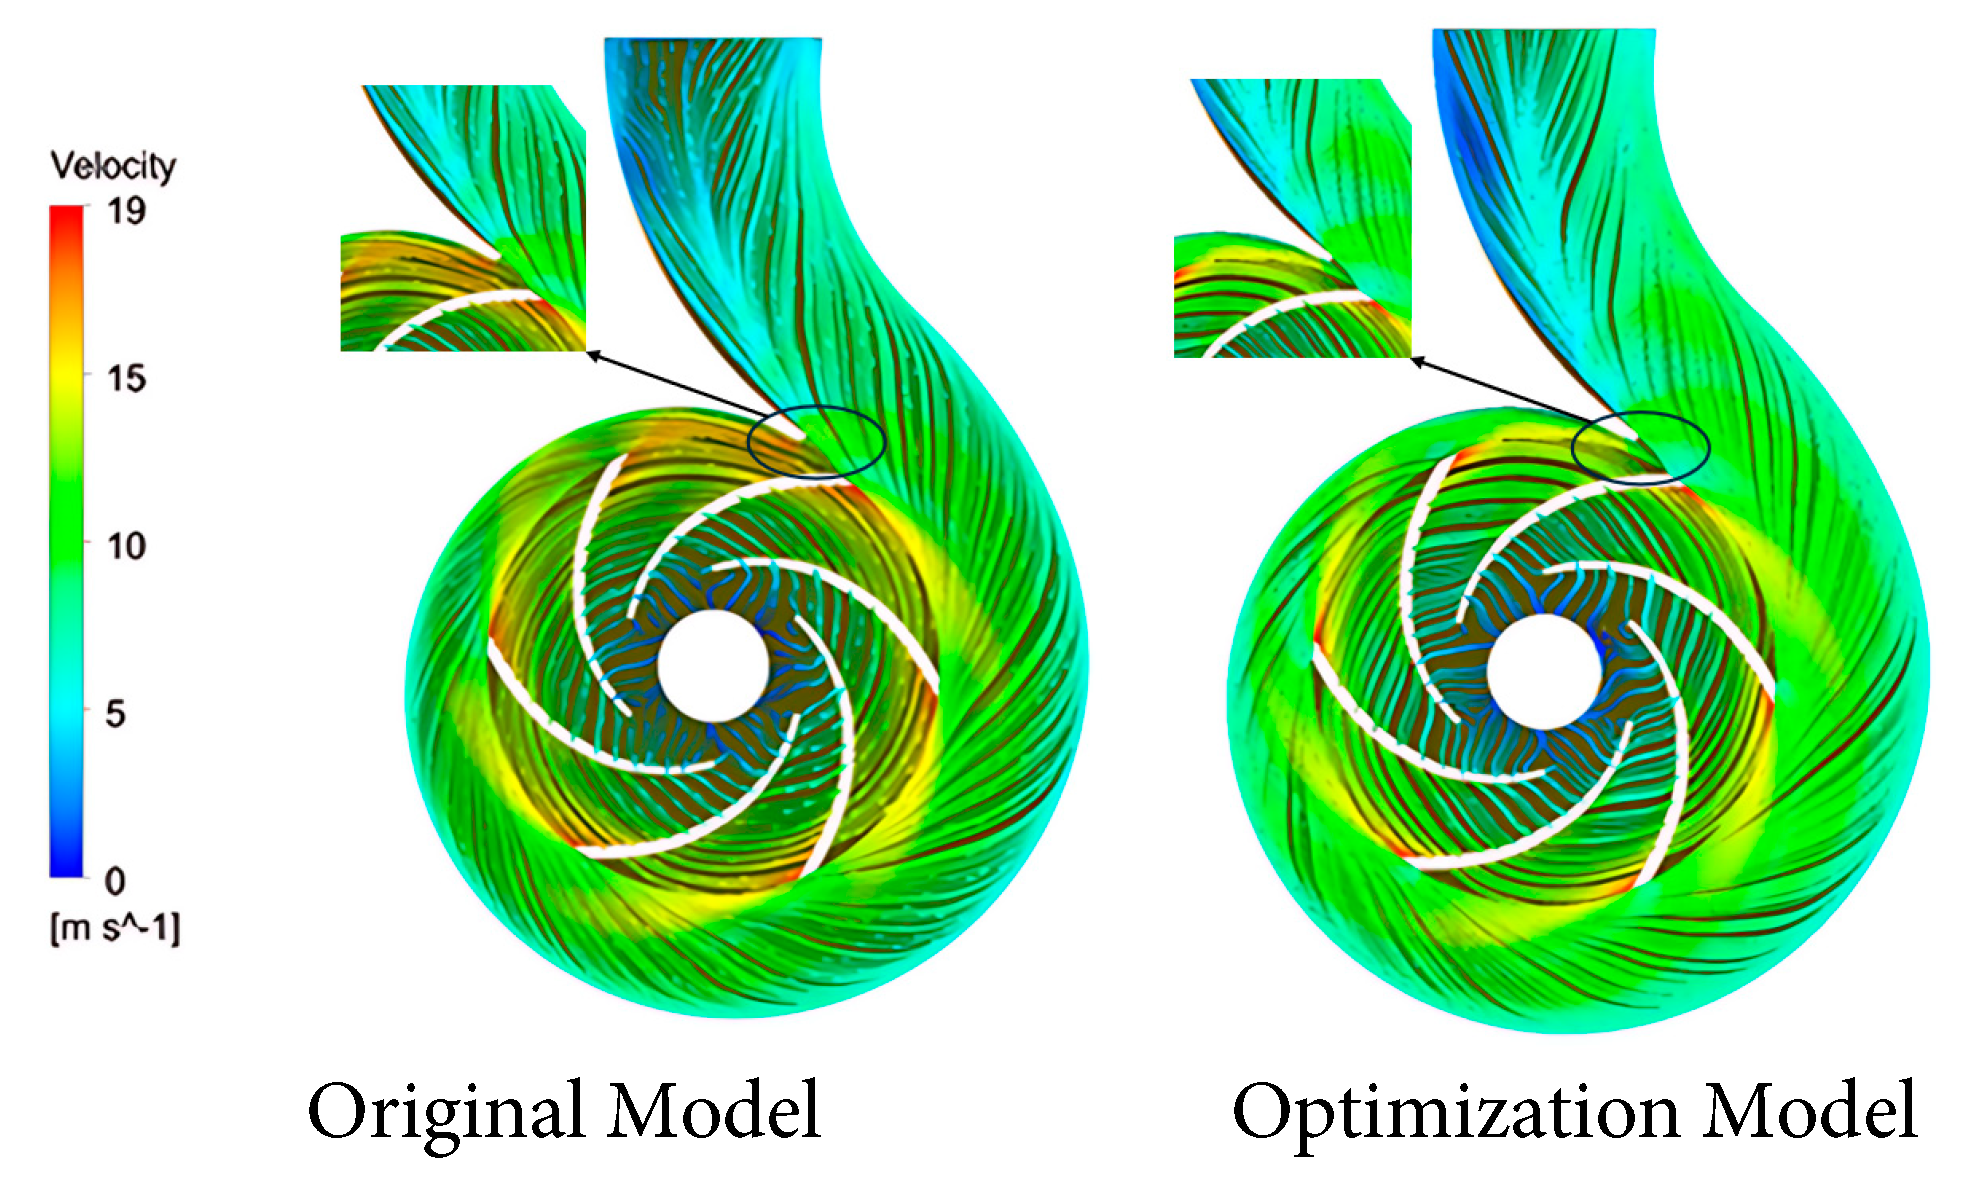
Figure 12: Comparison of internal velocity streamlines in the pump under rated conditions.
Fig. 13 presents contour plots of velocity on the impeller-volute interface at the rated condition, comparing the original and optimized designs. The original model shows a periodic alternation of high and low velocities across different impeller channels, with pronounced velocity gradients in localized regions. Post-optimization, the velocity distribution becomes more uniform, and the velocity gradients are significantly reduced. This is because the serrated tongue modulates the mainstream velocity distribution via small-scale flow structure adjustments, improving the matching between the impeller outlet jet-wake flow and the volute intake, thereby reducing impact losses. Concurrently, the groove structures of the serrations diminish the accumulation of vorticity at the interface, suppressing velocity fluctuations induced by rotor-stator interaction.
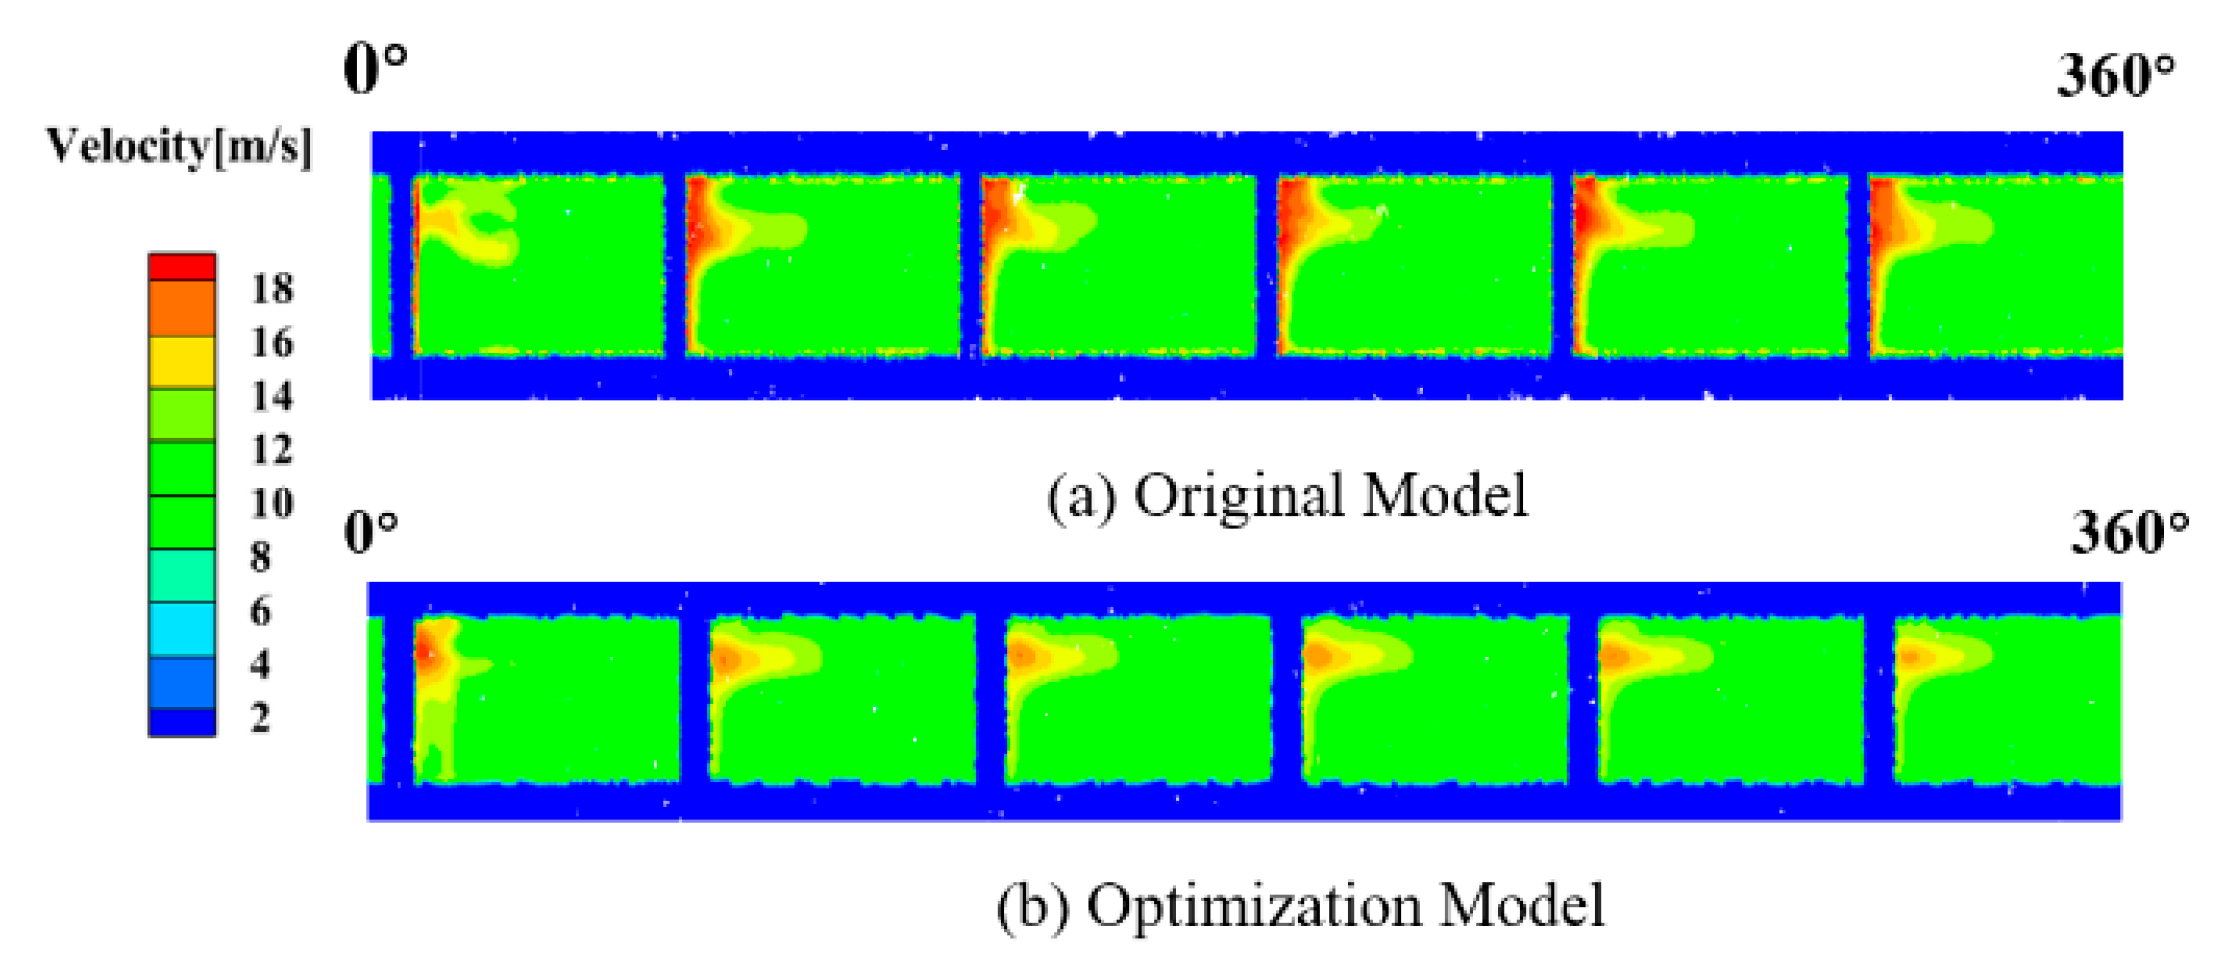
Figure 13: Velocity contour map of impeller-volute interface at rated conditions.
Under the same threshold (>18 m/s), the optimized biomimetic serrated configuration reduced the area fraction of the extremely extremely high-velocity region from 15.21% to 5.38%, corresponding to a 64.63% decrease. This quantitative improvement confirms that the serrations physically segment and break up the jet, thereby attenuating unsteady pressure pulsations at the source and providing a mechanistic explanation for the pronounced reduction in blade-passing-frequency (BPF) noise.
To quantitatively evaluate flow uniformity, a non-uniformity coefficient ζ was introduced. The analysis (Table 11) show that the baseline model exhibits a pronounced jet at the impeller outlet, with ζ = 0.241, With the biomimetic serrated structure, the high-speed jet is effectively fragmented, reducing ζ to 0.178, corresponding to a 26.1% reduction. This indicates a smoother flow-field distribution after optimization, corroborating the significant role of “flow-field reconstruction” in weakening the intensity of rotor–stator interaction.
Table 11: Quantitative comparison of flow uniformity at the impeller–volute interface.
| Model Type | High-Velocity Area Ratio (>18 m/s) | Velocity Standard Deviation δ (m/s) | Non-Uniformity Index ζ | Improvement Rate (Relative to Original) |
|---|---|---|---|---|
| Original Model | 15.21% | 3.42 | 0.241 | |
| Optimization Model | 5.38% | 2.41 | 0.178 | reduced by 26.1% |
Flow-induced noise, stemming from pressure pulsations, is closely related to the temporal instability of the pressure field. To intuitively analyze the unsteady pulsation characteristics of the pressure field, a statistical analysis method was employed to calculate the pressure pulsation intensity at each grid node (x, y, z) in the time domain. The periodic unsteady pressure at a grid node comprises two components: the time-averaged pressure component P and the periodic pressure component P̃, where P̃ represents the pressure variation over one impeller rotation cycle [28]. These components are defined as follows:
n′—Grid Node Sequence Number;
N′—Number of pressure samples per impeller rotation cycle;
t0—The starting moment of the rotation cycle.
The standard deviation of the normalized periodic pressure component P̃ is defined as the pressure pulsation intensity. The normalization is achieved by dividing the standard deviation by the dynamic head at the impeller outlet. The formula for pressure pulsation intensity is:
C*P—Pressure pulsation intensity;
U2—Velocity at the impeller outlet;
ρ—Density.
Fig. 14 shows contour plots of the pressure pulsation intensity within the pump at the rated condition. It is evident that after optimization with the serrated bionic tongue, the pressure pulsation intensity in the region of the impeller-volute interface is significantly weakened compared to the original straight-edge tongue model. Fig. 14a reveals a distinct zone of high pulsation intensity near the tongue of the original model, which propagates along the direction of impeller rotation. After optimization, both the spatial extent and magnitude of this high-intensity zone are markedly reduced, and its distribution becomes more fragmented. Fig. 14b further demonstrates that the original model exhibits a sharp peak at the circumferential position corresponding to the tongue, along with high-pulsation bands extending in the rotation direction. Post-optimization, the peak intensity is lowered, the bands are narrower, and the pulsations are more subdued. Mechanistically, the ‘hard boundary’ of the original tongue causes a concentrated release of energy between the impeller outlet jet and the tongue, enhancing secondary flows within the impeller passages and intensifying pressure pulsations. In contrast, the serrated tongue increases the contact area via its groove structures, dispersing the jet energy into multiple smaller regions, reducing local energy concentration, and improving the flow field topology. Furthermore, the segmented structure of the serrations disrupts the synchronous periodic disturbance between the original tongue and the blades, mitigating the cumulative effect of blade-passing frequency pulsations.
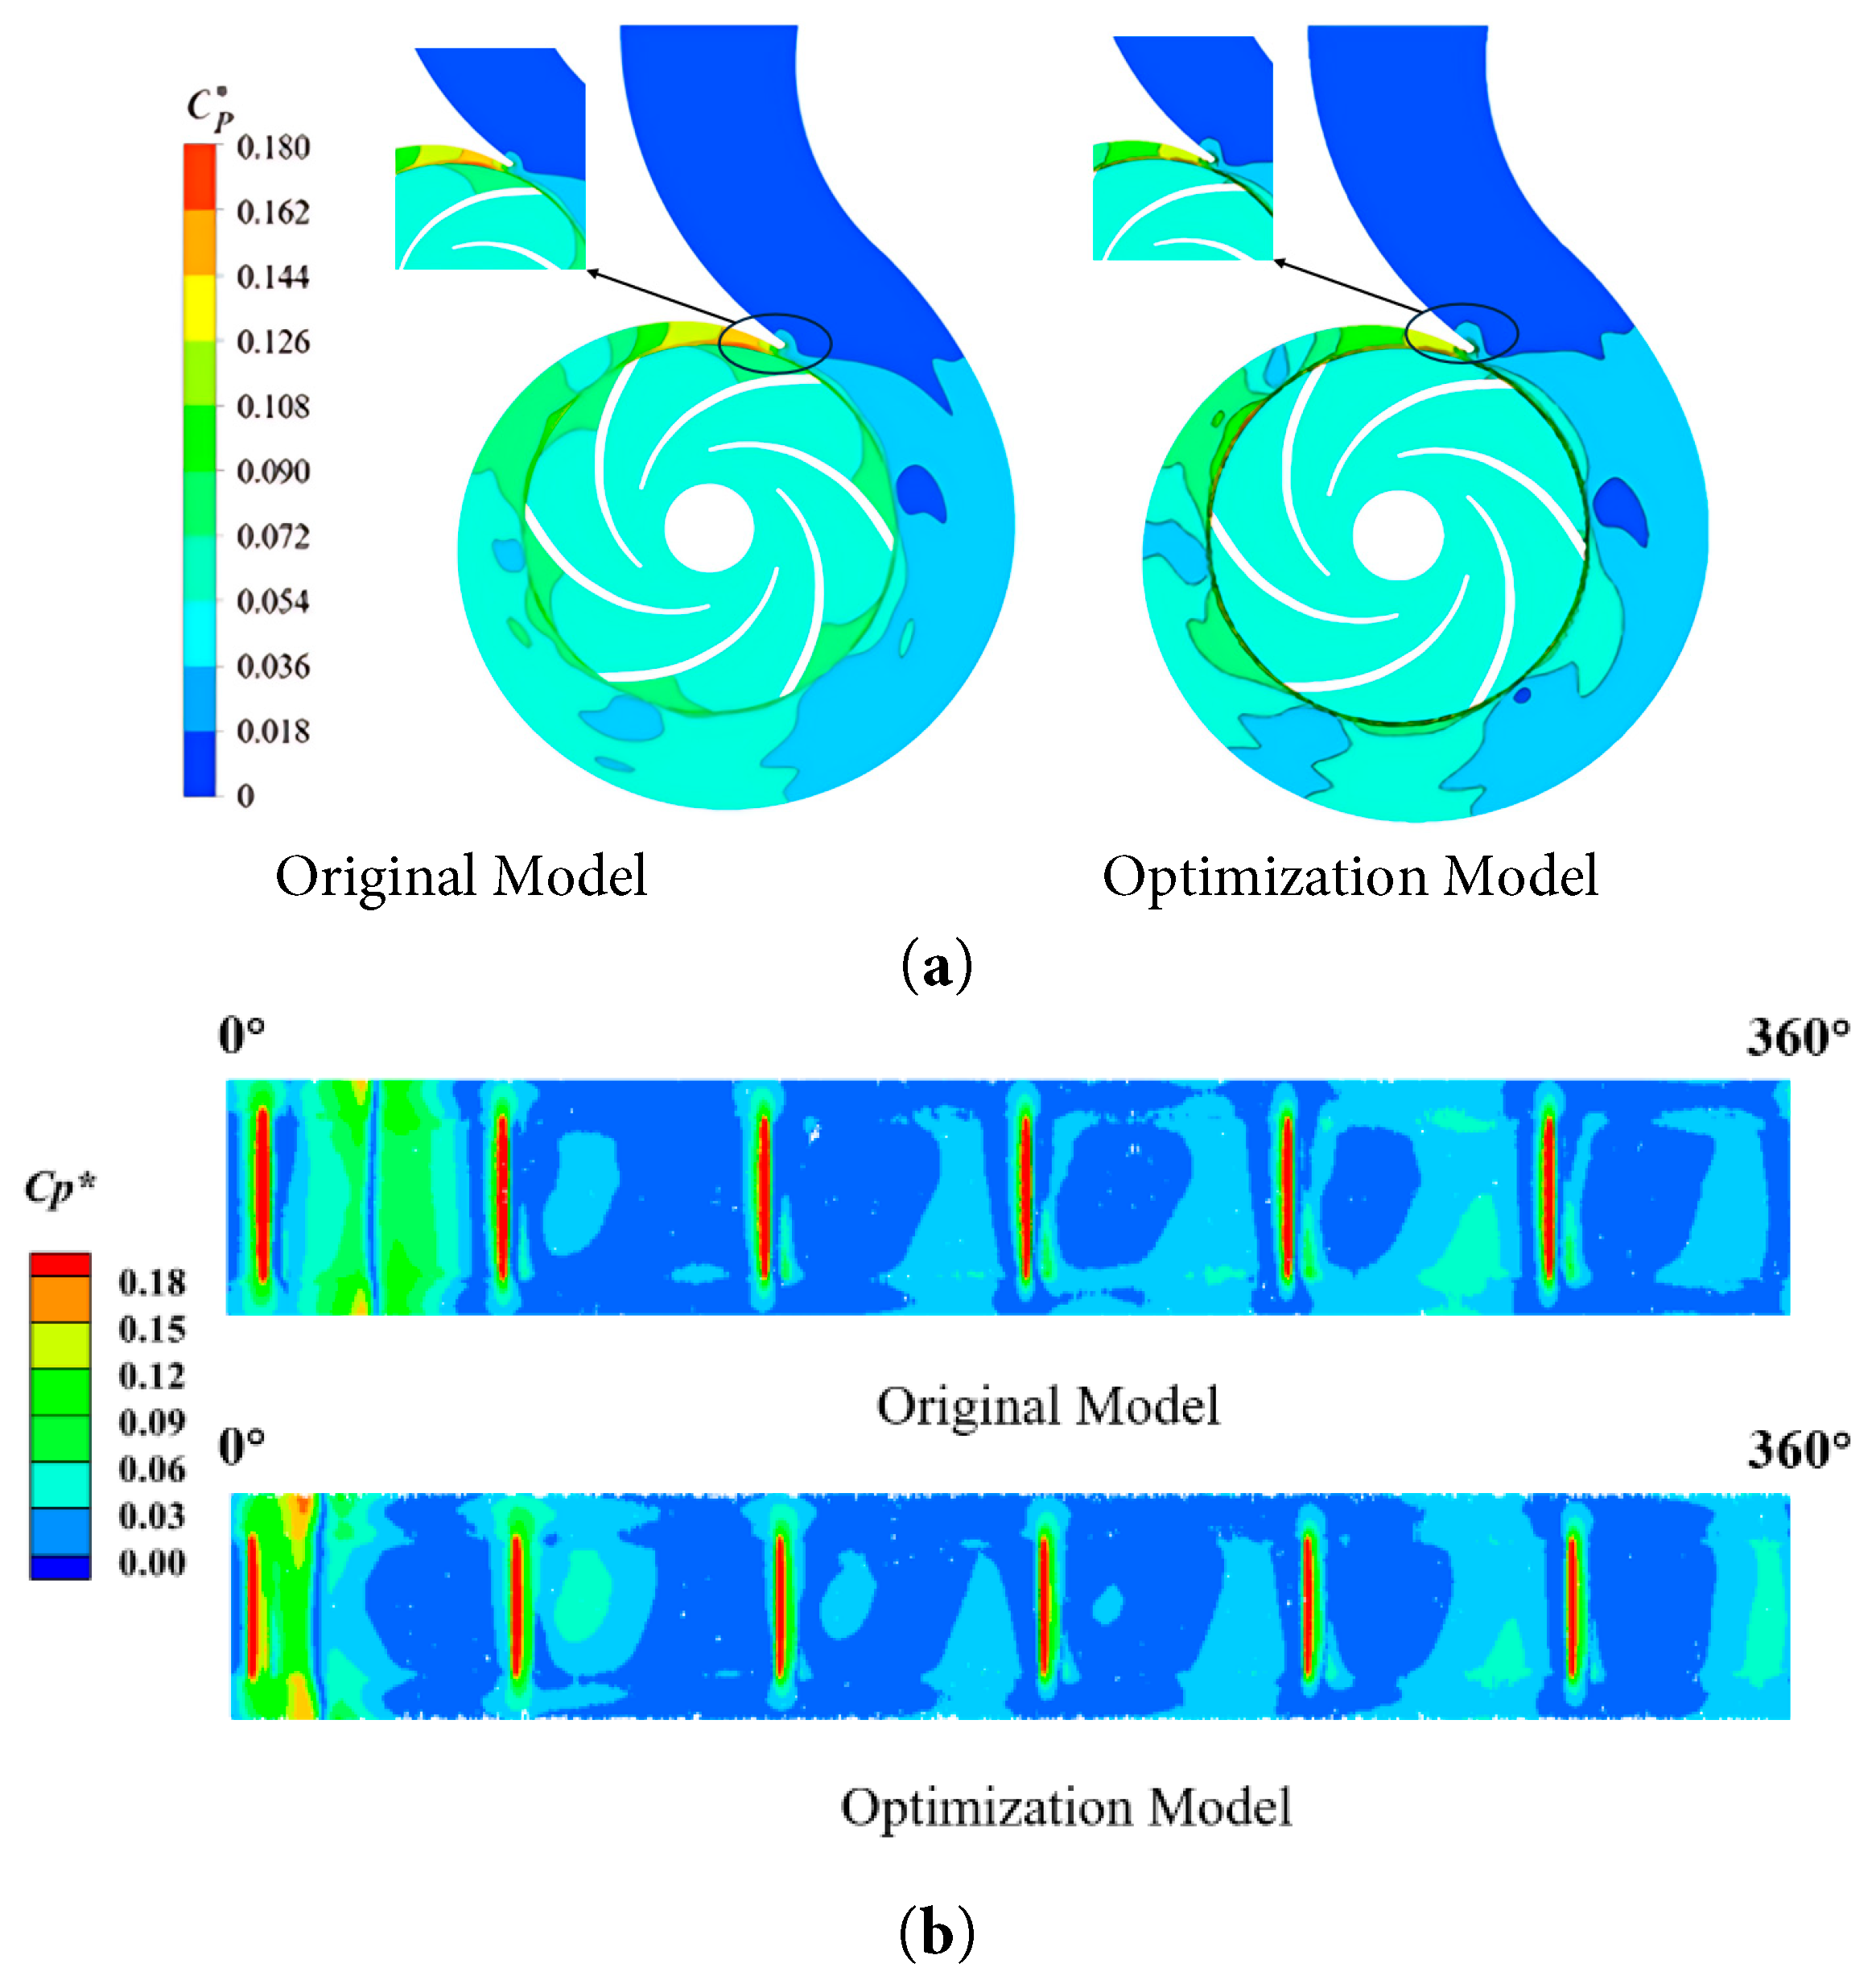
Figure 14: Pressure pulsation intensity contour map inside the pump at rated conditions, (a) axis-perpendicular plane, (b) involute profile of the impeller-volute interface.
Fig. 15 compares the frequency spectra of pressure pulsations at the tongue location before and after optimization under the rated condition. The serrated bionic tongue optimization significantly influences the frequency characteristics of the pressure pulsations. The spectrum of the original straight-edge tongue model is dominated by strong peaks at the blade passing frequency (BPF) and its distinct higher harmonics. After optimization, the pulsation amplitudes are substantially reduced, the higher harmonic components are nearly eliminated, the spectral distribution is smoother, and the overall pulsation energy density across the broadband frequency range is decreased. This indicates that the serrated structure disrupts the synchronous periodic disturbance between the tongue and the blades, The rotor–stator interaction induced by a conventional straight edge is highly time-synchronized, causing acoustic energy to be excessively concentrated at specific discrete frequencies. The serrated geometry redistributes the energy of pressure pulsations in the centrifugal pump from the concentrated blade passing frequency tones and their harmonics into a broader frequency range, effectively decomposing the instantaneous global impact into asynchronous local disturbances. This “de-synchronization” effect effectively disperses acoustic energy and reduces the amplitude of discrete-frequency pulsations.
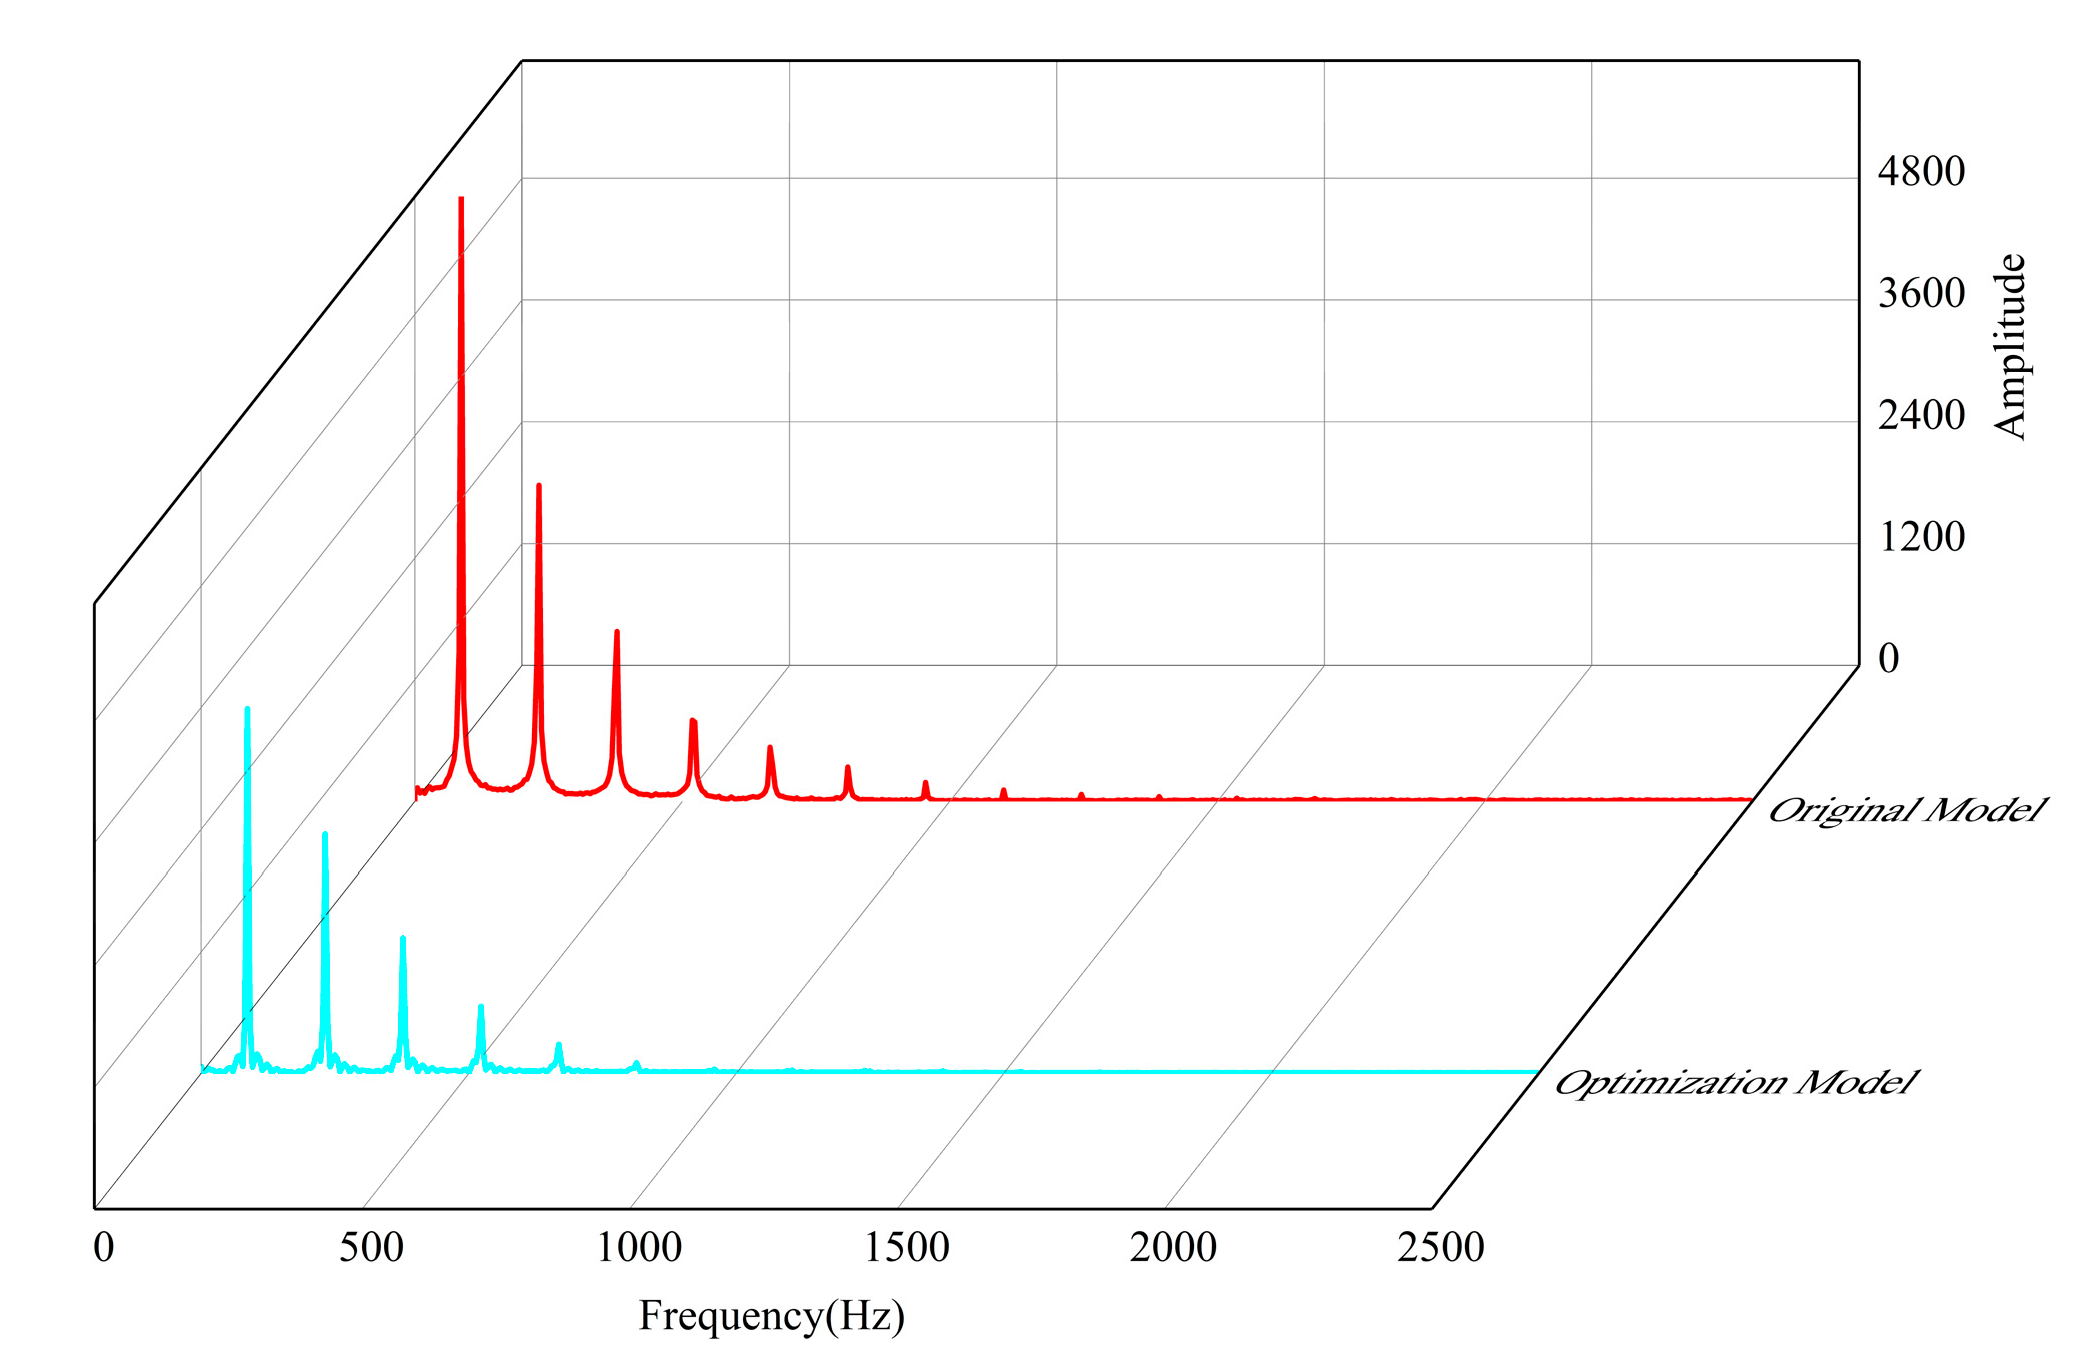
Figure 15: Comparison of pressure pulsation spectrum curves at the separator tongue before and after optimization under rated conditions.
To further quantify the attenuation of unsteady excitation sources, the dimensionless root-mean-square pressure fluctuation, RMS Cp*, was introduced. The calculation was based on the phase-averaged pressure and a dynamic-pressure reference (ρ = 1000 kg/m3, u2 = 19.7 m/s). The results indicate that (Table 12), owing to flow-field reconstruction induced by the biomimetic serrated structure, the pressure-pulsation intensity at monitoring points in the volute tongue region is substantially reduced. Specifically, RMS Cp* decreases from 0.06469 to 0.04918, corresponding to a 23.98% reduction. These quantitative results provide strong evidence that the excitation energy is dissipated at the source, thereby explaining the physical mechanism behind the pronounced reduction in far-field sound pressure level (SPL).
Table 12: Quantitative comparison of pressure pulsation at the separator tongue before and after optimization under rated conditions.
| Model Type | Pressure Standard Deviation δp (Pa) | Non-Dimensional Coefficient RMS Cp* | Reduction Rate |
|---|---|---|---|
| Original Model | 12,552.37 | 0.06469 | |
| Optimized Model | 9542.20 | 0.04918 | −23.98% |
Fig. 16 compares the sound pressure level spectra of the volute-induced noise at the acoustic monitoring point before and after optimization under the rated condition. The improvement in the centrifugal pump’s noise characteristics achieved by the serrated bionic tongue optimization is significant and highly consistent with the conclusions drawn from the pressure pulsation analysis. The original model exhibits sharp discrete noise peaks at the BPF and its harmonics. After optimization, the SPL is noticeably reduced in the low-frequency range and at the BPF, the harmonic peaks are essentially absent, and the spectral distribution is flatter. This demonstrates that the serrated tongue, by altering the rotor-stator interaction pattern and reducing the generation and accumulation of large-scale vortices, effectively attenuates both the discrete and broadband noise of the pump, thereby suppressing flow-induced noise at its source. The analysis of Table 13 provides more compelling evidence supporting the effectiveness of the noise reduction.
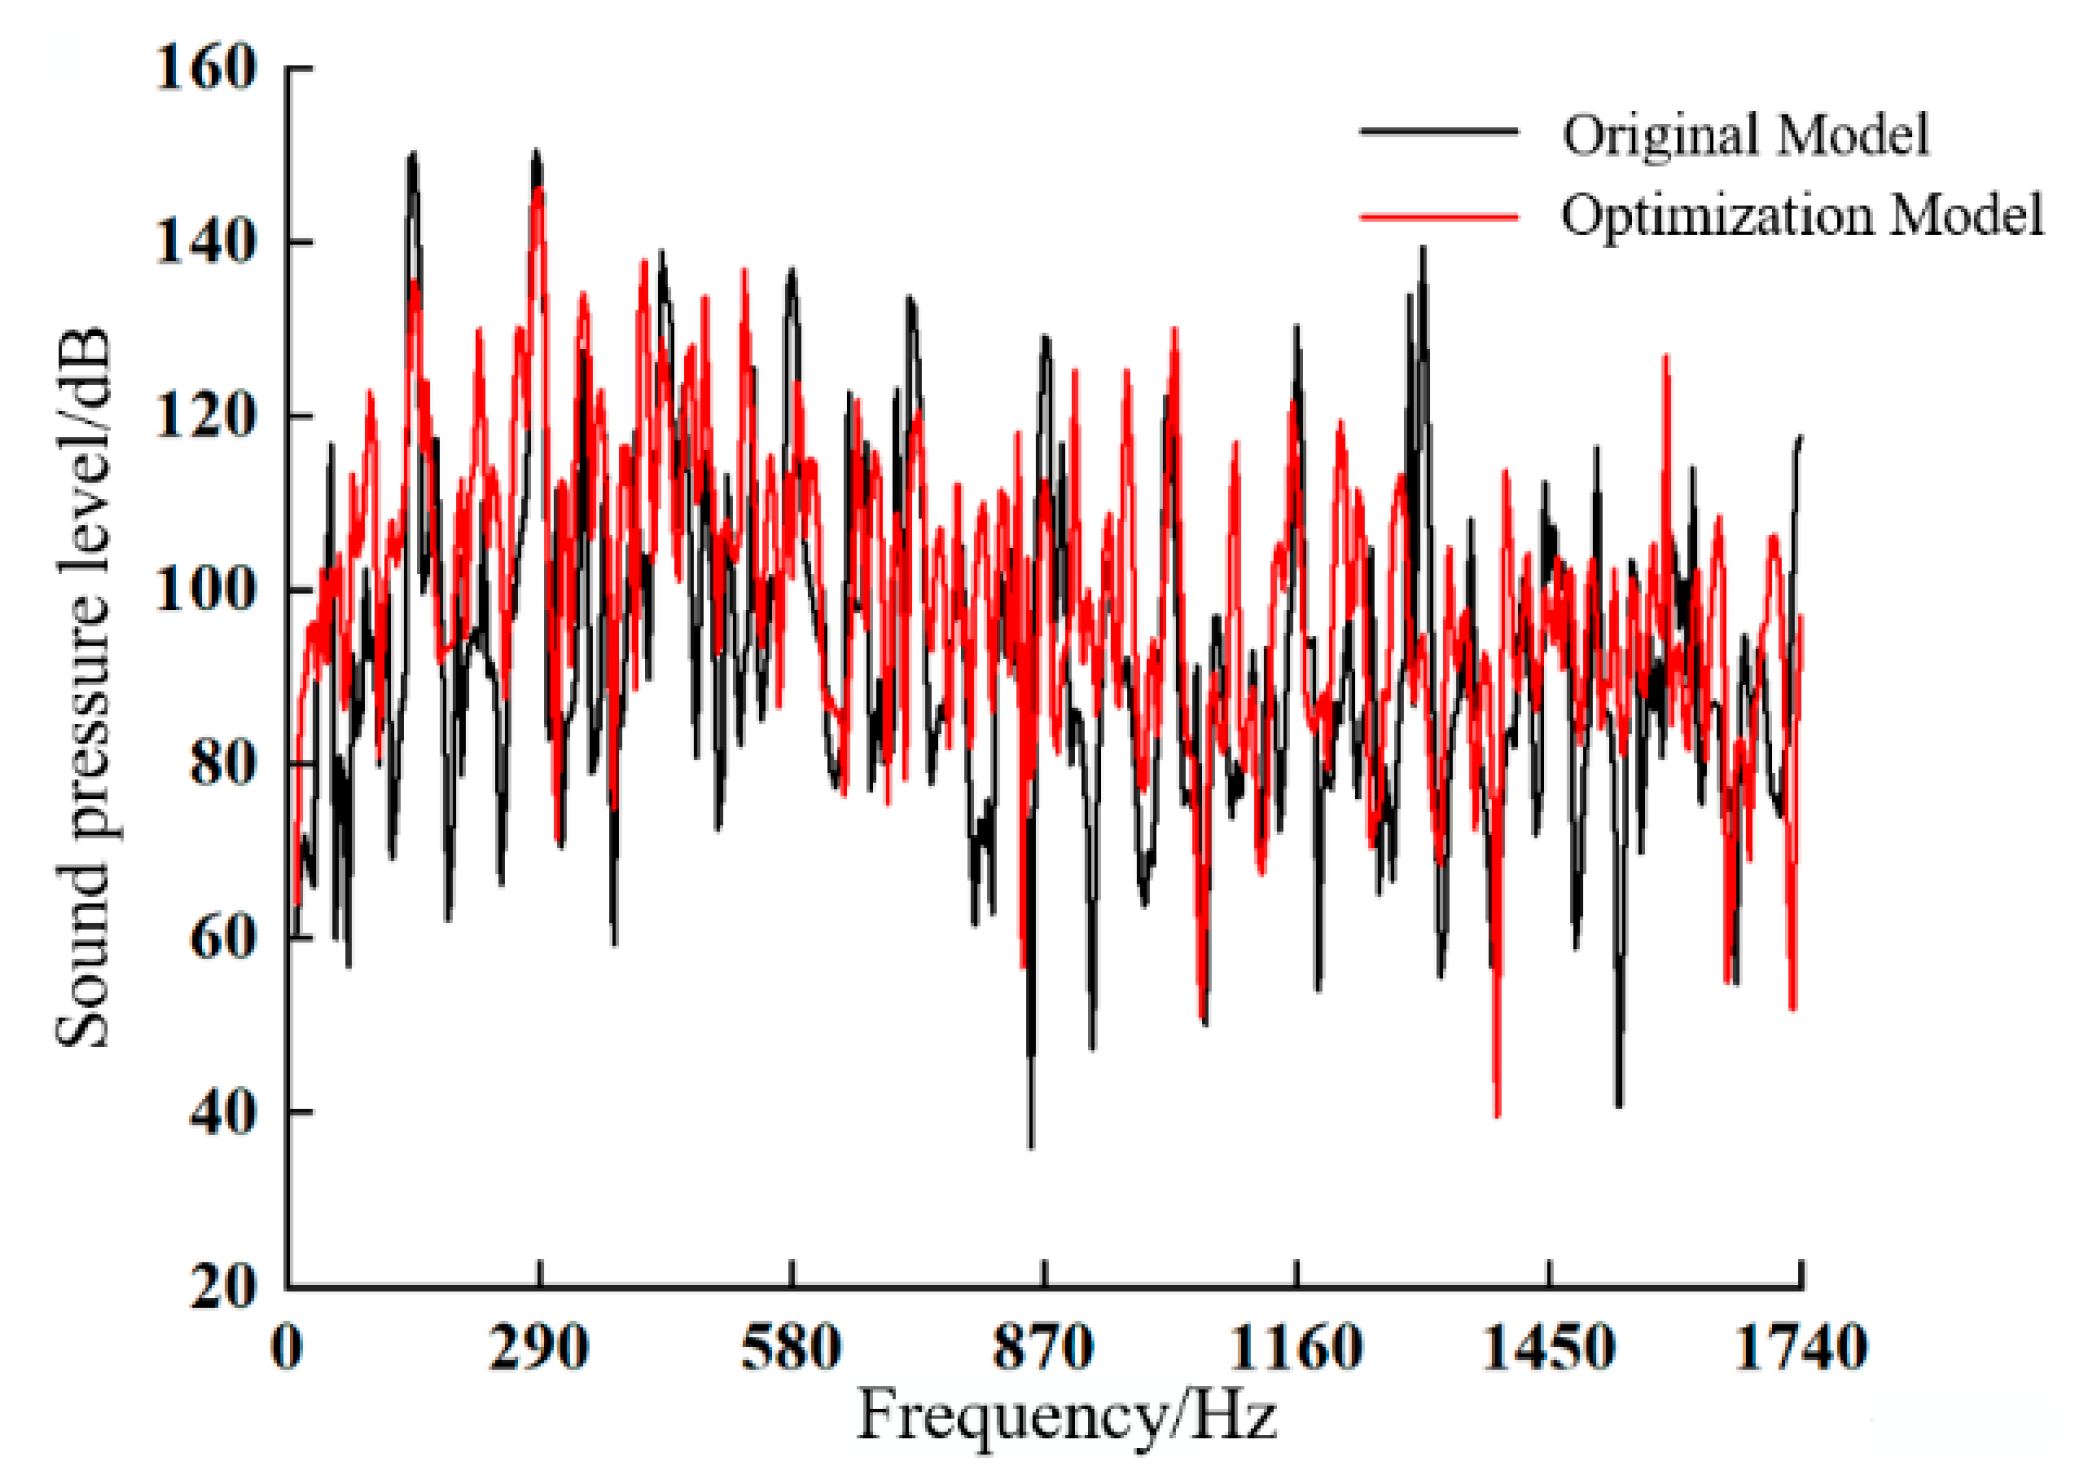
Figure 16: Comparison of acoustic pressure level frequency spectrum curves for induced noise at the volute at acoustic monitoring points before and after optimization under rated conditions.
Table 13: Quantitative comparison of acoustic pressure level frequency for induced noise at the volute at acoustic monitoring points before and after optimization under rated conditions.
| Physical Significance | Frequency (Hz) | Original Model (dB) | Optimized Model (dB) | Difference (dB) |
|---|---|---|---|---|
| 1st BPF (Fundamental) | 290 | 150.8 | 145.9 | −4.9 |
| 2nd harmonic | 580 | 137.2 | 131.4 | −5.8 |
| 3rd harmonic | 870 | 128.5 | 119.5 | −9.0 |
| 4th harmonic | 1160 | 130.8 | 121.2 | −9.6 |
| 5th harmonic | 1450 | 114.0 | 113.5 | −0.5 |
| Overall sound pressure level | — | 151.05 | 146.05 | −5.0 |
A multi-objective optimization design for the bionic tongue of the model pump was conducted utilizing the orthogonal experimental method combined with CFD/CFA techniques, leading to the following conclusions:
- (1)The weight matrix analysis method yielded an optimal solution that balances hydraulic and acoustic performance. Post-optimization, at the rated condition, the head increased by 0.5 m, efficiency improved by 5%, and the volute-induced noise was reduced by 5 dB. These results validate the feasibility of the bionic tongue design in simultaneously enhancing both the hydraulic and acoustic performance of centrifugal pumps, providing a bionic rationale for the design of high-efficiency, low-noise centrifugal pumps.
- (2)The influence of different bionic tongue design schemes on the pump’s acoustic performance was more pronounced than on its hydraulic performance. The volute was identified as the primary source of hydrodynamic noise. The serrated bionic tongue effectively reduced the level of volute-induced noise, with the base length of the serrations being the most influential factor. This indicates that the key to low-noise design lies in the appropriate determination of the serration geometry.
- (3)The serrated bionic tongue optimizes both the hydraulic and acoustic performance of the centrifugal pump synergistically. It achieves this by reconstructing the rotor-stator interaction, breaking down large-scale vortices, and mitigating flow separation. These mechanisms collectively enhance the spatial uniformity and temporal stability of the flow field, thereby reducing the pressure pulsation intensity at the rotor-stator interface. The broadened high-efficiency operating range and the overall reduction in volute noise not only improve economic performance by lowering the overall energy consumption, but also mitigate the risk of rotor vibration and load fluctuations by weakening flow-induced excitation. Collectively, these effects enhance the long-term operational reliability of the pump system from a mechanistic standpoint.
The conclusions are reliable within the defined scope of this study; however, the following limitations remain: First, the simulations were performed under a single-phase clean-water assumption and did not account for additional hydraulic losses induced by solid particles or entrained gas that may be present under real operating conditions. Second, the optimized biomimetic volute-tongue geometry is relatively complex and demands high casting accuracy; manufacturing tolerances may therefore introduce small discrepancies between measured performance and numerical predictions.
Future work will proceed along the following directions. First, based on parametric modeling and similarity criteria, the biomimetic design will be extended to pumps with different specific speeds to elucidate general mapping relationships between biomimetic features and hydraulic/acoustic performance, and to establish the boundaries of physical applicability. Second, a performance-degradation model will be introduced to quantify the long-term effects of manufacturing tolerances, roughness evolution, and wear/fouling on efficiency and noise, thereby incorporating life-cycle effects into the initial design framework. Finally, multi-objective optimization will be conducted over a wider operating envelope and under realistic spectral conditions. In parallel, a coupled “pump–piping–structure” vibration validation will be performed to calibrate and refine the numerical model, thereby improving the engineering implement-ability and generalizability of the biomimetic design.
Acknowledgement:
Funding Statement: The authors would like to thank the support of the Innovation Fund for National Natural Science Foundation of China (52009050, 52461047), Gansu Provincial Higher Education Innovation Fund (2025A-033).
Author Contributions: The authors confirm contribution to the paper as follows: study conception and design: Rong Guo, Jie Xiao; data collection: Jie Xiao, Xuehan Wang, Qi Jiang; analysis and interpretation of results: Jie Xiao, Xuehan Wang, Qi Jiang; draft manuscript preparation: Jie Xiao. All authors reviewed and approved the final version of the manuscript.
Availability of Data and Materials: The data that support the findings of this study are available from the corresponding author, upon reasonable request.
Ethics Approval: Not applicable.
Conflicts of Interest: The authors declare no conflicts of interest.
Nomenclature
| Ds | Pump inlet diameter (mm) |
| Dd | Pump outlet diameter (mm) |
| D1 | Impeller inlet diameter (mm) |
| D2 | Impeller outlet diameter (mm) |
| Z | Impeller blade numbers |
| b2 | Impeller outlet width (mm) |
| D3 | Volute base circle diameter (mm) |
| Hd | Design pump head (m) |
| Qd | Design Flow Rate (m3/h) |
| nd | Rotational Speed (rad/min) |
| fa | Shaft Frequency (Hz) |
| fb | Blade Passing Frequency (BPF) (Hz) |
References
1. Fu Q , Zhang F , Zhu R , He B . A systematic investigation on flow characteristics of impeller passage in a nuclear centrifugal pump under cavitation state. Ann Nucl Energy. 2016; 97: 190– 7. doi:10.1016/j.anucene.2016.07.011. [Google Scholar] [CrossRef]
2. Müller TM , Neumann J , Meck MM , Pelz PF . Sustainable cooling cycles by algorithmically supported design of decentral pump systems. Appl Therm Eng. 2022; 217: 119084. doi:10.1016/j.applthermaleng.2022.119084. [Google Scholar] [CrossRef]
3. Ravindran RV , Cotter D , Wilson C , Huang MJ , Hewitt NJ . Experimental investigation of a small-scale reversible high-temperature heat pump–organic Rankine cycle system for industrial waste heat recovery. Appl Therm Eng. 2024; 257: 124237. doi:10.1016/J.APPLTHERMALENG.2024.124237. [Google Scholar] [CrossRef]
4. Liang J , Tian Y , Yang S , Wang Y , Yin R , Wang Y . Long-term operation optimization of circulating cooling water systems under fouling conditions. Chin J Chem Eng. 2024; 65( 01): 255– 67. doi:10.1016/j.cjche.2023.08.008. [Google Scholar] [CrossRef]
5. Guo C , Gao M , He S . A review of the flow-induced noise study for centrifugal pumps. Appl Sci. 2020; 10( 3): 1022. doi:10.3390/app10031022. [Google Scholar] [CrossRef]
6. Lighthill MJ . On sound generated aerodynamically I. General theory. Proc R Soc Lond Ser A Math Phys Sci. 1952; 211( 1107): 564– 87. doi:10.1098/rspa.1952.0060. [Google Scholar] [CrossRef]
7. Guo C , Gao M . Investigation on the flow-induced noise propagation mechanism of centrifugal pump based on flow and sound fields synergy concept. Phys Fluids. 2020; 32( 3): 035115. doi:10.1063/5.0003937 [Google Scholar] [CrossRef]
8. Ryu BJ , Ryu SU , Kim GH , Yim KB . Vibration and dynamic stability of pipes conveying fluid on elastic foundations. J Mech Sci Technol. 2004; 18( 12): 2148– 57. doi:10.1007/BF02990219. [Google Scholar] [CrossRef]
9. Wang D , Wang W , Hu J , Zhao W , Liu L . Experimental study of cavitation noise characteristics in a centrifugal pump based on power spectral density and wavelet transform. Flow Meas Instrum. 2023; 94: 102481. doi:10.1016/j.flowmeasinst.2023.102481. [Google Scholar] [CrossRef]
10. Huo YW , Wang SP , Li XY , He XF , Liu DS , Pan ZB . The experimental research on noise characteristics of multistage centrifugal pump. Ship Sci Technol. 2019; 41( 13): 77– 83. (In Chinese). doi:10.3404/j.issn.1672-7649.2019.07.015. [Google Scholar] [CrossRef]
11. Choi J-S , McLaughlin DK , Thompson DE . Experiments on the unsteady flow field and noise generation in a centrifugal pump impeller. J Sound Vib. 2003; 263( 3): 493– 514. doi:10.1016/S0022-460X(02)01061-1. [Google Scholar] [CrossRef]
12. Gao M , Dong P , Lei S , Turan A . Computational study of the noise radiation in a centrifugal pump when flow rate changes. Energies. 2017; 10( 2): 221. doi:10.3390/en10020221. [Google Scholar] [CrossRef]
13. Si QR , Yuan SQ , Yuan JP , Wang C , Yang J . Study on the influence of volute to flow-induced noise in centrifugal pump. Adv Mater Res. 2012; 516: 1009– 17. doi:10.4028/www.scientific.net/AMR.516-517.1009. [Google Scholar] [CrossRef]
14. Qiaorui S , Shouqi Y , Jianping Y , Jun Y . Flow-induced noise calculation of centrifugal pumps based on CFD/CA method. J Mech Eng. 2013; 49( 22): 177– 84. doi:10.3901/JME.2013.22.177. [Google Scholar] [CrossRef]
15. Dehghan AA , Shojaeefard MH . Experimental and numerical optimization of a centrifugal pump volute and its effect on head and hydraulic efficiency at the best efficiency point. Proc Inst Mech Eng Part C J Mech Eng Sci. 2022; 236( 9): 4577– 98. doi:10.1177/09544062211056019. [Google Scholar] [CrossRef]
16. Dong R , Chu S , Katz J . Effect of modification to tongue and impeller geometry on unsteady flow, pressure fluctuations, and noise in a centrifugal pump. J Turbomach. 1997; 119( 3): 506– 15. doi:10.1115/1.2841152. [Google Scholar] [CrossRef]
17. Wan L , Song WW , Fu J , Luo X , Chen JX , Yu JY . The effect of different tongue angle on medium specific speed centrifugal pump performance. China Rural Water Hydropower. 2018; 37( 9): 84– 90. (In Chinese). doi:10.13522/j.cnki.ggps.20180189. [Google Scholar] [CrossRef]
18. Mohammed N , Ahmed F , Mewada H , Rathod RG , Sonawane SK . Experimental and machine learning optimization of centrifugal pump performance. Flow Meas Instrum. 2026; 107: 103048. doi:10.1016/j.Flowmeasinst.2025.103048. [Google Scholar] [CrossRef]
19. Ebada Y , Elshennawy A , Elbrashy A , Rashad M . Performance optimization of centrifugal pumps: Experimental analysis of flow enhancement and cavitation mitigation under variable operating conditions. Flow Meas Instrum. 2025; 106: 103043. doi:10.1016/j.Flowmeasinst.2025.103043. [Google Scholar] [CrossRef]
20. Dehghan AA , Shojaeefard MH , Roshanaei M . Exploring a new criterion to determine the onset of cavitation in centrifugal pumps from energy-saving standpoint; experimental and numerical investigation. Energy. 2024; 293: 130681. doi:10.1016/J.ENERGY.2024.130681. [Google Scholar] [CrossRef]
21. Mou JG , Dai DS , Gu YQ , Liu J , Zheng SH , Wu DH . Effect of structure of bionic volute on pulsation characteristic near volute tongue in centrifugal pump. J Shanghai Jiaotong Univ. 2016; 50( 09): 1493– 9. (In Chinese). doi:10.16183/j.cnki.jsjtu.2016.09.023. [Google Scholar] [CrossRef]
22. Song P , Wang X . The numerical study on the influence of bionic volute tongue on steady flow in centrifugal pump. Mar Equip Mater Mark. 2023; 31( 12): 70– 3. (In Chinese). doi:10.19727/j.cnki.cbwzysc.2023.12.023. [Google Scholar] [CrossRef]
23. Cui D , Zhipeng G , Liang D , Houlin L . Research on characteristics of drag reduction and noise reduction on V-groove surface of bionic blade of centrifugal pump. J Huazhong Univ Sci Technol. 2020; 48( 09): 113– 8. (In Chinese). doi:10.13245/j.hust.200919. [Google Scholar] [CrossRef]
24. Zhao X . Experimental Design Methods. Beijing, China: Science Press; 2006. (In Chinese) [Google Scholar]
25. Spalart PR . Detached-eddy simulation. Annual review of fluid mechanics. 2009; 41( 1): 181– 202. doi:10.1146/annurev.fluid.010908.165130. [Google Scholar] [CrossRef]
26. Van Doormaal JP , Raithby GD . Enhancements of the SIMPLE method for predicting incompressible fluid flows. Numer Heat Transf. 1984; 7( 2): 147– 63. doi:10.1080/01495728408961817. [Google Scholar] [CrossRef]
27. Ji Z . Acoustic theory and design of mufflers. Beijing, China: Science Press; 2015. (In Chinese). [Google Scholar]
28. Yuan J , Yuan S , Yuan J , Wang W . Comparative study of pressure flucyuration intensity for a single-blade pump under multiple operating conditions. J Huazhong Univ Sci Technol. 2013; 41( 12): 29– 53. (In Chinese). doi:10.13245/j.hust.2013.12.017. [Google Scholar] [CrossRef]
Cite This Article
 Copyright © 2026 The Author(s). Published by Tech Science Press.
This work is licensed under a Creative Commons Attribution 4.0 International License , which permits unrestricted use, distribution, and reproduction in any medium, provided the original work is properly cited.
 Downloads
 Citation Tools