
 Login
Login Register
 Submit a Paper
 Propose a Special lssue
 Open Access
ARTICLE
Heave-Induced Thrust and Free-Surface Deformation of an Oscillating Hydrofoil
1 Department of Hydroaeromechanics and Marine Acoustics, Saint-Petersburg State Marine Technical University, Saint-Petersburg, Russia
2 College of Engineering, Ocean University of China, Qingdao, China
3 Department of Applied Mathematics and Mathematical Modeling, Saint-Petersburg State Marine Technical University, Saint-Petersburg, Russia
* Corresponding Author: Bowen Zhao. Email:
Fluid Dynamics & Materials Processing 2026, 22(9), 10 https://doi.org/10.32604/fdmp.2026.087716
Received 22 June 2026; Accepted 15 September 2026; Issue published 28 September 2026
 View Full Text
 Download PDF
Abstract
The effects of heave amplitude and oscillation period on the hydrodynamic performance of a three-dimensional NACA0012 hydrofoil operating beneath a free surface are systematically investigated using an unsteady Reynolds-averaged Navier–Stokes (RANS) framework coupled with the Volume of Fluid (VOF) method. The shear stress transport (SST) turbulence model and an overset mesh technique are employed to resolve the turbulent flow and large-amplitude hydrofoil motion, while grid and time-step convergence studies are performed to establish numerical reliability. The results show that the heaving hydrofoil generates net thrust throughout the investigated parameter range, demonstrating the dominant role of the motion-induced effective angle of attack in determining the streamwise force. Increasing the oscillation frequency generally enhances thrust production by strengthening momentum exchange within the wake. Heave amplitude has a pronounced influence on the surface pressure distribution, with larger amplitudes intensifying the leading-edge suction peak, increasing the pressure difference between the upper and lower surfaces, and consequently amplifying the instantaneous hydrodynamic loads. Concurrently, both free-surface wave elevation and wake vorticity increase with heave amplitude, indicating increasingly strong interactions between the vortical wake and the free surface. At excessive amplitudes, however, a greater fraction of the input energy is transferred to surface-wave deformation and vortical structures rather than converted into useful thrust.Keywords
With the development of high-speed vessels [1], unmanned marine vehicles [2], and bio-inspired propulsion systems [3], the hydrodynamics of hydrofoils operating near a free surface has become an important topic in ocean engineering and fluid mechanics [4,5,6]. Hydrofoils can generate lift to reduce the wetted surface area of a hull, thereby decreasing resistance and improving navigation efficiency [4]. However, once a hydrofoil approaches the free surface, its flow environment differs substantially from that in deep or unbounded water, and the lift, drag, and wake structures are affected by free-surface deformation and wave generation [7,8]. For a hydrofoil operating near a free surface, the strength of free-surface effects is governed jointly by submergence depth, Froude number, motion form, and foil scale [9].
Early studies on hydrofoils near a free surface showed that the low-pressure region on the suction side of a hydrofoil can deform the free surface and generate a surface wave train behind the foil; this wave field introduces additional wave resistance and modifies the lift by altering the pressure distribution near the foil surface [8,10]. Daskovsky [8] pointed out that, under shallow submergence, free-surface deformation reduces the suction-side negative pressure and consequently decreases the hydrofoil lift. The RANS-VOF simulations of Pernod et al. [7] further demonstrated that free-surface effects become pronounced when the submergence-to-chord ratio h/c < 2, and the drag may increase significantly under shallower conditions.
The wave-resistance problem associated with free-surface deformation was systematically discussed in Duncan’s classical experiment. For a two-dimensional NACA0012 hydrofoil, Duncan showed that the induced wave resistance can be divided into non-breaking and breaking-wave components, with wave breaking causing strong energy dissipation and producing a momentum-deficient wake near the free surface [10]. Later, Ali and Karim and Prasad et al. simulated shallowly submerged NACA0012 hydrofoils using the finite-volume method (FVM) coupled with the VOF method, demonstrating the capability of such numerical approaches to capture free-surface wave profiles, pressure distributions, and lift/drag variations [11,12]. These studies indicate that the free surface is not merely a geometric boundary, but a dynamic interface involved in energy transfer and momentum exchange.
In addition to free-surface deformation, hydrofoil performance can be affected by cavitation, another pressure-driven multiphase phenomenon associated with low-pressure regions on the suction surface. Biswas and Harish [13] numerically investigated the unsteady cavitating flow around a NACA4412 hydrofoil equipped with a triangular slot on its suction side using the SST k-ω turbulence model, a homogeneous mixture formulation, and the Schnerr–Sauer cavitation model. Their results showed that the slotted hydrofoil provided improved cavitation control at lower cavitation numbers and avoided the stall observed for the baseline hydrofoil at a high angle of attack, although the hydrodynamic benefits remained dependent on the operating condition. These findings demonstrate that local modification of the suction-side flow can alter pressure loading, cavitation development, and stall behavior, further emphasizing the importance of pressure redistribution and unsteady flow structures in the assessment of multiphase hydrofoil hydrodynamics.
For unsteady hydrofoils, especially those undergoing pure heaving or flapping motion, the flow mechanism is more complex than that of fixed hydrofoils. Heaving motion introduces a periodic effective angle of attack, causing the hydrofoil to experience alternating suction enhancement, pressure recovery, vortex shedding, and wake reorganization within one cycle [14]. In experiments on a periodically plunging NACA0012 foil near a free surface, Cleaver et al. [14] found that drag reduction increases approximately parabolically with the amplitude-based Strouhal number SrA at relatively low values, whereas large-amplitude cases deviate from this trend due to leading-edge vortex formation. This finding indicates that heave amplitude does not merely change the motion magnitude; it also modifies the timing and strength of vortex formation.
The oscillation frequency or period is another important parameter controlling the free-surface response. Cleaver et al. [14] also observed a distinct thrust reduction near a specific unsteady parameter, which was associated with the generation of strong free-surface waves. Esmaeilifar et al. [15] further pointed out that, in the critical unsteady-parameter range, strong waves transfer more momentum to the free surface and wake, leading to a sudden drag increase. Therefore, for a heaving hydrofoil, the period affects not only the magnitude of heaving velocity but also whether the system enters a flow regime characterized by strong wave generation or enhanced wave-vortex coupling.
Recent studies on flapping foils and bio-inspired propulsion have further deepened the understanding of free-surface effects. Zheng et al. [16] showed that, at low Froude numbers, the free surface undergoes weak deformation and behaves similarly to a solid-wall-induced ground effect; at higher Froude numbers, however, moderate free-surface deformation may reduce the added-mass effect and improve propulsive efficiency. This finding suggests that free-surface effects are not necessarily detrimental; under certain motion parameters, favorable coupling may occur among surface waves, added mass, and wake structures [16]. Whether such a mechanism also exists for a pure heaving hydrofoil still requires analysis based on pressure distribution, vorticity fields, and free-surface wave elevation.
From a three-dimensional perspective, finite-span hydrofoils also generate spanwise leakage flow and tip vortices, which further modify the local pressure distribution and wake structure. Ozdemir et al. [17] showed that, even when the aspect ratio is relatively large and the midspan wave elevation is close to that predicted by two-dimensional simulations, the overall free-surface pattern may still exhibit clear three-dimensional characteristics. Ni et al. [18] also demonstrated experimentally and numerically that the interaction between hydrofoil-induced surface waves and the foil can modify suction-side separation and may delay stall at high angles of attack. Therefore, two-dimensional section results alone are insufficient to fully explain the hydrodynamic response of a heaving hydrofoil near a free surface.
Compared with the above studies, the combined influence of amplitude and period for a pure heaving hydrofoil at a fixed mean submergence depth remains insufficiently understood. The amplitude determines the motion range and peak heaving velocity, while the period regulates heaving velocity, acceleration, and the unsteady parameter; together, they influence the instantaneous effective angle of attack, added-mass response, trailing-edge vortex shedding, and free-surface wave formation [14,15]. Existing studies have generally examined the separate effects of submergence depth, Froude number, amplitude, or frequency, whereas the question of how amplitude and period jointly determine thrust/drag, lift fluctuation, vortex evolution, and free-surface deformation at the same submergence depth remains less explored [19].
The contribution of the present study does not lie in introducing a new numerical solver, but in systematically characterizing and quantitatively assessing the combined amplitude–period response of a three-dimensional finite-span pure-heaving hydrofoil beneath a deformable free surface. Rather than treating heave amplitude and oscillation period only as independent control parameters, their interaction is evaluated using two-parameter response maps and a quantitative interaction residual.
Based on this background, the present study investigates a three-dimensional NACA0012 hydrofoil undergoing pure heaving motion beneath a free surface using a URANS-VOF numerical method. The central question is not simply whether increasing amplitude is beneficial, but how different combinations of amplitude and period control the pressure distribution, wake vortex structures, and free-surface wave patterns, and how these flow features jointly determine the lift and thrust responses. By comparing the time-averaged thrust/drag, instantaneous lift coefficient, surface pressure coefficient, vorticity field, and free-surface wave elevation, this study aims to reveal the dominant flow mechanisms of a heaving hydrofoil near a free surface and provide guidance for optimizing its motion parameters.
2 Governing Equations and Numerical Methodology
2.1 Fluid Governing Equations and VOF Formulation
The present study investigates the unsteady two-phase viscous flow around a pure heaving hydrofoil operating near a free surface. The computational domain consists of water and air, both of which are treated as incompressible Newtonian fluids. To describe the coupled interaction among hydrofoil motion, wake development, and free-surface deformation, the unsteady Reynolds-averaged Navier–Stokes equations are solved using a finite-volume method.
To track the location and evolution of the water–air interface, the Volume of Fluid (VOF) method is employed. In the VOF method, the water volume fraction αw is introduced to describe the distribution of water and air in each computational cell. The transport equation for the water volume fraction is written as
This equation describes the convective transport of the air–water interface with the flow field. To reduce numerical diffusion and maintain a sharp free-surface profile, the high-resolution interface capturing (HRIC) scheme is applied to discretize the volume-fraction transport equation. This scheme provides good interface-capturing capability when the free surface undergoes noticeable deformation, and is therefore suitable for the present problem of a heaving hydrofoil operating near a free surface.
The water volume fraction is defined as
The effective density and dynamic viscosity of the mixture are evaluated through volume-fraction weighting:
The governing equations consist of the mass and momentum conservation equations, which can be written in tensor form as
The term
For a single-phase incompressible fluid, the density is constant and the continuity equation reduces to
2.2 Turbulence Model: k-ω SST Model
The chord-based Reynolds number in the present simulations is approximately Re = 2.0 × 10⁴. This value was selected to represent a laboratory-scale or small bio-inspired hydrofoil operating at a moderate inflow velocity, rather than a full-scale high-speed hydrofoil craft. Reynolds numbers of the order of 104–105 are relevant to small aquatic propulsors and laboratory-scale oscillating-foil studies [13,18]. At Re = 2.0 × 10⁴, the force and vortex responses may remain sensitive to laminar–turbulent transition and flow separation. Consequently, the conclusions of the present study are restricted to the investigated Reynolds number, and quantitative extrapolation to substantially larger scales should be made cautiously. A systematic investigation of Reynolds-number effects and transition-sensitive validation will be conducted in future work. The flow around a hydrofoil near a free surface involves complex features such as near-wall boundary layers, adverse pressure gradients, local separation, and free shear layers. To capture these phenomena with sufficient accuracy, the shear stress transport k-ω SST turbulence model proposed by Menter is adopted. This model retains the sensitivity of the k-ω formulation to near-wall boundary layers and adverse pressure gradients, while gradually transforming into a k-ε-type behavior in the far-field region, thereby reducing the sensitivity to free-stream turbulence quantities.
The transport equations for the turbulent kinetic energy k and the specific dissipation rate ωSST can be expressed as
2.3 Numerical Discretization and Solution Procedure
The governing equations were discretized using a cell-centered finite-volume method. A three-dimensional, implicit-unsteady, segregated-flow formulation was employed. Pressure–velocity coupling was achieved using the SIMPLE algorithm. The convective terms in the momentum equations were discretized using a second-order upwind scheme, and the second-order gradient option was enabled to improve the spatial accuracy of the gradient reconstruction. The SST k-ω model of Menter was employed for turbulence closure, together with the All-y+ wall treatment for near-wall modeling.
The air-water interface was captured using the Volume of Fluid (VOF) method. As described in Section 2.1, the water-volume-fraction transport equation was discretized using the HRIC scheme to reduce numerical diffusion and maintain a sharp air–water interface. Temporal advancement was performed using an implicit first-order temporal discretization scheme. A maximum of five inner iterations was performed at each physical time step.
The physical time-step size was determined through the temporal-convergence study described in Section 2.7. Five period-normalized time steps, Δt = T/n, with n = 300, 400, 600, 800, and 1000, were examined. The adopted value, Δt = T/800, corresponds to 800 time steps per heaving cycle and a phase increment of 0.45°. The relative differences between T/800 and T/1000 are approximately 0.58% for the time-averaged lift coefficient and 0.21% for the time-averaged drag coefficient. Therefore, Δt = T/800 was selected as a compromise between temporal accuracy and computational cost.
Since the hydrofoil undergoes large-amplitude periodic heaving motion during the simulation, conventional dynamic mesh methods may lead to stretching and distortion of the near-wall mesh, thereby reducing the accuracy of boundary-layer resolution. To avoid this problem, the overset mesh method is employed to handle the rigid-body motion of the hydrofoil. The computational domain consists of a stationary background mesh covering the far-field region and a component mesh surrounding the hydrofoil, which moves together with the hydrofoil.
In the overlapping region, flow information is transferred between the background mesh and the component mesh through interpolation. This approach allows the hydrofoil to undergo large-amplitude unsteady motion while maintaining good mesh quality near the foil surface. Compared with mesh deformation methods, the overset mesh technique is more effective in preventing mesh-quality degradation during body motion, making it suitable for hydrofoils or flapping foils with relatively large heave amplitudes.
2.5 Computational Domain and Boundary Conditions
The computational domain and boundary conditions are shown in Fig. 1. A background mesh is used to resolve the global flow field and free-surface deformation, while an overset mesh surrounding the hydrofoil is adopted to accommodate the prescribed heaving motion. The overset region moves together with the hydrofoil, and the flow variables are transferred between the overset mesh and background mesh through interpolation across the overset interface.
The three-dimensional computational domain and the corresponding boundary conditions are shown in Fig. 1. The hydrofoil is positioned 10c downstream of the inlet and 20c upstream of the pressure outlet. The upper boundary is located 5c above the initially calm free surface, while the lower boundary is located 15c below it, resulting in a total vertical extent of 20c. The spanwise width of the computational domain is 4c.
The finite-span hydrofoil has an aspect ratio of AR = b/c = 1, and hence its span is b = c. Symmetry boundary conditions are imposed on the two spanwise side boundaries. The hydrofoil is centered in the spanwise direction, leaving sufficient lateral clearance between the hydrofoil tips and the side boundaries to reduce their direct influence on the tip-vortex and near-wake development. The hydrofoil is initially placed at a submergence depth of c below the calm water surface. The overset region is arranged around the hydrofoil to ensure sufficient mesh resolution during the entire heaving cycle. The left boundary and the upper and lower boundaries are specified as velocity inlets with a uniform incoming velocity U∞. The right boundary is defined as a pressure outlet. The free surface is initialized as a horizontal air-water interface. This configuration provides enough space for wake development and free-surface wave propagation, while avoiding excessive reflection from the downstream boundary.
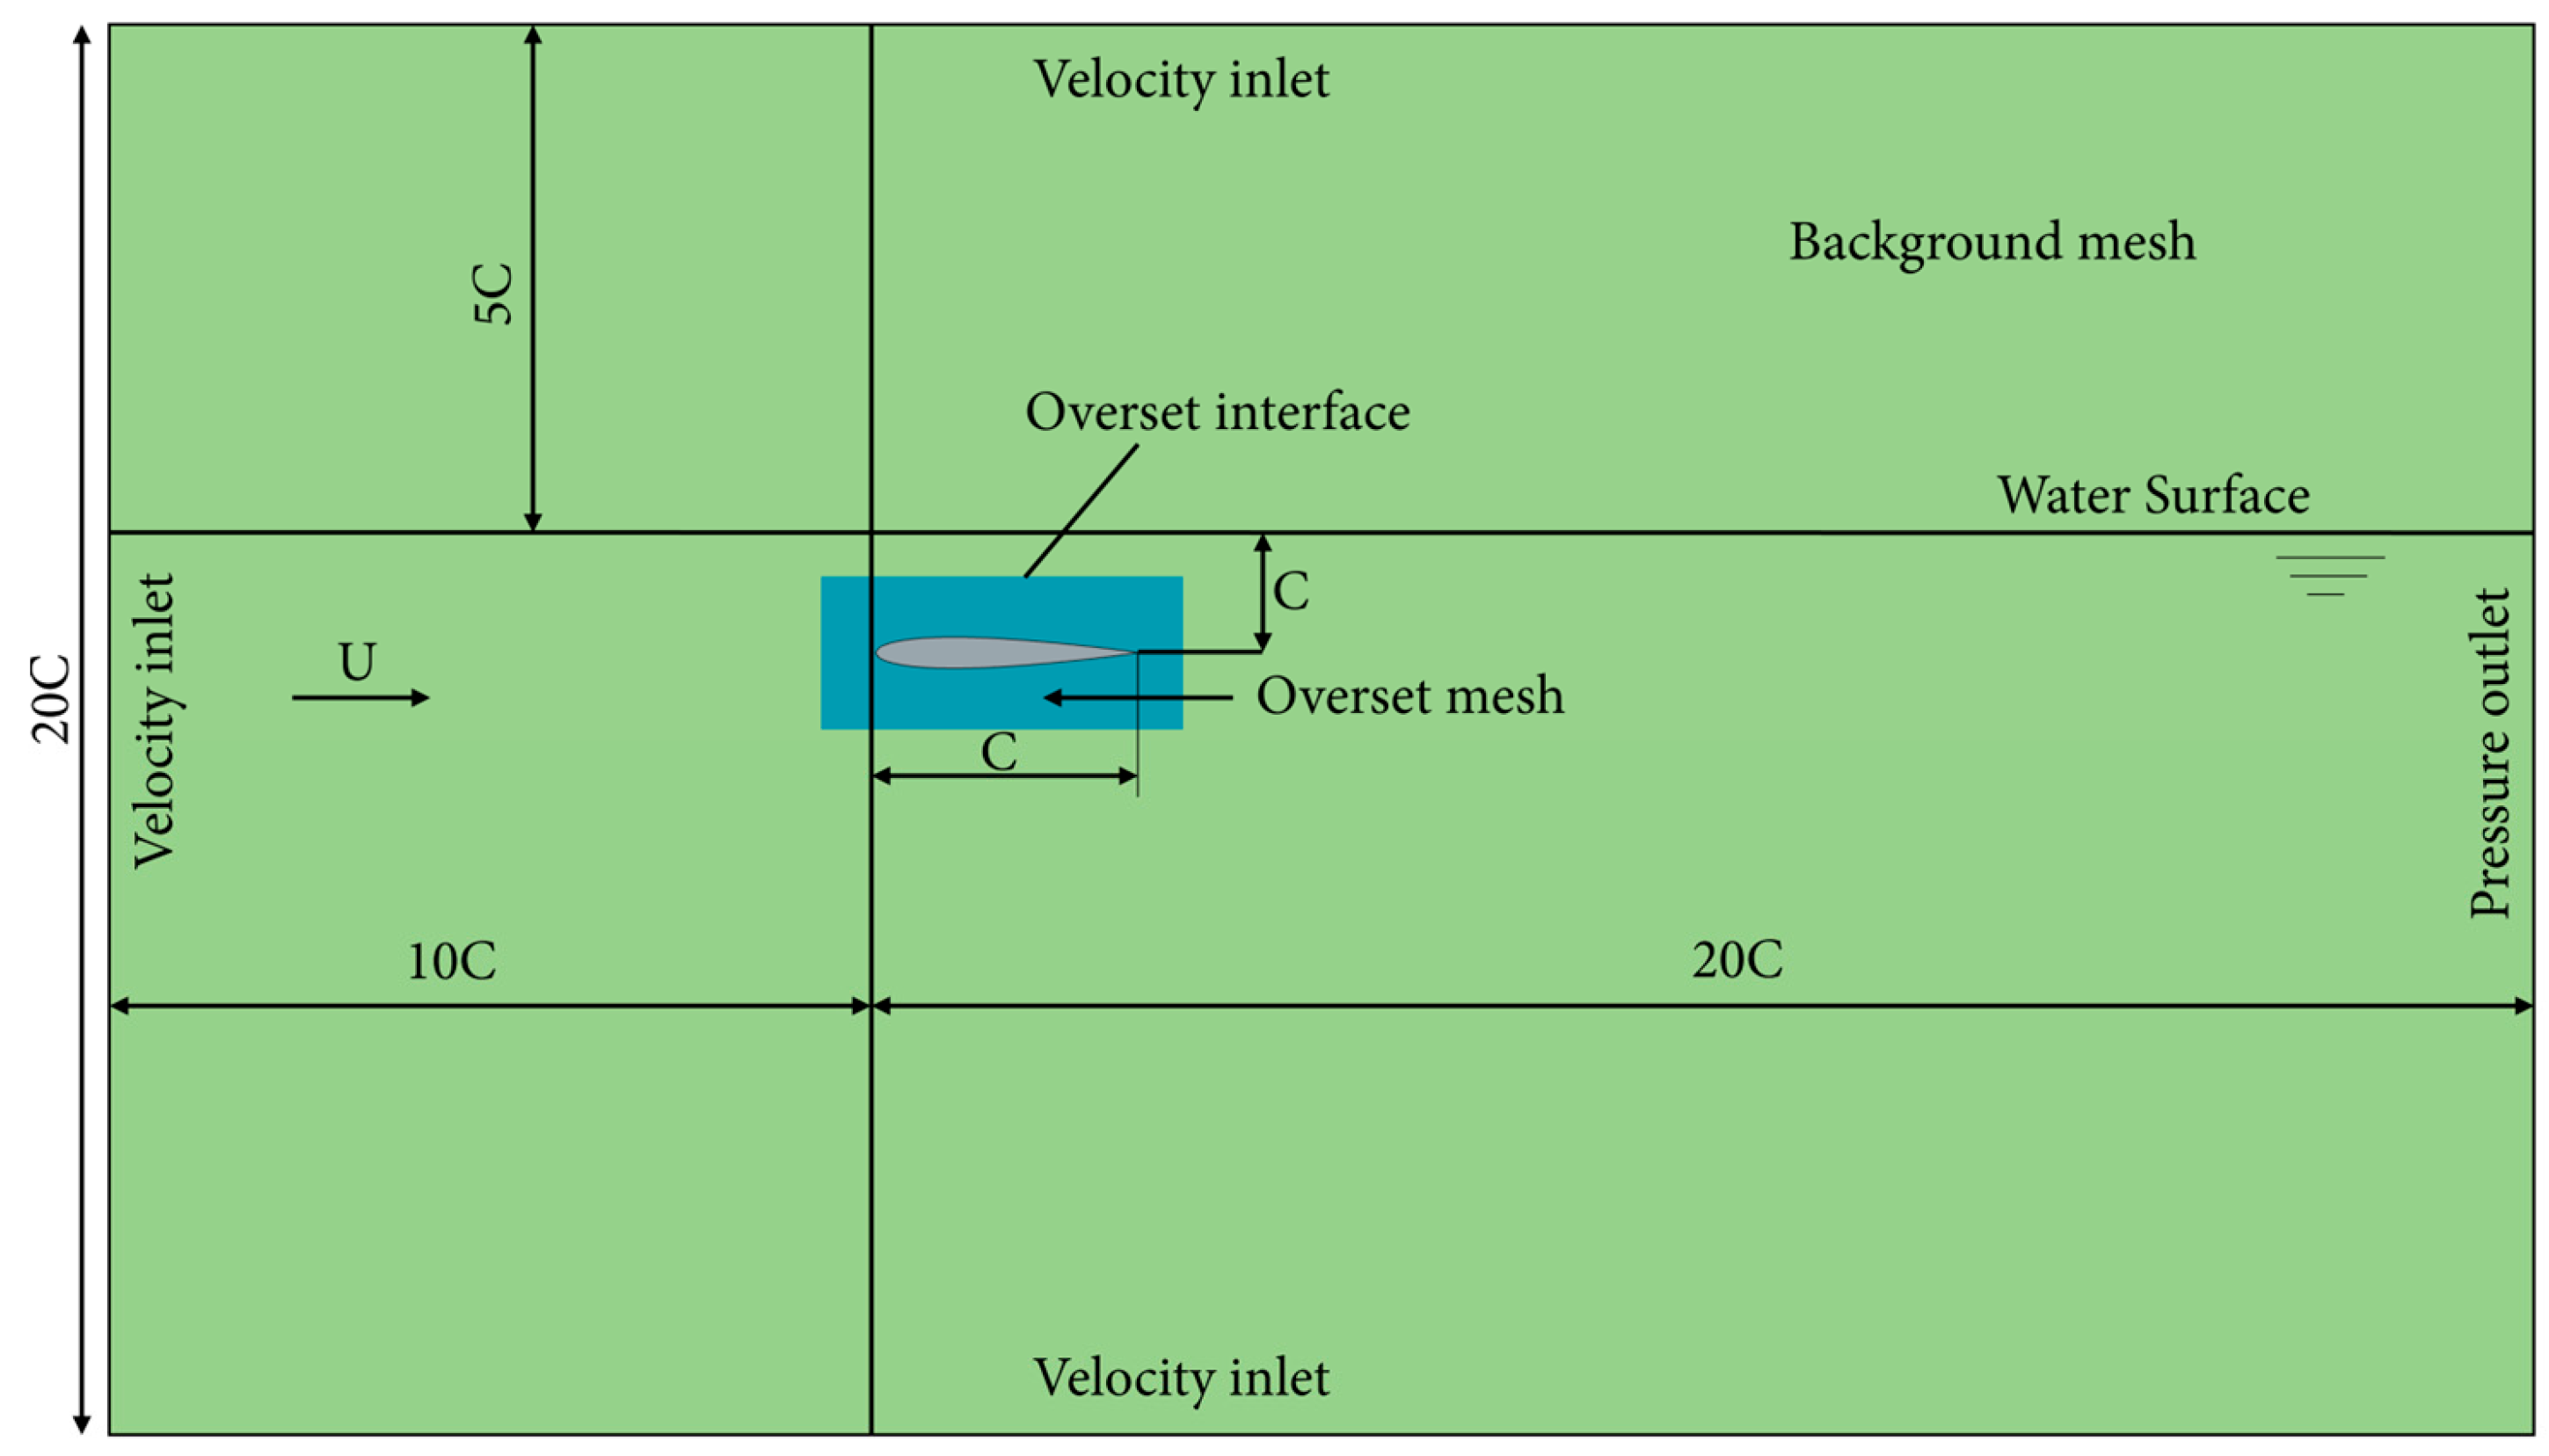
Figure 1: Three-dimensional computational domain, principal dimensions, overset-mesh region, initial free-surface position, and boundary conditions. The NACA0012 hydrofoil has AR = b/c = 1 and a mean submergence of d/c = 1.
The upstream boundary is specified as a velocity inlet with a uniform incoming velocity U∞. The upper and lower far-field boundaries are also prescribed as velocity inlets. Because the upper boundary lies entirely within the air region, the air-phase volume fraction and the uniform streamwise velocity are imposed there. Correspondingly, the lower boundary lies entirely within the water region and is prescribed with the water-phase volume fraction and the same streamwise velocity. This phase-dependent treatment maintains the undisturbed two-phase incoming current without introducing artificial solid-wall effects. The air–water interface is initialized inside the computational domain and subsequently captured using the VOF method. The downstream boundary is defined as a pressure outlet to permit the wake structures and generated free-surface waves to leave the domain with minimal reflection.
2.6 Prescribed Heaving Motion and Hydrodynamic Coefficients
The heaving motion of the hydrofoil is prescribed as a harmonic function. The instantaneous displacement is given by
The pressure coefficient, lift coefficient, and drag coefficient are used to characterize the local pressure distribution and the overall hydrodynamic performance of the hydrofoil. The pressure coefficient is defined as
2.7 Grid and Time Step Convergence Study
A systematic grid convergence study was performed to ensure that the numerical solutions are independent of the spatial discretization. Four grids with increasing refinement levels were generated, with the total number of cells ranging from approximately G1 (coarse) to G4 (fine). The time-averaged lift coefficient
Table 1: Mesh sensitivity analysis based on time-averaged lift and drag coefficients for different grid resolutions.
| Grid | Number of Cells | Variation in | Variation in | ||
|---|---|---|---|---|---|
| G1 | 1,131,369 | −0.03115 | — | −0.12553 | — |
| G2 | 2,145,736 | −0.02543 | 22.49 | −0.13486 | 6.92 |
| G3 | 3,472,584 | −0.02755 | 7.70 | −0.13744 | 1.88 |
| G4 | 6,814,952 | −0.02712 | 1.59 | −0.13741 | 0.02 |
A time step convergence study was conducted to determine an appropriate temporal resolution. Five time steps were tested, corresponding to Δt = T/n, where T is the heaving period and n = 300, 400, 600, 800, 1000. The time-averaged lift and drag coefficients are presented in Table 2. Five period-normalized time steps, Δt = T/n with n = 300, 400, 600, 800, 1000, were tested. They correspond to phase increments of 1.20 degrees, 0.90 degrees, 0.60 degrees, 0.45 degrees, and 0.36 degrees per time step. Defining Δt relative to T provides the same number of temporal samples per oscillation cycle for all frequencies. The differences between T/800 and T/1000 are 0.58% in
Table 2: Time step convergence study: time-averaged lift and drag coefficients for different time step sizes.
| Δt | ||
|---|---|---|
| T/300 | −0.0448 | −0.13693 |
| T/400 | −0.02794 | −0.13818 |
| T/600 | −0.02756 | −0.13728 |
| T/800 | −0.02755 | −0.13744 |
| T/1000 | −0.02739 | −0.13715 |
In this section, we present and discuss the numerical results obtained for a NACA0012 hydrofoil undergoing pure heaving motion beneath a free surface. The effective angle of attack is induced solely by the heaving velocity
For an equivalent head-wave encounter condition at the fixed incoming velocity, the encounter angular frequency is
The prescribed hydrofoil angular frequency was set equal to the equivalent encounter angular frequency, ωh = ωe, and the resulting heaving frequency was calculated from
This procedure gives fh = 2.512, 1.128, 0.723, 0.532, 0.420, and 0.347 Hz, corresponding to Tw = 0.5, 1.0, 1.5, 2.0, 2.5, and 3.0 s, respectively.
It should be emphasized that the reference wave periods are used only to establish a physically interpretable range of heaving frequencies. No incident wave is imposed in the numerical simulations. The free surface is initialized as a calm horizontal interface, and no incident-wave elevation, phase velocity, or orbital-velocity field is prescribed. Therefore, the calculated responses represent a prescribed pure-heaving hydrofoil beneath an initially calm free surface. The corresponding heaving frequency is obtained from fh = ωh/(2π), and the relationships among the reference period, intrinsic frequency, equivalent encounter frequency, and prescribed heaving frequency are summarized in Table 3.
The dimensional heaving frequency fh and nondimensional amplitude h0/c are retained as the two independent motion parameters. Since U∞ and c are fixed, introducing a reduced frequency would only linearly rescale fh. Similarly, using St as the primary parameter would combine the independently varied amplitude and frequency and could obscure their separate effects.
Table 3: Reference wave period Tw, reference frequency fw, intrinsic angular frequency ω0, equivalent head-wave encounter angular frequency ωe, and prescribed hydrofoil heaving frequency fh at U∞ = 0.2 m/s. The reference wave quantities are used only to construct the prescribed frequency range; no incident waves are imposed in the simulations.
| Tw (s) | fw (Hz) | ω0 (rad/s) | ωe = ωh (rad/s) | fh (Hz) |
|---|---|---|---|---|
| 0.5 | 2.0000 | 12.5664 | 15.7834 | 2.512 |
| 1.0 | 1.0000 | 6.2832 | 7.0874 | 1.128 |
| 1.5 | 0.6667 | 4.1888 | 4.5462 | 0.723 |
| 2.0 | 0.5000 | 3.1416 | 3.3427 | 0.532 |
| 2.5 | 0.4000 | 2.5133 | 2.6420 | 0.420 |
| 3.0 | 0.3333 | 2.0944 | 2.1838 | 0.347 |
3.2 Effect of Heave Amplitude and Frequency on Lift and Drag
Fig. 2 presents the lift coefficient as a function of oscillation frequency for different heave amplitudes. Several observations can be made. First, all lift coefficient values are negative across the entire range of frequencies and amplitudes examined. This indicates that the net lift force acts downward (towards the seabed), which is a characteristic of pure heaving motion at zero angle of attack when the hydrofoil operates beneath a free surface, the induced vertical force is directed opposite to the heave direction on average. In the low-frequency range, the lift coefficient first rises and then falls as frequency increases, showing a non-monotonic behavior. This low-frequency “hump” is likely associated with the transition from quasi-steady to unsteady flow regimes, where the vortex shedding pattern and free-surface interactions alter the phase relationship between heave velocity and induced pressure forces. For the larger-amplitude cases, a small positive mean lift is observed around this local maximum. Beyond this frequency range, the mean lift coefficient decreases rapidly and becomes increasingly negative, particularly for h0/c = 0.4 and 0.5. The low-frequency hump becomes more pronounced as the heave amplitude increases.
This behavior reflects competition among the quasi-steady circulatory contribution, the acceleration-dependent added-mass contribution, and the phase-lagged pressure response induced by wake vortices and free-surface deformation. The peak heaving velocity scales as h0ω, whereas the acceleration scales as h0ω2; consequently, these force components increase at different rates and undergo different phase changes as frequency increases. In the low-to-intermediate-frequency range, partial phase cancellation among these contributions reduces the cycle-averaged downward force and produces the observed hump. At higher frequencies, stronger heave-induced effective angles of attack, added-mass loading, vortex shedding, and asymmetric free-surface deformation produce a dominant downward pressure bias, leading to a rapid decrease in the mean lift coefficient.
Fig. 3 shows the drag coefficient as a function of oscillation frequency for the same amplitudes. Remarkably, all drag coefficients are negative over the whole parameter space, indicating that the hydrofoil experiences a net thrust force (i.e., the hydrodynamic force in the streamwise direction acts forward) for every combination of amplitude and frequency tested. In other words, the pure heaving motion successfully converts the conventional drag into thrust across all conditions. The drag coefficient becomes increasingly negative as the frequency increases; that is, the thrust magnitude grows monotonically with frequency. This monotonic trend suggests that higher heaving frequencies generate larger effective angles of attack and stronger reverse Kármán vortex streets, which enhance the jet-like momentum surplus in the wake. No positive drag is observed even at the lowest frequencies, implying that the heave-induced thrust always overcomes the viscous and wave drag within the present parameter range.
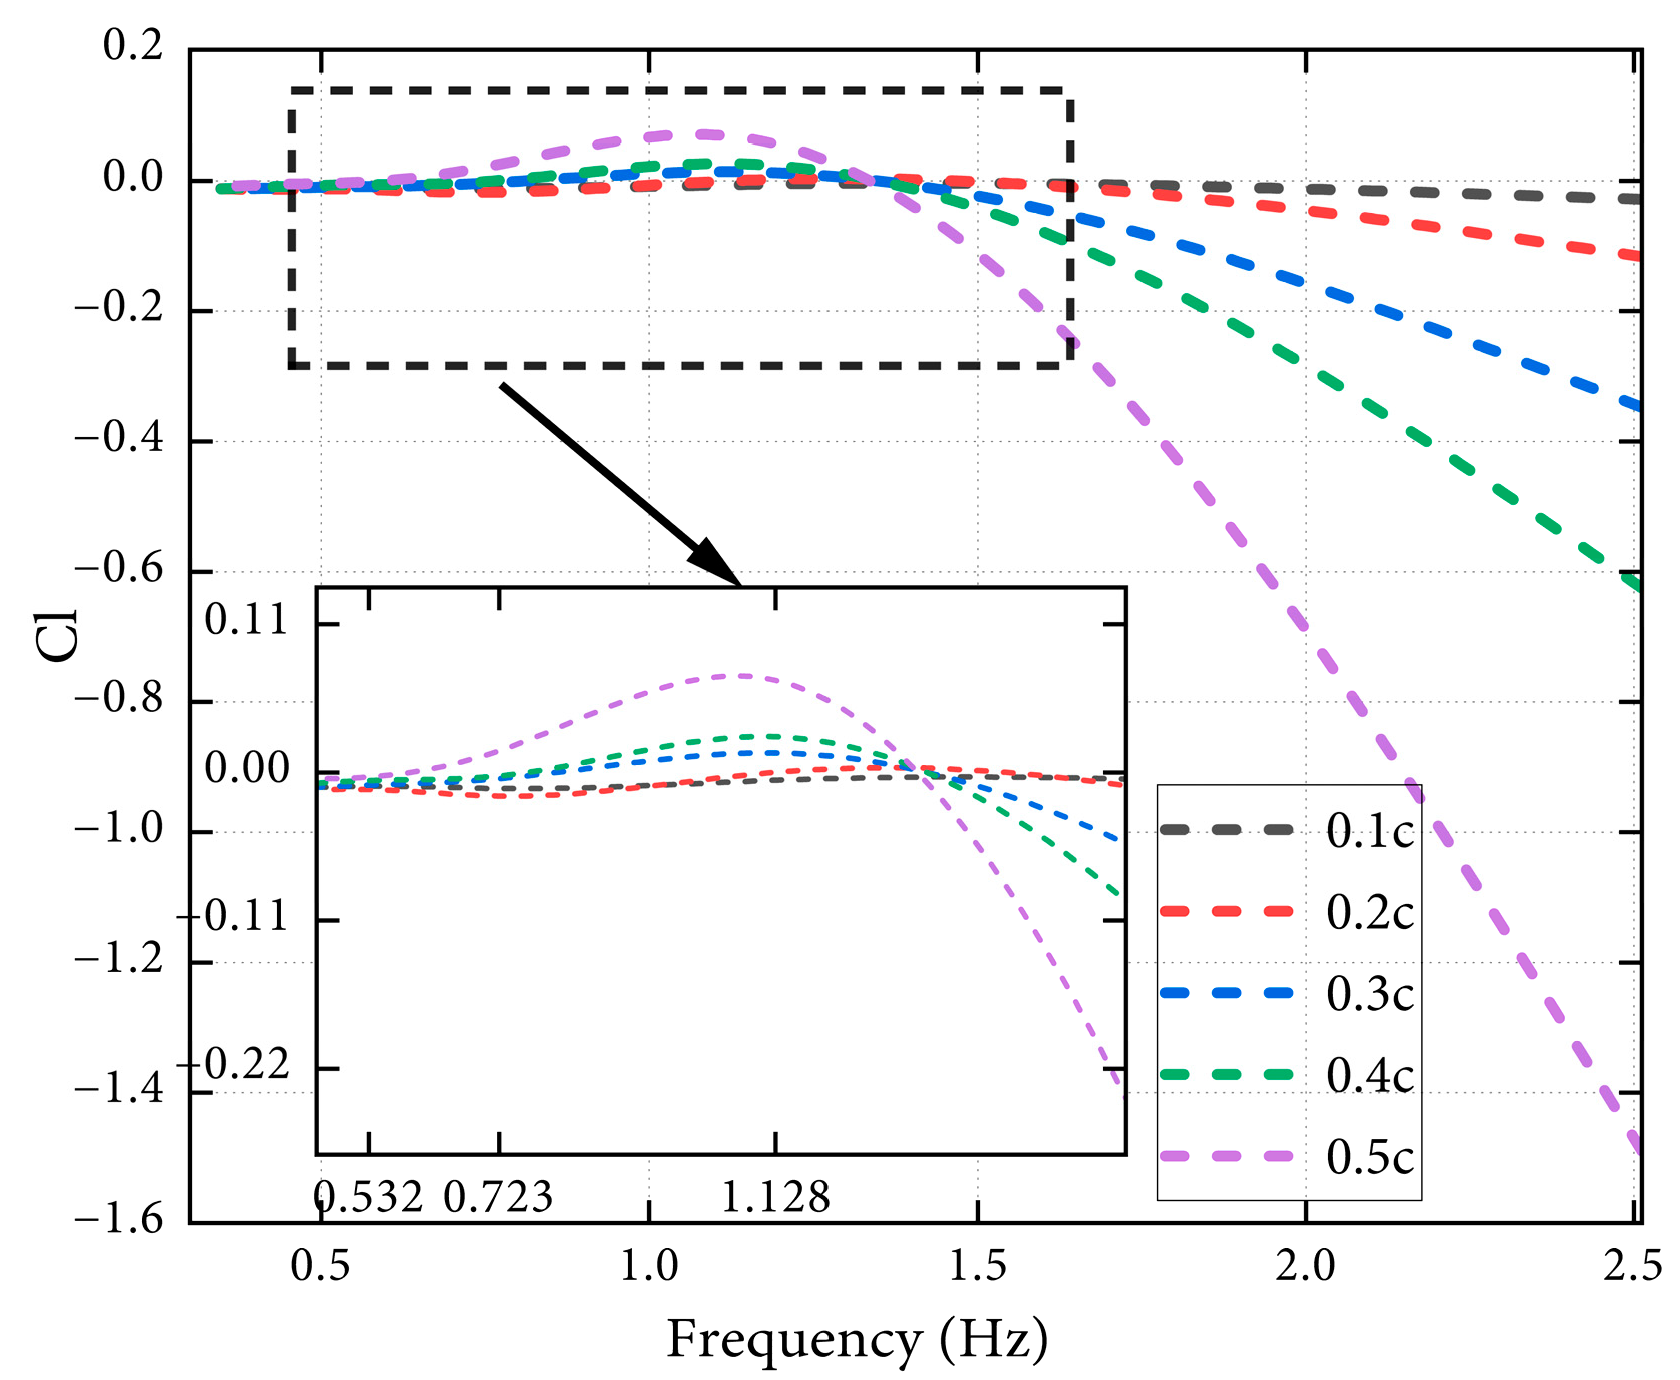
Figure 2: Lift coefficient for h0/c = 0.1–0.5 at U∞ = 0.2 m/s, Re = 2.0 × 10⁴, d/c = 1, and AR = 1.
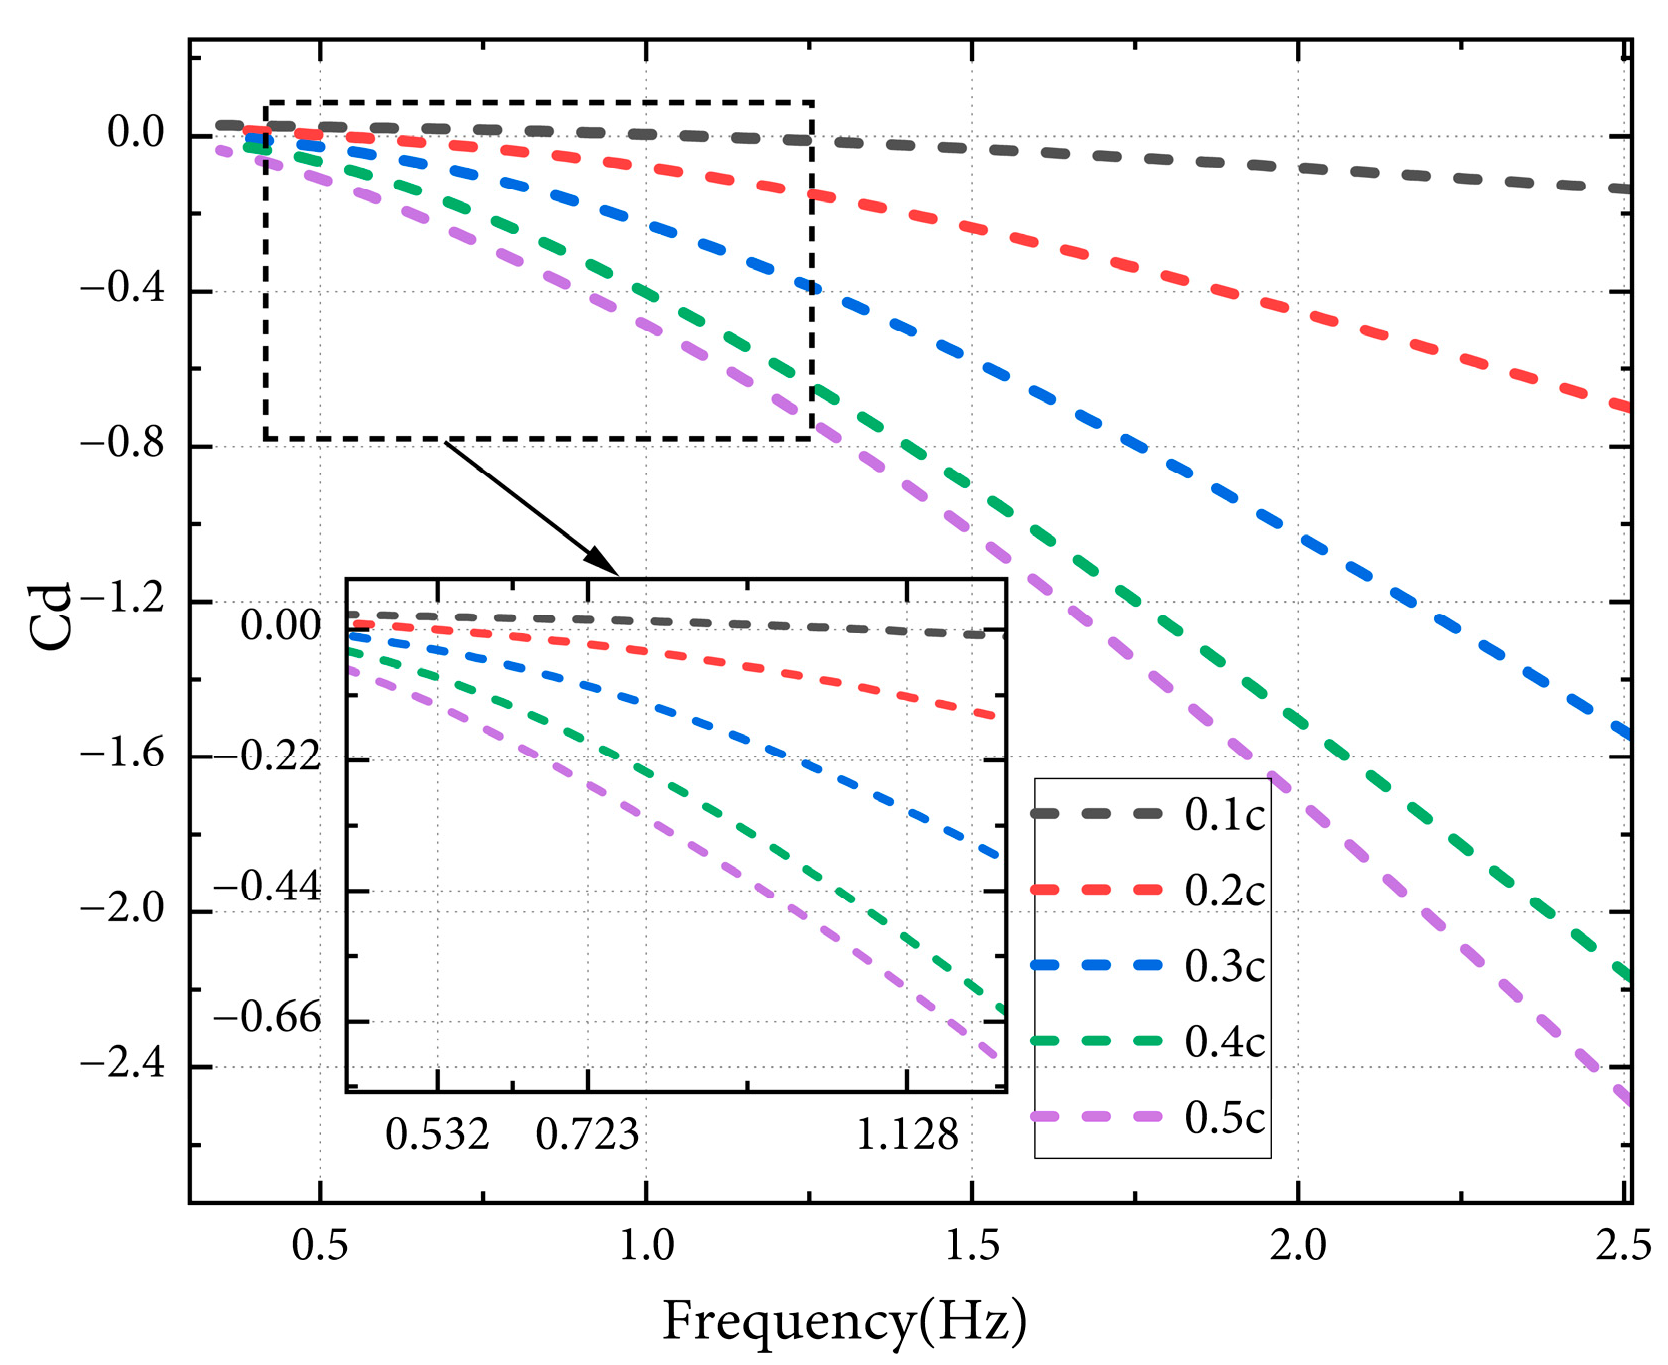
Figure 3: Drag coefficient for h0/c = 0.1–0.5 at U∞ = 0.2 m/s, Re = 2.0 × 10⁴, d/c = 1, and AR = 1.
The spacing among the amplitude-dependent curves also changes with frequency, indicating that the sensitivity of the force coefficients to heave amplitude is not uniform over the investigated frequency range. In particular, the differences among the amplitude cases are relatively limited at lower frequencies but become more pronounced as the frequency increases. This observation is treated here as a qualitative conditional dependence rather than as a quantitatively decomposed interaction.
Combining the observations from Fig. 2 and Fig. 3, we note that while higher frequencies produce greater thrust, they also produce more negative lift. The physical mechanism can be understood as follows: a larger heave velocity increases the effective angle of attack, which simultaneously augments both the vertical (lift) and horizontal (thrust) components of the resultant force. The fact that all drag values are negative confirms the dominance of the Knoller–Betz effect under the given submergence depth and inflow velocity.
3.3 Pressure Distribution Analysis
Fig. 4 and Fig. 5 show the chordwise pressure coefficient distributions on the upper and lower surfaces at a fixed spanwise section (y/s = 0.25) for different heave amplitudes. The chordwise coordinate x is defined with its origin at the quarter-chord point (x = 0) and is positive from the leading edge toward the trailing edge. The selected amplitudes are
At t = T/4, the upper surface exhibits a pronounced negative-pressure distribution over most of the chord, whereas the lower surface is mainly characterized by positive pressure. As the amplitude increases from 0.1c to 0.5c, the upper-surface suction becomes much stronger, with the minimum pressure coefficient decreasing from approximately −4 to about −6.5. At the same time, the positive-pressure region on the lower surface also strengthens with increasing amplitude, especially over the mid-chord to near-trailing-edge region. This indicates that even at a phase where the heave velocity is small or close to zero, a larger amplitude can still enlarge the pressure difference between the upper and lower surfaces through stronger acceleration effects and fluid inertial response. This pressure difference is the primary source of the instantaneous normal force and further affects the thrust or drag component through force decomposition.
At t = T/2, the strongest suction peak appears near the leading edge of the upper surface, and its magnitude increases significantly with heave amplitude. For the h0 = 0.1c case, the upper-surface negative pressure is relatively mild. When the amplitude increases to 0.4c and 0.5c, the pressure coefficient near the leading edge can decrease to approximately −16 to −18, followed by rapid pressure recovery downstream. This “strong suction peak–rapid pressure recovery” pattern indicates that larger amplitudes induce stronger local flow acceleration and a larger adverse pressure gradient. Correspondingly, the lower surface forms a relatively stable positive-pressure plateau at this phase, and the pressure level increases with amplitude. The combined effect of strong upper-surface suction and lower-surface positive pressure produces a large pressure difference between the two surfaces, demonstrating the amplification of instantaneous hydrodynamic loading by larger heave amplitudes.
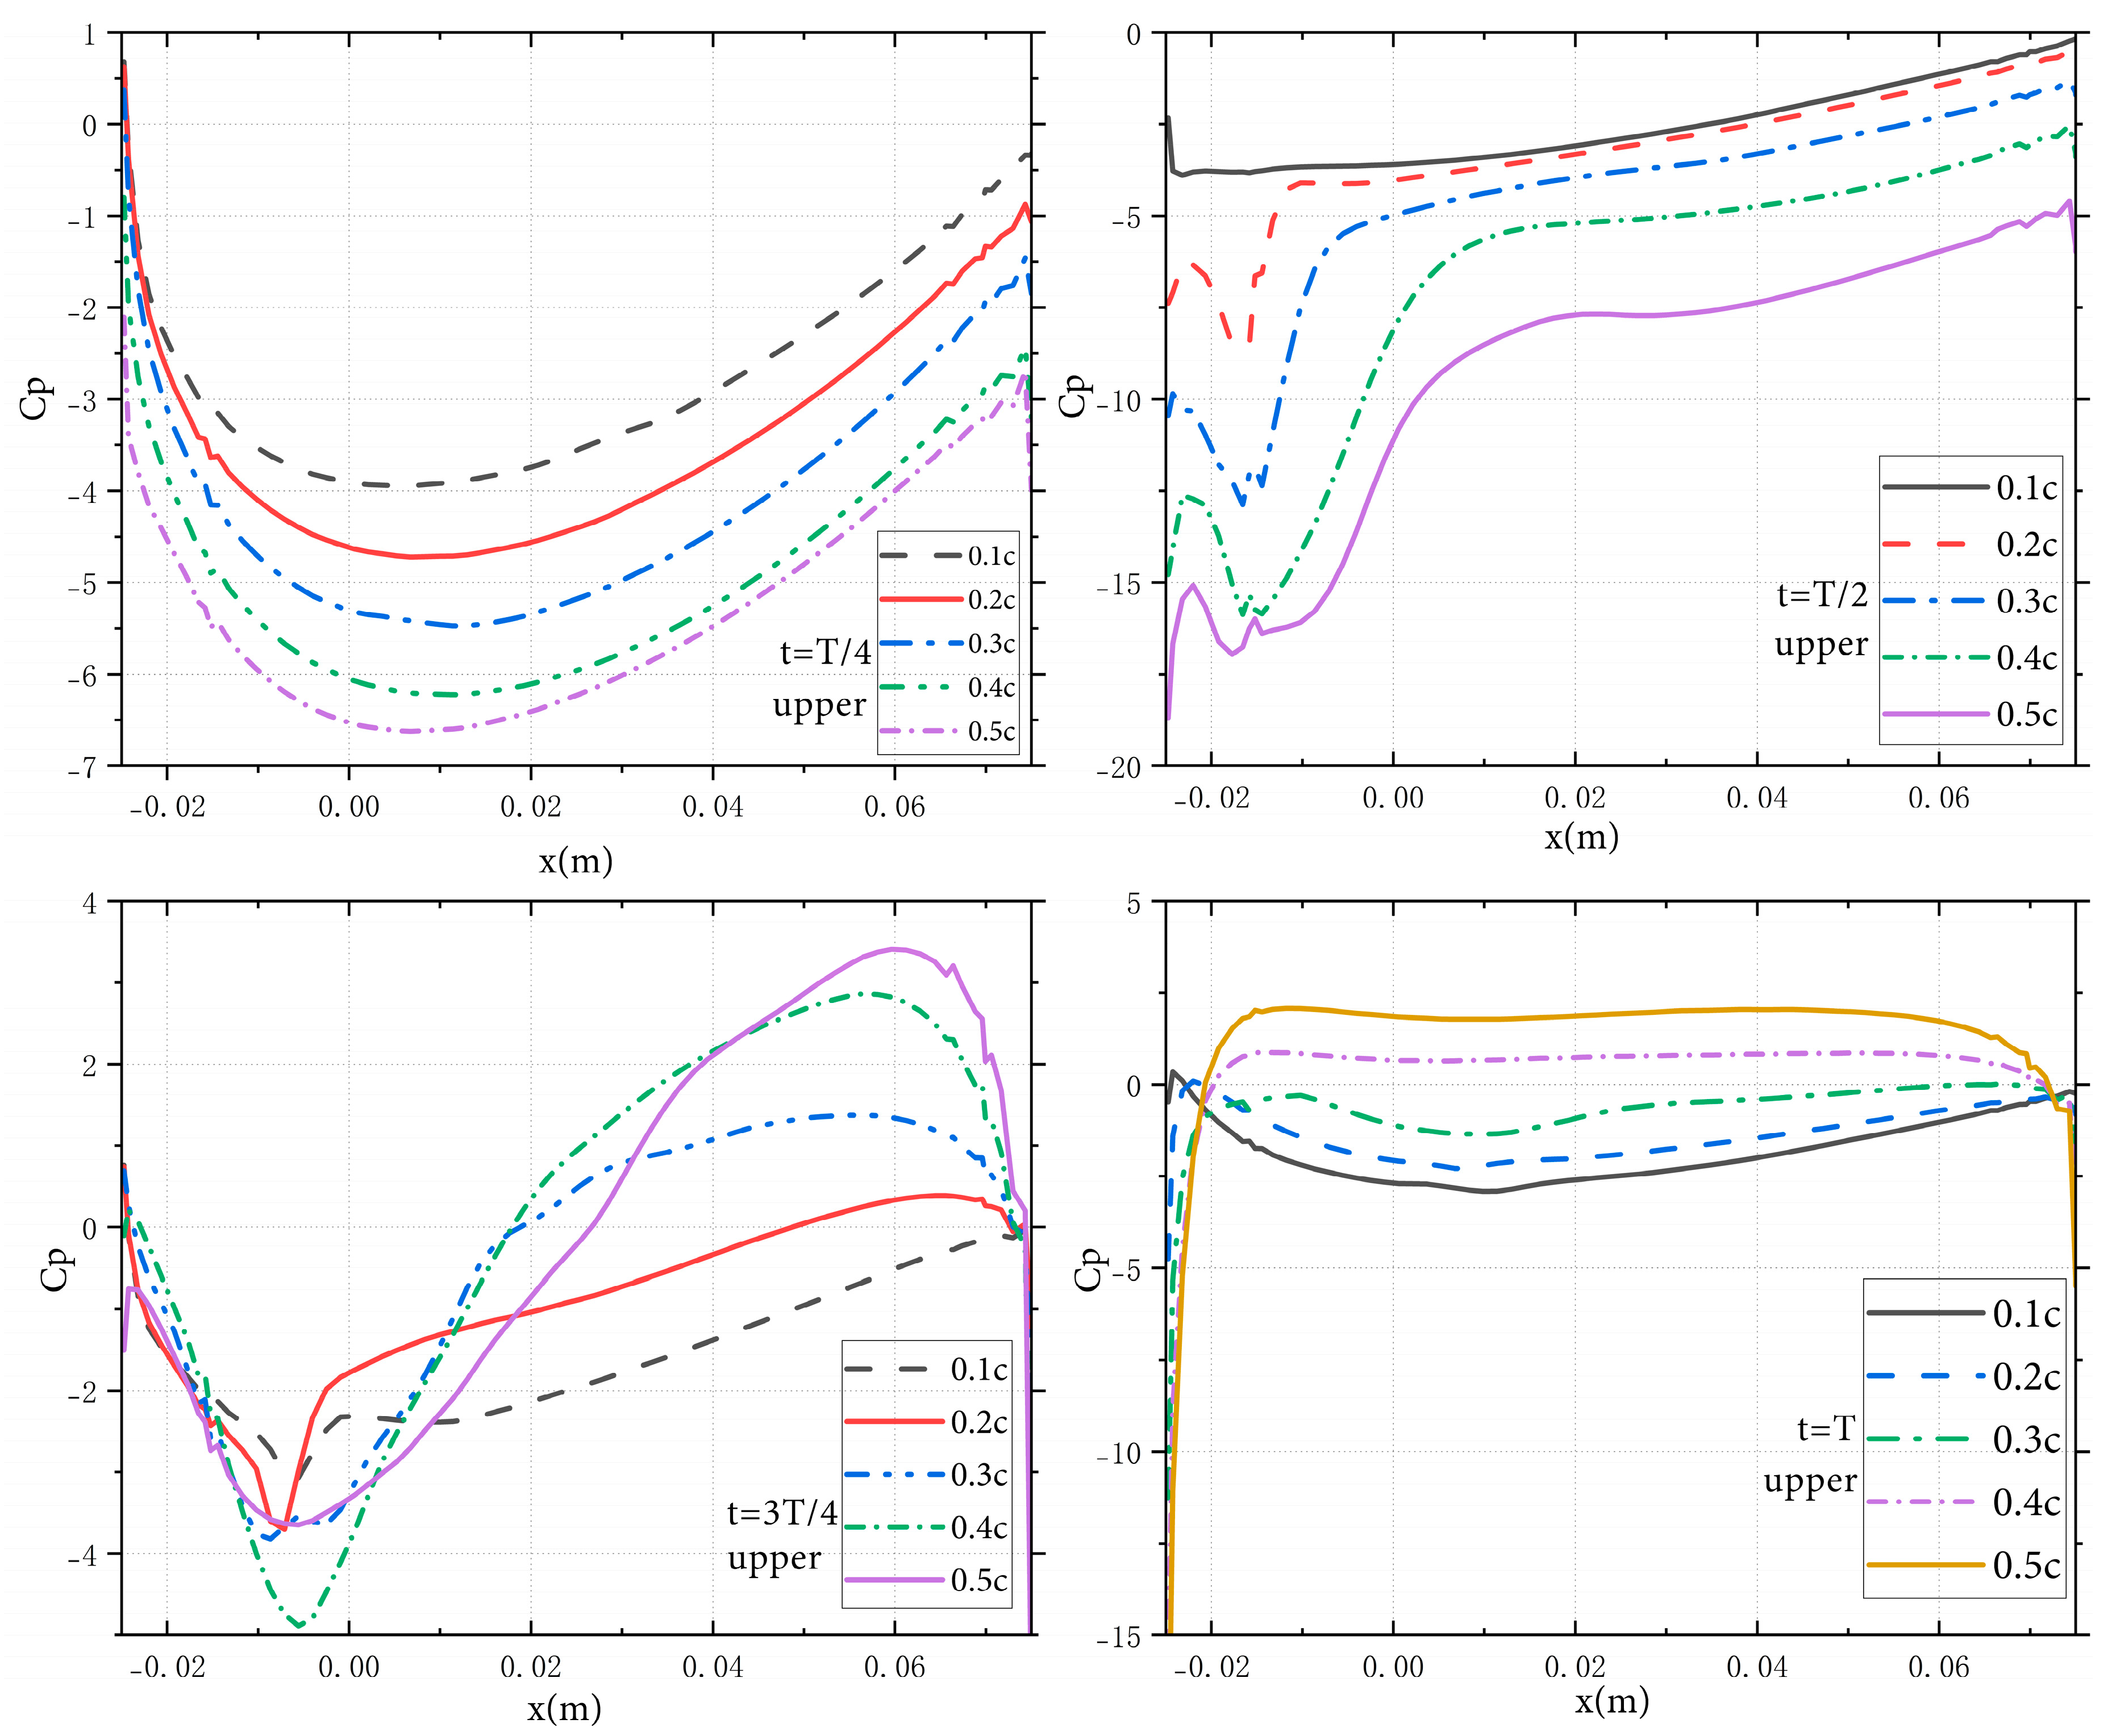
Figure 4: Chordwise pressure-coefficient distributions on the upper surface at the spanwise section y/s = 0.25 for h0/c = 0.1–0.5. The chordwise coordinate x is defined with its origin at the quarter-chord point and is positive from the leading edge toward the trailing edge. The results are obtained at fh = 1.128, d/c = 1, and Re = 2.0 × 10⁴.
At t = 3T/4, a clear phase transition occurs in the pressure distribution. The upper surface no longer remains entirely under negative pressure; instead, the pressure over the mid-chord to trailing-edge region gradually changes to positive values, especially for the small-amplitude cases. In contrast, the large-amplitude cases still retain strong negative pressure near the leading edge and the front part of the chord before recovering toward positive pressure downstream. This suggests that as the amplitude increases, the pressure field exhibits a certain phase lag relative to the prescribed heaving motion, and the local suction does not disappear immediately when the heaving direction changes. On the lower surface, the pressure changes from weak positive values at small amplitudes to negative values at large amplitudes, indicating that the suction-dominated region is being transferred from one surface to the other. This transition reflects the unsteady nature of pure heaving motion and shows that the pressure responses on the two surfaces are not simply symmetric.
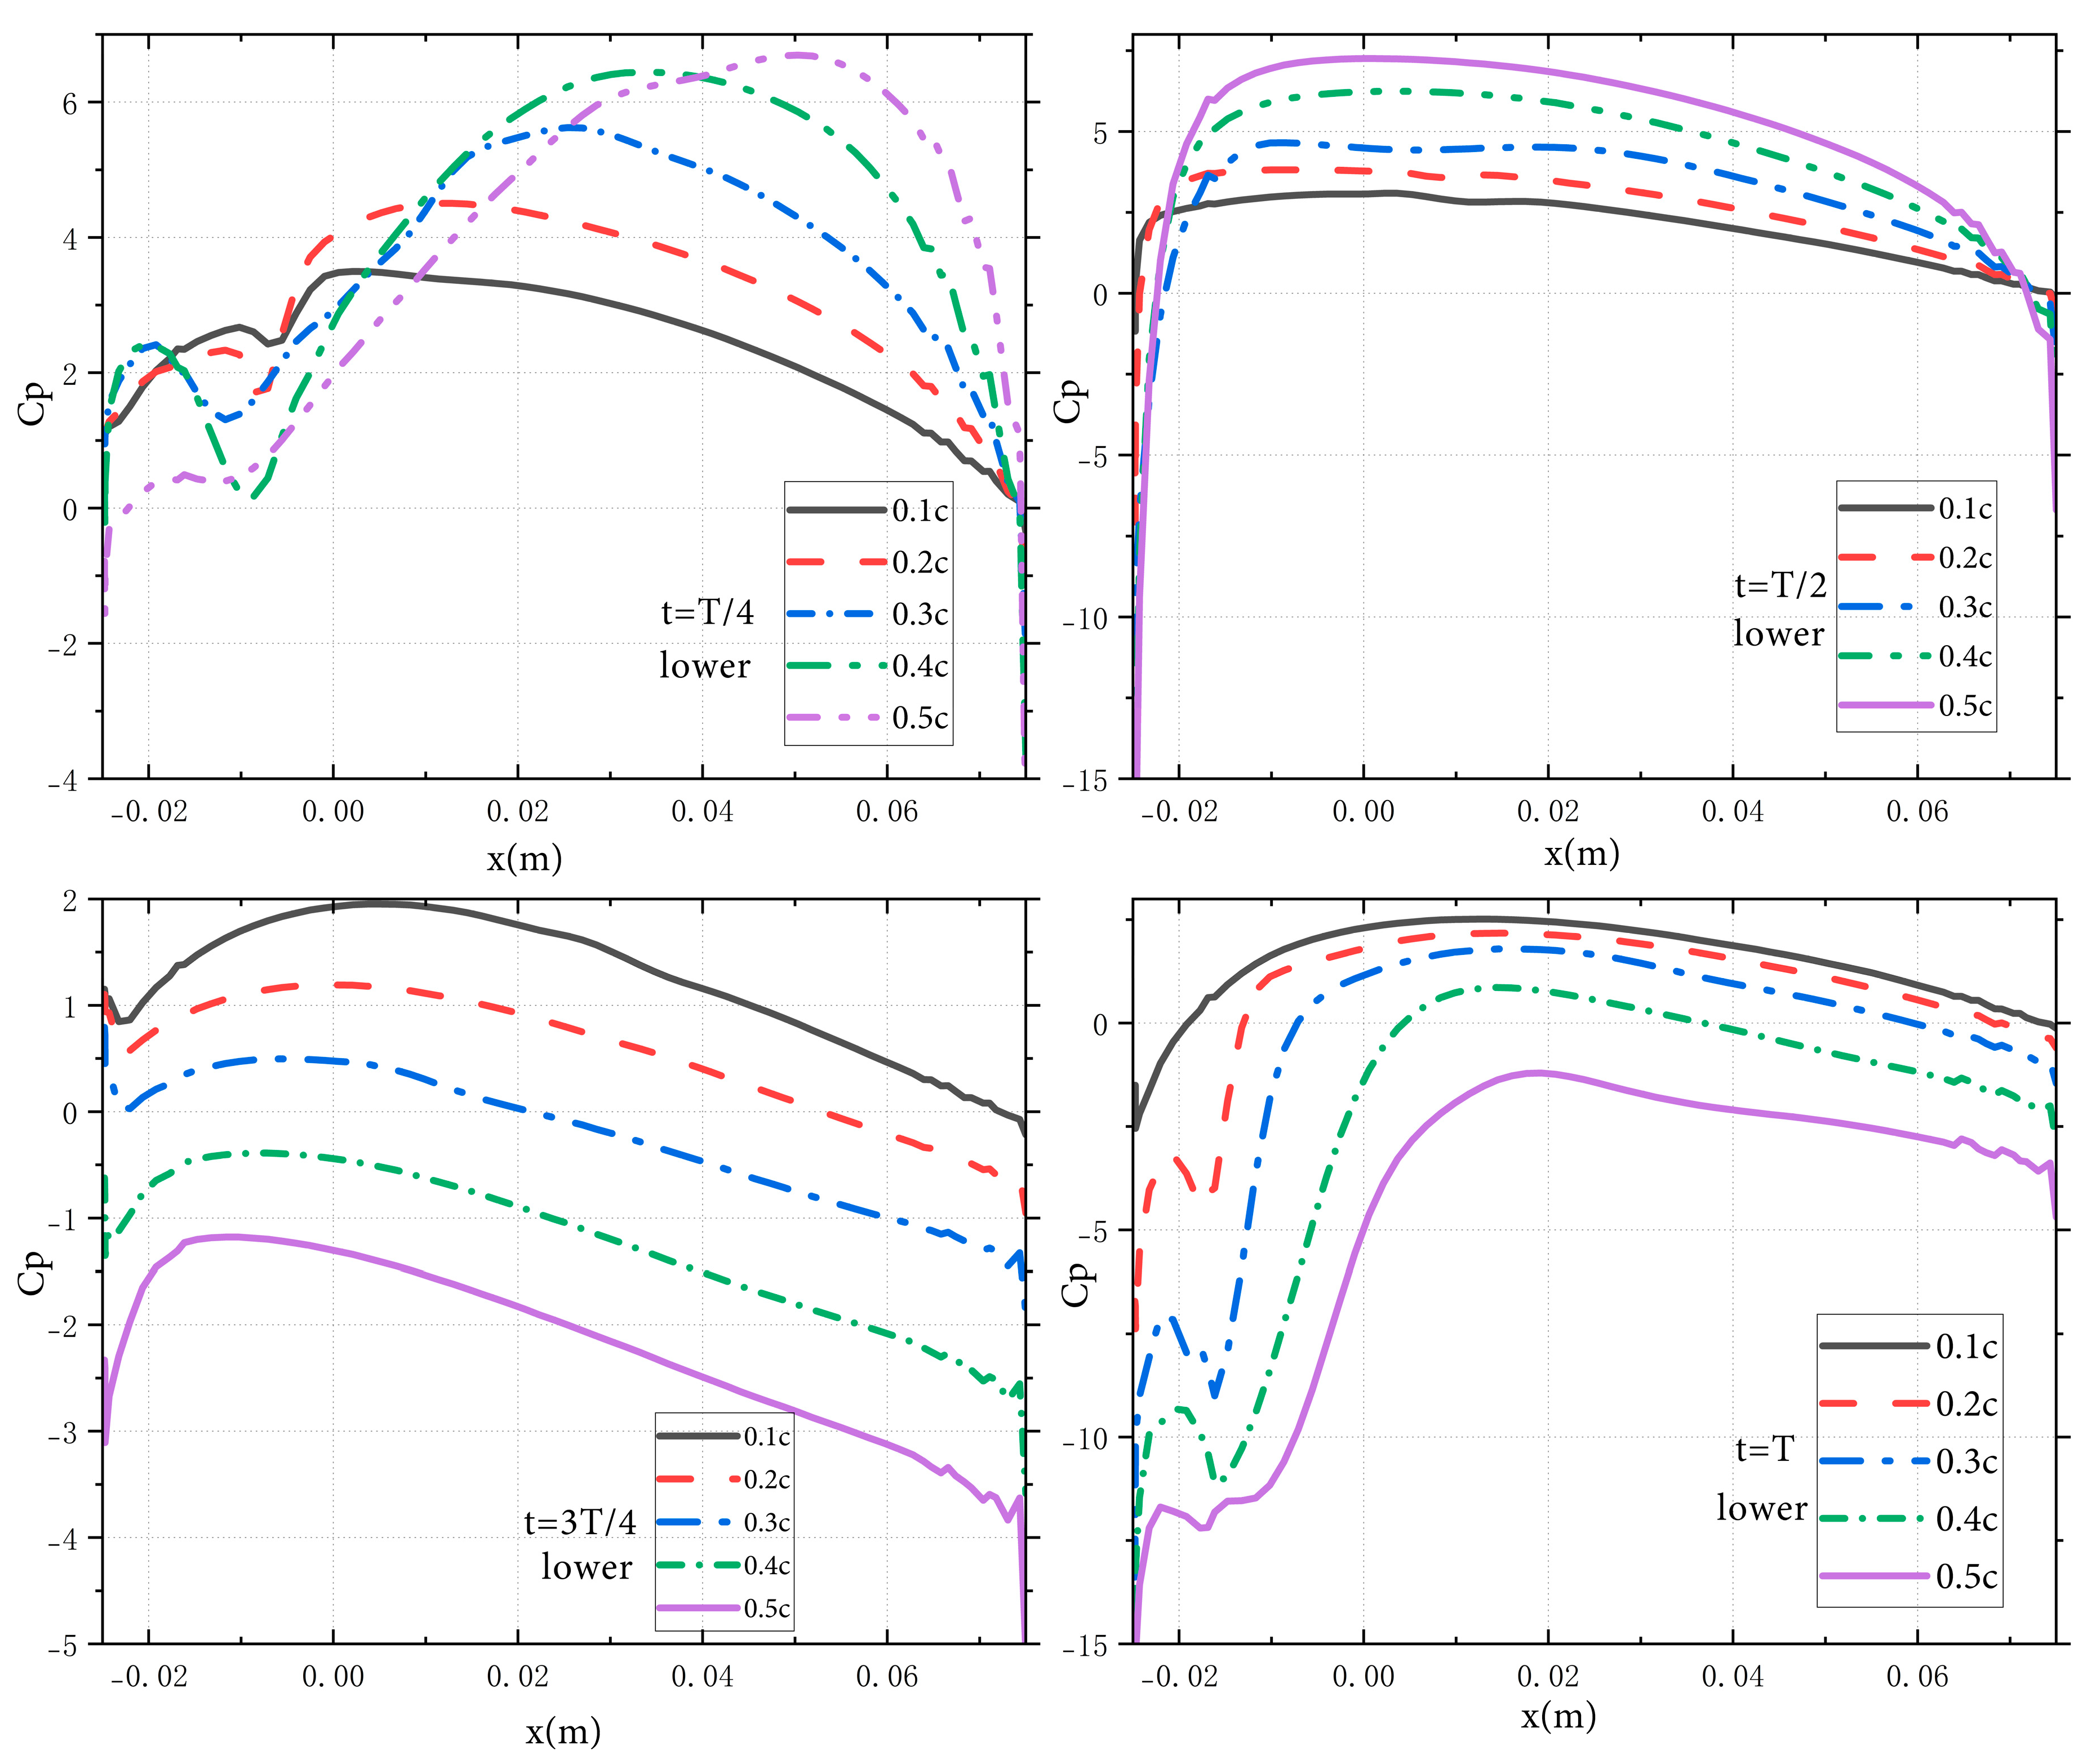
Figure 5: Chordwise pressure-coefficient distributions on the lower surface at the spanwise section y/s = 0.25 for h0/c = 0.1–0.5. The chordwise coordinate x is defined with its origin at the quarter-chord point and is positive from the leading edge toward the trailing edge. The results are obtained at fh = 1.128, d/c = 1, and Re = 2.0 × 10⁴.
At t = T, a sharp local suction peak still exists near the leading edge, which is a typical feature of local leading-edge acceleration during unsteady motion of a NACA0012 hydrofoil. For small amplitudes, the upper surface remains generally under weak negative pressure, whereas for h0 = 0.4c and h0 = 0.5c, a weak positive-pressure region or pressure plateau gradually forms over the mid-chord region. Meanwhile, the lower surface exhibits stronger leading-edge suction in the large-amplitude cases and maintains a pronounced negative-pressure distribution over a considerable chordwise range. This indicates that the suction-dominated region has been transferred to the lower surface at this phase. In other words, after the heaving direction changes, the pressure roles of the upper and lower surfaces are reversed, which is consistent with the physical mechanism that the effective angle of attack changes sign with the heaving velocity direction.
Overall, Fig. 4 and Fig. 5 show that increasing heave amplitude modifies the pressure distribution in three main ways. First, a larger amplitude strengthens the leading-edge suction peak and significantly increases the local pressure gradient. Second, it enlarges the pressure difference between the upper and lower surfaces, thereby enhancing the generation of instantaneous normal force and thrust component. Third, it makes the pressure recovery process more abrupt, especially behind the leading edge, where a stronger adverse pressure gradient may increase the possibility of local separation or leading-edge vortex formation. Therefore, the pressure-distribution results provide a local flow explanation for the variation of lift and drag coefficients discussed earlier. A moderate increase in amplitude is beneficial for strengthening the heave-induced hydrodynamic response, but an excessively large amplitude may redirect more input energy into local vortex structures and free-surface disturbances rather than converting it entirely into useful thrust.
3.4 Free-Surface Wave Height Analysis
The time-resolved free-surface wave profiles corresponding to heave amplitudes h0 = 0.1c to 0.3c are shown in Fig. 6. These profiles illustrate the chordwise variation of the wave elevation along the spanwise center section of the hydrofoil. A clear trend is observed: as the heave amplitude increases, both the peak elevation and trough depth of the free surface increase, indicating a nonlinear amplification of wave generation due to stronger hydrofoil-induced fluid acceleration.
At h0 = 0.1c, the wave amplitudes remain small and relatively symmetric along the chord, reflecting a near-linear response of the free surface under weak excitation. The maximum wave elevation is approximately 0.002 m, where the free-surface behaves analogously to a solid boundary with minimal nonlinear deformation. With increased amplitude h0 = 0.2c and 0.3c, the wave height grows rapidly and the profiles exhibit clear asymmetry, with the crests more pronounced than the troughs. This is indicative of nonlinear free-surface effects, where larger heaving motions induce stronger vortex shedding and surface wave steepening, contributing to increased wave resistance in subcritical Froude regimes.
The amplification of the free-surface elevation with heave amplitude demonstrates two critical mechanisms. First, larger amplitudes induce stronger local fluid acceleration, which enhances both the peak and trough through nonlinear inertial effects. Second, the interaction with the hydrofoil’s added-mass contribution further accentuates the wave height.
The increased free-surface wave height directly affects the instantaneous normal forces acting on the hydrofoil. Larger wave elevations lead to higher variations in pressure distribution along the chord, which contributes to enhanced lift and thrust components during the heaving cycle. However, excessive amplitude may lead to early wave breaking or localized flow separation, potentially converting useful input energy into unproductive free-surface disturbances.
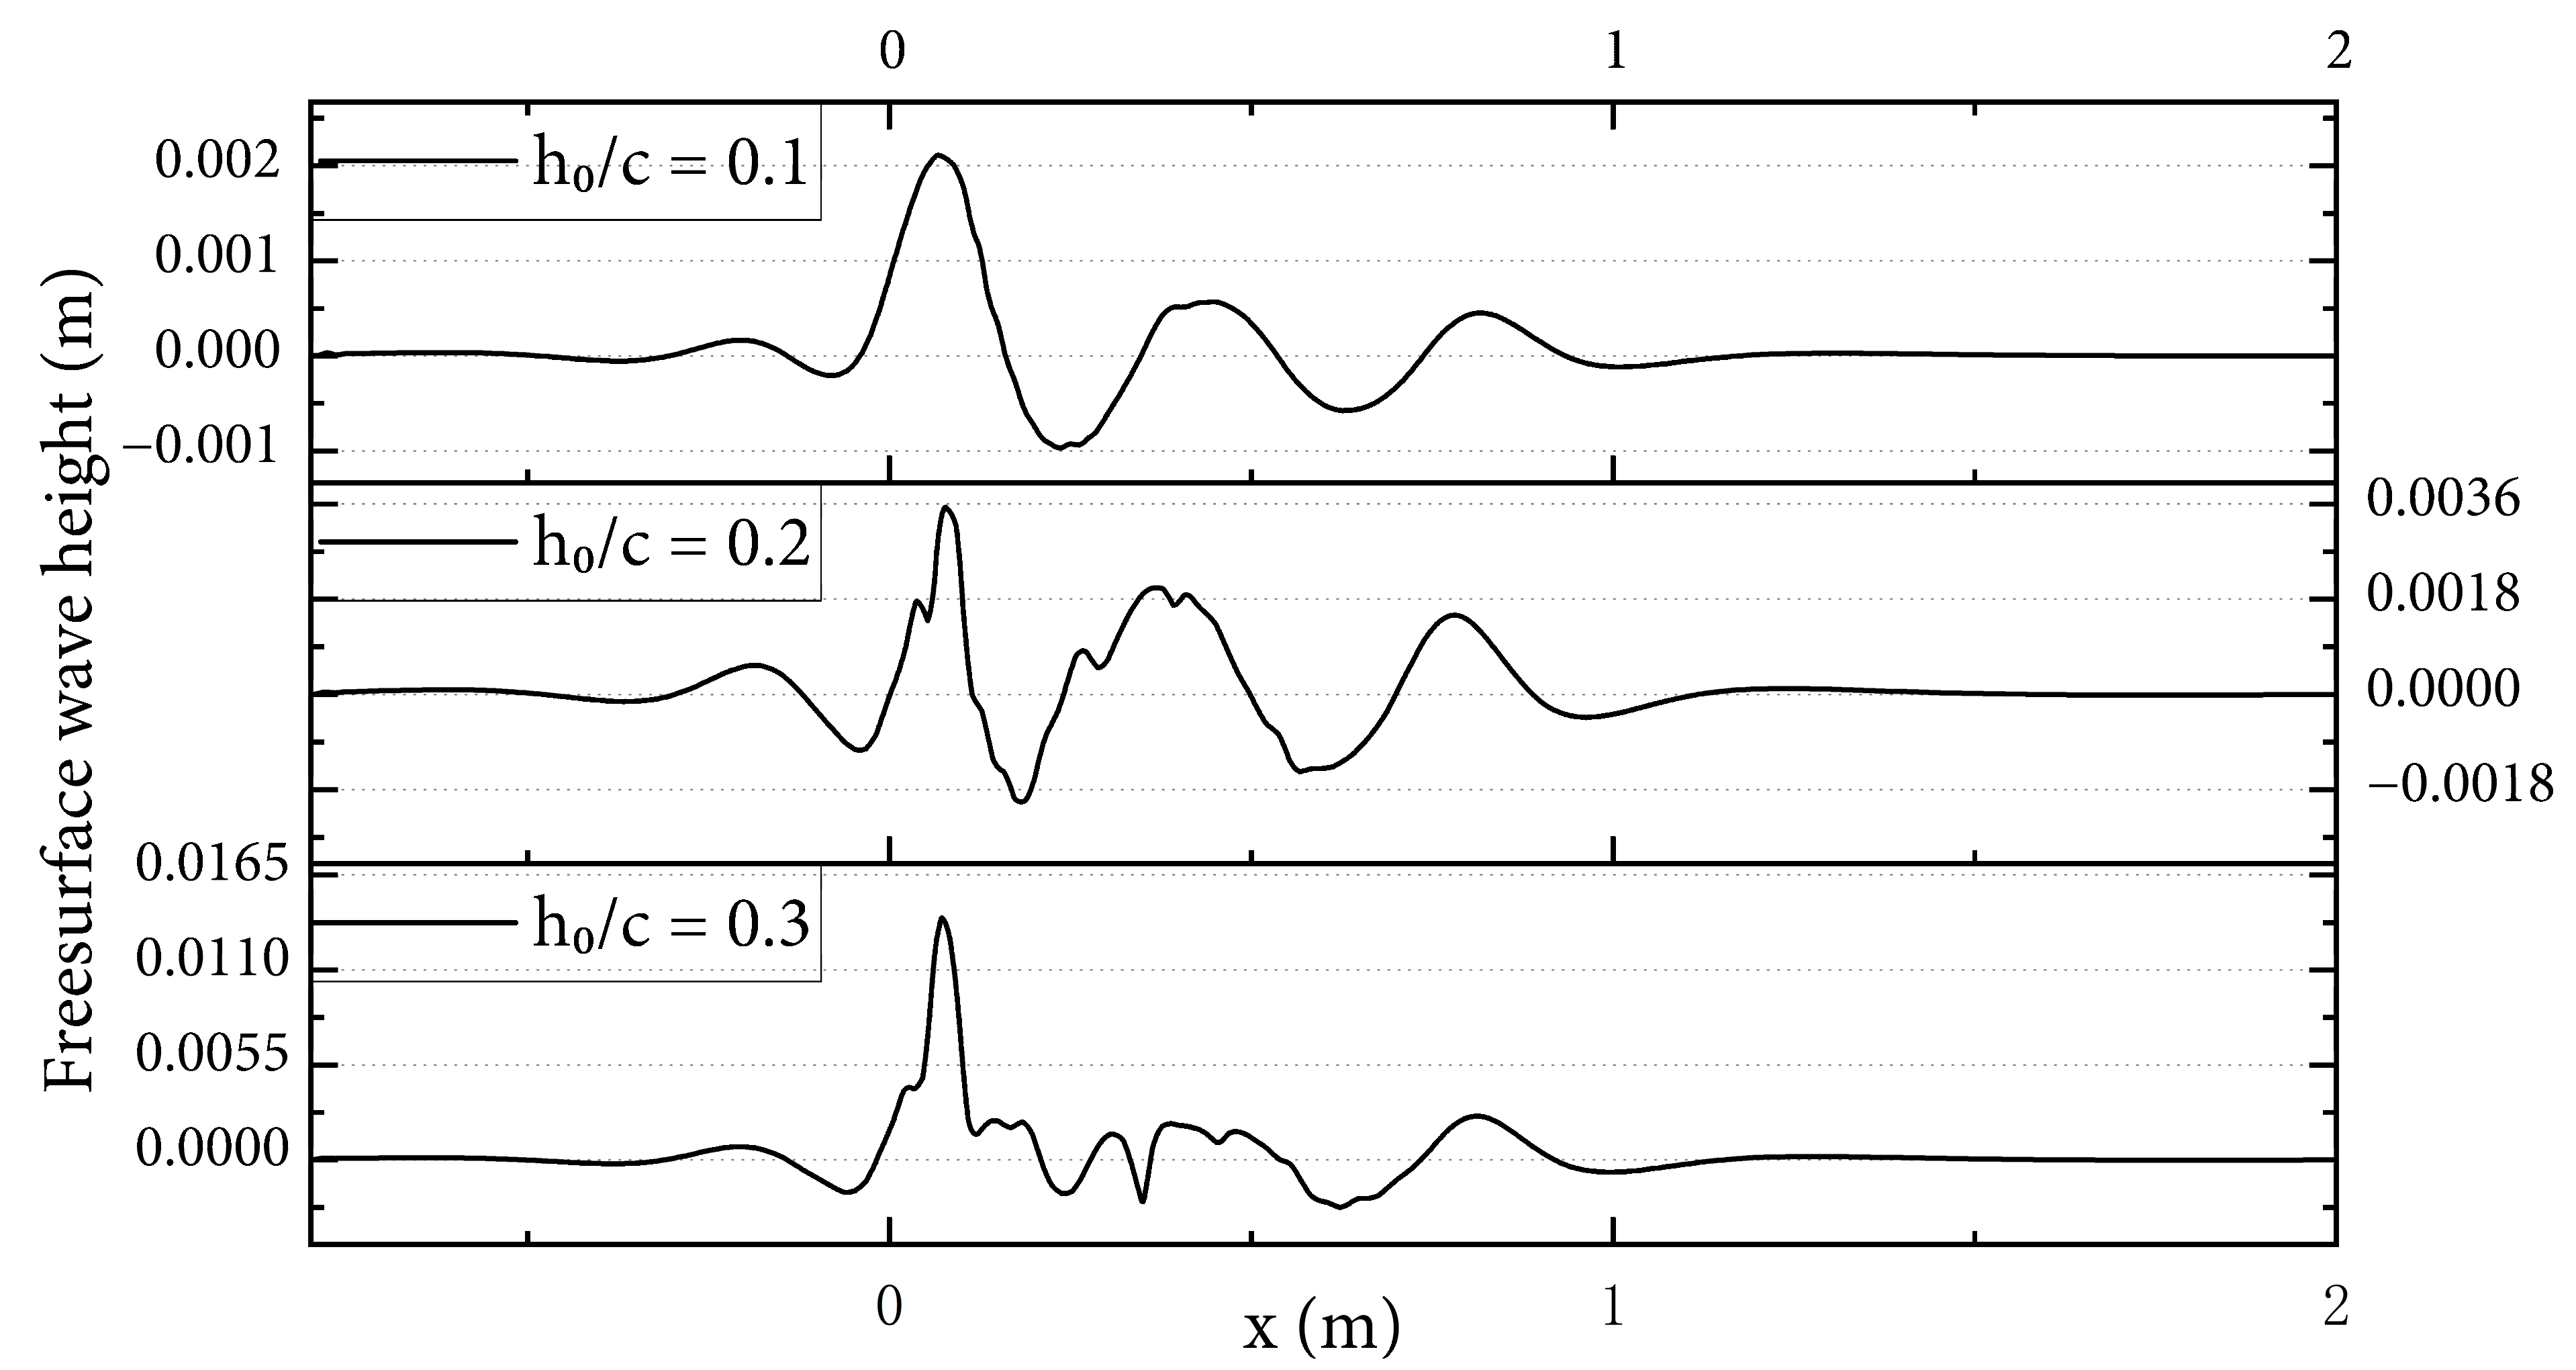
Figure 6: Free-surface wave height for h0/c = 0.1, 0.2, and 0.3 at fh = 1.128, d/c = 1, and Re = 2.0 × 10⁴.
3.5 Vorticity Field Distribution
The vorticity fields for heave amplitudes h0 = 0.2c, 0.3c, 0.4c at a fixed mean depth and frequency fh = 1.128 Hz are shown in Fig. 7. The contour plots illustrate the evolution of the vortex structures around the hydrofoil and in the wake, with blue representing negative vorticity and red representing positive vorticity.
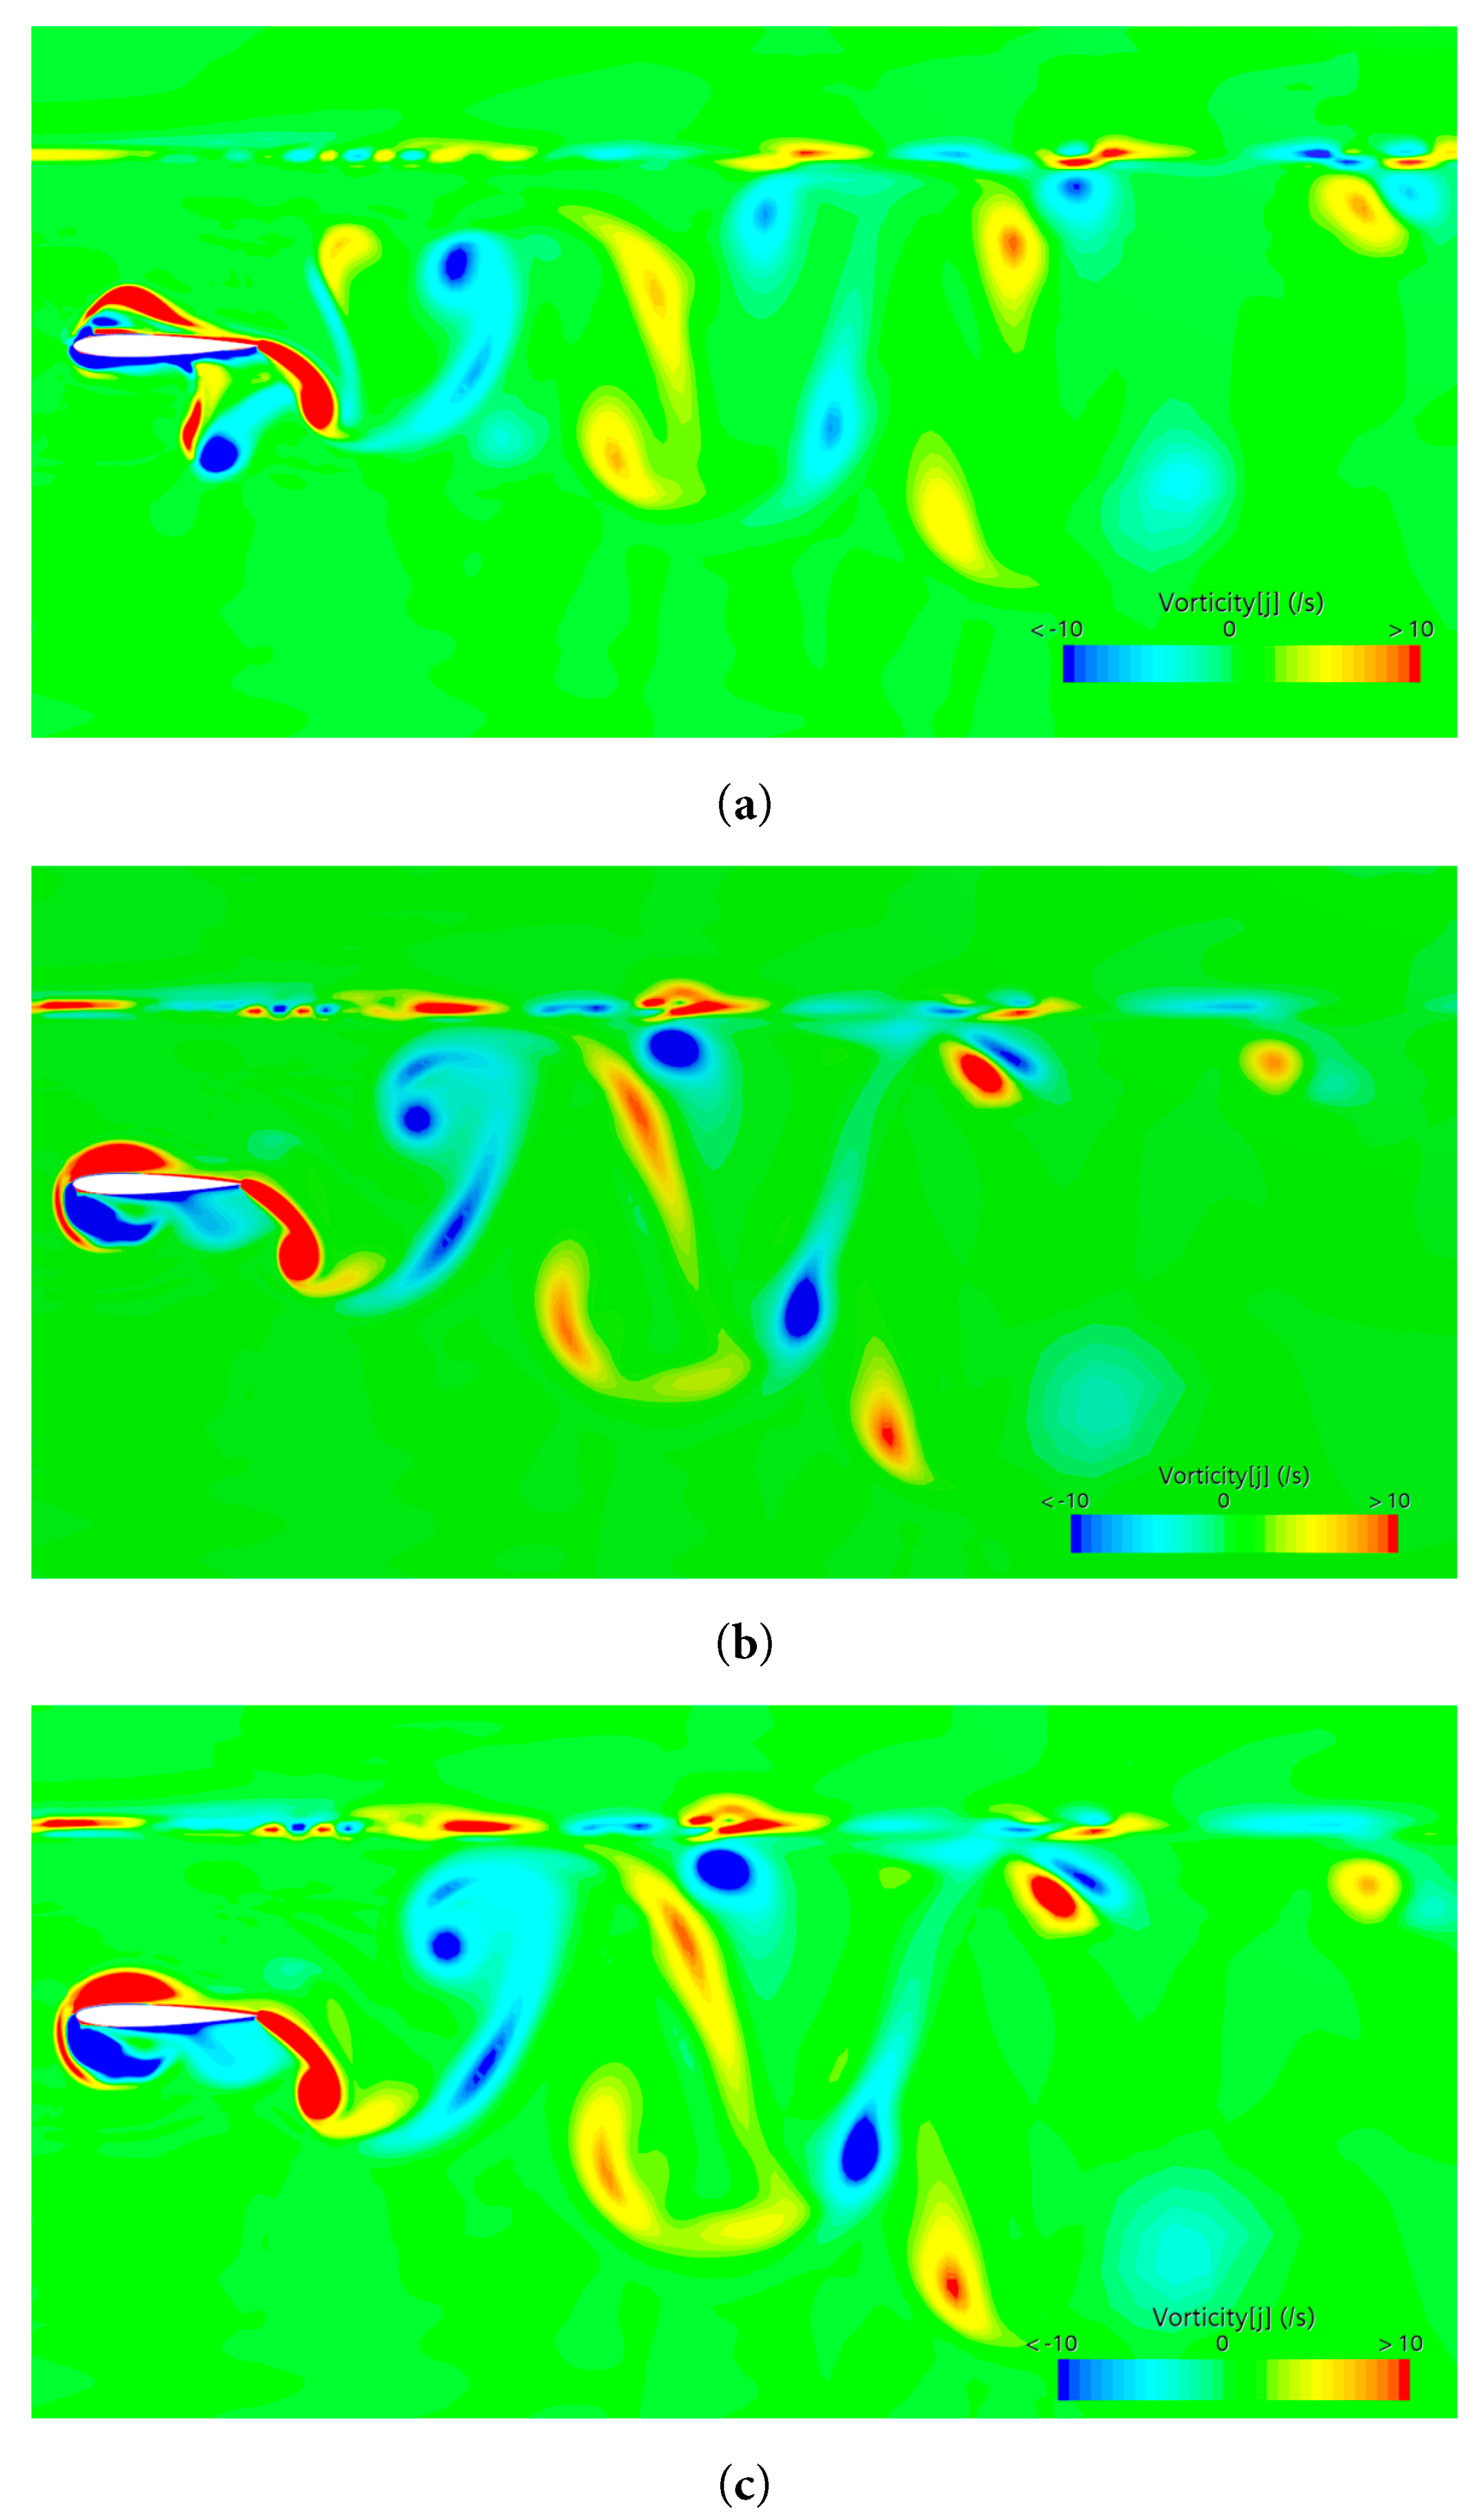
Figure 7: Instantaneous vorticity distributions around the hydrofoil and in the wake for (a) h0/c = 0.2, (b) h0/c = 0.3, and (c) h0/c = 0.4 at fh = 1.128, d/c = 1, Re = 2.0 × 10⁴. Red and blue denote positive and negative vorticity, respectively.
For h0 = 0.2c, the vorticity field shows the formation of regular alternating vortices behind the hydrofoil, which are approximately symmetric along the midspan. The positive and negative vortices are relatively weak, indicating low-intensity momentum transfer to the wake. This is consistent with the onset of nonlinear free-surface behavior at h0 = 0.2c observed in the wave-height analysis.
Increasing the heave amplitude to h0 = 0.3c leads to stronger and more elongated vortices. The alternating pattern remains, but the vortex cores are more pronounced, and the downstream wake exhibits early signs of vortex merging and deformation. This indicates stronger nonlinear fluid interaction and increased energy input into the wake, consistent with experimental and CFD studies for shallowly submerged hydrofoils [12]. At h0 = 0.4c, the wake becomes highly nonlinear. Large-scale vortices shed from the leading and trailing edges interact, creating a complex, asymmetric vorticity distribution. Vortex pairing and stretching are observed, which may enhance local flow acceleration near the free surface and contribute to stronger wave generation. These features are in line with previous studies showing that higher heave amplitudes amplify free-surface perturbations and momentum exchange in the wake.
All three amplitudes exhibit a tendency for stronger vorticity near the free surface, reflecting the coupling between vertical hydrofoil motion and free-surface deformation. The maximum positive and negative vorticity peaks increase with amplitude, indicating that more kinetic energy is being imparted to both the water and the free surface, which can enhance lift and thrust generation but also increases the potential for vortex-induced unsteady loads [14,15].
This study numerically investigated the hydrodynamic characteristics of a pure heaving NACA0012 hydrofoil operating beneath a free surface. The results show that the heaving motion can generate net thrust over the examined parameter range, while the lift remains mainly directed downward. Increasing the oscillation frequency enhances the thrust production, indicating that the heave-induced effective angle of attack and wake momentum exchange play a dominant role in the propulsive response.
The heave amplitude strongly affects the local pressure distribution, free-surface deformation, and wake evolution. Larger amplitudes intensify the leading-edge suction peak and enlarge the pressure difference between the upper and lower surfaces, thereby increasing the instantaneous hydrodynamic loading. Meanwhile, the free-surface wave height and wake vorticity increase markedly with amplitude, demonstrating stronger coupling among hydrofoil motion, vortex shedding, and surface-wave generation.
From an engineering perspective, amplitude and frequency should not be increased solely to maximize thrust. Larger h0/c and f increase the effective heave velocity and can enhance thrust, but they also intensify leading-edge suction, pressure gradients, free-surface waves, and vortex-induced load fluctuations. For near-surface unmanned or bio-inspired vehicles, the operating envelope should therefore balance thrust demand against structural loading, wave signature, and energy transferred into surface deformation. The present results provide a parameter-screening basis at Re = 2.0 × 10⁴ and d/c = 1.0 rather than a universal optimum. Future work should include experimental or benchmark validation, systematic variations of d/c, Fr, Re, and aspect ratio, direct evaluation of input power and propulsive efficiency, incident-wave conditions, transition and cavitation effects, and phase-resolved decomposition of circulatory, added-mass, vortex, and wave-radiation contributions.
The present work provides a systematic comparative assessment of the combined amplitude and period effects, but it does not perform a formal decomposition of their interaction. Future studies may employ response-surface analysis, variance-based sensitivity methods, or an expanded parameter matrix to quantify the independent and interaction contributions of the governing motion parameters.
Overall, the hydrodynamic performance of a near-surface heaving hydrofoil is governed by a balance between useful thrust generation and energy loss associated with free-surface waves and vortex structures. Moderate increases in amplitude and frequency are beneficial for enhancing thrust, whereas excessively large amplitudes may transfer more input energy into wave deformation and unsteady vortical motion. These findings provide physical insight for selecting suitable motion parameters of heaving hydrofoils operating near a free surface.
Acknowledgement:
Funding Statement: This study was financially supported by China Scholarship Council under Contract No. CSC202506680120.
Author Contributions: The authors confirm contribution to the paper as follows: study conception and design: Bowen Zhao, Decai Qu; data collection: Feiyang Liu; analysis and interpretation of results: Feiyang Liu; draft manuscript preparation: Feiyang Liu; manuscript review and editing: Yi Zhou. All authors reviewed and approved the final version of the manuscript.
Availability of Data and Materials: Data is contained within the article.
Ethics Approval: Not applicable.
Conflicts of Interest: The authors declare no conflicts of interest.
References
1. Rozhdestvensky K , Zhao B . Recent advances in hydrodynamics of wing propulsive lifting systems for ships and underwater vehicles. Phys Fluids. 2023; 35( 11): 111302. doi:10.1063/5.0169938. [Google Scholar] [CrossRef]
2. Rozhdestvensky K . Study of underwater and wave gliders on the basis of simplified mathematical models. Appl Sci. 2022; 12( 7): 3465. doi:10.3390/app12073465. [Google Scholar] [CrossRef]
3. Wu X , Zhang X , Tian X , Li X , Lu W . A review on fluid dynamics of flapping foils. Ocean Eng. 2020; 195: 106712. doi:10.1016/j.oceaneng.2019.106712. [Google Scholar] [CrossRef]
4. Akbari Vakilabadi K , Ghafari HR , Ghassemi H . Investigation of front hydrofoil position influence on the hydrofoil-assisted craft. Ocean Eng. 2024; 304: 117901. doi:10.1016/j.oceaneng.2024.117901. [Google Scholar] [CrossRef]
5. Amini Y , Kianmehr B , Emdad H . Dynamic stall simulation of a pitching hydrofoil near free surface by using the volume of fluid method. Ocean Eng. 2019; 192: 106553. doi:10.1016/j.oceaneng.2019.106553. [Google Scholar] [CrossRef]
6. Shao Y , Wang W , Wan D , Wang J . Numerical investigations of breaking waves and air entrainment induced by a shallowly submerged hydrofoil. Ocean Eng. 2024; 312: 119026. doi:10.1016/j.oceaneng.2024.119026. [Google Scholar] [CrossRef]
7. Pernod L , Sacher M , Wackers J , Augier B , Bot P . Free-surface effects on two-dimensional hydrofoils by RANS-VOF simulations. J Sail Technol. 2023; 8( 1): 24– 38. doi:10.5957/jst/2023.8.2.24. [Google Scholar] [CrossRef]
8. Daskovsky M . The hydrofoil in surface proximity, theory and experiment. Ocean Eng. 2000; 27( 10): 1129– 59. doi:10.1016/S0029-8018(99)00032-3. [Google Scholar] [CrossRef]
9. Marshall JS , Johnson ER . The high-speed submerged hydrofoil. J Fluid Mech. 2023; 954: A45. doi:10.1017/jfm.2022.1042. [Google Scholar] [CrossRef]
10. Duncan JH . The breaking and non-breaking wave resistance of a two-dimensional hydrofoil. J Fluid Mech. 1983; 126: 507– 20. doi:10.1017/s0022112083000294. [Google Scholar] [CrossRef]
11. Ali A , Karim M . Numerical study of free surface effect on the flow around shallowly submerged hydrofoil. In: Proceedings of MARTEC 2010 The International Conference on Marine Technology; 2010 Dec 11–12; Dhaka, Bangladesh. [Google Scholar]
12. Prasad B , Hino T , Suzuki K . Numerical simulation of free surface flows around shallowly submerged hydrofoil by OpenFOAM. Ocean Eng. 2015; 102: 87– 94. doi:10.1016/j.oceaneng.2015.04.049. [Google Scholar] [CrossRef]
13. Biswas S , Harish R . Effect of unsteady cavitation on hydrodynamic performance of NACA 4412 Hydrofoil with novel triangular slot. Heliyon. 2025; 11( 3): e42266. doi:10.1016/j.heliyon.2025.e42266. [Google Scholar] [CrossRef]
14. Cleaver DJ , Calderon DE , Wang Z , Gursul I . Periodically plunging foil near a free surface. Exp Fluids. 2013; 54( 3): 1491. doi:10.1007/s00348-013-1491-9. [Google Scholar] [CrossRef]
15. Esmaeilifar E , Hassan Djavareshkian M , Forouzi Feshalami B , Esmaeili A . Hydrodynamic simulation of an oscillating hydrofoil near free surface in critical unsteady parameter. Ocean Eng. 2017; 141: 227– 36. doi:10.1016/j.oceaneng.2017.06.037. [Google Scholar] [CrossRef]
16. Zheng K , He S , Zhao X , Shen L , Zhu X . Free-surface-induced ground effect for flapping swimmers. J Fluid Mech. 2024; 997: A36. doi:10.1017/jfm.2024.830. [Google Scholar] [CrossRef]
17. Ozdemir YH , Cosgun T , Barlas B . Wave field generated by finite-span hydrofoils operating beneath a free surface. Brodogradnja. 2021; 72( 1): 145– 67. doi:10.21278/brod72108. [Google Scholar] [CrossRef]
18. Ni Z , Dhanak M , Su TC . Performance of a hydrofoil operating close to a free surface over a range of angles of attack. Int J Nav Archit Ocean Eng. 2021; 13: 1– 11. doi:10.1016/j.ijnaoe.2020.11.002. [Google Scholar] [CrossRef]
19. Wei Y , Zhang J , Liu K , Pan J , Zhang L , Chen W , et al. Numerical study of the influence of hydrofoil hydrodynamic performance considering near-free surface. Brodogradnja. 2025; 76( 1): 1– 18. doi:10.21278/brod76108. [Google Scholar] [CrossRef]
Cite This Article
 Copyright © 2026 The Author(s). Published by Tech Science Press.
This work is licensed under a Creative Commons Attribution 4.0 International License , which permits unrestricted use, distribution, and reproduction in any medium, provided the original work is properly cited.
 Downloads
 Citation Tools
