
 Login
Login Register
 Submit a Paper
 Propose a Special lssue
 Open Access
ARTICLE
Effects of Tip-Clearance Variation on Blade Deformation, Near-Tip Flow, and Entropy Generation in a Transonic Compressor
School of Mechanical Engineering, Shaanxi University of Technology, Hanzhong, China
* Corresponding Author: Junli Wang. Email:
Fluid Dynamics & Materials Processing 2026, 22(9), 7 https://doi.org/10.32604/fdmp.2026.089646
Received 22 July 2026; Accepted 10 September 2026; Issue published 28 September 2026
 View Full Text
 Download PDF
Abstract
This study investigates how tip-clearance variation affects blade deformation, aerodynamic performance, near-tip flow structures, and irreversible energy loss in a transonic compressor. NASA Rotor 37 is used as the research model, and a two-way fluid–structure interaction framework coupled with entropy-generation analysis is developed to resolve the interplay between structural deformation and tip-leakage flow. At the respective peak-efficiency operating points, increasing the nominal tip clearance from 1.0δ to 3.0δ produces little change in the chordwise-averaged radial blade displacement, which decreases from 0.0725 to 0.0713 mm. However, the corresponding deformation-corrected effective clearance increases substantially, from 0.2835 to 0.9967 mm, leading to reductions in total pressure ratio and isentropic efficiency and a decrease of approximately 66.7% in the range of numerically converged steady-state solutions. The enlarged effective clearance also intensifies tip-leakage flow, promotes the development of the primary tip-leakage vortex, broadens the leakage shear layer, and strengthens the interaction among near-tip vortex structures. Entropy-generation analysis shows that turbulence-related entropy generation accounts for more than 98% of the calculated total and is the dominant modeled source of irreversible loss under the investigated conditions. As tip clearance increases, the contribution of the tip region to total entropy generation rises from 18.5% to 33.2%, while the region affected by tip leakage extends farther into the passage and the highest-loss region becomes increasingly concentrated near the casing.Keywords
Turbomachinery is a key component in high-performance power systems such as aero-engines and gas turbines, with its aerodynamic performance and operational stability directly influencing system efficiency and reliability [1,2]. During operation, a blade tip clearance exists between the rotating blades and the stationary casing [3]. The tip clearance varies dynamically because of centrifugal deformation, thermal expansion, aerodynamic loading, and wear [4]. These variations induce tip-leakage flow and alter the near-endwall flow structures. Studies have shown that tip-leakage flow plays a critical role in determining the aerodynamic performance and stability of compressors [5] and can trigger unsteady instability phenomena such as rotating stall, making it a critical factor limiting efficiency gains and stability margins in turbomachinery. In transonic compressors, the interaction between tip leakage flow, shock waves, and boundary layers further complicates the flow near the endwall, leading to increased losses and making the instability evolution harder to describe consistently [6].
Regarding the effects of blade tip clearance, Smith [7] summarized the quantitative relationship between increased clearance and the attenuation of peak pressure rise based on extensive experimental data, noting that when the clearance exceeds 1% of the blade-tip chord, the two variables exhibit an approximately linear relationship. Sakulkaew [8] further identified the piecewise response of efficiency to clearance variation, highlighting a significant nonlinear relationship in the small-clearance regime and indicating an optimal clearance at which efficiency reaches its maximum. Within a certain clearance range, efficiency decreases approximately linearly as clearance increases. To reduce the sensitivity of compressor performance to tip-clearance variation in engineering applications, measures such as forward-swept blades [9] and unsteady tip excitation [10] have been proposed to mitigate the adverse effects of clearance variation on aerodynamic performance. Generally, increasing blade tip clearance in axial compressors leads to performance degradation, including reductions in total pressure ratio and isentropic efficiency, and a narrower stable operating range [11]. A similar trend is observed in the present steady Reynolds-averaged Navier–Stokes (RANS) calculations, where the range of numerically converged steady-state solutions is reduced. Further unsteady studies show that the dominant stall mechanism varies under different clearance conditions. Liu et al. [12] found that under large-clearance conditions, unsteady disturbances caused by the breakdown of the tip leakage vortex dominate the flow, while in small-clearance conditions, the spillage mechanism resulting from leading-edge separation is more pronounced. Under transonic conditions, Biollo and Benini [13] demonstrated that the interaction among shock waves, boundary layers, and tip-clearance flows strongly affects the near-tip flow field and contributes to aerodynamic losses in transonic rotor blades. Near-stall conditions, the coupling of shock waves and the tip leakage vortex can trigger vortex breakdown, significantly increasing loss and threatening compressor stability.
Existing studies have primarily focused on performance indicators and typical flow phenomena, with limited quantitative analysis of the spatial distribution of losses and the dominant loss sources in the endwall region. Entropy generation theory provides an effective approach for spatial localization and component-wise evaluation of irreversible losses, and has been increasingly applied in turbomachinery flow-field analyses [14,15]. Recent studies in other fluid-energy conversion systems have also highlighted the relationship between vortex manipulation and irreversible loss reduction. For example, Prasetyo et al. [16] investigated the effect of additional baffle plates on a double-stage gravitational water vortex turbine and demonstrated that modifying internal flow structures could influence vortex characteristics and energy conversion performance. Although the working mechanism differs from that of compressors, these studies provide broader insights into the role of vortex evolution in controlling energy dissipation. The studies by Zhang et al. [17] and Li et al. [18] demonstrated that turbulence-related entropy generation can represent the dominant component under high-speed turbulent flow conditions, providing a useful framework for identifying irreversible loss mechanisms. The fluid–structure interaction (FSI) effect is also significant. Under the combined influence of aerodynamic loading, centrifugal force, and thermal effects, blade deformation can modify the actual tip clearance distribution and redistribute the aerodynamic loading [19]. Traditional assumptions of rigid blades or purely fluid-based numerical methods cannot accurately capture this two-way interaction. While previous studies have advanced the understanding of blade tip clearance effects, fluid–structure interaction, and entropy-generation-based loss evaluation, the coupled relationship among deformation-induced clearance variation, near-tip flow evolution, and loss redistribution under transonic conditions remains insufficiently understood.
Unlike previous studies that prescribed geometric tip clearances or treated deformation and entropy generation separately, the present work establishes a two-way FSI model of NASA Rotor 37 and uses entropy-generation decomposition to quantify the coupled evolution of blade deformation, effective clearance, leakage-vortex structure, and irreversible-loss redistribution. The main objective of this work is to clarify the intrinsic relationship among performance deterioration, leakage-flow enhancement, local blockage intensification, and loss redistribution as the tip clearance increases. To achieve this, the following aspects are addressed. First, the blade-tip radial deformation and deformation-corrected local effective clearance are quantified, together with the variations in total pressure ratio, isentropic efficiency, and the range of numerically converged steady-state solutions under different tip-clearance conditions. Second, the evolution of the dominant near-tip flow structures is identified, with particular attention to the development of leakage vortices, near-wall low-momentum regions, and local reverse flow. Third, based on entropy-generation decomposition, the dominant loss sources and major high-loss regions are determined, and the mechanism by which tip-clearance enlargement drives the redistribution of loss toward the casing is examined. These results are intended to clarify the link among structural deformation, near-tip flow evolution, and irreversible-loss redistribution in transonic compressors.
2 Numerical Computation Methods
The fluid flow is governed by the three-dimensional compressible Reynolds-averaged Navier–Stokes equations, while the blade–disk assembly is described by linear elastodynamics. Two-way coupling is achieved through the transfer of aerodynamic loads and structural displacements at the fluid–structure interface. The casing deformation is neglected in the structural calculation. To simplify the thermal treatment, the blade and casing surfaces are treated as adiabatic boundaries, and heat conduction across the fluid–solid interface is neglected. However, the fluid energy equation is retained to account for the effects of viscous and turbulent dissipation on the temperature field and entropy generation.
- (1)Fluid Domain Control Equations
The fluid domain satisfies the conservation equations of mass, momentum, and energy, which can be written in Reynolds-averaged form as follows:
- (2)Solid Domain Control Equation
The blade–disk assembly is modeled as an isotropic linear elastic structure. The momentum-balance equation, strain–displacement relation, and constitutive relation are expressed as follows:
- (3)Fluid-Structure Coupling Interface Conditions
At the fluid–structure coupling interface
The SST k–ω turbulence model has been widely applied in turbomachinery simulations involving shock-wave interaction, boundary-layer separation, and tip-leakage flows, and has demonstrated reliable capability in predicting complex internal flow fields [20,21]. Previous studies on compressor aerodynamic simulations and fluid–structure interaction analyses have shown that numerical approaches based on coupled computational fluid dynamics (CFD) frameworks can achieve good agreement with experimental measurements, providing a reliable basis for investigating aerodynamic performance and structural deformation effects [22].
In turbomachinery, viscous effects, turbulent fluctuations, and heat transfer caused by temperature gradients lead to irreversible thermodynamic processes and consequently generate entropy. The entropy-generation rate can therefore be used to characterize the intensity and spatial distribution of irreversibility in the flow field. In the present study, the total volumetric entropy-generation rate is decomposed into four components: direct viscous dissipation, turbulent mechanical dissipation, molecular heat transfer, and turbulent heat transfer:
The entropy-generation rate associated with direct viscous dissipation of the mean flow is expressed as
Following the RANS-based entropy-generation framework proposed by Kock and Herwig [23], the unresolved turbulent mechanical dissipation is evaluated using quantities provided by the turbulence model. Accordingly, the entropy-generation rate associated with turbulent mechanical dissipation is evaluated using the turbulent kinetic-energy dissipation rate:
In addition to mechanical dissipation, entropy generation associated with heat transfer is also considered. The molecular heat-transfer entropy-generation rate is calculated as
The entropy-generation rate associated with turbulent heat transfer is evaluated as
By integrating the local entropy-generation rates over the entire fluid domain
The total entropy generation within the computational domain is then evaluated as:
This decomposition allows the relative contributions of viscous dissipation, turbulent dissipation, and thermal transport to overall thermodynamic irreversibility to be quantitatively distinguished. In the present study, entropy generation serves as a thermodynamic measure of flow irreversibility rather than lost mechanical energy.
2.3 Initial and Boundary Conditions
The computational domain and the corresponding boundary-condition settings are illustrated in Fig. 1. At the inlet, the total pressure and total temperature were specified as 101,325 Pa and 288.15 K, respectively, while a static-pressure boundary condition was imposed at the outlet. Different operating points from near stall to near choke were obtained by adjusting the outlet back pressure. Periodic boundary conditions were applied to both sides of the passage. In the rotating reference frame, the casing was specified as a counter-rotating wall with an angular velocity equal in magnitude and opposite in direction to that of the rotor, thereby keeping the casing stationary in the absolute frame. All solid walls were treated as adiabatic no-slip boundaries.
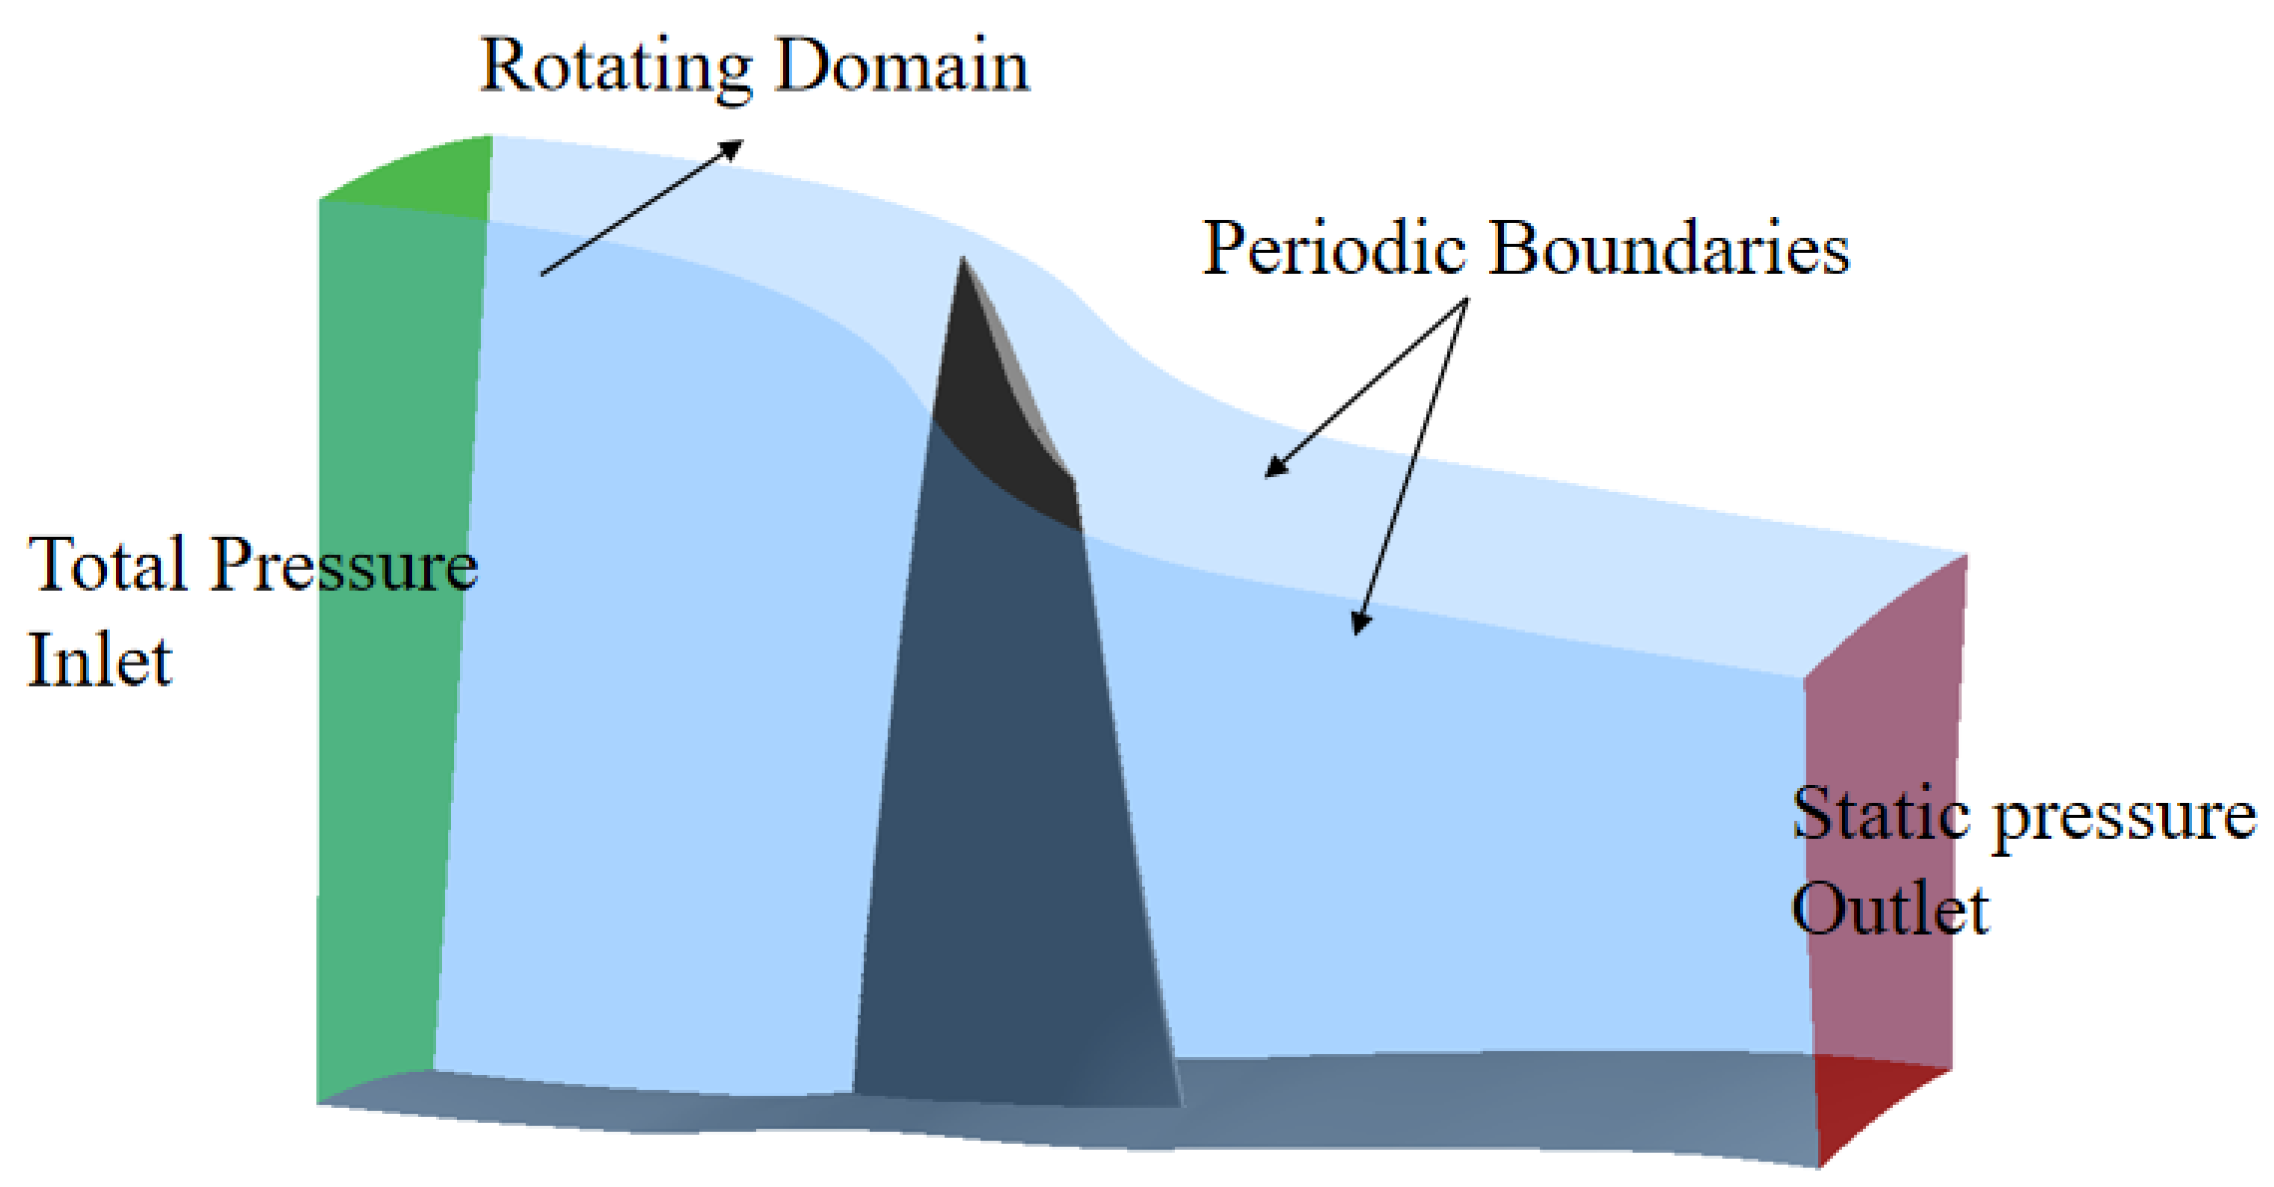
Figure 1: Computational domain and boundary-condition settings.
3 Computational Model and Validation
In this study, NASA Rotor 37, a transonic axial-compressor rotor designed by the NASA Glenn Research Center in the United States [24], is selected as the research object. As shown in Fig. 2, the rotor consists of 36 blades and is widely used to validate three-dimensional CFD methods and turbulence models, thanks to its extensive publicly available experimental data. The basic parameters are provided in Table 1.
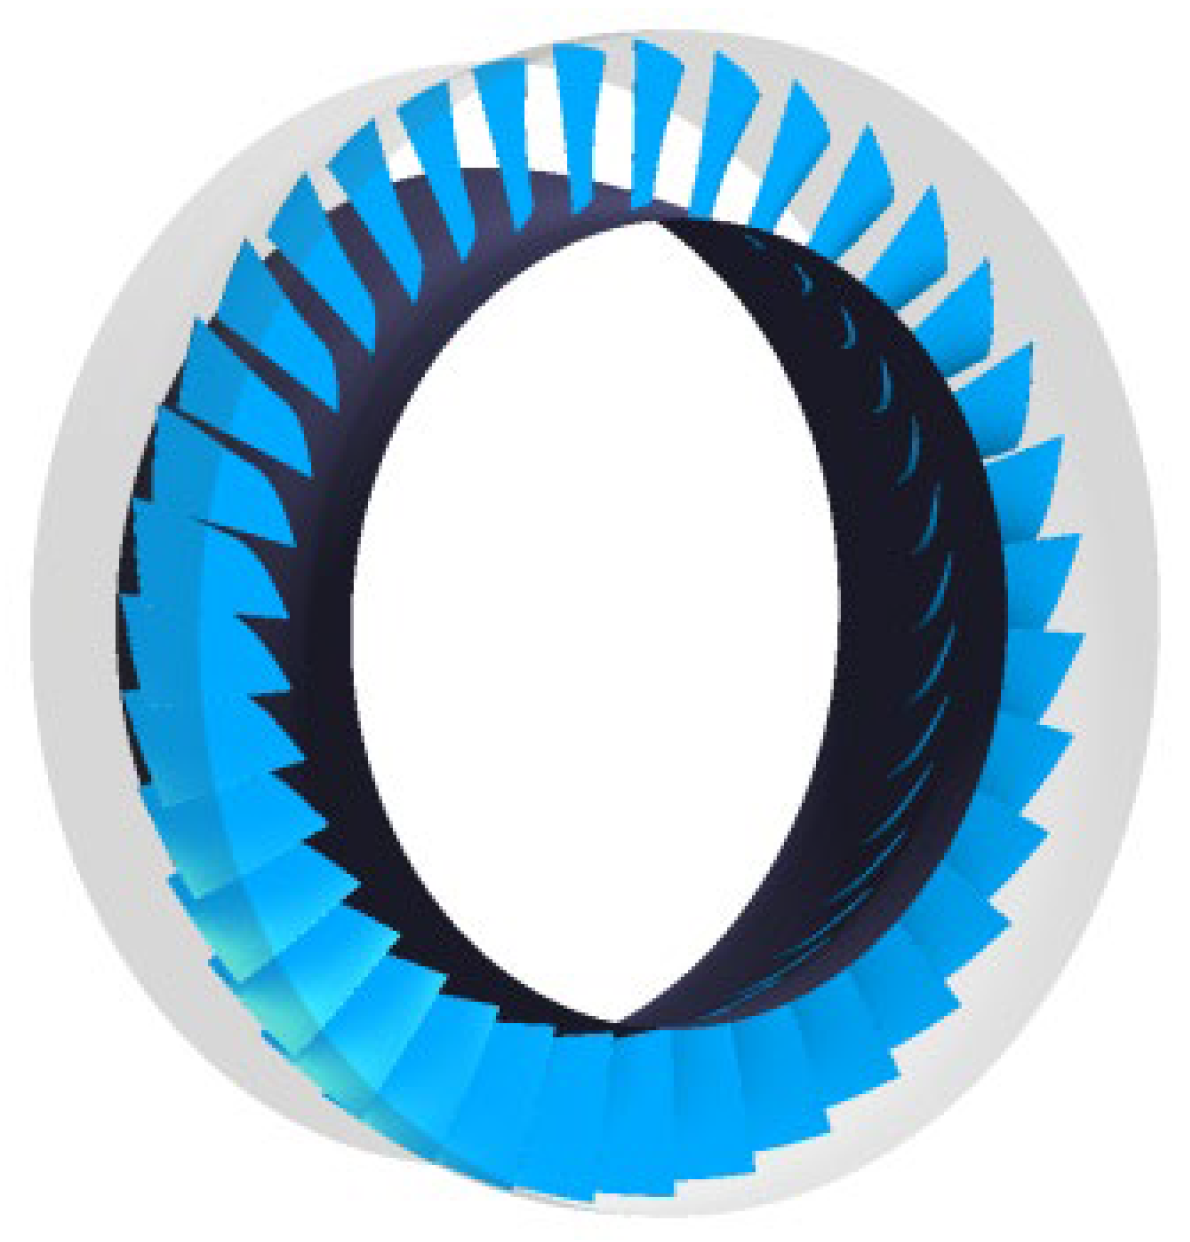
Figure 2: NASA rotor 37 compressor computational model.
Table 1: Key parameters of NASA rotor 37.
| Parameter | Value |
|---|---|
| Number of blades | 36 |
| Design speed (r/min) | 17,188.7 |
| Design flow rate (kg/s) | 20.19 |
| Choke point flow rate (kg/s) | 20.93 |
| Design pressure ratio | 2.106 |
| Blade tip speed (m/s) | 454.14 |
| Design blade tip clearance (mm) | 0.356 |
| Design isentropic efficiency | 0.889 |
In this study, the design tip clearance of NASA Rotor 37 (0.356 mm) is defined as the reference clearance δ. Five nominal tip-clearance conditions, namely 1.0δ, 1.5δ, 2.0δ, 2.5δ, and 3.0δ, were investigated to characterize the aerodynamic and loss-generation responses associated with progressive tip-clearance enlargement from the nominal design condition. This clearance range represents representative clearance degradation scenarios during compressor operation, providing engineering insights into the influence of tip-clearance deterioration on aerodynamic performance and loss generation.
3.2 Computational Setup and Boundary Conditions
Numerical calculations were performed using ANSYS CFX, with the shear-stress-transport (SST) k–ω turbulence model. This model combines the near-wall accuracy of the standard k–ω model with the favorable free-stream prediction capability of the k–ε model and is therefore suitable for predicting compressor internal flows involving complex phenomena such as separation and recirculation [21]. Consequently, the SST k−ω model has been widely adopted for transonic compressor simulations involving shock-wave interaction, boundary-layer separation, and tip-leakage flows. However, as a RANS-based turbulence model, it provides time-averaged predictions and cannot resolve instantaneous turbulent fluctuations. Consequently, the detailed transient evolution of tip-leakage vortices and local entropy-generation fluctuations may depend on the turbulence modeling approach. The governing equations were discretized using the finite-volume method. The compressible Reynolds-averaged Navier–Stokes equations were solved using a coupled solution algorithm. A high-resolution scheme was employed for the advection terms and the turbulence transport equations. Automatic timescale control was adopted for the steady-state calculations. No transition model was used in the present simulations. At the inlet boundary, the turbulence intensity was specified as 5% using the medium turbulence level in ANSYS CFX.
For the two-way fluid–structure interaction (FSI) calculations, a partitioned iterative coupling strategy was implemented, with key FSI setup parameters and numerical settings summarized in Table 2. In the present FSI framework, rotor blade deformation was considered, while the casing was assumed to be rigid. It should be noted that the actual tip clearance is determined by the relative deformation between the rotor blade and the casing. Casing elastic deformation and thermal expansion may alter the effective tip-clearance distribution under realistic engine operating conditions, thereby influencing tip-leakage flow development and aerodynamic losses. The present study therefore focuses on blade-deformation-induced clearance variation and its associated aerodynamic and entropy-generation mechanisms in the NASA Rotor 37 rotor. Thus, casing thermo-mechanical deformation is beyond the scope of the present study and is recognized as a limitation.
To further assess the potential influence of thermal effects, an order-of-magnitude estimation was performed. The thermally induced radial expansion can be approximated by
It should be noted that the present two-way FSI framework is based on steady Reynolds-averaged Navier–Stokes (RANS) calculations. The steady approach is adopted to evaluate the time-averaged effects of tip-clearance variation on aerodynamic performance, leakage-vortex evolution, and entropy-generation distribution. However, inherently unsteady phenomena, such as leakage-vortex oscillations, transient flow mixing, and rotating-stall-related disturbances, are not captured by the present framework. These unsteady effects may influence instantaneous flow structures and local loss-generation characteristics, particularly under near-stall conditions, and will be further investigated using unsteady numerical approaches in future work.
The convergence criteria, coupling parameters, and computational details are summarized in Table 2. Compared with rigid-blade simulations, two-way FSI calculations required approximately three times the computational time due to the additional structural solution and iterative fluid–structure data exchange.
Table 2: Key parameters and settings of the two-way fluid–structure interaction simulations.
| Parameter | Details |
|---|---|
| Blade material | Ti–6Al–4V |
| Material properties | Density: 4430 kg·m−3; Young’s modulus: 114 GPa; Poisson’s ratio: 0.33 |
| Structural constraint | Fixed support applied at the blade root surface |
| Rotational loading | Design speed: 17,188.7 rpm; centrifugal loading and aerodynamic pressure loads considered |
| Mesh deformation method | Displacement diffusion method |
| Coupling strategy | Partitioned implicit two-way coupling |
| Data exchange | Pressure loads mapped to structural solver; blade deformation transferred to fluid mesh |
| Convergence criteria | Root-mean-square (RMS) fluid residual < 10−6; relative variation of monitored metrics < 0.1% |
| Coupling parameters | Maximum iterations: 20; relaxation factor: 0.8 |
Structured hexahedral meshes were employed for both the fluid and structural domains. The fluid mesh was generated using ANSYS TurboGrid, as shown in Fig. 3. H-type topologies were adopted in the inlet and outlet regions, whereas an O4H-type topology was used within the blade passage. O-type meshes were applied around the blade surfaces to improve the geometric conformity to the blade profile. A butterfly-type topology was employed in the tip-clearance region, and local mesh refinement was further introduced in the tip-clearance and near-wall regions to better capture the flow details. The near-wall mesh was designed to maintain y+ ≤ 1 on the blade and casing surfaces, ensuring that the viscous sublayer was directly resolved and that the SST k–ω turbulence model could accurately capture near-wall flow characteristics.
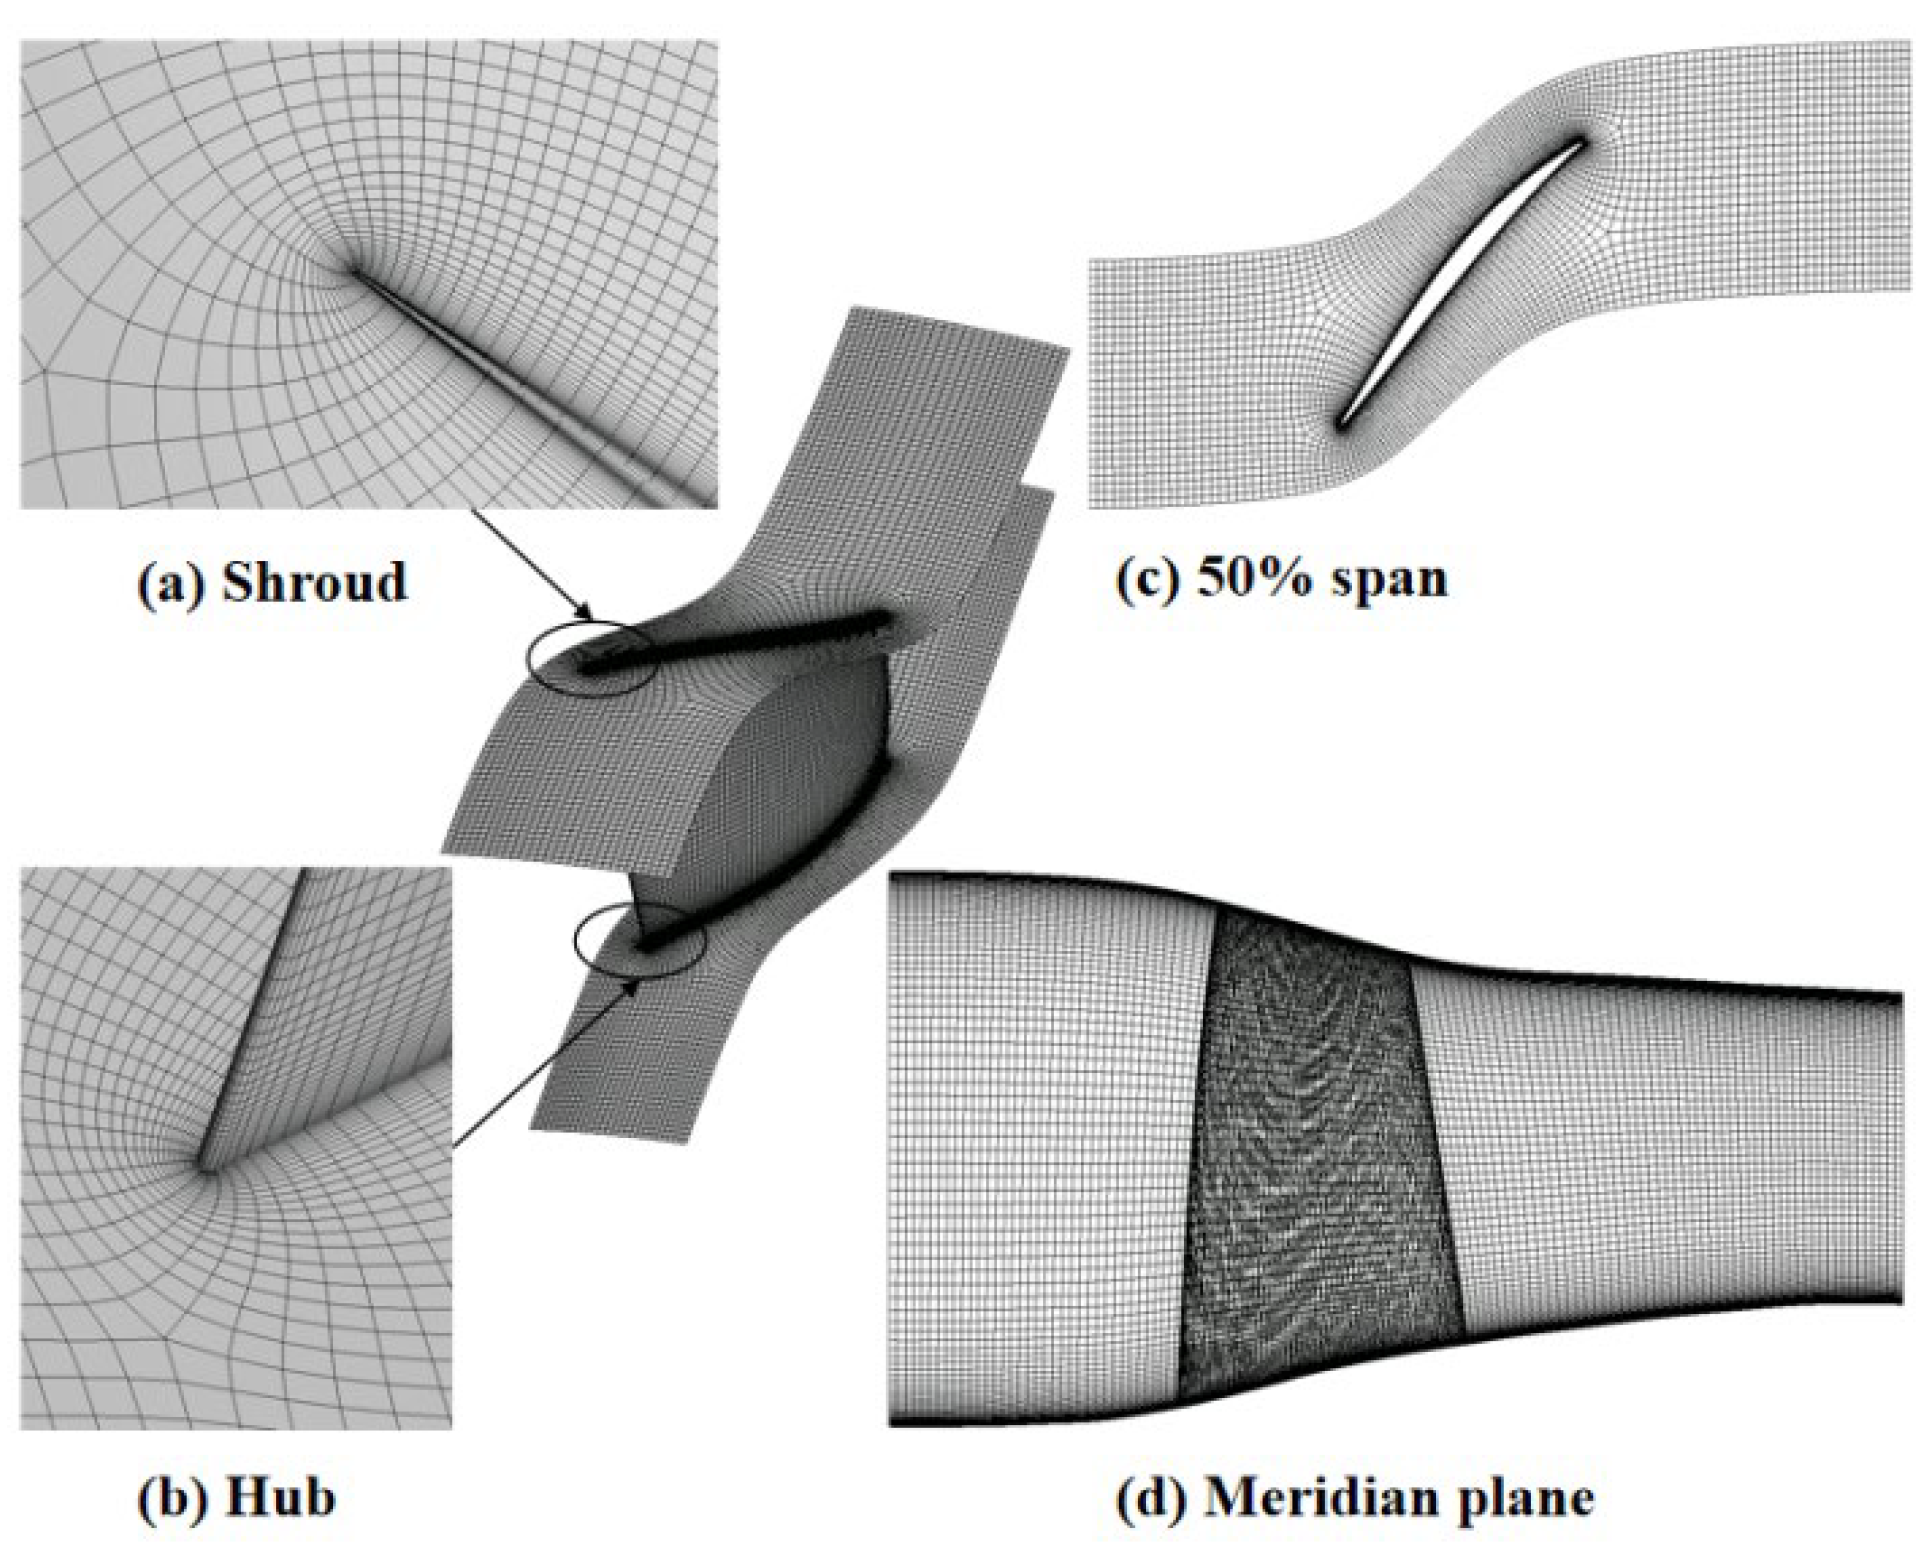
Figure 3: Computational grid schematic diagram.
To assess the sensitivity of the numerical results to mesh resolution, five progressively refined mesh systems were generated for both the fluid and structural domains. The total pressure ratio and isentropic efficiency were selected as the monitoring parameters for the fluid domain, while the maximum blade displacement was monitored for the structural domain. The mesh-independence results are presented in Fig. 4a,b, and the mesh sensitivity analysis is in Table 3. As the number of cells increased, all monitored quantities gradually approached mesh-independent values. For the fluid domain, increasing the number of cells from 9.1 × 10⁵ to 1.5 × 10⁶ resulted in relative changes of only 0.0233% in isentropic efficiency and 0.0358% in total pressure ratio. For the structural domain, increasing the number of cells from 3.8 × 10⁵ to 5.9 × 10⁵ produced a relative change of only 0.0098% in the maximum blade displacement. These small variations indicate that further mesh refinement has a limited influence on the numerical results. Therefore, considering both computational accuracy and efficiency, the mesh system containing approximately 9.1 × 10⁵ fluid cells and 3.8 × 10⁵ structural cells was adopted for the subsequent calculations.
Since the present study focuses on tip-clearance-induced leakage characteristics, the tip leakage flow rate was further introduced as a local flow quantity to evaluate mesh sensitivity. As shown in Fig. 4c, the tip leakage flow rate gradually approaches a plateau when the number of fluid cells exceeds 9.1 × 10⁵. Further mesh refinement results in a maximum relative variation of less than 0.05%, confirming that the selected mesh resolution (9.1 × 10⁵ fluid cells) is sufficient to accurately capture the tip-leakage flow characteristics.
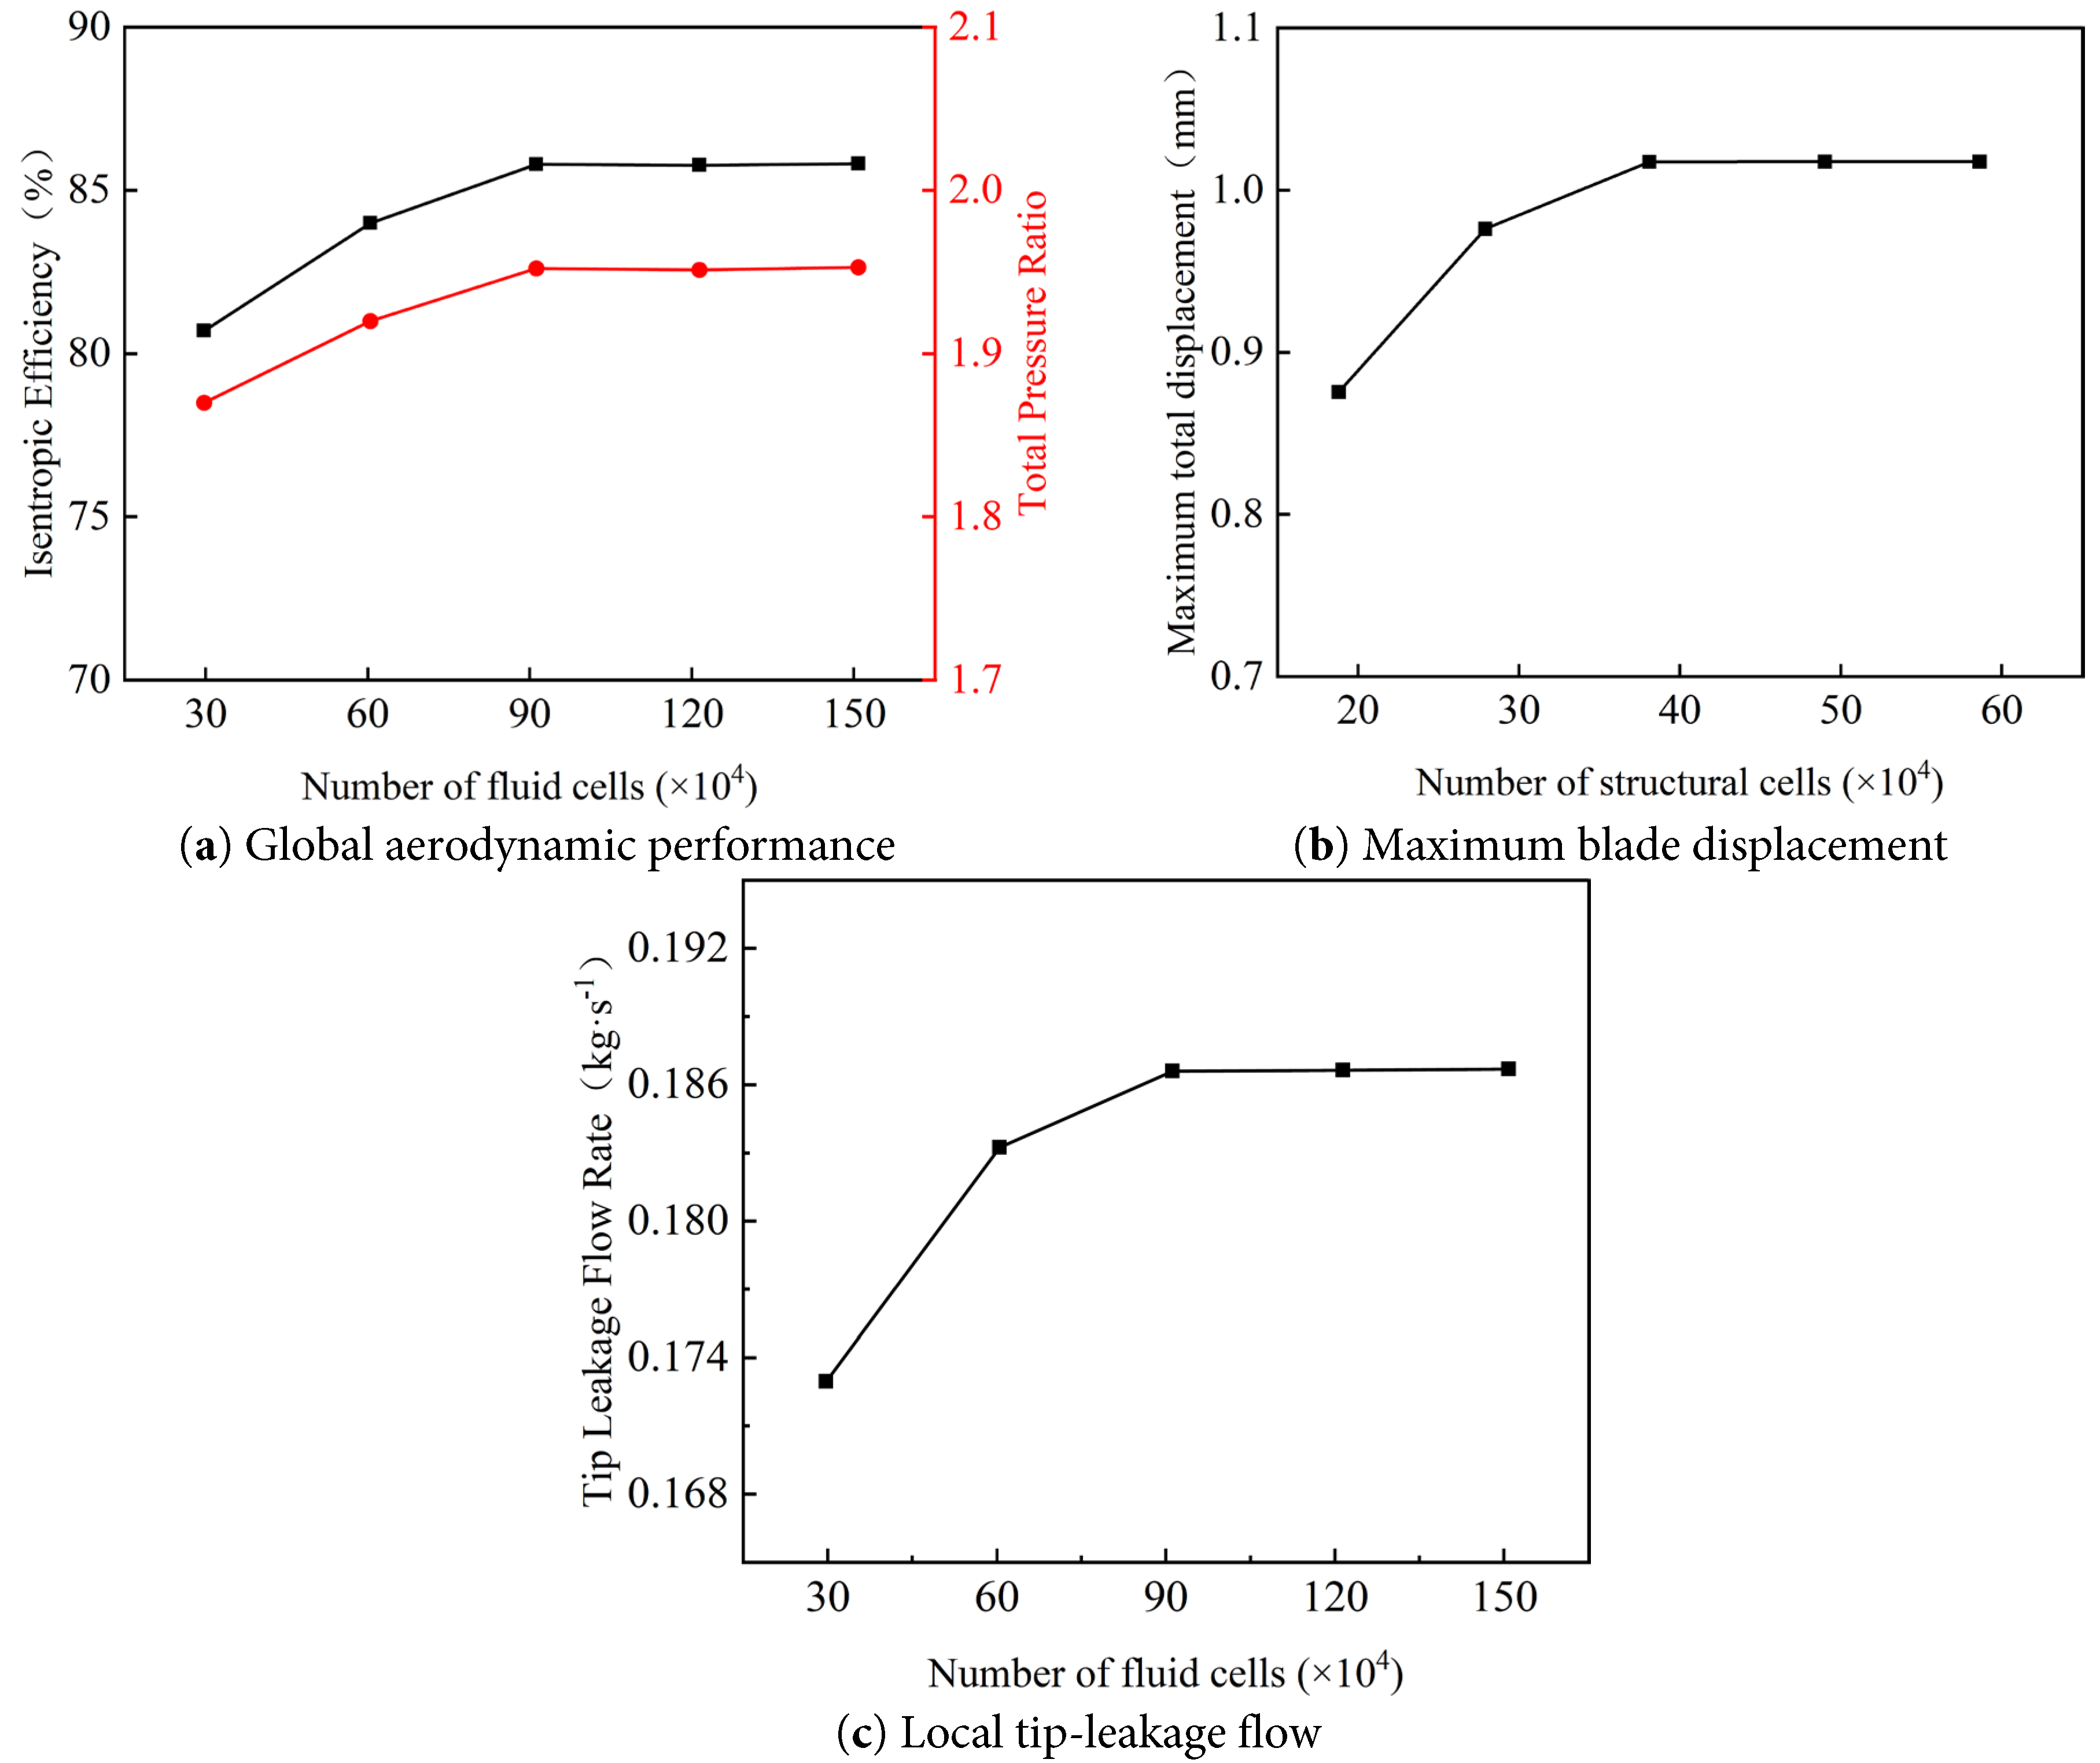
Figure 4: Mesh-independence verification.
Table 3: Mesh sensitivity analysis.
| Domain | Selected Number of Cells | Refined Number of Cells | Monitoring Parameter | Relative Change (%) |
|---|---|---|---|---|
| Fluid | 9.1 × 10⁵ | 1.5 × 10⁶ | Isentropic efficiency | 0.0233 |
| Fluid | 9.1 × 10⁵ | 1.5 × 10⁶ | Total pressure ratio | 0.0358 |
| Fluid | 9.1 × 10⁵ | 1.5 × 10⁶ | Tip leakage flow rate | 0.0482 |
| Structural | 3.8 × 10⁵ | 5.9 × 10⁵ | Maximum blade displacement | 0.0098 |
Steady-state numerical calculations were performed for the Rotor 37 rotor under blade tip clearance conditions and compared with experimental data [22], as shown in Fig. 5. Two numerical setups were considered: CFD (rigid blades) and CFD (two-way FSI). Overall, both numerical approaches reproduce the general variation trends of the experimental data along the constant-speed line. The predictions obtained using the rigid-blade and two-way FSI models are generally close, while the two-way FSI model provides a slightly improved representation of the experimental performance characteristics by considering blade deformation and its feedback on the flow field. At the peak efficiency point, the relative errors in efficiency and total pressure ratio are 3.65% and 3.24%, respectively. The average errors along the constant-speed line are 2.41% and 4.67%, respectively. These results indicate that the two-way FSI framework can provide a more physically representative description of deformation-induced effective tip-clearance variation, although its influence on the global performance prediction is relatively limited.
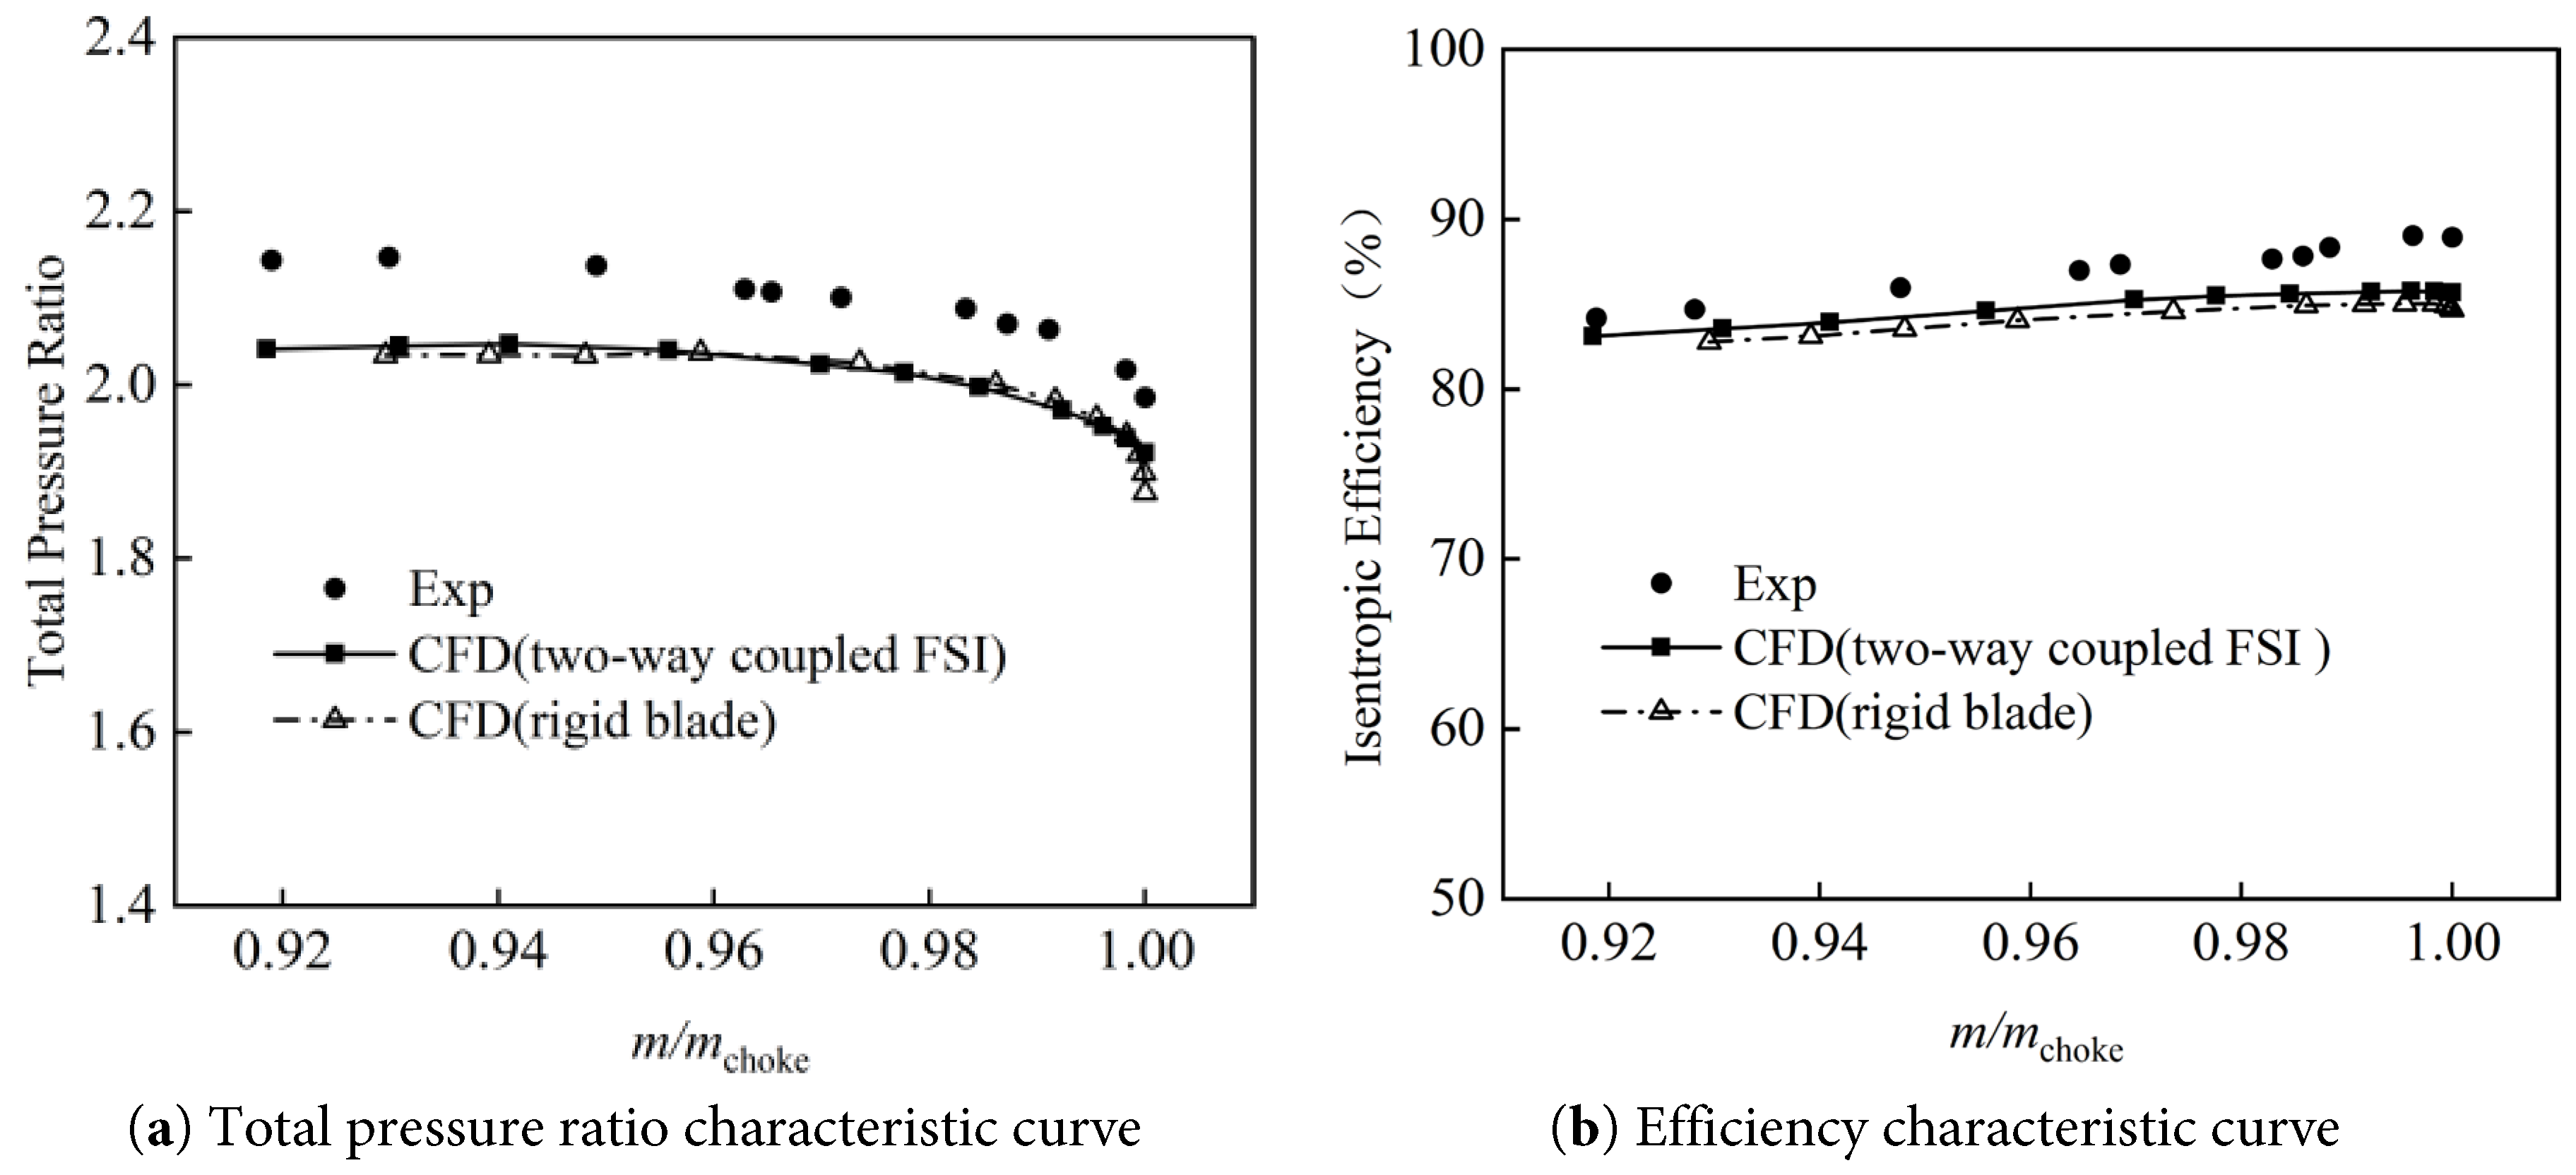
Figure 5: Comparison of experimental and numerical results for overall pressure ratio and efficiency.
Although the numerical results agree well with the experimental trends, some deviations remain due to several factors. The turbulence model may introduce uncertainties in predicting highly three-dimensional tip-leakage flows, shock–boundary-layer interactions, and turbulent mixing processes. In addition, mesh resolution and numerical discretization may influence the prediction of small-scale leakage vortices and near-wall flow structures. Differences between numerical and experimental boundary conditions, measurement uncertainties, and structural assumptions in the FSI framework may also contribute to the remaining discrepancies.
To further assess the capability of the numerical method to reproduce local flow characteristics in the tip-clearance region, Fig. 6 compares the experimental and numerical relative Mach number distributions at 95% blade height under the near-stall condition. The experimental result [25] is shown on the left, while the corresponding CFD prediction is presented on the right. The black dashed line indicates the trajectory of the tip-leakage vortex. Overall, the numerical prediction captures the main flow features observed in the experiment, including the shock position, boundary-layer separation characteristics, and the general trajectory of the tip-leakage vortex. This agreement indicates that the present numerical framework can reasonably reproduce the dominant tip-region flow structures, including shock location and tip-leakage vortex evolution, thereby providing additional confidence for the subsequent analysis.
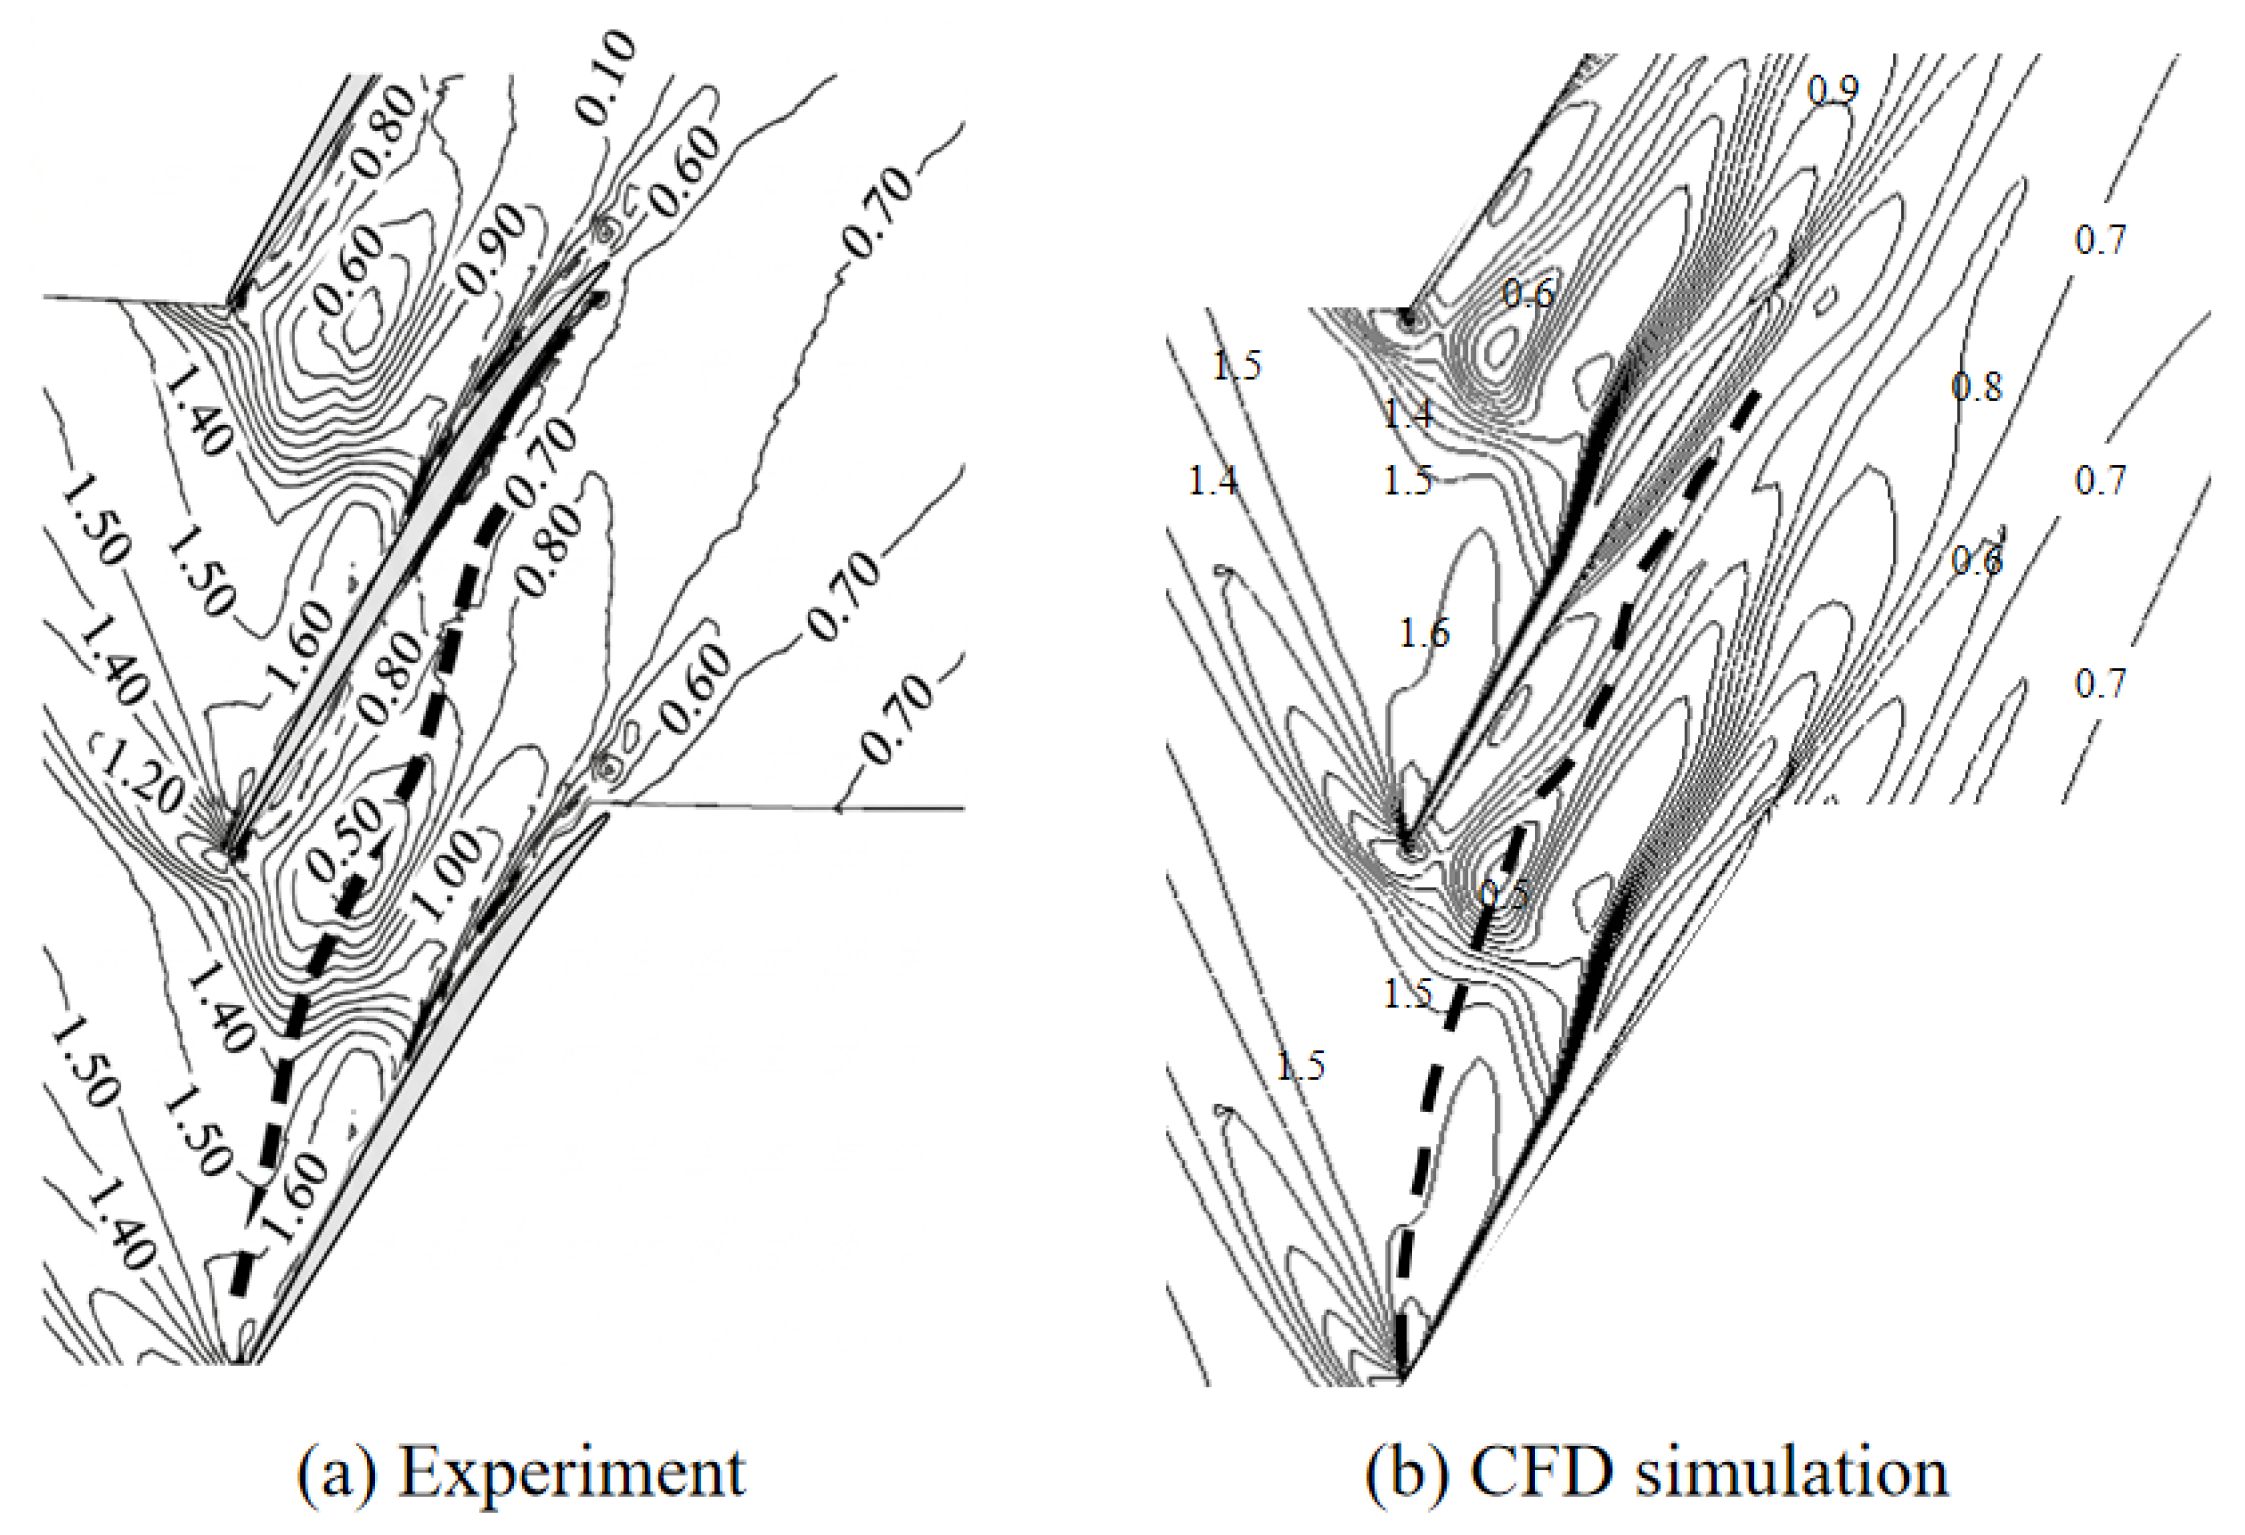
Figure 6: Comparison of relative mach number distributions at 95% blade height under near-stall conditions: (a) experimental result and (b) CFD simulation.
The available experimental data for NASA Rotor 37 mainly include global aerodynamic performance and near-tip Mach-number distributions. Therefore, the subsequent analyses of blade deformation, effective tip-clearance variation, leakage-flow evolution, and entropy-generation characteristics are conducted based on the validated numerical framework.
4.1 Blade-Tip Radial Deformation and Local Effective Tip-Clearance Variation
To clarify the influence of structural deformation on the actual blade tip clearance, the radial deformation of the rotor blade was extracted from the two-way fluid–structure interaction results at the peak-efficiency operating point of each clearance configuration. A cylindrical coordinate system was established with its axial direction aligned with the rotor rotation axis, and the positive radial direction was defined as pointing from the rotation axis toward the casing. Fig. 7 presents the radial deformation distributions on the suction side (SS) and pressure side (PS) for the representative 1.0δ, 2.0δ, and 3.0δ clearance conditions.
As shown in Fig. 7, the radial deformation exhibits a pronounced spanwise gradient on both blade surfaces, increasing rapidly from the hub toward the blade tip. The deformation is also non-uniform in the chordwise direction. On the suction side, the high-deformation region extends obliquely from the tip corner toward the mid-span region, whereas on the pressure side it is more concentrated near the opposite tip corner and exhibits a relatively compact arc-shaped distribution. The asymmetric distributions on the two blade surfaces reflect the combined effects of centrifugal loading and non-uniform aerodynamic loading. As the nominal tip clearance increases from 1.0δ to 3.0δ, the overall spatial distribution remains similar among the three cases, while the maximum radial-deformation values indicated by the contour legends decrease slightly as the nominal clearance increases.
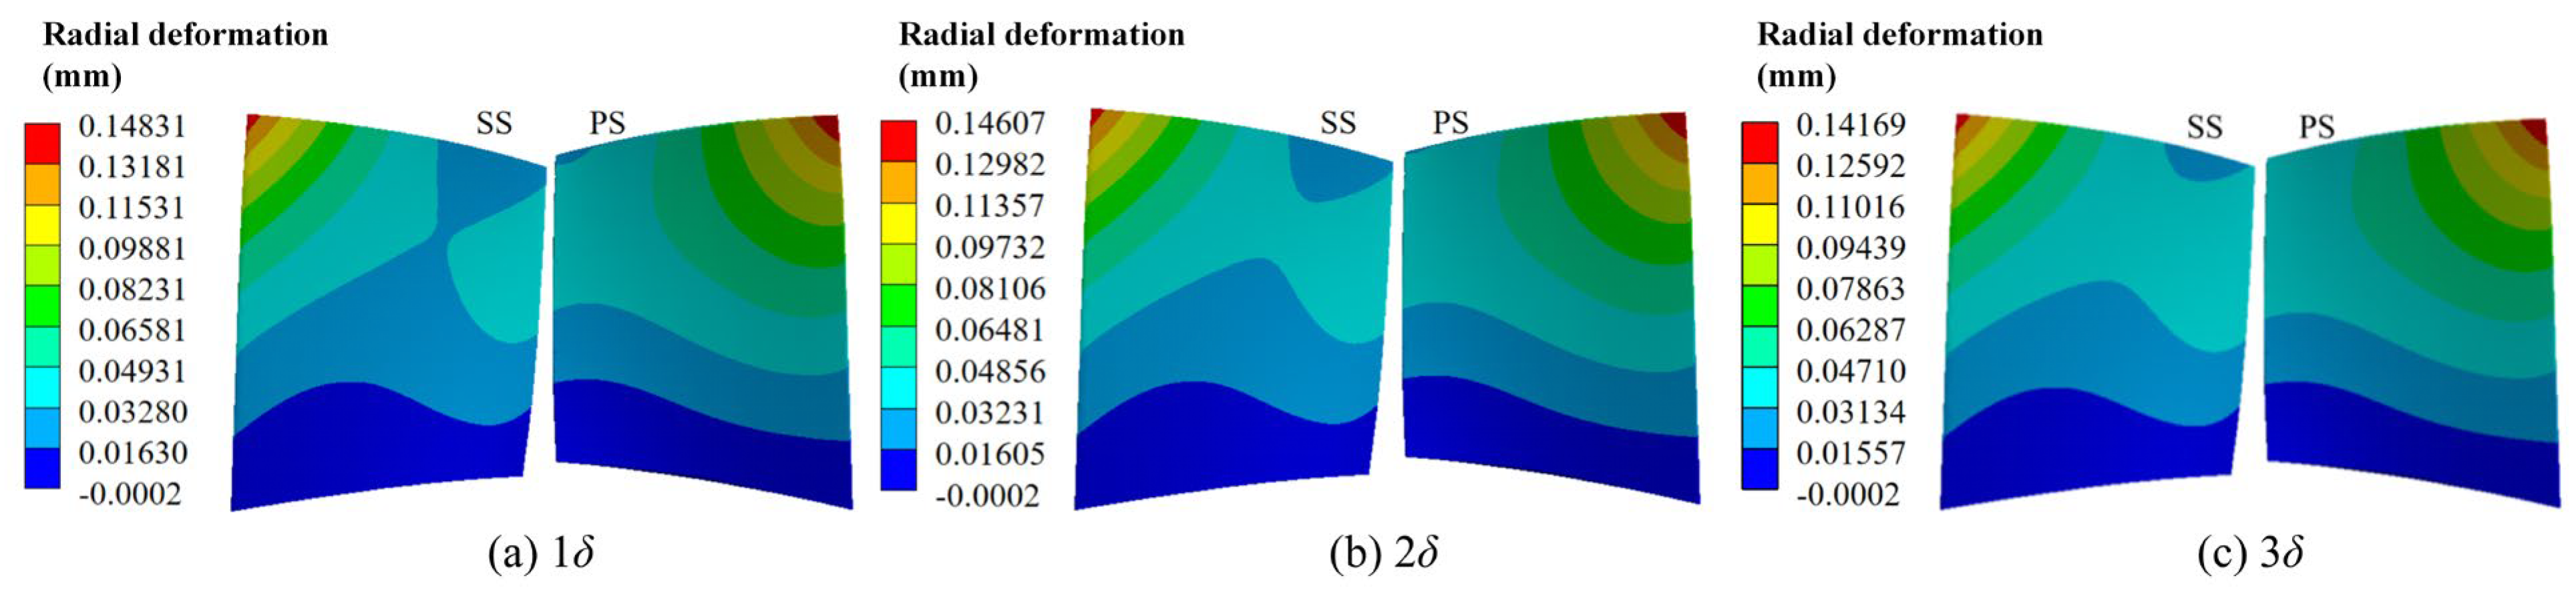
Figure 7: Radial deformation distributions on the suction and pressure surfaces under different nominal tip-clearance conditions.
To account for the non-uniform blade deformation along the chordwise direction, the radial displacement distribution along the blade tip from the leading edge to the trailing edge was extracted from the two-way FSI results. The deformation-corrected chordwise-distributed effective tip clearance was calculated as:
As shown in Fig. 8, the blade-tip radial displacement exhibits a consistent chordwise distribution across all nominal tip-clearance conditions, decreasing gradually from the leading edge to the trailing edge due to the combined centrifugal and aerodynamic loading. The chordwise-averaged metrics are summarized in Table 4. While the averaged radial displacement remains almost constant (0.071–0.073 mm) across all cases, the chordwise-averaged effective clearance increases monotonically from 0.2835 mm at 1.0δ to 0.9967 mm at 3.0δ. This indicates that the increase in effective leakage passage size, rather than the variation in structural deformation, plays a dominant role in the clearance-induced aerodynamic deterioration under the investigated conditions, whereas the variation in structural deformation plays a secondary role under the investigated conditions. This provides the geometric basis for the enhanced leakage flow, intensified near-tip blockage, and increased irreversible loss discussed in the following sections.
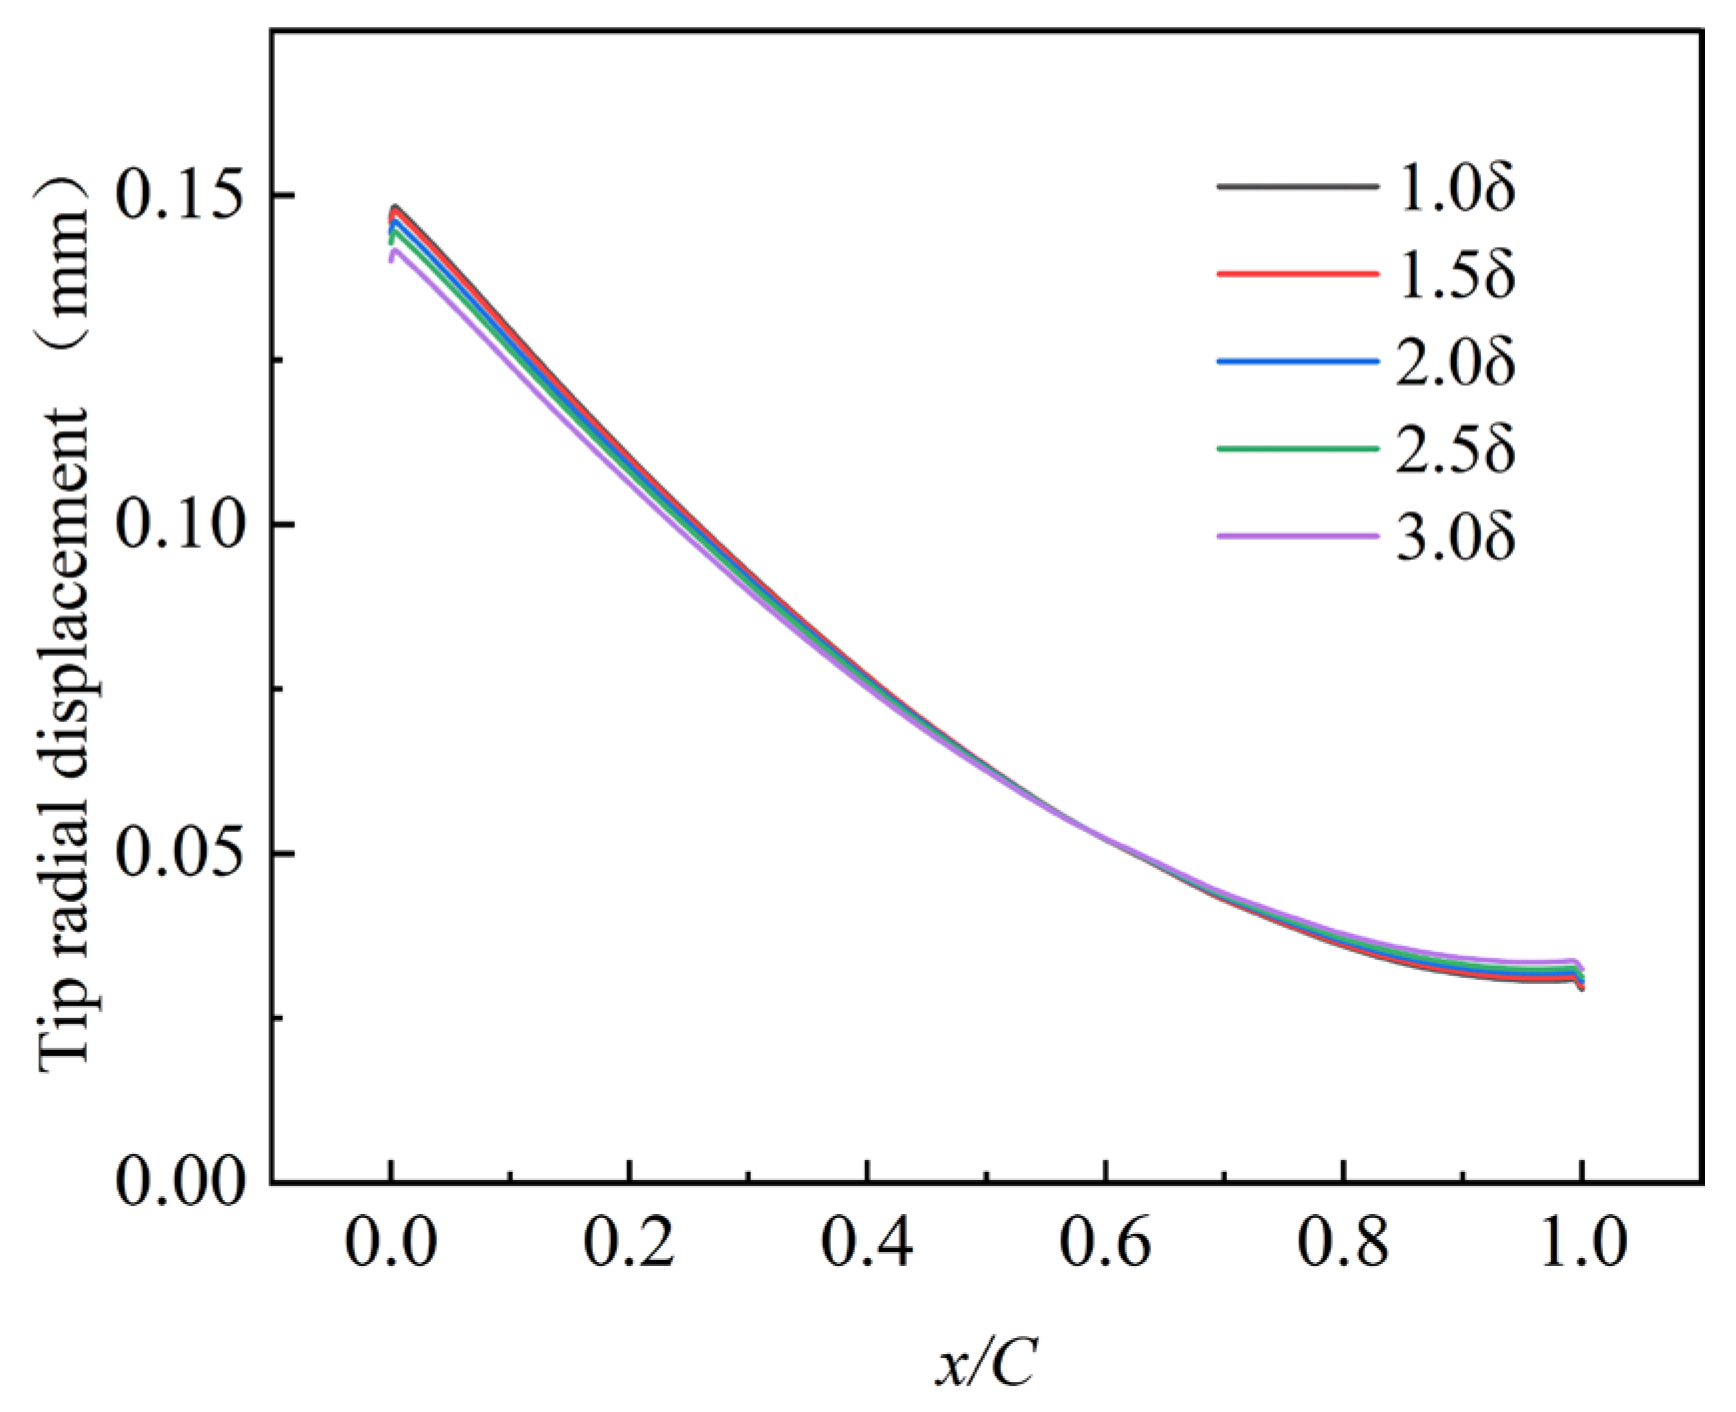
Figure 8: Chordwise distribution of blade-tip radial displacement under different nominal tip-clearance conditions.
Table 4: Chordwise-averaged radial displacement and effective tip clearance under different nominal tip-clearance conditions.
| Tip-Clearance Condition | Nominal Clearance (mm) | Chordwise-Averaged Radial Displacement (mm) | Chordwise-Averaged Effective Clearance (mm) |
|---|---|---|---|
| 1.0δ | 0.356 | 0.0725 | 0.2835 |
| 1.5δ | 0.534 | 0.0724 | 0.4616 |
| 2.0δ | 0.712 | 0.0721 | 0.6399 |
| 2.5δ | 0.890 | 0.0718 | 0.8182 |
| 3.0δ | 1.068 | 0.0713 | 0.9967 |
It should be noted that the conclusion regarding the secondary influence of blade deformation is limited to the investigated NASA Rotor 37 configuration and operating conditions. Under higher rotational speeds, elevated-temperature environments, or more flexible blade structures, structural deformation effects may become more significant and contribute more strongly to the variation of effective tip clearance. In such cases, thermo-mechanical deformation and stronger fluid–structure interactions should be considered for a more comprehensive evaluation of tip-clearance effects.
4.2 Effect of Blade Tip Clearance on Overall Compressor Performance
Fig. 9 presents the total pressure ratio and isentropic efficiency characteristics under different tip-clearance conditions. Along the design-speed characteristic line, both characteristic curves shift downward as the tip clearance increases, indicating reductions in pressure-rise capability and isentropic efficiency. The separation between adjacent curves becomes more pronounced toward the high-flow end, suggesting stronger sensitivity to tip-clearance variation near the choke boundary. To quantify this effect, the range of numerically converged steady-state solutions is defined as the interval between the minimum and maximum mass-flow-rate points for which a converged steady solution is obtained. Compared with the 1.0δ condition, the mean total pressure ratio over the common mass-flow-rate range decreases by approximately 3.4% at 3.0δ, while the peak isentropic efficiency decreases by approximately 1.01 percentage points and the range of numerically converged steady-state solutions is reduced by approximately 66.7%. These results indicate that increasing blade tip clearance weakens the pressure-rise capability and substantially narrows the range of numerically converged steady-state operation. The enlarged clearance enhances the interaction and mixing between the tip-leakage flow and the mainstream, thereby reducing the aerodynamic loading in the blade-tip region and increasing local flow loss. Under transonic conditions, the intensified interaction among the leakage flow, passage shock, and boundary layer further increases aerodynamic loss, resulting in more pronounced performance deterioration near the choke boundary.
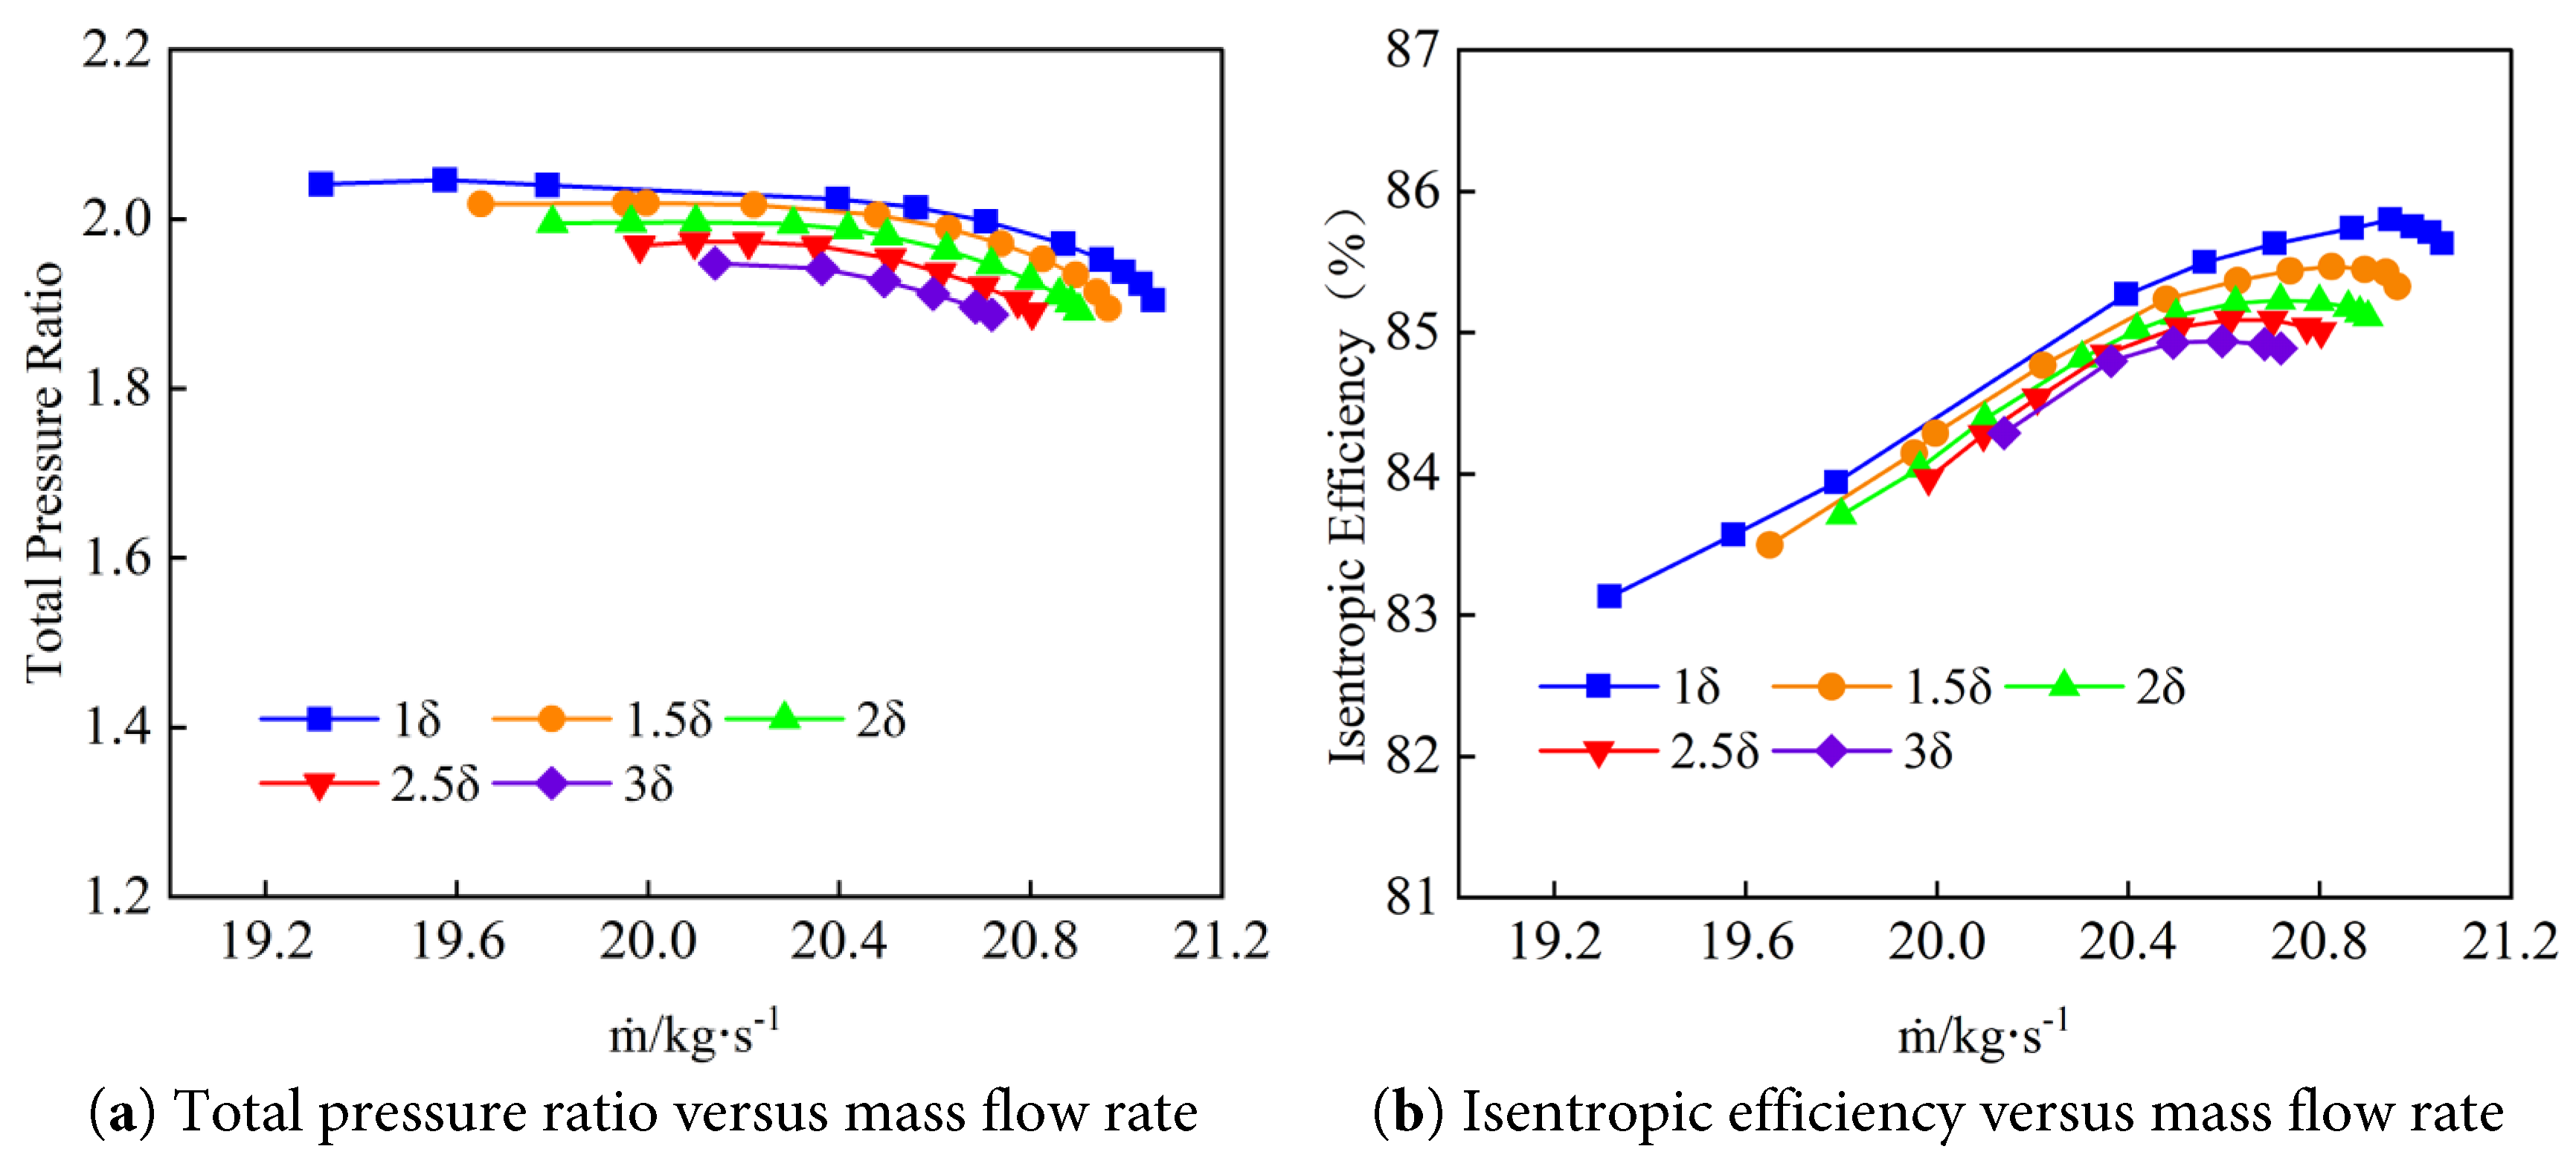
Figure 9: Effects of tip clearance on rotor performance characteristics.
4.3 Effects of Tip Clearance on Near-Tip Flow Structures and Pressure Distribution
To further explore the internal flow characteristics of the compressor under different blade tip clearances, this study compares the respective peak-efficiency operating points for each clearance. The vortex structures are identified using the Q-criterion. A threshold value of Q = 8 × 10⁸ s−2 is selected to capture the coherent tip-leakage vortex structures while reducing the influence of weak background vortical regions. This threshold provides a clear visualization of the dominant tip-region vortex structures and facilitates the comparison of vortex evolution under different tip-clearance conditions.
First, from the static pressure distribution at 98% blade height (Fig. 10), the high-pressure region is primarily located on the pressure side near the blade tip leading edge, while the low-pressure region is near the suction side leading edge. As the blade tip clearance increases, the high-pressure region becomes more concentrated and its pressure level rises, while the low-pressure region on the suction side expands and extends toward the pressure side of the adjacent passage. As a result, the pressure difference between the two sides increases. This pressure difference pattern indicates a stronger tip leakage flow, providing a greater momentum source for the subsequent vortex system.
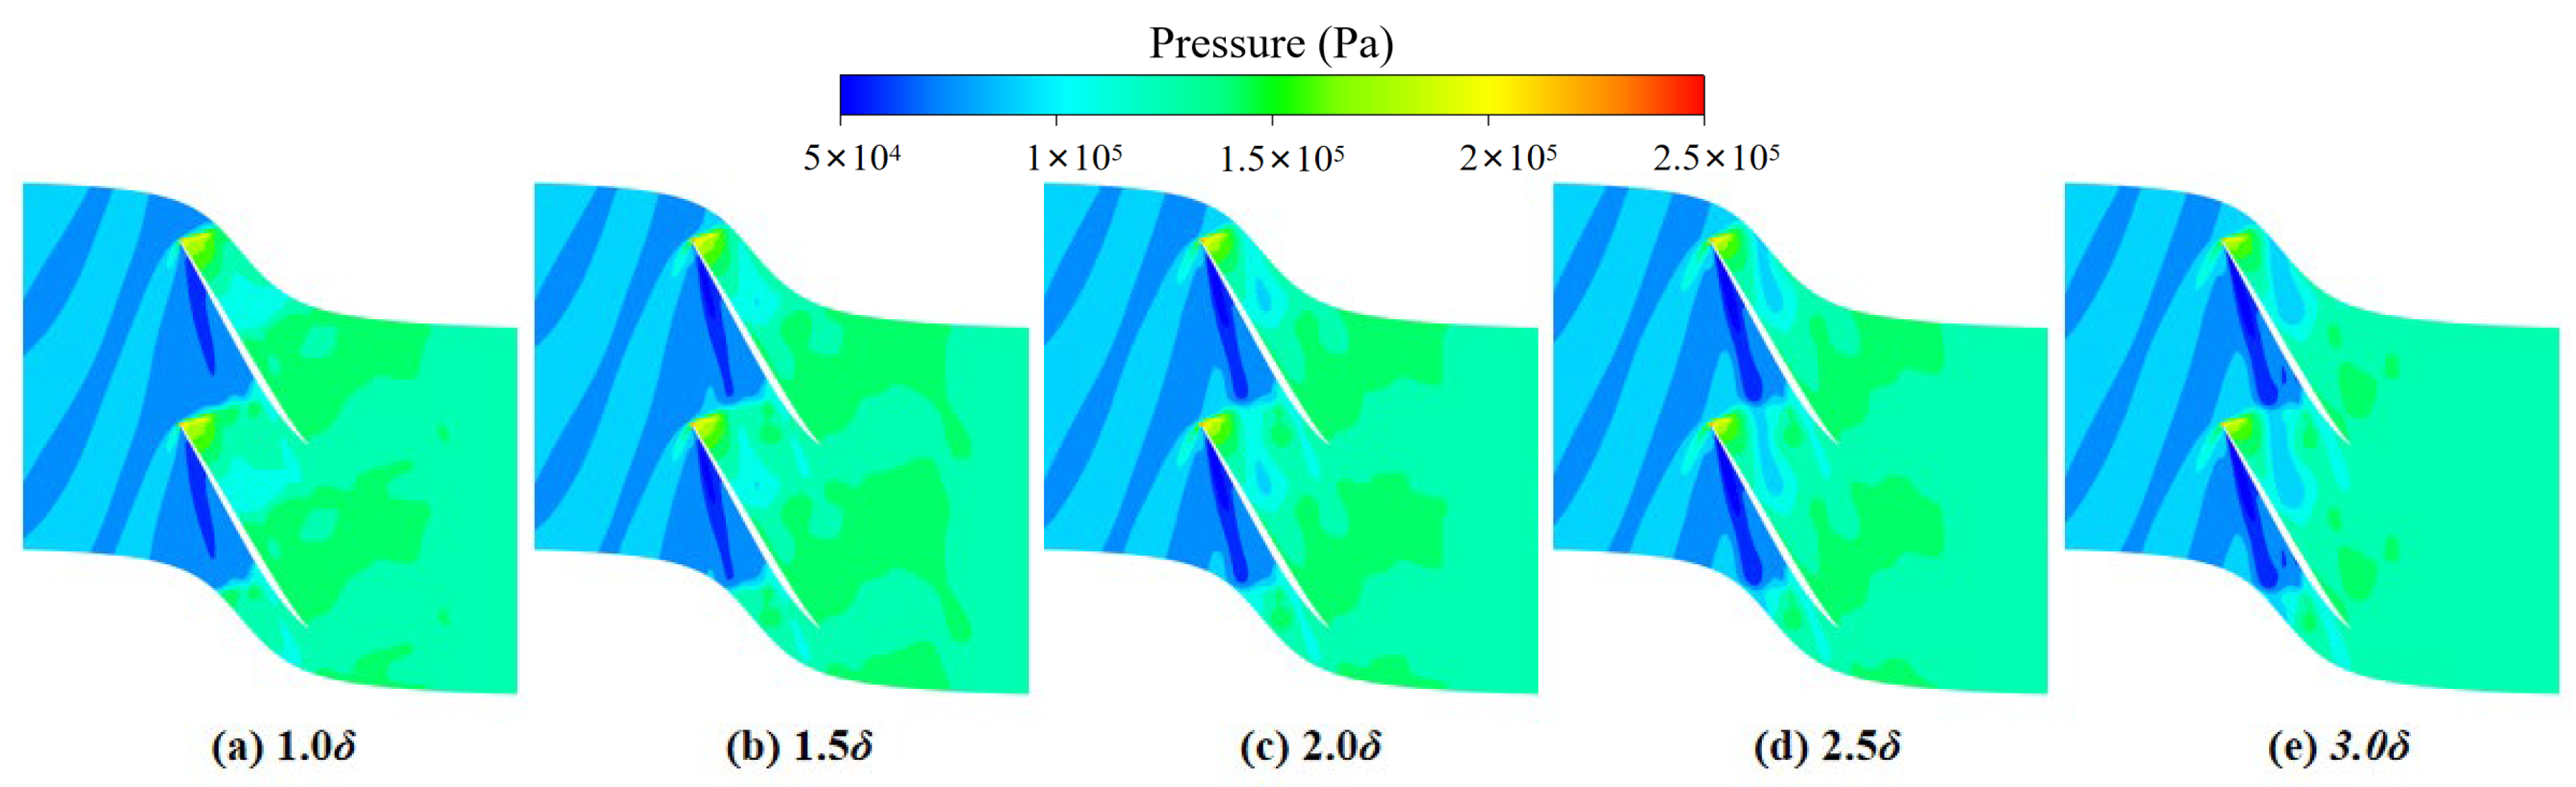
Figure 10: Static pressure distribution at 98% blade height under different tip clearance conditions.
In the blade tip vortex structure and total entropy-generation-rate distribution (Fig. 11), three main vortex systems can be identified: the primary tip leakage vortex (PTLV), secondary tip leakage vortex (STLV), and tip separation vortex (TSV). The PTLV originates near the blade tip leading edge and extends downstream along the passage, while the STLV develops in the mid-chord region of the blade tip. The TSV is located in the separation zone near the blade tip on the suction side. As the blade tip clearance increases, the PTLV and STLV structures exhibit an apparent spatial expansion, while the STLV-related structure becomes more pronounced and extends further downstream. At larger clearances, the three-dimensional organization of the leakage-vortex system becomes less compact and locally less coherent, indicating a broader but more diffuse vortex morphology. Meanwhile, the interaction between the PTLV and STLV becomes intensified, leading to enhanced shear mixing and increased thermodynamic irreversibility in the tip region.
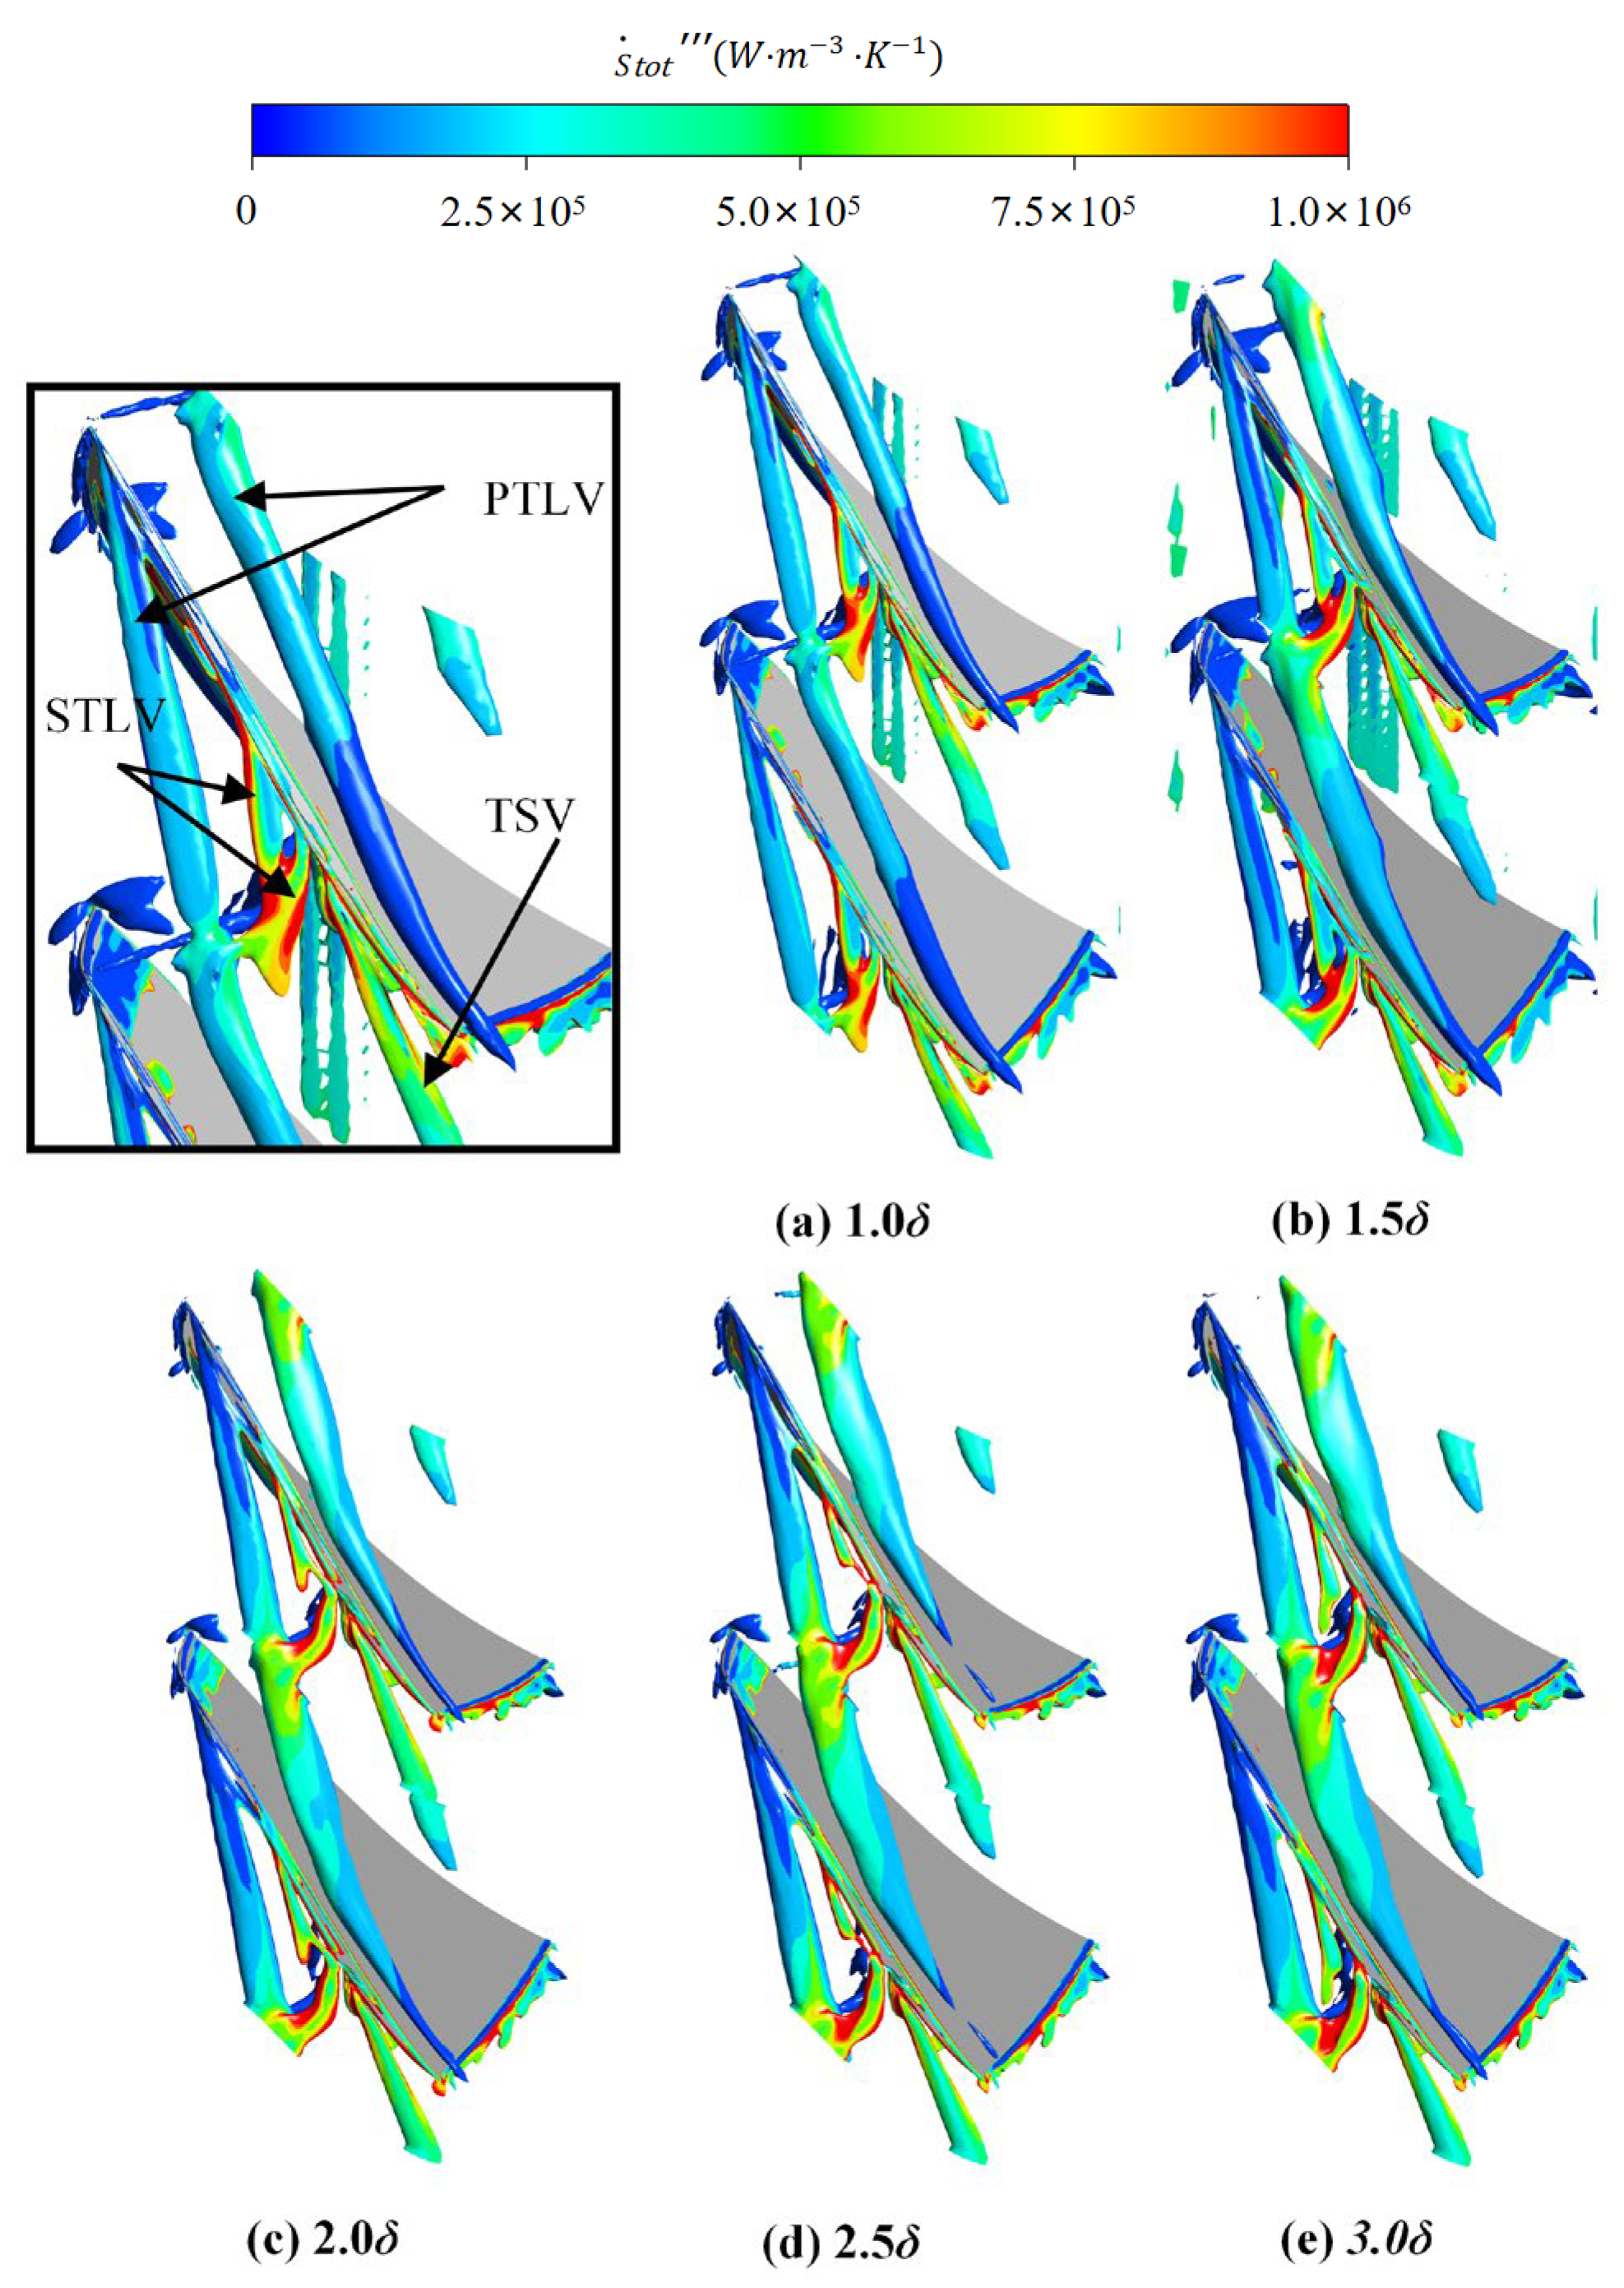
Figure 11: Overlay distribution of blade-tip vortex structures and total entropy-generation rate at different tip clearances.
To quantitatively characterize the spatial evolution of the leakage-vortex system, the volume of the Q-criterion identified vortex structures (Q ≥ 8 × 10⁸ s−2) was calculated, as summarized in Table 5. The identified vortex volume increases from 4.83 × 10⁻⁷ m3 at 1.0δ to 1.15 × 10⁻⁶ m3 at 3.0δ, corresponding to an increase of approximately 138%. Meanwhile, the peak-efficiency loss increases from 0 to 1.002% with increasing tip clearance. These results demonstrate that the enlargement of the Q-criterion-identified leakage-vortex region is closely associated with aerodynamic performance deterioration. The expanded leakage-vortex region enhances vortex interaction and mixing losses, thereby contributing to increased irreversible losses under enlarged tip-clearance conditions.
The total entropy-generation-rate distribution shows that the high-entropy-generation regions are mainly located in the blade-tip shear layer and the vortex interaction zone, corresponding to the active regions of the leakage-vortex system. These regions are characterized by intense turbulent mixing and concentrated irreversible dissipation, making them dominant contributors to entropy generation in the tip region. Overall, as the blade tip clearance increases, the shear and mixing interactions between the leakage flow and the mainstream are enhanced, resulting in the expansion of the high-entropy-generation region and an increase in its local intensity.
Table 5: Variations of Q-criterion-identified vortex volume and efficiency loss under different tip-clearance conditions.
| Tip-Clearance Condition | VQ (m3) | Efficiency Loss (%) |
|---|---|---|
| 1.0δ | 4.83 × 10⁻⁷ | 0 |
| 1.5δ | 7.56 × 10⁻⁷ | 0.385 |
| 2.0δ | 9.27 × 10⁻⁷ | 0.664 |
| 2.5δ | 9.78 × 10⁻⁷ | 0.828 |
| 3.0δ | 1.15 × 10⁻⁶ | 1.002 |
4.4 Effect of Blade Tip Clearance on Leakage Flow and Blockage Effects
Tip-leakage flow reduces the effective throughflow and causes substantial aerodynamic loss. A portion of the flow that has received work from the rotor short-circuits through the tip clearance from the pressure side to the suction side and therefore contributes less effectively to the downstream pressure rise. To quantify this impact, Fig. 12 presents the leakage mass flow rate m and its leakage rate Rq relative to the total mass flow rate at the inlet under peak efficiency conditions for each clearance. The results show that as the clearance increases, both m and Rq increase approximately linearly. At 1.0δ, Rq = 0.895%; when the clearance increases to 3.0δ, Rq rises to 2.89%, an increase of about 223%. This indicates that blade tip clearance size is a key design parameter for controlling leakage losses and, consequently, affecting the aerodynamic performance of the compressor.
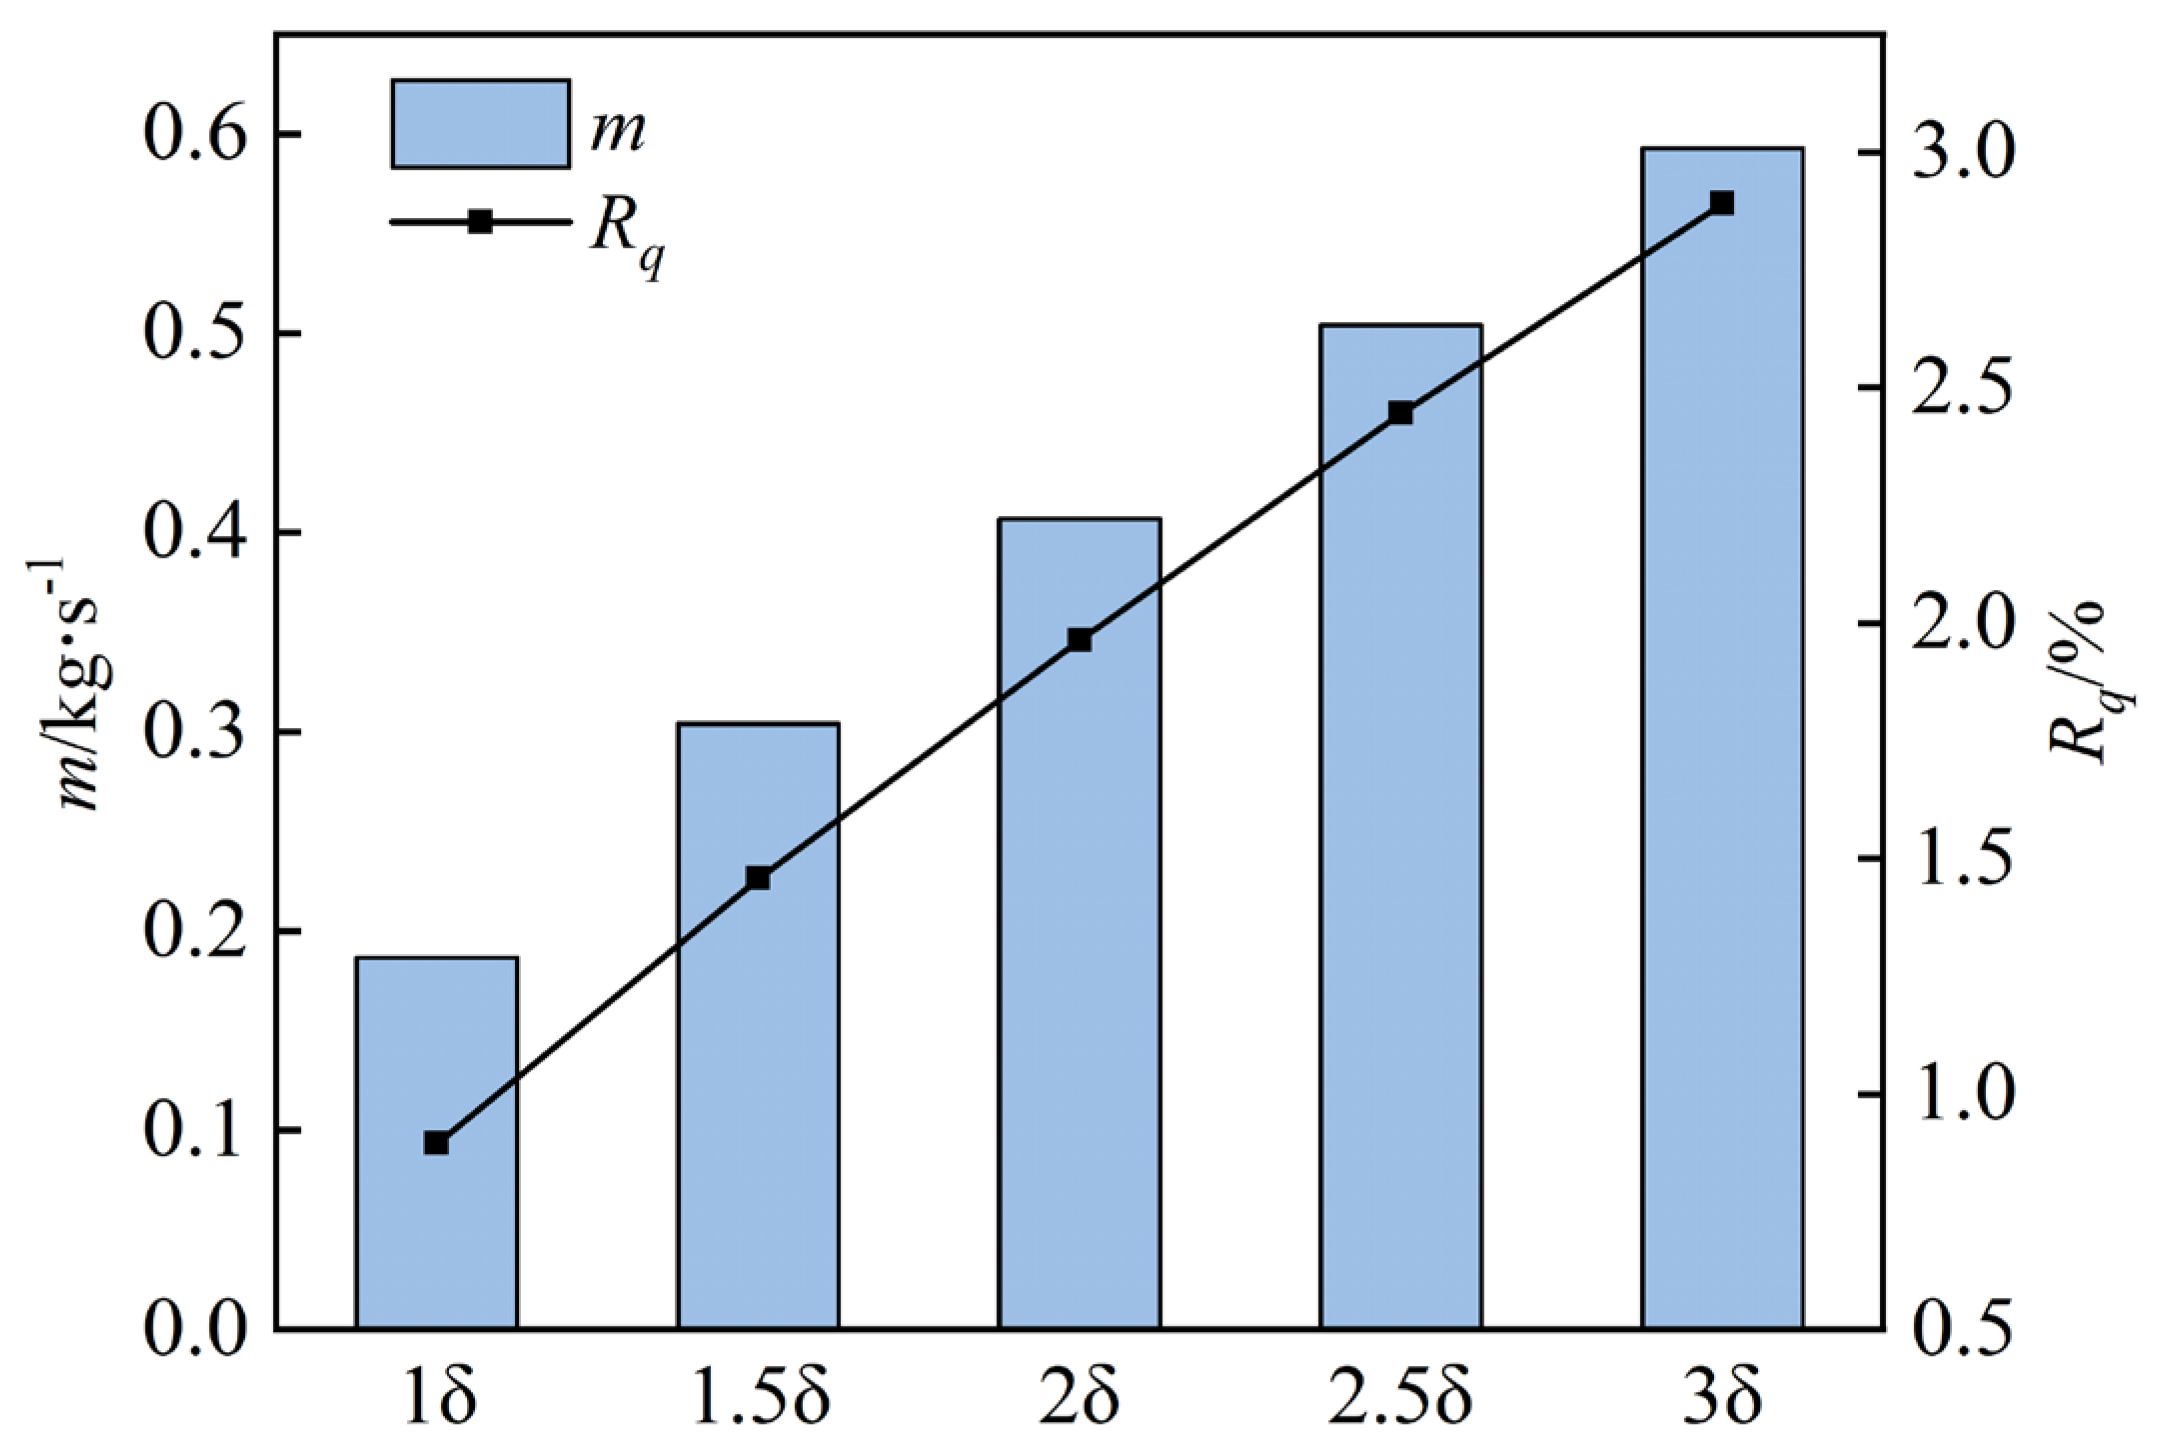
Figure 12: Comparison of leakage flow and leakage rate at different blade tip clearances.
To further analyze the influence of tip-leakage flow on the flow organization and local flow-passing capability in the near-tip region of the passage, a mid-passage section between two adjacent blades is selected and denoted as Sm, as shown in Fig. 13. Based on the Sm section, the axial-velocity distribution overlaid with velocity vectors is extracted for three representative tip-clearance conditions, namely 1.0δ, 2.0δ, and 3.0δ, as shown in Fig. 14. The pressure side and suction side are denoted as PS and SS, respectively, and the white dashed line represents the zero-axial-velocity contour. Positive axial velocity corresponds to the normal downstream passage of the mainstream, whereas negative axial velocity indicates the presence of local reverse flow.
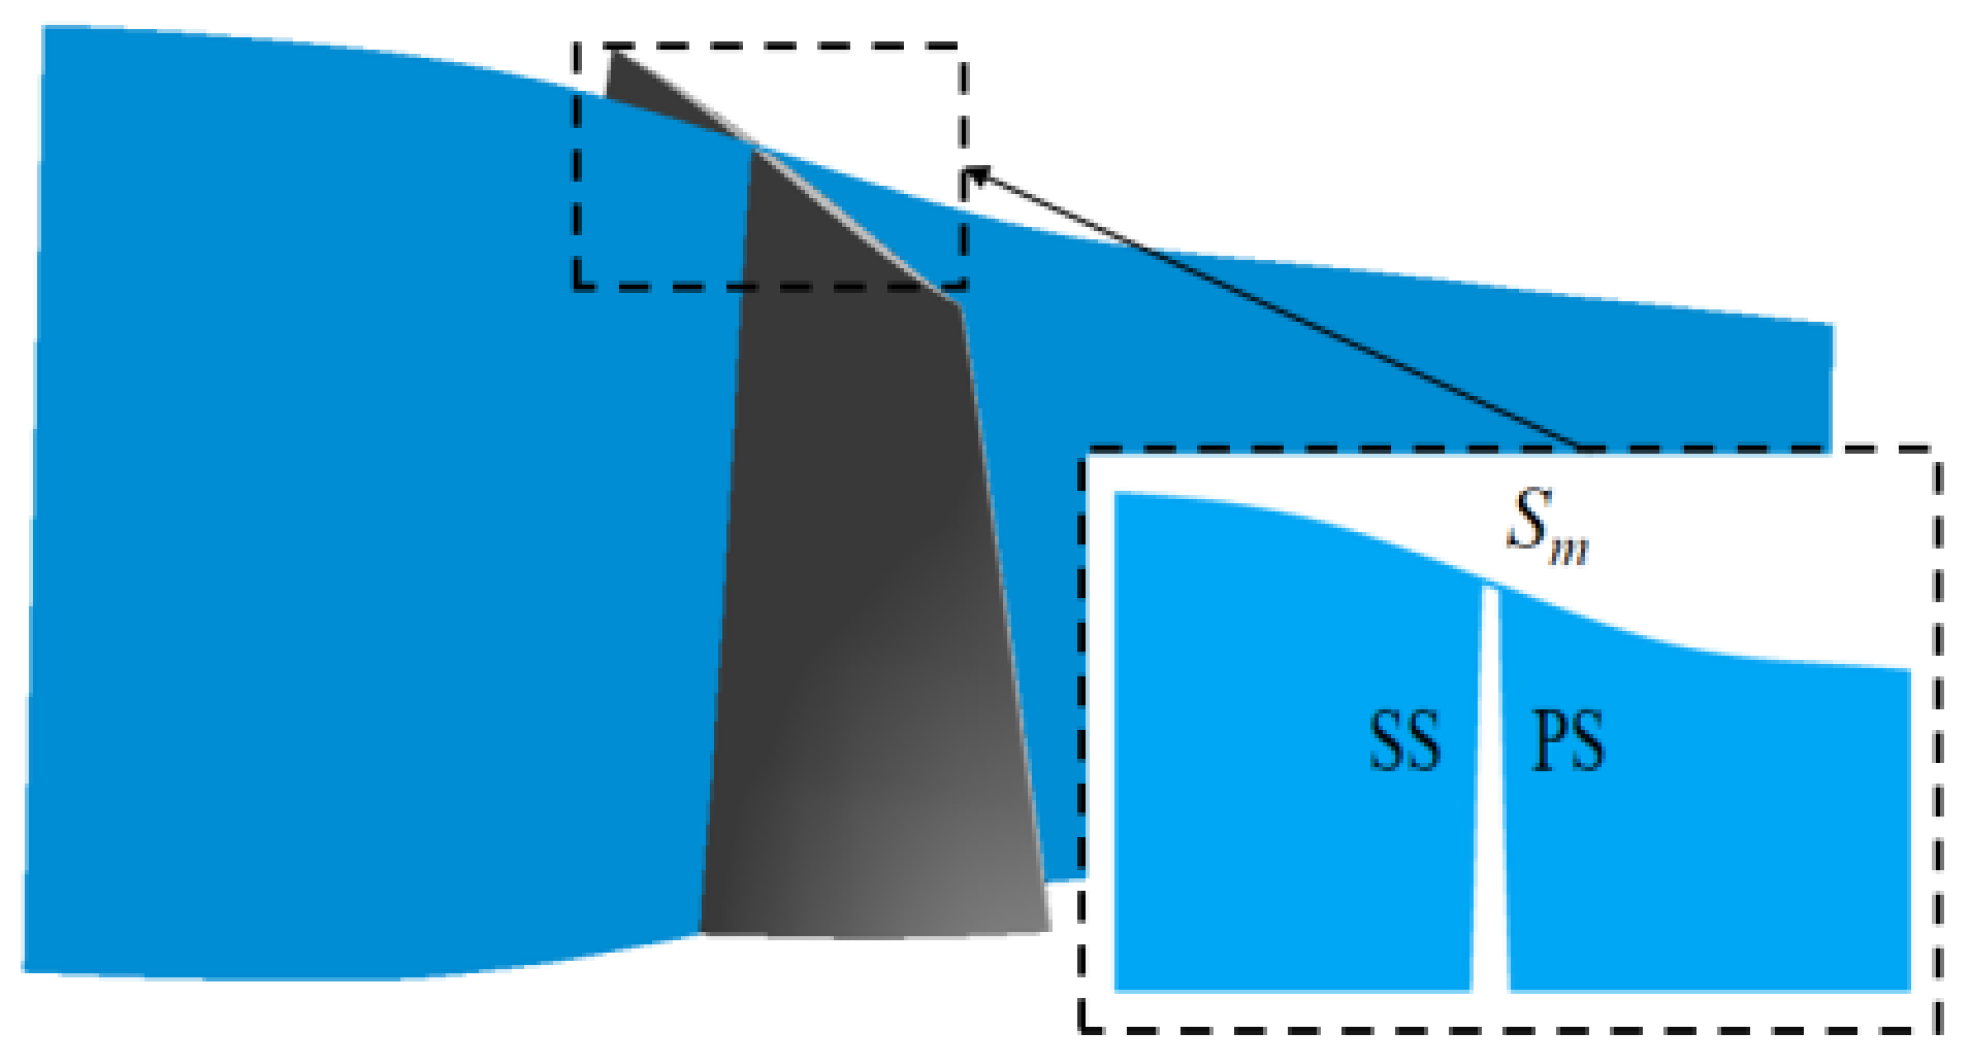
Figure 13: Sm section position.
As shown in Fig. 14, the flow structure in the near-tip region evolves markedly with increasing tip clearance. Under the 1.0δ condition, the negative axial-velocity region remains relatively limited and is mainly confined to the local tip region near the casing. The white dashed line stays close to the tip wall, indicating that the reverse-flow region has not expanded significantly into the passage. Accordingly, the mainstream still maintains good flow continuity, and both the flow deflection and blockage effect in the tip region remain weak. When the clearance increases to 2.0δ, the low axial-velocity region and the negative axial-velocity region both expand noticeably, while the zero-axial-velocity contour moves further into the passage and downstream, indicating a further development of local reverse flow. Meanwhile, the mainstream in the tip region exhibits more pronounced deflection, suggesting that the effective axial flow area has been significantly reduced and that the blockage effect has become stronger. As the clearance further increases to 3δ, the negative axial-velocity band near the casing becomes wider and more continuous, and the reverse-flow region reaches its largest extent. At the same time, the mainstream core is further compressed toward the lower part of the passage, indicating that the blockage effect in the near-tip region is the most severe under this condition.
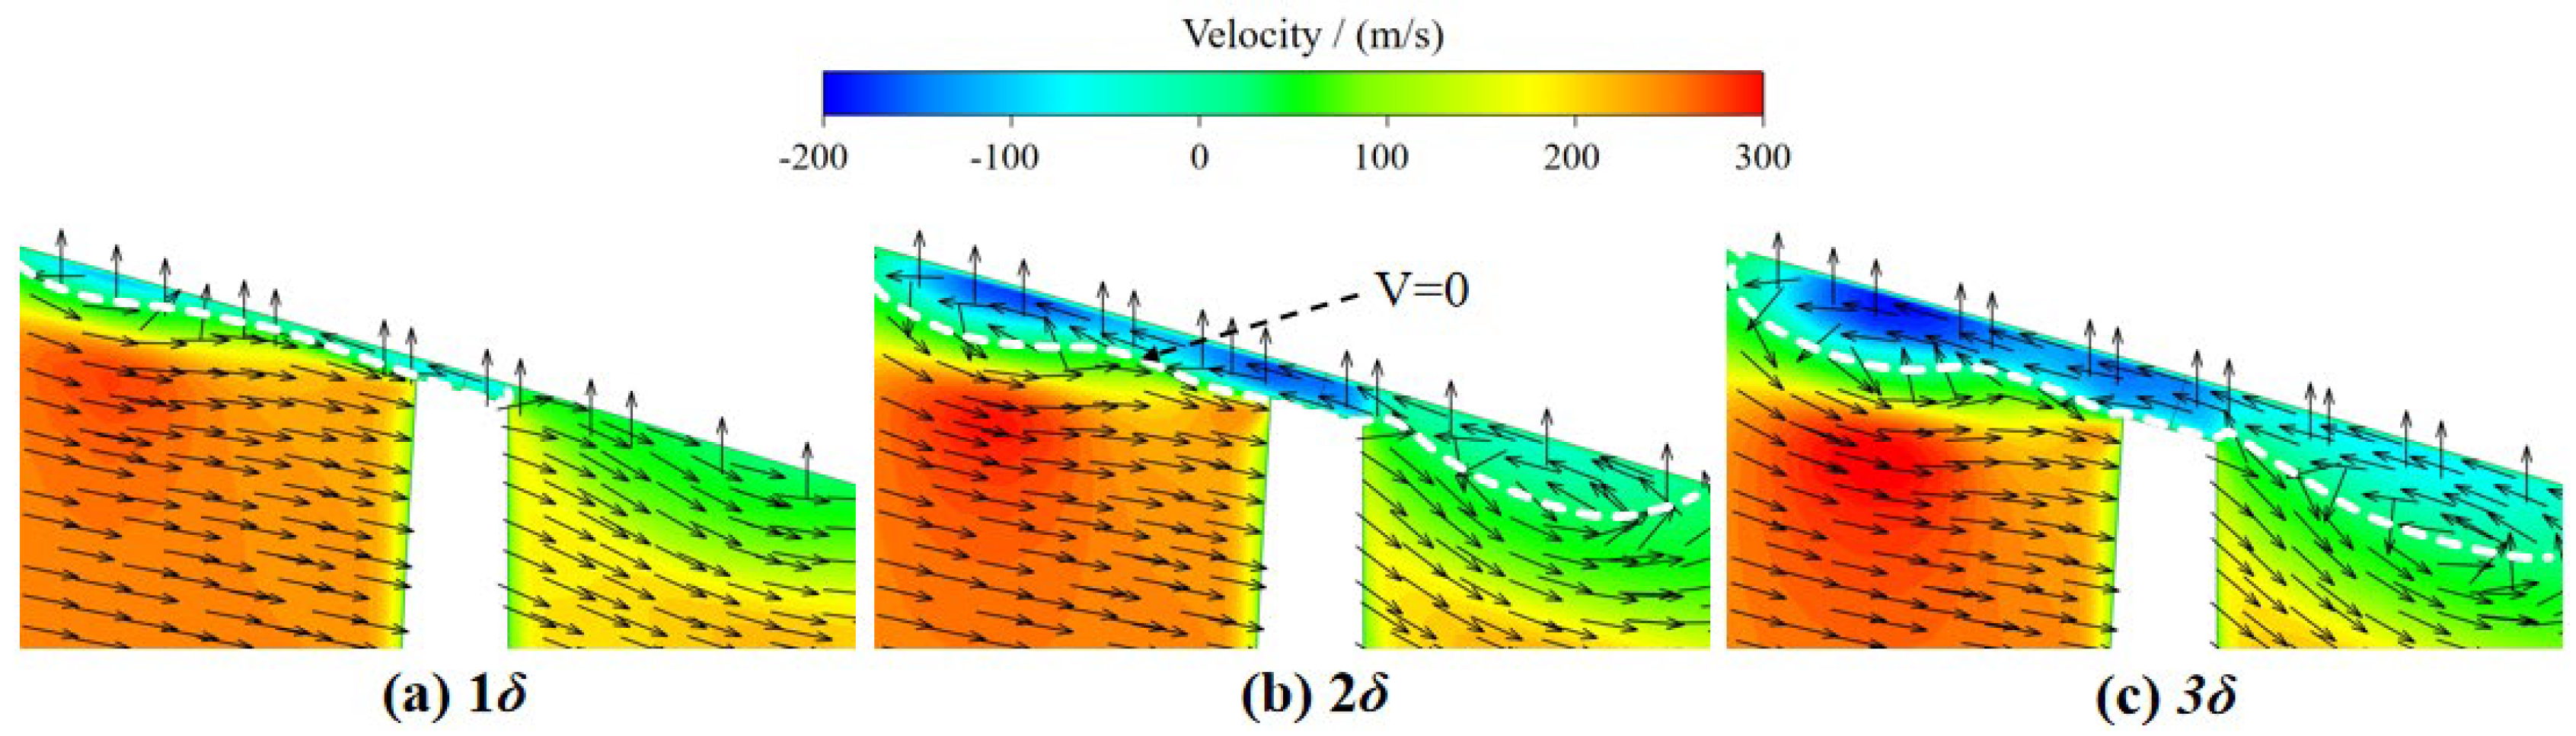
Figure 14: Axial-velocity distribution and velocity vectors on the Sm section for different tip clearances.
Overall, increasing tip clearance causes the low axial-velocity region and the reverse-flow region in the near-tip area to expand continuously, accompanied by a progressive migration of the zero-axial-velocity contour toward the passage interior and downstream. These changes reflect the enhancement of local reverse flow and the intensification of mainstream deflection. This indicates that a larger tip clearance significantly weakens the effective flow-passing capability in the tip region, promotes the accumulation of low-momentum fluid near the casing, and aggravates the blockage effect within the passage. This trend is consistent with the previously observed reductions in total pressure ratio and isentropic efficiency with increasing tip clearance.
4.5 Entropy-Generation Characteristics for Different Tip Clearances
Fig. 15 compares the total rotor entropy generation
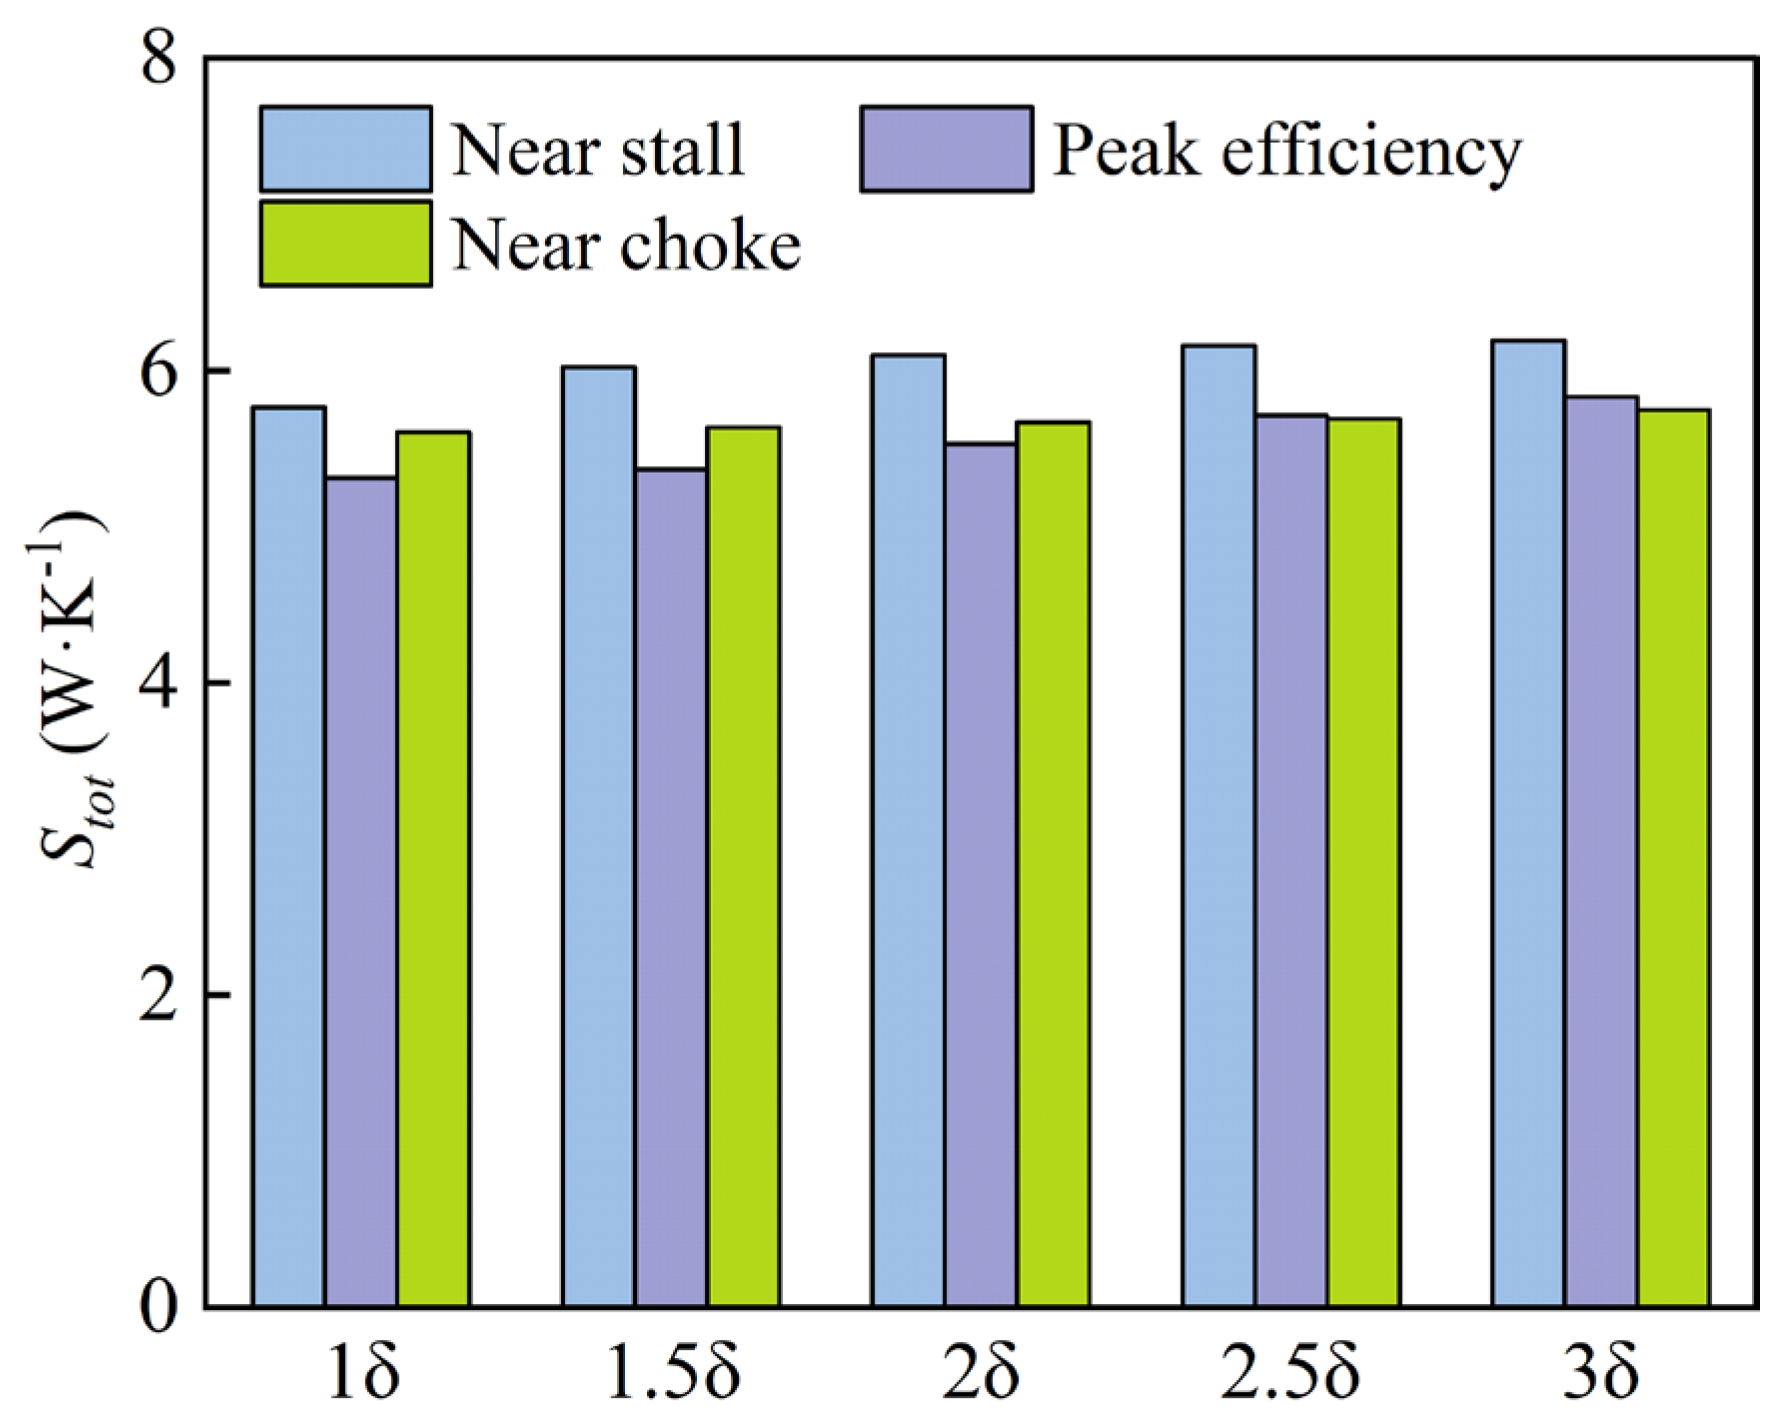
Figure 15: Comparison of total rotor entropy generation under different tip-clearance conditions and operating points.
Fig. 16 compares the four entropy-generation components at the respective peak-efficiency operating points under different tip-clearance conditions. The direct viscous-dissipation entropy generation, (Sdir), remains nearly unchanged, varying only from 0.0576 to 0.0596 W·K−1. The molecular heat-transfer entropy generation, (Sth,m), is also very small and varies within a narrow range of 0.0168–0.0176 W·K−1. In contrast, the turbulent mechanical-dissipation entropy generation, (Sturb), is the dominant individual component and increases from 4.655 W·K−1 at 1.0δ to 5.114 W·K−1 at 3.0δ. The turbulent heat-transfer entropy generation, (Sth,t), is the second-largest component and increases overall from 0.581 to 0.639 W·K−1.
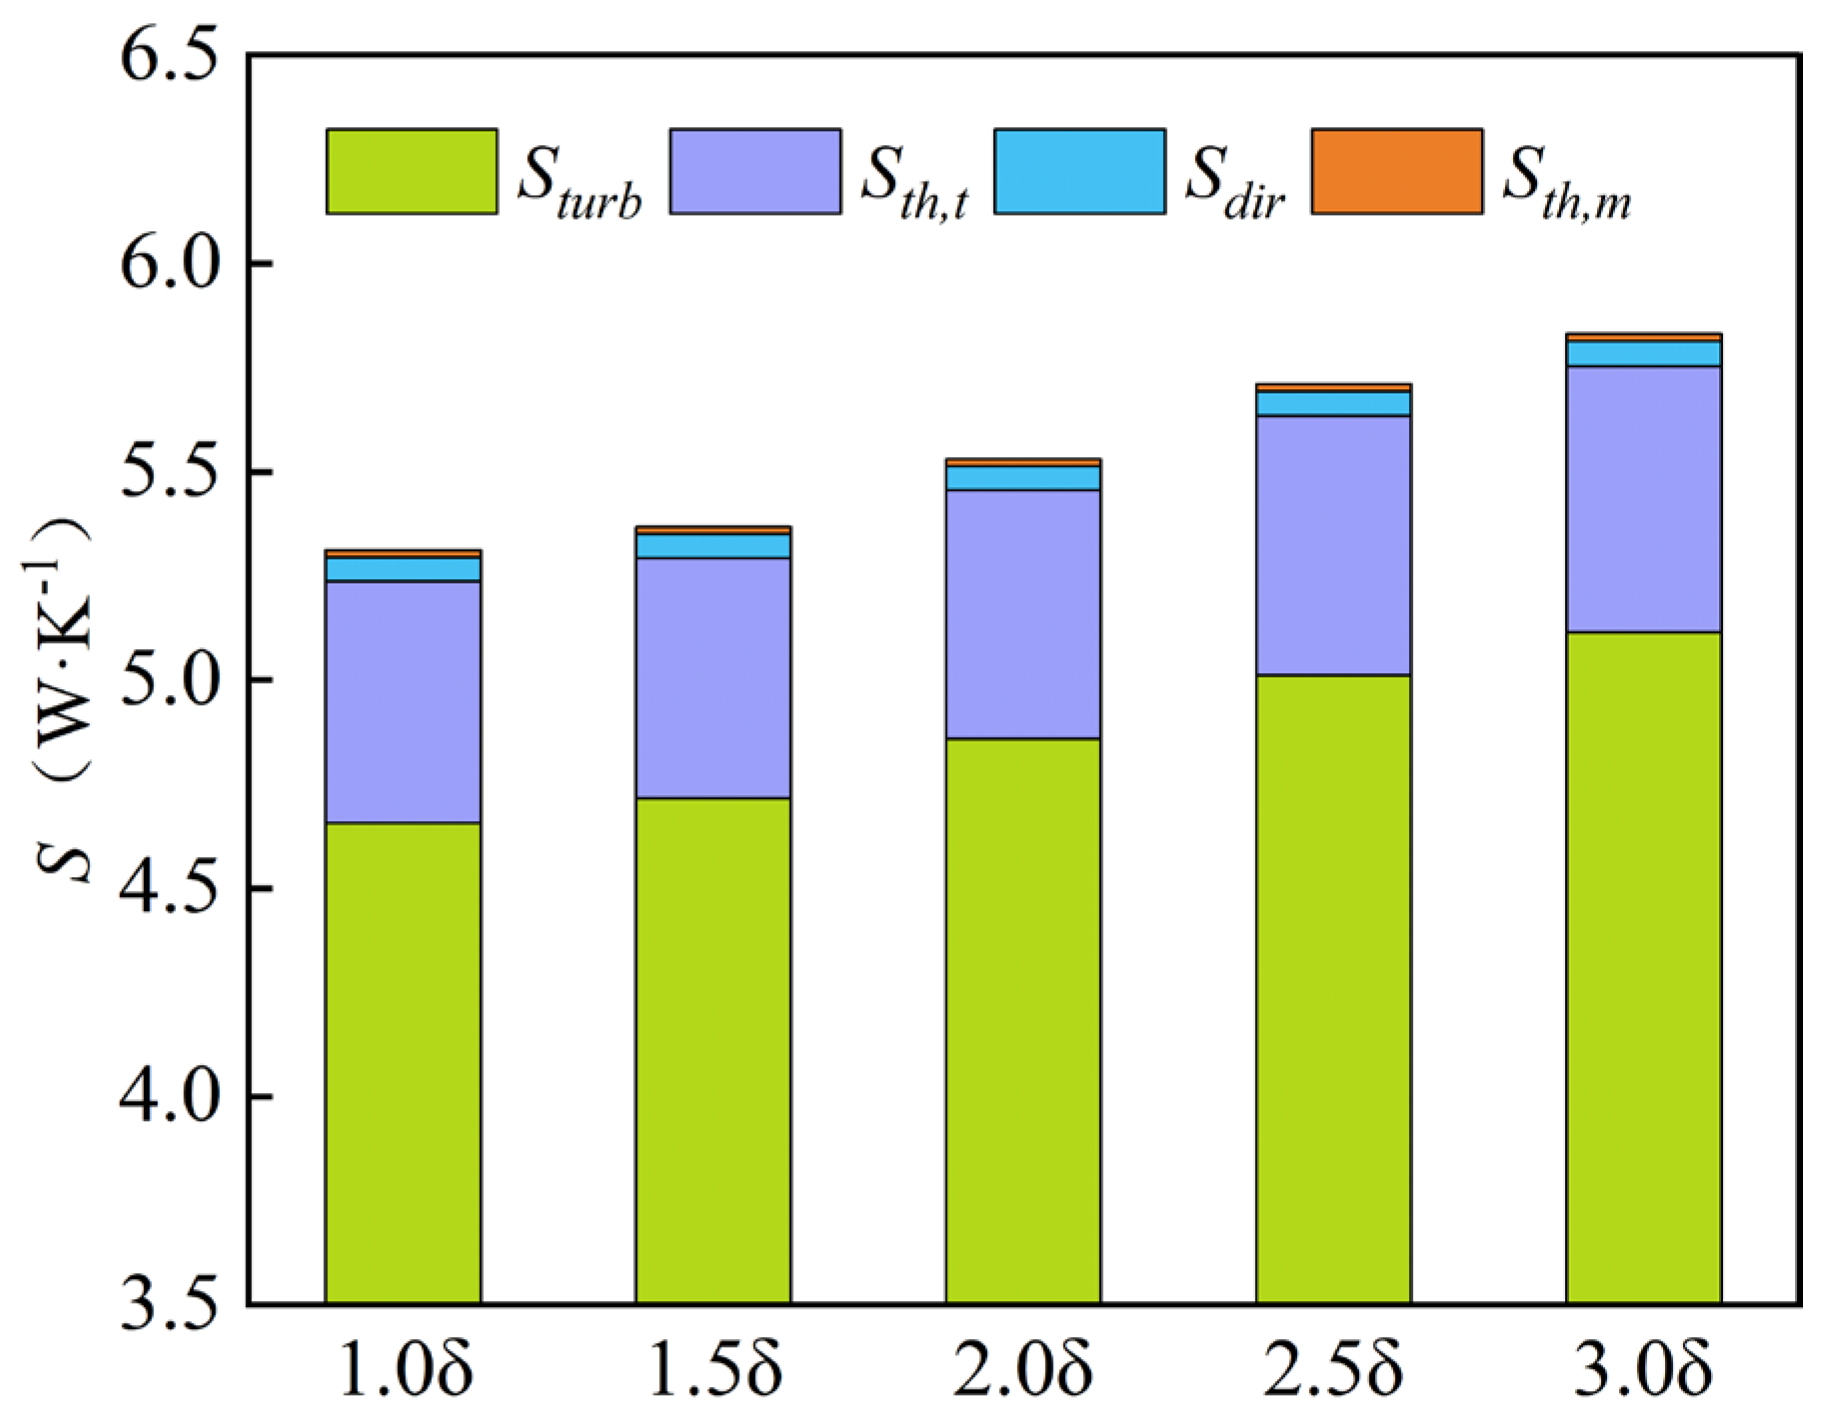
Figure 16: Entropy-generation components at the respective peak-efficiency operating points under different tip-clearance conditions.
Accordingly, the total entropy generation increases from 5.311 W·K−1 at 1.0δ to 5.830 W·K−1 at 3.0δ, indicating a progressive enhancement of thermodynamic irreversibility with increasing tip clearance.
To quantify the contribution of turbulence-related processes, the turbulence-related entropy-generation fraction is defined as
The calculated value of Rturb remains between approximately 98.59% and 98.68% over all tip-clearance conditions. This indicates that turbulence-related dissipation is the dominant contributor to the total entropy generation under the investigated conditions, whereas the contributions of direct viscous dissipation and molecular heat transfer are comparatively small.
This dominance of turbulence-related entropy generation is mainly attributed to the high-speed transonic flow characteristics of Rotor 37, where strong tip-leakage vortex development, shock–boundary-layer interaction, and turbulent mixing dominate the irreversible loss mechanisms. It should be noted that the entropy-generation decomposition is based on the present SST k–ω based RANS framework. Therefore, the absolute values of turbulence-related entropy generation are subject to uncertainties associated with the turbulence modeling approach. Nevertheless, the dominance of turbulence-related entropy generation and its consistent variation trends under different tip-clearance conditions indicate that the identified loss-generation mechanisms remain robust within the present numerical framework.
To quantify the spanwise distribution of entropy generation, the blade passage is divided into ten equal-volume segments along the blade span. The entropy generation within each segment is obtained by integrating the local total entropy-generation rate over the corresponding segment volume:
The contribution of the i-th segment to the total entropy generation is then defined as:
As shown in Fig. 17, the entropy-generation fraction exhibits an endwall-dominated distribution along the blade span. The entropy generation is relatively high near both the hub and casing regions, whereas the mid-span region presents lower values with moderate fluctuations. With increasing tip clearance, the entropy-generation contribution near the casing gradually increases, indicating that the irreversible losses become increasingly concentrated toward the blade-tip region.
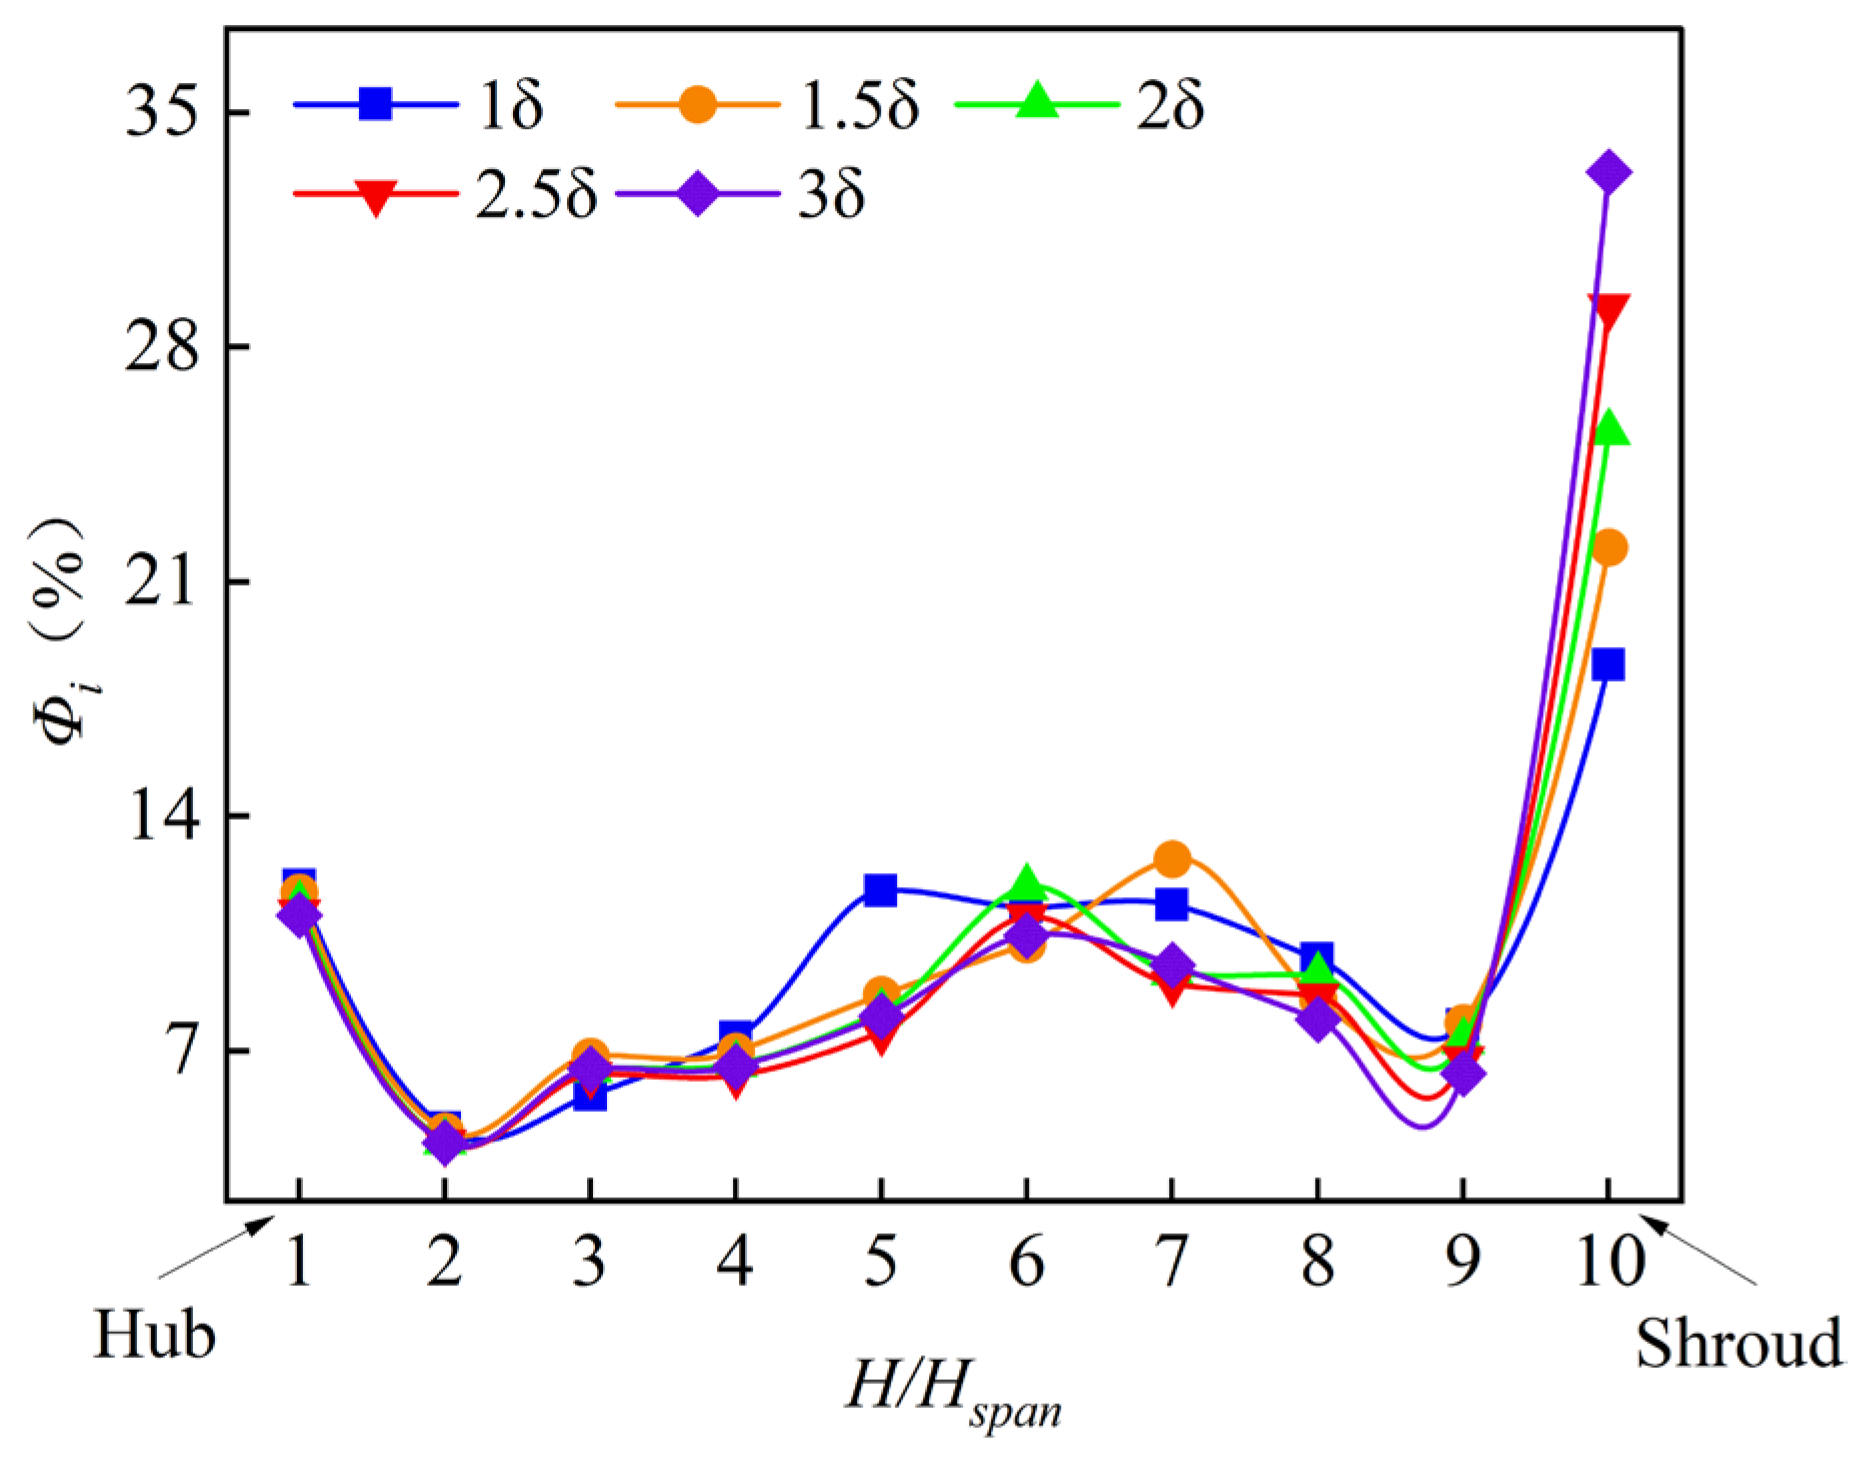
Figure 17: Spanwise distribution of entropy-generation fraction under different tip-clearance conditions.
In this study, the region with H/Hspan ≥ 0.9 is selected to characterize the blade-tip influence zone. Under this definition, the entropy-generation contribution of this region increases from approximately 18.5% at 1.0δ to 33.2% at 3.0δ. The redistribution of entropy generation toward the casing side is mainly attributed to the enhanced tip-leakage flow, intensified near-wall shear, and stronger turbulent mixing induced by enlarged tip clearance.
To evaluate the sensitivity of the observed entropy-generation redistribution to the selected spanwise boundary threshold, additional evaluations were performed using H/Hspan ≥ 0.85 and H/Hspan ≥ 0.95. As summarized in Table 6, although the absolute entropy-generation fractions vary with the selected boundary threshold, the increasing trend with tip clearance remains unchanged. Specifically, the entropy-generation contribution of the blade-tip region continuously increases from 1.0δ to 3.0δ across all three thresholds. This demonstrates that the observed redistribution of irreversible losses toward the blade-tip region is not sensitive to the specific threshold selected for defining the blade-tip influence zone.
Table 6: Sensitivity analysis of entropy-generation contribution in the blade-tip influence zone under different spanwise threshold definitions.
| Tip-Clearance Condition | |||
|---|---|---|---|
| 1.0δ | 22.26% | 18.52% | 15.42% |
| 1.5δ | 25.88% | 22.02% | 18.25% |
| 2.0δ | 29.28% | 25.45% | 20.78% |
| 2.5δ | 32.95% | 29.19% | 23.04% |
| 3.0δ | 36.81% | 33.22% | 24.47% |
4.6 Distribution Analysis of Energy Loss Based on Entropy Generation Theory
To further examine the chordwise evolution of flow structures and loss distribution in the tip region, 10 chordwise sections are extracted at peak efficiency for different blade tip clearances. Based on this sectional treatment, the distributions of vortex intensity and Total entropy-generation rate are presented in Fig. 18a,b, respectively. This comparison helps identify the dominant flow structures in the tip-affected region and clarify how their spatial evolution is associated with the development of aerodynamic loss.
As shown in Fig. 18a, the high-intensity vortex region is mainly concentrated near the blade tip on the suction side and exhibits an approximately double-triangular spatial pattern in each section. The larger triangular region extends along the chordwise direction and is associated with the PTLV–STLV system, whereas the smaller triangular region is located near the leading edge of the suction side and is related to local separation. The strongest vortex cores are mainly observed near the onset of the PTLV and in the mid-chord region where the STLV becomes pronounced. As the blade tip clearance increases, the local peak intensity changes only slightly, while the influence range of the leakage-vortex system expands noticeably, appearing as longer and wider high-intensity bands over multiple sections and showing a greater geometric overlap with the adjacent tip region.
Fig. 18b shows that the total entropy-generation field exhibits a clear, although not complete, spatial correspondence with the vortex-intensity field. In terms of both overall location and contour pattern, the major high-entropy-generation regions are mainly distributed in the STLV-related shear layer and the downstream part of the PTLV–STLV system, where strong shear mixing and turbulent transport contribute to irreversible thermodynamic losses. By contrast, the leading-edge high-intensity vortex core does not always coincide with the strongest entropy-generation region, indicating that high vortex intensity alone does not necessarily imply severe aerodynamic loss. As the blade-tip clearance increases from 1.0δ to 3.0δ, the high-entropy-generation region gradually expands over more chordwise sections, indicating that the loss contribution of the tip-affected region increases continuously. This trend is consistent with the spanwise analysis presented above, where the entropy-generation contribution of the blade-tip influence zone (H/Hspan ≥ 0.9) increases from 18.5% at 1.0δ to 33.2% at 3.0δ.
On the Sm section shown in Fig. 13, the distributions of vortex intensity and total entropy generation rate for different blade tip clearances are further compared in Fig. 19. The peak-efficiency condition for each clearance is selected, and the corresponding vorticity and total entropy-generation fields are extracted on this section to examine the evolution of near-tip flow structures and loss distribution.
As shown in Fig. 19a, the high-vorticity region is mainly concentrated in the near-wall region on the suction-side tip, including the PTLV near the leading edge, the STLV-related high-vorticity band extending downstream from the clearance exit, and the right-side high-vorticity structure associated with the adjacent passage. As the blade tip clearance increases, the leading-edge high-vorticity region becomes wider, the STLV-related band becomes more evident and extends further downstream in the sectional view, and the right-side high-vorticity structure gradually intensifies.
Fig. 19b shows that the total entropy-generation field has a clear spatial correspondence with these high-vorticity structures. At smaller clearances, the dominant high-entropy-generation band is distributed continuously along the suction-side tip wall, and its location is broadly consistent with the STLV-related high-vorticity band, indicating that the STLV-related shear-layer structure contributes significantly to local entropy generation. It should be noted, however, that this correspondence does not mean that entropy generation is governed by vortex rotation alone; rather, it more directly reflects the enhancement of near-wall shear and strong mixing within the STLV-related region. As the clearance increases, the coverage of this dominant high-entropy-generation band expands continuously. Meanwhile, starting from 2.0δ, a new localized high-entropy-generation region appears near the tip corner, and it becomes more pronounced and broader at 2.5δ and 3.0δ. Based on its spatial position, this new high-entropy-generation region corresponds closely to the area where the right-side high-vorticity structure approaches the near-wall tip-corner region, indicating that local interference and the associated enhancement of near-wall shear play an important role in the growth of loss in this area. Overall, increasing blade tip clearance leads to a simultaneous enlargement of both the high-vorticity region and the high-entropy-generation region on the Sm section. The dominant high-entropy-generation band mainly corresponds to the STLV-related high-vorticity band developing along the wall, whereas the newly emerged localized high-entropy-generation region is associated with the local interference and enhanced near-wall shear induced by the intensified right-side high-vorticity structure.
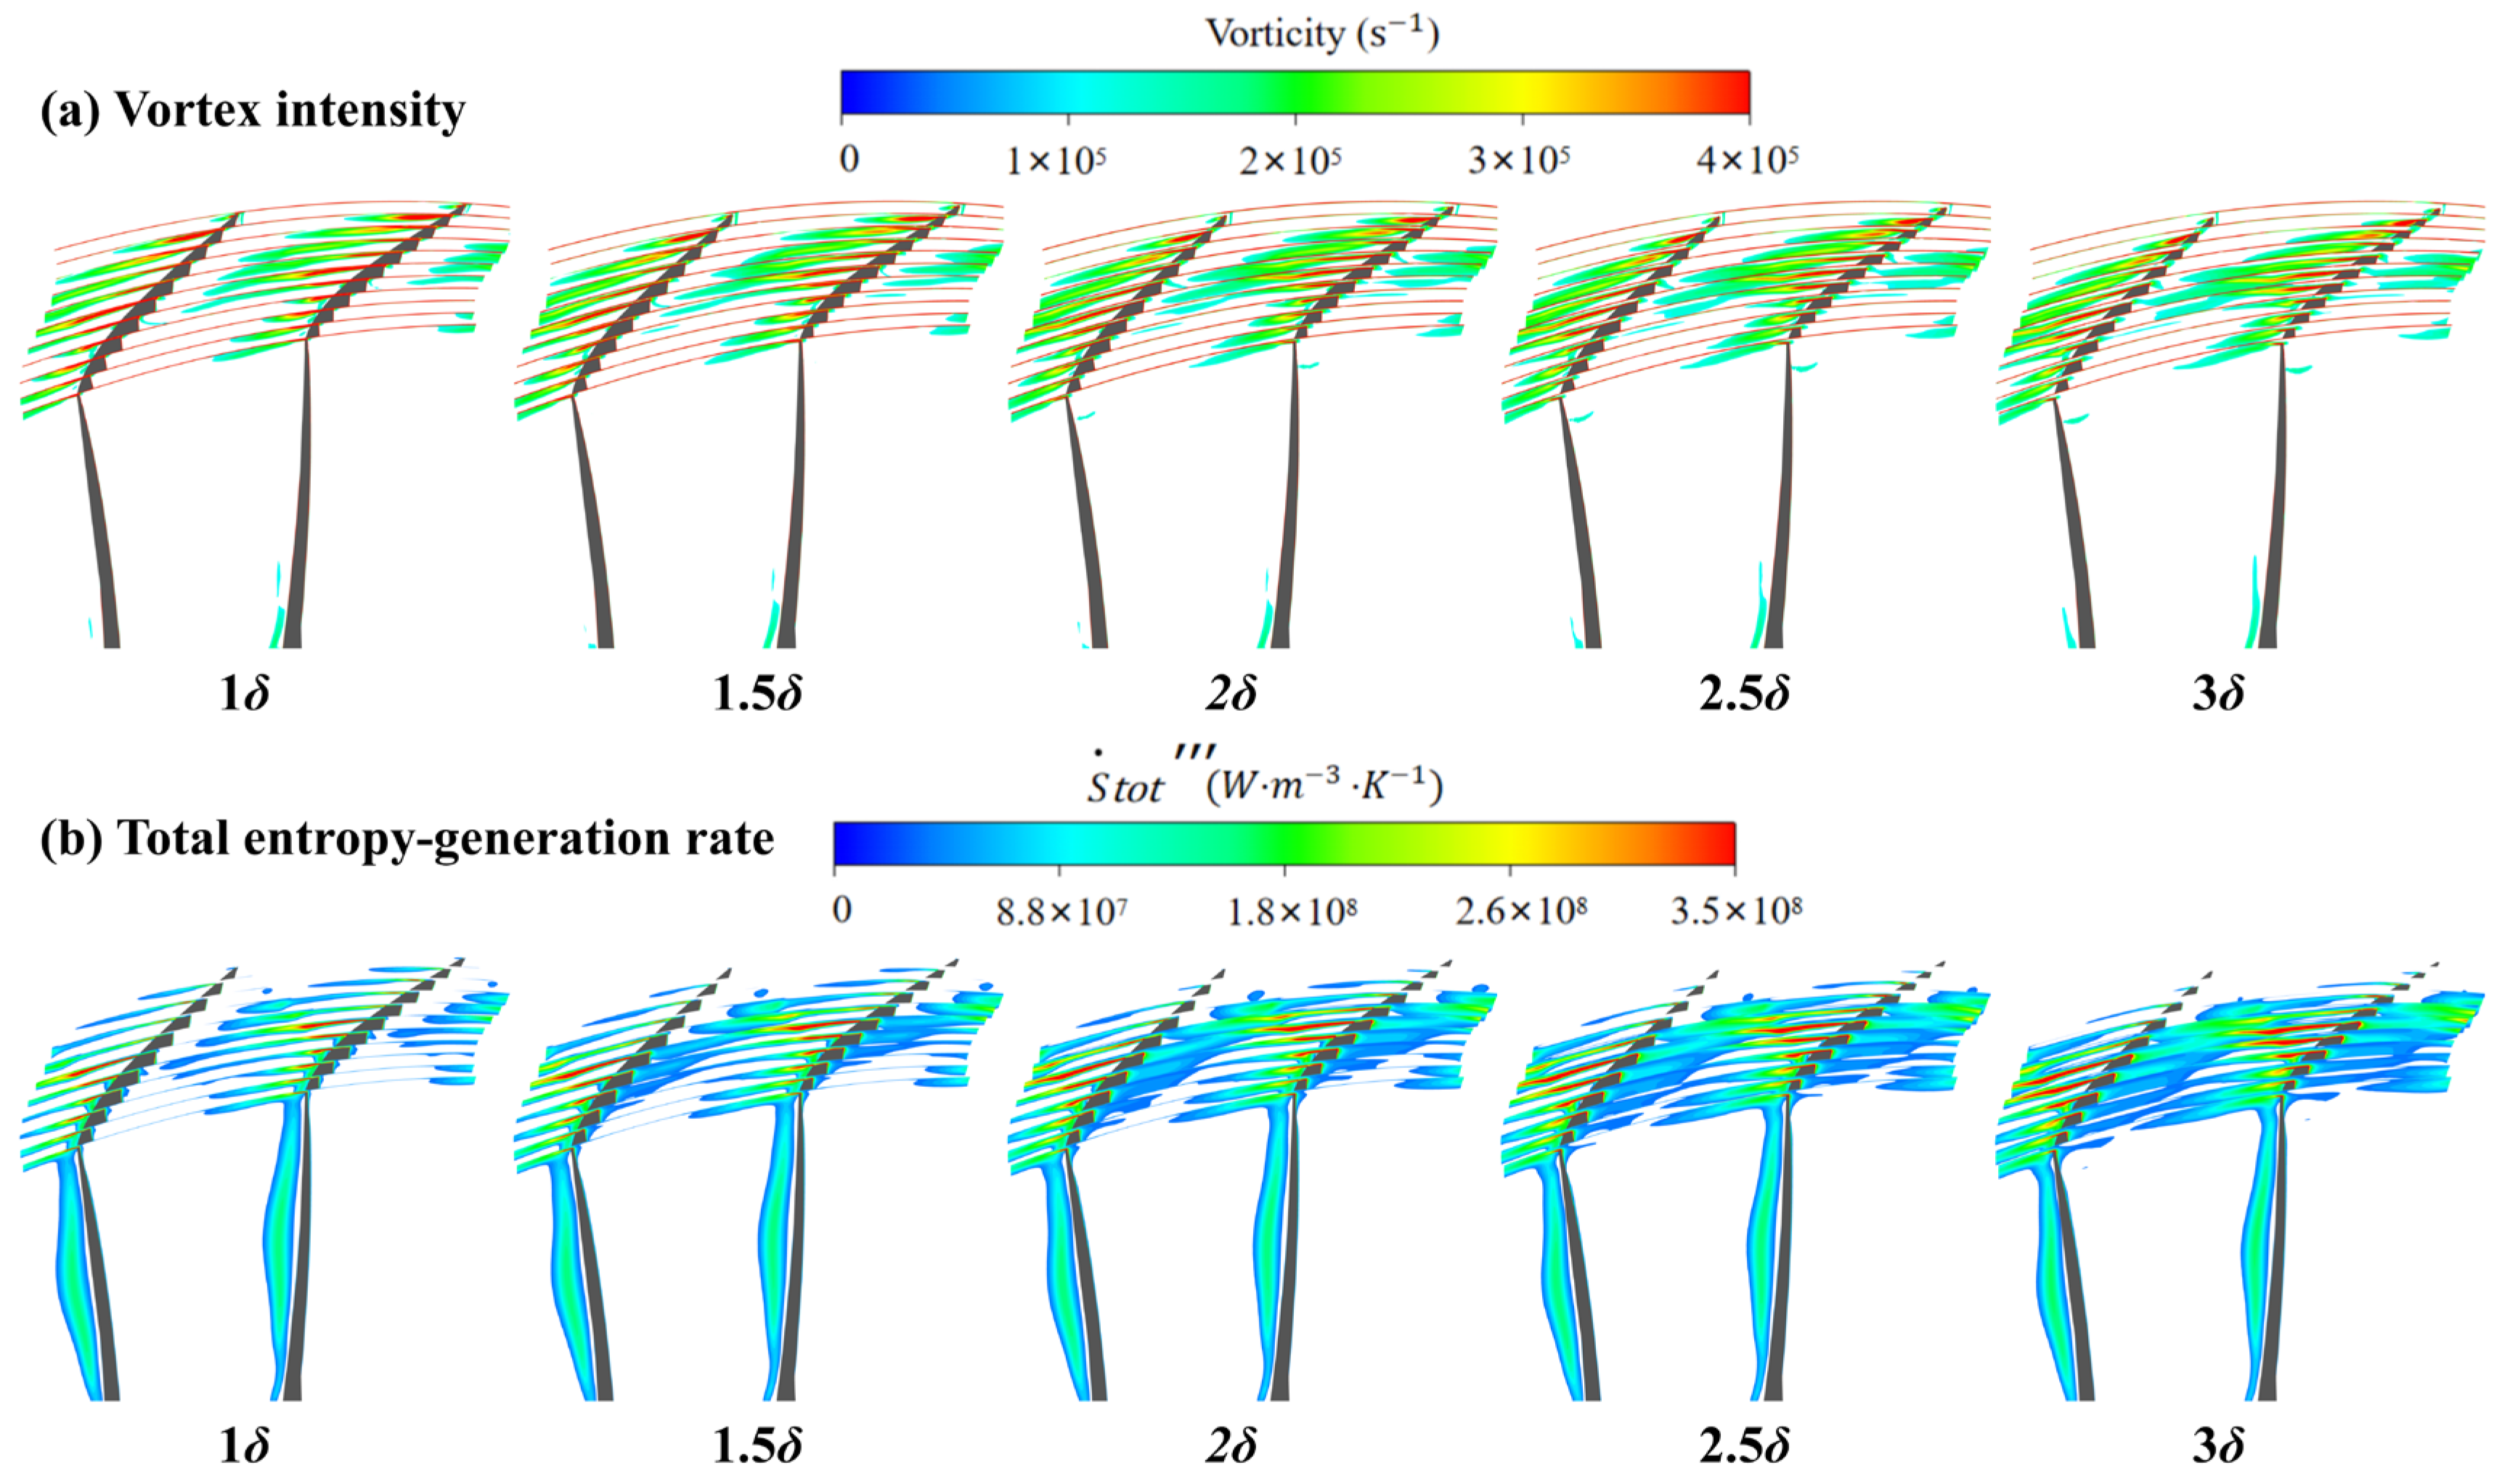
Figure 18: Chordwise distributions of vortex intensity and entropy generation rate in the tip region at peak efficiency under different tip clearances: (a) vortex intensity; (b) total entropy-generation rate.
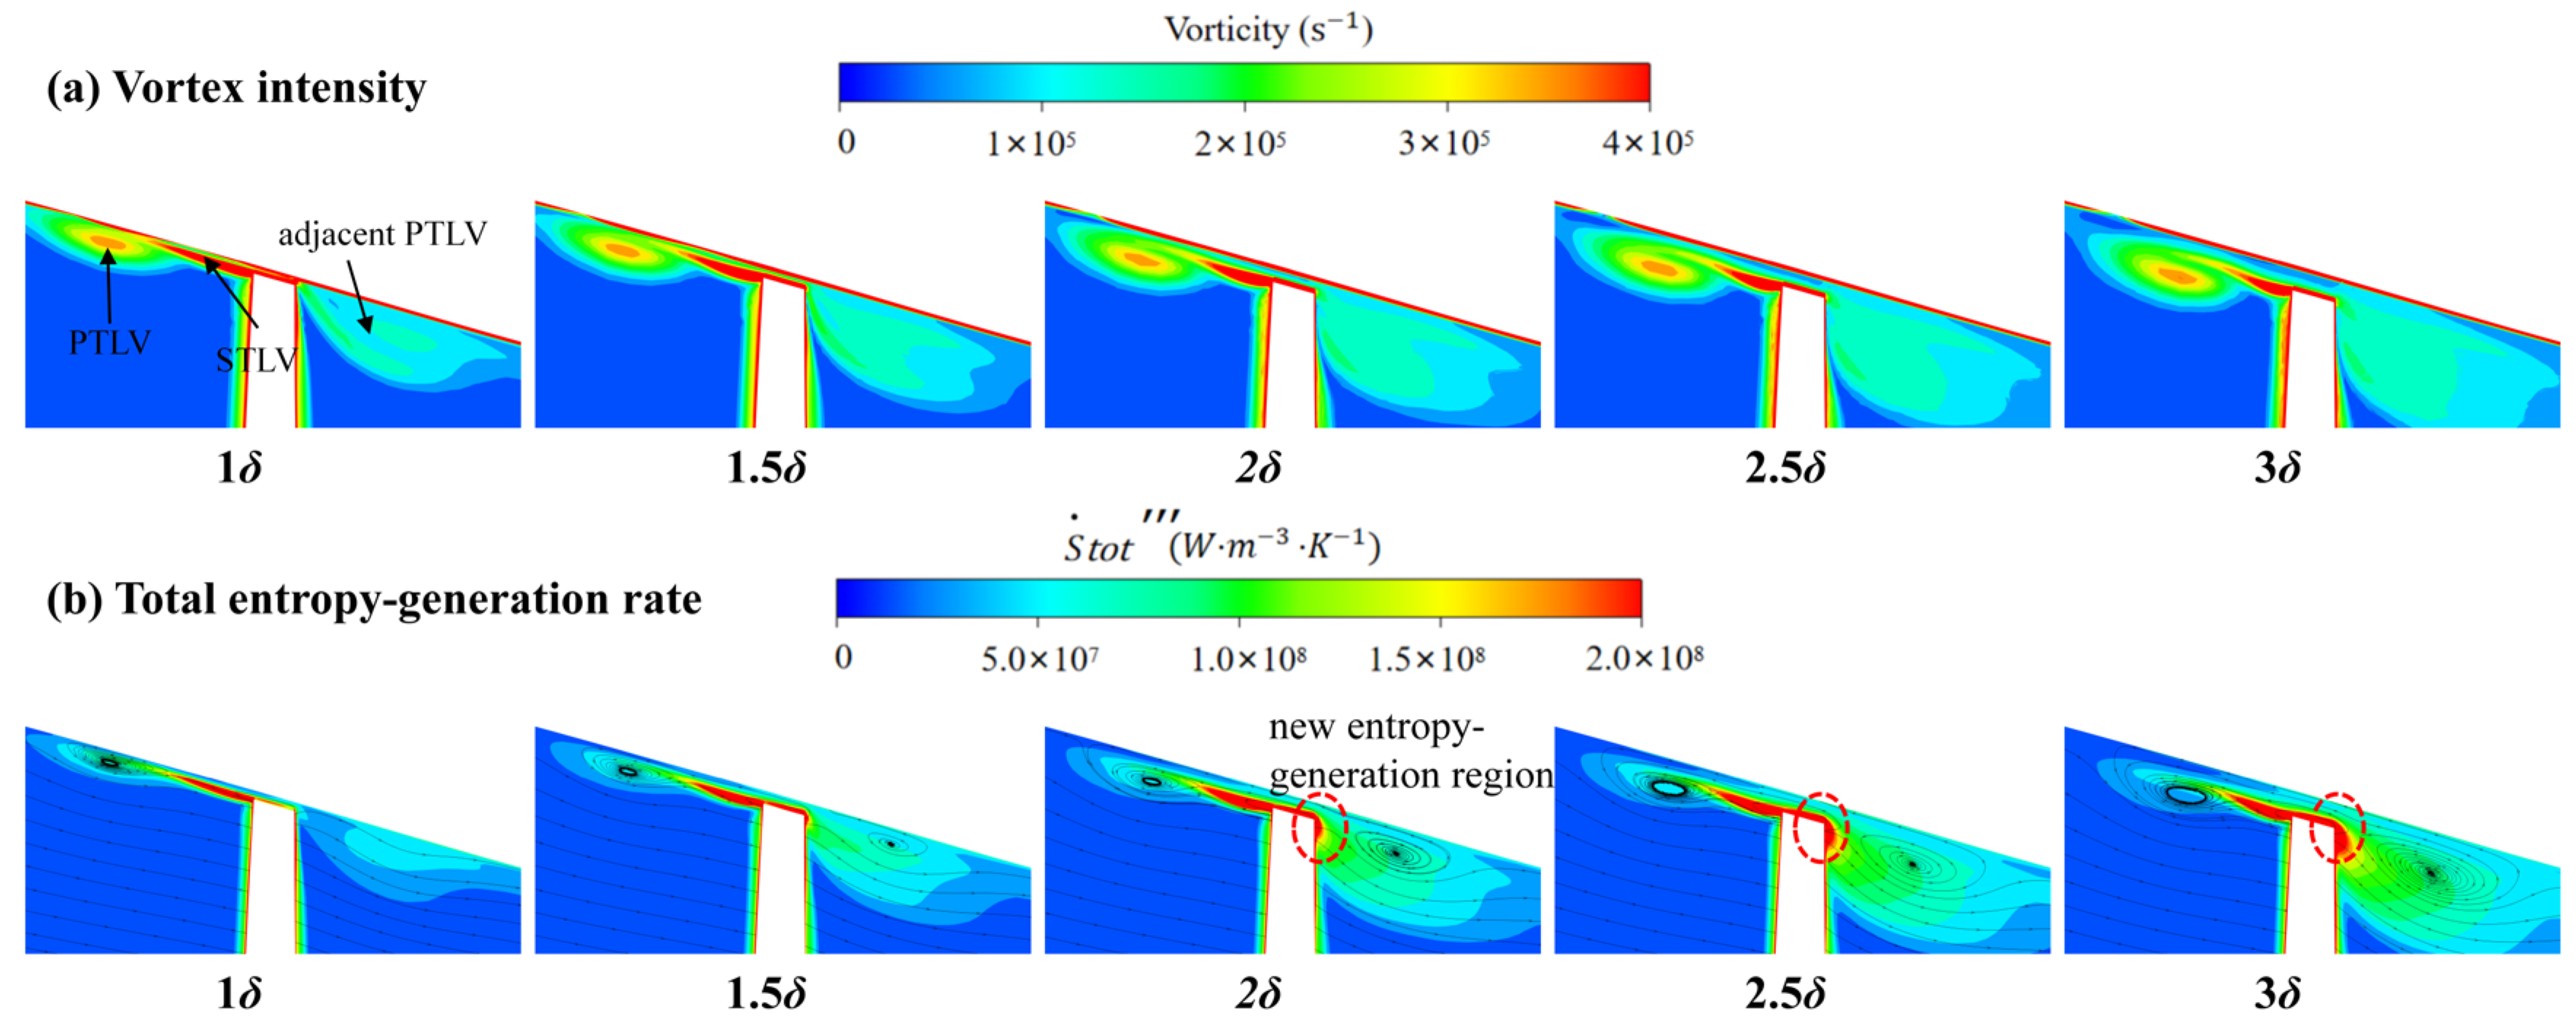
Figure 19: Comparison of vorticity and entropy generation distributions in Sm cross-sections at different blade tip clearances: (a) vortex intensity; (b) total entropy-generation rate.
Fig. 20 presents the paired distributions of total entropy generation rate and vortex intensity at the 98% span section under different blade tip clearances. At 1.0δ, the major high-entropy-generation region is mainly concentrated in the PTLV–STLV interaction zone, which corresponds well to the local high-vorticity region in the paired vortex-intensity field. In contrast, although the PTLV core near the leading edge exhibits relatively high vorticity, it does not coincide with the strongest entropy-generation region, indicating that strong rotational motion alone does not necessarily correspond to severe irreversible losses.
When the clearance increases to 2.0δ, the PTLV–STLV interaction zone becomes more extended, and the STLV band expands more clearly in the vortex-intensity field. Correspondingly, the high-entropy-generation region in the total-entropy-generation field also enlarges and remains mainly distributed within the interaction zone. This result indicates that the STLV development is highly sensitive to the increase in blade tip clearance and plays an increasingly important role in intensifying local thermodynamic irreversibility.
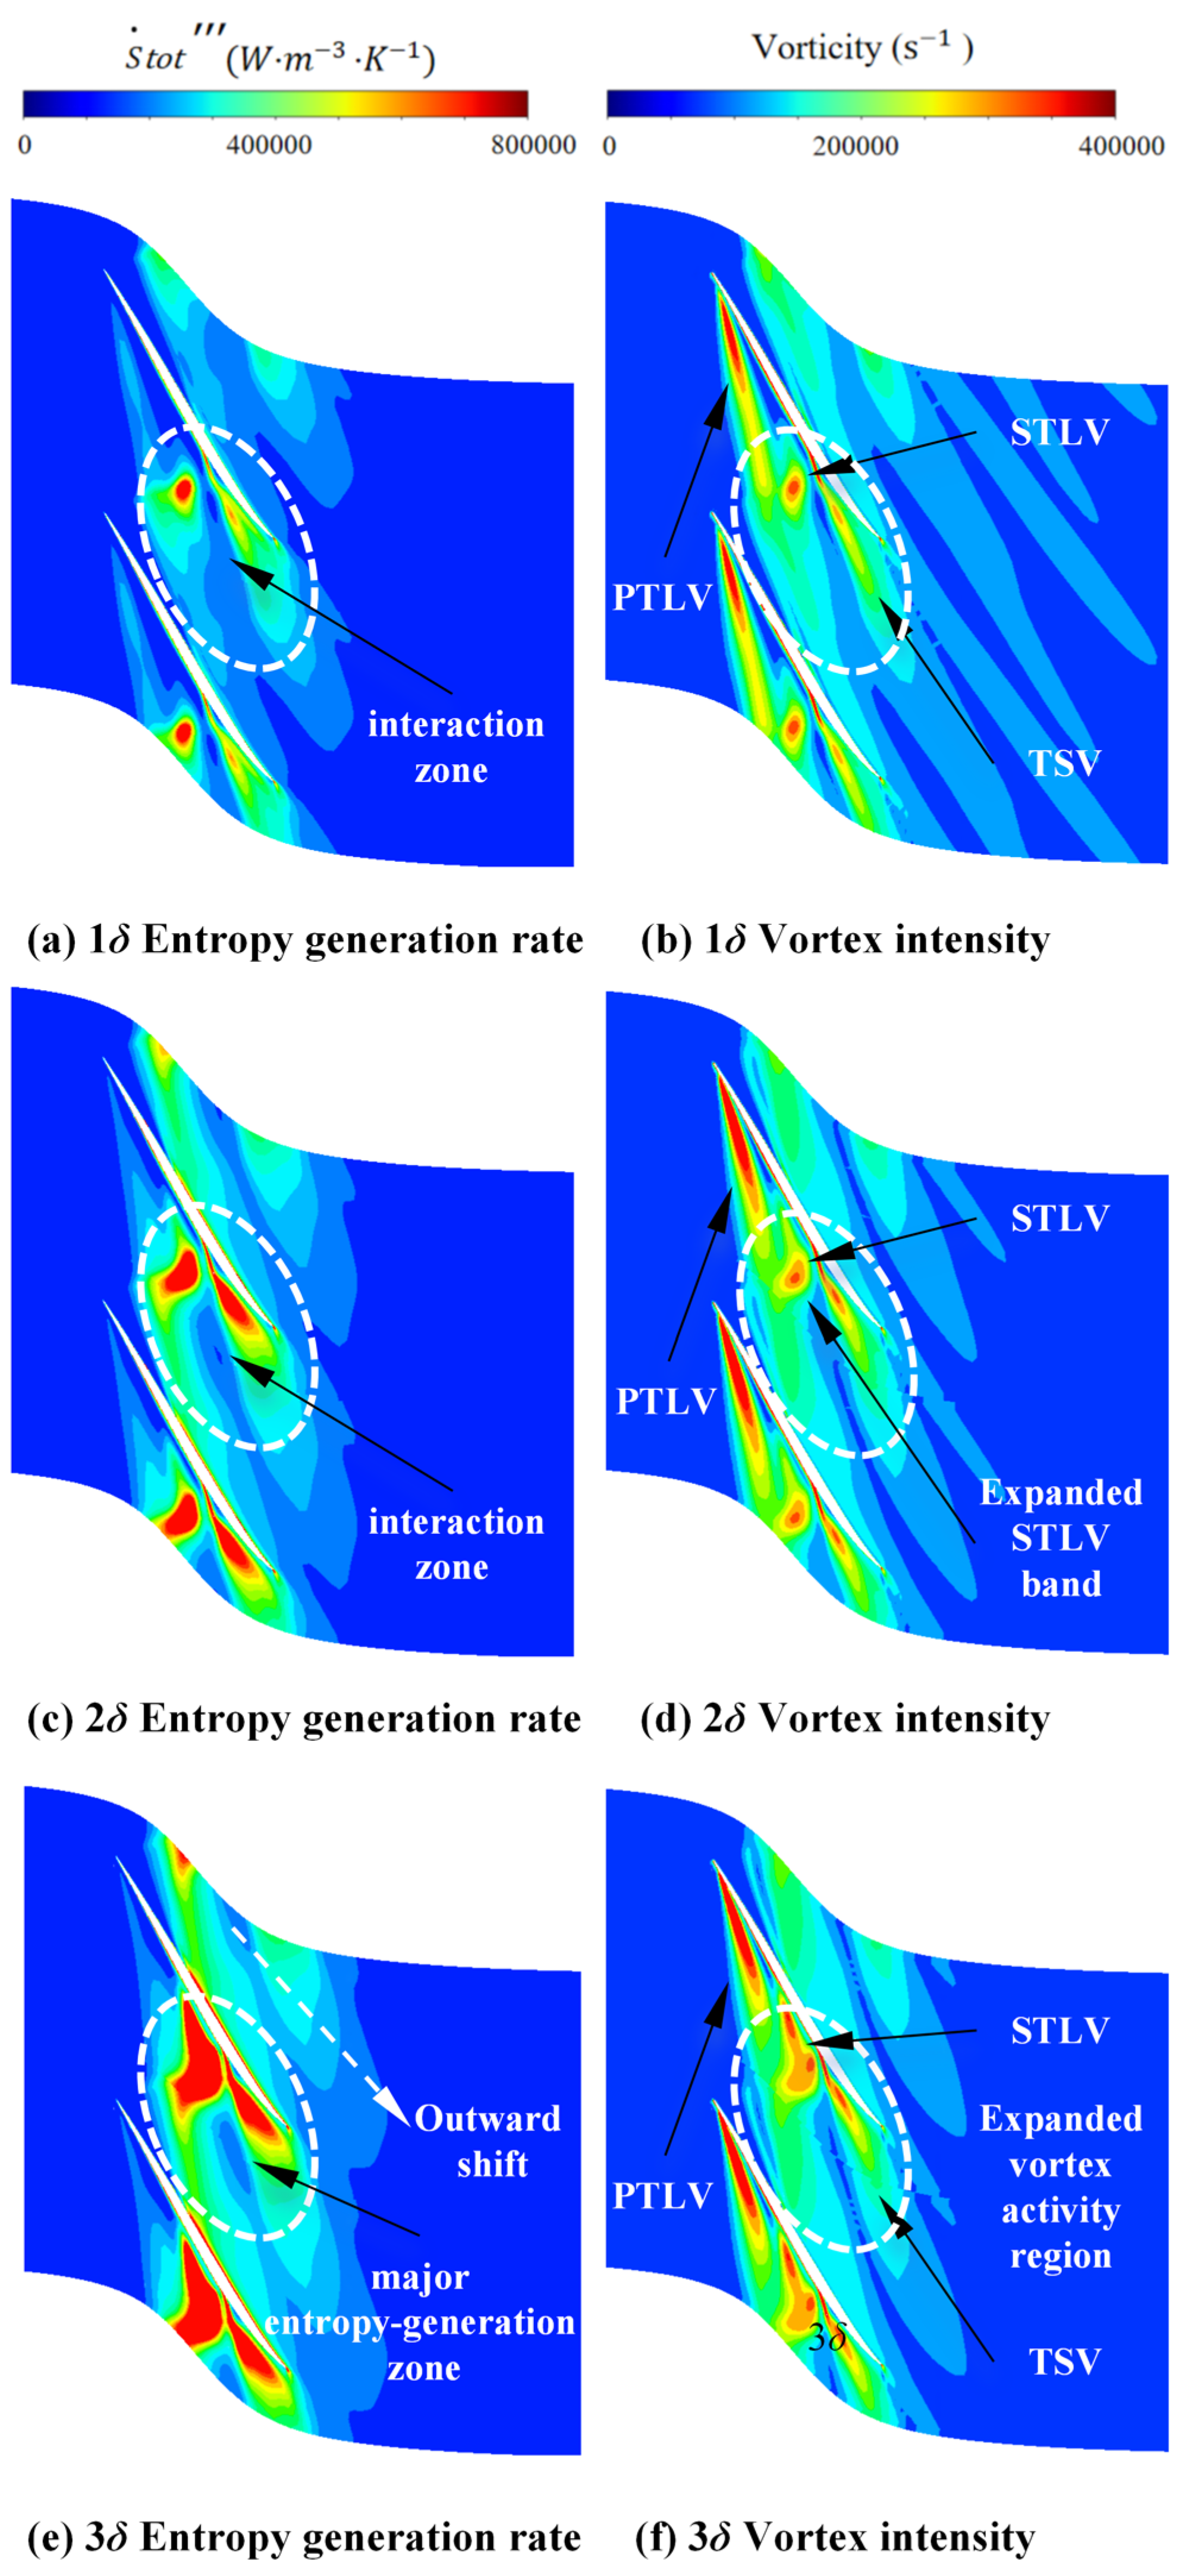
Figure 20: Comparison of vorticity and total entropy-generation rate distributions at the 98% blade span section.
At 3.0δ, the major high-entropy-generation zone occupies a substantially larger portion of the passage. In the corresponding vortex-intensity field, the main vortex-activity region is also enlarged, with the PTLV, STLV, and TSV exhibiting more spatially extended structures. These paired distributions demonstrate that increasing blade tip clearance simultaneously broadens the main vortex-activity region and the associated high-entropy-generation zone.
The radial distribution of the circumferentially averaged total entropy-generation rate is shown in Fig. 21a. The overall distribution exhibits a distinct three-region distribution pattern: in the near-hub region, the entropy generation rate is higher due to the effects of hub corner separation and wall friction; the entropy generation rate then decreases rapidly and maintains a low and relatively flat plateau in the middle blade height region, indicating that irreversible thermodynamic losses in the mainstream core region remains relatively weak; as the near-tip region is reached, the entropy generation rate increases sharply, with a peak near the blade tip, primarily caused by strong shear mixing between the tip leakage vortex and the mainstream. Comparing different clearances, the curves for H/Hspan ≤ 0.9 almost overlap, indicating that the loss mechanism in this range is insensitive to clearance changes. However, in the blade tip influence zone where H/Hspan > 0.9, the clearance effect is very significant: as the clearance increases from 1.0δ to 3.0δ, the starting position of the high-entropy generation region moves inward from H/Hspan ≈ 0.94 to H/Hspan ≈ 0.90, and the peak position shifts from H/Hspan ≈ 0.990 to H/Hspan ≈ 0.984. Meanwhile, the peak entropy-generation rate increases significantly, from approximately 3.97 × 10⁵ to 9.92 × 10⁵ W·m−3·K−1. This indicates that as the clearance increases, the influence range of the leakage effect extends deeper into the passage, and local entropy generation is significantly enhanced.
Fig. 21b shows the radial distribution of the circumferentially averaged vortex intensity |ω| for the corresponding conditions. Its overall shape is similar to that in Fig. 21a, exhibiting a “high at both ends, low in the middle” characteristic. As the blade tip clearance increases, the near-tip vorticity peak shifts inward and increases markedly, consistent with the inward extension and intensification of the high-entropy-generation region. This correspondence indicates that the development and spatial expansion of the leakage-vortex system are closely associated with the increase in near-tip entropy generation. However, the irreversible loss is more directly related to the intensified shear and mixing associated with these vortex structures than to vorticity magnitude alone. The high values near the hub are primarily governed by hub-corner separation and are only weakly affected by tip-clearance variation.
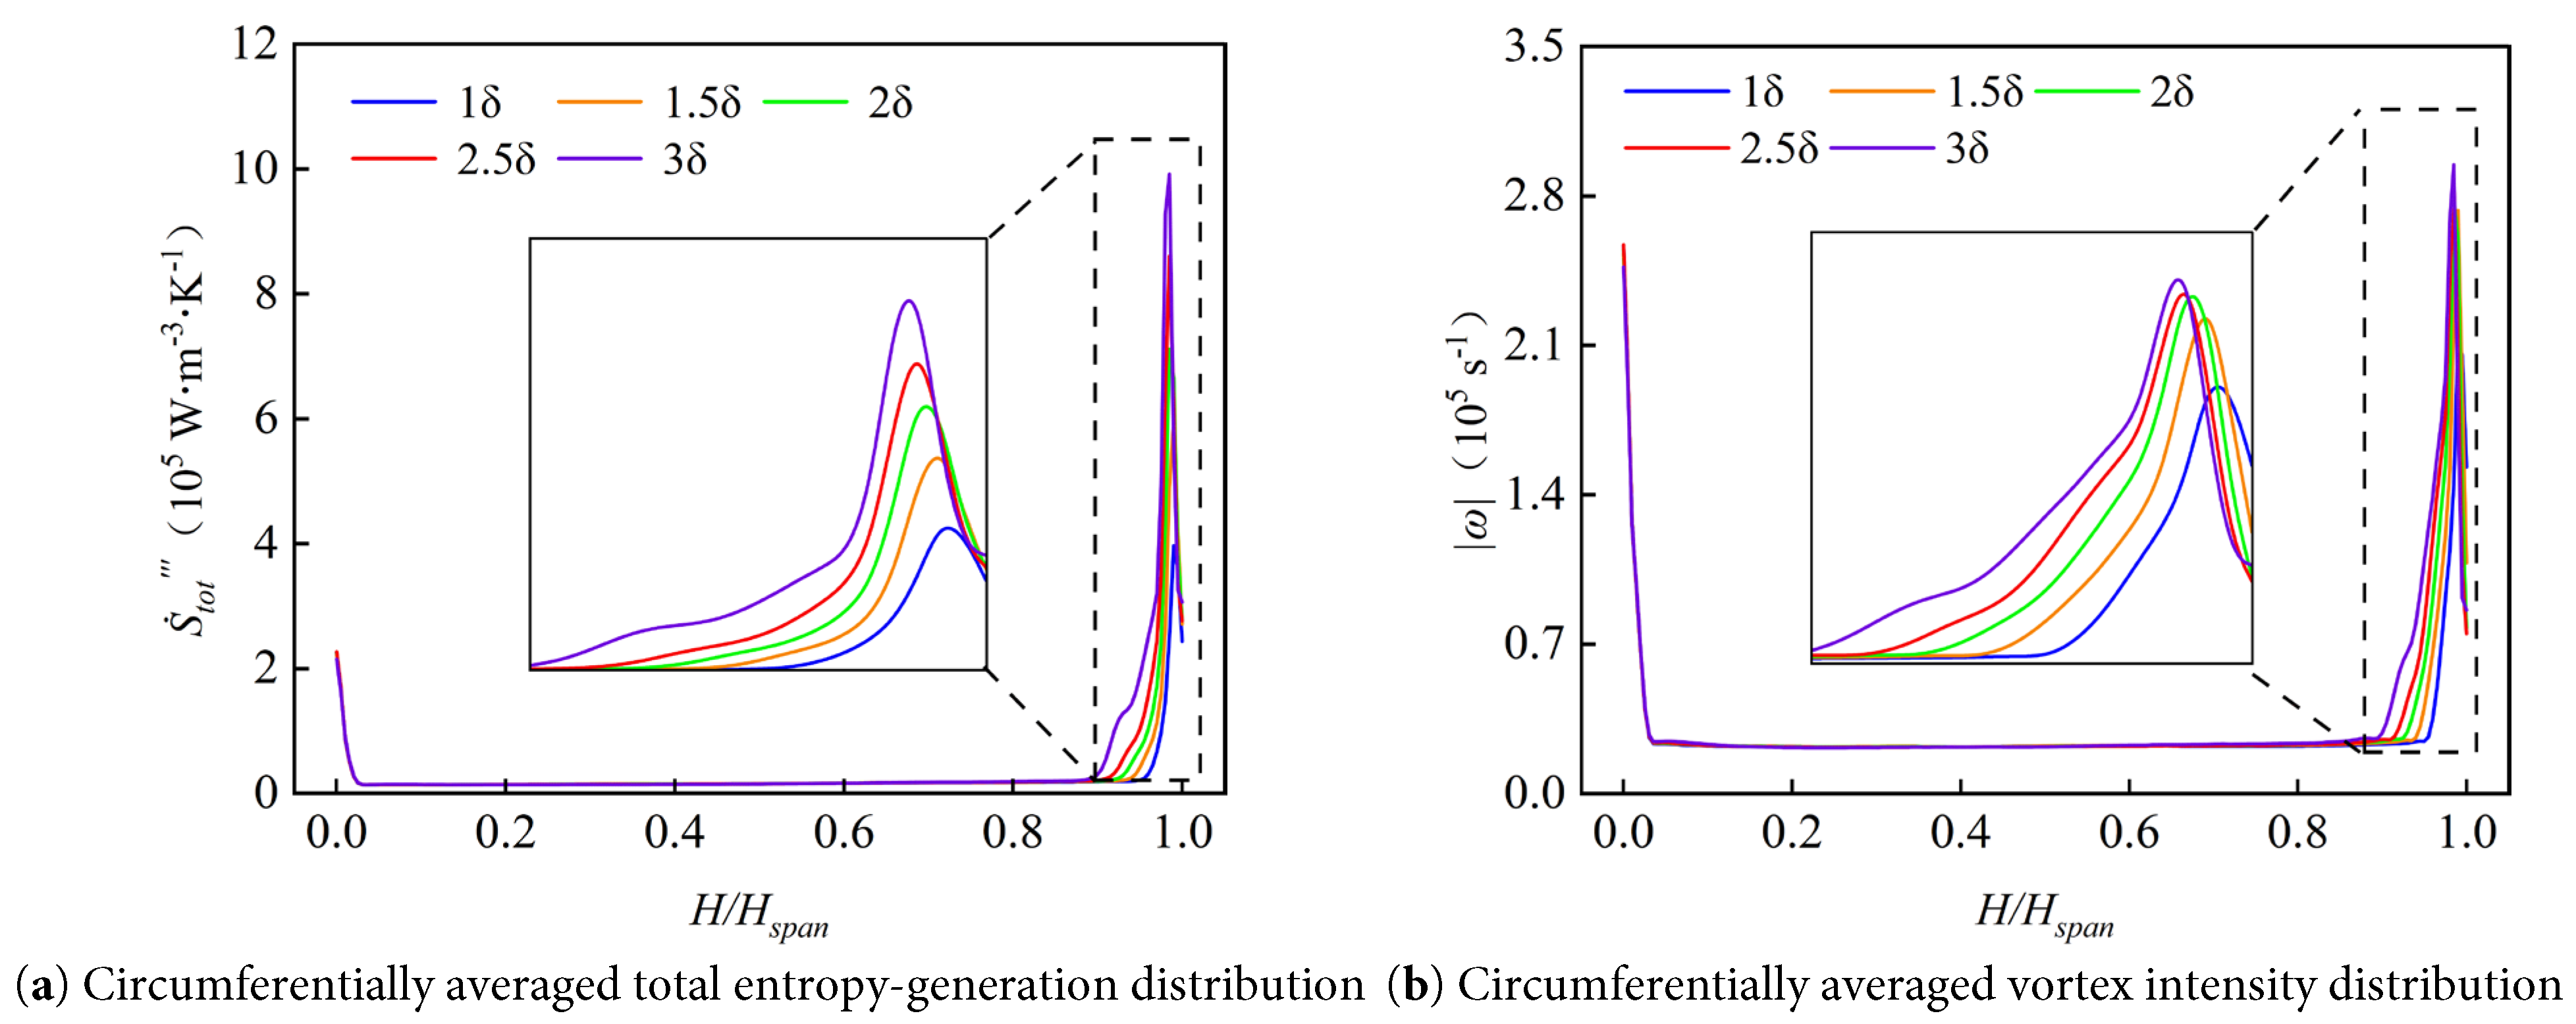
Figure 21: Radial distribution of circumferentially averaged total entropy generation rate and vortex intensity in the passage at different tip clearances.
This study systematically investigates the effects of blade tip clearance on the performance and energy loss of transonic compressors using a two-way fluid–structure interaction numerical model and entropy generation analysis. The following conclusions are drawn:
- (1)At the respective peak-efficiency operating points, as the nominal tip clearance increases from 1.0δ to 3.0δ, the chordwise-averaged radial displacement remains nearly unchanged, varying only from 0.0725 mm to 0.0713 mm, whereas the chordwise-averaged effective tip clearance increases from 0.2835 mm to 0.9967 mm. Over the same clearance range, both the compressor total pressure ratio and isentropic efficiency decrease significantly, and the range of numerically converged steady-state solutions narrows considerably. Under the 3.0δ condition, this numerically converged steady-state solution range is reduced by approximately 66.7% compared with that at the design clearance. These results indicate that the performance deterioration is mainly associated with the increased leakage passage caused by enlarged tip clearance, while the influence of blade structural deformation on effective clearance variation remains relatively limited.
- (2)At the respective peak-efficiency operating points, the tip leakage rate increases from 0.895% to 2.89%, corresponding to an increase of approximately 223%. As the leakage flow intensifies, the PTLV expands significantly, the STLV-related high-loss region extends downstream, and the interaction between leakage-vortex structures becomes stronger, thereby contributing to the amplification of aerodynamic loss in the tip region and the deterioration of overall performance. Furthermore, the Q-criterion-identified vortex volume increases from 4.83 × 10⁻⁷ m3 at 1.0δ to 1.15 × 10⁻⁶ m3 at 3.0δ, indicating that the expansion of the leakage-vortex system is accompanied by increased aerodynamic degradation.
- (3)Entropy-generation analysis shows that turbulence-related entropy generation is the dominant modeled contributor, accounting for more than 98% of the calculated total entropy generation under the investigated conditions. As the blade tip clearance increases, the high-entropy-generation region expands, and the contribution of the tip region to the total entropy generation rises from 18.5% to 33.2%. The enlargement of the high-loss region is closely associated with the evolution of the leakage-vortex system, especially the enhanced shear interaction between the tip leakage vortex and the mainstream, which enhances thermodynamic irreversibility and is associated with the deterioration of overall compressor performance.
The present study is conducted using steady two-way fluid–structure interaction simulations under the design rotational speed condition. The effects of casing deformation and thermal expansion are not considered, which may influence the actual tip-clearance variation under more complex operating environments. In addition, although the SST k−ω model provides reliable predictions for transonic compressor flows, the steady RANS framework may not fully capture transient tip-leakage vortex evolution and stall precursors. Moreover, the entropy-generation evaluation is subject to uncertainties associated with the turbulence modeling approach. Future studies will consider thermo-mechanical coupling, casing deformation effects, and unsteady scale-resolving simulations to further investigate tip-loss mechanisms in transonic compressors.
Acknowledgement:
Funding Statement: This work was supported by the Key Research Program of the Department of Science and Technology of Shaanxi Province (2024NC-YBXM-203), the Natural Science Basic Research Program of Shaanxi Province (2022JQ-131), the Key Research and Development Program of Shaanxi Province (2025CY-JJQ-96), and the Natural Science Basic Research Program of Shaanxi Province (2026JC-YBMS-0564).
Author Contributions: Yongjie Wang conducted the numerical simulations, analyzed the data, and wrote the original draft. Junli Wang supervised the research, reviewed and edited the manuscript, and served as the corresponding author. Zhigui Ren contributed to the methodology and validation. Wenshuai Liu participated in data analysis. Wei Kong contributed to the investigation and visualization. Chenxing Niu assisted with software and validation. Chang Yang contributed to resources and supervision. All authors reviewed and approved the final version of the manuscript.
Availability of Data and Materials: The data that support the findings of this study are available from the corresponding author upon reasonable request.
Ethics Approval: Not applicable.
Conflicts of Interest: The authors declare no conflicts of interest.
References
1. San Andrés L . A review of turbine and compressor aerodynamic forces in turbomachinery. Lubricants. 2023; 11( 1): 26. doi:10.3390/lubricants11010026. [Google Scholar] [CrossRef]
2. Kurzke J , Riegler C . A new compressor map scaling procedure for preliminary conceptional design of gas turbines. In: Proceedings of the ASME Turbo Expo 2000: Power for Land, Sea, and Air; 2000 May 8–11; Munich, Germany. doi:10.1115/2000-gt-0006. [Google Scholar] [CrossRef]
3. Sinha SK . Rotordynamic analysis of asymmetric turbofan rotor due to fan blade-loss event with contact-impact rub loads. J Sound Vibr. 2013; 332( 9): 2253– 83. doi:10.1016/j.jsv.2012.11.033. [Google Scholar] [CrossRef]
4. Lattime SB , Steinetz BM . High-pressure-turbine clearance control systems: Current practices and future directions. J Propuls Power. 2004; 20( 2): 302– 11. doi:10.2514/1.9255. [Google Scholar] [CrossRef]
5. An G , Wu Y , Spence S , Lang J , Chen Z , Larimi YM . Numerical investigation into the mechanism regarding the inception and evolution of flow unsteadiness induced by the tip leakage flow in a transonic compressor. Proc Inst Mech Eng Part A J Power Energy. 2021; 235( 1): 44– 58. doi:10.1177/0957650920910597. [Google Scholar] [CrossRef]
6. Wu Y , An G , Wang B . Numerical investigation into the underlying mechanism connecting the Vortex breakdown to the flow unsteadiness in a transonic compressor rotor. Aerosp Sci Technol. 2019; 86: 106– 18. doi:10.1016/j.ast.2018.12.040. [Google Scholar] [CrossRef]
7. Smith LH Jr . The effect of tip clearance on the peak pressure rise of axial-flow fans and compressors. In: Proceedings of the ASME Symposium on Stall; 1958 Dec 4–5; New York, NY, USA. p. 149– 52. [Google Scholar]
8. Sakulkaew S , Tan CS , Donahoo E , Cornelius C , Montgomery M . Compressor efficiency variation with rotor tip gap from vanishing to large clearance. J Turbomach. 2013; 135( 3): 031030. doi:10.1115/1.4007547. [Google Scholar] [CrossRef]
9. McNulty GS , Decker JJ , Beacher BF , Khalid SA . The impact of forward swept rotors on tip clearance flows in subsonic axial compressors. J Turbomach. 2004; 126( 4): 445– 54. doi:10.1115/1.1773852. [Google Scholar] [CrossRef]
10. Bae JW , Breuer KS , Tan CS . Active control of tip clearance flow in axial compressors. J Turbomach. 2005; 127( 2): 352– 62. doi:10.1115/1.1776584. [Google Scholar] [CrossRef]
11. Suder KL , Celestina ML . Experimental and computational investigation of the tip clearance flow in a transonic axial compressor rotor. J Turbomach. 1996; 118( 2): 218– 29. doi:10.1115/1.2836629. [Google Scholar] [CrossRef]
12. Liu Z , Wang J , Cao P , Wang K . Study of the effect of clearance variation on the blade tip flow field near stall condition of axial compressors. J Eng Therm Energy Power. 2024; 39( 1): 68– 78. (In Chinese). [Google Scholar]
13. Biollo R , Benini E . Shock/boundary-layer/tip-clearance interaction in a transonic rotor blade. J Propuls Power. 2009; 25( 3): 668– 77. doi:10.2514/1.39541. [Google Scholar] [CrossRef]
14. Gong R , Wang H , Chen L , Li D , Zhang H , Wei X . Application of entropy production theory to hydro-turbine hydraulic analysis. Sci China Technol Sci. 2013; 56( 7): 1636– 43. doi:10.1007/s11431-013-5229-y. [Google Scholar] [CrossRef]
15. He X , Fang Z , Rigas G , Vahdati M . Spectral proper orthogonal decomposition of compressor tip leakage flow. Phys Fluids. 2021; 33( 10): 105105. doi:10.1063/5.0065929. [Google Scholar] [CrossRef]
16. Prasetyo A , Rovianto E , Adika D , Maulana R , Septiyanto MD , Budiana EP , et al. The effect of additional baffle plates on double-stage gravitational water Vortex turbine. Civ Eng J. 2025; 11( 2): 580– 95. doi:10.28991/cej-2025-011-02-011. [Google Scholar] [CrossRef]
17. Zhang X , Tang F . Energy loss evaluation of axial flow pump systems in reverse power generation operations based on entropy production theory. Sci Rep. 2022; 12( 1): 8667. doi:10.1038/s41598-022-12667-7. [Google Scholar] [CrossRef]
18. Li Z , Sun Y , Gong W , Ni D , Gao B . Analysis of energy loss characteristics in an axial-flow reactor coolant pump based on entropy production theory. Energies. 2024; 17( 14): 3399. doi:10.3390/en17143399. [Google Scholar] [CrossRef]
19. Li J , Luo J , Liu Y , Han Z . Static aeroelasticity analysis of a rotor blade using a Gauss-Seidel fluid-structure interaction method. Adv Aerodyn. 2023; 5( 1): 23. doi:10.1186/s42774-023-00155-z. [Google Scholar] [CrossRef]
20. Liu JN , Wang D , Huang X . Investigation of turbulence models for aerodynamic analysis of a high-pressure-ratio centrifugal compressor. Phys Fluids. 2023; 35( 10): 106108. doi:10.1063/5.0169214. [Google Scholar] [CrossRef]
21. Gibson L , Galloway L , Kim SI , Spence S . Assessment of turbulence model predictions for a centrifugal compressor simulation. J Glob Power Propuls Soc. 2017; 1: 142– 56. doi:10.22261/2ii890. [Google Scholar] [CrossRef]
22. Seshadri P , Parks GT , Shahpar S . Leakage uncertainties in compressors: The case of rotor 37. J Propuls Power. 2015; 31( 1): 456– 66. doi:10.2514/1.b35039. [Google Scholar] [CrossRef]
23. Kock F , Herwig H . Local entropy production in turbulent shear flows: A high-Reynolds number model with wall functions. Int J Heat Mass Transf. 2004; 47( 10–11): 2205– 15. doi:10.1016/j.ijheatmasstransfer.2003.11.025. [Google Scholar] [CrossRef]
24. Reid L , Moore RD . Design and overall performance of four highly loaded, high speed inlet stages for an advanced high-pressure-ratio core compressor. Cleveland, OH, USA: NASA Lewis Research Center; 1978. NASA Technical Paper 1337. [Google Scholar]
25. Lang JH , Chu WL , An GY , Zhang HG . Mechanism of stall development in a transonic axial compressor. J Aerosp Power. 2018; 33( 8): 1964– 73. (In Chinese). doi:10.13224/j.cnki.jasp.2018.08.020. [Google Scholar] [CrossRef]
Cite This Article
 Copyright © 2026 The Author(s). Published by Tech Science Press.
This work is licensed under a Creative Commons Attribution 4.0 International License , which permits unrestricted use, distribution, and reproduction in any medium, provided the original work is properly cited.
 Downloads
 Citation Tools
