
 Submit a Paper
 Propose a Special lssue
 Open Access
ARTICLE
Comparison and Analysis of Heat Transfer and Inflow Rate for Supercritical Carbon Dioxide Based on Different Tubes
Electromechanical Engineering Department, University of Technology, Baghdad, Iraq
* Corresponding Author: Ameer Abed Jaddoa. Email:
Frontiers in Heat and Mass Transfer 2023, 21, 443-465. https://doi.org/10.32604/fhmt.2023.042288
Received 25 May 2023; Accepted 17 July 2023; Issue published 30 November 2023
 View Full Text
 Download PDF
Abstract
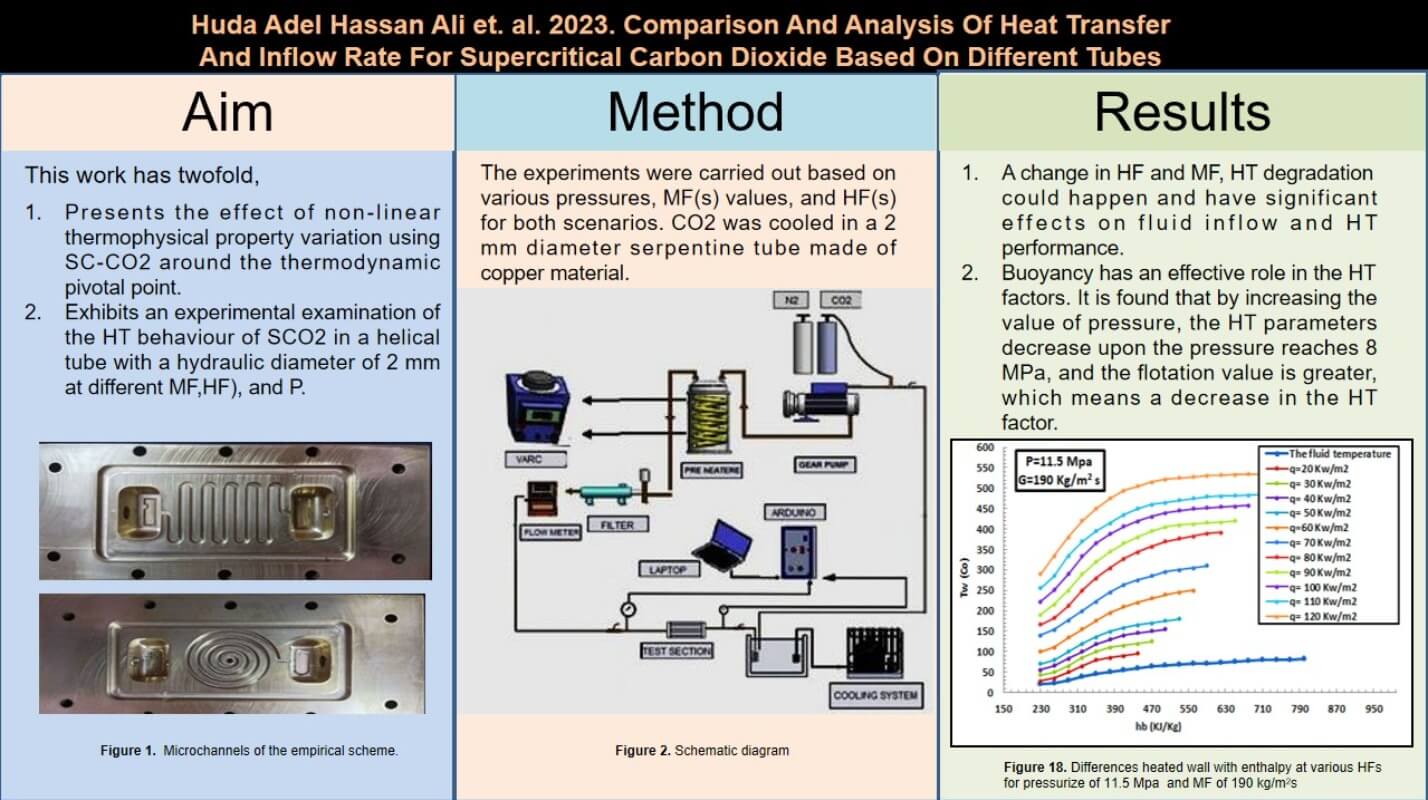
This paper is twofold. First, the effect of non-linear thermophysical property variation was presented using supercritical carbon dioxide (SCO2) around the thermodynamic pivotal point. The second part exhibits an experimental examination of the heat transfer (HT) behaviour of SCO2 in a helical tube with a hydraulic diameter of 2 mm at different mass fluxes (MF), heat fluxes (HF), and pressures (P). The experiments were carried out based on various pressures, mass fluxes, and heat fluxes for both scenarios. CO2 was cooled in a 2 mm diameter serpentine tube made of copper material. The experimental results showed that HT degradation could happen under the circumstances of a change in HF and MF and have significant effects on fluid inflow and HT performance. Also, buoyancy plays an essential and influential role in the HT factors. By increasing the pressure value, the HT parameters decrease when the pressure reaches 8 MPa, and the flotation value is more significant, which means a decrease in the HT factor. Finally, under the system circumstances, the HT value decreases with the increase in heat flux and pressure and increases with the increment in MF.Graphic Abstract
Keywords
Liquid cooling in small electrical and electronic equipment has become a significant issue in modernization and scientific growth. Electronic circuit heat must escape the device. These devices need many cooling systems to work correctly. Recent interest in heat sink cooling systems has grown. Single-phase forced convection can chill a highly supercooled heat sink using many methods. These applications include industrializing electronic devices, magnet high-voltage systems, pressurized nuclear fission systems, spaceships, and thermal administration systems. The area around the critical area had better temperature movement, with the most significant characteristics at the same pseudo-critical temperature. Under cooling circumstances, an experimental analysis of supercritical carbon dioxide flow and heat transfer in multichannel microports led to this improvement [1,2]. The literature has focused mainly on the temperature movement of liquids near supercritical conditions [3–5]. A supercritical fluid is kept at just over its stringent level of temperature and pressure, known as a critical point. Over (304.25 K) and (72.9 atm or 7.39 MPa) for temperature and pressure, respectively, at the critical level, CO2 acts as a supercritical liquid, expanding to fill its vessel like a gas in the form of density liquid. Besides that, in the case of heating the fluids up to 304.25 K and compressing thereafter just over 7.39 MPa, then it transfers to the supercritical phase. Under these conditions, it can dramatically modify its characteristics, for instance, solvent power. In the following paragraphs, an overview of supercritical CO2 applications is introduced. At Qv = 30 ml/s, the pressure drop can be decreased by up to 73%, the average Nusselt number can be increased by up to 17%, and the minimum temperature difference is 17 K. In conclusion, the error calculation demonstrates that the results of multi-objective optimization are in reasonable agreement with simulation results [6–8]. To obtain supercritical states, supercritical carbon dioxide SCCO2 provides a suitable feature of pressure compound with temperature. For most SCCO2-phobic materials, SCCO2 might not be the best solvent. Yet, both silicon and fluorine products are CO2-philic and thus likely further soluble. It is well known that magnetic media are made from such products. These products are applied in the manufacture of magnetic media, and it deemed to belong to the earliest utilization of SCCO2 investigated. Aligned channels, perpendicular channels, packed bed channels, annulus, tube-in-tube, standard circulation tubes, micro-porous media, and another structure were tested. Until separation, bubble behavior and heat transmission were examined. The numerical simulations confirmed the experimental findings that developing bubbles affected the flow streamlines and thermal boundary layer downwind of the bubble-forming site [9–12]. Most recent investigations used large or standard channels. Acosta et al. measured supercritical CO2 inflow in flat mini- or micro-circular tubes chilled by a steady liquid [13]. Their results differed greatly from earlier study. In regular channels with large tube sizes, buoyancy caused this. Experiments for the axially averaged Nusselt number were provided [14–16].
Channel diameter, viscosity, flow rate, and ratio affect flow pattern, pressure drop, film thickness, and heat transfer rate. According to the literature, the interface pressure drop increases pressure loss by 200% compared to single-phase flow. The findings explain how slugs’ recirculating zones affect the film region and backflow. Segmented water slugs boost heat transfer as the dimensionless thermal length decreases. For the first time, recirculating zones and heat transport are strongly linked [17], allowing extensive analyses. We examined current empirical methods for limited convective temperature movement. Dittus-Boelter-type correlations can be used in the near-critical zone to anticipate turbulent, little convective temperature movement. For considerable physical characteristic fluctuations, the property ratio technique was proposed [18–20]. Jajja et al. [21] predicted supercritical CO2 temperature using a unique correlation based on experimental data and numerical computations. Visualization experiments identify annular, bubble, slug, plug, and jetlike flows after the abrupt expansion. They receive a CFD model. The pressure gradient on the bubble surface is large, and the gas-liquid flow pressure drop is closely related to the flow pattern. A new model for estimating frictional pressure drop includes small channel diameter, viscosity, surface tension, mass velocity, flow pattern, flow regime, and updated parameter C. The new connection also predicts two-phase frictional pressure decrease across a wide mass flow range [22]. In tight, rectangular hydraulic tubes with diameters of 0.96 and 0.38 mm, respectively, they examined the movement of momentum and mass. The authors studied both laminated flux and turbulence scenarios. Due to the similarities between heat and mass transfer, it was determined that correlations with larger tubes were satisfactory and that heat transfer correlations should follow suit. However, it was found that the hydraulic smoothness criteria had to be met for walls constructed of optical materials. Additionally, the surface roughness considerably influenced both the mass movement factor and the friction coefficient. The convective heat transfer of fluids at supercritical pressures was also investigated for mini/microtubes or cooling channels [23–25]. The channel is 120 mm long, 30 mm broad, and 1 mm deep. Measurements and simulations are performed for three mass fluxes (G = 140, 390, and 648 kg/(m2.s)) from the start of boiling until drying out. The major goals of the experiment are to measure heat transport and describe the dry-out process. A 2D inverse heat conduction approach is used to calculate the local heat transfer coefficient. The two-phase flow is simulated using an Eulerian multiphase 2D technique with a Critical Heat Flux (CHF) wall-boiling model. The comparison of the experimental and CFD boiling curves and axial heat transfer coefficient profiles is shown in the last section. The numerical simulation satisfactorily predicted the observed heat transfer coefficients and dry-out occurrences [26]. Ünverdi et al. [27] examined supercritical CO2’s average heat transfer factor in multi-port mini-channels with a 0.79 mm inner diameter under chilling circumstances. Gnielinski’s one-phase temperature movement factor matches experiment findings. Mitra et al. [18] examined supercritical CO2 temperature in standard mini/micro rotating pipes of 0.50, 0.70, 1.1, 1.40, 1.55, and 2.16 mm diameter chilled to a constant temperature. The researchers enhanced the axially-averaged Nusselt number relationship for limited heat transfer of supercritical CO2 in conventional mini/microtubes. Supercritical CO2 restricted heat transmission via ordinary pipes at maximal Reynolds numbers was still affected by buoyancy. When the waterside mass flow rate is 0.175 kg/s and the CO2 side pressure is 7.9 MPa, boosting CO2 mass flux can significantly improve the overall heat transfer coefficient. Inlet water temperature increases the heat transfer coefficient. Vertical gas coolers have more significant heat transfer coefficients. A Matlab program verified Zhang’s correlation’s correctness. The experimental analysis yielded a heat transfer correlation for the new spiral plate mini-channel gas cooler that can be employed for future designs [28]. The researchers examined the effects of mass, pressure, and temperature influx on the axially averaged temperature movement factor and pressure reduction of carbon dioxide at critical compressing based on chilling conditions for conventional chilling pipes with diameters from 1 to 6 mm. They proposed a new Gnielinski formula by selecting the standard heat level. Recent supercritical CO2 research, especially for narrow pipes, focuses on averaged features and a little on local temperature movement and compression loss. Nu = C Rem Prn, and Dittus-Boelter relationships were devised to predict restricted heat transport. The property proportion and standard heat method integrated property effects [29,30]. Due to the complexity of the events, it is generally accepted that the relationships do not accord with trials and should only be employed in specific instances.
This research examines supercritical CO2 heat transfer and flow properties in small tubes under chilling for two local samples and averages them across the test zone. They compared the literature with experimental results. Thus, a link was found. Factors affecting heat transmission and pressure drop behavior were also examined.
This section introduces the experimental system under examination. Fig. 1 shows a realistic view of the entire system. In contrast, the figure exhibits the schematic diagram of the empirical scheme, and figure demonstrates the microchannels and their dimensions based on vertical and side views. A coil is used to heat the cylinder, composed of 99.7% CO2. A compressor is used to compress the ammonia gas. As it is known, ammonia gas condenses upon exposure to high temperatures, and its colour changes to dark blue. Next, the gas moved from a high-pressure to a low-pressure room through a tiny hole to reach a boiling temperature degree until the colour became white-blue; at this point, the ammonia evaporated (−27). Compressing, heating, and cooling processing were recurrent as they positively impacted the cooling system. It should be noted that ethylene glycol gas was adopted as cooling since its features include, for example, remarkable efficiency, affordability, a friendly atmosphere, and a low maintenance requirement. For bi-directional inflow control, a valve was utilized that can work with high-pressure up to 200 bar, operate with temperatures scaling from −10 to 200 degrees Celsius, and have a time response lower than 31 s. Note that all system parts were manufactured from stainless steel to meet high measurement, accuracy, and system efficiency standards. With pressures up to five hundred bars and an accuracy of less than one percent, a pressure gauge of the type PG23HP-P (German industry) was used. Note that all safety requirements regarding system operation and work failure have been applied. Additionally, the MF was measured using a TSI of 5210-7, with 2% accuracy, wherein it can operate to measure the pressure in two ways. In addition, many detectors were instilled into the system, including, but not limited to, temperature and pressure detectors aiming to record actual data measurements. It is interesting to note that the recorded values can be saved and displayed for all variables regarding CO2 in terms of pressure, volume, and inflow rate, which can be watched on the touchable screen. Depending on the Flo-Sight program, the gas inflow rate can be controlled. A sensor of type 35 Lm was also used to record temperature (1/10 volts). An Arduino Uno microcontroller, which operates with 0–5 volts as an input voltage, adjusted the heating process to the temperature variation. Besides that, it used a detector type K for accuracy measurement; the analysis ranges from −200 to 1350°C or from −330 to 2460°F. This detector uses the solid state in its characterisation. The basic principle of its operation is that changes in thermoelectricity lead to changes in temperature degree, where a deflection occurs when the heat level reaches 185% due to the nickel material from which the detector is made. A filter is employed as an extractor for the CO2. It is made of carbon steel and can operate under a pressure of 100 bar using a nichrome heating element. Such an element is 10 m in length and carries a power of 1500 watts and six amps. Furthermore, this part is manufactured to handle the harshest conditions regarding oxidation resistance. Concerning the supply voltage, a Variac AC transformer 520T-10-14 was adopted to supply 0 to 130 V, 10 A, and 110 output voltage. The structure is designed with three terminal pins, while the insulator is made of cellulose thermal since it is non-toxic and has a great insulating capability. Most of its parts are manufactured from recyclable materials, with a few other materials made of different types to reduce the risk of combustion. Ultimately, the system is designed to work efficiently in terms of electric and thermal conductivity and, notably, cost-effectiveness. That is why the model was made of copper (99.5%, atomic number 29). The following illustrates the main procedures adopted in this work. To achieve a balanced state, four key variables must be modified: system pressure, input heat degree, model heat influx, and mass inflow velocity. It is interesting to see how changing one parameter affects the others. Adjusting only one variable and then watching to see if the other values change significantly is crucial. Additionally, after the nitrogen container connected to the accumulator was turned on, the regulator managed the pressure throughout the model. Once the model pressure was set to a pressure a little below the preset point (0.1–0.2 MPa), the glycol-water circulation loop and the unit gear pump were turned ON.
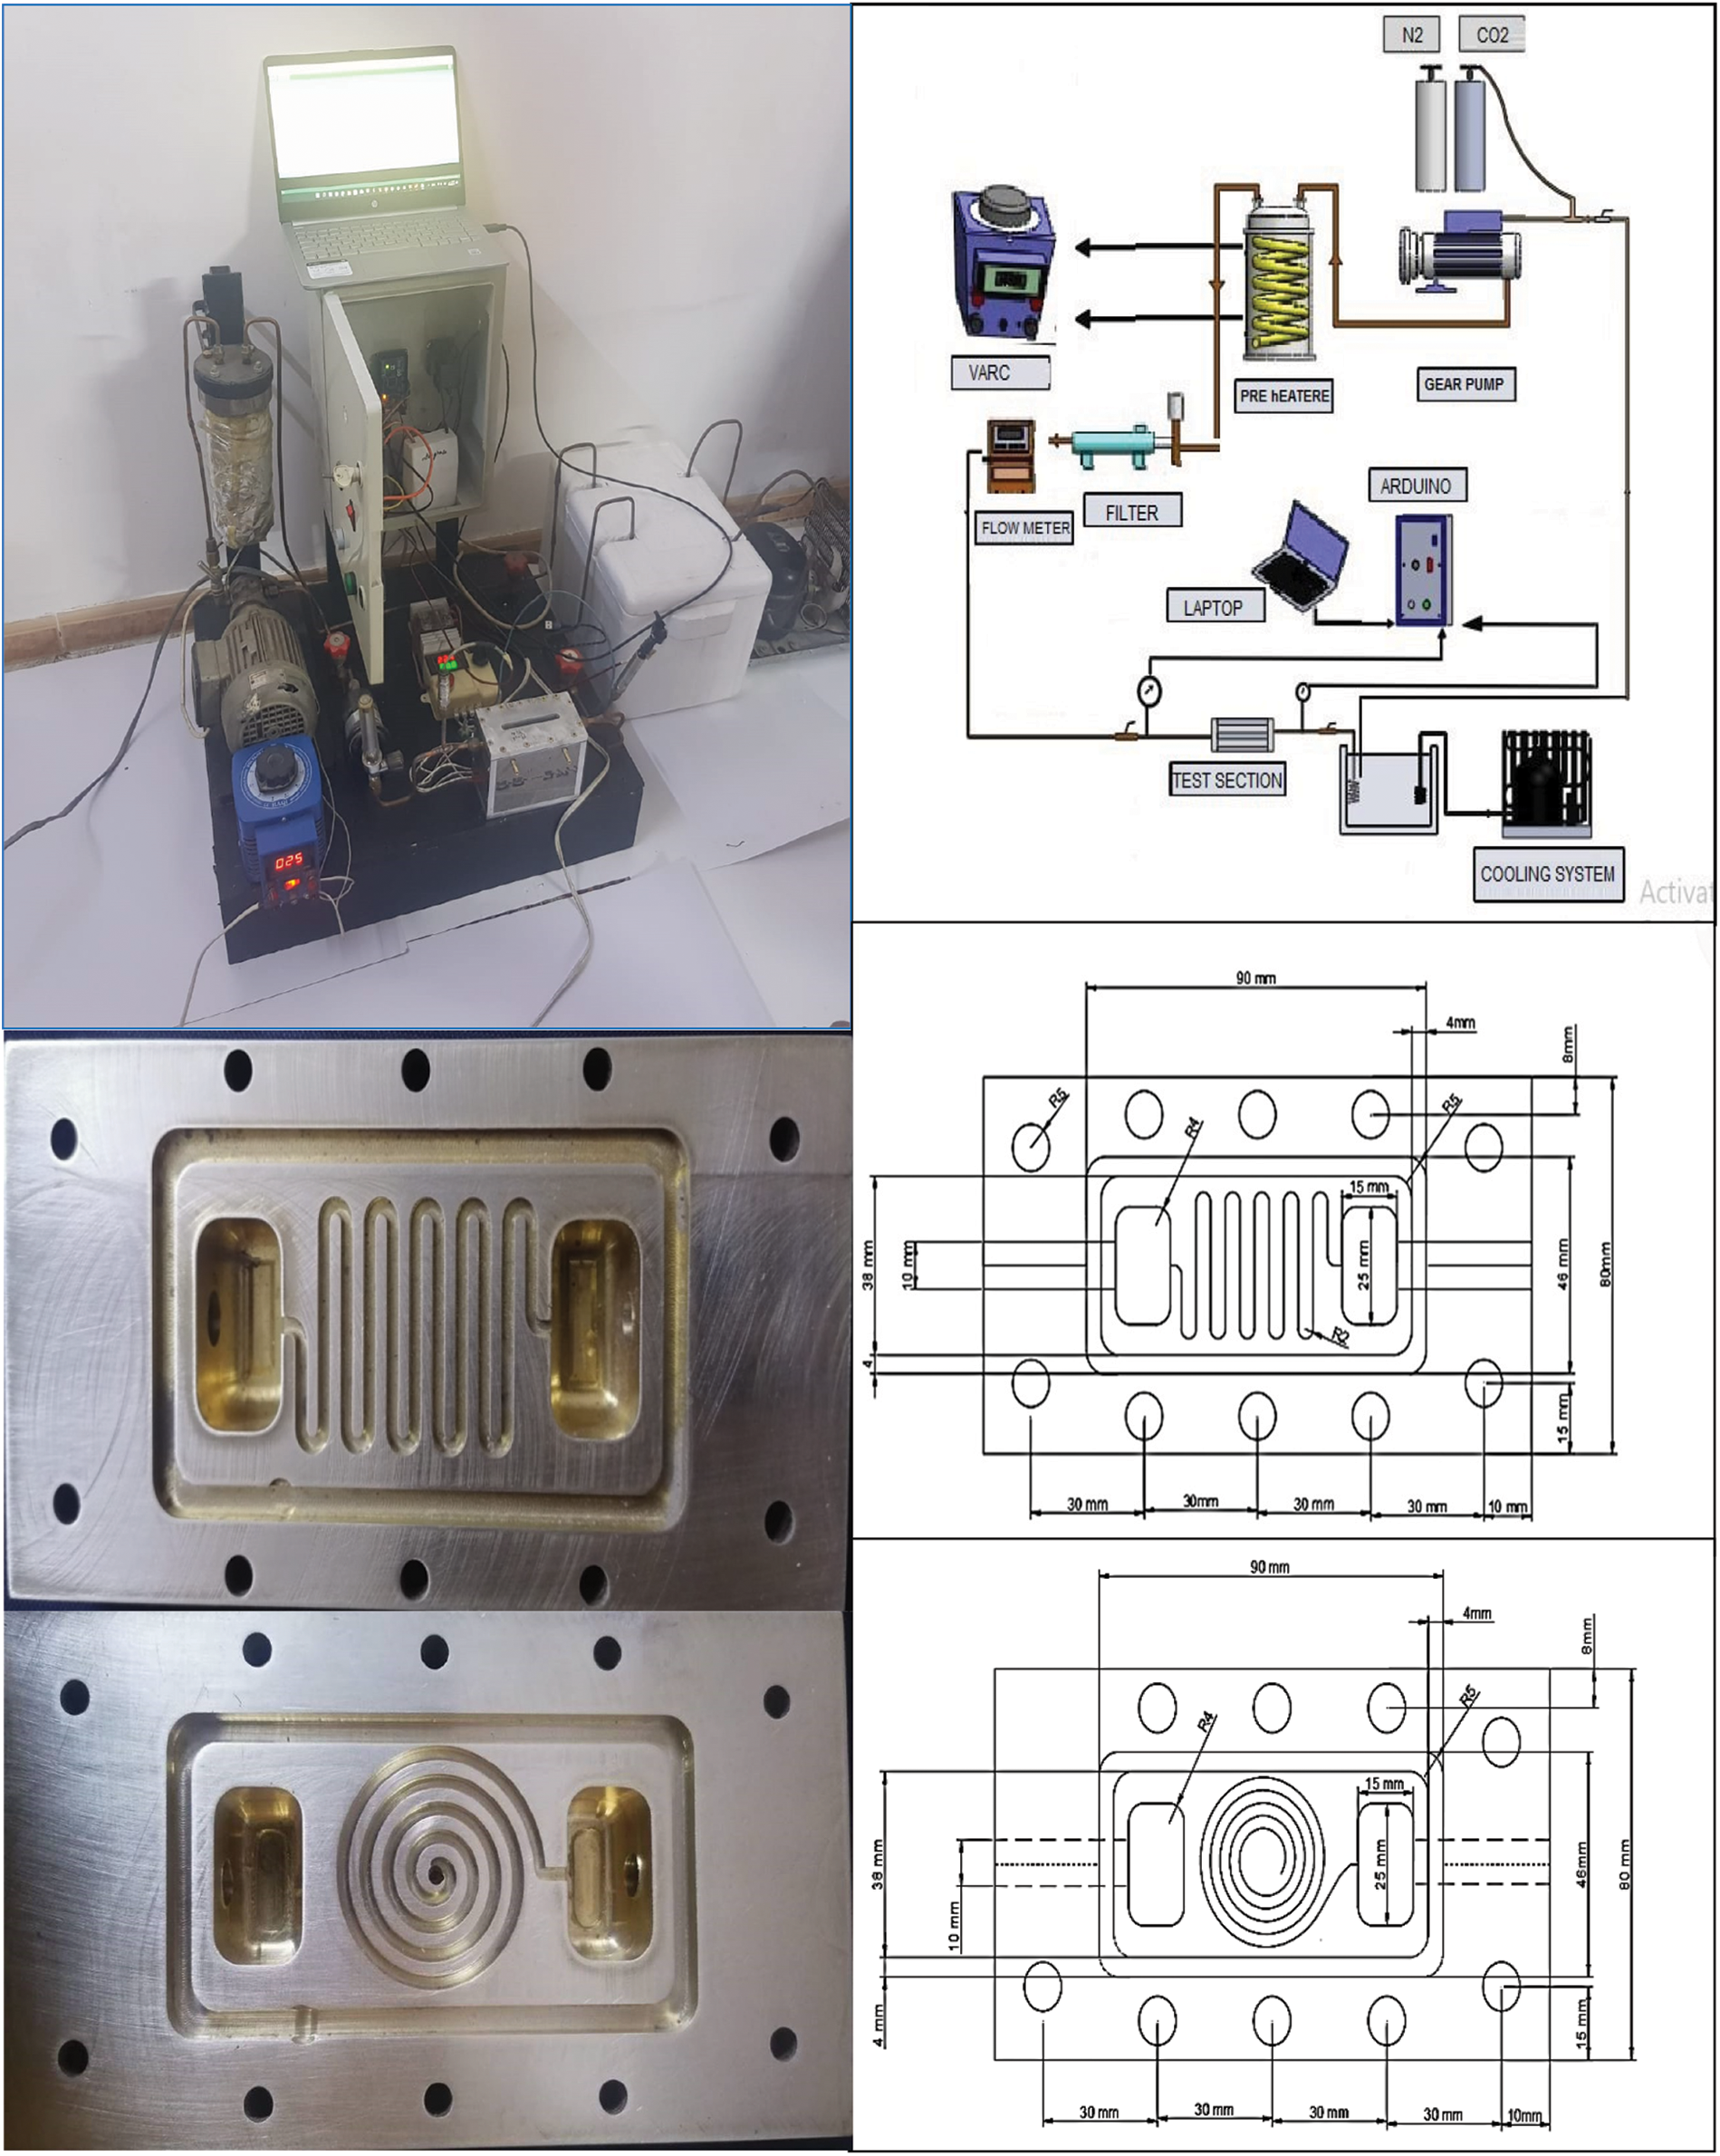
Figure 1: Realistic view, schematic diagram and microchannels of the empirical scheme
Additionally, the SC-CO2’s heat level was observed using LabVIEW results. It should be mentioned that after the recorded pre-heater temperature reached 15°C, the target test section intake temperature was chosen, and the pre-heater PID controller was turned ON. It is a device that, as is well known, uses a feedback strategy to change the output, like the voltage of a heater (Omega Engineering Inc., 2016). Regarding our work processes, the system pressure was set to the required testing pressure using a purge valve connected to the accumulator/N2 device after the pre-heater outlet temperature approached stable. The input temperature was verified again, and the MF average was adjusted to the necessary inflow rate using the variable speed pump. If the input temperature cannot sustain a temperature of 0.25°C for 5 min, the PID controller settings may be used. The Proportional, Integral, and Derivative values were adjusted utilizing an auto-tuning method built within the controller, it should be noted. Proportional control determines the value of the setting necessary for the control system to respond by comparing the set point and the actual quantity (National Instruments, 2011). By gradually adding the abovementioned errors, integral control can reduce the stable error to zero (National Instruments, 2011). According to the manufacturer’s instructions, the derivative control also determines the controller’s reaction rate in response to changes in the operational response variable. Once the new PID factors were set, the input heat degree was adjusted to the necessary amount. To provide the experimental model with a consistent HF after that, the heater was turned ON once a particular point was reached. The heater was turned on at 10 watts and steadily increased using the auto-transformer dial for the settings until the necessary HF condition was reached. This procedure is required to prevent the test part from overheating and to improve the heater’s lifespan. It should be noted that after monitoring the input and outflow heat degrees for the test portion for 5 min, the system’s stability was validated. The pre-and post-interval heat degrees must be within 0.25°C for the experimental model to be considered stable; hence data is gathered at 1 Hz for 10 min. The data is collected at a rate of 1 Hz for 20 min if, following a PID tuning procedure, the experimental model can still not maintain the intake and output heat degrees below 0.25°C. This procedure is beneficial for reducing post-processing data inaccuracies. The post-processing of the dataset is divided into two steps. First, a Matlab program calculates the average, standard deviation, accuracy inaccuracy, bias error, and cumulative measurement uncertainty of each parameter estimate from the many data sets gathered. This script organizes several data points from a single collection using a single Microsoft Excel page. Using the collected data and associated systematic errors, such software was utilized to calculate heat flow, wall temperature, mass liquid heat degrees, and HT factors.
The expression below is adopted for surface temperatures computation:
The expression below is adopted for HT factor computation:
The next expression is adopted for Nusselt number computation at each point at which rays converge:
Eq. (4) expression is adopted for fluid temperature calculation.
Mean value of HT factor was computed as
The mean value of Nusselt number take the form of Eq. (6) below:
The mean value of HT of surface temperature was computed using the following form:
In the end, utilizing the expression below, the Reynolds number was computed.
This section is assigned to illustrate the most influential parameters concerning the S-CO2, such as, for instance, the effect of pressurize, MF, and HF on the HT, besides the buoyancy relative to the HT behaviour. The measurement of parameter validation was verified by measuring the data at various intervals, subdivided into three groups. Three times were adopted as repeats for recorded data to ensure the accuracy of the results. Fig. 2 illustrates that the highest departure was achieved by group 1 at a rate of 3%. In the same context, it can be seen that the highest deflection occurred at a rate of 5% compared to the third group, which reached 4%. Such results proved the robustness of the model’s results.
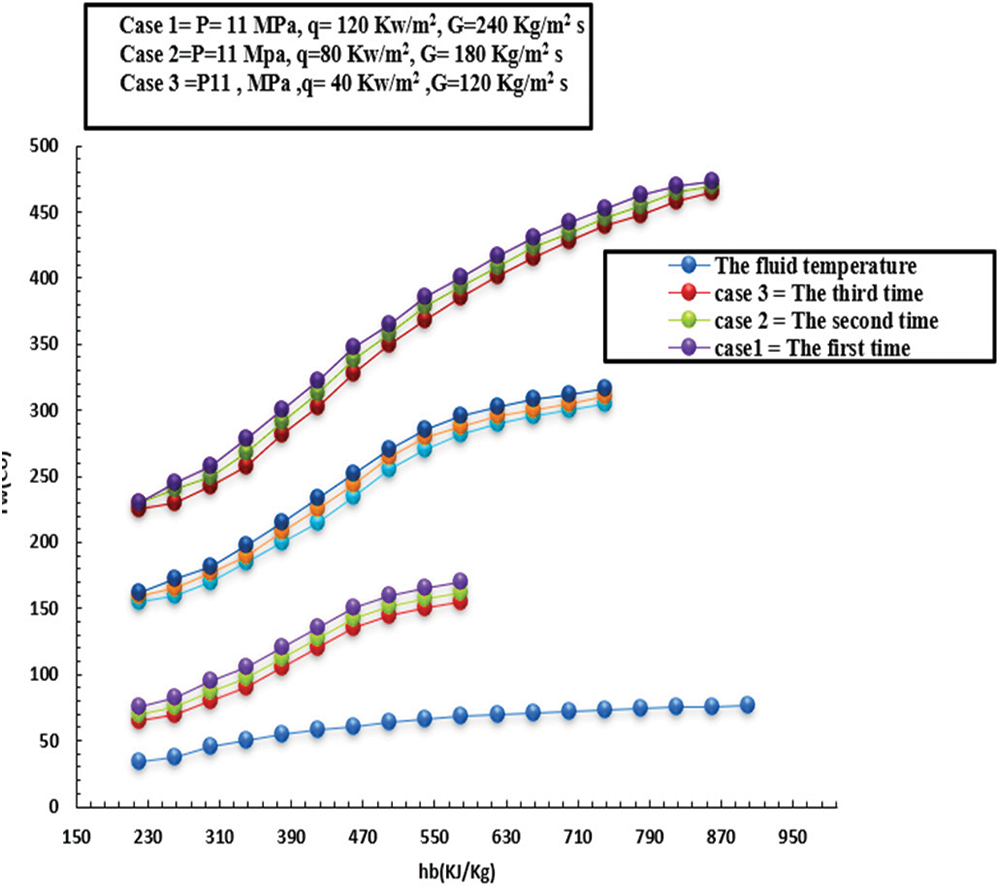
Figure 2: Verification results
Figs. 3–6 show how the HT is impacted by HF with SC-CO2 for two levels of MF inflow (low and high) based on various thermal flow rates. It is worth mentioning that the low MF rate and pressure were kept fixed to highlight the impact of heat inflow on HT. Furthermore, these figures show the variation in wall temperature and HT factor. It can be seen that there is a direct relationship between internal wall temperature and heat inflow and the HT factor from the other side, besides a degradation in the HT in the low enthalpy zone. This behaviour was recorded at a heat inflow of about 40 kW/m2. In this context, in comparison, the head in the centre of the tube was lower than the area close to the wall, and the flotation (due to variation in CO2 density) significantly contributed to the HT factor. However, the buoyancy dropped when thermodynamics stabilized at 440 kJ/kg.
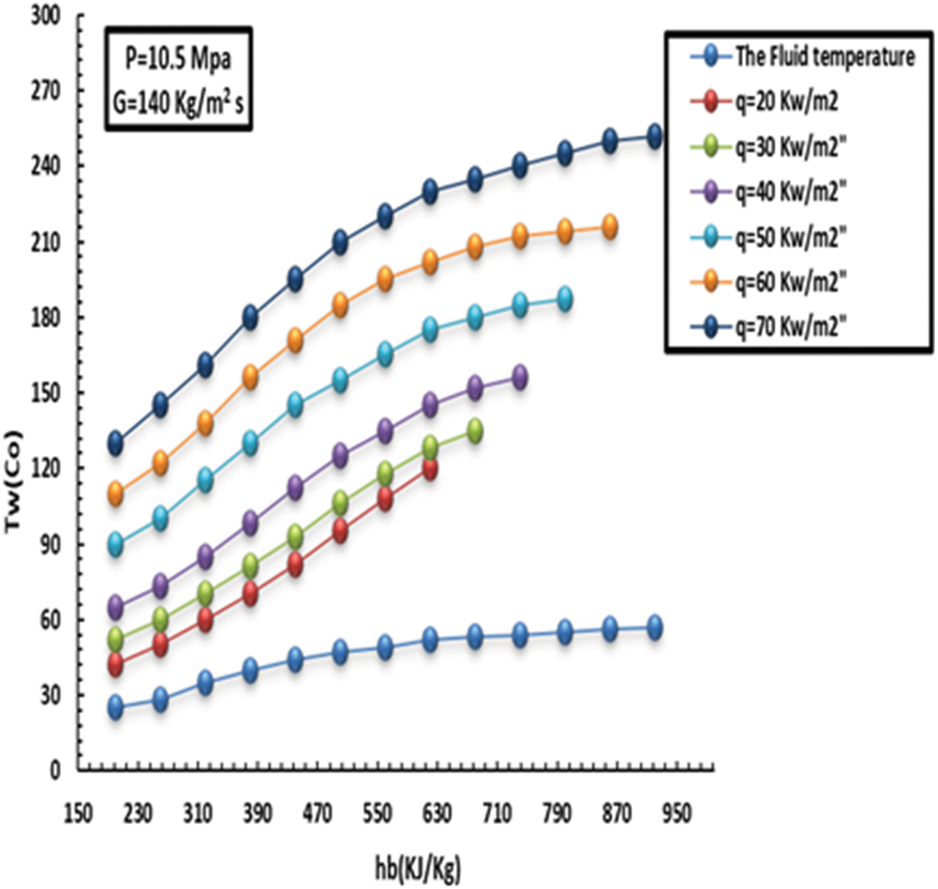
Figure 3: Effect of HF on inside heat wall at a MF of 140 kg/m2s and pressure of 10.5 MPa
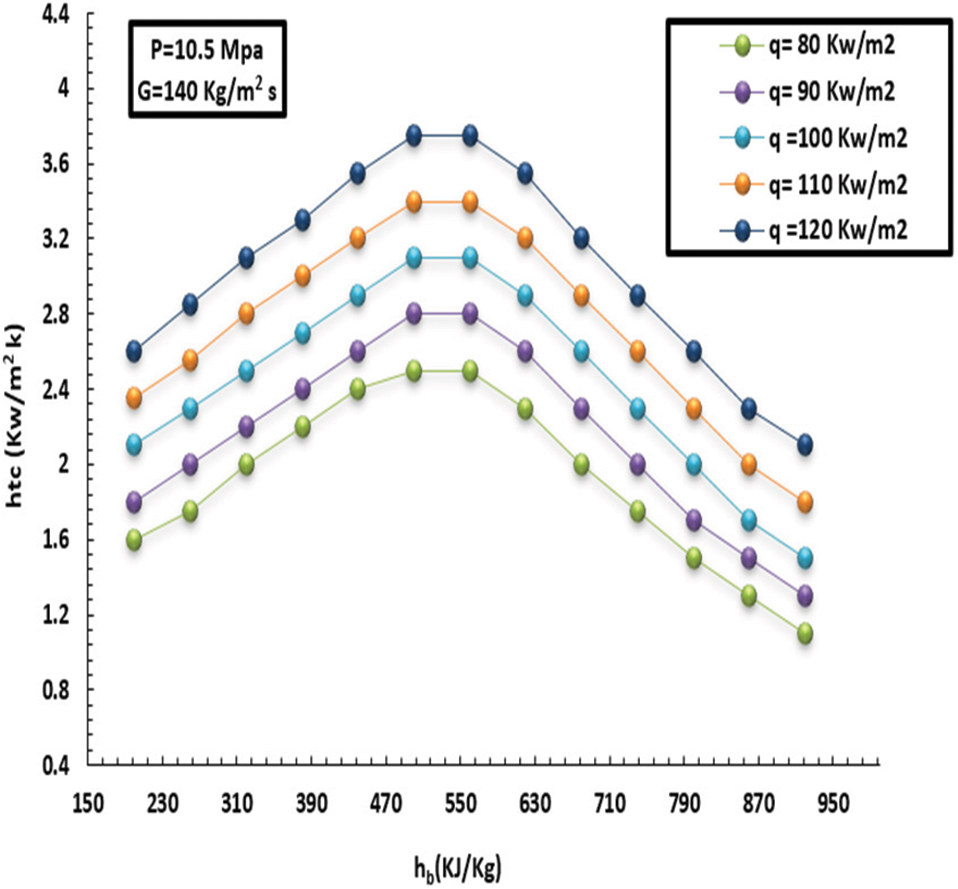
Figure 4: Effect of HF on topical HT factor at a MFof 140 kg/m2s and pressure of 10.5 MPa
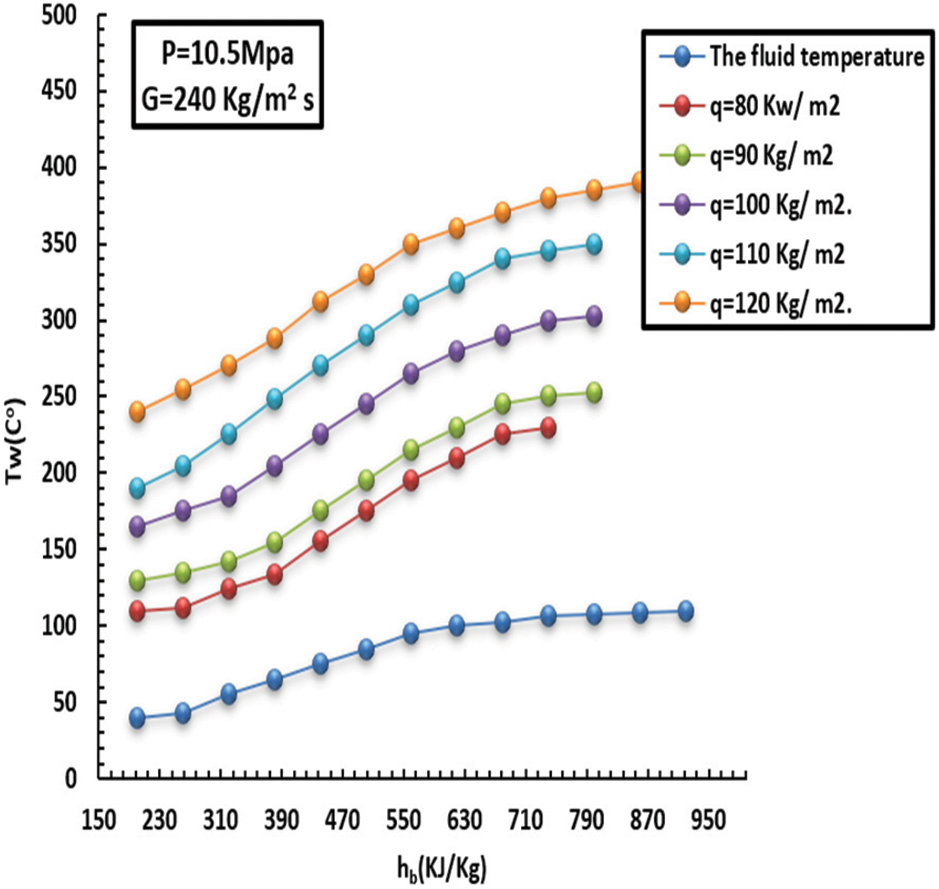
Figure 5: Effect of HF on inside heat wall at a MF of 240 kg/m2s and pressure of 10.5 MPa
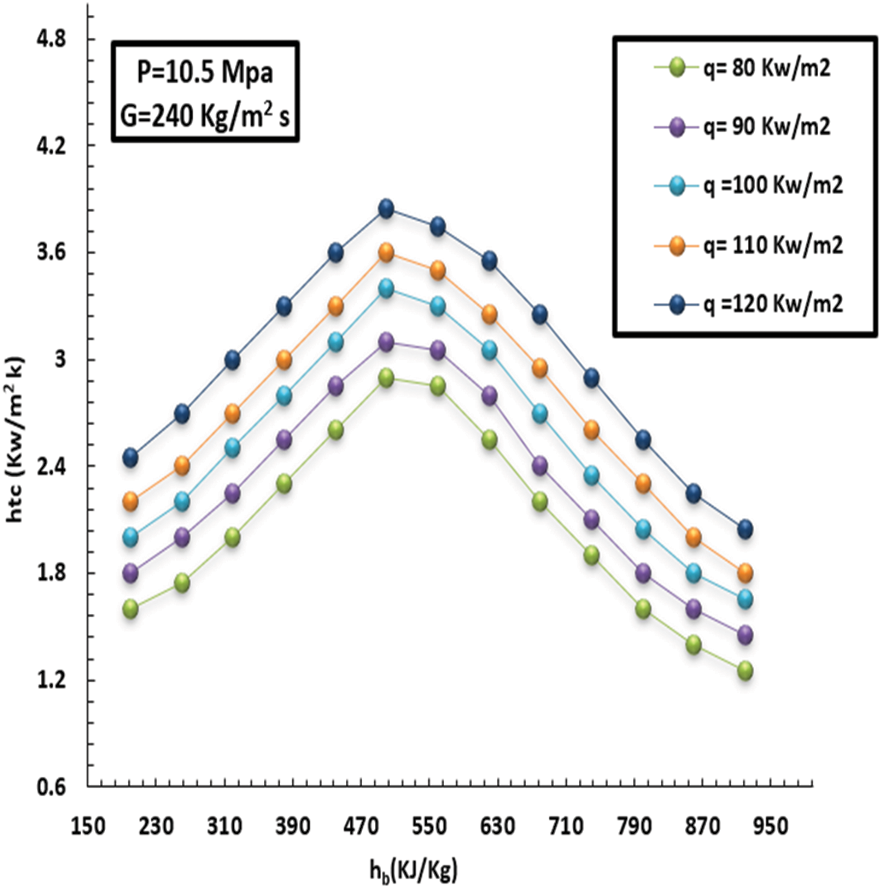
Figure 6: Effect of HF on topical HT factor at a MF of 140 kg/m2s and pressure of 10.5 MPa
Additionally, the wall temperature rose while the HT decreased with high intake. In particular, the HT factor maxed early in the low-thermodynamic zone under a high HF scenario, with a more prominent HT factor than under a low HF scenario. As a result, this performance was mainly attributable to SC-CO2’s intricate and diverse physical characteristics. On the other hand, the liquid heat adjacent to the wall zone differed significantly from the liquid heat in the tube core under high HF conditions, leading to noticeable differences in physical characteristics. At HT enhancement, the floating effect that the density variation caused was significant. In this sense, the impact of floating was immediately diminished when the liquid thermodynamics were more important than 410 kJ/kg. Under high HF conditions, however, the wall’s heat rapidly increased, and the HT factor progressively decreased. In addition, the wall’s heat gradually increased under low HF conditions, and the HT factor peaked at the pseudo-critical temperature. The HT factor decreased as the HF increased, though.
It has been observed that the more mass flux increments, the more the HT factor and turbulence intensity increment. The inside wall temperature and HT factor affected by MF (140–240 kg/m2s) can be noted in Figs. 7–10. This, in turn, led to unstable inflow and heavy mixing. Furthermore, the greater the MF increase, the lower the wall temperature, and consequently, the HT factor increases rapidly over the entire region. In short, such behavior promotes heat exchange between the fluid and the solid tube wall.
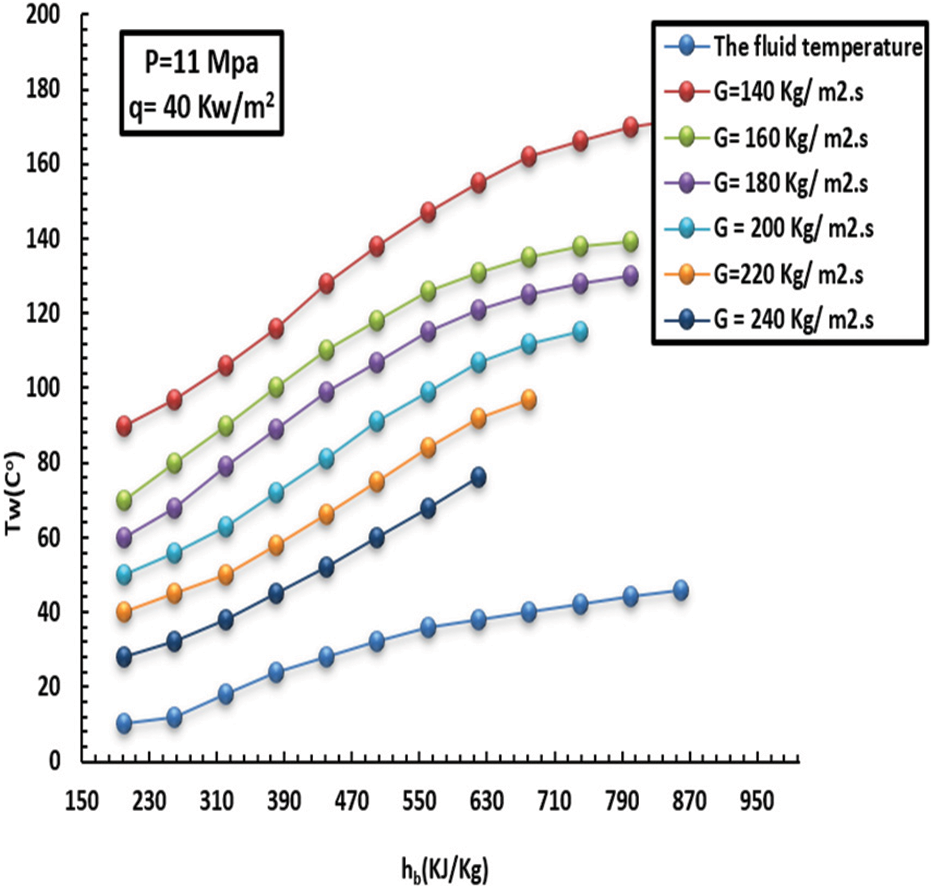
Figure 7: Effect of MF on inside heat wall at a HF of 40 kW/m2 and pressure of 11 MPa
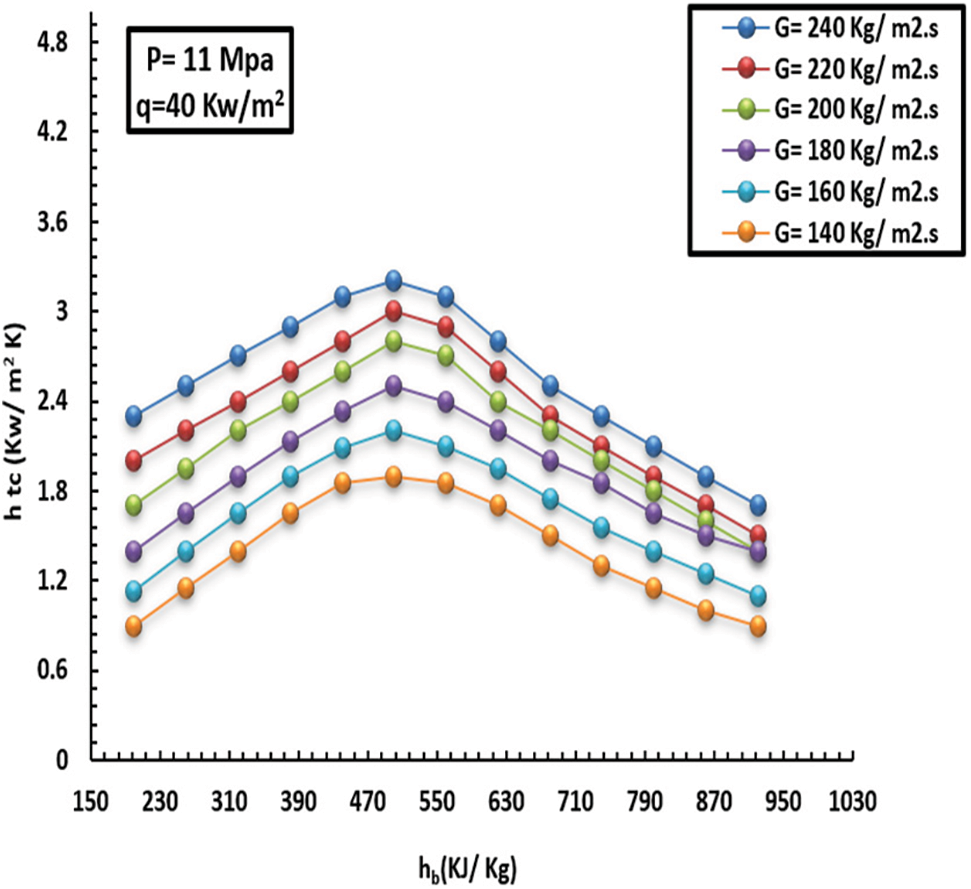
Figure 8: Effect of MF on topical HT facto at a HF of 40 kW/m2 and pressure of 11 MPa
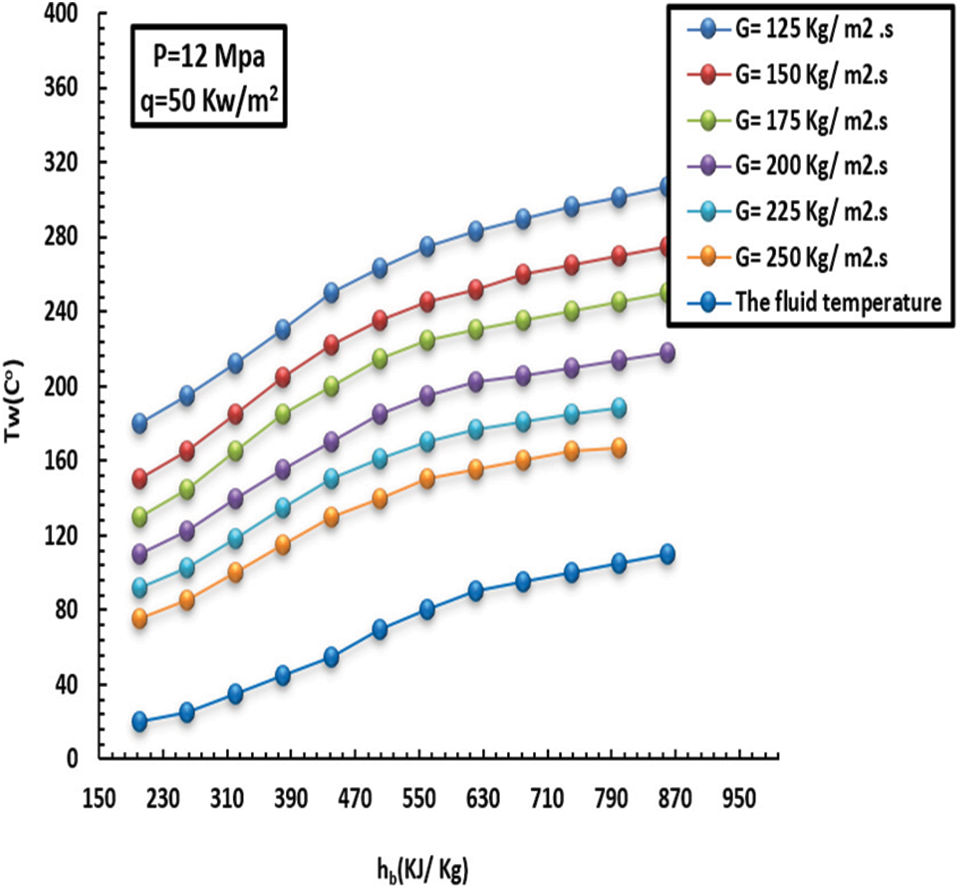
Figure 9: Effect of MF on inside heat wall at a HF of 50 kW/m2 and pressure of 12 MPa
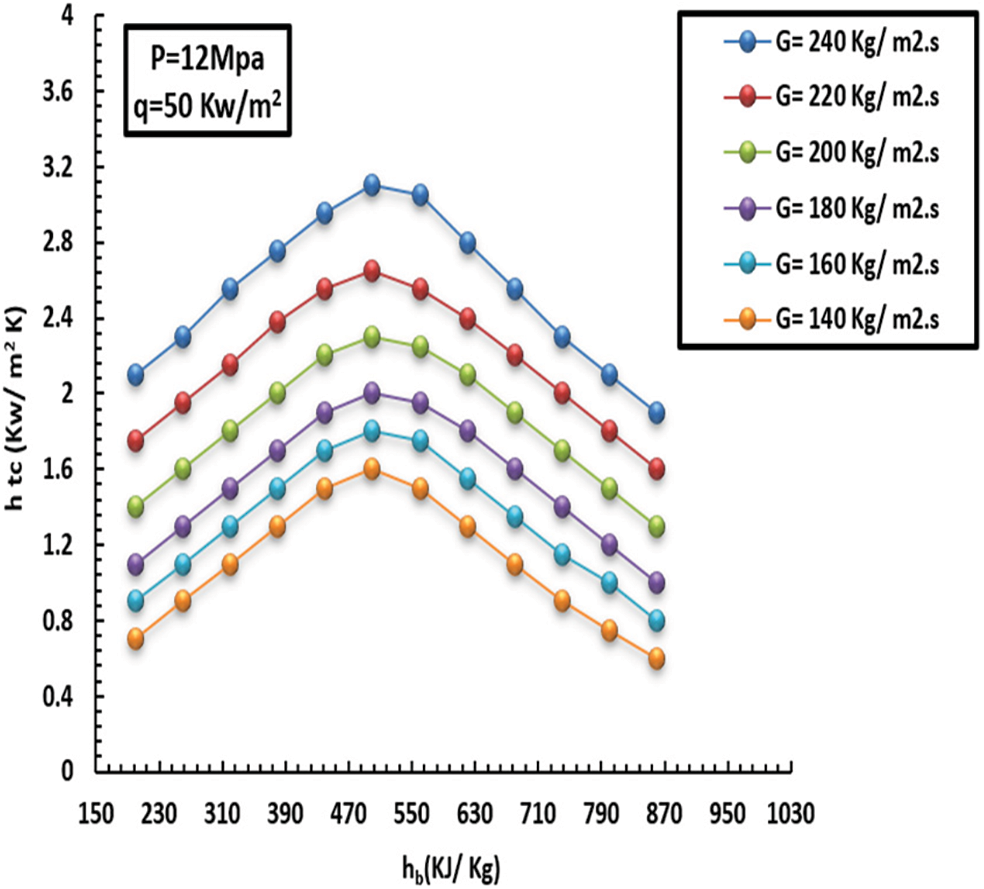
Figure 10: Effect of MF on topical HT factor at a HF of 50 kW/m2 and pressure of 12 MPa
As previously mentioned, the variations between interior wall temperature and HT were small at various mass fluxes, especially in the low-enthalpy field. Intriguingly, at the same enthalpy zone, the HT factor was greater than in the case of high MF. This was caused by the inverse ratio of Bo* and Re in the flotation computational criteria. The other measured value was 410 kJ/kg; the MF significantly affects HT at low wall temperatures. On the other hand, this was attributed to the decrease in flotation and density dissimilarity and the growing turbulence intensity as the MF incremented. In keeping with this, when the liquid was in the low-thermodynamic zone (7–10), the differences in the inside-heat wall and HT factor at different degrees of MF were minimal. Likewise, the HT factor was higher at thermodynamic sites with the highest MF compared to low MF. This results from the [Bo* and Re] inverse relationship of the flotation computation criterion, which causes less improved floating HT as the MF rises. Furthermore, floating has a more substantial effect on increasing HT because it lowers the MF. With a lower inner-wall temperature and a higher HT factor as MF increased, MF significantly affected the HT when the liquid thermodynamic characteristics were more significant than 410 kJ/kg. A decrease in floating, a narrowing of density disparities, and increasing turbulence intensity were the main factors driving MF growth. The inner-wall temperature increased quickly when the thermodynamics increased between 100 and 180 kg/m2, but it raised more gradually at 200 kg/m2.
The behaviour of the inner-wall temperature has identical attitudes at supercritical pressure and HF of 30 kW/m2 and MF of 150 kg/m2s. In addition, the inner-wall temperature discrepancy changed due to pressure, and HF and MF were incremented to 75 kW/m2 and 230 kg/m2s, respectively. The reason is that the more pressure increases, the greater the decrease in thermal capacity and, consequently, the greater the reduction in heat transfer. All these behaviours can be seen in Figs. 11–15. As far as the pressure is concerned, the more the pressure increases, the more the liquid thermal capacity and the mobility of heat transfer decline, which is noted at the pseudo-critical temperature. This explained how the pressure impacts the heat degree at the related points. Moreover, in the case of low pressure, the specific heat capacity increased, contributing to better promotion of HT at low pressure compared to high-pressure situations.
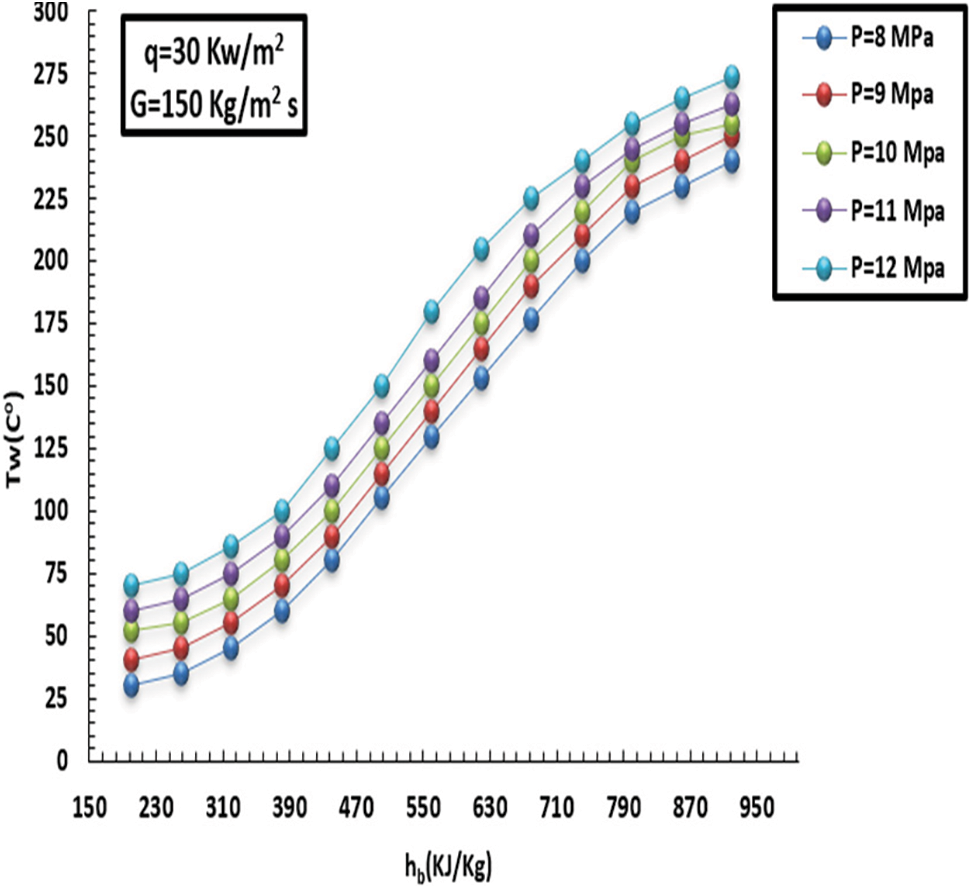
Figure 11: Influence of pressure on internal-wall heat at a HF of 30 kW/m2 and MF of 150 kg/m2s
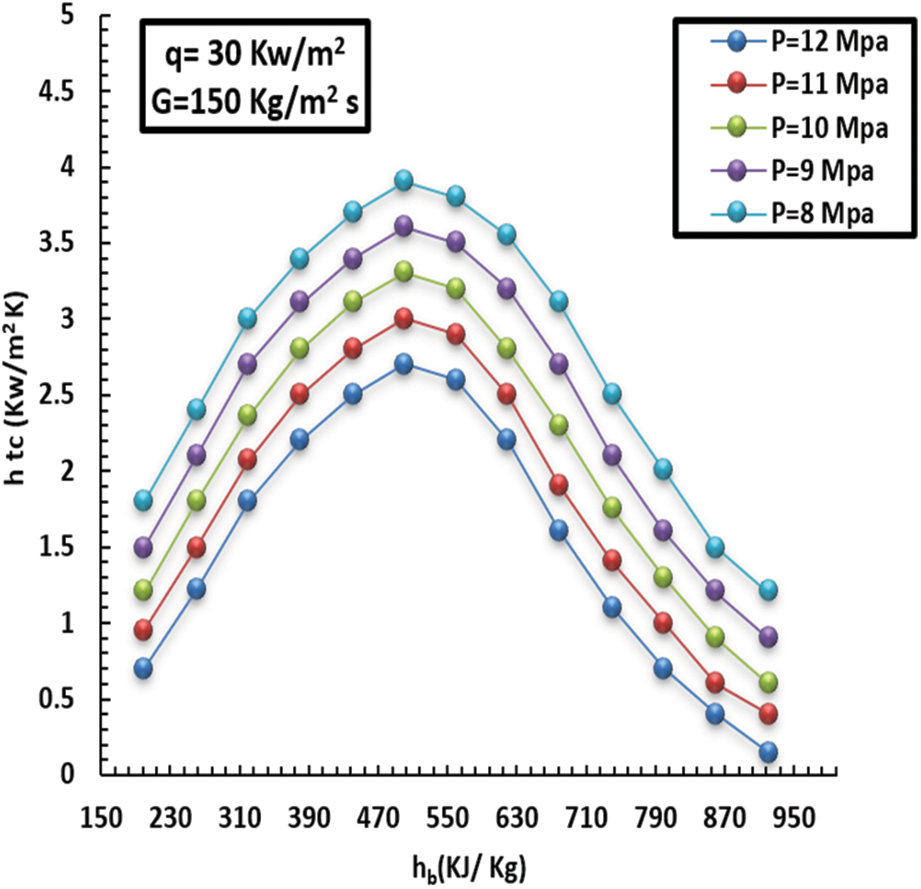
Figure 12: Influence of pressure on topical heat at a HF of 30 kW/m2 and MF of 150 kg/m2 s
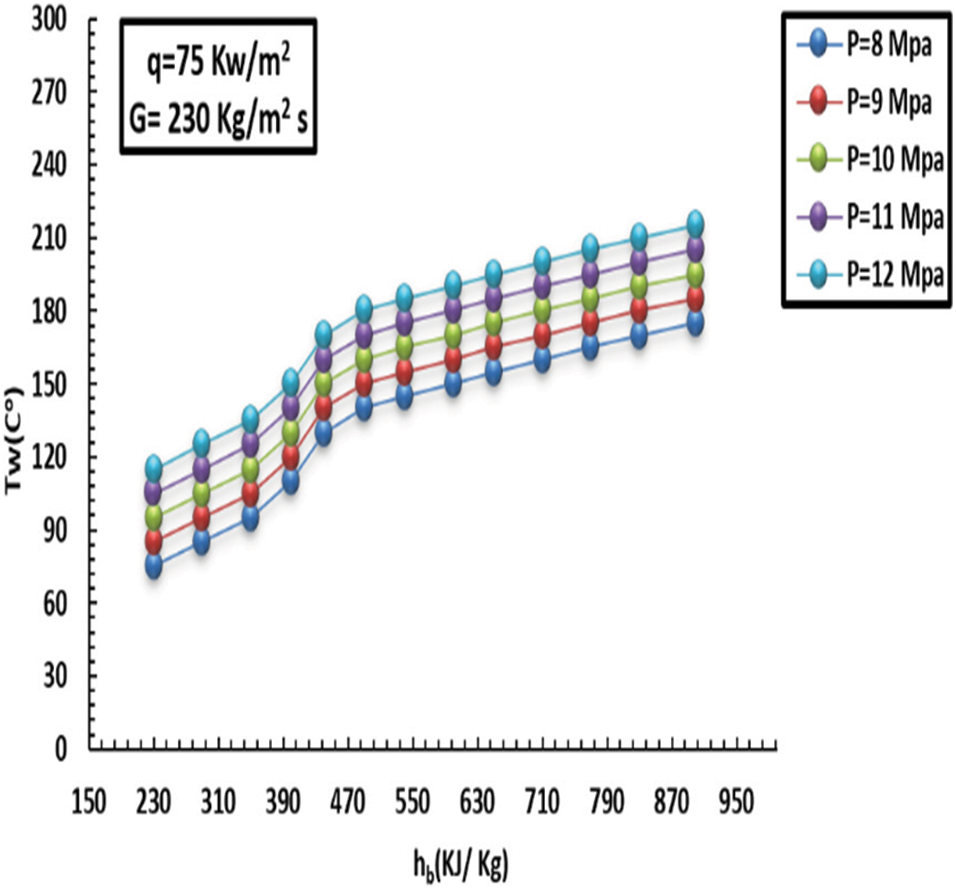
Figure 13: Influence of pressure on internal-wall heat at a HF of 75 kW/m2 and MF of 230 kg/m2s
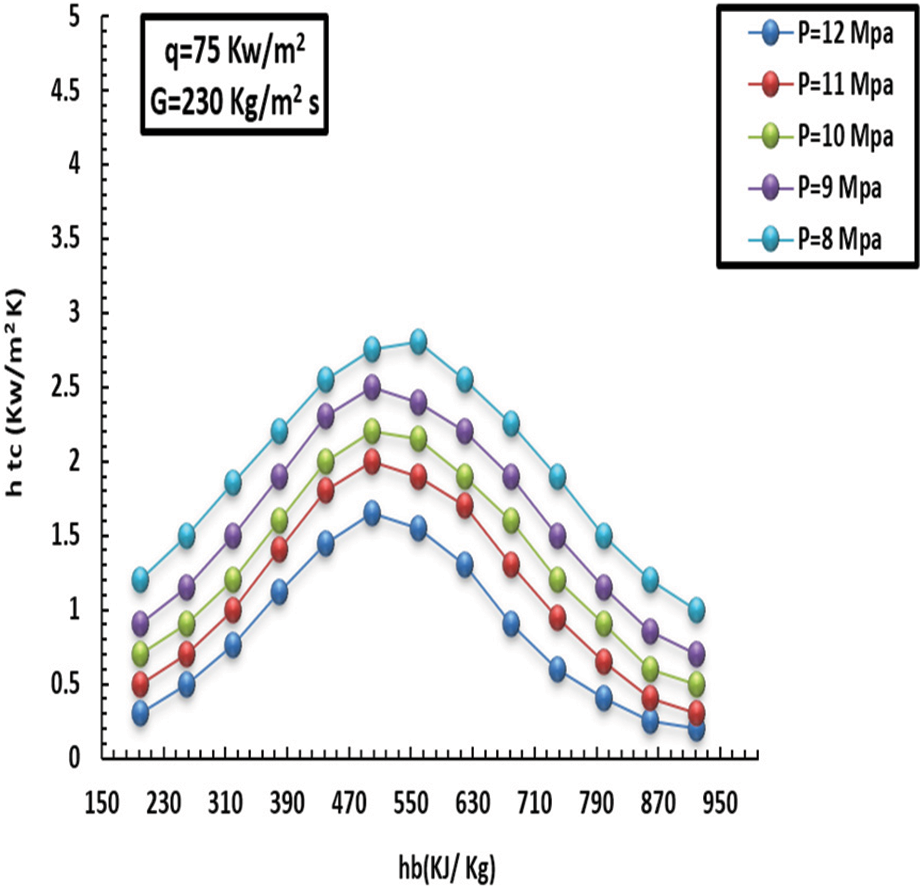
Figure 14: Influence of pressure on topical heat at a HF of 75 kW/m2 and MF of 230 kg/m2s
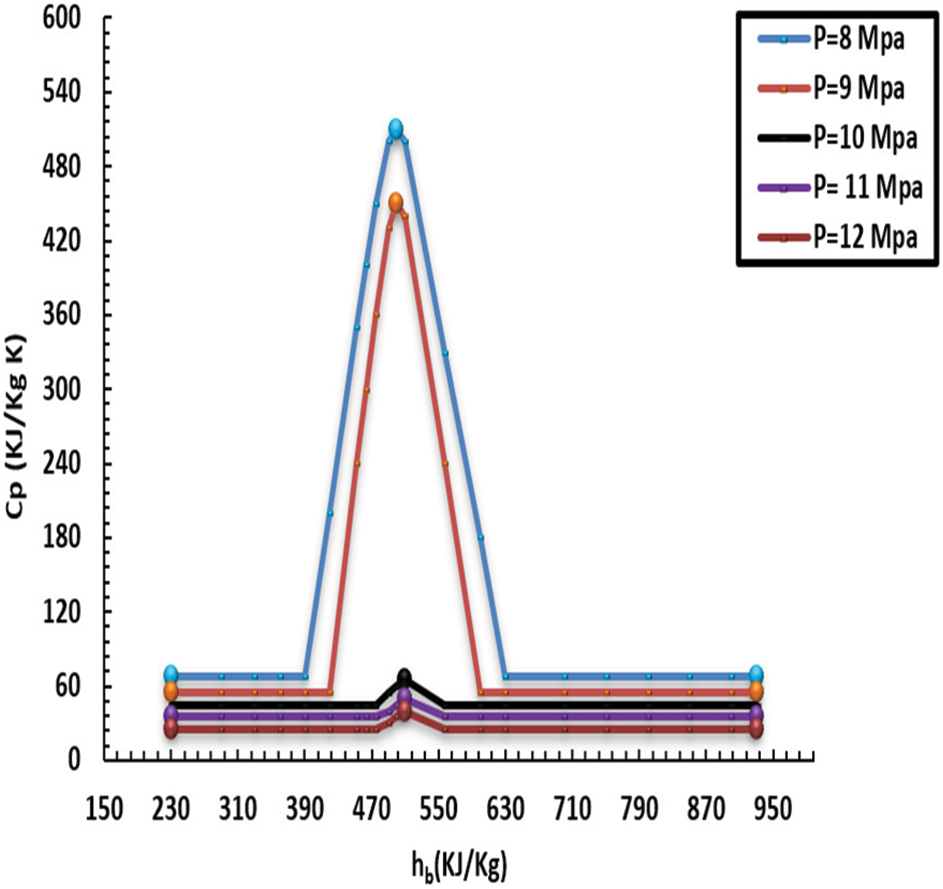
Figure 15: Variations in specific heat capacity of CO2 in supercritical region at different
The specific heat capacity of the liquid decreased as the pressure grew, owing to the fluid’s ability to transmit heat. In addition, it was noticed that specific heat capacity surged dramatically with sharp peaks subject to low pressure, particularly towards the pseudo-critical temperature, eliciting greater HT at low pressure than at high pressure. Additionally, the effect of pressure on HT was greatly diminished when the liquid thermodynamic neared 380 kJ/kg, and the HT factors under various pressures remained largely steady. Additionally, after reaching the pseudo-critical temperature, the specific heat capacity under low pressure began rapidly decreasing from its most significant point. It gradually matched the heat capacity under high pressure. The distinctive HT feature illustrated in (11 and 12) may cause the noticeably higher q (i.e., 65 kW/m2). Moreover, the gap between the inner heat of the wall and the pseudo-crucial heat was greater subject to low pressure since the wall heat in the low-thermodynamic zone was greater in comparison to the pseudo-crucial heat at increased HF. The heated tube wall caused the liquid close to the wall to heat up more than the pseudo-crucial heat, which caused the typical close-wall liquid thermic associated with low pressure to fall and become generally compatible with high pressure swiftly. Additionally, the capacity to move heat from the internal sidewall cover remained constant under various pressures.
Figs. 12 and 14 show a comparison in terms of specific heat capacity at different pressures. The impact of HT was light, and HT factors were approximately consistent. In comparison, the peak of the HT factor of 8 MPa was higher by 18% than that of 12 MPa. Again, Fig. 12 presents a difference in the HT factor for various pressures with a heat flux of 30 kW/m2. Our conclusion related to HT depicted in Fig. 12 can be attributed to increased q. When the HT coefficient is increased and as a result of the temperature of the heated wall, the liquid temperature around the wall is larger than the critical temperature, after which the temperature of the inner wall decreases and becomes close to the high-pressure temperature. Finally, the thermal capacity on the inner side cover wall remained constant.
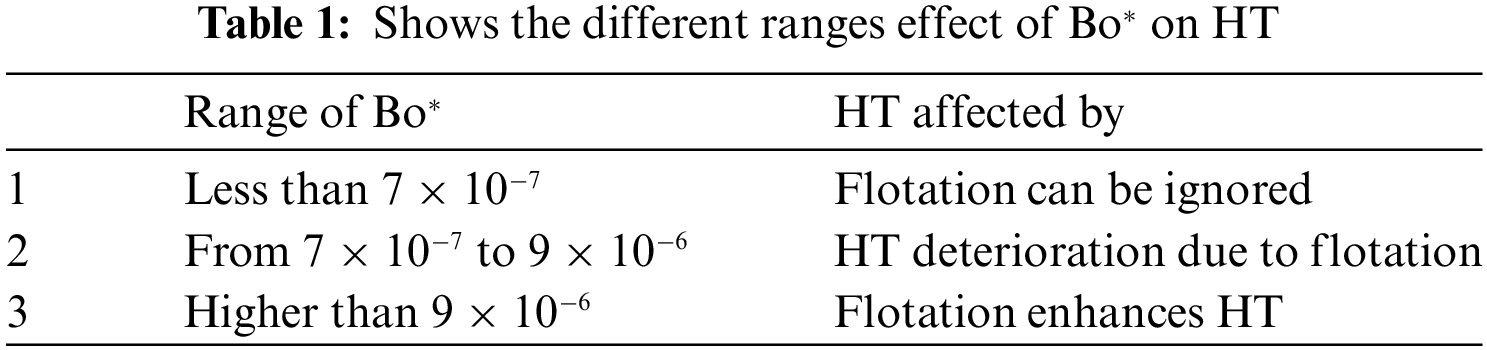
It is worth mentioning that the variation in liquid temperature leads to a variation in density, which causes buoyancy phenomena. In this vein, the authors in P.X. Jiang presented a dimensional-less parameter, Bo*, to measure the effect of flotation on the fully enhanced compound convection HT manner of liquids at SC pressures for upward inflow. Based on that, Eq. (9) explains how the flotation can be computed as a dimensional-less parameter, Bo*. As shown in the equation, buoyancy is related to Re inversely. Table 1 illustrates the effect of various ranges of Bo* on HT.
The performance of the buoyancy of CO2 in the SC zone for various values of HF is shown in Figs. 16 and 17. As can be seen, the Bo* value increased as the HF increased. At the low thermal zone and under high HF, buoyancy had an outstanding effect; in other words, the value of Bo* significantly exceeded 9 × 10⁻⁶ in the HT promotion area. After that, as the HF incremented, the value of Bo* dropped gradually, degrading the heat promotion, that is to say, the HT factor effect at this region. As seen in Figs. 18 and 19, with a lowering in MF, the Bo* incremented gradually since it is in an inverse relationship with Re. See Fig. 17. It can be concluded that the HT can be significantly enhanced because the value of Bo* was much larger than 8 × 10⁻⁶ when MF was 60 and 120 kg/m2 s. However, the HT is affected with Bo* under an MF of 240 kg/m2, undermining heat transfer. Fig. 10 illustrates the scenario of a low thermal zone, different HF besides the great HT, and low heat flux compared to high HF at the exact enthalpy locations.
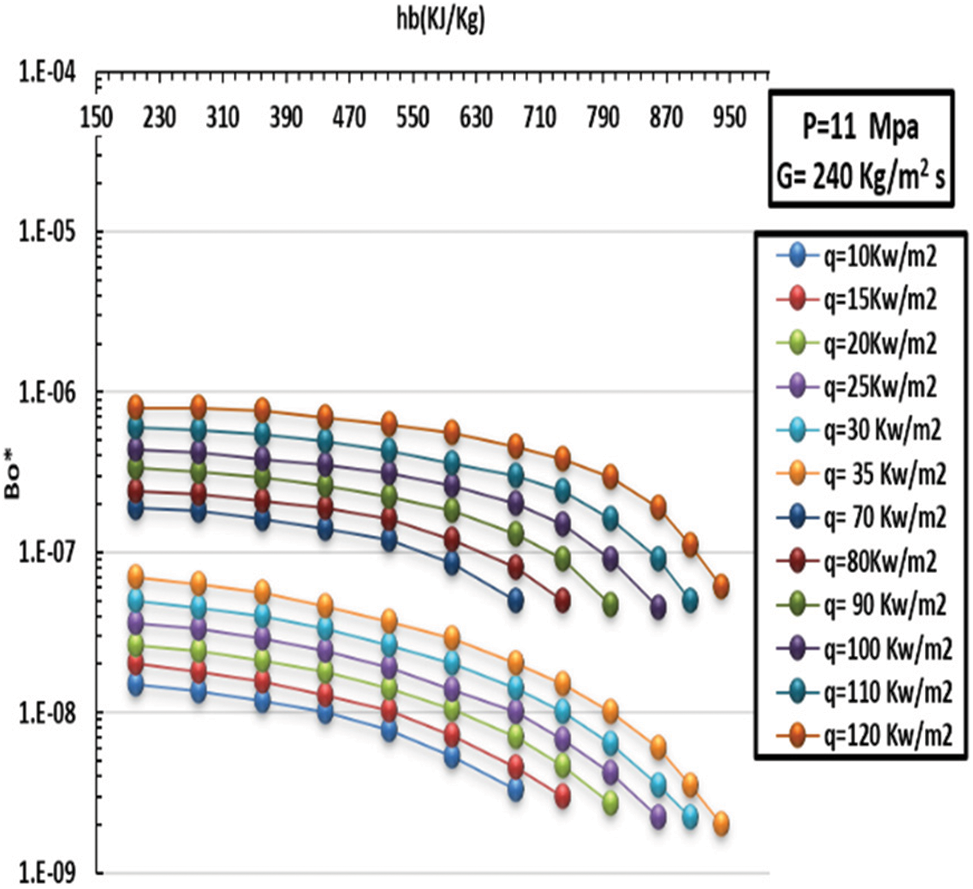
Figure 16: Differences in floating of CO2 in SC supercritical zone at various levels of HF
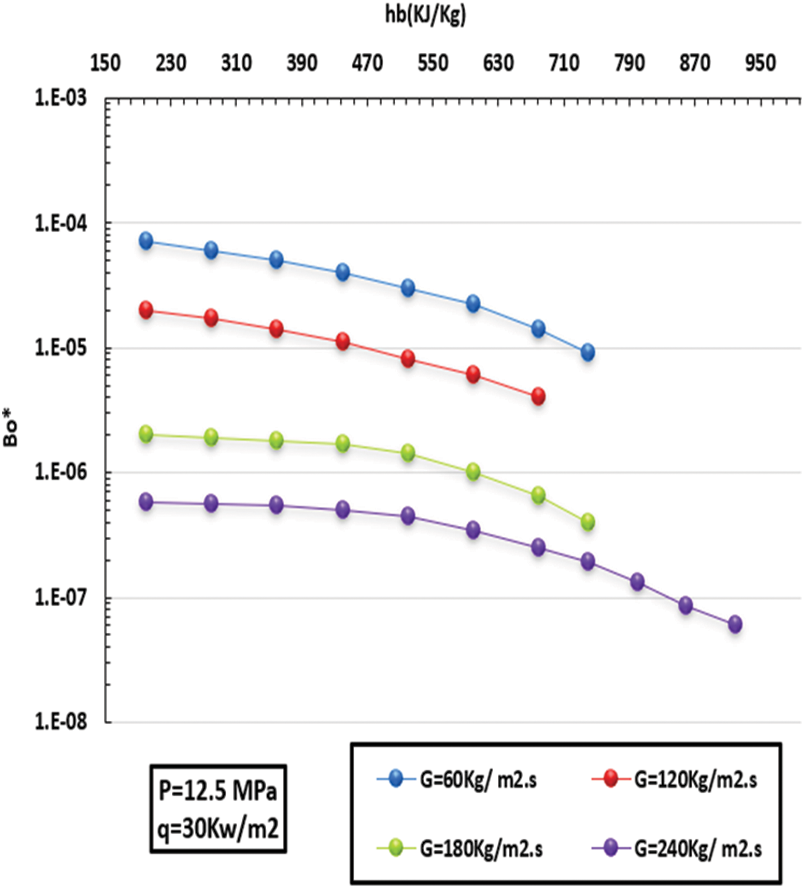
Figure 17: Differences in floating of CO2 in zone at various scenarios of MF
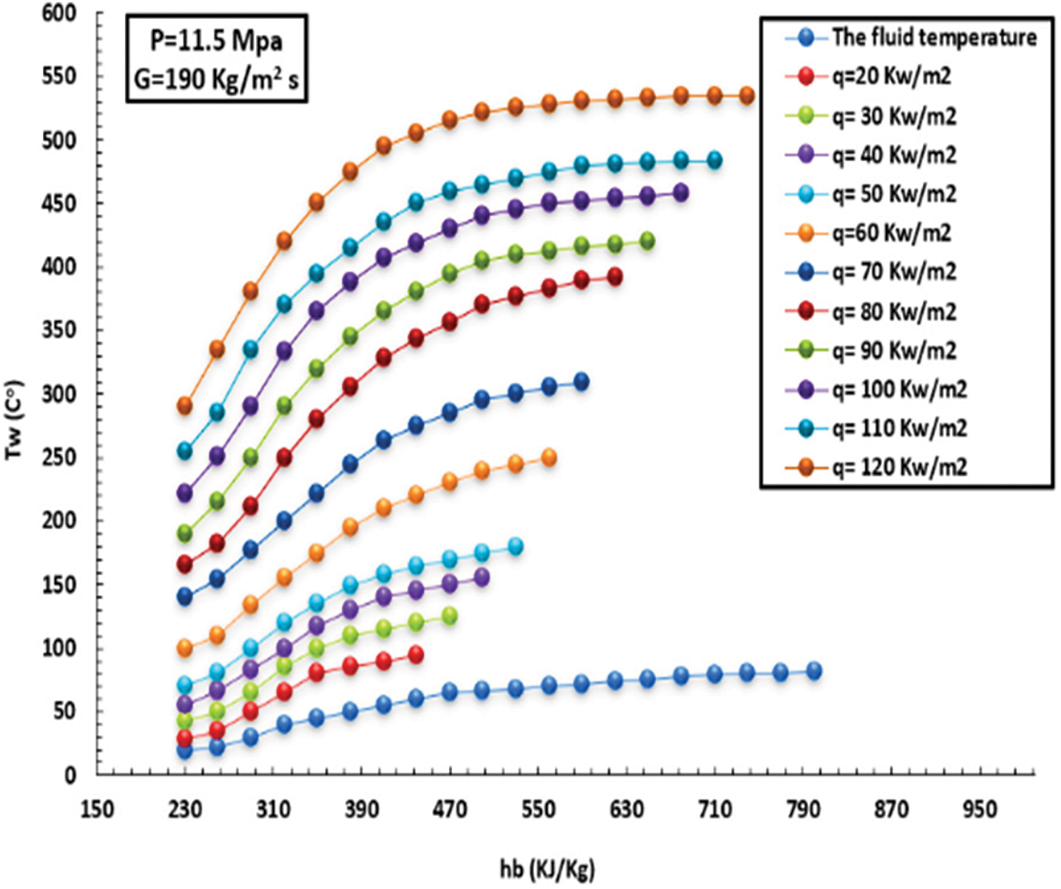
Figure 18: Differences heated wall with enthalpy at various HFs for pressurize of 11.5 MPa and MF of 190 kg/m2s
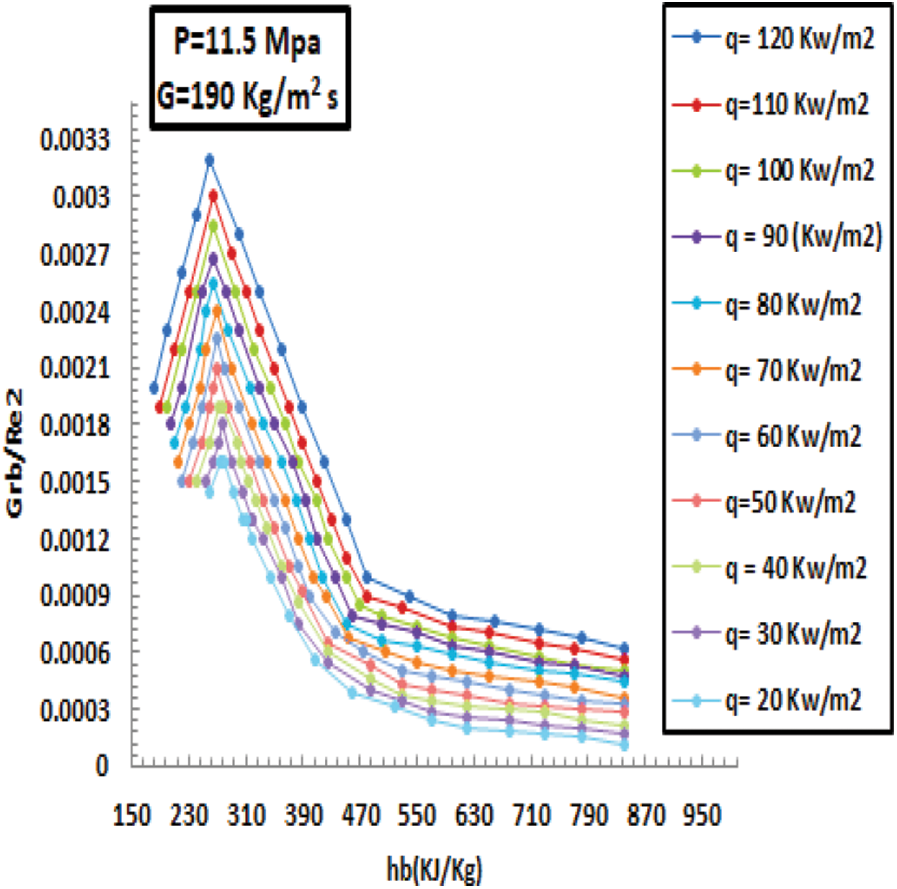
Figure 19: Differences mixed convection at various HFs for pressurize of 11.5 MPa and MF of 190 kg/m2s
3.5 Resistance of the Flow Contribution
The friction factor can be computed using the formula introduced in P.X. Jiang.
where Reb signifies comparable to Reynolds number determined as:
In line with the previously mentioned, Figs. 20 and 21 depict the friction factor computed from empirical data for carbon dioxide inflow in sintered tubes at SC pressures with the formula. A match was found related to parameters such as the friction factors of CO2 in sintered pipes at SC pressures and invariant heat (cold). Fig. 22 depicts the behaviour of CO2 and SC pressures according to Eq. (11) above. In summary, sintered tubes’ varied thermo-physical characteristics are related to friction factors. Two novel relationships were introduced to evaluate the system performance of heated sintered tubes.
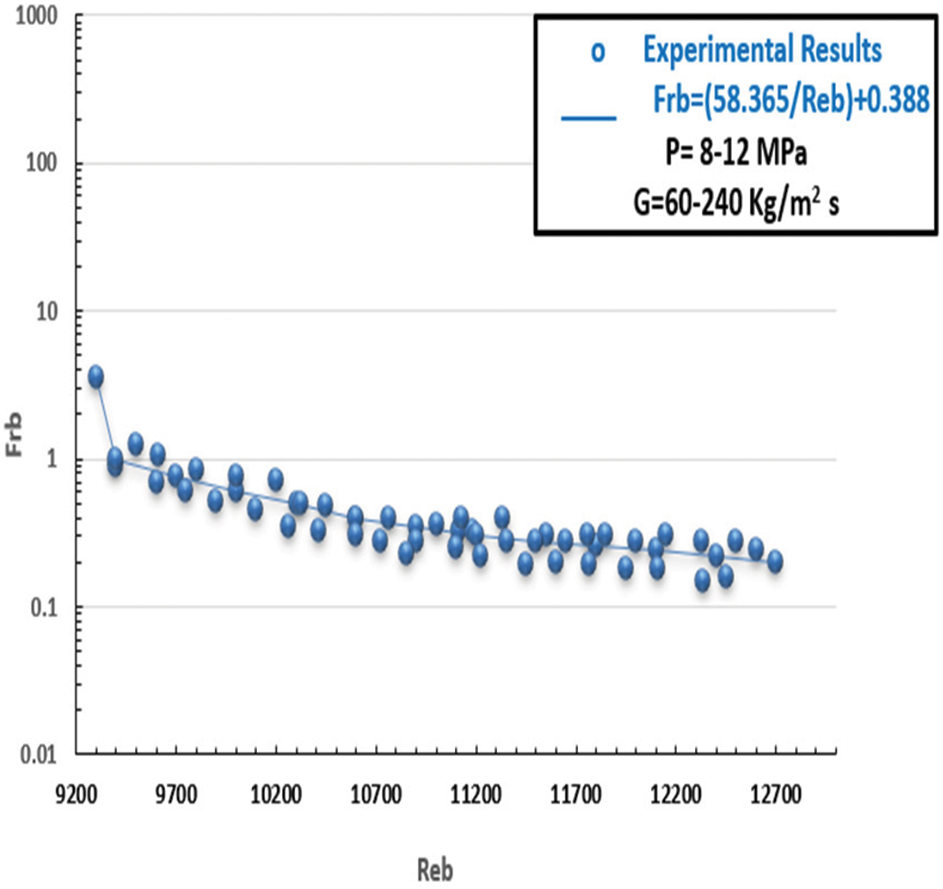
Figure 20: Friction property in case of CO2 at SC pressures in the covered channels (cold scenario): p = 8–12 MPa, G = 60–240 kg/m2
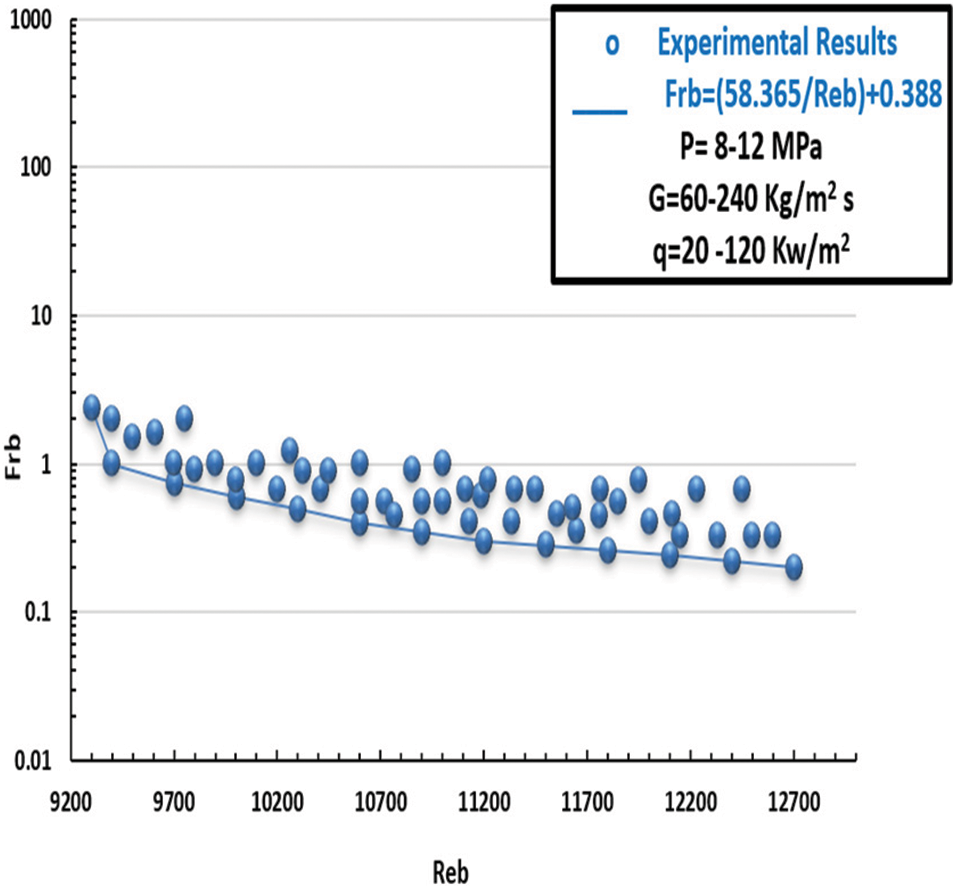
Figure 21: Friction property in case of CO2 at SC pressures in the covered channels (Heated scenario) p = 8–12 MPa, G = 60–240 kg/m2 s, q = 20–120 kW/m2
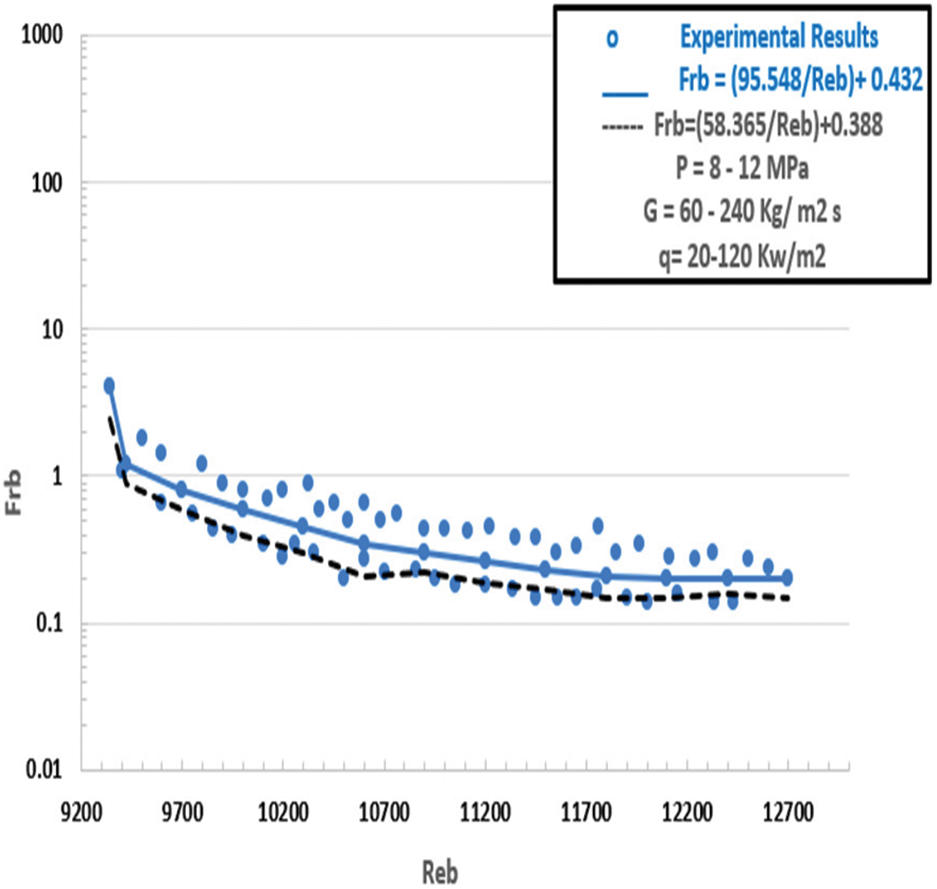
Figure 22: Case CO2 scenario, the friction property (Heated scenario), and at SC pressure: p = 8–12 MPa, G = 60–240 kg/m2 s, q = 20–120 kW/m2
The values of Reb was given as:
In this work, Reb considers the impacts of differential mass and viscidity, where ρw and μw signify the mean of mass and viscosity. Noting that the inside heat of the wall and P controls these parameters. In the same context, ρf and μf denote density and viscidity to the main of the inside and outside heat degrees and P (n = 4.63, m = 2.33) for inflow. As seen in Fig. 21 beside Eq. (12), it predicts the friction factor substantially better than Eq. (11).
3.6 Correlation of the Experimental
Based on several experimental runs, the relationships were determined for forced convection HT of SC-CO2 in a tiny pipe.
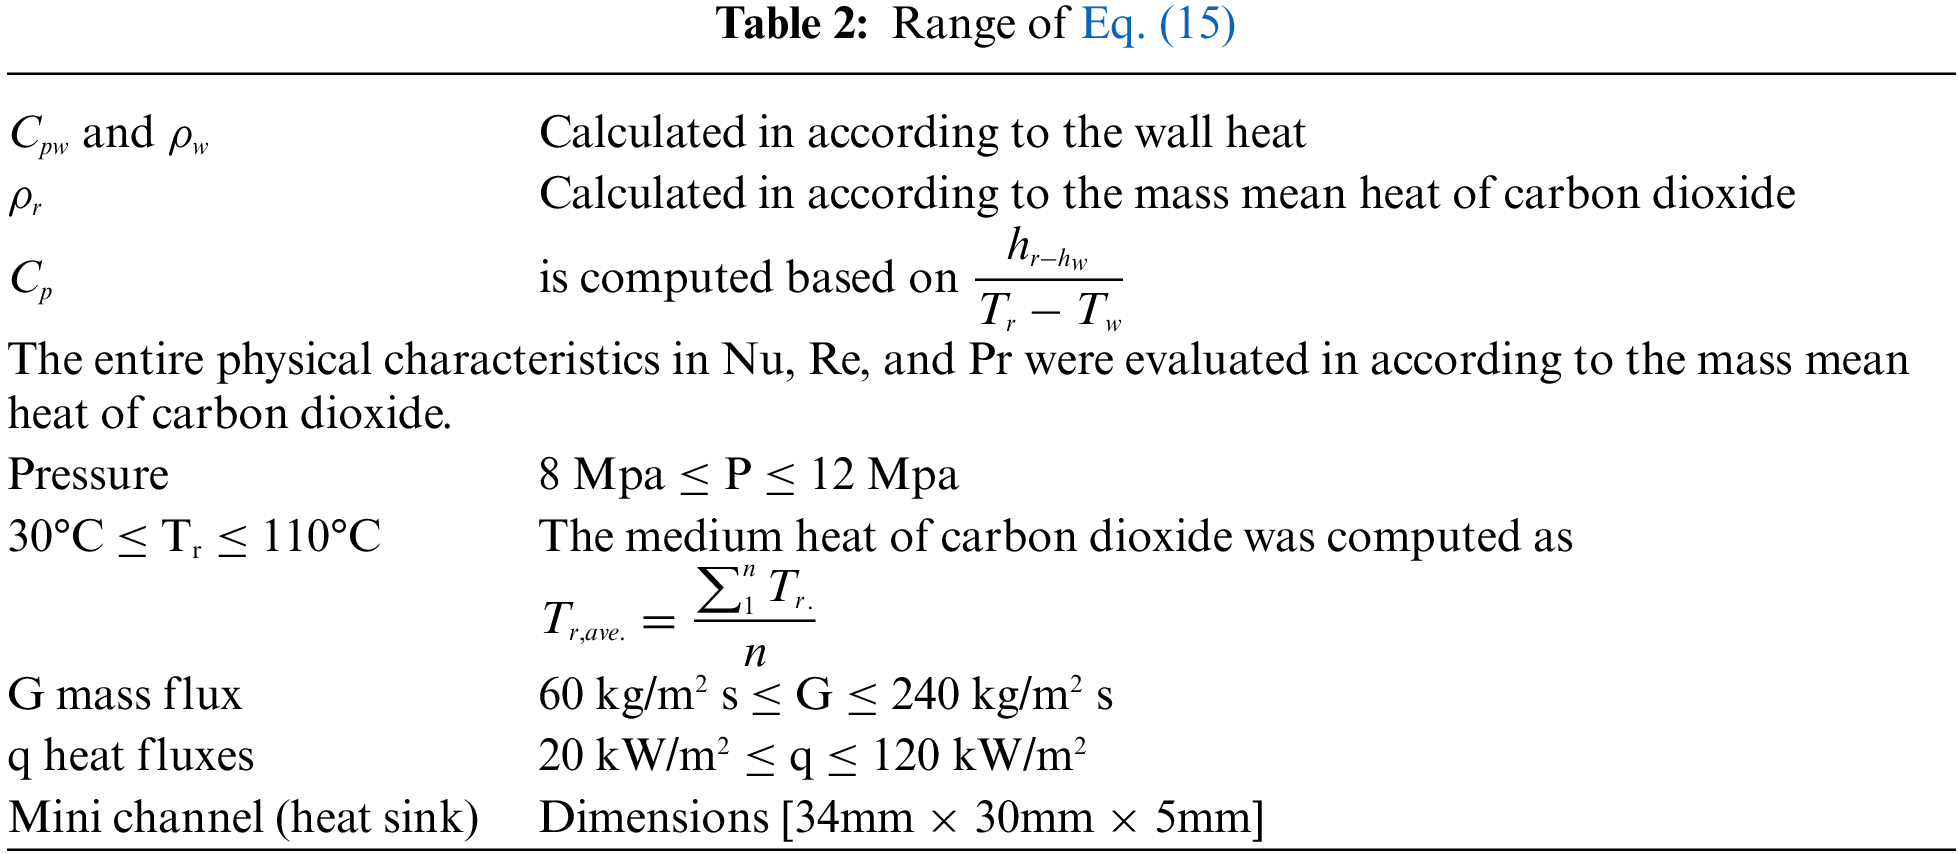
The range of adopted Eq. (15) can be illustrated in Table 2.
3.7 Comparison between Two Scenarios, Eq. (14) with the Correlations in the Literature and Verification
Fig. 23 below compares the values of Nusselt based on expression 15 to those obtained during the experiment for more precise measurement. It is understood that the new expressions can provide accurate Nusselt value estimates. Reb examines the effects of differential mass and viscidity in this paper, where w and w denote the mass and viscidity averages governed by the wall’s internal fundamental temperatures and pressures. Additionally, f and f represent the density and viscosity governed by the pressures and heat points at the inside and exterior, respectively. Eq. (12) and Fig. 21 next to each other show how much better Eq. (15) forecasts the friction factor. Due to the influence of buoyancy and various thermo-physical features, the inflow impedance for the inflow depressed value is more significant in this context than that of the upward inflow direction. With P = 9 MPa and G = 180 kg/m2 s as the working conditions, Fig. 24 compares Nusselt values produced using Eq. (14) with those computed using the relationships described in [R. N. Xu, Ameer Abed, and Robin Lioger]. Finally, the Nusselt number was measured based on the three expressions to be more accurate. In comparison between the two scenarios, Fig. 25 shows the effect of characteristics on the HT coefficient of the first and second models. At the same time, in this section, it can be noted in the figure that the comparison between the first model (Serpentine tube) and the second (helically tube) in terms of the value of the Nusselt number. It can be seen that the more significant the increase in surface area, the greater the increase in the HT factor and, consequently, the higher the Nusselt number recorded.
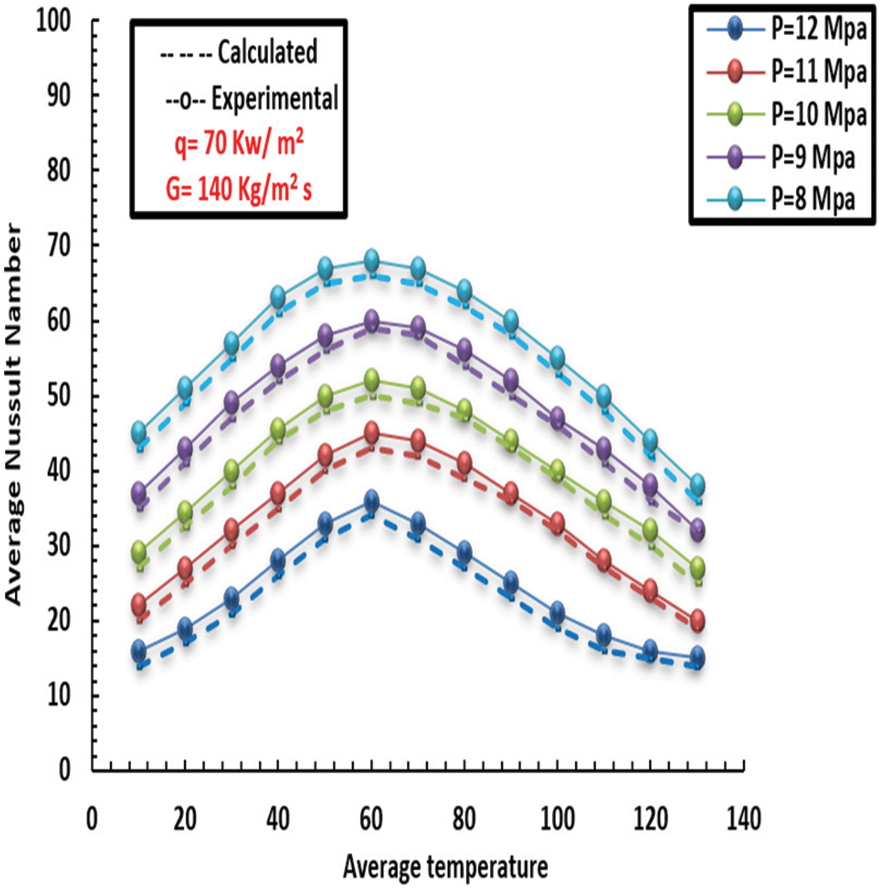
Figure 23: Comparison of Eq. (14) and the experimental Nusselt number
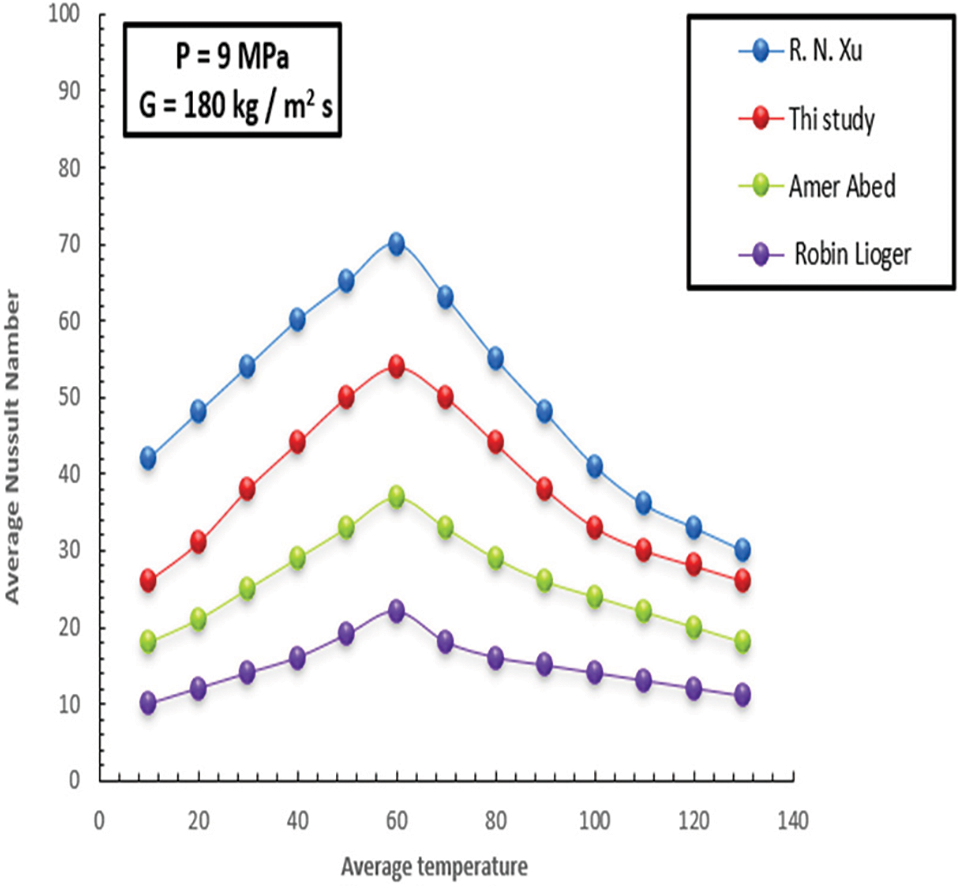
Figure 24: Comparison of Eq. (14) the correlations in the literature
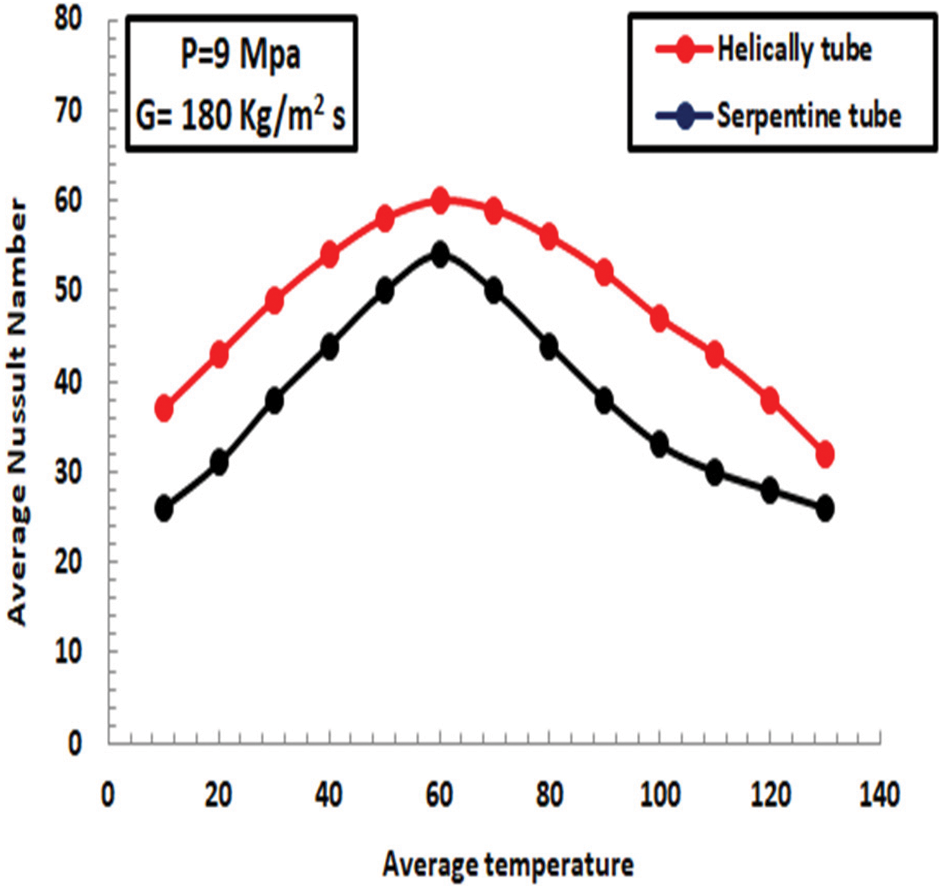
Figure 25: Comparison between two scenarios
Comparison based on experimental examination between the HT performance of SC-CO2 in a vertical, tiny circular pipe and a helical tube at different mass fluxes, heat fluxes, and pressures introduced in this study.
1. The major findings can be summarized in the next paragraph: The experiments demonstrate outstanding variation in HT factors in the presence of HF in two tiny channels.
2. The flotation provided a significant function in HT at low MFs. According to experimental circumstances, the HT factors decrease with the increment of HF, and pressure increases with the increase of MF. Under low HF circumstances, the HT factor decreased dramatically as pressure increased. In high-HF cases, however, the variations in HT properties between pressures were quite minor.
3. Apart from a specific HT behaviour at low MF, which differs from the situations at moderate and high MFs, a special HT behaviour at low MF is found.
4. An empirical investigation of the HT factors of SC-CO2 in a confined flow with dimensions of 2 mm at various MFs, pressures, and HFs is introduced, followed by the development of novel HT.
Acknowledgement: We would like to express our sincere gratitude to University of Technology that have support this work.
Funding Statement: The authors received no specific funding for this study.
Author Contributions: Study conception and design: Huda Adel Hassan Ali, Ameer Abed Jaddoa and Jafaar Mohamme Daif; data collection: Huda Adel Hassan Ali, Ameer Abed Jaddoa and JafaarMohamme Daif; analysis and interpretation of results: Huda Adel Hassan Ali, Ameer Abed Jaddoa and Jafaar Mohamme Daif; draft manuscript preparation: Huda Adel Hassan Ali, Ameer Abed Jaddoa and JafaarMohamme Daif. All authors reviewed the results and approved the final version of the manuscript.
Availability of Data and Materials: All the data required to establish this work is available in the manuscript.
Conflicts of Interest: The authors declare that they have no conflicts of interest to report regarding the present study.
References
1. Huai, X., Koyama, S. (2007). Heat transfer characteristics of supercritical CO2 flow in small-channeled structures. Experimental Heat Transfer, 20(1), 19–33. [Google Scholar]
2. Huaia, X. L., Koyama, S., Zhao, T. S. (2005). An experimental study of flow and heat transfer of supercritical carbon dioxide in multi-port mini channels under cooling conditions. Chemical Engineering Science, 60(12), 3337–3345. [Google Scholar]
3. Petukhov, B. S. (1970). Heat transfer and friction in turbulent pipe flow with variable physical properties. Advances in Heat Transfer, 6(2), 504–564. [Google Scholar]
4. Hall, W. B. (1971). Heat transfer near the critical point. Advances in Heat Transfer, 7(1), 1–86. [Google Scholar]
5. Jaddoa, A. A. (2022). Experimental investigation of supercritical fluid heat transfer properties in a miniature heat sink. Journal of Mechanical Engineering, 19(2), 41–63. [Google Scholar]
6. Polyakov, A. F. (1991). Heat transfer under supercritical pressures. Advances in Heat Transfer, 21(8), 1–53. [Google Scholar]
7. Afshin, J. G., Asadi, A. (2012). Improved forced convective heat transfer correlations for liquids in the near-critical region. AIAA Journal, 24, 2030–2037. [Google Scholar]
8. Pitla, S., Groll, S., Eckhard, A., Ramadhyani, S., Afshin, J. G. et al. (2000). Improved forced convective heat transfer correlations for liquids in the near-critical region. Proceedings 4th IIRGustav Lorentzen Conference Natural Working Fluids, pp. 259–267. Purdue University. [Google Scholar]
9. Liao, S. M., Zhao, T. S. (2002). Measurements of heat transfer coefficients from supercritical carbon dioxide flowing in horizontal mini/micro channels. Journal of Heat Transfer, 124(3), 413–419. [Google Scholar]
10. Jaddoa, A. A. (2023). Experimental investigation of heat transfer of supercritical fluid flowing in a tube with twisted tape. Jurnal Teknologi, 85(2), 69–82. [Google Scholar]
11. Gnielinski, V. (1976). New equations for heat and mass transfer in turbulent pipe and channel flow. International Chemical Engineering, 16, 359–367. [Google Scholar]
12. Petrov, N. E., Popov, V. N. (1985). Heat transfer and resistance of carbon dioxide cooled in the supercritical region. Thermal Engineering, 32, 131–134. [Google Scholar]
13. Acosta, R., Muller, R., Tobias, C. (1985). Transport processes in narrow (capillary) channels. AIChE Journal, 31(3), 473–482. [Google Scholar]
14. Pettersen, J., Rieberer, R., Munkejord, S. T. (2000). Heat transfer and pressure drop characteristics of supercritical carbon dioxide in microchannel tubes. 4th IIR Gustav Lorentzen Conference on Natural Working Fluids, Purdue University, USA. https://www.researchgate.net/publication/238695324 [Google Scholar]
15. Jaddoa, A. A. (2021). Convection heat transfer analysis with flow resistance for mini-helically coiled tubes at supercritical pressures experimentally. International Journal of Heat and Technology, 39(3), 817–824. [Google Scholar]
16. Xu, R. N., Luo, F., Jiang, P. X. (2015). Experimental research on the turbulent convection heat transfer of supercritical pressure CO2 in a serpentine vertical mini tube. International Journal of Heat and Mass Transfer, 91(1–3), 552–561. [Google Scholar]
17. Dang, C., Hihara, E. (2004). In-tube cooling of supercritical carbon dioxide. Part 1. Experimental measurement. International Journal of Refrigeration, 27(7), 736–747. [Google Scholar]
18. Mitra, I., Ghosh, I. (2020). Mini-channel heat sink parameter sensitivity based on precise heat flux redistribution. Thermal Science and Engineering Progress, 4(6), 1–11. [Google Scholar]
19. Makam, J. S., Totla, N. B. (2020). Heat transfer characteristics of water cooled minichannel heat sink using different fluid flow geometries. IOP Conference Series: Materials Science and Engineering, 998, 012018. https://doi.org/10.1088/1757-899X/998/1/012018 [Google Scholar] [CrossRef]
20. Lei, Y. C., Xu, B., Chen, Z. Q. (2021). Experimental investigation on cooling heat transfer and buoyancy effect of supercritical carbon dioxide in horizontal and vertical micro-channels. International Journal of Heat and Mass Transfer, 181, 121792. [Google Scholar]
21. Jajja, S. A., Zada, K. R., Fronk, B. M. (2019). Experimental investigation of supercritical carbon dioxide in horizontal microchannels with non-uniform heat flux boundary conditions. International Journal of Heat and Mass Transfer, 130(6), 304–319. [Google Scholar]
22. Wang, L., Huang, X. Y., Wang, D. Y. (2020). Solubility and diffusion coefficient of supercritical CO2 in polystyrene dynamic melt. Journal e-Polymers, 20(1), 659–672. [Google Scholar]
23. Duarte, A. R. C., Coimbra, P., de Sousa, H. C., Catarina, M. M. D. (2004). Solubility of flurbiprofen in supercritical carbon dioxide. Journal of Chemical & Engineering Data, 49(3), 449–452. [Google Scholar]
24. Cao, X., Liu, H. L., Shao, X. D., Shi, H. B. (2022). Experimental and numerical investigation on the heat transfer enhancement for mini-channel heat sinks with tessellated fins. Applied Thermal Engineering, 211(5), 118353. [Google Scholar]
25. Vermaak, M., Potgieter, J., Dirker, J., Moghim, M. A., Valluri, P. et al. (2020). Experimental and numerical investigation of micro/mini channel flow-boiling heat transfer with non-uniform circumferential heat fluxes at different rotational orientations. International Journal of Heat and Mass Transfer, 158(8), 119948. [Google Scholar]
26. Jiang, J. W., Liang, S. Q., Xu, X., Chen, B. Z., Shen, Z. X. et al. (2023). Experimental research on a new mini-channel transcritical CO2 heat pump gas cooler. Micromachines, 14(5), 1094. [Google Scholar] [PubMed]
27. Ünverdi, M., Kücük, H., Yılmaz, M. S. (2019). Experimental investigation of heat transfer and pressure drop in a mini-channel shell and tube heat exchanger. Heat and Mass Transfer, 55(5), 1271–1286. [Google Scholar]
28. Liu, S. T., Jiao, Y. G., Gao, B., Liu, B. (2020). Experimental and numerical study of two-phase flow in a rectangular mini-channel with sudden expansion structure. Journal of Enhanced Heat Transfer, 27(2), 173–194. [Google Scholar]
29. Etminan, A., Muzychka, Y. S., Pope, K. (2023). Experimental and numerical analysis of heat transfer and flow phenomena in Taylor flow through a straight mini-channel. Journal of Heat Mass Transfer, 145(8), 081801. [Google Scholar]
30. Lioger-Arago, R., Coste, P., Caney, N. (2022). Experimental and numerical study of boiling HFE7100 in a vertical mini-channel. Journal of Fluid Flow, Heat and Mass Transfer, 2(9), 92–100. [Google Scholar]
Cite This Article
 Copyright © 2023 The Author(s). Published by Tech Science Press.
This work is licensed under a Creative Commons Attribution 4.0 International License , which permits unrestricted use, distribution, and reproduction in any medium, provided the original work is properly cited.
 Downloads
 Citation Tools