
 Submit a Paper
 Propose a Special lssue
 Open Access
ARTICLE
Numerical Calculation of Transient Thermal Characteristics of Nozzle Flowmeter
1
College of Mechanical Engineering, Quzhou University, Quzhou, 324000, China
2
College of Mechanical Engineering, Zhejiang University of Technology, Hangzhou, 310023, China
3
Zhejiang Zhigao Machinery Co., Ltd., Quzhou, 324024, China
* Corresponding Author: Yuliang Zhang. Email:
Frontiers in Heat and Mass Transfer 2023, 21, 245-264. https://doi.org/10.32604/fhmt.2023.041778
Received 05 May 2023; Accepted 07 July 2023; Issue published 30 November 2023
 View Full Text
 Download PDF
Abstract
This article aims to reveal the transient thermal characteristics of the solid domain in a nozzle flowmeter when measuring fluids of varying temperatures. Based on finite element method, the transient numerical calculation of the thermal characteristics of each component of the nozzle flowmeter has been conducted. The research shows that: as the fluid passes through the flowmeter, the high heat flux area inside the nozzle flowmeter gradually transfer from the center of the nozzle to the inlet and outlet, as well as the pressure tapping points upstream and downstream; High thermal stress zones are present near the upstream and downstream pressure tapping points and inlet and outlet area; High thermal deformation zones occur near the upstream and downstream pressure tapping points and eight slot nozzle.Keywords
Nomenclature
| Fluid velocity component in the direction of the coordinate. | |
| Fluid pressure. | |
| Flow time. | |
| Coordinate component. | |
| Volume force. | |
| Viscous stress tensor in the i-direction. | |
| Heat flow density, J/(m2·s). | |
| Thermal conductivity, W/(m·K). | |
| Temperature gradient at a point within the medium. |
Flow measurement is necessary in engineering field for fluid metrology and process control [1,2]. Different types of flowmeters are suitable for different industrial productions to address flow detection problems in various flow states. In recent years, many scholars have conducted extensive research on the internal flow and external characteristics of various types of steam flowmeters. Singh et al. investigated the effect of cone vertex angle and upstream swirl on the performance of cone flowmeter, and found that the value of discharge coefficient is independent of Reynolds number and its value decreases with increase in vertex angle. In the presence of upstream disturbance in the form of swirl, the value of discharge coefficient is also independent of Reynolds number and its value is only marginally affected by the magnitude of swirl [3]. Nasiruddin et al. studied the effect of vertex angle and vertex tip radius on the performance of a V-cone flowmeter [4]. Prabu et al. investigated the impact of different upstream pipe fittings on the performance of conical flowmeters and orifice flowmeters through experiments, and found that the conical flowmeter has lower sensitivity to turbulence and an irrecoverable pressure drop 50% smaller than that of the orifice flowmeter [5]. Guo et al. discovered that viscosity affects the pressure distribution on the rotor blades, which in turn affects the performance of the turbine flowmeter [6]. Guo et al. studied the effect of different blade shapes on the measurement performance of the turbine flowmeter using CFD simulation [7]. Huang et al. studied the characteristics of outward vibration transmission caused by wall-mounted state in a Coriolis flowmeter through harmonic response analysis [8]. Shavrina et al. found that the increase in the gas volume fraction and the reduction in the mixture flow rate lead to the increase in the gas distribution asymmetry. The strong correlation between the gas distribution asymmetry and the experimentally observed CFM error is demonstrated [9]. Costa et al. developed a model that explains how Coriolis meters need to be corrected for temperature effects from room temperature down to cryogenic temperature [10]. Enz studied the effect of asymmetric actuator and detector position on Coriolis flowmeter and measured phase shift [11]. Perumal et al. studied the effects of diameter, diameter ratio, and convergence angle on the performance of Venturi meters in measuring humid air by CFD modeling of high-pressure wet air flow [12]. Huang et al. studied the discharge coefficient of a new type of porous orifice flowmeter. It was found that the pressure drop of the porous orifice plate is lower than that of the standard orifice plate, and the flow field is more stable. The outflow coefficient of the porous orifice plate is 22.5%~25.6% higher than that of the standard orifice plate. In addition, the critical Reynolds number of the porous orifice plate is lower, and it defends interference more powerfully [13]. Muñoz-Díaz et al. proposed a dual parabolic-shaped orifice plate. Numerical simulation experiments were conducted using both Newtonian and non-Newtonian fluids, and the results demonstrated that the improved dual parabolic-shaped orifice plate exhibited superior performance compared to the standard orifice plate [14]. Venugopal et al. studied the influence of valve and vortex on the frequency of vortex shedding in vortex flowmeter and analyzed the influence of vortex structure on measurement under disturbed flow [15]. Končar et al. conducted experiments and numerical simulations on vortex flowmeters and demonstrated a clear linear dependence of the shedding frequency on the volumetric flow rate over the entire range of Reynolds numbers. In addition, numerical simulations were used to study the main mechanisms of vortex formation and shedding behind the considered bluff body [16]. Shah et al. conducted a detailed analysis of the flow characteristics of orifice flowmeters through numerical simulation and investigated the variations of turbulent kinetic energy and turbulent dissipation rate in different area of the orifice plate flowmeter [17]. Chen et al. found that the cone angle directly affects the measurement performance of the swirl flow meter by analyzing the velocity and pressure distribution of the swirl flow meter at different flow rates and different cone angles [18]. Chen et al. investigated the internal flow characteristics and the influence of the tube structure (geometric parameter of flow passage) on metrological performance were studied, with a particular focus on the meter factor. Calibration experiments were performed to validate the CFD predictions; the results show good agreement with those from simulations [19]. Zhang et al. studied the metrological performance and internal unsteady flow of a swirl meter assembled with three swirlers with different helix angles through physical experiments and numerical calculations. The results indicate that a larger helix angle can significantly reduce the pressure and flow losses of the swirl meter [20,21]. Alaeddin et al. studied the effect of circumferential position of transducers on calibration factor for special type of ultrasonic flowmeters, UCCF, at different Reynolds numbers and various locations of flowmeter for the first time, and the effects of Reynolds numbers and the flowmeter distances from the elbow on the calibration factor were analysed [22]. Zhang et al. proposed a correction factor for theoretical flowrate considering the real velocity profile were proposed for laminar and turbulent flow, obtaining a higher accuracy [23].
The orifice plate flowmeter is one of the most widely used steam flowmeters, but its drawbacks include low measurement accuracy and small measurement range [24]. Due to the high temperature of the medium inside the pipeline, the steam nozzle flowmeter has unique advantages in the detection of high temperature and high pressure fluids. Moreover, the nozzle flowmeter can overcome the problems associated with standard orifice plate flowmeters in measurement. Therefore, it has been increasingly used in practical applications [25]. Wang et al. achieved the optimization of the pressure tapping position by numerical simulation of a 65 mm nozzle flowmeter [26]. Oh et al. proposed a new type of multi-nozzle air flow meter, which has the advantages of small size, simple operation, and low measurement error [27]. Zhang et al. found that there is a significant temperature stratification near the inner wall when the small-sized nozzle flowmeter is used to transport high-temperature medium, and the thermal flow field at the inlet and outlet of the flowmeter will increase accordingly with the temperature increases [28]. Tong et al. found that the pressure distribution in the fluid domain, the dynamic stress, and fluid-induced vibration deformation generated by the fluid of the nozzle flowmeter are less affected by inner wall temperature [29]. In recent years, CFD has been widely used for flow prediction and performance simulation of various flow meters due to its efficiency and accuracy [30]. The research methodology of this study is similar to that of Chen et al. [19], and the results have good reliability.
There are only studies on the thermal characteristics of nozzle flow meters for stable conditions [28,29], there are no studies on transient conditions. In order to reveal the transient thermal characteristics of the nozzle flowmeter at different temperatures, transient numerical calculations were performed under various temperature conditions.
2 Calculation Models and Methods
The internal flow of fluid machinery can be described by the basic physical Conservation law, and there are three corresponding governing equations: continuity equation, momentum equation and energy equation.
The continuity equation is used as a manifestation of the law of conservation of mass in fluid mechanics and can be written as the following equation:
where:
The momentum equation, also known as the Navier Stokes (N-S) equation, is the specific expression of the conservation of momentum and the expression of Newton's second law, which can be written as follows:
The fluid pressure is
The energy equation is the specific form of the Conservation of energy, so this paper uses the energy equation widely used in CFX to establish the total specific enthalpy
Thermal analysis of flowmeters requires a study of the way heat is transferred in the meter. There are three modes of heat transfer: heat conduction, heat convection and heat radiation. At present, heat conduction models are mainly used to solve thermodynamic problems:
where:
This article is a numerical simulation of the flow field and thermal effects of nozzle flowmeter under different inner wall temperatures. As the solid structure of the nozzle flowmeter is less influenced by fluid forces and considering the computational efficiency, the one way fluid-solid coupling method is chosen in this paper. The computational fluid dynamics software FLUENT is used to calculate the flow field inside the flowmeter and the standard k-ε turbulence model is used to enclose the average Reynolds equation. The medium is air, the inlet boundary condition is velocity inlet and the outlet is free flow, the extension of the outlet section ensures the full development of the fluid at the outlet. The coupling calculation of velocity and pressure is implemented by SIMPLEC algorithm. All solid walls are set to standard wall boundary conditions, the wall roughness is set to smooth wall and the function near the wall is standard wall function. The solid field is simulated numerically using the finite element analysis software ANSYS Work-bench.
The structure and cross-sectional view of the nozzle flowmeter are shown in Fig. 1. The measuring tube has an inlet diameter of 213 mm, an overall diameter of 358 mm, and an outlet diameter of223 mm. Additionally, there are several upstream and downstream pressure outlets with a diameter of 27 mm, which are uniformly distributed around the measuring tube’s circumference. The material of the measuring tube is 12 CrMoVG.

Figure 1: General structure diagram
2.5 Computational Domain and Grid
This study utilized ANSYS Workbench, a solid field finite element analysis software, to conduct numerical simulations of the nozzle flowmeter. The calculation domain of the solid structure of the nozzle flowmeter is depicted in Fig. 2.

Figure 2: Schematic diagram of the solid structure domain
The present study utilized the ICEM software to perform the meshing of the solid structural domain of the nozzle flowmeter(as shown in Fig. 3). Unstructured tetrahedral grids with good adaptability are used for complex computational domains such as the front measuring tube, eight slot nozzle,rear measuring tube and weld metal watershed.

Figure 3: Solid field structured domain grid
The grid independence study was conducted on the number of different grids in the range of 48.18 × 10⁴ to 182.9 × 10⁴. Fig. 4 shows the relationship between the pressure loss of the nozzle flowmeter and the pressure difference between the upstream and downstream pressure tapping points. It can be found from the figure that the measurement characteristics of the nozzle flowmeter are basically stable when the grid number exceeds 159.04 × 10⁴. Considering computational efficiency and accuracy, the final grid number was determined to be 159.04 × 10⁴.

Figure 4: Grid independence verification results
A numerical calculation of the transient heat effect of a solid structure in a nozzle flowmeter was conducted at five different inner wall temperatures of 50°C, 100°C, 300°C, 500°C, and 700°C. Comparative analysis was performed on the spatial distribution and temporal variation of various physical quantities at the cross section of the nozzle flowmeter under different inner wall temperatures.
Fig. 5 shows the transient heat flow distribution of the cross section of the flow meter at 50°C on the inner wall. When the outer wall temperature remains constant at 20°C and the inner wall temperature is 50°C, the high heat flux area within the nozzle flow meter is transferred from the interior to the inlet and outlet and the upstream and downstream pressure tapping points as the heat transfer effect develops. The high heat flux area inside the eight slot nozzle gradually decreases. At t = 0 s, there exists a large area of high heat flux inside the nozzle flowmeter, with a value of 2 W/mm2. At t = 0.5 s, the area of high heat flux area on the inner wall of the flowmeter nozzle gradually decreases, and the heat flux value inside the eight slot nozzle also decreases gradually. During the period of t = 1.0 to t = 2.5 s, the thermal flux values around the pressure tapping points upstream and downstream decrease to 0.6 W/mm2, and the area of low-thermal-flux area gradually exceeds that of high-thermal-flux area. At t = 2.5 s, the high heat flux area mainly concentrates at the pressure tapping points upstream and downstream as well as the inlet and outlet with a value of 0.8 W/mm2.

Figure 5: Transient heat flow distribution in the flowmeter cross-section at 50°C on the inner wall surface
Fig. 6 shows the transient heat flow distribution of the cross section of the flowmeter at 100°C on the inner wall. When the outer wall temperature remains constant at 20°C and the inner wall temperature is 100°C, the high heat flux area within the nozzle flowmeter is transferred from the interior to the inlet and outlet and the upstream and downstream pressure tapping points as the heat transfer effect develops. The high heat flux area inside the eight slot nozzle gradually decreases. At t = 0 s, there exists a large area of high heat flux inside the nozzle flowmeter, with a value of 4.2 W/mm2. At t = 0.5 s, the area of high heat flux area on the inner wall of the flowmeter nozzle gradually decreases, and the heat flux value inside the eight slot nozzle also decreases gradually. During the period of t = 1.0 to t = 2.5 s, the thermal flux values around the pressure tapping points upstream and downstream decrease to 1.2 W/mm2, and the area of low-thermal-flux area gradually exceeds that of high-thermal-flux area. At t = 2.5 s, the high heat flux area mainly concentrates at the pressure tapping points upstream and downstream as well as the inlet and outlet with a value of 1.4 W/mm2.

Figure 6: Transient heat flow distribution in the flowmeter cross-section at 100°C on the inner wall surface
Fig. 7 shows the transient heat flow distribution of the cross section of the flowmeter at 300°C on the inner wall. When the outer wall temperature remains constant at 20°C and the inner wall temperature is 300°C, the high heat flux area within the nozzle flowmeter is transferred from the interior to the inlet and outlet and the upstream and downstream pressure tapping points as the heat transfer effect develops. The high heat flux area inside the eight slot nozzle gradually decreases. At t = 0 s, there exists a large area of high heat flux inside the nozzle flowmeter, with a value of 15 W/mm2. At t = 0.5 s, the area of high heat flux area on the inner wall of the flowmeter nozzle gradually decreases, and the heat flux value inside the eight slot nozzle also decreases gradually. During the period of t = 1.0 to t = 2.5 s, the thermal flux values around the pressure tapping points upstream and downstream decrease to 4 W/mm2, and the area of low-thermal-flux area gradually exceeds that of high-thermal-flux area. At t = 2.5 s, the high heat flux area mainly concentrates at the pressure tapping points upstream and downstream as well as the inlet and outlet with a value of 6 W/mm2.

Figure 7: Transient heat flow distribution in the flowmeter cross-section at 300°C on the inner wall surface
Fig. 8 shows the transient heat flow distribution of the cross section of the flowmeter at 500°C on the inner wall. When the outer wall temperature remains constant at 20°C and the inner wall temperature is 500°C, the high heat flux area within the nozzle flowmeter is transferred from the interior to the inlet and outlet and the upstream and downstream pressure tapping points as the heat transfer effect develops. The high heat flux area inside the eight slot nozzle gradually decreases. At t = 0 s, there exists a large area of high heat flux inside the nozzle flowmeter, with a value of 26 W/mm2. At t = 0.5 s, the area of high heat flux area on the inner wall of the flowmeter nozzle gradually decreases, and the heat flux value inside the eight slot nozzle also decreases gradually. During the period of t = 1.0 to t = 2.5 s, the thermal flux values around the pressure tapping points upstream and downstream decrease to 8 W/mm2, and the area of low-thermal-flux area gradually exceeds that of high-thermal-flux area. At t = 2.5 s, the high heat flux area mainly concentrates at the pressure tapping points upstream and downstream as well as the inlet and outlet with a value of 10 W/mm2.

Figure 8: Transient heat flow distribution in the flowmeter cross-section at 500°C on the inner wall surface
Fig. 9 shows the transient heat flow distribution of the cross section of the flowmeter at 700°C on the inner wall. When the outer wall temperature remains constant at 20°C and the inner wall temperature is 700°C, the high heat flux area within the nozzle flowmeter is transferred from the interior to the inlet and outlet and the upstream and downstream pressure tapping points as the heat transfer effect develops. The high heat flux area inside the eight slot nozzle gradually decreases. At t = 0 s, there exists a large area of high heat flux inside the nozzle flowmeter, with a value of 36 W/mm2. At t = 0.5 s, the area of high heat flux area on the inner wall of the flowmeter nozzle gradually decreases, and the heat flux value inside the eight slot nozzle also decreases gradually. During the period of t = 1.0 to t = 2.5 s, the thermal flux values around the pressure tapping points upstream and downstream decrease to 12 W/mm2, and the area of low-thermal-flux area gradually exceeds that of high thermal flux area. At t = 2.5 s, the high heat flux area mainly concentrates at the pressure tapping points upstream and downstream as well as the inlet and outlet with a value of 14 W/mm2.
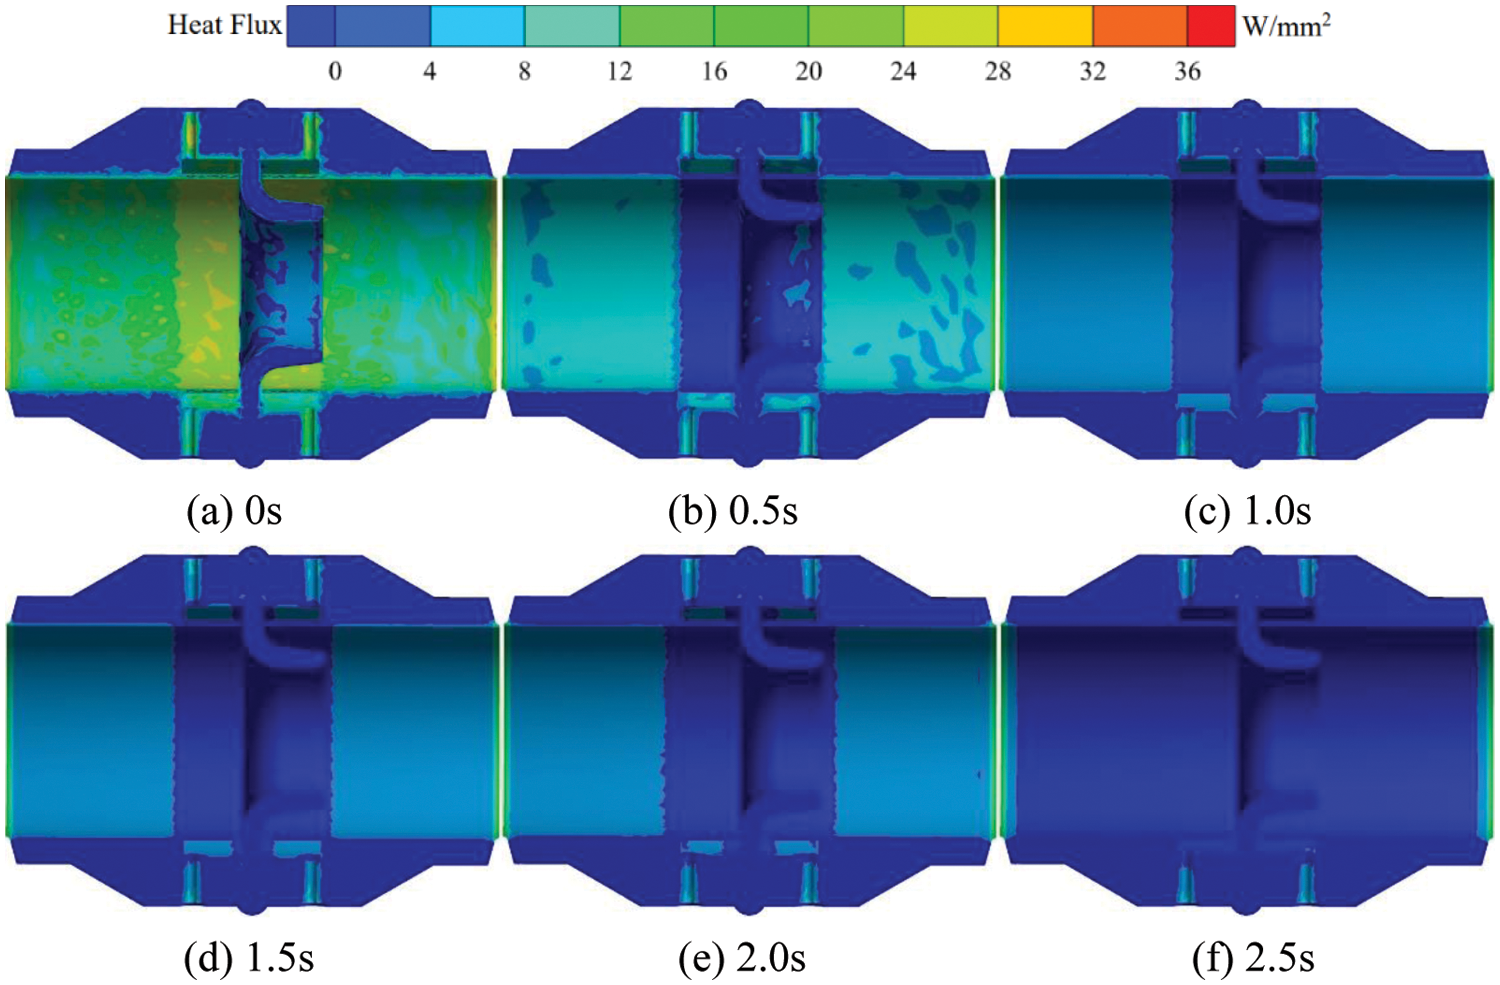
Figure 9: Transient heat flow distribution in the flow meter cross-section at 700°C on the inner wall surface
Fig. 10 shows the transient thermal stress distribution in the flow meter cross-section at 50°C on the inner wall surface. When the outer wall temperature remains constant at 20°C and the internal wall temperature is 50°C, the high thermal stress area inside the nozzle flow meter mainly concentrates near the upstream and downstream pressure tapping points and the inlet and outlet of the flow meter. With the gradual flow of fluid through the flow meter, the high thermal stress area around the pressure tapping points of the flow meter gradually increases, and its thermal stress value also gradually increases. At t = 0 s, the high thermal stress area inside the nozzle flowmeter is relatively small, with a maximum thermal stress value of 44 Pa. At t = 0.5 s, the high thermal stress area of the inner wall of the nozzle flow meter gradually increases, and the thermal stress value near the upstream and downstream pressure tapping points increases more significantly. During the period from t = 1.0 to t = 2.0 s, the thermal stress value around the upstream and downstream pressure tapping points is154 Pa. The high thermal stress area at t = 2.5 s is mainly concentrated at the upstream and downstream pressure tapping points and at the inlet and outlet with a value of 220 Pa.
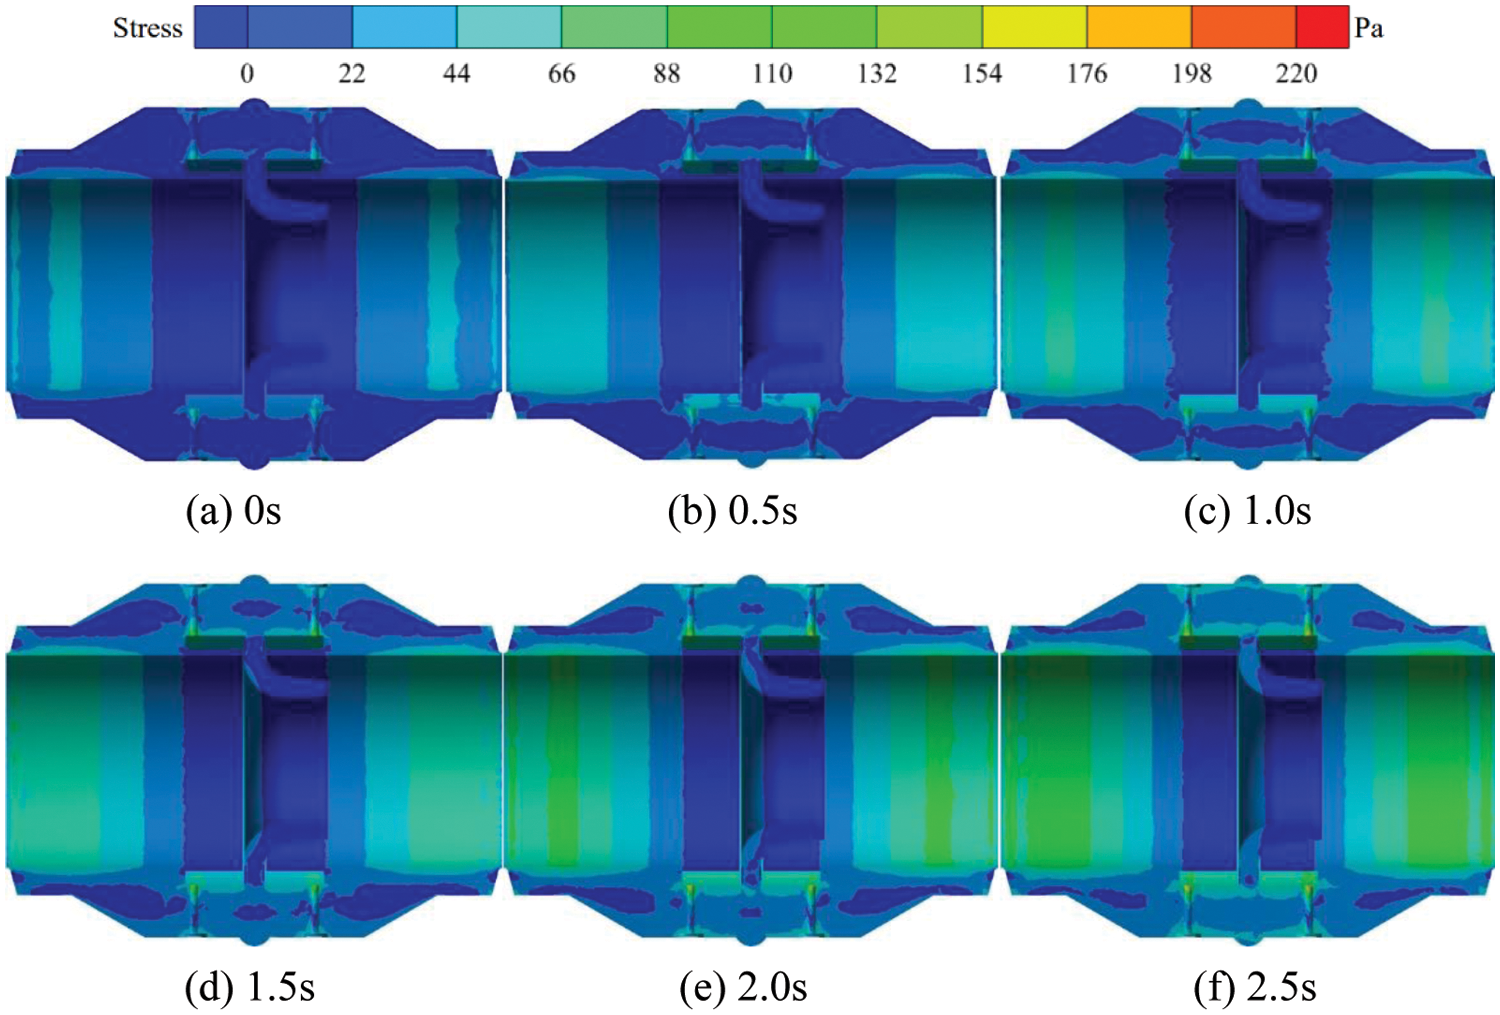
Figure 10: Transient thermal stress distribution in the flowmeter cross-section at 50°C on the inner wall surface
Fig. 11 shows the transient thermal stress distribution in the flowmeter cross-section at 100°C on the inner wall surface. When the outer wall temperature remains constant at 20°C and the internal wall temperature is 100°C, the high thermal stress area inside the nozzle flowmeter mainly concentrates near the upstream and downstream pressure tapping points and the inlet and outlet of the flowmeter. With the gradual flow of fluid through the flowmeter, the high thermal stress area around the pressure tapping points of the flowmeter gradually increases, and its thermal stress value also gradually increases. At t = 0 s, the high thermal stress area inside the nozzle flowmeter is relatively small, with a maximum thermal stress value of 180 Pa. At t = 0.5 s, the high thermal stress area of the inner wall of the nozzle flowmeter gradually increases, and the thermal stress value near the upstream and downstream pressure tapping points increases more significantly. During the period from t = 1.0 tot = 2.0 s, the thermal stress value around the upstream and downstream pressure tapping points is420 Pa. The high thermal stress area at t = 2.5 s is mainly concentrated at the upstream and downstream pressure tapping points and at the inlet and outlet, with a value of 600 Pa.

Figure 11: Transient thermal stress distribution in the flowmeter cross-section at 100°C on the inner wall surface
Fig. 12 shows the transient thermal stress distribution in the flow meter cross-section at 300°C on the inner wall surface. When the outer wall temperature remains constant at 20°C and the internal wall temperature is 300°C, the high thermal stress area inside the nozzle flow meter mainly concentrates near the upstream and downstream pressure tapping points and the inlet and outlet of the flow meter. With the gradual flow of fluid through the flow meter, the high thermal stress area around the pressure tapping points of the flow meter gradually increases, and its thermal stress value also gradually increases. At t = 0 s, the high thermal stress area inside the nozzle flow meter is relatively small, with a maximum thermal stress value of 600 Pa. At t = 0.5 s, the high thermal stress area of the inner wall of the nozzle flow meter gradually increases, and the thermal stress value near the upstream and downstream pressure tapping points increases more significantly. During the period from t = 1.0 to t = 2.0 s, the thermal stress value around the upstream and downstream pressure tapping points is1540 Pa. The high thermal stress area at t = 2.5 s is mainly concentrated at the upstream and downstream pressure tapping points and at the inlet and outlet, with a value of 2200 Pa.

Figure 12: Transient thermal stress distribution in the flowmeter cross-section at 300°C on the inner wall surface
Fig. 13 shows the transient thermal stress distribution in the flowmeter cross-section at 500°C on the inner wall surface. When the outer wall temperature remains constant at 20°C and the internal wall temperature is 500°C, the high thermal stress area inside the nozzle flowmeter mainly concentrates near the upstream and downstream pressure tapping points and the inlet and outlet of the flowmeter. With the gradual flow of fluid through the flowmeter, the high thermal stress area around the pressure tapping points of the flowmeter gradually increases, and its thermal stress value also gradually increases. At t = 0 s, the high thermal stress area inside the nozzle flowmeter is relatively small, with a maximum thermal stress value of 1100 Pa. At t = 0.5 s, the high thermal stress area of the inner wall of the nozzle flowmeter gradually increases, and the thermal stress value near the upstream and downstream pressure tapping points increases more significantly. During the period from t = 1.0 to t = 2.0 s, the thermal stress value around the upstream and downstream pressure tapping points is2590 Pa. The high thermal stress area at t = 2.5 s is mainly concentrated at the upstream and downstream pressure tapping points and at the inlet and outlet, with a value of 3700 Pa.

Figure 13: Transient thermal stress distribution in the flow meter cross-section at 500°C on the inner wall surface
Fig. 14 shows the transient thermal stress distribution in the flowmeter cross-section at 700°C on the inner wall surface. When the outer wall temperature remains constant at 20°C and the internal wall temperature is 700°C, the high thermal stress area inside the nozzle flowmeter mainly concentrates near the upstream and downstream pressure tapping points and the inlet and outlet of the flowmeter. With the gradual flow of fluid through the flowmeter, the high thermal stress area around the pressure tapping points of the flowmeter gradually increases, and its thermal stress value also gradually increases. At t = 0 s, the high thermal stress area inside the nozzle flowmeter is relatively small, with a maximum thermal stress value of 1560 Pa. At t = 0.5 s, the high thermal stress area of the inner wall of the nozzle flowmeter gradually increases, and the thermal stress value near the upstream and downstream pressure tapping points increases more significantly. During the period from t = 1.0 to t = 2.0 s, the thermal stress value around the upstream and downstream pressure tapping points is3640 Pa. The high thermal stress area at t = 2.5 s is mainly concentrated at the upstream and downstream pressure tapping points and at the inlet and outlet, with a value of 5200 Pa.

Figure 14: Transient thermal stress distribution in the flowmeter cross-section at 700°C on the inner wall surface
Fig. 15 shows the transient thermal deformation distribution of the section in the flowmeter at 50°C on the inner wall. When the outer wall temperature remains constant at 20°C and the inner wall temperature is 50°C, the high thermal deformation area within the nozzle flowmeter is mainly concentrated near the upstream and downstream pressure tapping points and the inlet and outlet of the eight slot nozzle. With the gradual flow of fluid through the flowmeter, the area of high thermal deformation near the pressure tapping points of the flowmeter increases gradually, and its the deformation value also increases gradually. At t = 0 s, the high thermal deformation area inside the nozzle flowmeter is relatively small, and the value of maximum thermal deformation is 0.02 mm. At t = 0.5 s, the area of high thermal deformation on the inner wall of the nozzle flowmeter gradually increases, and the thermal deformation value near the upstream and downstream pressure tapping points increases more significantly. During the period from t = 1.0 to t = 2.0 s, the thermal deformation value near the upstream and downstream pressure tapping points is 0.05 mm. At t = 2.5 s, the high thermal deformation area mainly concentrates near the upstream and downstream pressure tapping points and the inlet and outlet, and its value is 0.06 mm.

Figure 15: Transient heat deformation distribution of the flowmeter cross-section at 50°C on the inner wall surface
Fig. 16 shows the transient thermal deformation distribution of the section in the flowmeter at 100°C on the inner wall. When the outer wall temperature remains constant at 20°C and the inner wall temperature is 100°C, the high thermal deformation area within the nozzle flowmeter is mainly concentrated near the upstream and downstream pressure tapping points and the inlet and outlet of the eight slot nozzle. With the gradual flow of fluid through the flowmeter, the area of high thermal deformation near the pressure tapping points of the flowmeter increases gradually, and its thermal deformation value also increases gradually. At t = 0 s, the high thermal deformation area inside the nozzle flowmeter is relatively small, and the value of maximum thermal deformation is 0.06 mm. At t = 0.5 s, the area of high thermal deformation on the inner wall of the nozzle flowmeter gradually increases, and the thermal deformation value near the upstream and downstream pressure tapping points increases more significantly. During the period from t = 1.0 to t = 2.0 s, the thermal deformation value near the upstream and downstream pressure tapping points is 0.13 mm. At t = 2.5 s, the high-thermal deformation area mainly concentrates near the upstream and downstream pressure tapping points and the inlet and outlet, and its value is 0.15 mm.

Figure 16: Transient heat deformation distribution of the flowmeter cross-section at 100°C on the inner wall surface
Fig. 17 shows the transient thermal deformation distribution of the section in the flowmeter at 300°C on the inner wall. When the outer wall temperature remains constant at 20°C and the inner wall temperature is 300°C, the high thermal deformation area within the nozzle flowmeter is mainly concentrated near the upstream and downstream pressure tapping points and the inlet and outlet of the eight slot nozzle. With the gradual flow of fluid through the flowmeter, the area of high thermal deformation near the pressure tapping points of the flowmeter increases gradually, and its thermal deformation value also increases gradually. At t = 0 s, the high thermal deformation area inside the nozzle flowmeter is relatively small, and the value of maximum thermal deformation is 0.20 mm. At t = 0.5 s, the area of high thermal deformation on the inner wall of the nozzle flowmeter gradually increases, and the thermal deformation value near the upstream and downstream pressure tapping points increases more significantly. During the period from t = 1.0 to t = 2.0 s, the thermal deformation value near the upstream and downstream pressure tapping points is 0.45 mm. At t = 2.5 s, the high-thermal deformation area mainly concentrates near the upstream and downstream pressure tapping points and the inlet and outlet, and its value is 0.50 mm.

Figure 17: Transient heat deformation distribution of the flowmeter cross-section at 300°C on the inner wall surface
Fig. 18 shows the transient thermal deformation distribution of the section in the flowmeter at 500°C on the inner wall. When the outer wall temperature remains constant at 20°C and the inner wall temperature is 500°C, the high thermal deformation area within the nozzle flowmeter is mainly concentrated near the upstream and downstream pressure tapping points and the inlet and outlet of the eight slot nozzle. With the gradual flow of fluid through the flowmeter, the area of high thermal deformation near the pressure tapping points of the flowmeter increases gradually, and its thermal deformation value also increases gradually. At t = 0 s, the high thermal deformation area inside the nozzle flowmeter is relatively small, and the value of maximum thermal deformation is 0.3 mm. At t = 0.5 s, the area of high-thermal deformation on the inner wall of the nozzle flowmeter gradually increases, and the thermal deformation value near the upstream and downstream pressure tapping points increases more significantly. During the period from t = 1.0 to t = 2.0 s, the thermal deformation value near the upstream and downstream pressure tapping points is 0.80 mm. At t = 2.5 s, the high-thermal deformation area mainly concentrates near the upstream and downstream pressure tapping points and the inlet and outlet, and its value is 0.90 mm.

Figure 18: Transient heat deformation distribution of the flowmeter cross-section at 500°C on the inner wall surface
Fig. 19 shows the transient thermal deformation distribution of the section in the flowmeter at 700°C on the inner wall. When the outer wall temperature remains constant at 20°C and the inner wall temperature is 700°C, the high thermal deformation area within the nozzle flowmeter is mainly concentrated near the upstream and downstream pressure tapping points and the inlet and outlet of the eight slot nozzle. With the gradual flow of fluid through the flowmeter, the area of high thermal deformation near the pressure tapping points of the flowmeter increases gradually, and its thermal deformation value also increases gradually. At t = 0 s, the high thermal deformation area inside the nozzle flowmeter is relatively small, and the value of maximum thermal deformation is 0.52 mm. At t = 0.5 s, the area of high thermal deformation on the inner wall of the nozzle flowmeter gradually increases, and the thermal deformation value near the upstream and downstream pressure tapping points increases more significantly. During the period from t = 1.0 to t = 2.0 s, the thermal deformation value near the upstream and downstream pressure tapping points is 1.17 mm. At t = 2.5 s, the high-thermal deformation area mainly concentrates near the upstream and downstream pressure tapping points and the inlet and outlet, and its value is 1.30 mm.

Figure 19: Transient heat deformation distribution of the flowmeter cross-section at 700°C on the inner wall surface
The study of the thermal characteristics of flow meters can aid in better understanding the characteristics of the internal flow field of the flow meter and their impact on flow measurement. It allows for the determination of the influence of various heat transfer mechanisms, such as conduction, convection, and radiation, on the flow meter, and provides a theoretical foundation for the design, optimization, and fault diagnosis of flow meters, thereby ensuring their operational stability and reliability. Investigating the thermal characteristics of flow meters is of great importance in enhancing their measurement performance, engineering application effectiveness, and ensuring safety in production.
In this paper, the transient numerical calculation of the thermal characteristics of each component of the nozzle flowmeter is carried out based on the finite element method, and the transient thermal characteristics of the solid domain of the nozzle flowmeter are analyzed when measuring and transporting media with different temperatures. Research has found that:
(1) With the heat transfer effect develops, the high heat flux area within the nozzle flowmeter will gradually transfer from the center of the nozzle to the inlet, outlet, and pressure tapping points upstream and downstream. The high heat flux area in the eight slot nozzle gradually reduces.
(2) The high thermal stress area of the nozzle flowmeter is mainly distributed near the upstream and downstream pressure tapping points and the inlet and outlet. As the fluid passes through the flowmeter, the high thermal stress area around the pressure tapping points will gradually expand, and the thermal stress value will also gradually increase.
(3) The high thermal deformation area inside the nozzle flowmeter is mainly distributed near the upstream and downstream pressure tapping points and the inlet and outlet of the eight slot nozzle. As the fluid flows through the flowmeter, the area and value of the thermal deformation at the pressure tapping points of the flowmeter will continuously increase.
Acknowledgement: I would like to personally thank all people who supported us with my sincere gratitude.
Funding Statement: The research was financially supported by the “Pioneer” and “Leading Goose” R&D Program of Zhejiang (Grant No. 2022C03170), Science and Technology Project of Quzhou (Grant No. 2022K98), and Science and Technology Project of Zhejiang (Grant No. LGC21E050001).
Author Contributions: The data analysis: Xin Li; the formal analysis: Shaohan Zheng; proposal of the conceptualization: Yuliang Zhang; revision of the manuscript: Minfeng Lv. All authors reviewed the results and approved the final version of the manuscript.
Availability of Data and Materials: The data used to support the findings of this study are available from the corresponding author upon request.
Conflicts of Interest: The authors declare that they have no conflicts of interest to report regarding the present stud.
References
1. Ferrari, A., Pizzo, P., Rundo, M. (2018). Modelling and experimental studies on a proportional valve using an innovative dynamic flow-rate measurement in fluid power systems. Proceedings of the Institution of Mechanical Engineers, Part C: Journal of Mechanical Engineering Science, 232(13), 2404–2418. [Google Scholar]
2. Sun, Y., Zhang, T., Zheng, D. (2018). New analysis scheme of flow-acoustic coupling for gas ultrasonic flowmeter with vortex near the transducer. Sensors, 18(4), 1151. [Google Scholar] [PubMed]
3. Singh, R. K., Singh, S. N., Seshadri, V. (2009). Study on the effect of vertex angle and upstream swirl on the performance characteristics of cone flowmeter using CFD. Flow Measurement and Instrumentation, 20(2), 69–74. [Google Scholar]
4. Nasiruddin, S., Singh, S. N., Veeravalli, S. V., Hegde, S. (2019). Effect of vertex angle and vertex tip radius on the performance of V-cone flowmeter using CFD. Measurement, 138, 536–544. [Google Scholar]
5. Prabu, S. V., Mascomani, R., Balakrishnan, K., Konnur, M. S. (1996). Effects of upstream pipe fittings on the performance of orifice and conical flowmeters. Flow Measurement and Instrumentation, 7(1), 49–54. [Google Scholar]
6. Guo, S., Sun, L., Zhang, T., Yang, W., Yang, Z. (2013). Analysis of viscosity effect on turbine flowmeter performance based on experiments and CFD simulations. Flow Measurement and Instrumentation, 34,42–52. [Google Scholar]
7. Guo, S., Zhang, T., Sun, L., Yang, Z., Yang, W. (2016). Blade shape optimization of liquid turbine flow sensor. Transactions of Tianjin University, 22, 144–150. [Google Scholar]
8. Huang, T. X., Ren, J. X., Zhang, P. (2020). Fluid-structure interaction analysis of coriolis mass flowmeter. International Journal of Modern Physics B, 34, 2040119. [Google Scholar]
9. Shavrina, E., Zeng, Y., Khoo, B. C., Nguyen, V. T. (2022). The investigation of gas distribution asymmetry effect on coriolis flowmeter accuracy at multiphase metering. Sensors, 22(20), 7739. [Google Scholar] [PubMed]
10. Costa, F. O., Pope, J. G., Gillis, K. A. (2020). Modeling temperature effects on a Coriolis mass flowmeter. Flow Measurement and Instrumentation, 76, 101811. [Google Scholar]
11. Enz, S. (2010). Effect of asymmetric actuator and detector position on Coriolis flowmeter and measured phase shift. Flow Measurement and Instrumentation, 21(4), 497–503. [Google Scholar]
12. Perumal, K., Krishnan, J. (2013). A CFD study of the effect of venturi geometry on high pressure wet gas metering. International Journal of Oil, Gas and Coal Technology, 6(5), 549–566. [Google Scholar]
13. Huang, S., Ma, T., Wang, D., Lin, Z. (2013). Study on discharge coefficient of perforated orifices as a new kind of flowmeter. Experimental Thermal and Fluid Science, 46, 74–83. [Google Scholar]
14. Muñoz Díaz, E., Solorio Ordaz, F. J., Ascanio, G. (2012). A numerical study of an orifice flowmeter. Flow Measurement and Instrumentation, 26, 85–92. [Google Scholar]
15. Venugopal, A., Agrawal, A., Prabhu, S. V. (2012). Frequency detection in vortex flowmeter for low Reynolds number using piezoelectric sensor and installation effects. Sensors and Actuators A: Physical, 184, 78–85. [Google Scholar]
16. Končar, B., Sotošek, J., Bajsić, I. (2022). Experimental verification and numerical simulation of a vortex flowmeter at low Reynolds numbers. Flow Measurement and Instrumentation, 88, 102278. [Google Scholar]
17. Shah, M. S., Joshi, J. B., Kalsi, A. S., Prasad, A. S. R., Shukla, D. S. (2012). Analysis of flow through an orifice meter: CFD simulation. Chemical Engineering Science, 71, 300–309. [Google Scholar]
18. Chen, D., Lin, Z., Liu, Q., Wang, Y., Wu, F. et al. (2020). Numerical investigation and characteristic analysis of the swirl meter with different swirlers. Measurement and Control, 53(7–8), 1122–1130. [Google Scholar]
19. Chen, D., Cui, B., Zhu, Z. (2018). Numerical simulations for swirlmeter on flow fields and metrological performance. Transactions of the Institute of Measurement and Control, 40(4), 1072–1081. [Google Scholar]
20. Zhang, C. L., Cui, B. L., Zhu, Z. C., Sheng, Y. N. (2019). Experimental and numerical study on swirlmeter with different helix angles of swirler. Transactions of the Institute of Measurement and Control, 41(11), 3103–3120. [Google Scholar]
21. Cui, B. L., Zhang, C. L., Zhang, Y. L. (2020). Experimental and numerical studies on metrological characteristics of swirlmeters with different swirler helix angles in a gas-solid two-phase flow. Flow Measurement and Instrumentation, 74, 101779. [Google Scholar]
22. Alaeddin, M. A., Hashemabadi, S. H., Mousavi, S. F. (2021). Numerical study on the effect of circumferential position of ultrasonic transducers on ultrasonic cross-correlation flowmeter performance under asymmetric air flow profile. Ultrasonics, 115, 106479. [Google Scholar] [PubMed]
23. Zhang, H., Guo, C., Lin, J. (2019). Effects of velocity profiles on measuring accuracy of transit-time ultrasonic flowmeter. Applied Sciences, 9(8), 1648. [Google Scholar]
24. Min, B., Logan, B. E. (2004). Continuous electricity generation from domestic wastewater and organic substrates in a flat plate microbial fuel cell. Environmental Science & Technology, 38(21), 5809–5814. [Google Scholar]
25. Yin, J. G., Li, J. (2016). Discussion on site detection technology of steam flowmeter. Metrology & Measurement Technique, 43(1), 48–56. [Google Scholar]
26. Wang, Y., Yan, Y., Zhou, J., Li, S. (2018). Flow field numerical simulation and pressure tapping location optimization of nozzle flow meter. Contemporary Chemical Industry, 47(10), 2161–2164, 2177. [Google Scholar]
27. Oh, S. T., Park, J. J., Kim, Y. I., Kim, S. H. (2019). Design of multi nozzles for a portable air flow meter using numerical simulation. ASHRAE Transactions, 125, 298–306. [Google Scholar]
28. Zhang, Y. L., Tong, L. H., Yu, T. H., Luo, B. Y., Li, J. F. (2023). Heat flow distribution characteristics of solid wall of nozzle flowmeter. Frontiers in Heat and Mass Transfer, 20, 10, 1–8. [Google Scholar]
29. Tong, L. H., Zheng, S. L., Zhang, Y. L., Zhao, Y. J., Zhang, K. Y. et al. (2021). Study on thermal effect of nozzle flowmeter based on fluid-solid coupling method. Shock and Vibration, 2021, 1–11. [Google Scholar]
30. Singh, R. K., Singh, S. N., Seshadri, V. (2010). CFD prediction of the effects of the upstream elbow fittings on the performance of cone flowmeters. Flow Measurement and Instrumentation, 21(2), 88–97. [Google Scholar]
Cite This Article
 Copyright © 2023 The Author(s). Published by Tech Science Press.
This work is licensed under a Creative Commons Attribution 4.0 International License , which permits unrestricted use, distribution, and reproduction in any medium, provided the original work is properly cited.
 Downloads
 Citation Tools