
 Submit a Paper
 Propose a Special lssue
 Open Access
ARTICLE

Investigative Review of Design Techniques of Parabolic Trough Solar Collectors
Smart Engineering Systems Research Center (SESC), Nile University, Shaikh Zayed City, 12588, Egypt
* Corresponding Author: Roba Tarek AbdelFatah. Email:
Frontiers in Heat and Mass Transfer 2024, 22(1), 317-339. https://doi.org/10.32604/fhmt.2023.044706
Received 06 August 2023; Accepted 12 October 2023; Issue published 21 March 2024
 View Full Text
 Download PDF
Abstract
Parabolic trough solar collectors (PTCs) are among the most cost-efficient solar thermal technologies. They have several applications, such as feed heaters, boilers, steam generators, and electricity generators. A PTC is a concentrated solar power system that uses parabolic reflectors to focus sunlight onto a tube filled with heat-transfer fluid. PTCs performance can be investigated using optical and thermal mathematical models. These models calculate the amount of energy entering the receiver, the amount of usable collected energy, and the amount of heat loss due to convection and radiation. There are several methods and configurations that have been developed so far; however, it is usually difficult for a designer to choose the appropriate method or configuration for his application. The present work investigates different PTC configurations and methods of solution, compares their efficiency and accuracy, summarizes their key behaviors and trends, and improves the available methods by maximizing the positives and minimizing the negatives among them. We investigated three methods and seven configurations. The findings suggest that optimizing the collector structure, tracking system, and reflector can lead to high PTC performance and reduced capital costs. After investigating and comparing the recent mathematical models, the study identified a clear deficiency in estimating the output temperature. Three PTC's solution methods are investigated, and a novel method is developed to give more accurate estimations of the output temperature.Graphic Abstract
Keywords
Nomenclature
| C | Concentrator ratio |
| Parabola height | |
| Total aperture loss | |
| Geometric factor | |
| Intercept factor | |
| Reflectance of mirror | |
| Transmittance of the glass cover | |
| Absorptance of receiver | |
| Receiver length | |
| The outer diameter of the receiver | |
| The inner diameter of the receiver | |
| The outer diameter of the glass cover | |
| The temperature of ambient air | |
| The temperature of inlet air | |
| The temperature of the receiver surface | |
| Wind velocity | |
| The pressure of ambient air | |
| The pressure of the working fluid | |
| Glass cover emissivity | |
| Receiver emissivity | |
| Mass flow of working fluid | |
| Tube thermal conductivity | |
| Aperture area | |
| Rim angle | |
| Focal length | |
| Parabolic trough width | |
| Incidence angle | |
| Half of the angle subtended by the Sun on the Earth | |
| Solar beam radiation constant | |
| Collector efficiency factor | |
| Heat loss coefficient | |
| Collector heat removal factor | |
| The receiver area | |
| Convection coefficient of the losses in the glass cover | |
| Convection coefficient of the total radiation heat transfer between the receiver and the glass cover | |
| The radiation heat transfer between the receiver and the glass cover | |
| Nusselt number | |
| Reynolds number | |
| Prandtl number | |
| Stefan-Boltzmann constant | |
| Temperature of the glass cover | |
| Area of the glass cover | |
| Specific-heat coefficient at constant pressure | |
| Total solar energy | |
| Useful energy captured by the fluid | |
| Loss energy | |
| Inlet temperature | |
| Outlet temperature | |
| Outlet convection coefficient | |
| Mean fluid temperature | |
| Fluid conductivity | |
| Total solar exergetic energy | |
| Useful exergetic energy | |
| Sun temperature | |
| Optical efficiency | |
| Collector efficiency | |
| Thermal efficiency | |
| Exergetic efficiency |
Solar energy has the most significant amount of energy on earth. It spreads all over the planet’s surface in the form of solar radiation with total radiation of 3,400,000 EJ per year, which can cover the yearly global energy consumption [1]. It is a clean, eco-friendly, and widely available energy on earth that can fulfill the growing global energy demands. It can be harnessed using different technologies, such as photovoltaic systems applications, which generate electricity from solar radiation and concentrated solar power applications, like linear Fresnel reflectors, solar dishes, parabolic and compound parabolic trough collectors (PTC), and power towers [2]. It has been proven that the optimum design of PTC components such as the collector structure, tracking system, and reflector can result in good PTC designs with minimal system capital cost of up to $75–$100/m2, which can be considered highly cost-effective solar concentration systems [3].
There are three important aspects in PTC analysis and design: (1) PTC configurations, (2) Methods of solution, and (3) Key behaviours and trends. PTC configuration concerns the different shapes, designs, analyses, and applications of PTCs. Gharat et al. [3] discussed various configurations and components of PTCs, showing how they may have evolved to simplify PTCs' manufacture, installation, and maintenance and enhance their performance. The system's capital cost can be decreased by enlarging the parabolic trough's aperture. Hydraulic rotary actuators may be preferable to the traditional step-reduction gearbox to achieve superior tracking precision. Kasem [4] showed how to modify PTC for air conditioning and desalination in addition to heating. PTCs can also provide energy that can be utilized to run stirring engines and be stored in hydraulic accumulator systems. Jamali [5] focused on the significance of solar mirror reflectance and how it affects the thermal performance of parabolic trough solar collectors. Aluminium and silver mirrors are the most popular and often used in mirrors for PTC reflectors. However, we have to weigh the benefits of mirrors against their drawbacks in light of their immediate needs.
According to Yilmaz et al. [6], the PTC's optical and thermal characteristics are crucial for enhancing the PTC's general performance. They argued that reducing the PTC cost, increasing optical precision, and enhancing reliability are important. Better system controllability techniques can be attained using dynamic simulation of Direct Steam Generation (DSG) and solar plants. They also showed that PTCs thermal performance can be enhanced by adding turbulators, changing the absorber tube, and using nanofluids [6]. For optical analysis, Malan et al. [7] found that the flux distribution analysis is important for improving the PTC optical performance. The history of flux distribution at the focal plane with a flat receiver began in 1957 and continued into the 1980s when a cylindrical receiver was added. After 2010, most of the research used the Monte Carlo Ray Tracing (MCRT) approach for PTCs optical analysis [7].
Accurate mathematical models are critical for optimizing PTC performance, so various models have been developed to predict solar radiation absorption, heat transfer fluid flow, and heat loss mechanisms. Analytical, numerical, and experimental models have been established for PTC analysis, with each offering different advantages and limitations [8,9]. The creation of precise and effective models can aid in the optimization of PTC system design and operation, resulting in a greater uptake of this renewable energy technology [10].
Many of the studies found in the literature concentrate on PTCs configurations, analysis, and design. The present work investigates the development of efficient PTCs structure configurations and solution methods and compares them. Three methods are developed and compared regarding their accuracy, finally leading to a new method that is found to be more accurate than the traditional methods since it maximizes the positives and minimizes the negatives among the methods available in the literature. Some key behaviors and trends regarding PTC analysis and design are summarized, and some conclusions are obtained.
The solar PTC consists of a reflector with a parabolic cross-section trough shape, receiver tube, supporting structure and solar tracking system, as shown in Fig. 1. The receiver, which is the heat collection element (HCE), is a black pipe located at the trough's focal line that receives the concentrated solar energy and converts it into heat, as depicted in Fig. 1. When a solar beam falls on the trough, it is reflected to the receiver at which the heat transfer fluid is located. The heat produced by the radiation is used to warm the fluid [3,11]. This section reviews the development of PTCs configurations over the years, including the solar tracking system, the receiver, and the working fluid.
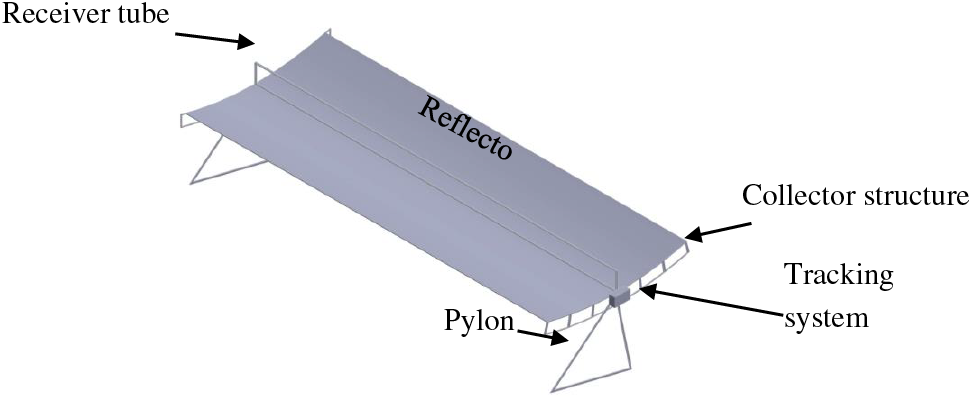
Figure 1: PTC basic components
PTCs have a long development history, dating back to 1911 when John Ericsson built the first PTC [3,12]. Over time, various improvements and developments were made to enhance PTC performance and reduce costs. In 1883, Ericsson improved the reflector to be a flat silvered reflector rather than polished sheet metal. In 1912, Frank Shuman [3] developed the first solar trough to drive irrigation water pumps for farmers in Egypt. Lewis Shipman [3] invented a new PTC in 1925 that used a mechanical geared wheel for a solar tracking system. In 1959, C.G. Abbot [3] utilized a PTC in conjunction with a steam engine to transform solar energy into mechanical work [3].
In later years, significant contributions were made. A new rotation mechanism was developed by Matlock et al. in 2011, and Orrison [3] developed a PTC that used two reflectors: primary and secondary. In 1978, Garner [3] invented a parabolic trough with a transparent cover to protect the reflector, and in 1979, Kenedy [3] used high-accuracy reflectors known as torque tube collectors.
After 1980, new designs were investigated to reduce costs and improve performance. The central torque tube was developed in 1984 and 1985 [3] to bear the reflector supporting arms loads and transfer torque through the tube. The space frame structure was adopted in 1989 [3], and the torque box design was developed in 2007 [3] as a low-cost design. The space tube structure was invented in 2013 [3], and Heliovis developed the Helio-Tube [3,13], which is a lightweight and low-cost solar concentrator structure made of plastics, in 2017 [3]. These developments are shown in Fig. 2. Table 1 gives the different structure configurations of PTCs, and includes their advantages and disadvantages.
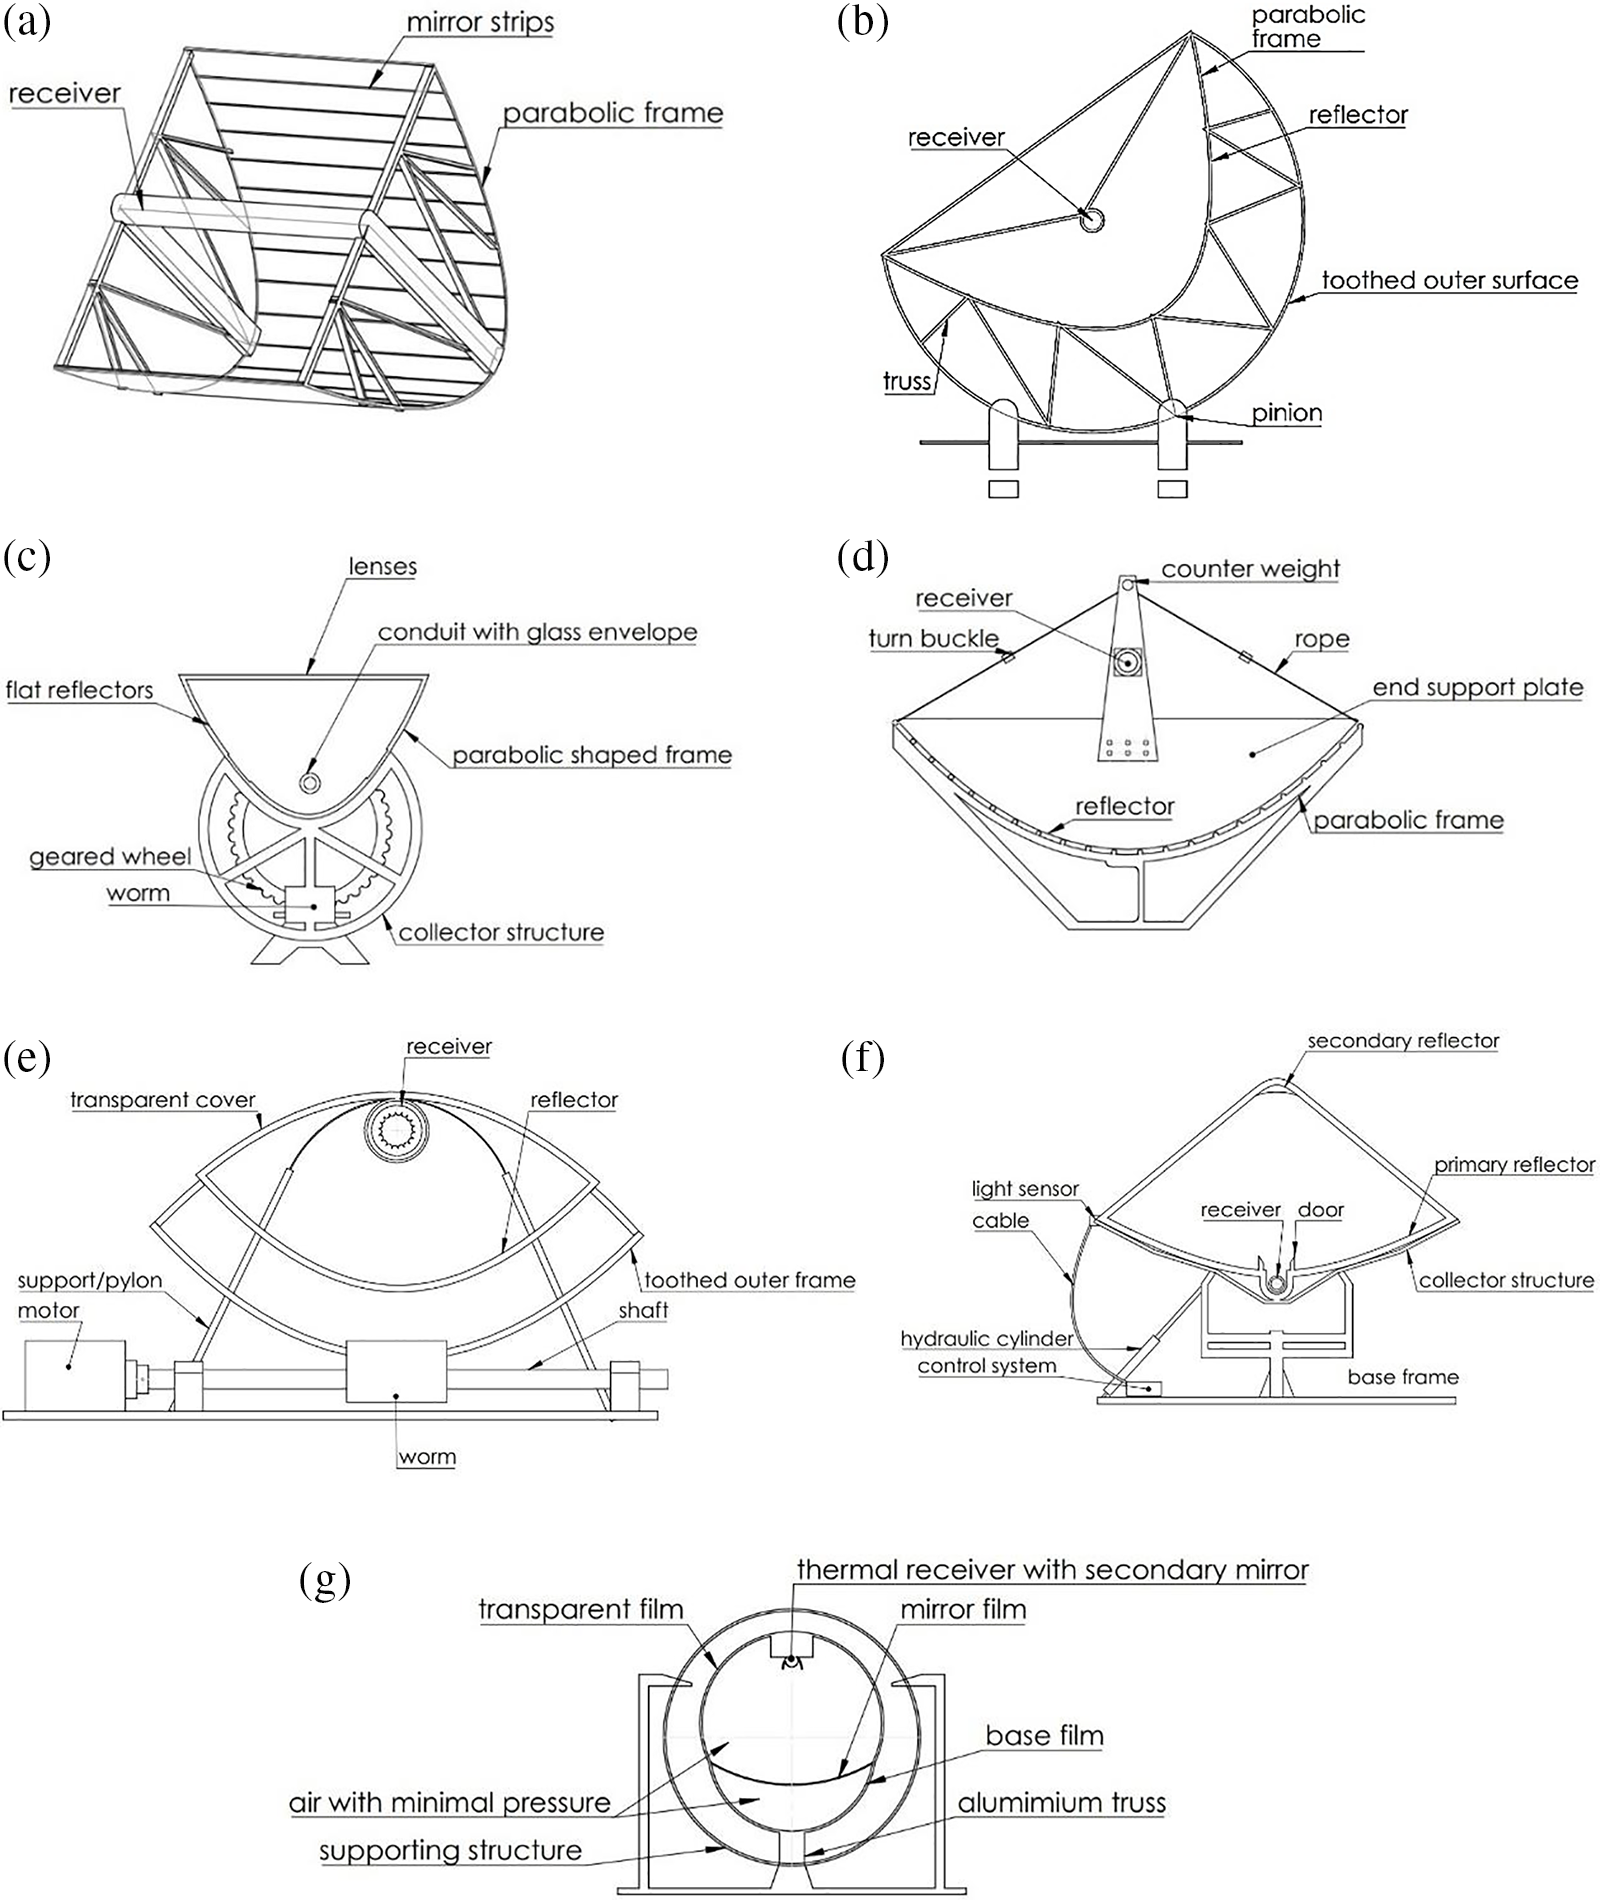
Figure 2: (a) John Ericsson PTC, (b) Frank Shuman’s PTC, (c) Lewis Shipman’s PTC, (d) C. G. Abbot’s parabolic trough, (e) Garner’s parabolic trough system, (f) Orrison’s PTC system with the hydraulic tracking system, and (g) Helio-tube structure

The PTC tracking systems have undergone significant advancements from 1912 to 2020. Initially, gear wheels and a motor-driven system with a thermopile sensing element were used for tracking. This was followed by the adoption of worm wheels from 1925 to 1959, with manual and automatic modes based on time relations. Subsequent developments included a hydraulic cylinder and light-sensing device in 1977, a mechanism with two hydraulic cylinders in 1979, and a single-axis system with light-dependent resistors (LDR) in 1996. In 1998, a two-axis system was implemented. In the early 21st century, a tracking system utilizing photodetectors and DC motors was introduced in 2004, followed by a high-accuracy system with a hydraulic helical-gear actuator in 2010. In 2013, various improvements were made, including an amplifier and comparator for energy gain and image processing with adjustable magnification [3]. The tri-positional control system with DC motors and photosensitive cells was established in 2014, and image vision sensors were implemented in 2017. Finally, in 2020, an adaptive neural fuzzy inference system was introduced to enhance the PTC performance [3].
Solar reflectors, which concentrate solar rays onto the receiver line to heat the working fluid, utilize various materials such as glass substrates, non-glass substrates, and superstrates. Glass has been commonly used in two forms: first-surface solar glass mirrors and second-surface solar glass mirrors [5]. In the former, the reflective film is placed on the front side of the glass substrate, while in the latter, the reflective film is positioned at the back and protected by additional layers. The composition, thickness, and coating material of glass substrates and superstrates can be adjusted for performance enhancement. Different types of glass, including soda lime float glass, Corning Microsheet glass, aluminosilicate, borosilicate, and microscopic glass substrates, have been used over the years. Protective and reflective films were applied to the front or back sides of the glass, depending on the substrate type. Coating materials were used, such as silver and aluminum, with various protective coatings applied to achieve the desired reflectance and glass adhesion [5].
The receiver, or heat element collector (HCE), converts solar energy to heat. It is the main component of the heat transfer process in PTCs. The HCE’s optical and thermal characteristics significantly impact its performance, affecting the power-generating efficiency of the thermal plants. The receiver is fixed with supporting brackets at the reflector’s focal line. Commonly, its tube is made of low-emissive and high-absorptive materials, such as stainless steel, and is contained in an evacuated annulus glass envelope with a vacuum pressure of around 0.013 Pa to minimize heat losses by convection. The envelope is also coated with anti-reflective materials to minimize heat losses by radiation [14–16], as shown in Fig. 3.
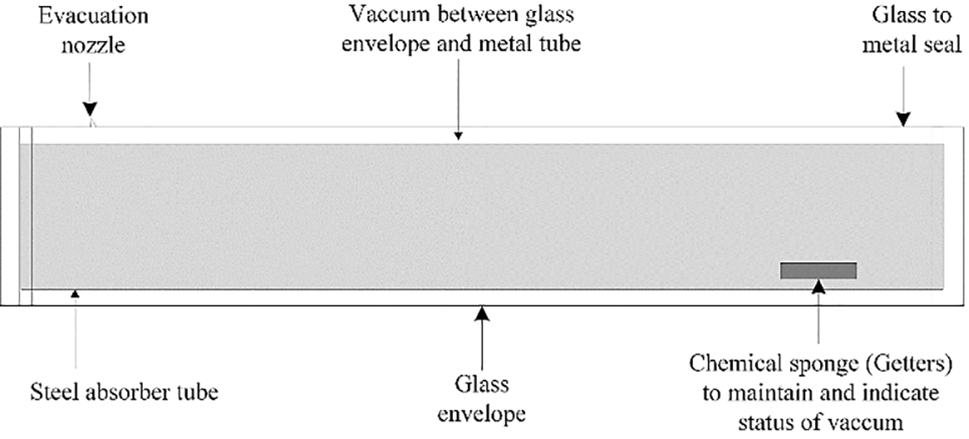
Figure 3: Receiver tube components
Working fluids used in PTCs are thermal or heat transfer fluids (HTFs) that circulate in the receiver tube until the required temperature or steady state is reached. They are classified into two main categories: conventional heat transfer fluids and nanoparticle heat transfer fluids. The selection of an appropriate working fluid is usually based on the system power cycle, thermal storage, and the desired temperature. Conventional HTF is a fluid with natural thermophysical properties, whereas nanoparticle HTF is a fluid with modified thermophysical properties using additives, such as metallic parts, carbon nanotubes, and metallic oxides [14,17,18].
Several mathematical models and solution methods are used to obtain the optical, thermal, structural, and fluid dynamic performance of a PTC. These models are summarised in Fig. 4.
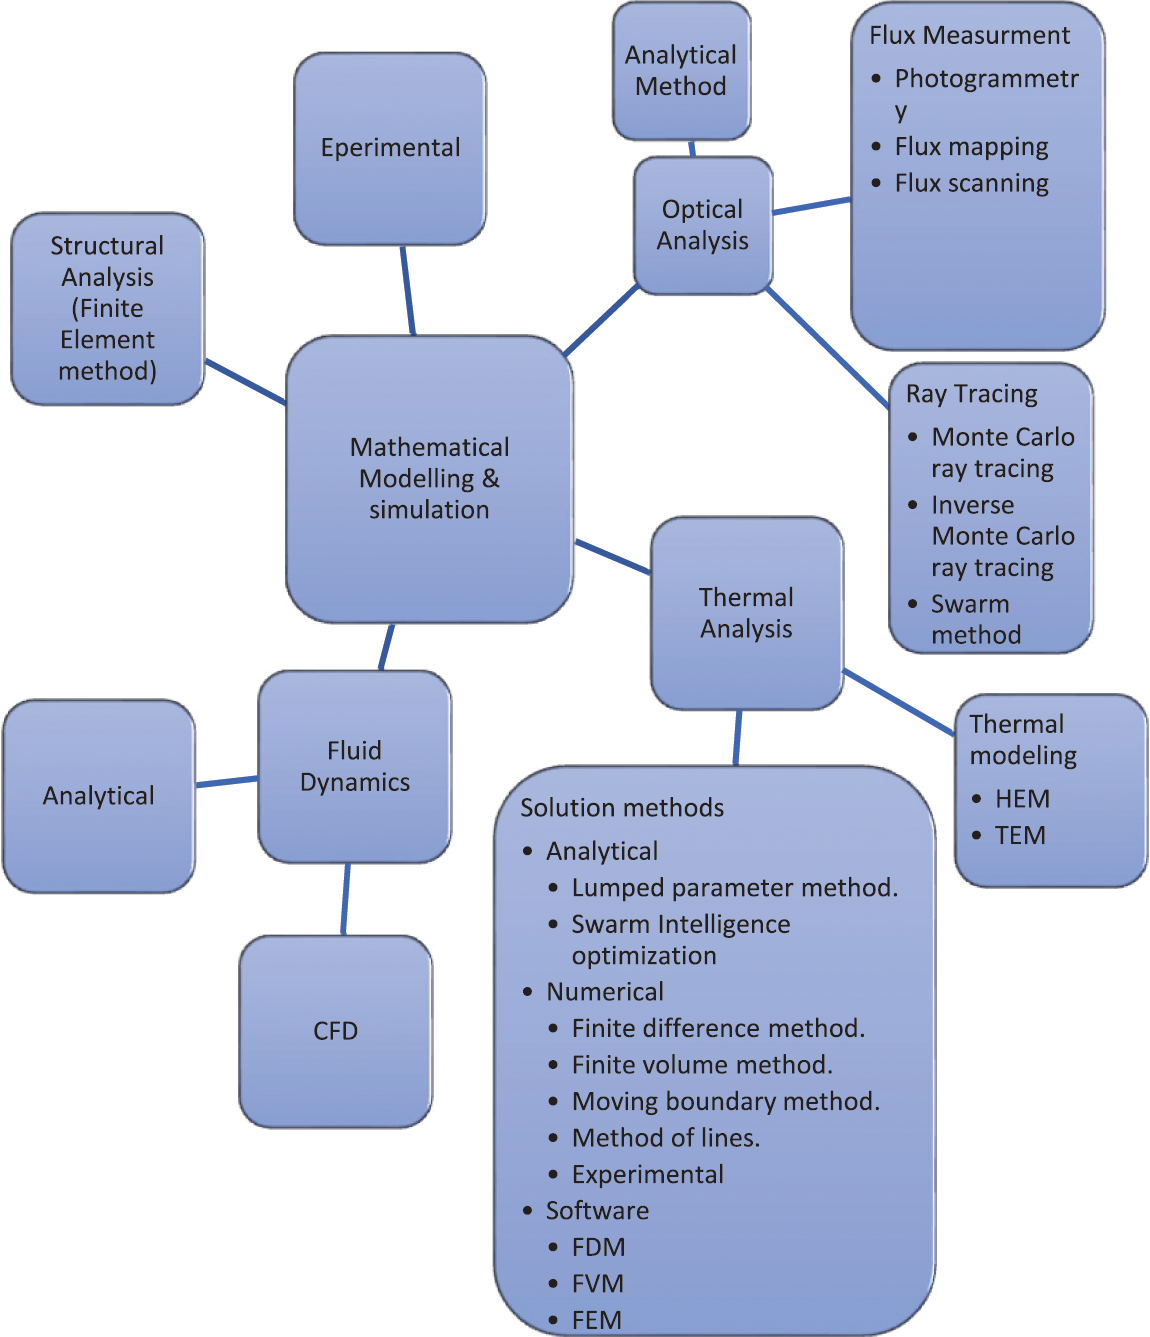
Figure 4: Mathematical modelling methods
3.1 Optical Modelling Analysis
In solar systems, optical analysis is vital to the understanding of solar concentrators performance. There are three approaches to optical analysis: analytical, ray tracing, and flux measurement. Analytical techniques offer closed-form solutions and require less computational power, but they are limited to simple systems. On the other hand, ray tracing is more popular as it can model complex systems and provide more accurate results. To analyse the optical properties of solar concentrators, various parameters, such as the incoming ray, concentrator surface, and receiver geometry, need to be determined to obtain the flux distribution [7].
One of the popular techniques used in ray tracing is the Monte Carlo Ray Tracing (MCRT) method, which studies the flux distribution on the receiver of PTCs. MCRT includes the Sun shape model, collector geometry, photon initiation, reflection from the concentrator, coordinate determination, and photon distribution counting. The coupled MCRT-FVM finite volume method can be used to examine the PTC's overall optical and thermal performance. Optical software such as Sol Trace is used for general ray tracing of different solar concentrators. However, primary ray tracing models assume some simplifications, such as the sun being a constant source of energy and the reflector being continuous and flawless, which may not represent realistic scenarios [7,19].
Flux measurement methods include photogrammetry, flux mapping, and flux scanning. Photogrammetry is a practical measurement method for evaluating solar concentrators' forms and related parts. Flux mapping is a camera-target method that captures ray patterns to identify areas of high and low concentration. Flux scanning, which has two versions, PARASCAN-I and PARASCAN-II, measures the flux density on the receiver using photodiodes or digital cameras [7,19].
In summary, the three primary methods for optical analysis in solar systems are analytical, ray tracing, and flux measurement. Each method has its advantages and limitations. Researchers and engineers can choose the appropriate method based on the system's complexity and the required accuracy of the results. Optical analysis methods are usually enrolled in improving the design and performance of solar concentrators, which can lead to more efficient and cost-effective solar energy utilization. Finally, the most recent and common optical models are discussed in [7,20–22].
PTCs are widely used in solar thermal power plants for energy conversion. However, large temperature gradients in the receiver tube caused by the heat flux difference between the upper and bottom parts of the tube can create high thermal stresses that may cause the glass envelope to break, or the absorber tube to distort. Therefore, thermal analysis is a critical aspect of PTC design and optimization. Thermal analysis consists of three phases: thermal modeling, governing equations, and solution methods.
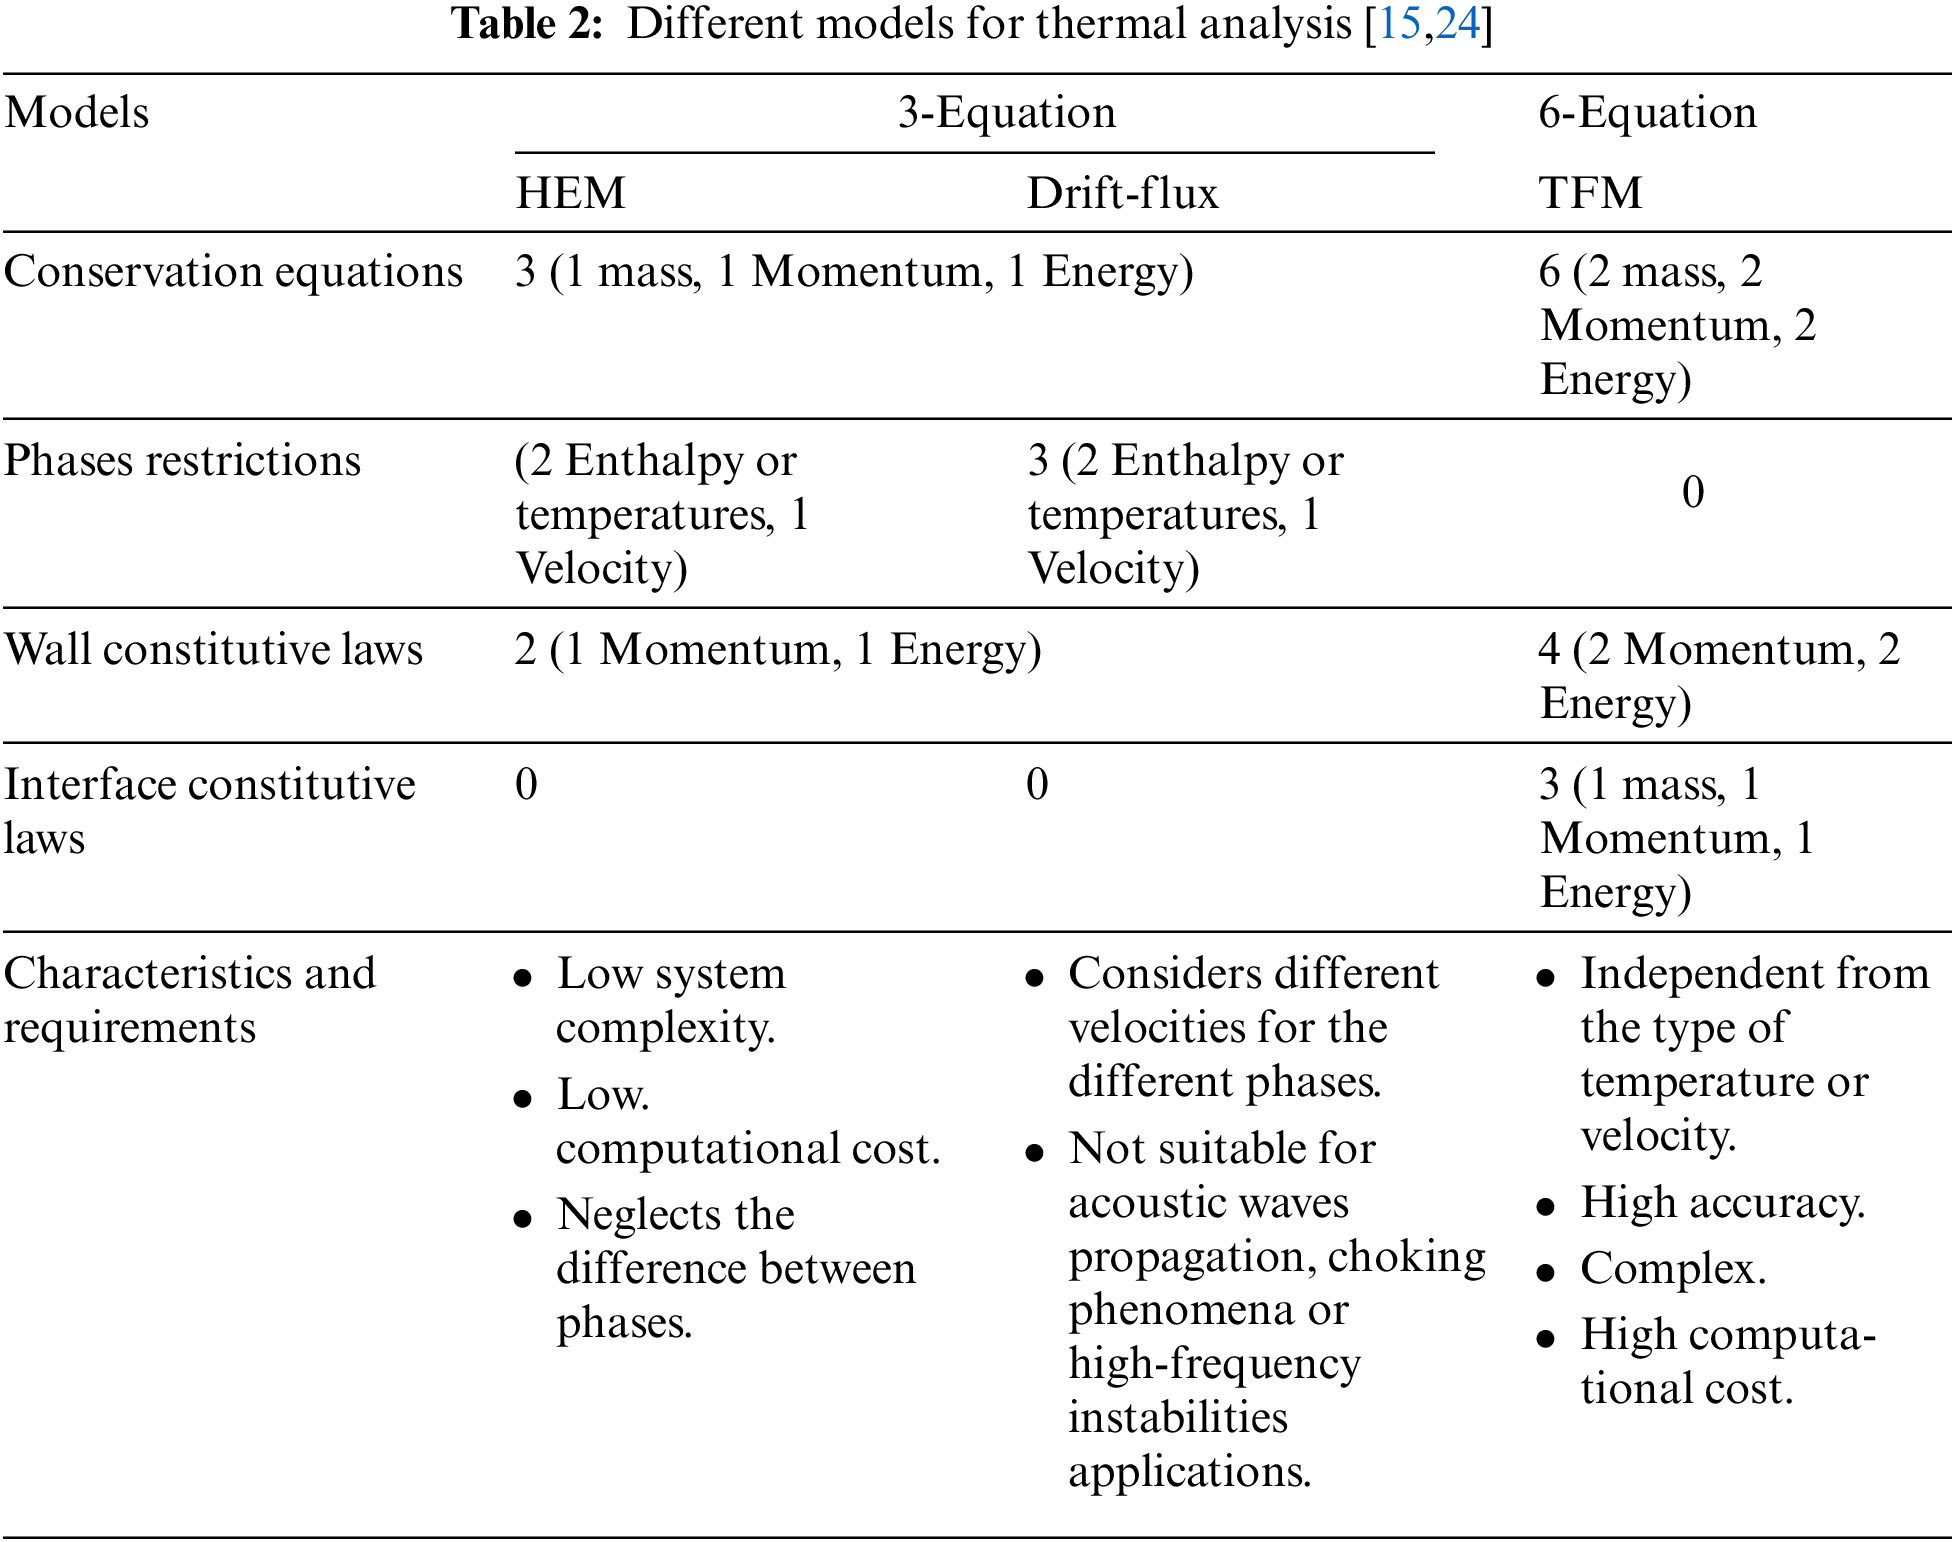
Regarding the thermal modeling of PTCs, most studies use three conservation governing equations, two-phase restriction parameters, constitutive wall laws, and constitutive interface laws. Several models have been developed to analyse PTC performance. The homogeneous equilibrium model (HEM) is the most widely used model, which treats the two-phase problem as a single phase by averaging the thermodynamic properties of the two phases. The two-fluid model (TFM) is another model that offers more accurate modelling of the two-phase flow than the HEM model [15]. However, it has more unknowns and requires more data for closure conditions, such as the equation of state and constitutive relations, and it is difficult to predict interphase relationships using physical rules. The six-equation method based on conservation equations for mass, energy, and momentum equations for each phase neglects the interfacial terms between the phases [23]. Table 3 provides a comparison between the different models for studying PTCs. A comparison among the different models is listed in Table 2.
3.3 Investigating Different Mathematical Models
In this model, we begin with the most common geometric shape of the parabolic trough, which is mathematically described as
where
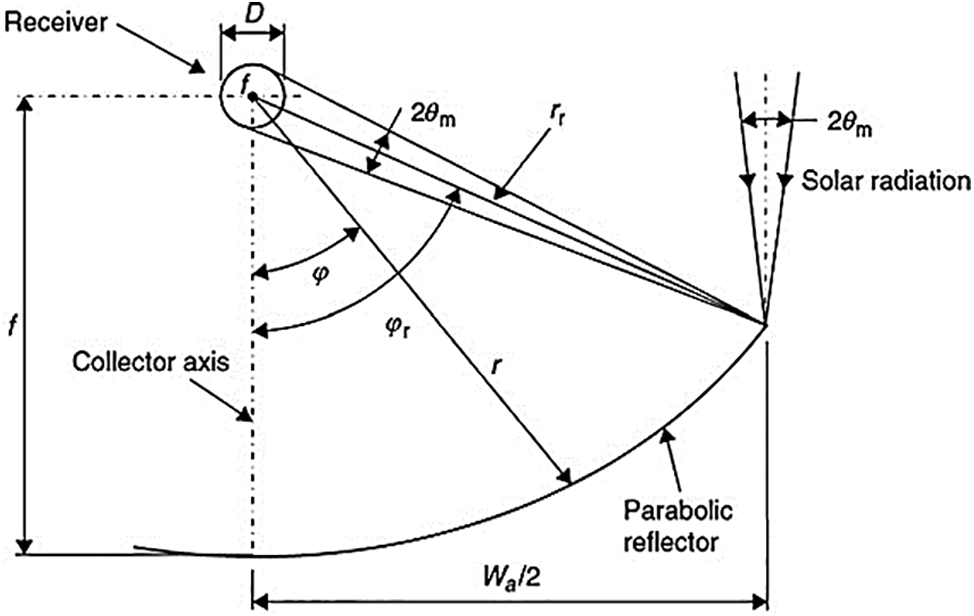
Figure 5: Cross-section of a PTC [26]
The rim angle
The reflector radius at any point is:
A key indicator of a solar collector's capacity to concentrate solar energy is the geometric concentration ratio. It has a value of 1 for non-focusing collectors, a value up to 100 for a line-focusing collectors, and a value up to 1000 for a point-focusing dish collector. The following formula is used to compute the concentration ratio [25]:
The combined losses resulting from geometric imperfections in an optical system and optical qualities of materials, such as absorptivity, the emissivity of the absorber tube, reflectivity of the mirror or reflector, and transmissivity of the glass cover, is what is referred to as “Optical Efficiency”. It is a measure of how flawless the system is, and it is formally stated as follows:
where
The PTC thermal analysis concentrates on the heat transfer through the working fluid. The receiver tube receives solar energy from the reflector and absorbs it to produce electricity. PTCs, however, are not able to utilize The full solar energy. The quantity of thermal energy that can be stored and the PTC effectiveness can be obtained using the appropriate mathematical models. Solar energy accessibility can be computed by taking into account fluctuations in
where
where
The total solar energy is given by:
The useful energy captured by the fluid can be calculated as:
A crucial equation that connects the total solar energy, useable energy, and lost energy is the energy balance equation, given by:
where
Convection-radiation related heat loss can be stated as:
where
The usable energy is correlated with the receiver temperature as:
where
PTC utilises two performance metrics. A measure of thermal efficiency,
The PTC's energetic performance is the other indication, and it may be represented as follows:
The equations above cannot forecast the characteristics of the glass cover without knowing the temperature of the glass cover. Throughout the procedure, Tg is obtained by iterations. Usually, two cycles are sufficient.
In [10] the outer temperature is given by:
where
In Model II, the geometric shape is described similarly to Model I and the optical efficiency is obtained using Eq. (11). k defines the inclination angle indicator by which it has a value of 1 for zero inclination angle [26]. The equations used for the parabola height estimation, aperture area, and the concentration ratio are defined as follows [26]:
And
For the thermal analysis, it is important to obtain suitable equations for the collector efficiency factor
where
• For Re between 0.1 and 1000
• For Re between 1000 and 50000
• For Re
where
where
The temperature of the glass cover is necessary in the equations above to predict the parameters of the glass cover, which is usually obtained by iteration. Compared to the receiver temperature,
Then, we can obtain the collector efficiency factor, which is determined by dividing the overall heat transfer coefficient by the overall heat loss coefficient [27].
Then, it can be used to obtain the thermal losses. The fluid inlet temperature is often a good way to represent the collector's overall usable energy gain, which can be obtained by determining the collector heat removal factor (FR).
The useable energy produced by the concentrator is defined as:
where
Model III is similar to Model I with different error estimation criteria for estimating the output temperature [18].
The compensated cover temperature is assumed to be [18]:
and the error in temperature can be calculated as:
The mean fluid temperature is [10]:
Since the three methods are almost near each other with small differences, they are implemented into MATLAB codes, and the solution procedure is depicted in Fig. 6.
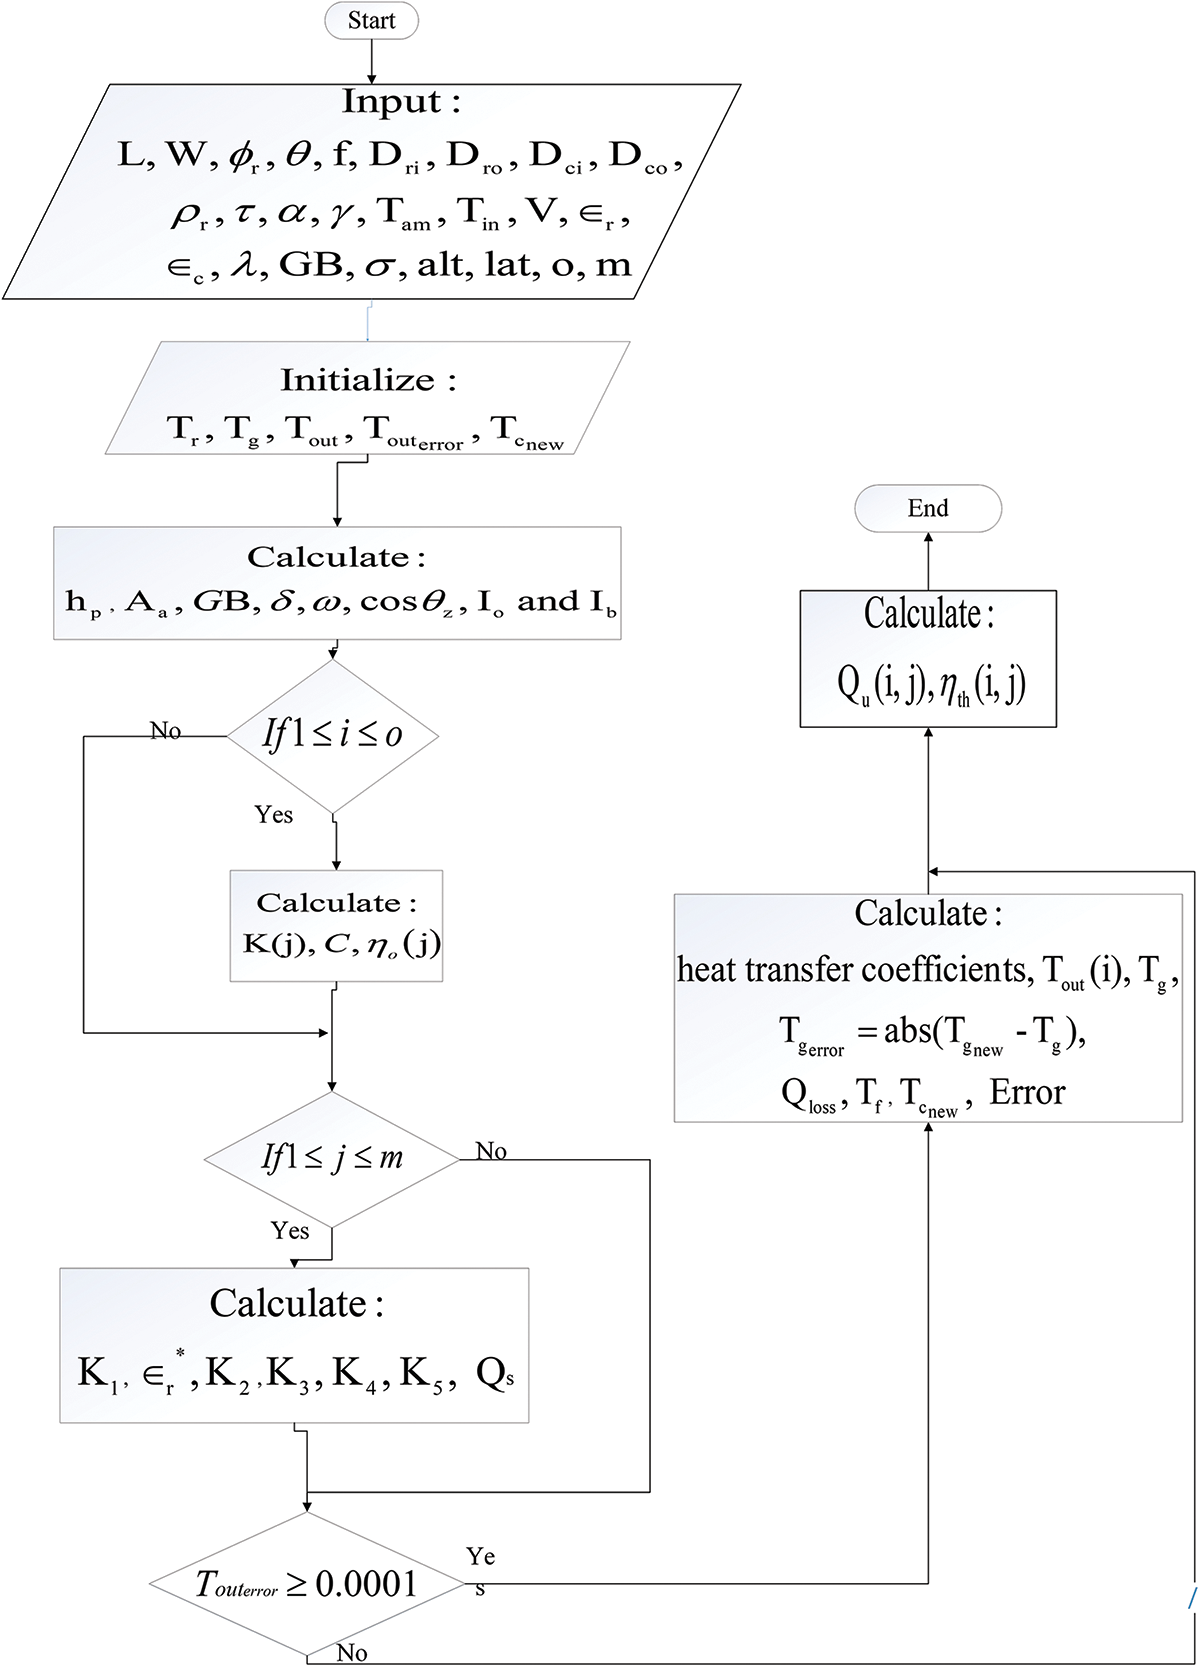
Figure 6: Flowchart for the solution procedure
We developed an enhanced method that maximizes the positives and minimizes the negatives among the previous methods. It begins with identifying the geometric shape of the parabolic trough, using the Eqs. (2), (3), (8) and (10) and obtaining the parabola height, the aperture area, the surface area, and the concentration ratio. Then, we calculate the solar irradiance coefficients using Eqs. (12) and (13). Finally we obtain the optical efficiency using Eq. (11).
Regarding the thermal analysis, it begins with identifying the fluid properties. After that, the wind properties, flow characteristics, and heat transfer coefficients are estimated using the Eqs. (40)–(45). Then, the solar energy, the useful energy, the loss energy, the glass temperature, output temperature, the fluid temperature, and the thermal efficiency all can be obtained using the Eqs. (28)–(34), (39), (45)–(47). However, the proposed model is a combination of some mathematical models that are available in the literature. It showed a better and more accurate performance in the results. The model flow chart is available in Fig. 7.
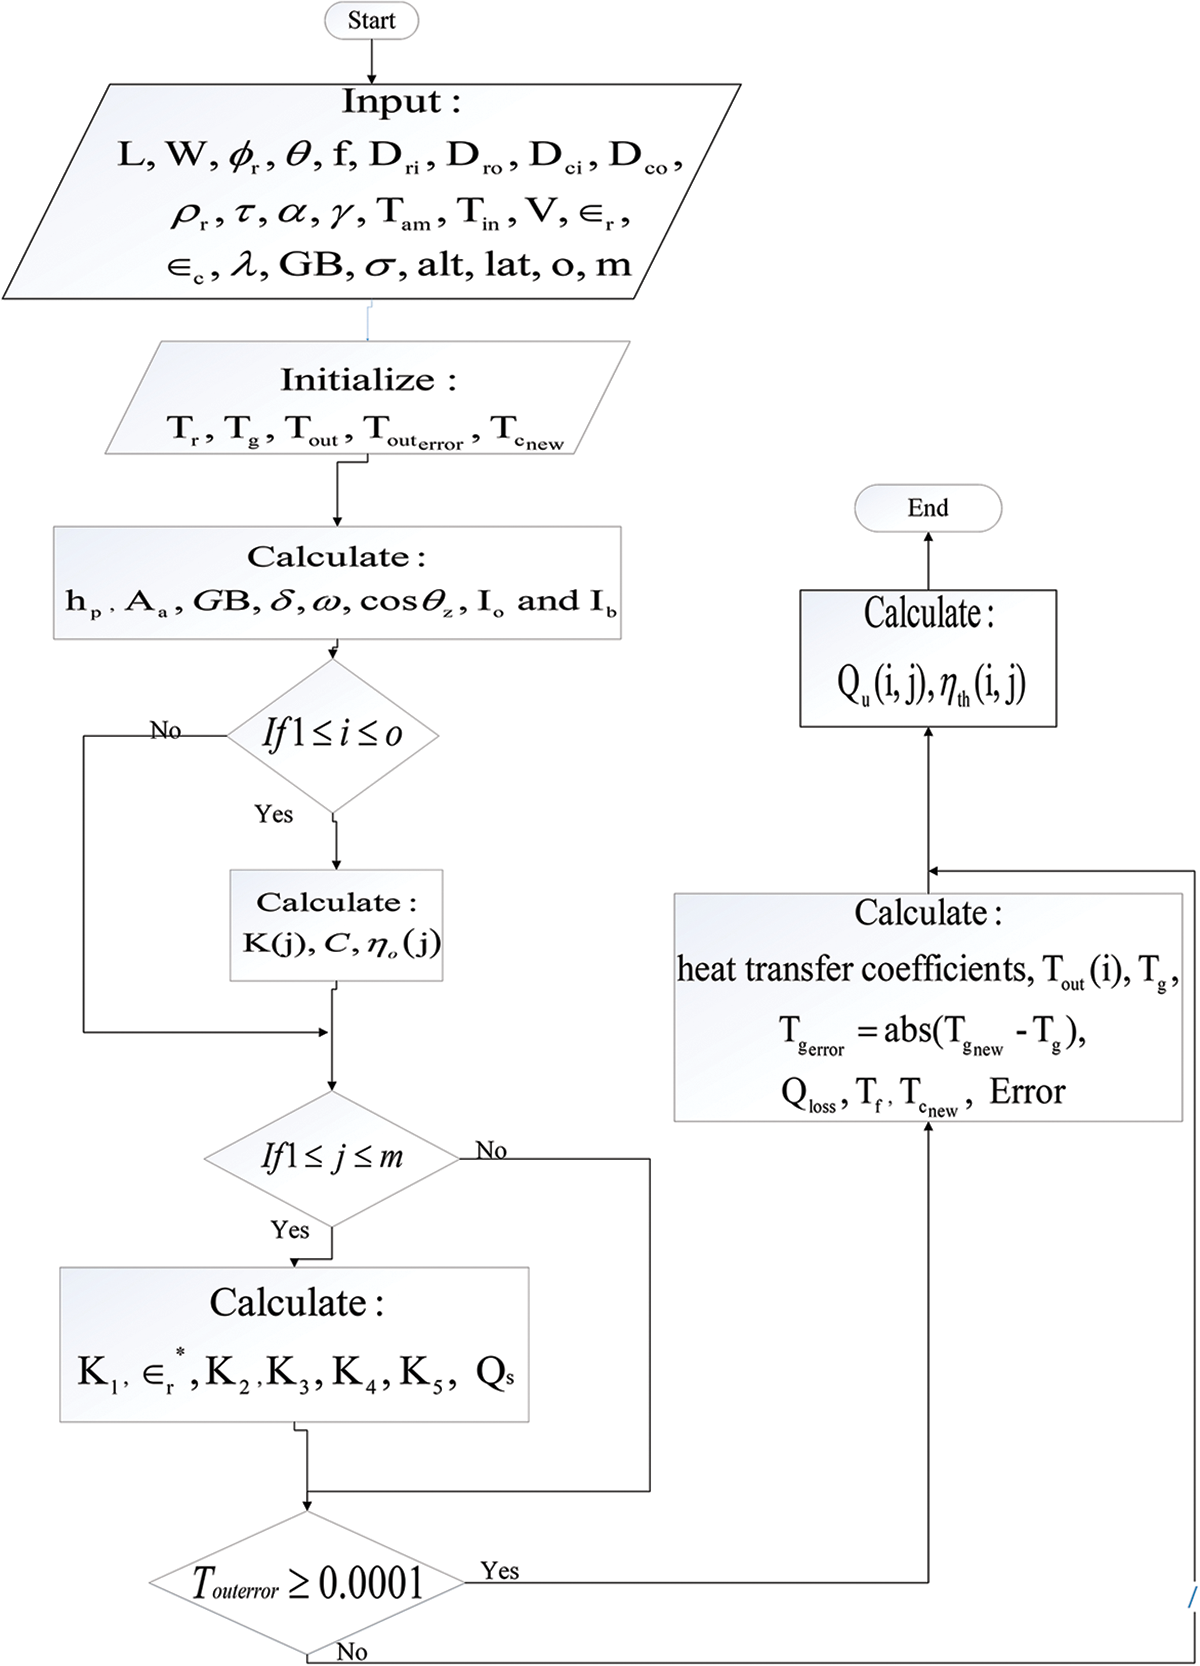
Figure 7: Flow chart for the proposed model procedure
Fors the receiver to be structurally stable, the study of the absorber tube wall overheating caused by partial or total dry-out is essential. The glass cover might break due to the significant stress that deflects the absorber tube in the transverse direction. Thermal studies have revealed that the absorbers' temperature distribution is Y-axisymmetric. The little inlet and exit surfaces experience the highest thermal stress. The displacement in the Z-direction steadily rises from the inlet to the outlet side. The large temperature gradient caused by the irregular distribution of solar radiation is to blame for this. Adopting an eccentric receiver tube and a 90° orientation angle may decrease the thermal stress by about 41.4%. The internal surface centre of the receiver moves higher, but the exterior surface centre remains the same [28].
The addition of porous medium at the absorber tube's inner surface speeds up heat transfer because of the following reasons: (a) disruption of the boundary layer lowers thermal resistance; (b) an increase in turbulence intensity speeds up fluid mixing; and (c) an increase in effective thermal conductivity because of the porous medium high thermal conductivity and high fluid area density [23].
Also, increasing the wet surface area of the absorber tube's inner surface, including micro-grooves, speeds up the rate at which heat is transferred from the absorber to the working fluid. Capillary-driven flow minimises the size of the dry region in stratified and stratified-wavy flow by pushing liquid water into micro-grooves. It aids in accelerating heat transmission and lowering the thermal gradient along the circumference of the absorber wall. In addition, convective boiling is accelerated by microcircumferential grooves on the inner wall of the PTC absorber tube, increasing the heat transfer rate [29]. As the wall thickness is increased, the pressure-induced stress decreases whereas the thermal stress increases. Because steam has a poor heat transfer coefficient, the overheated part becomes critical [30].
Thermal efficiency, pressure drop, and heat transfer decrease with the increase in HTF inlet temperatures and increase with the addition of nanoparticles to synthetic oil to increase the Reynold number. Complex impacts of the Darcy number might be seen. As the Darcy number rises, thermal efficiency and the heat transfer coefficient also decrease. However, the pressure drop is inversely proportional to the Darcy number decreases. Installing a porous structure within the absorber tube improves thermal efficiency at lower Reynolds numbers (5*105–15*105). However, porous structures with lower Darcy numbers (Da = 0.07) have no significant effect on improving the thermal efficiency of PTCs at high Reynolds numbers [31].
The drag and friction coefficients decrease with the increase in Reynold's number, but the heat transfer coefficient increases. Speed drops off away from the receiver pipe's output line along the centre line axis. Additionally, the dispersion of velocity drops in a laminar flow is more significant than in a turbulent flow. Pressure drop is more considerable for laminar flow than the turbulent flow and decreases with increasing distance along the centre line towards the outlet line of the receiver pipe. In both laminar and turbulent flows, the temperature distribution along the centreline receiver pipe is constant. With increasing heat flow, the temperature of the parabolic collector's thermal output at the absorber tube wall rises.
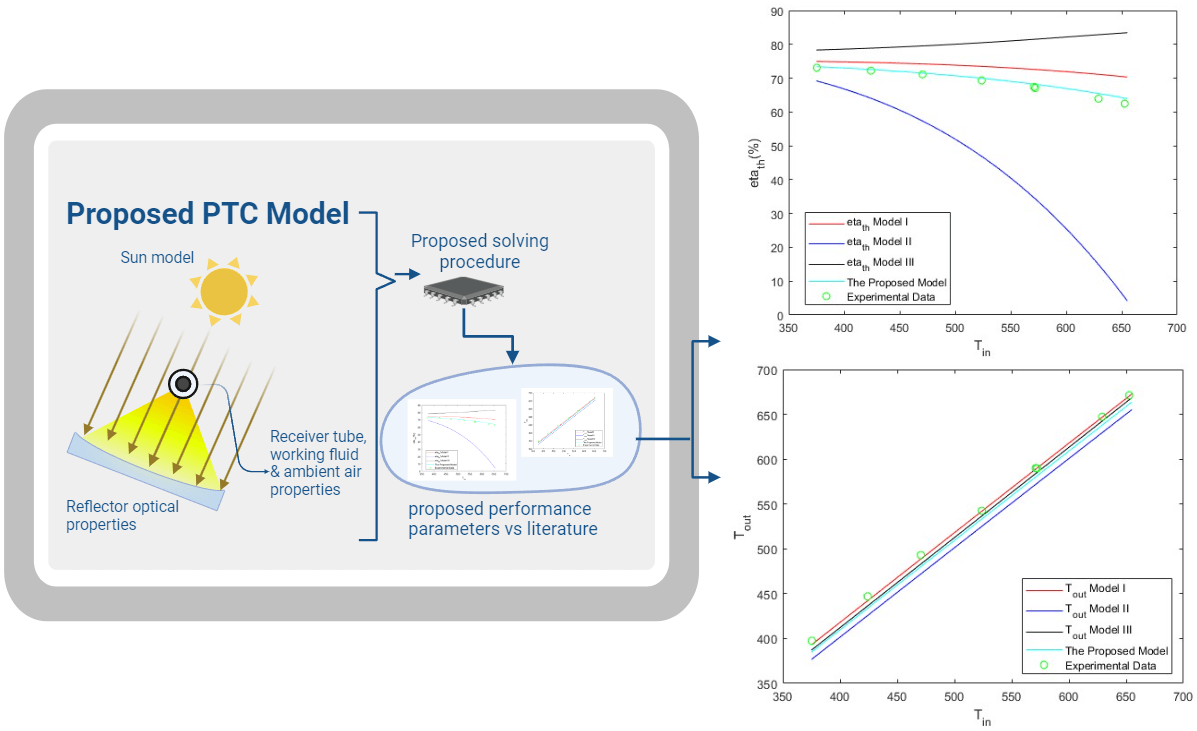
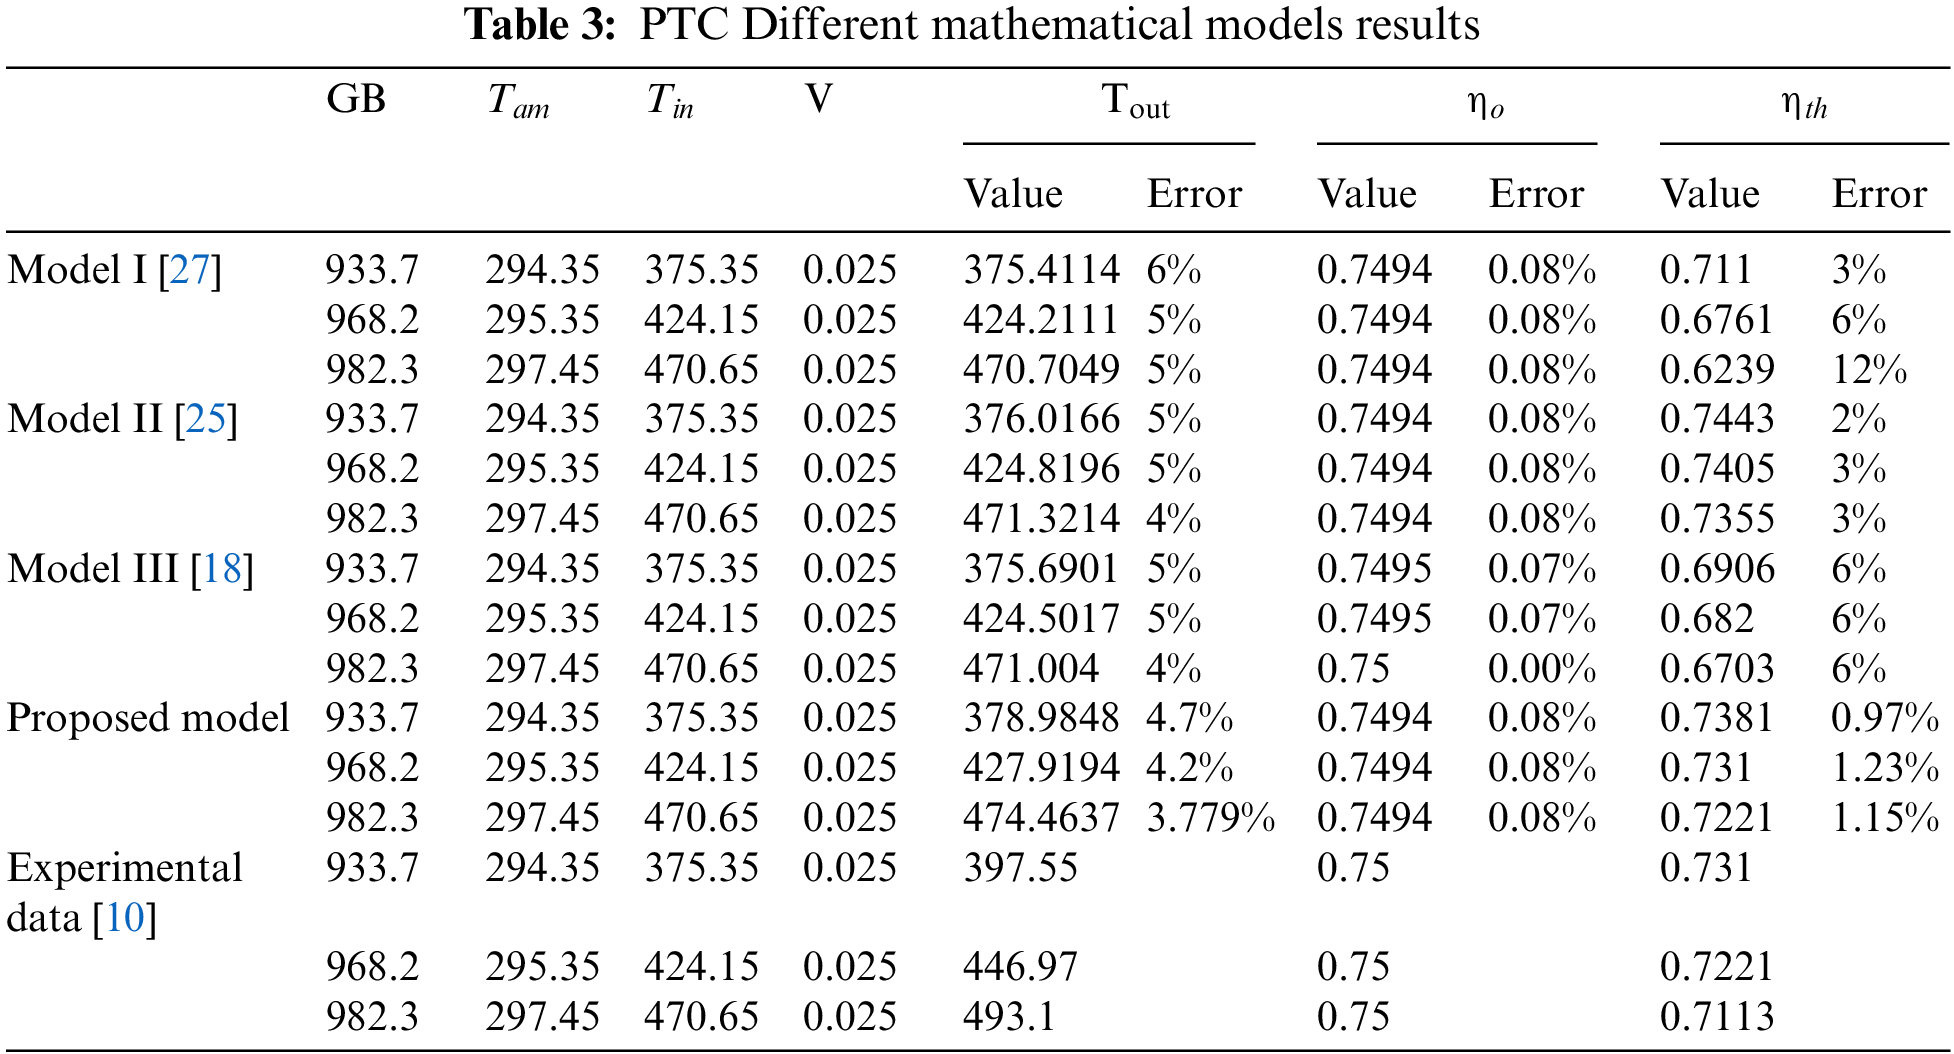
In the following, we investigate the accuracy of the above-described three models in addition to the one developed by the author. The comparison between these models and the experimental data provided by Bellos et al. [10] is presented in Table 3. The experimental data provides the values for various parameters, including Tout,
Model I revealed a discrepancy in the forecasted optical efficiency, measuring at 0.08%. Conversely, the error in thermal efficiency has a positive correlation with the input temperature. This suggests that the methodology employed to estimate the output temperature may possess inherent limitations.
The results of Model II show a good agreement with the experimental data. It gives the lowest error for the thermal efficiency of 3% for Tin = 470.65 K.
Model III also shows a good agreement with the experimental data, with a maximum error in the output temperature of 4% for Tin = 470.65 K. However, this depends on the good choice of a compensation factor in the iterative technique, which is not usually easy.
Finally, the proposed model shows the best agreement with the experimental data, with a maximum error in the output temperature of 4.7% for Tin = 375.35 K, as shown in Fig. 8. Table 3 below compares the different models used in thermal analysis. The results are also depicted in Fig. 9 for a velocity of 0.0008 m3/s.
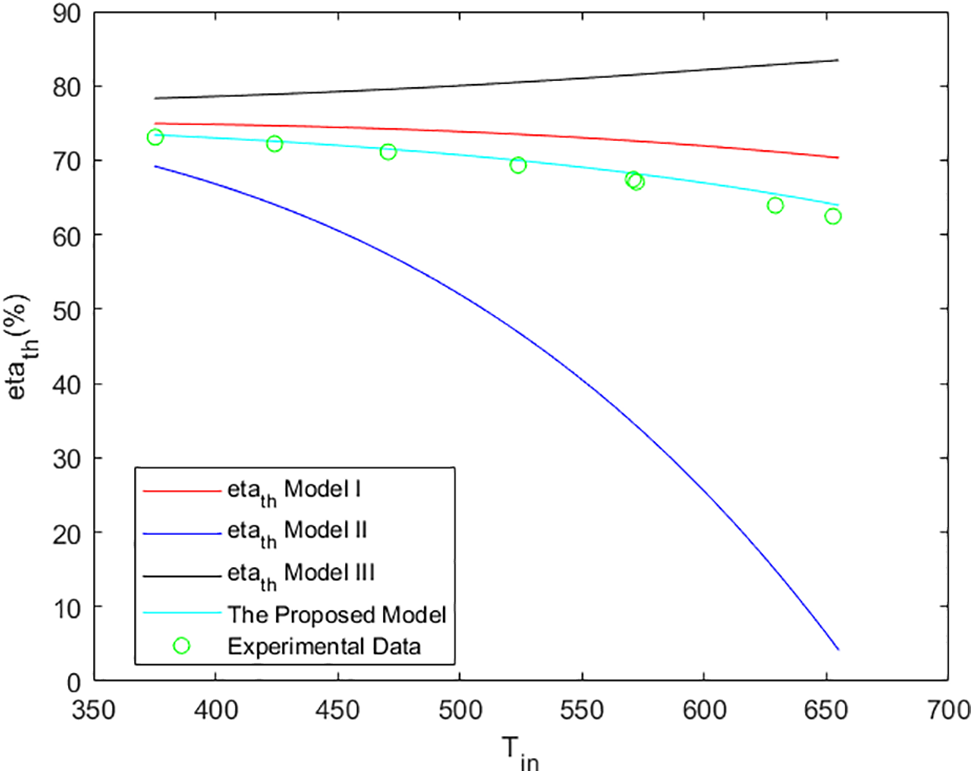
Figure 8: Thermal efficiency of the model vs. the experimental data at V = 0.0008 m3/s
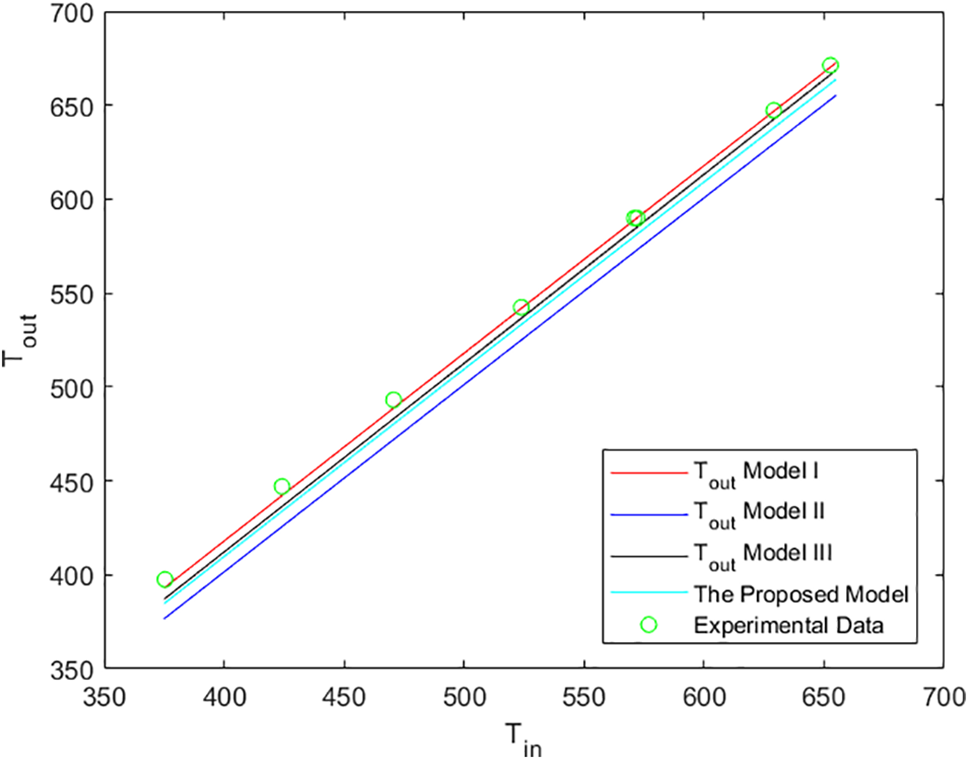
Figure 9: output temperature of the model’s vs. the experimental data at V = 0.0008 m3/s
Fig. 8 shows variation of the outlet temperature predicted by the various models with the inlet temperature for V = 0.0008 m3/s.
In the present work, we investigate different PTC configurations and methods of solution found in literature and compare their accuracies with a newly developed method. We start by discussing the PTCs’ main components and their evolution with time. Then, we investigate the different mathematical models available for solving PTC’s optical, thermal, and structural behaviors in addition to the key solution techniques. Some key behaviors, and trends regarding PTC analysis and design are discussed.
Regarding the mechanical design of the reflector structure, the space tube design is preferred. For optimal reflectance, polymer-based reflective sheets are comparable to glass mirrors, but their resilience, corrosion resistance, and reflectivity may require more testing under humidity and cyclical conditions. Solar tracking systems commonly utilize the shadow effect idea, but it has been demonstrated that artificial intelligence-powered image processing may achieve higher accuracy. In addition, hydraulic rotary actuators are preferable to traditional step reduction gearboxes for superior tracking precision in significant solar fields. Ultimately, optimising the collector structure, tracking system, and reflector may lead to the PTC design with optimal performance, and it may reduce the system's capital cost by up to $75–$100/m2.
When creating an adequate parabolic trough solar collector, the flux distribution analysis is one of the most critical factors. The primary method currently used for the optical analysis is MCRT, which has replaced older methods like limb darkening studies. Some researchers have investigated methods to reduce the computational time of MCRT using algorithms or two-dimensional methods. For thermal analysis, TFM is the best method to use for PTCs in direct steam generation, with different fluid phases considered. For structural analysis of PTCs for home applications, FEM is the most cost-effective and suitable method. Regarding fluid dynamics analysis, most studies use software such as ANSYS FLUENT, Ansys CFX, Thermo-fluids, Solidworks, and COMSOL Multiphysics. General fluid dynamics software can also be used for PTC simulations, such as Sol Trace, MCRT-code/Fluent, STAR-CCM+, TracePro, or MSC Nastran.
In the present work, the optical efficiency of parabolic trough solar collectors is accurately predicted by validating the proposed models using experimental data from Bellos. Three models are examined, each resulting in different thermal efficiency. However, the models encountered contradicting challenges when confronted with the experimental data and faced limitations in estimating the output temperature. After that, a new model that combines the optical model developed in [26] with the solar energy calculations based on location and date in [25] and the output temperature has resulted in the highest thermal efficiency and the best matching with the experimental results.
For future work, there is a need to improve the mathematical model for the analysis and design of multistage PTCs. This model can design, analyze, and perform parametric studies on multistage PTCs, leading to better performance and cost savings. There are also other forms of solar concentrators that need better mathematical modelling and formulation, such as Flat Solar Concentrators.
Acknowledgement: The authors would like to thank Prof. Hani M. Negm, Aerospace Engineering Department, Cairo University for reviewing the work.
Funding Statement: The authors received no specific funding for this study.
Author Contributions: The authors confirm contribution to the paper as follows: study conception and design: AbdelFatah and Kasem, interpretation of results: Fahim, draft manuscript preparation: AbdelFatah and Kasem. All authors reviewed the results and approved the final version of the manuscript.
Availability of Data and Materials: Because the work contains MATLAB routines that the author has created, the datasets created and/or analyzed during the current work are not publicly available, but they are available from the corresponding author upon justifiable request.
Conflicts of Interest: The authors declare that they have no conflicts of interest to report regarding the present study.
References
1. Breeze, P. (2019). Chapter 13—Solar power. In: Breeze, P. (Ed.), Power generation technologies, 3rd edition. pp. 293–321. Newnes. https://doi.org/10.1016/B978-0-08-102631-1.00013-4 [Google Scholar] [CrossRef]
2. Duffie, J., Beckman, W. (2013). Solar engineering of thermal processes, 4th edition. John Wiley & Sons, Ltd. pp. 322–372. https://doi.org/10.1002/9781118671603.ch7 [Google Scholar] [CrossRef]
3. Gharat, P., Bhalekar, S., Dalvi, V., Panse, S., Deshmukh, S. et al. (2021). Chronological development of innovations in reflector systems of parabolic trough solar collector (PTC)—A review. Renewable and Sustainable Energy Reviews, 145, 111002. https://doi.org/10.1016/j.rser.2021.111002 [Google Scholar] [CrossRef]
4. Kasem, M. M. (2022). Design of parabolic trough collectors using level curves for pressurized water and carbon dioxide as working fluids. 2022 4th Novel Intelligent and Leading Emerging Sciences Conference (NILES), pp. 248–251. Giza, Egypt. https://doi.org/10.1109/NILES56402.2022.9942385 [Google Scholar] [CrossRef]
5. Jamali, H. (2019). Investigation and review of mirrors reflectance in parabolic trough solar collectors (PTSCs). Energy Reports, 5, 145–158. https://doi.org/10.1016/j.egyr.2019.01.006 [Google Scholar] [CrossRef]
6. Yılmaz, İ. H., Mwesigye, A. (2018). Modeling, simulation and performance analysis of parabolic trough solar collectors: A comprehensive review. Applied Energy, 225, 135–174. https://doi.org/10.1016/j.apenergy.2018.05.014 [Google Scholar] [CrossRef]
7. Malan, A., Ravi Kumar, K. (2021). A comprehensive review on optical analysis of parabolic trough solar collector. Sustainable Energy Technologies and Assessments, 46, 101305. https://doi.org/10.1016/j.seta.2021.101305 [Google Scholar] [CrossRef]
8. Chen, L., Xu, L., Yang, Z. (2019). Inequality of industrial carbon emissions of the urban agglomeration and its peripheral cities: A case in the Pearl River Delta, China. Renewable and Sustainable Energy Reviews, 109, 438–447. https://doi.org/10.1016/j.rser.2019.04.010 [Google Scholar] [CrossRef]
9. Ibrahim, M., Kasem, M. (2022). Numerical thermal study of heat transfer enhancement in laminar-turbelunt transition flow through absorber pipe of parabolic solar trough collector system. Frontiers in Heat and Mass Transfer, 17, 1–11. https://doi.org/10.5098/hmt.17.20 [Google Scholar] [CrossRef]
10. Bellos, E., Tzivanidis, C. (2018). Analytical expression of parabolic trough solar collector performance. Designs, 2(1), 9. https://doi.org/10.3390/designs2010009 [Google Scholar] [CrossRef]
11. Alghamdi, F. (2019). Performance analysis of a parabolic trough solar collector (Master of Science). Florida Institute of Technology, Melbourne, Florida, USA. [Google Scholar]
12. Zarza, M. (2012). Parabolic-trough concentrating solar power (CSP) systems. In: Concentrating solar power technology, pp. 197–239. UK: Woodhead Publishing Limited, UK. [Google Scholar]
13. Bermadinger, S., Steinmair, M., Tiefenbacher, F. (2019). HELIOtube: An industrially realized reinvention of a CSP collector. SOLARPACES 2018: International Conference on Concentrating Solar Power and Chemical Energy Systems, Casablanca, Morocco. https://doi.org/10.1063/1.5117621 [Google Scholar] [CrossRef]
14. Osorio, J. D., Rivera-Alvarez, A. (2019). Performance analysis of Parabolic trough collectors with double glass envelope. Renewable Energy, 130, 1092–1107. https://doi.org/10.1016/j.renene.2018.06.024 [Google Scholar] [CrossRef]
15. Sandá, A., Moya, S. L., Valenzuela, L. (2019). Modelling and simulation tools for direct steam generation in parabolic-trough solar collectors: A review. Renewable and Sustainable Energy Reviews, 113, 109226. https://doi.org/10.1016/j.rser.2019.06.033 [Google Scholar] [CrossRef]
16. Fernández-García, A., Zarza, E., Valenzuela, L., Pérez, M. (2010). Parabolic-trough solar collectors and their applications. Renewable and Sustainable Energy Reviews, 14(7), 1695–1721. https://doi.org/10.1016/j.rser.2010.03.012 [Google Scholar] [CrossRef]
17. Benoit, H., Spreafico, L., Gauthier, D., Flamant, G. (2016). Review of heat transfer fluids in tube-receivers used in concentrating solar thermal systems: Properties and heat transfer coefficients. Renewable and Sustainable Energy Reviews, 55, 298–315. https://doi.org/10.1016/j.rser.2015.10.059 [Google Scholar] [CrossRef]
18. Kasem, M. (2022). Multiobjective design optimization of parabolic trough collectors. Scientific Reports, 12(1), 19964. https://doi.org/10.1038/s41598-022-24305-3 [Google Scholar] [PubMed] [CrossRef]
19. Natraj, Rao, B., Reddy, K. (2022). Optical and structural optimization of a large aperture solar parabolic trough collector. Sustainable Energy Technologies and Assessments, 53, 102418. https://doi.org/10.1016/j.seta.2022.102418 [Google Scholar] [CrossRef]
20. Schiricke, B., Pitz-Paal, R., Lupfert, E., Pottler, K., Pfander, M. et al. (2009). Experimental verification of optical modeling of parabolic trough collectors by flux measurement. Journal of Solar Energy Engineering. https://doi.org/10.1115/1.3027507 [Google Scholar] [CrossRef]
21. Neumann, A., Schmitt, G. (2003). Review of optical properties for Lambertian diffusers in solar energy application. Proceedings of the ASME 2003 International Solar Energy Conference, pp. 231–242. Kohala Coast, Hawaii, USA. [Google Scholar]
22. Riffelmann, K. J., Neumann, A., Wittkowski, M. (2003). PARASCAN: A new parabolic trough flux scanner. Göteborg. [Google Scholar]
23. Pal, R., Kumar, K. (2021). Investigations of thermo-hydrodynamics, structural stability, and thermal energy storage for direct steam generation in parabolic trough solar collector: A comprehensive review. Journal of Cleaner Production, 311, 127550. [Google Scholar]
24. Abam, F., Dilibe, N., Nwankwojike, B., Diemuodeke, O., John, I. (2021). Comparative evaluation of homogenous and drift-flux models for a three-phase downward flow in a pipe. Scientific African, 13, e00898. https://doi.org/10.1016/j.sciaf.2021.e00898 [Google Scholar] [CrossRef]
25. Singh, R. K., Chandra, P. (2023). Parabolic trough solar collector: A review on geometrical interpretation, mathematical model, and thermal performance augmentation. Engineering Research Express, 5(1), 012003. https://doi.org/10.1088/2631-8695/acc00a [Google Scholar] [CrossRef]
26. Vician, P., Palacka, M., Ďurčanský, P., Jandačka, J. (2018). Mathematical model for calculating performance of parabolic through collector. In: Mudryk, K., Werle, S. (Eds.Renewable energy sources: Engineering, technology, innovation, pp. 59–69. Cham: Springer International Publishing. https://doi.org/10.1007/978-3-319-72371-6_7 [Google Scholar] [CrossRef]
27. Mudryk, K., Werle, S. (2018). Renewable energy sources: Engineering, technology, innovation. Cham: Springer International Publishing. https://doi.org/10.1007/978-3-319-72371-6 [Google Scholar] [CrossRef]
28. Wang, F., Shuai, Y., Yuan, Y., Yang, G., Tan, H. (2010). Thermal stress analysis of eccentric tube receiver using concentrated solar radiation. Solar Energy, 84(10), 1809–1815. https://doi.org/10.1016/j.solener.2010.07.005 [Google Scholar] [CrossRef]
29. Dung, N., Wang, K. J., Chuang, F. S., Kung, K. Y. (2015). Optimizing the design of receiver in parabolic trough by using genetic algorithm. European Journal of Mechanics—B/Fluids, 49, 146–152. https://doi.org/10.1016/j.euromechflu.2014.08.003 [Google Scholar] [CrossRef]
30. Serrano-Aguilera, J. J., Valenzuela, L., Parras, L. (2014). Thermal 3D model for Direct Solar Steam Generation under superheated conditions. Applied Energy, 132, 370–382. https://doi.org/10.1016/j.apenergy.2014.07.035 [Google Scholar] [CrossRef]
31. Bozorg, M., Hossein Doranehgard, M., Hong, K., Xiong, Q. (2020). CFD study of heat transfer and fluid flow in a parabolic trough solar receiver with internal annular porous structure and synthetic oil-Al2O3 nanofluid. Renewable Energy, 145, 2598–2614. https://doi.org/10.1016/j.renene.2019.08.042 [Google Scholar] [CrossRef]
Cite This Article
 Copyright © 2024 The Author(s). Published by Tech Science Press.
This work is licensed under a Creative Commons Attribution 4.0 International License , which permits unrestricted use, distribution, and reproduction in any medium, provided the original work is properly cited.
 Downloads
 Citation Tools