
 Submit a Paper
 Propose a Special lssue
 Open Access
ARTICLE

Numerical Investigation on Air Distribution of Cabinet with Backplane Air Conditioning in Data Center
1 Huadong Engineering Corporation Limited, Power Construction Corporation of China, Hangzhou, 310014, China
2 Institute of Refrigeration and Cryogenics, Zhejiang University, Hangzhou, 310027, China
3 Zhejiang Key Laboratory of Clean Energy and Carbon Neutrality, Hangzhou, 310027, China
* Corresponding Author: Xiangdong Ding. Email:
Frontiers in Heat and Mass Transfer 2025, 23(2), 685-701. https://doi.org/10.32604/fhmt.2025.063785
Received 23 January 2025; Accepted 17 March 2025; Issue published 25 April 2025
 View Full Text
 Download PDF
Abstract
The effect of gradient exhaust strategy and blind plate installation on the inhibition of backflow and thermal stratification in data center cabinets is systematically investigated in this study through numerical methods. The validated Re-Normalization Group (RNG) k-ε turbulence model was used to analyze airflow patterns within cabinet structures equipped with backplane air conditioning. Key findings reveal that server-generated thermal plumes induce hot air accumulation at the cabinet apex, creating a 0.8°C temperature elevation at the top server’s inlet compared to the ideal situation (23°C). Strategic increases in backplane fan exhaust airflow rates reduce server 1’s inlet temperature from 26.1°C (0% redundancy case) to 23.1°C (40% redundancy case). Gradient exhaust strategies achieve equivalent server temperature performance to uniform exhaust distributions while requiring 25% less redundant airflow. This approach decreases the recirculation ratio from 1.52% (uniform exhaust at 15% redundancy) to 0.57% (gradient exhaust at equivalent redundancy). Comparative analyses demonstrate divergent thermal behaviors: in bottom-server-absent configurations, gradient exhaust reduces top server inlet temperatures by 1.6°C vs. uniform exhaust, whereas top-server-absent configurations exhibit a 1.8°C temperature increase under gradient conditions. The blind plate implementation achieves a 0.4°C top server temperature reduction compared to 15%-redundancy uniform exhaust systems without requiring additional airflow redundancy. Partially installed server arrangements with blind plates maintain thermal characteristics comparable to fully populated cabinets. This study validates gradient exhaust and blind plate technologies as effective countermeasures against cabinet-scale thermal recirculation, providing actionable insights for optimizing backplane air conditioning systems in mission-critical data center environments.Keywords
The rapid scaling of data center infrastructures has led to projected annual growth rates of more than 12% in energy consumption per year [1], with conventional cooling systems constituting approximately 40% of their total energy expenditure [2,3]. This energy challenge is exacerbated by the increasing thermal loads from computing hardware, driving unprecedented demands for advanced thermal management solutions. Consequently, developing precision cooling strategies ensuring equipment reliability while optimizing energy efficiency has become a critical operational imperative for sustainable data center operations.
Data center cooling methods primarily include air and liquid cooling [4]. As a promising cooling solution, liquid cooling employs liquid mediums for heat transfer to dissipate server heat, particularly suitable for data centers with high heat flux density. However, it faces limitations such as high construction costs and maintenance complexity [5]. Currently, air cooling remains the dominant cooling approach for data centers [6], operating by delivering cold air to equipment and exhausting heated air to complete heat exchange [7]. Despite challenges posed by localized hotspot heat flux densities reaching 300–1000 W/cm2 due to advancing server performance [8], air cooling continues to prevail as the most widely adopted solution owing to its low operational costs and ease of maintenance [4]. Backplane air conditioning, an enhanced air-cooling configuration, integrates standalone heat pipe technology installed at the rear door of server cabinets. In this system, heat exchangers directly cool the hot air discharged by servers within the cabinet [9,10]. The chilled air, driven by backplane fans, is first introduced into the room environment before circulating through the cabinet’s front door to establish continuous airflow for heat dissipation. Compared to traditional air conditioning, the backplane system achieves closed-loop circulation of hot air within cabinets, enhancing cold air utilization efficiency while mitigating localized overheating in equipment rooms. Furthermore, its targeted single-cabinet cooling mechanism significantly increases thermal capacity per cabinet.
Optimizing airflow patterns represents a critical strategy for reducing energy consumption in data center cooling systems [11]. Effective airflow management demonstrates significant energy-saving potential, capable of reducing cooling system energy usage by up to 30% [12]. Extensive research has been conducted on data room air distribution strategies. Comparative studies of rack-level, row-level, and room-level air supply configurations [13] reveal that rack-level air delivery achieves optimal cooling efficiency. Implementing cold aisle containment has been proven to enhance equipment room thermal conditions while lowering cooling system energy demands [14–18]. Cabinet-level airflow dynamics substantially influence cooling performance. Studies identify internal cabinet air recirculation patterns that intensify with elevated server power densities [19]. Proposed solutions include horizontal server repositioning along the cabinet’s vertical airflow path to improve thermal management [20], though this configuration increases spatial requirements. Alternative approaches demonstrate that angular server placement moderately enhances cooling efficiency [21]. Further innovations focus on thermal exchanger structural modifications and strategic positioning within cabinets [22,23]. Notably, thermal buoyancy effects on cabinet airflow require careful consideration, particularly to mitigate overheating risks in upper cabinet servers [24].
Backplane air conditioning, as an emerging cooling technology, demonstrates significant cooling potential yet has yet to see widespread adoption in data centers. The implementation of backplane air conditioning confines hot air exclusively within cabinets, consequently making the cabinet’s thermal environment a critical focus area. At present, existing research lacks a systematic investigation of airflow patterns within backplane air-conditioned cabinets. Given the insufficient understanding of internal airflow dynamics and the heightened risk of server overheating at cabinet tops, a novel exhaust configuration—gradient exhaust—is proposed as an alternative to traditional uniform exhaust patterns. This study examines the impacts of exhaust configurations and server layouts on airflow distribution and server thermal performance. The influence of exhaust pattern, server layout, and blind plate installation on airflow pattern and server temperature are studied. The application of gradient exhaust and blind plate is discussed.
The three-dimensional model of the backplane air conditioning cabinet was designed using SolidWorks 2020 (SolidWorks, USA) as shown in Fig. 1. The cabinet has dimensions of 1.2 m (x) × 0.6 m (y) × 2.15 m (z). It houses eight servers, each measuring 0.8 m (x) × 0.44 m (y) × 0.17 m (z), labeled sequentially from server 1 to server 8 from top to bottom. The servers are spaced 0.04 m apart, positioned 0.08 m from the cabinet’s side wall and 0.23 m from the top of the cabinet. Behind the servers, a backplane heat exchanger is installed, while eight backplane fans are mounted on the rear of the cabinet. The cabinet’s overall exhaust direction is horizontal (+y). Seven partitions are incorporated in the space between the heat exchanger and the backplane fans to isolate the eight fans. Additionally, a blind plate is positioned around the server exit (y = 0.9 m).
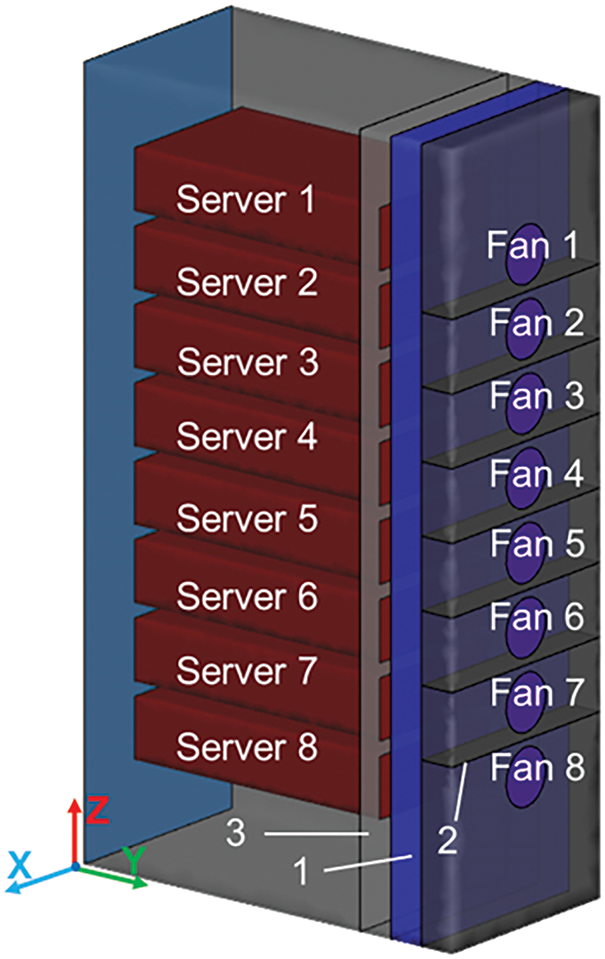
Figure 1: Illustration of three-dimensional settings of the cabinet. 1-Backplane heat exchanger; 2-Partitions; 3-Blind plate; Server 1~8; Backplane fan 1~8
2.2 Meshing and Grid Independency Test
In ICEM Computational Fluid Dynamics (CFD) 2021 R1 (ANSYS, Inc., Canonsburg, PA, USA), the Robust (Octree) method was selected as the generation method to discretize the volume of the 3D cabinet model. The total number of grid cells was determined through a grid independence test. Based on [25,26], the magnitude of velocity and the root mean square error (εrms) were calculated for different grid numbers, and grid independence was assessed based on the values of εrms. The expression for εrms is given by:
where i represents the i-th sampling point and n is the total number of sampling points.
2.3 Numerical Models and Validation
The mass, momentum and energy equations were solved using ANSYS Fluent 2021 R1 (ANSYS Corporation) commercial software to obtain the velocity field inside the cabinet.
Continuity equation:
Momentum equation:
Energy equation:
where
The Re-Normalization Group (RNG) k-ε model was chosen for the closure of above equations [27].
The SIMPLE algorithm was employed to couple the pressure and velocity fields, while the second-order upwind scheme was utilized to discretize the momentum, turbulent kinetic energy, and turbulent dissipation rate in the governing equations. Additionally, Boussinesq’s hypothesis was applied to account for the buoyancy force, which generates a thermal plume from the server heat source. The flow was assumed to be three-dimensional, incompressible, and steady-state turbulence.
Studies have demonstrated that RNG k-epsilon model can accurately predict the influence of obstacles within a room on the flow pattern and is the most suitable turbulence model for indoor air conditioning systems [28].
The experimental data of Murakami [29] was validated, and the model used for simulation is shown in Fig. 2 [29]. Temperature values along seven lines at x = 0 m, y = 2.1, 0.9, 0.45, 0, −0.45, −0.9, and −2.1 m were extracted from the simulation results. These values were then normalized using Eq. (2) and compared with the experimental results, as depicted in Fig. 3. Overall, the numerical simulation showed good agreement with the experimental data. The maximum error occurred along the seventh line, where the difference between the simulation and experimental results was approximately 0.4°C. This discrepancy is primarily attributed to the air supply angle of 75° at the inlet near the seventh line. The sampling point beneath this line is highly sensitive to positional deviations due to the influence of the air supply airflow.
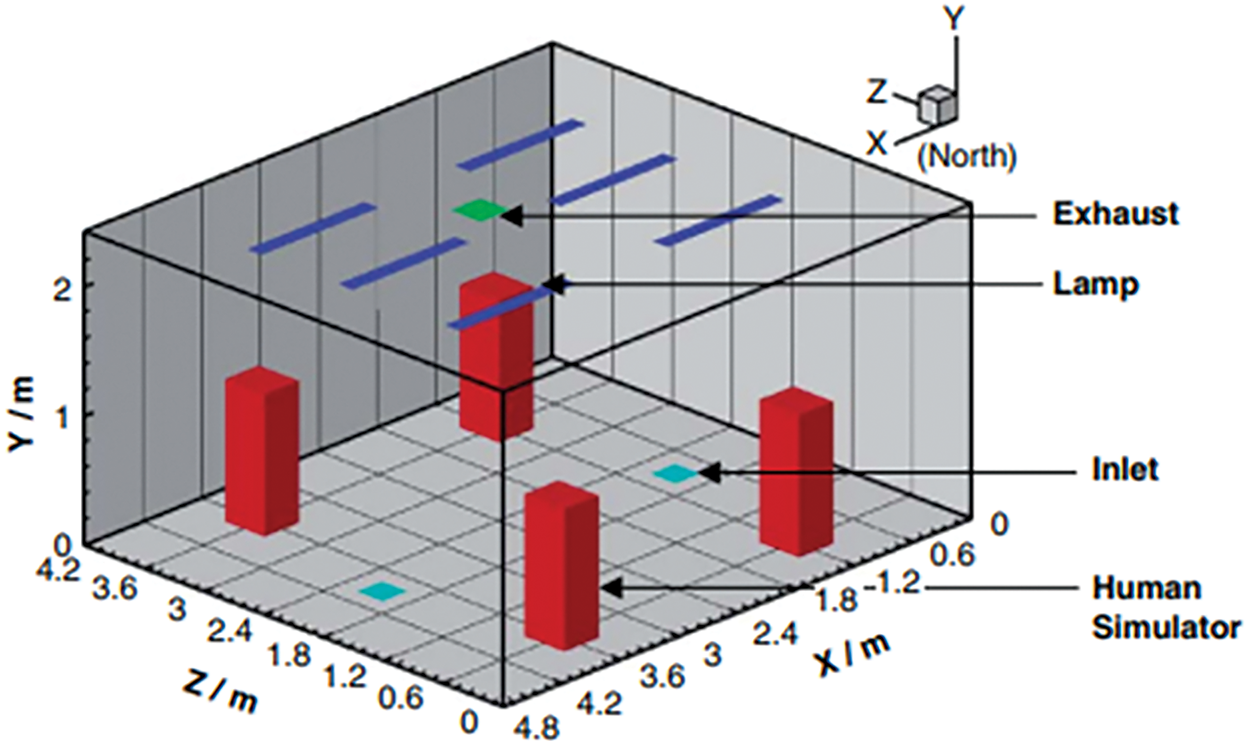
Figure 2: Physical model for validation of turbulence model
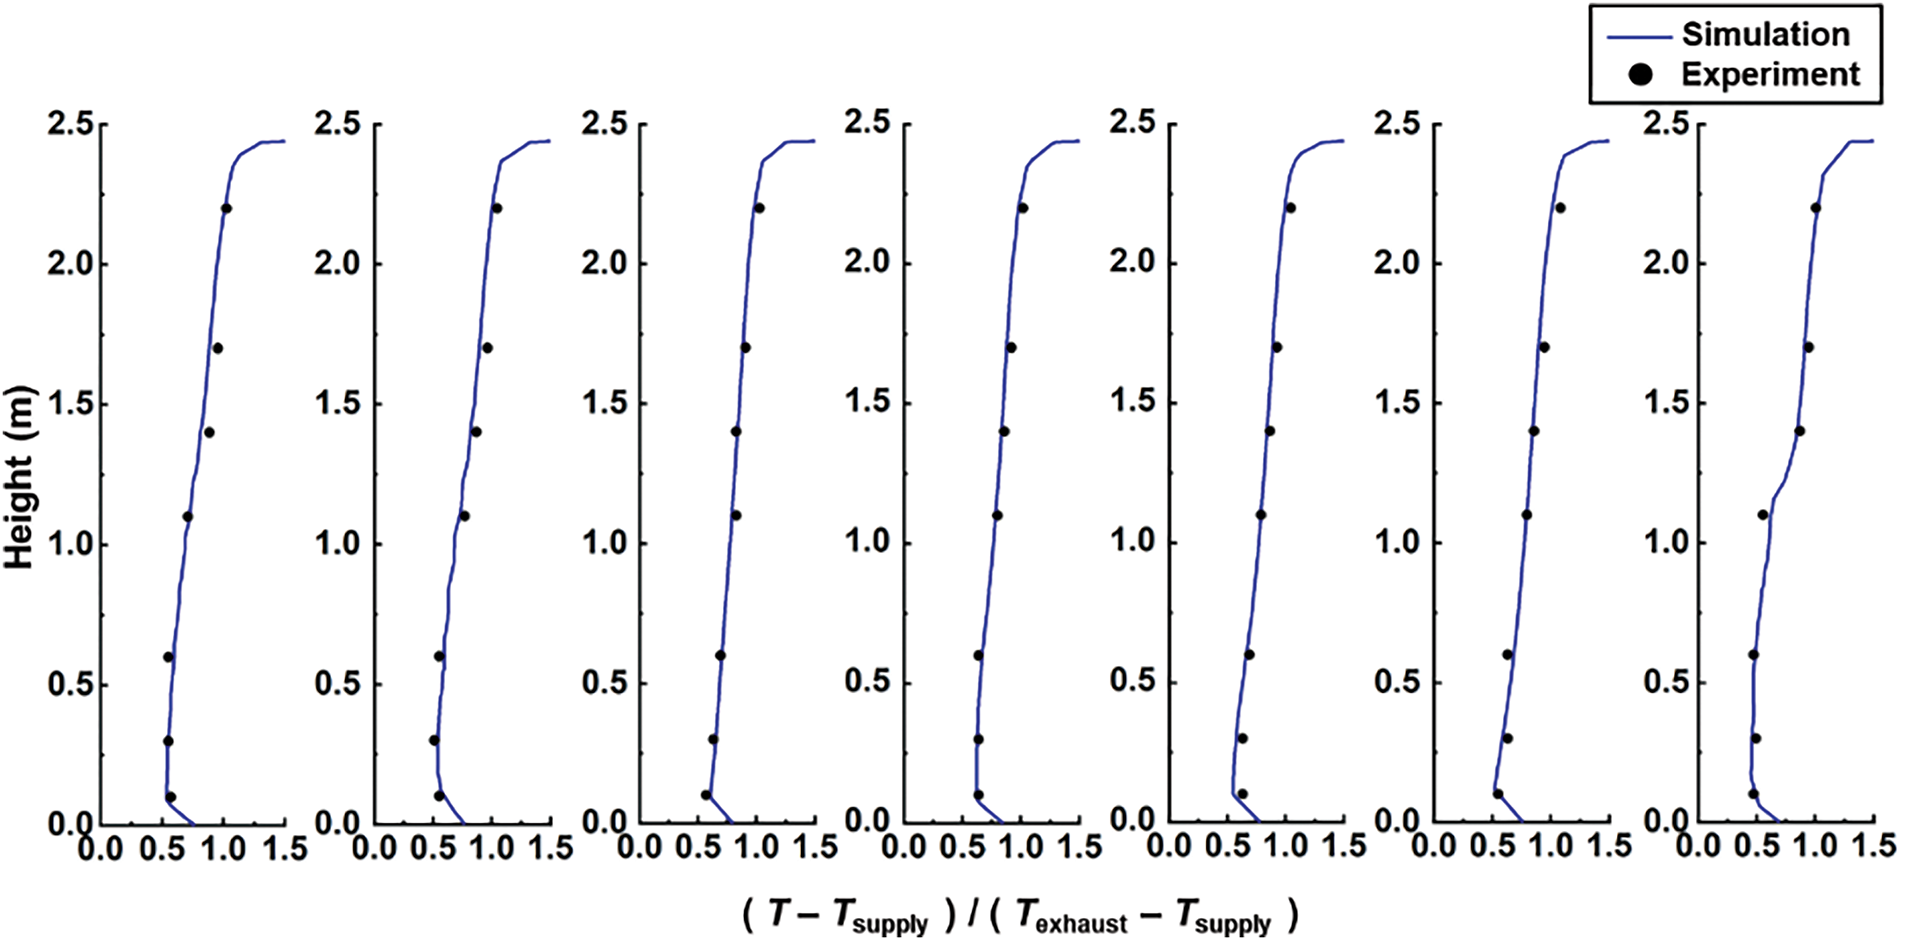
Figure 3: Results of comparison between simulated and experimental temperature in validation
The standard temperature range for the air inlet area of a cabinet is 18°C–27°C [30]. In this study, 23°C was chosen as the intake air temperature, and the temperature distribution on the intake air surface of the cabinet was assumed to be uniform. Additionally, the standard temperature difference between the supply air and return air in a traditional equipment room is 8°C–15°C [30].
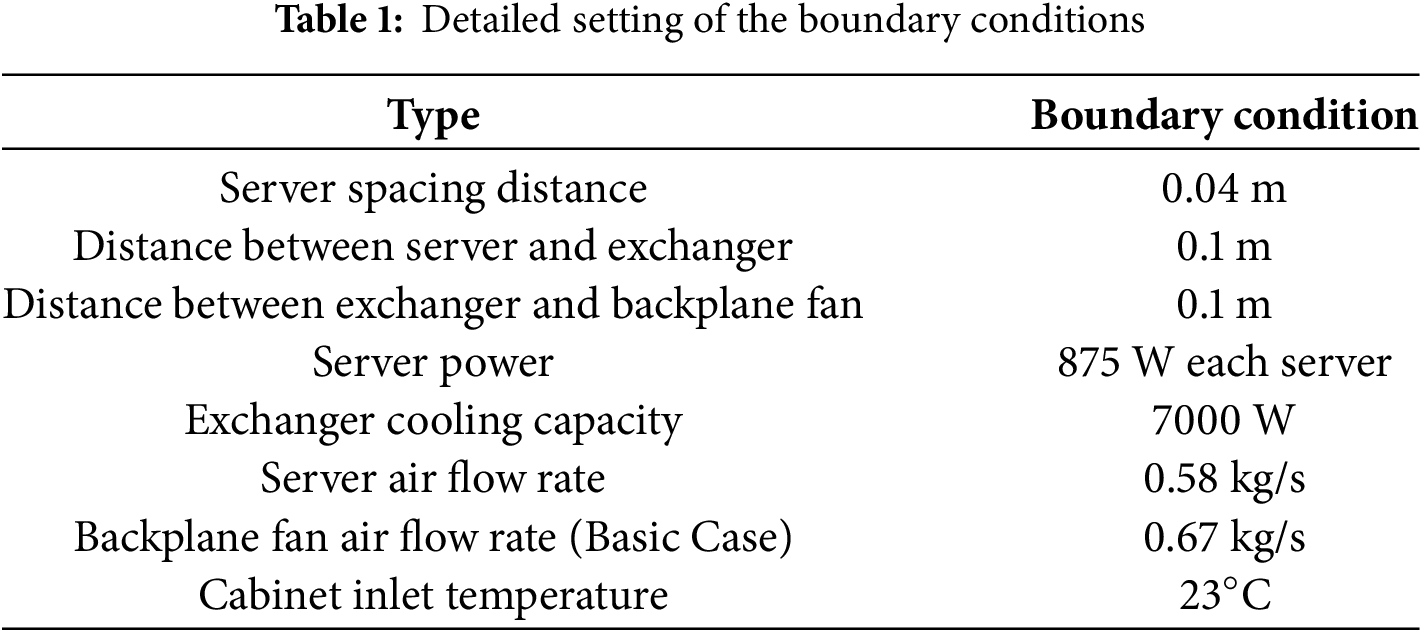
In the CFD simulation, non-slip boundary conditions were applied to all walls, and the cabinet walls were assumed to be adiabatic. The internal heat source originates from the servers. The outlet of the server is set to fan and the airflow rate for each server was controlled by setting identical pressure jumps at the server outlets to ensure a consistent value of 0.072 kg/s per server. As the powers of all servers are the same as 875 W, the temperature difference of the inlet and outlet air of the servers (not the cabinet) is nearly same as 12°C. The backplane fans were configured to exhaust air at a fixed speed. Additionally, gravity was set to 9.81 m/s2 in the z-direction. The detailed settings of the boundary conditions are summarized in Table 1, while the airflow rate settings for the backplane fans in the gradient exhaust case are provided in Table 2.
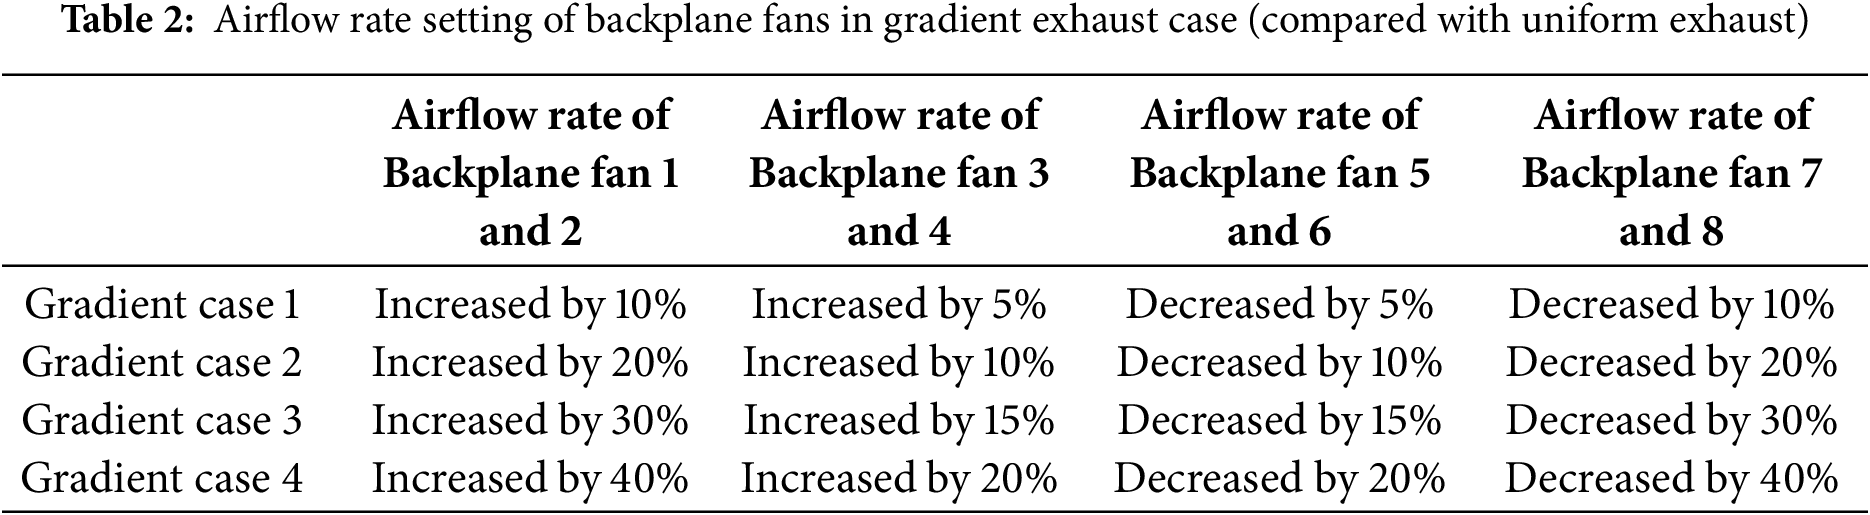
The airflow pattern and temperature field inside the cabinet were initially studied to determine the possible causes of server overheating. Subsequently, strategies to address the backflow around the servers, such as the airflow rate of the backplane fan, server layout, and the setting of blind plates, were systematically investigated.
3.1 Airflow Pattern in the Cabinet under Uniform Exhaust
The airflow pattern and temperature contour in the cabinet (x = 0 m, x = −0.26 m) under the basic case (uniform air supply, with the air flow rate of backplane fan set to 1.15 times the server airflow rate, also referred to as the ‘15% Redundancy Case’) are depicted in Fig. 4. Cooled air is drawn into the cabinet from the front door due to the influence of the backplane fan. The majority of the air flows into the servers under the effect of the server fan (referred to as ‘server air’), absorbing the heat generated by the servers and transforming into hot air. This hot air is then exhausted from the servers and enters the ‘public area’ between the servers and the backplane. A small portion of the air flows around the servers (referred to as ‘cabinet air’) and ascends toward the top of the cabinet under the influence of the thermal plume generated by the servers (average velocity in the z-direction (m/s) / average velocity in y-direction (m/s) = 0.65), creating a temperature gradient in the vertical direction. Hot air within the cabinet rises and accumulates at the top, where it cannot be fully exhausted by the backplane fans located there. Some of the hot air in the ‘public area’ is forced to flow back from the top of the cabinet and the sides of the servers to the front of the servers, re-entering the servers and forming a recirculation loop. This causes the inlet temperature of server 1 to increase by approximately 0.8°C compared to the ideal scenario (23°C). The ratio of the backflow rate to the server flow rate is about 1.52% in the uniform exhaust case (0.009 kg/s divided by 0.58 kg/s). A small amount of air also flows back from the lower side of the servers. Since the air temperature in this region is around 24°C, there is no significant increase in the inlet temperature of server 8. The velocity contour inside the cabinet is shown in Fig. 4c and d. Under the influence of the server fan, most of the cold air flows into the servers at a rate of approximately 0.9 m/s, while a small amount of air flows around the sides of the servers at a speed of about 0.5 m/s.
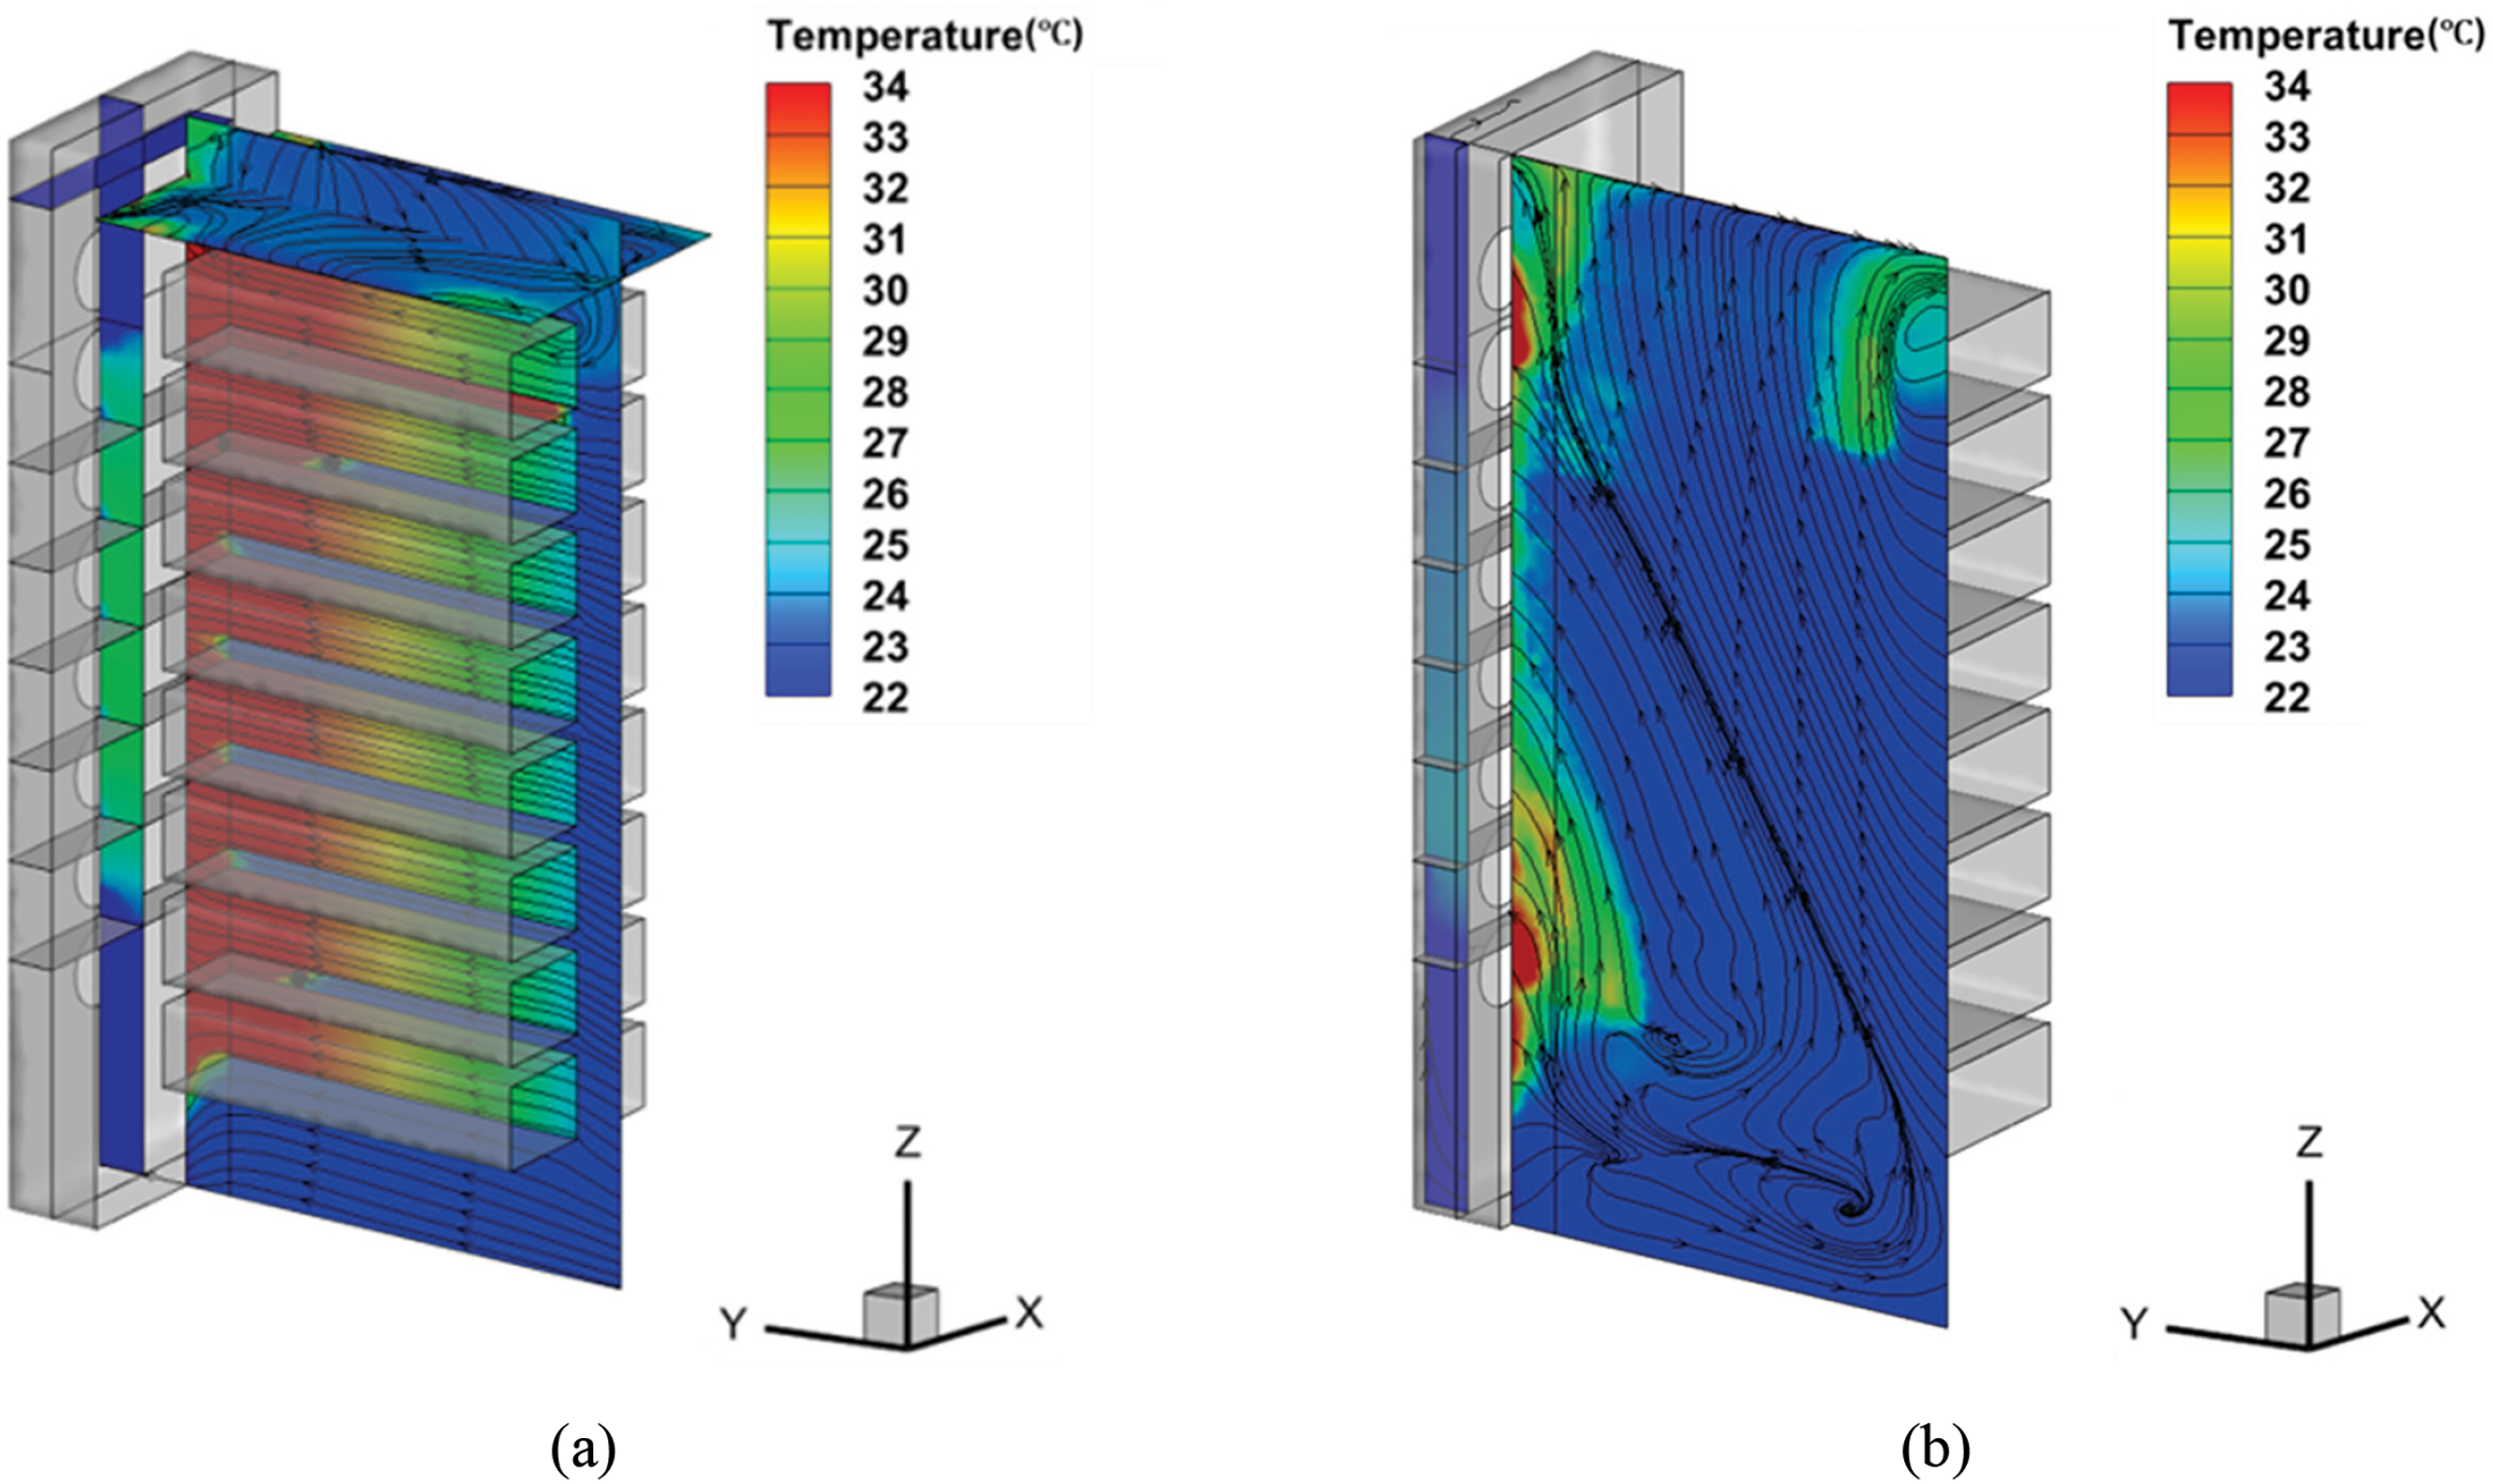
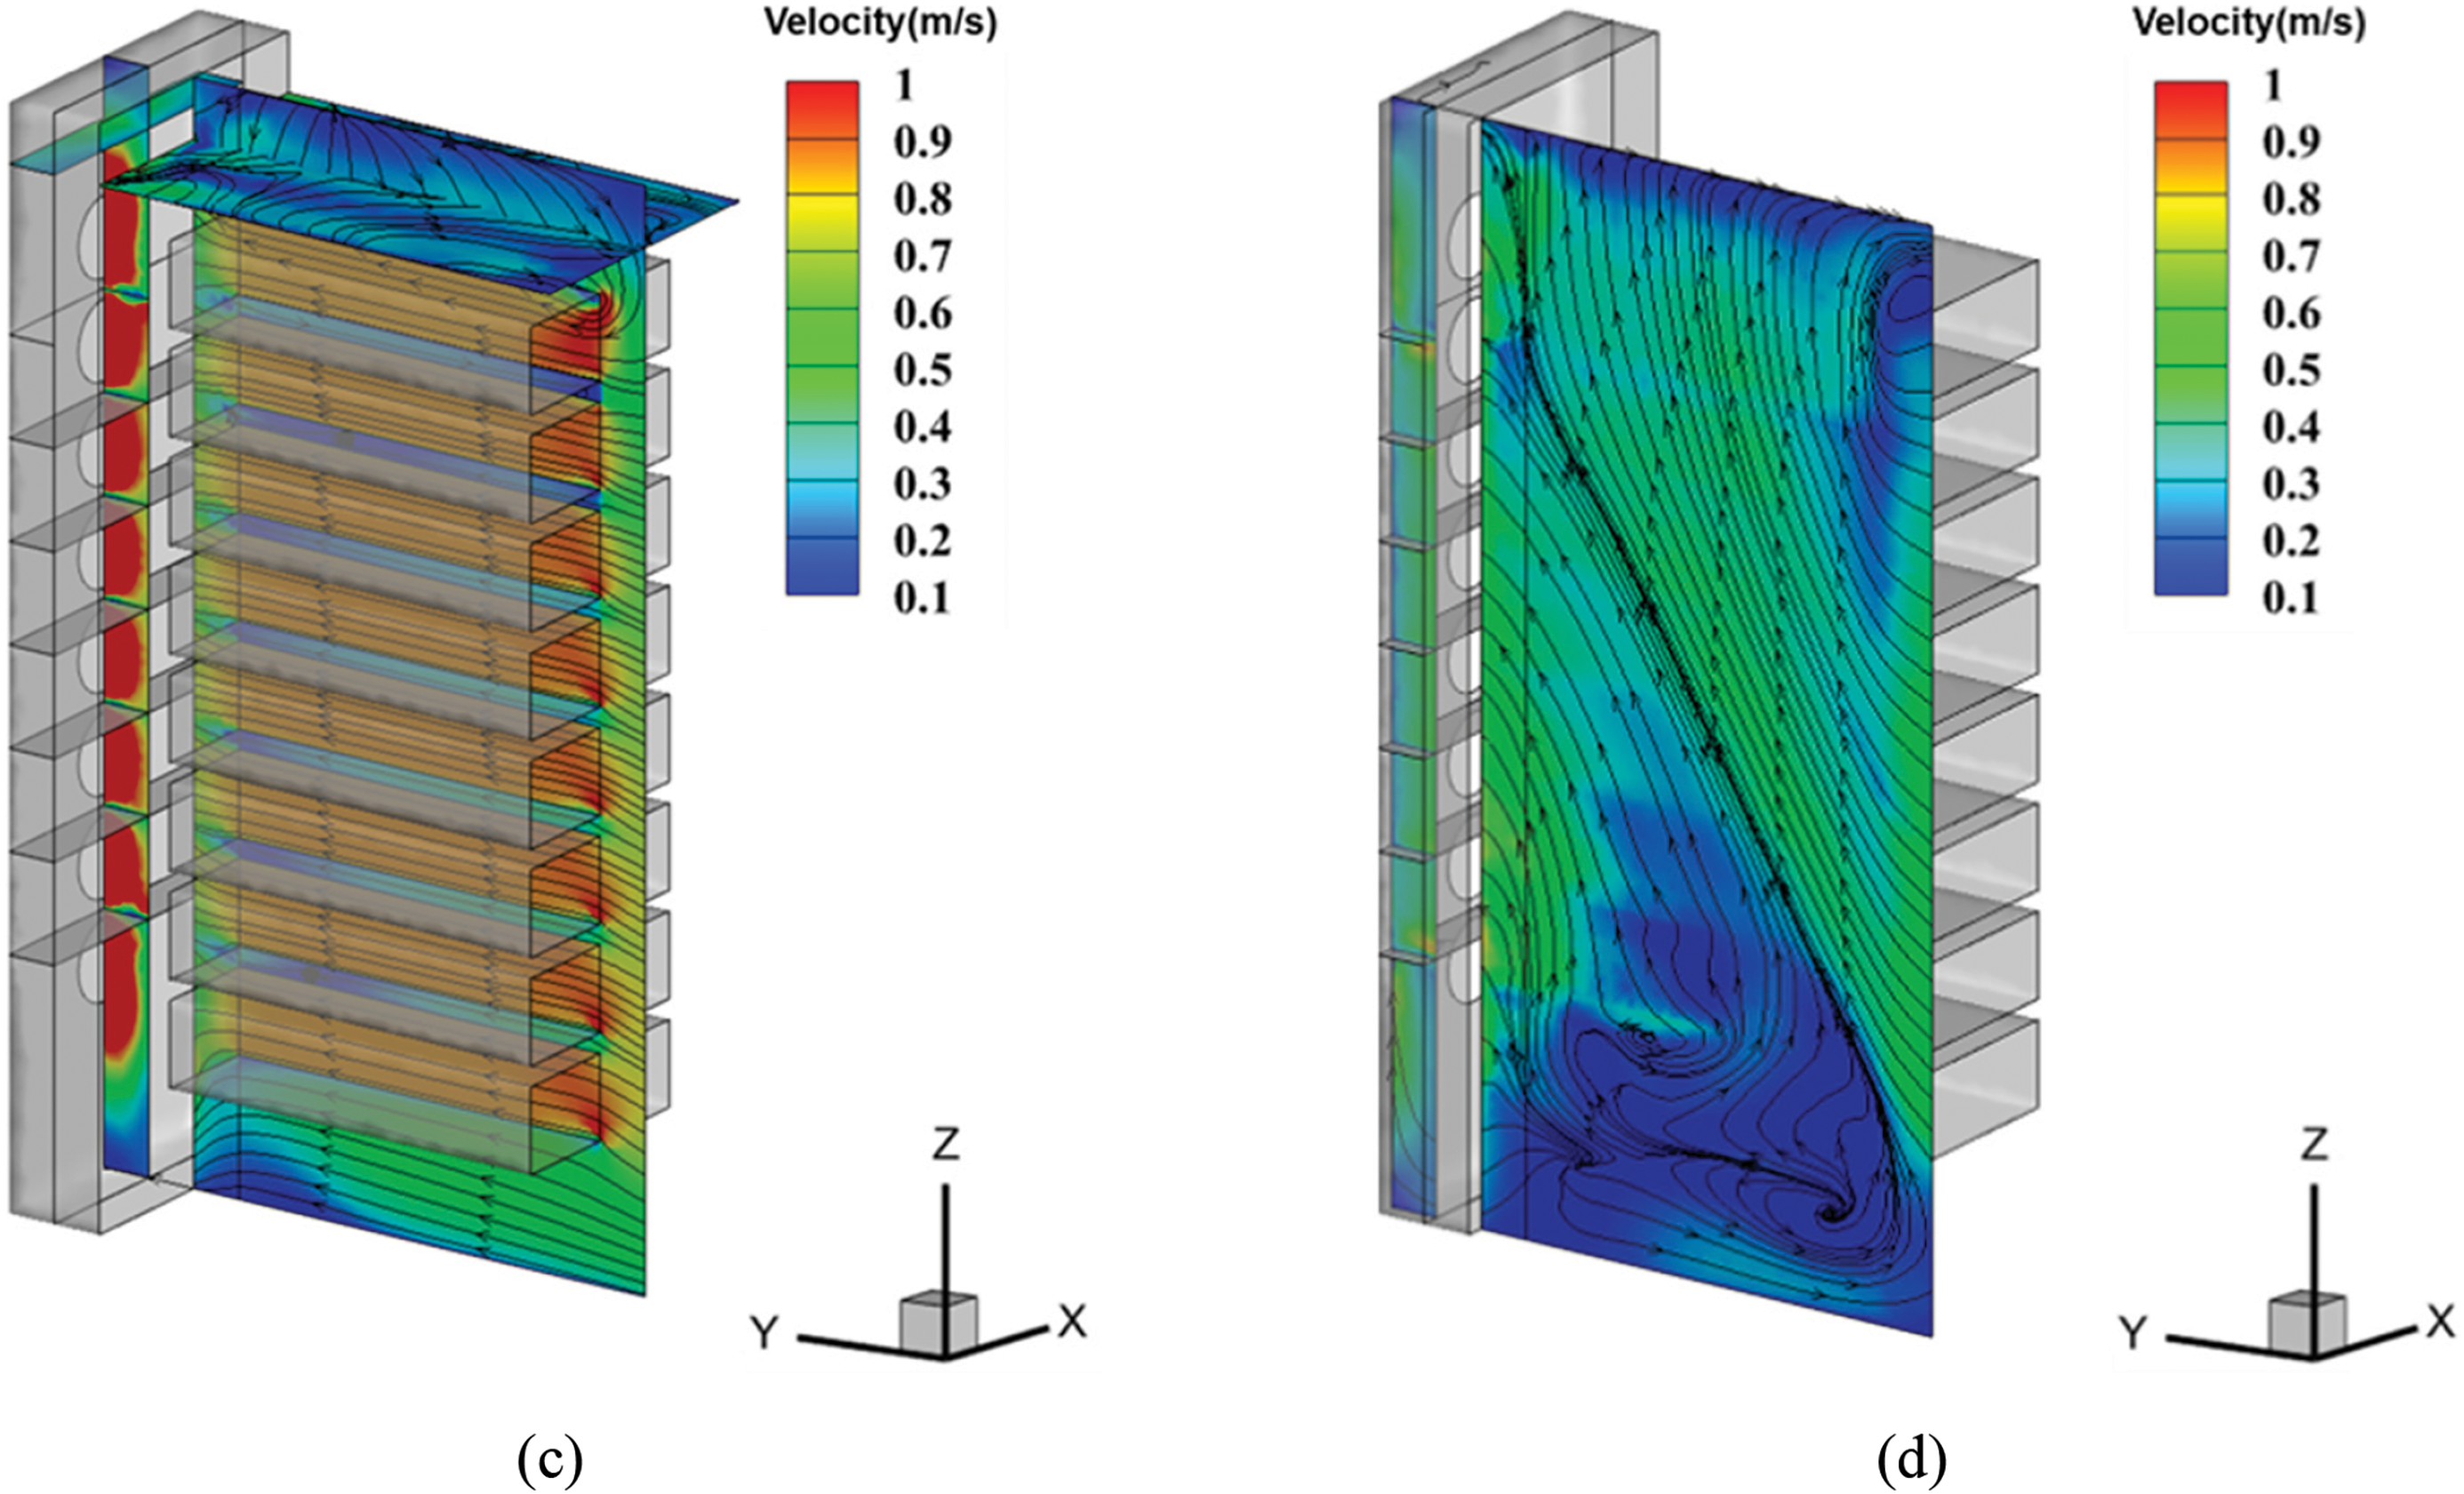
Figure 4: Airflow pattern and temperature in the (a) symmetry plane of the cabinet (x = 0 m) and the top plane (z = 2 m) and the (b) side plane (x = −0.26 m); The velocity contour in the (c) symmetry plane of the cabinet (x = 0 m) and the top plane (z = 2 m) and the (d) side plane (x = −0.26 m)
The flow rate of the ‘server air’ is primarily regulated by the server fan, which remains largely unaffected by the surrounding flow field. In contrast, variations in the operating pattern of the backplane fan predominantly influence the ‘cabinet air’. Specifically, the flow rate of ‘server air’ saw a marginal increase from 0.57 to 0.58 kg/s, whereas the flow rate of ‘cabinet air’ rose more significantly from 0.06 to 0.22 kg/s when transitioning from the ‘10% Redundancy Case’ to the ‘40% Redundancy Case’. The inlet temperature of the upper server is depicted in Fig. 5a. With the increase in flow rate redundancy, more hot air at the top of the cabinet is expelled, and backflow is effectively suppressed. Consequently, the inlet temperature of server 1 decreased from 26.1°C (0% Redundancy Case) to 23.1°C (40% Redundancy Case). Additionally, as illustrated in Fig. 5b, the impact of thermal buoyancy is mitigated, and the temperature uniformity along the vertical axis of the cabinet is enhanced by boosting the flow rate redundancy, thereby increasing the momentum of the airflow. Furthermore, under the uniform air supply scenario, hot air at the bottom of the cabinet ascends to the top due to thermal buoyancy. Given that the lower backplane fan maintains a high flow rate, it is inevitable that the airflow at the top and middle of the cabinet compensates for the airflow at the bottom, intensifying air circulation and exacerbating the thermal conditions at the cabinet’s base.
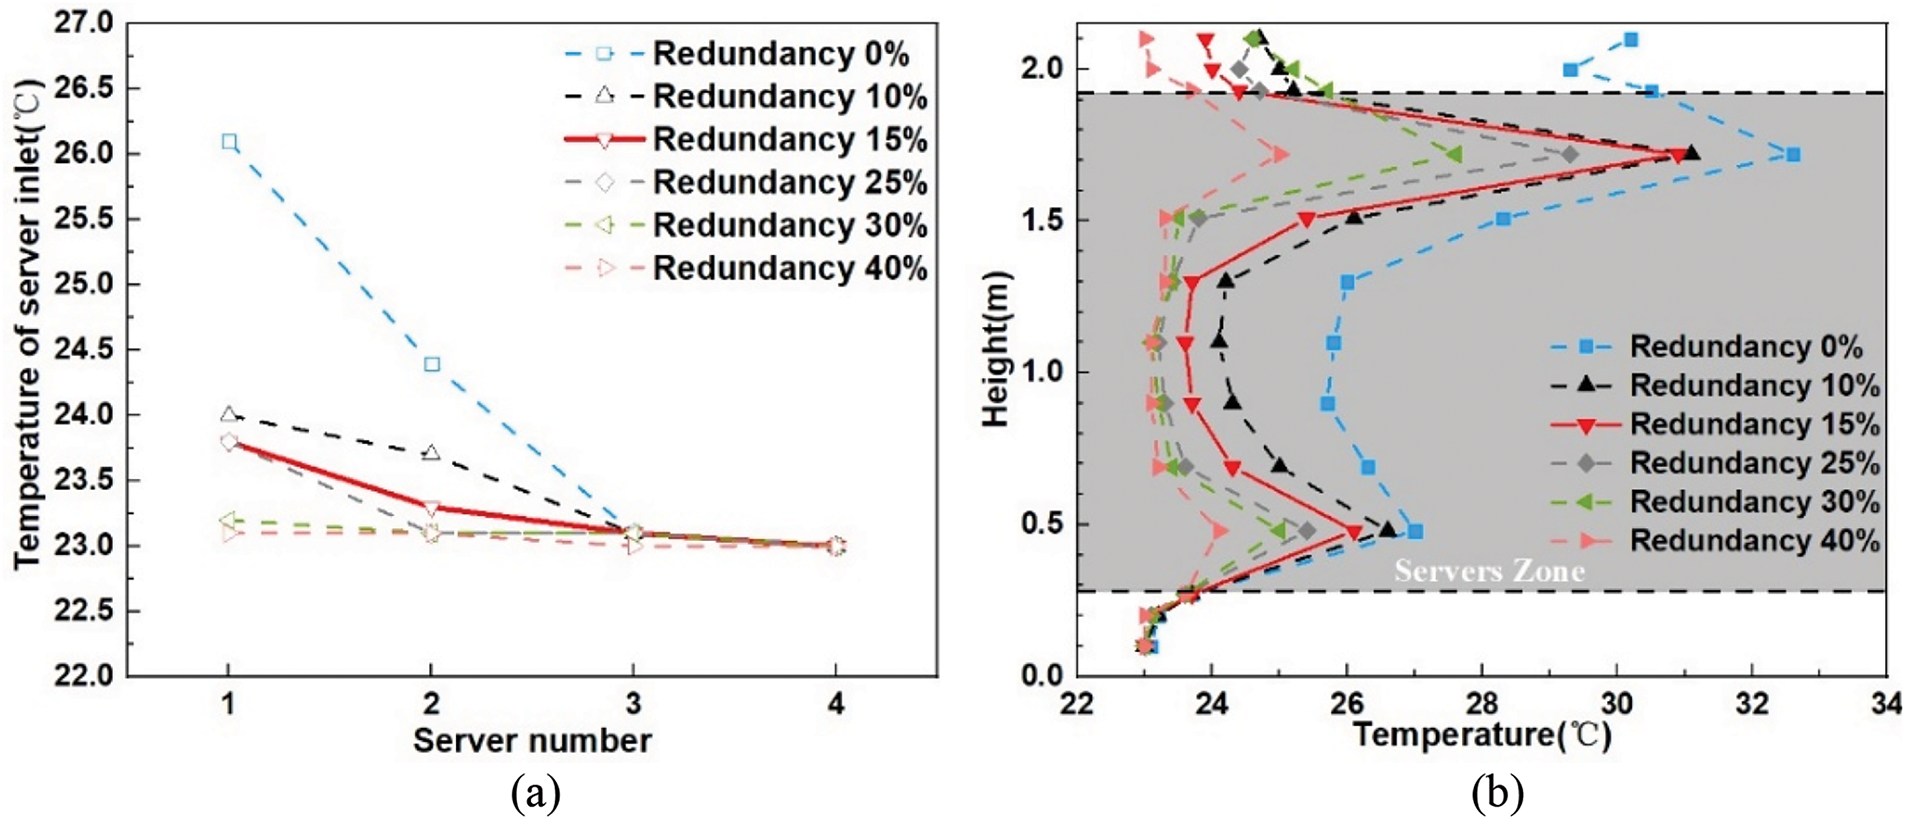
Figure 5: (a) Upper servers’ inlet temperature and (b) average temperature as a function of cabinet height of basic case and each redundancy case
3.2 Effect of Gradient Exhaust of Backplane Fan
Based on the above analysis, a high air flow rate of the backplane fan (more than 30% redundancy) can effectively inhibit backflow and reduce the temperature at the top of the cabinet. However, this comes at the cost of reduced cooling efficiency, as a higher proportion of cold air bypasses the servers. Since the primary cause of the temperature gradient and backflow is the increased air flow at the top of the cabinet due to thermal buoyancy, the basic case (15% Redundancy Case) is adopted, with adjustments to increase the air flow rate of the upper backplane fan and decrease that of the lower backplane fan. The temperature contour of the middle plane of the cabinet (y = 0.5 m) and the inlet temperature of each server are illustrated in Fig. 6. By increasing the air flow rate of the upper backplane fan (Gradient Case 3), more hot air at the top of the cabinet is expelled, and backflow at the top is significantly reduced. Under the gradient exhaust case, the ratio of backflow rate to server flow rate is approximately 0.57% (0.003/0.58), which is about 62.5% lower than that of the uniform exhaust case (0.009 kg/s). The inlet temperature of server 1 decreases by 0.7°C compared to the basic case, and the inlet temperatures across all servers become more uniform. However, if the exhaust gradient is excessively high (Gradient Case 4), the exhaust capacity of the lower backplane fan becomes insufficient, preventing the complete expulsion of hot air generated by the bottom server. This results in backflow at the bottom of the cabinet, causing the inlet temperature of server 8 to rise by 0.2°C compared to the basic case. Under Gradient Case 3, the inlet temperature of server 1 drops to 23.1°C, while the temperature at the bottom server inlet remains relatively stable, showing no significant increase.
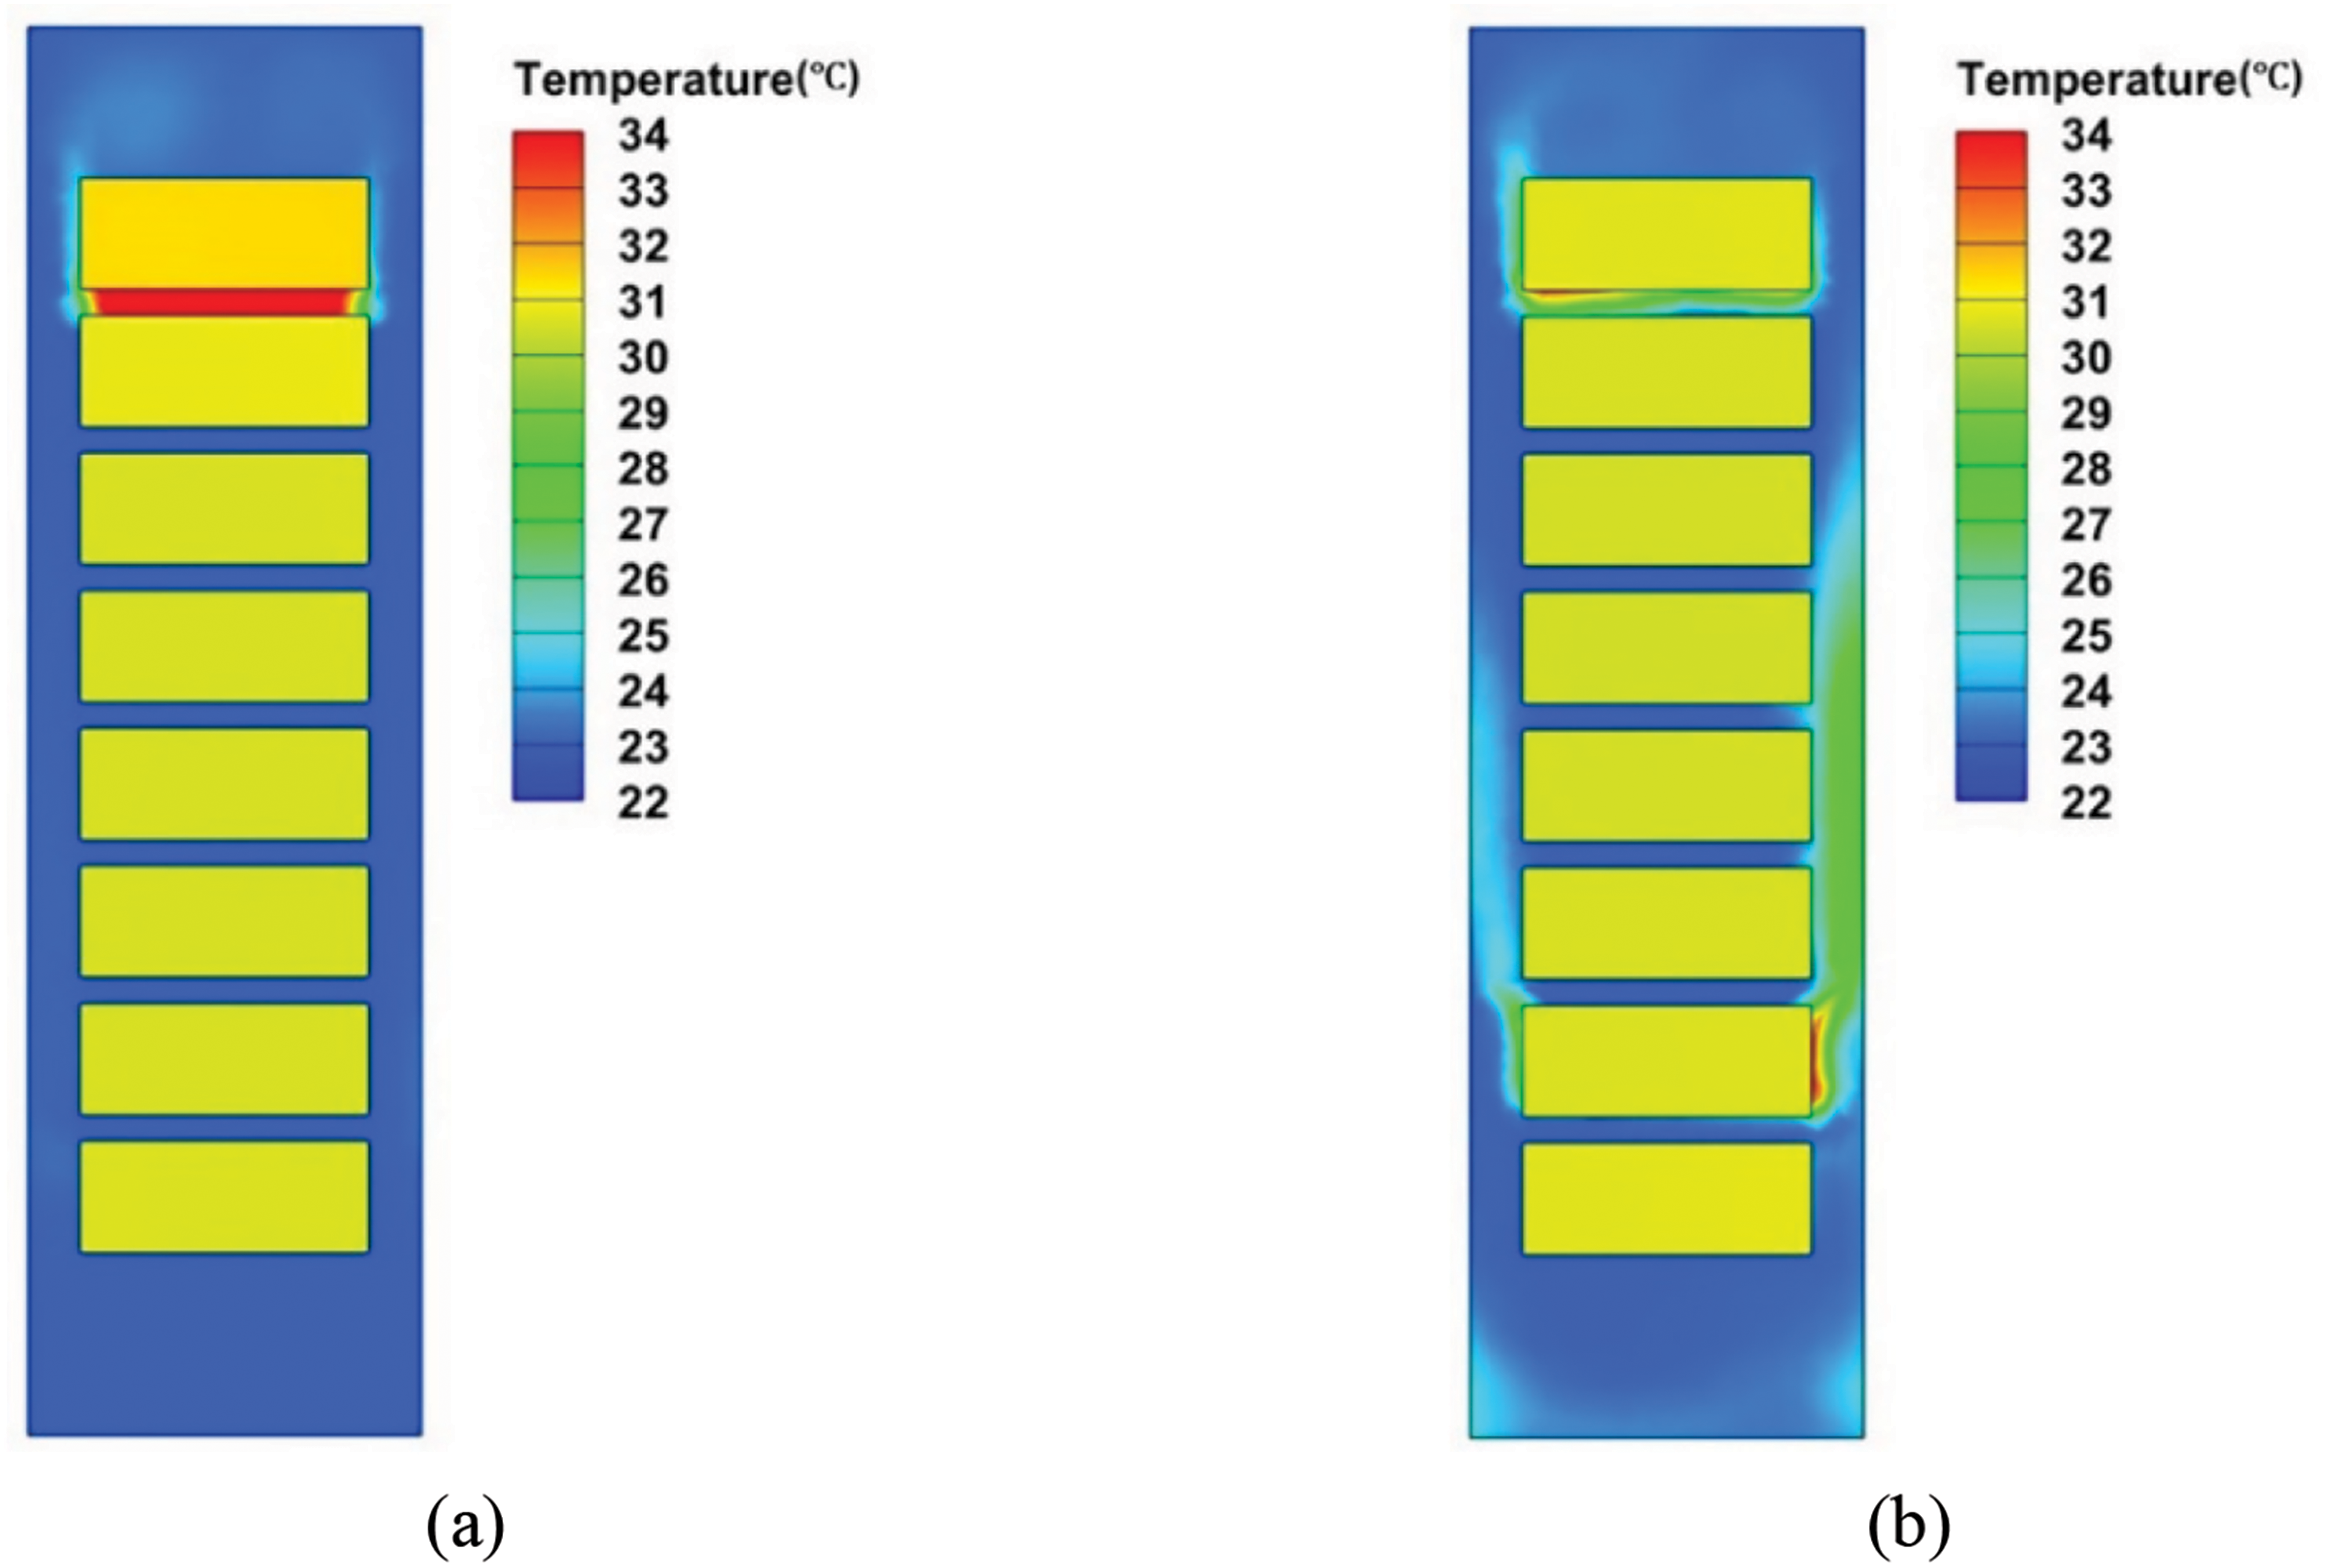
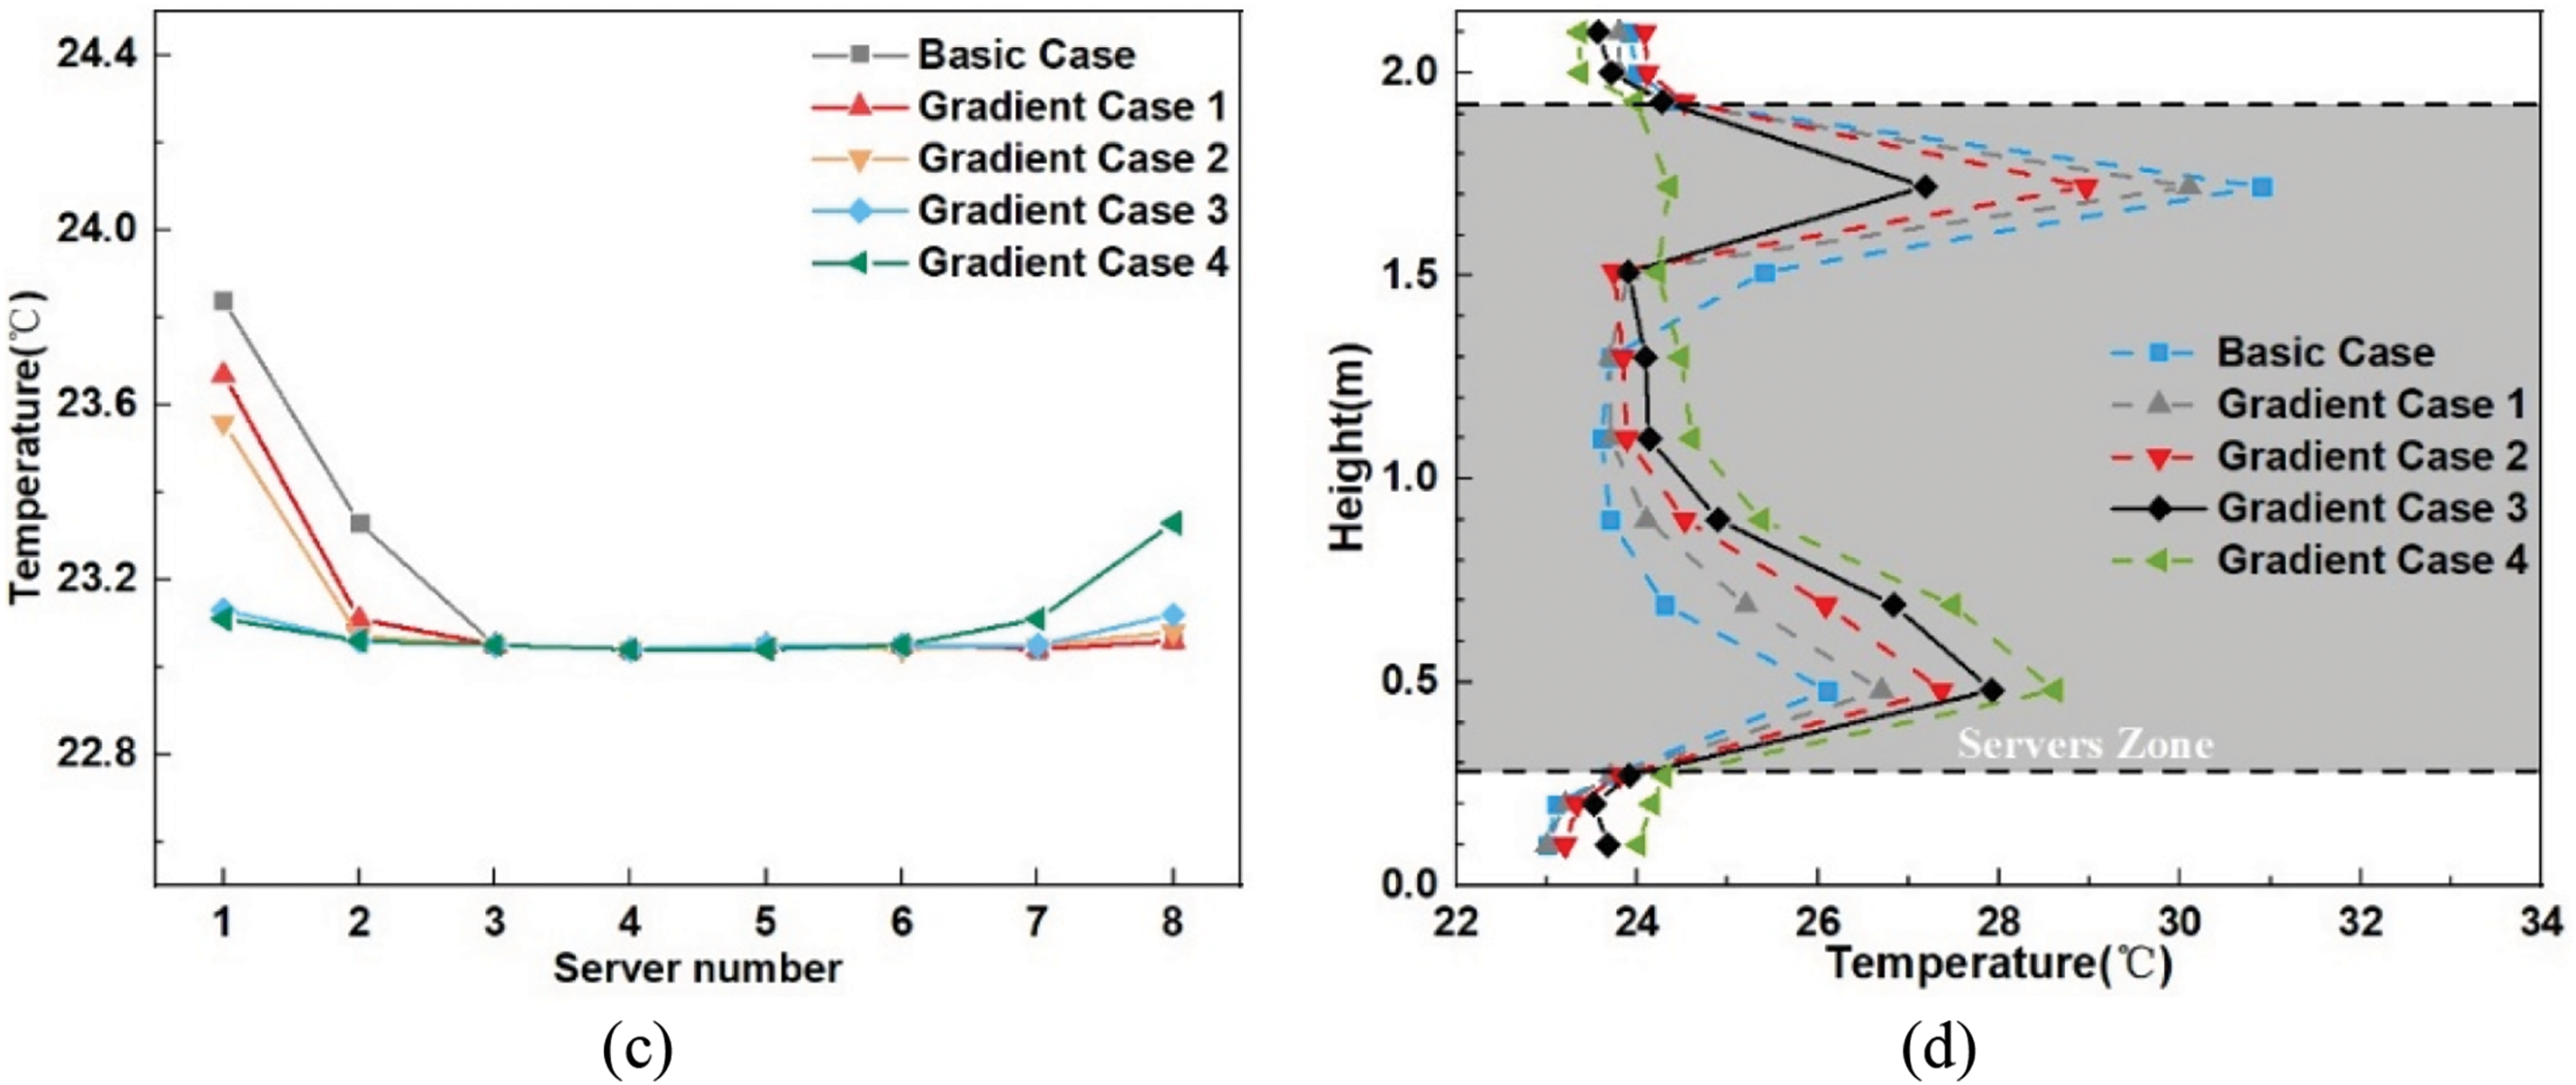
Figure 6: Temperature contour (y = 0.5 m) of (a) Basic Case and (b) Gradient Case 3; (c) inlet temperature of each server and (d) average temperature as a function of cabinet height of basic case and each gradient case
During the daily operation of data centers, servers are not always fully installed in cabinets. The absence of servers can significantly alter the airflow patterns and ventilation efficiency. This study investigates the air distribution of three server-partially-installed structures (where server 2, server 7, or server 4 is not installed). To align with the reduced heat generation of the servers, the cooling capacity of the backplane heat exchanger is reduced to 7/8 of its full capacity, and the backplane fan exhaust flow rate is also reduced while maintaining a 15% redundancy. The temperature contours of the symmetry plane (x = 0 m) for the three server-partially-installed structures under both uniform and gradient exhaust cases are shown in Fig. 7. Compared with the basic case, when server 7 is not installed, the exhaust air flow rate of each backplane fan is reduced, and the overall server layout is positioned higher. This configuration leads to more severe backflow at the top of the cabinet, resulting in the inlet temperature of server 1 rising to 25.2°C, which is 1.4°C higher than that of the basic case (23.8°C). In Gradient Case 3, the thermal environment in the middle of the cabinet improves, but backflow at the top remains significant. The inlet temperature of server 1 only drops to 23.6°C, which is still 0.5°C higher than that of the fully installed structure under gradient exhaust (23.1°C). When server 2 is not installed, the inlet temperatures of all servers are relatively low under uniform exhaust (with the highest inlet temperature of server 1 at 23.3°C). However, in Gradient Case 3 without server 2, due to the high exhaust flow rate of the lower servers, the hot air that cannot be expelled by the lower backplane fans flows upward into the vacant server space under the combined influence of thermal buoyancy and the high momentum exhaust at the top. This worsens the thermal environment at the top of the cabinet, causing the inlet temperature of server 1 to reach 25.1°C, which is 1.8°C higher than that of the uniform exhaust case. When server 4 is not installed, the inlet temperatures of all servers under uniform exhaust and the improvements under gradient exhaust fall between the two preceding cases. In the uniform exhaust case, the thermal environment at the top of the cabinet deteriorates due to the reduced airflow rate of the upper backplane fan, similar to the scenario when server 7 is not installed. In the gradient exhaust case, the hot air that cannot be discharged by the lower backplane fan flows into the space where server 4 is located, resembling the situation when server 2 is not installed. The results of these three cases demonstrate that the lower the position of the vacant server (i.e., the higher the overall server layout), the more effective the gradient exhaust strategy becomes.
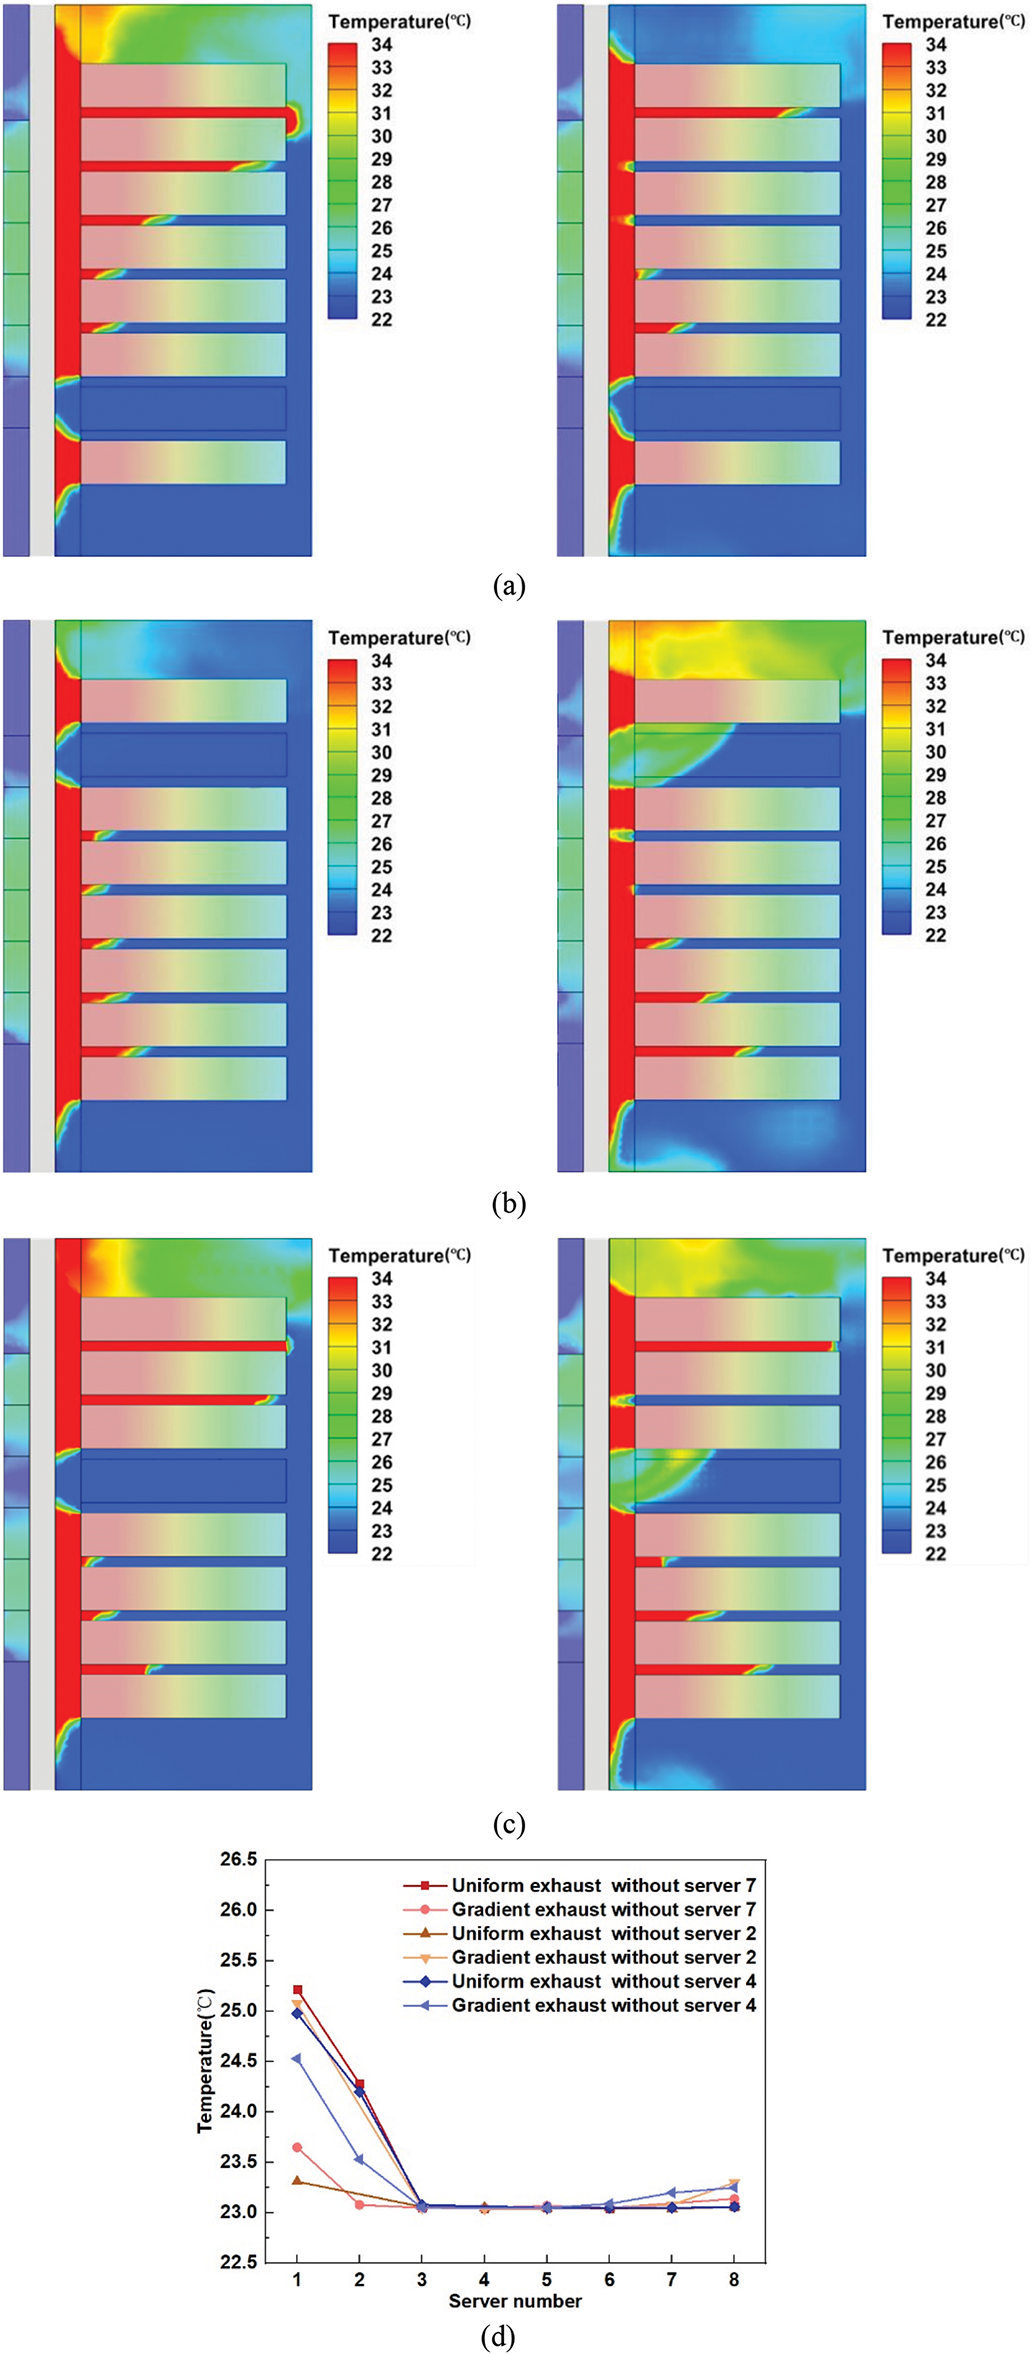
Figure 7: Temperature contour in the symmetry plane of the cabinet (x = 0 m) of the structure without server 2 (a), server 7 (b) and server 4 (c) under the 15% redundancy uniform exhaust case (left) and the gradient case 3 (right); (d) temperature of each server inlet under uniform exhaust and gradient exhaust cases when servers are not completely installed
3.3 Effect of Blind Plate to Backflow
Based on the above analysis, although gradient exhaust can reduce server inlet temperatures while lowering the backplane fan air flow rate, it lacks good adaptability to server-partially-installed structures, and the issue of cold energy waste persists. Installing blind plates is a common measure to prevent backflow and improve cooling efficiency in data centers. Cases with blind plates installed around the server outlet (y = 0.9 m) were investigated for both fully installed and partially installed server structures. The exhaust flow rate of the backplane fans was adjusted to match that of the servers, considering that the blind plates restrict the exhaust space of the cabinet to the server areas. The vertical velocity contour of the middle plane of the cabinet (y = 0.5 m) is shown in Fig. 8. The average vertical velocity of airflow in the cabinet is 0.1 m/s. The blind plates effectively prevent the hot air exhausted by the servers from flowing back to the server inlets. A small amount of air flows to the upper part of the cabinet under the influence of thermal buoyancy after absorbing heat from the server walls and the surrounding blind plates, resulting in the inlet temperature of server 1 (23.4°C) being slightly higher than the cabinet’s inlet temperature (23°C). After the installation of blind plates, the inlet temperatures of each server are shown in Fig. 9a. The inlet temperature of server 1 is 2.7°C lower than that of the uniform exhaust case without blind plates. In the partially installed server structure, the inlet temperature of server 1 remains at 23.4°C, and the inlet temperatures of the other servers do not exceed 23.1°C, indicating that the server installation configuration has minimal impact on the air distribution within the cabinet when blind plates are used. The average temperature of the ‘public area’ behind the server outlet as a function of cabinet height in the blind plate structure is shown in Fig. 9b. The presence of blind plates ensures a relatively uniform temperature in the ‘public area’ behind the servers, and the exhaust air temperature of the cabinet becomes more consistent. This uniformity is beneficial for temperature control in the equipment room, enhancing overall cooling efficiency and thermal management.
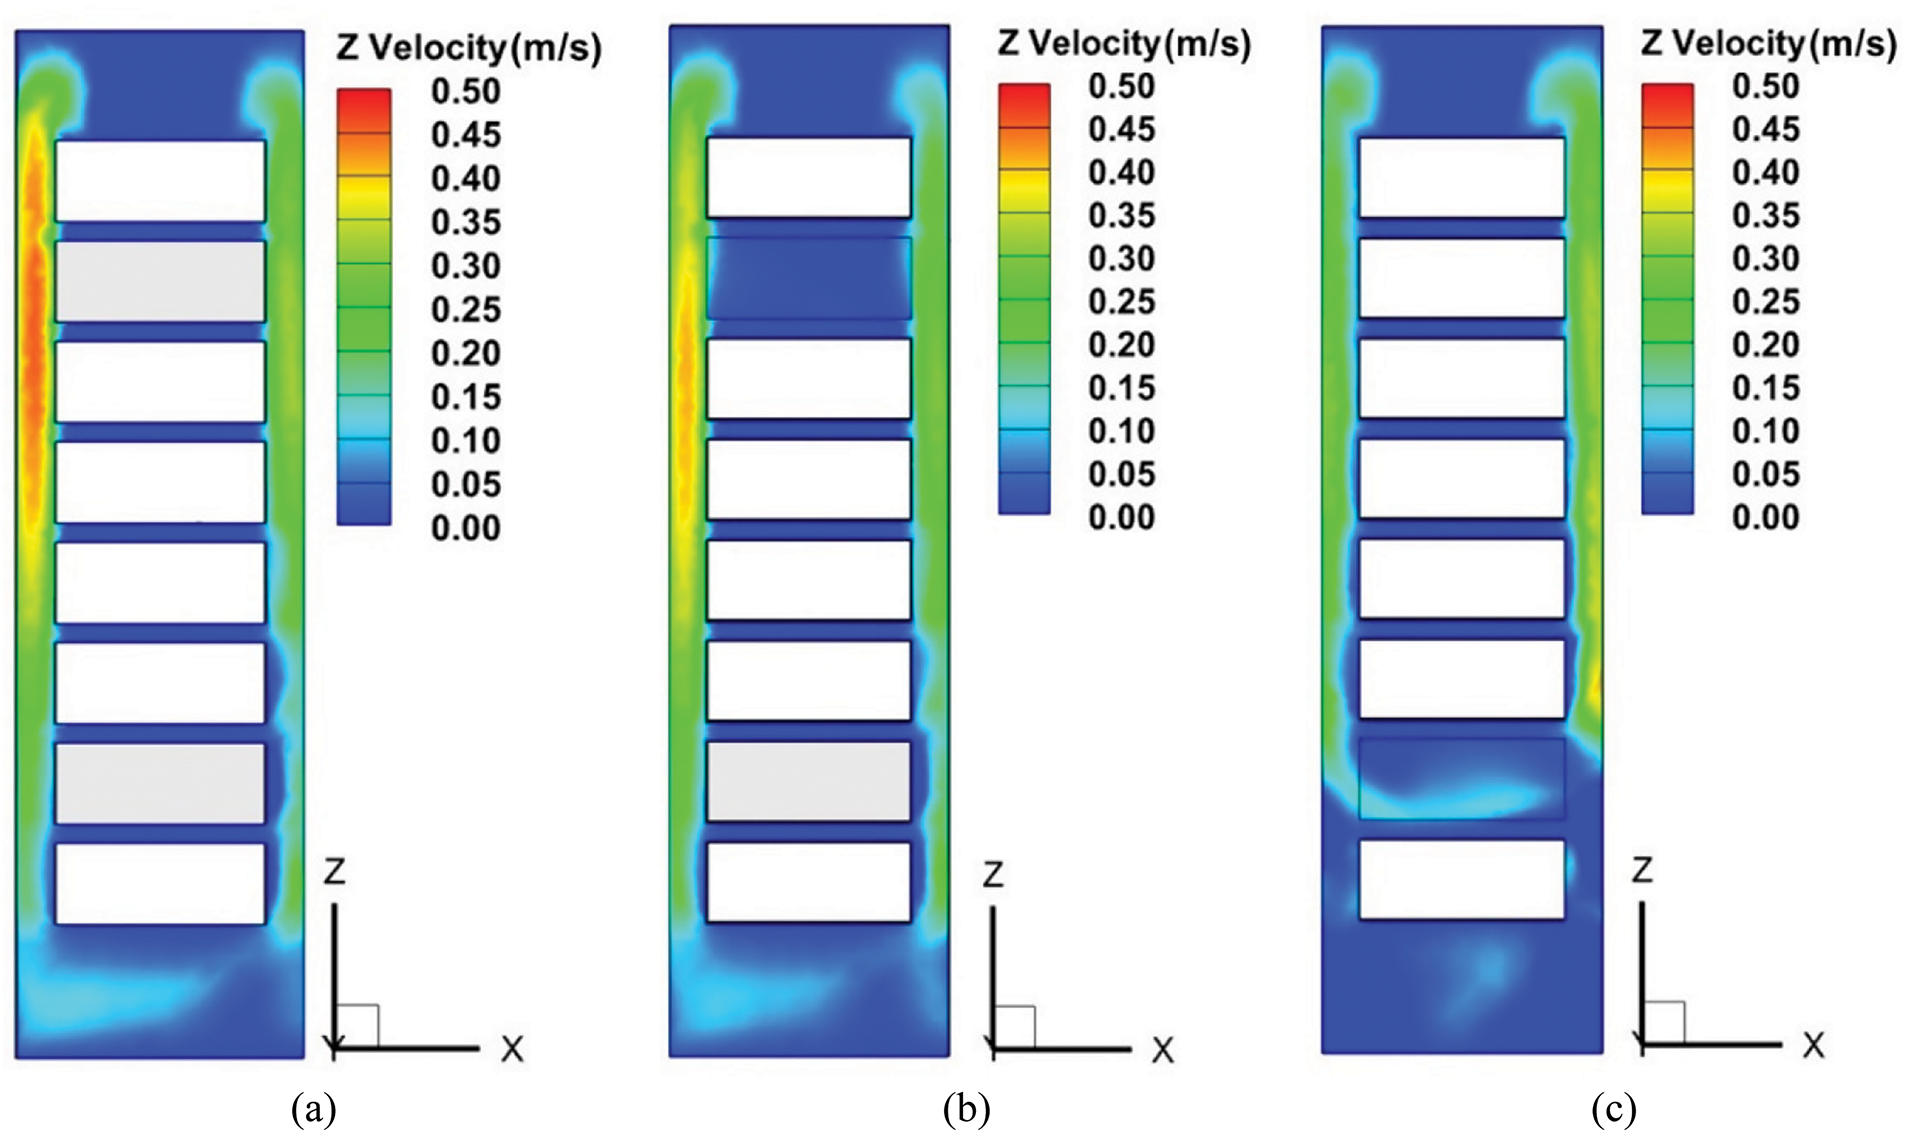
Figure 8: Vertical velocity contours in the mid-plane (y = 0.5 m) of the cabinet’s blind plate structure for (a) all servers installed, (b) server 2 removed, and (c) server 7 removed
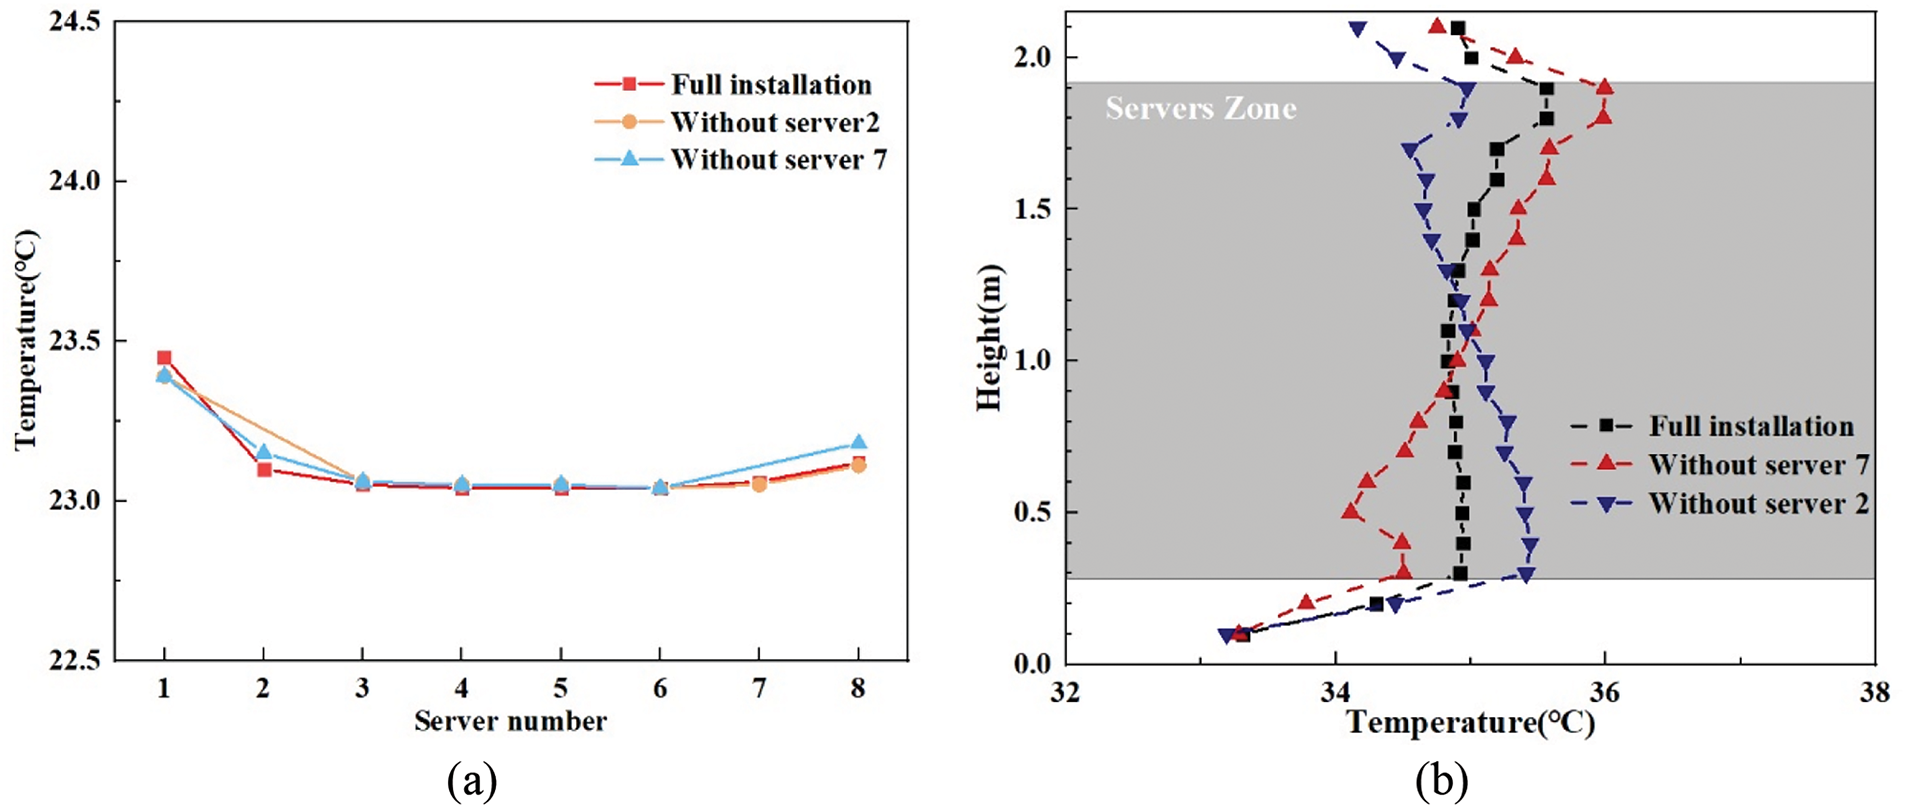
Figure 9: (a) Temperature of each server inlet under uniform exhaust with blind plate; (b) Average temperature of the ‘public area’ behind the server outlet as a function of cabinet height in the blind plate structure
In this study, the temperature gradient phenomenon within the cabinet is investigated, and the effects of gradient exhaust and blind plates on inhibiting backflow are explored. As shown in Fig. 4, backflow primarily occurs at the top of the cabinet, increasing the temperature of the top server, which aligns with the findings of Nada S A [14]. From Figs. 5 and 6, it is evident that under Gradient Case 3, the inlet temperatures of server 1 and server 2 are reduced to 23.1°C with 15% redundancy, matching the performance of the uniform exhaust case with 30% redundancy. This indicates that gradient exhaust can reduce exhaust redundancy by approximately 15%. Additionally, Figs. 5 and 9 demonstrate that the blind plate structure can lower the inlet temperature of server 1 by 2.7°C without requiring airflow redundancy in fully installed server configurations. Furthermore, Figs. 7 and 9 reveal that the blind plate structure reduces the inlet temperature of server 1 by 1.8°C compared to the uniform exhaust case with 15% redundancy in partially installed server structures. Studies by Lu et al. [11] and Feng et al. [31] on blind plates have shown that, compared to leaving the vacant parts of the cabinet open, installing blind plates can reduce server inlet temperatures by 4°C~13°C, further validating the effectiveness of blind plates in suppressing backflow. The inlet temperatures of each server under different structures, using gradient exhaust and blind plates, are summarized in Fig. 10. Both methods effectively reduce server inlet temperatures with lower airflow redundancy. While gradient exhaust does not significantly improve the thermal environment in the server-2-vacant structure, it successfully reduces the inlet temperature of server 1 to near-ideal levels in fully installed configurations. On the other hand, blind plates demonstrate excellent adaptability to various server layouts, requiring no airflow redundancy and thereby reducing the energy consumption of backplane fans. The exhaust pattern and internal cabinet structure have minimal impact on the inlet temperatures of central servers. However, upper servers are at a higher risk of overheating due to thermal buoyancy effects. Additionally, as illustrated in Fig. 4b, the airflow below the servers needs to exit the cabinet through the ‘public area’ directly opposite the server 8 outlet. The fan of server 8 creates high pressure in this area, inhibiting the exhaust of air beneath the server and causing backflow at the bottom of the cabinet. This backflow results in a temperature rise for server 8, further underscoring the importance of installing blind plates to mitigate such issues.
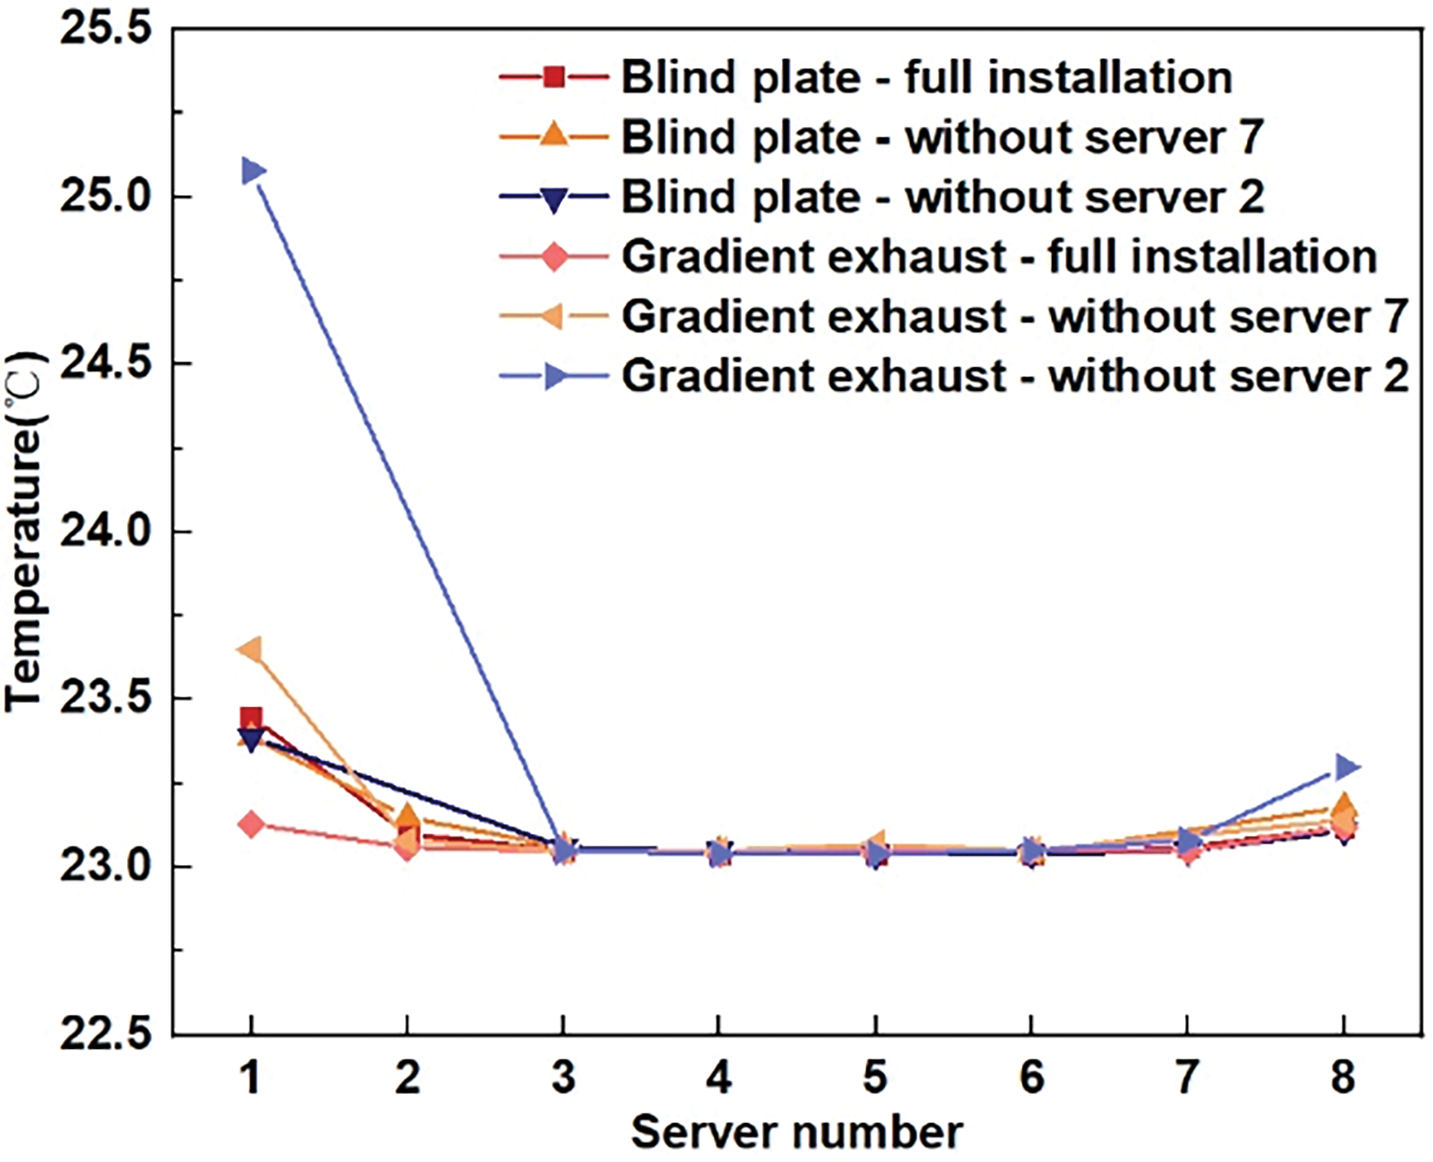
Figure 10: Temperature of each server inlet with different server structures under gradient exhaust case or blind plate structure
The contour of the age of air on the cabinet symmetry plane for both the uniform exhaust case and the gradient exhaust case is shown in Fig. 11. Under the uniform exhaust case, the maximum age of air is 51.99 s, and the average age of air is 14.37 s. In contrast, under the gradient exhaust case, the maximum age of air is reduced to 46.22 s, and the average age of air is slightly lower at 14.11 s. This indicates that the gradient exhaust strategy not only reduces the maximum age of air but also marginally improves the overall air freshness within the cabinet compared to the uniform exhaust approach.
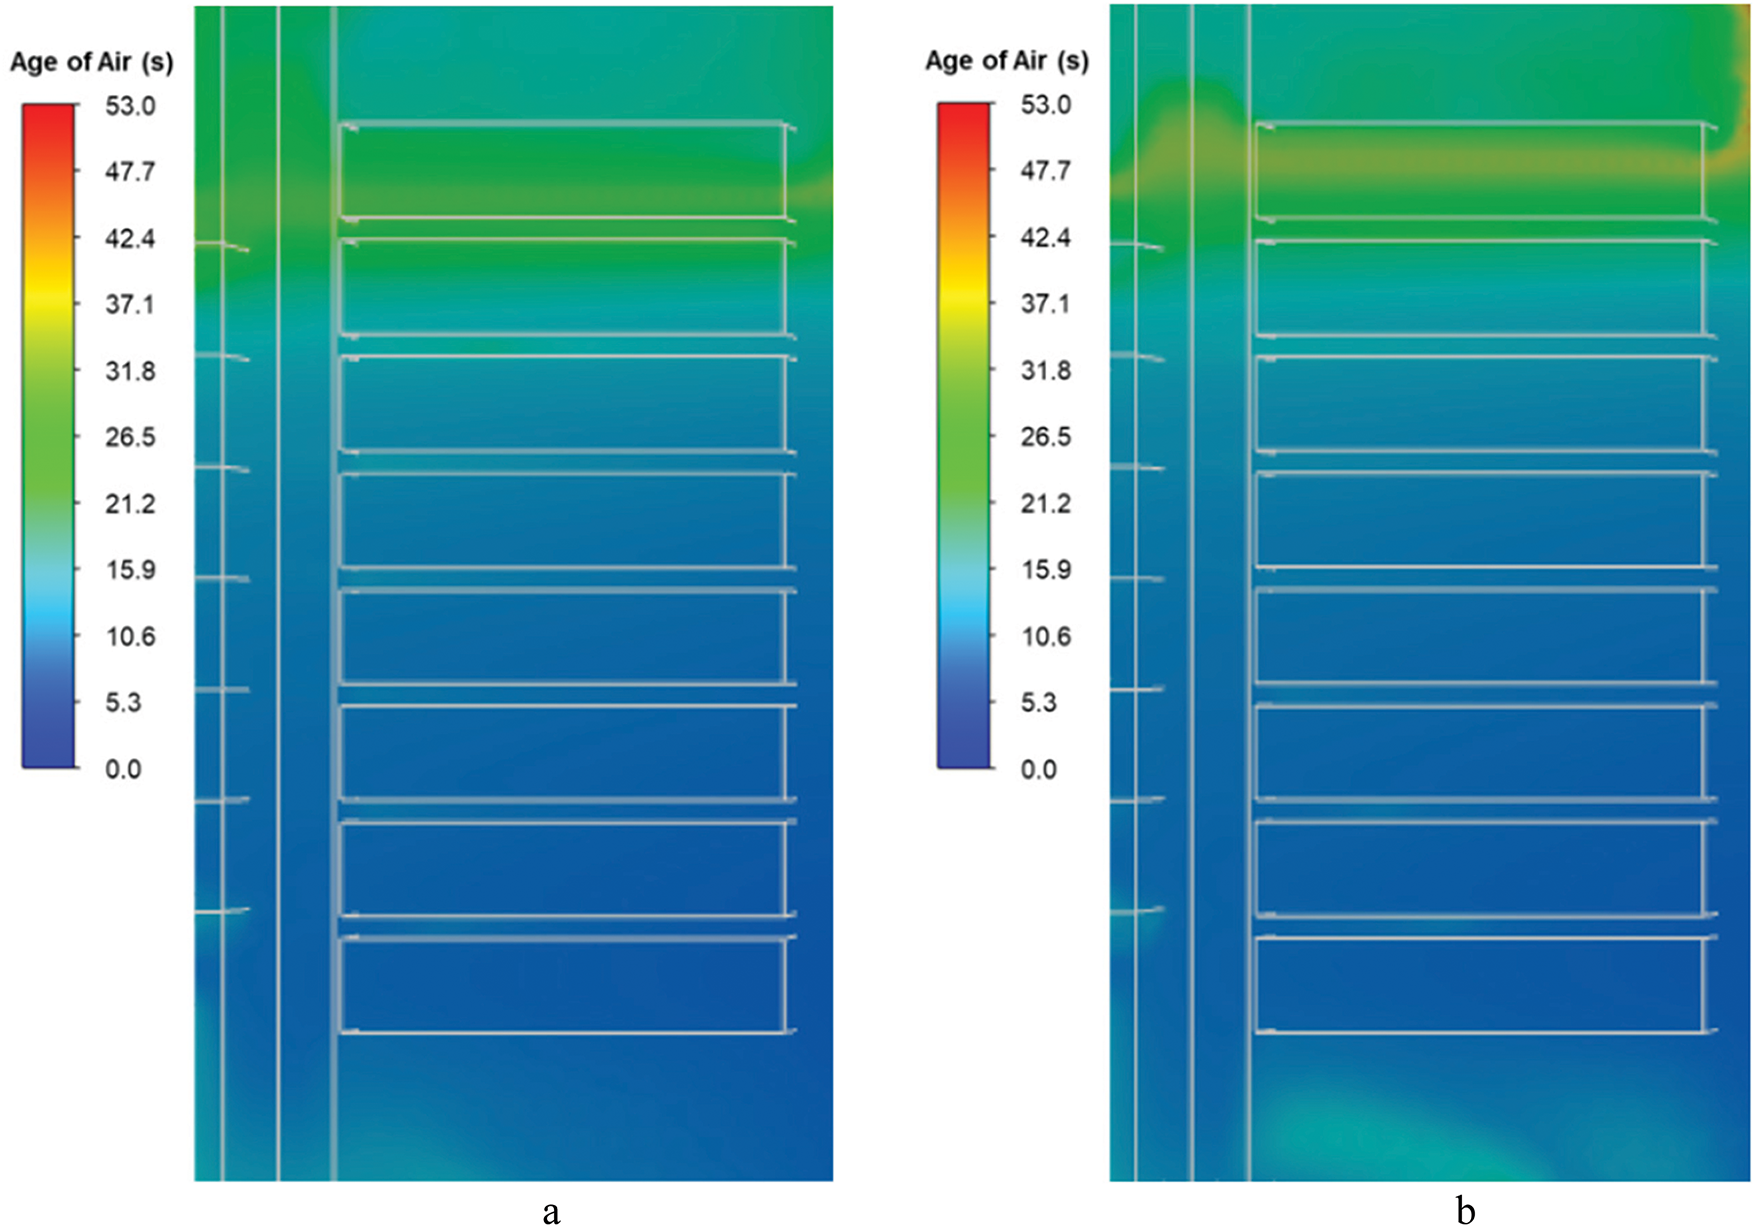
Figure 11: Contour of age of air cabinet symmetry plane of (a) uniform exhaust case and (b) gradient exhaust case
There are several limitations in our study that should be acknowledged. Firstly, the validation case used differs from the specific problem investigated. However, to the best of our knowledge, experimental research on detailed airflow patterns inside a cabinet is scarce. The validation case selected is the most suitable study available at this time, and future experimental investigations are planned to address this gap. Additionally, the inlet temperature of the cabinet is assumed to be a uniform 23°C, which may not fully reflect real-world conditions. The heat sources of the servers are treated as identical and constant, meaning the dynamic influence of server heat generation has not been explored. Furthermore, potential holes in the front door of the cabinet are ignored, which could affect the turbulence intensity of the cabinet air intake compared to actual scenarios. Pressure drops caused by internal structures such as cable management kits are also not considered. This research primarily focuses on the hot aisle inside the cabinet. To balance computational resources and accuracy, the server modeling was simplified. Critical components such as the GPU, CPU, and other internal units of the server were not modeled, which means the simulation cannot identify actual critical points. The height of the servers within the cabinet and the distance between the servers and the backplane heat exchanger may significantly impact the cabinet’s air distribution, but these factors were not systematically investigated in this study. Based on the findings related to the blind plate, the inlet temperature of server 1 was slightly higher than ideal due to a small amount of air flowing toward the top of the cabinet under thermal buoyancy after absorbing heat. Adding blind plates around the server inlet could potentially lower the server inlet temperature further, offering an area for future exploration. These limitations highlight opportunities for more detailed and realistic modeling in subsequent studies.
This study aims to address the challenges associated with air distribution in data center cabinets and investigates the backplane fan exhaust patterns and blind plate configurations in cabinets equipped with backplane air conditioning. Using a three-dimensional model of the cabinet and numerical simulations, the basic airflow patterns inside the cabinet under uniform exhaust conditions are analyzed. Additionally, the effects of gradient exhaust and blind plates on air distribution and server temperatures are studied, providing valuable data to support the application and performance improvement of backplane air conditioning systems. In the cases examined, the cabinet inlet temperature is set at 23°C, with each server consuming 875 W of power and the heat exchanger providing a cooling capacity of 7000 W. The key findings are summarized as follows:
Hot air rises and accumulates at the top of the cabinet due to the thermal plume generated around the servers. Increasing the exhaust airflow rate of the backplane fans can reduce the inlet temperature of server 1 from 26.1°C (0% Redundancy Case) to 23.1°C (40% Redundancy Case). In a specific gradient exhaust case (Gradient Case 3), the inlet temperature of server 1 can be reduced to 23.1°C with a 25% reduction in redundancy, while the temperatures of other servers remain largely unaffected. Compared to uniform exhaust, gradient exhaust reduces the inlet temperature of server 1 by 1.6°C in the server-7-vacant structure but increases it by 1.8°C in the server-2-vacant structure. The use of blind plates can reduce the inlet temperature of server 1°C to 23.4°C without requiring airflow redundancy, with the inlet temperatures of other servers not exceeding 23.1°C. In partially installed server structures, the inlet temperatures of all servers are nearly identical to those in the fully installed configuration, demonstrating the blind plate’s strong adaptability to different server layouts. Based on their effectiveness, the measures can be ranked in the following order of importance: setting blind plate, gradient exhaust,and increasing airflow redundancy.
Acknowledgement: The authors would like to thank the Basic Research Funds for the Central Government “Innovative Team of Zhejiang University”.
Funding Statement: This study was financially supported by the Basic Research Funds for the Central Government “Innovative Team of Zhejiang University” under contract number (2022FZZX01-09).
Author Contributions: Methodology: Yiming Rongyang; Conceptualization: Xiangdong Ding; Investigation: Xiangdong Ding; Validation: Chengyu Ji, Jianjian Wei; Formal analysis: Yiming Rongyang; Original draft: Yiming Rongyang, Xiangdong Ding; Editing: Yiming Rongyang, Xiangdong Ding, Chengyu Ji, Jun Gao, Jianjian Wei; Data curation: Jun Gao; Supervision: Jianjian Wei. All authors reviewed the results and approved the final version of the manuscript.
Availability of Data and Materials: The data that support the findings of this study are available from the corresponding author upon reasonable request.
Ethics Approval: Not applicable.
Conflicts of Interest: The authors declare no conflicts of interest to report regarding the present study.
References
1. Liu X, Hou G, Yang L. Optimizing data center energy consumption via energy complementarity scheduling. Energy Rep. 2024;12(5):5990–7. doi:10.1016/j.egyr.2024.11.032. [Google Scholar] [CrossRef]
2. He W, Zhang J, Li H, Liu S, Wang Y, Lv B, et al. Optimal thermal management of server cooling system based cooling tower under different ambient temperatures. Appl Therm Eng. 2022;207(4):118176. doi:10.1016/j.applthermaleng.2022.118176. [Google Scholar] [CrossRef]
3. Yu H, Zhang T, Chen L, Tao WQ. Refrigeration equipment model construction based in data center cooling station. Int J Green Energy. 2023;20(15):1741–9. doi:10.1080/15435075.2023.2194374. [Google Scholar] [CrossRef]
4. Zhang Q, Meng Z, Hong X, Zhan Y, Liu J, Dong J, et al. A survey on data center cooling systems: technology, power consumption modeling and control strategy optimization. J Syst Archit. 2021;119(1):102253. doi:10.1016/j.sysarc.2021.102253. [Google Scholar] [CrossRef]
5. Zhang Y, Zhao Y, Dai S, Nie B, Ma H, Li J, et al. Cooling technologies for data centres and telecommunication base stations-a comprehensive review. J Clean Prod. 2022;334:130280. doi:10.1016/j.jclepro.2021.130280. [Google Scholar] [CrossRef]
6. Isazadeh A, Ziviani D, Claridge D. Cooling technologies in datacom facilities: an overview and perspectives. In: 19th International Refrigeration and Air Conditioning Conference at Purdue; 2022 Jul 10–14; West Lafayette, IN, USA: PurdueUniversity; 2022. [Google Scholar]
7. Isazadeh A, Ziviani D, Claridge DE. Thermal management in legacy air-cooled data centers: an overview and perspectives. Renew Sustain Energ Rev. 2023;187:113707. doi:10.1016/j.rser.2023.113707. [Google Scholar] [CrossRef]
8. Li Z, Luo H, Jiang Y, Liu H, Xu L, Cao K, et al. Comprehensive review and future prospects on chip-scale thermal management: core of data center’s thermal management. Appl Therm Eng. 2024;251:123612. doi:10.1016/j.applthermaleng.2024.123612. [Google Scholar] [CrossRef]
9. Sun YX. Historical review on heating regions in China. Heat Ventilat Air Condit. 2014;44(6):1–6. (In Chinese). doi:10.19991/j.hvac1971.2014.06.001. [Google Scholar] [CrossRef]
10. Wang X, Wen Q, Yang J, Xiang J, Wang Z, Weng C, et al. A review on data centre cooling system using heat pipe technology. Sustain Comput: Inform Syst. 2022;35:100774. doi:10.1016/j.suscom.2022.100774. [Google Scholar] [CrossRef]
11. Lu H, Zhang Z, Yang L. A review on airflow distribution and management in data center. Energy Build. 2018;179(4):264–77. doi:10.1016/j.enbuild.2018.08.050. [Google Scholar] [CrossRef]
12. Shehabi A, Smith S, Hubbard A, Brown R, Herrlin M, Koomey J, et al. United States data center energy usage report; 2024. [Google Scholar]
13. Huang X, Yan J, Zhou X, Wu Y, Hu S. Cooling technologies for Internet data center in China: principle, energy efficiency, and applications. Energies. 2023;16(20):7158. doi:10.3390/en16207158. [Google Scholar] [CrossRef]
14. Nada SA, Elfeky KE. Experimental investigations of thermal managements solutions in data centers buildings for different arrangements of cold aisles containments. J Build Eng. 2016;5(7):41–9. doi:10.1016/j.jobe.2015.11.001. [Google Scholar] [CrossRef]
15. Liu Y, Ma Z, Chen M, Zhang WT, Li LD, Wang XL. Influence of floor air supply methods and impact of geometric parameters on the thermal performance of data centers. J Refrigerat. 2023;44(1):71–80. [Google Scholar]
16. Feng Y, Liu P, Zhang Z, Zhang W, Li L, Wang X. Influence of floor air supply methods and geometric parameters on thermal performance of data centers. J Therm Anal Calorim. 2023;148(16):8477–96. doi:10.1007/s10973-023-12188-z. [Google Scholar] [CrossRef]
17. Zhang J, Mao R, Li C, Lan J, Yi X, Zhang Z. Optimization air-conditioning system and thermal management of data center via fan-wall free cooling technology. Appl Therm Eng. 2023;234:121245. doi:10.1016/j.applthermaleng.2023.121245. [Google Scholar] [CrossRef]
18. Wu L, Mao R, Wu H, Zhang J, Li C, Yi X, et al. Optimization of airflow organization in fan-wall data center via baffles. Appl Therm Eng. 2024;244(3):122745. doi:10.1016/j.applthermaleng.2024.122745. [Google Scholar] [CrossRef]
19. Li X, Li M, Zhang Y, Han Z, Wang S. Rack-level cooling technologies for data centers—a comprehensive review. J Build Eng. 2024;90:109535. doi:10.1016/j.jobe.2024.109535. [Google Scholar] [CrossRef]
20. Yuan X, Liang Y, Pan Y, Kosonen R, Wang Y. Airflow management and energy saving potentials at a high-density data center with stepped-like server placement. Int J Green Energy. 2022;19(14):1554–67. doi:10.1080/15435075.2021.2016415. [Google Scholar] [CrossRef]
21. Yuan X, Xu X, Wang Y, Liu J, Kosonen R, Cai H. Design and validation of an airflow management system in data center with tilted server placement. Appl Therm Eng. 2020;164(7):114444. doi:10.1016/j.applthermaleng.2019.114444. [Google Scholar] [CrossRef]
22. Shalom Simon V, Modi H, Sivaraju KB, Bansode P, Saini S, Shahi P, et al. Feasibility study of rear door heat exchanger for a high capacity data center. In: ASME, 2022 International Technical Conference and Exhibition on Packaging and Integration of Electronic and Photonic Microsystems; 2022 Oct 25–27; Garden Grove, CA, USA; 2022. doi:10.1115/IPACK2022-97494. [Google Scholar] [CrossRef]
23. Muduli S, Panigrahi U. Numerical simulation of thermal performance of porous metal heat sink for cooling the CPU. In: 2022 International Electronics Symposium (IES); 2022 Aug 9–11; Surabaya, Indonesia: IEEE; 2022. p. 150–5. doi:10.1109/IES55876.2022.9888382. [Google Scholar] [CrossRef]
24. Wang L, Tang Y, Bai X, Mi R, Wang Y. Experimental and optimization research of the rack thermal environment based on the dynamic server power. J Build Eng. 2024;96(3):110591. doi:10.1016/j.jobe.2024.110591. [Google Scholar] [CrossRef]
25. Liu PC, Lin HT, Chou JH. Evaluation of buoyancy-driven ventilation in atrium buildings using computational fluid dynamics and reduced-scale air model. Build Environ. 2009;44(9):1970–9. doi:10.1016/j.buildenv.2009.01.013. [Google Scholar] [CrossRef]
26. Wang Y, Zhong K, Zhang N, Kang Y. Numerical analysis of solar radiation effects on flow patterns in street canyons. Eng Appl Comput Fluid Mech. 2014;8(2):252–62. doi:10.1080/19942060.2014.11015511. [Google Scholar] [CrossRef]
27. Menter FR, Langtry R, Völker S, Huang PG. Transition modelling for general purpose CFD codes. Eng Turb Model Exper. 2005;77(8):31–48. doi:10.1016/B978-008044544-1/50003-0. [Google Scholar] [CrossRef]
28. Posner JD, Buchanan CR, Dunn-Rankin D. Measurement and prediction of indoor air flow in a model room. Energy Build. 2003;35(5):515–26. doi:10.1016/S0378-7788(02)00163-9. [Google Scholar] [CrossRef]
29. Murakami S, Kato S, Nagano S, Tanaka S. Diffusion characteristics of airborne particles with gravitational settling in a convection-dominant indoor flow field. ASHRAE Transact. 1992;98(Part 1):82–97. [Google Scholar]
30. ASHRAE. Thermal Guidelines for data processing environments. 5th ed. Atlanta, GA, USA: ASHRAE; 2021. [Google Scholar]
31. Feng X, Zhang Z, Zhang Y, Zhang Y, Yao Y, Wang X. Investigating thermal performance and energy efficiency in under-floor air distribution data centers: a case study. Therm Sci Eng Progress. 2024;54(1):102823. doi:10.1016/j.tsep.2024.102823. [Google Scholar] [CrossRef]
Cite This Article
 Copyright © 2025 The Author(s). Published by Tech Science Press.
This work is licensed under a Creative Commons Attribution 4.0 International License , which permits unrestricted use, distribution, and reproduction in any medium, provided the original work is properly cited.
 Downloads
 Citation Tools