
 Submit a Paper
 Propose a Special lssue
 Open Access
ARTICLE

Comparative Study on the Performance of a Solar Air Heater Using Aluminum Soda Cans with “Different Arrangements”
Electromechanical Engineering Department, University of Technology, Baghdad, 10066, Iraq
* Corresponding Author: Ameer Abed Jaddoa. Email:
Frontiers in Heat and Mass Transfer 2025, 23(3), 975-990. https://doi.org/10.32604/fhmt.2025.064025
Received 01 February 2025; Accepted 21 April 2025; Issue published 30 June 2025
 View Full Text
 Download PDF
Abstract
The comparison of experimental performance was studied for soda cans: longitudinal, transverse, diagonal, and smooth cases to improve the heat transfer rate and thermal performance of the solar air heater, in this study using a frame which has 1.5 m × 0.5 m × 0.05 m dimensions, the arrangements were placed on the absorber plate inside the channel, raising the air’s exit temperature as it passed by. The work was carried out for 4 cases in January in Baghdad, Iraq, under specific conditions to compare them to reach the ideal case and the best performance evaluation. When the collector was tilted 350 to the horizontal facing south, The range of mass flow rate was from 0.012 to 0.049 kg/s, and the range of Re was from 2000 to 10,000. The results show that the best Nusselt number in the diagonal AL cans case was increased to 112 at Re = 10,000. Then the thermal efficiency increased to 98% accompanied by a moderate decrease in the fraction factor to reach 0.435. Aluminum cans also provide good economic support for solar systems due to their low cost, in addition to their recycling and reducing pollution.Keywords
Solar collectors that use air as a working fluid are called solar air heaters. Space heating and drying procedures are examples of widespread applications. Among their benefits are their ease of production and maintenance [1,2]. Among all renewable energy sources, solar energy is the most abundant and varied, and it is utilized in many different ways to supply buildings with clean electricity and drying applications [3–5]. To improve the heat transfer between the absorbent plate and the air, researchers have employed a variety of techniques in the literature to produce vortices to disrupt the airflow. The rate of heat transmission is increased when the viscous barrier sub-layer is broken near the surface of the absorption plate [6–9]. Because of the inefficient heat transmission between the absorber plate and the air duct, solar air heating using non-restrictive material is thought to have low thermal efficiency [10–12]. Cans of soda are recycled. Soda cans have been discovered to function as solar collector receivers for air heaters, which is of greater significance along the value chain [13]. Millions of beverage (soda) cans are thrown away every day worldwide, and they are primarily made of aluminum and are not biodegradable. 92.5% to 97% aluminum, 5.5% magnesium, 1.6% manganese, 0.15% chromium, and trace amounts of iron, silicon, and copper make up the alloy used to make a normal soda can [14]. Recent studies, (SCAH) absorption panel, which has 15 can columns with 16 soda cans glued together and arranged sequentially in each column, was the subject of some recent studies that looked into its performance in a four-pass mode active system, it can elevate the air temperature through it to 128°C, which is high enough for industrial application [15]. A study [13] evaluated the effectiveness of a pop-can solar drier, which dries products using an indirect passive mode without storing thermal energy. They compared their design with performance testing using variables like moisture content and temperature using single pass and four pass, this study examines how temperature and moisture content change over time and how this affects the rate at which chilies dry [16] evaluated of longitudinal and transverse four-pass, different tilt angles of 0°, 7°, 14°, 21°, and 28° were used for the testing daily from 8:00 a.m. to 17:00 p.m. They calculated and compared the efficiency, The transverse configuration demonstrated a 15% higher cumulative efficiency and a 10% greater useful energy gain than the longitudinal arrangement, even at low insolation values. Temperatures between roughly 105.4 and 103.1 degrees Celsius at a mass flow rate of 0.019 kg/s [17]. An experimental investigation looked at the results of using solar food dehydrators with longitudinal aluminum cans to dry agricultural products. The result shows that the temperature inside the dehydrator’s drying chamber is significantly higher than the outside temperature. 50°C was the highest temperature that could be reached. Ref. [18] presents an experimental assessment and mathematical model of solar air heating appropriate for uses like agricultural drying and space heating, taking into account both single and multi-pass flow configurations with transverse aluminum cans. The results of experimental tests and numerical studies using forced and natural convection on the five-pass solar air heater were compared and validated. The outcomes were especially advantageous in areas with limited financial resources. Few numerical and experimental research have been identified to investigate the possibilities of various arrangements of AL cans in the review of all the prior literature.
In this study, aluminum cans were used in longitudinal, transverse, and diagonal arrangements which is considered a new idea from previous studies in the design of the SCAH, and compared between these to obtain the best performance and gain, the Nusselt number and friction factor for these systems are predicted experimentally as well as to investigate the factors influencing the thermo hydraulic performance parameter and thermal efficiency.
In the future, it can be enhanced by using various can shapes (such as elliptical, triangular, or multifaceted) and spacing patterns to see if they can further enhance heat transfer without causing excessive pressure drops. The improved analysis performance can be used in many everyday applications, such as heating and drying clothes, fruits, and vegetables, as well as contributing to adding thermal energy to micro-grids with a greater number of solar collectors, also can use high-fidelity computational fluid dynamics (CFD) simulations to visualize flow patterns, turbulence structures, and temperature fields around cans.
A solar air heater (SAH) with a rectangular duct that is 1.5 m long, 0.5 m wide, and 0.05 m high from a wooden frame makes up the experimental work for this study. A conduit with a clear glass cover on top. The absorbent plate was made of metal, measuring 1.5 m by 0.5 m and having a thickness of 0.003 m. It was covered in black paint to facilitate heat transmission and maximize heat absorption. Aluminum cans were arranged to study their effect on performance. A K-type thermocouple was also used to measure the temperature in different areas of the SAH and connected to an Arduino which gives data to a laptop. To determine the flow, the duct’s flow speed was measured using an anemometer, the pressure differential between the duct’s intake and output was measured using a digital manometer, and the amount of sun radiation using a solar meter and airflow was forced via a blower, the structure of system explained in Figs. 1 and 2.
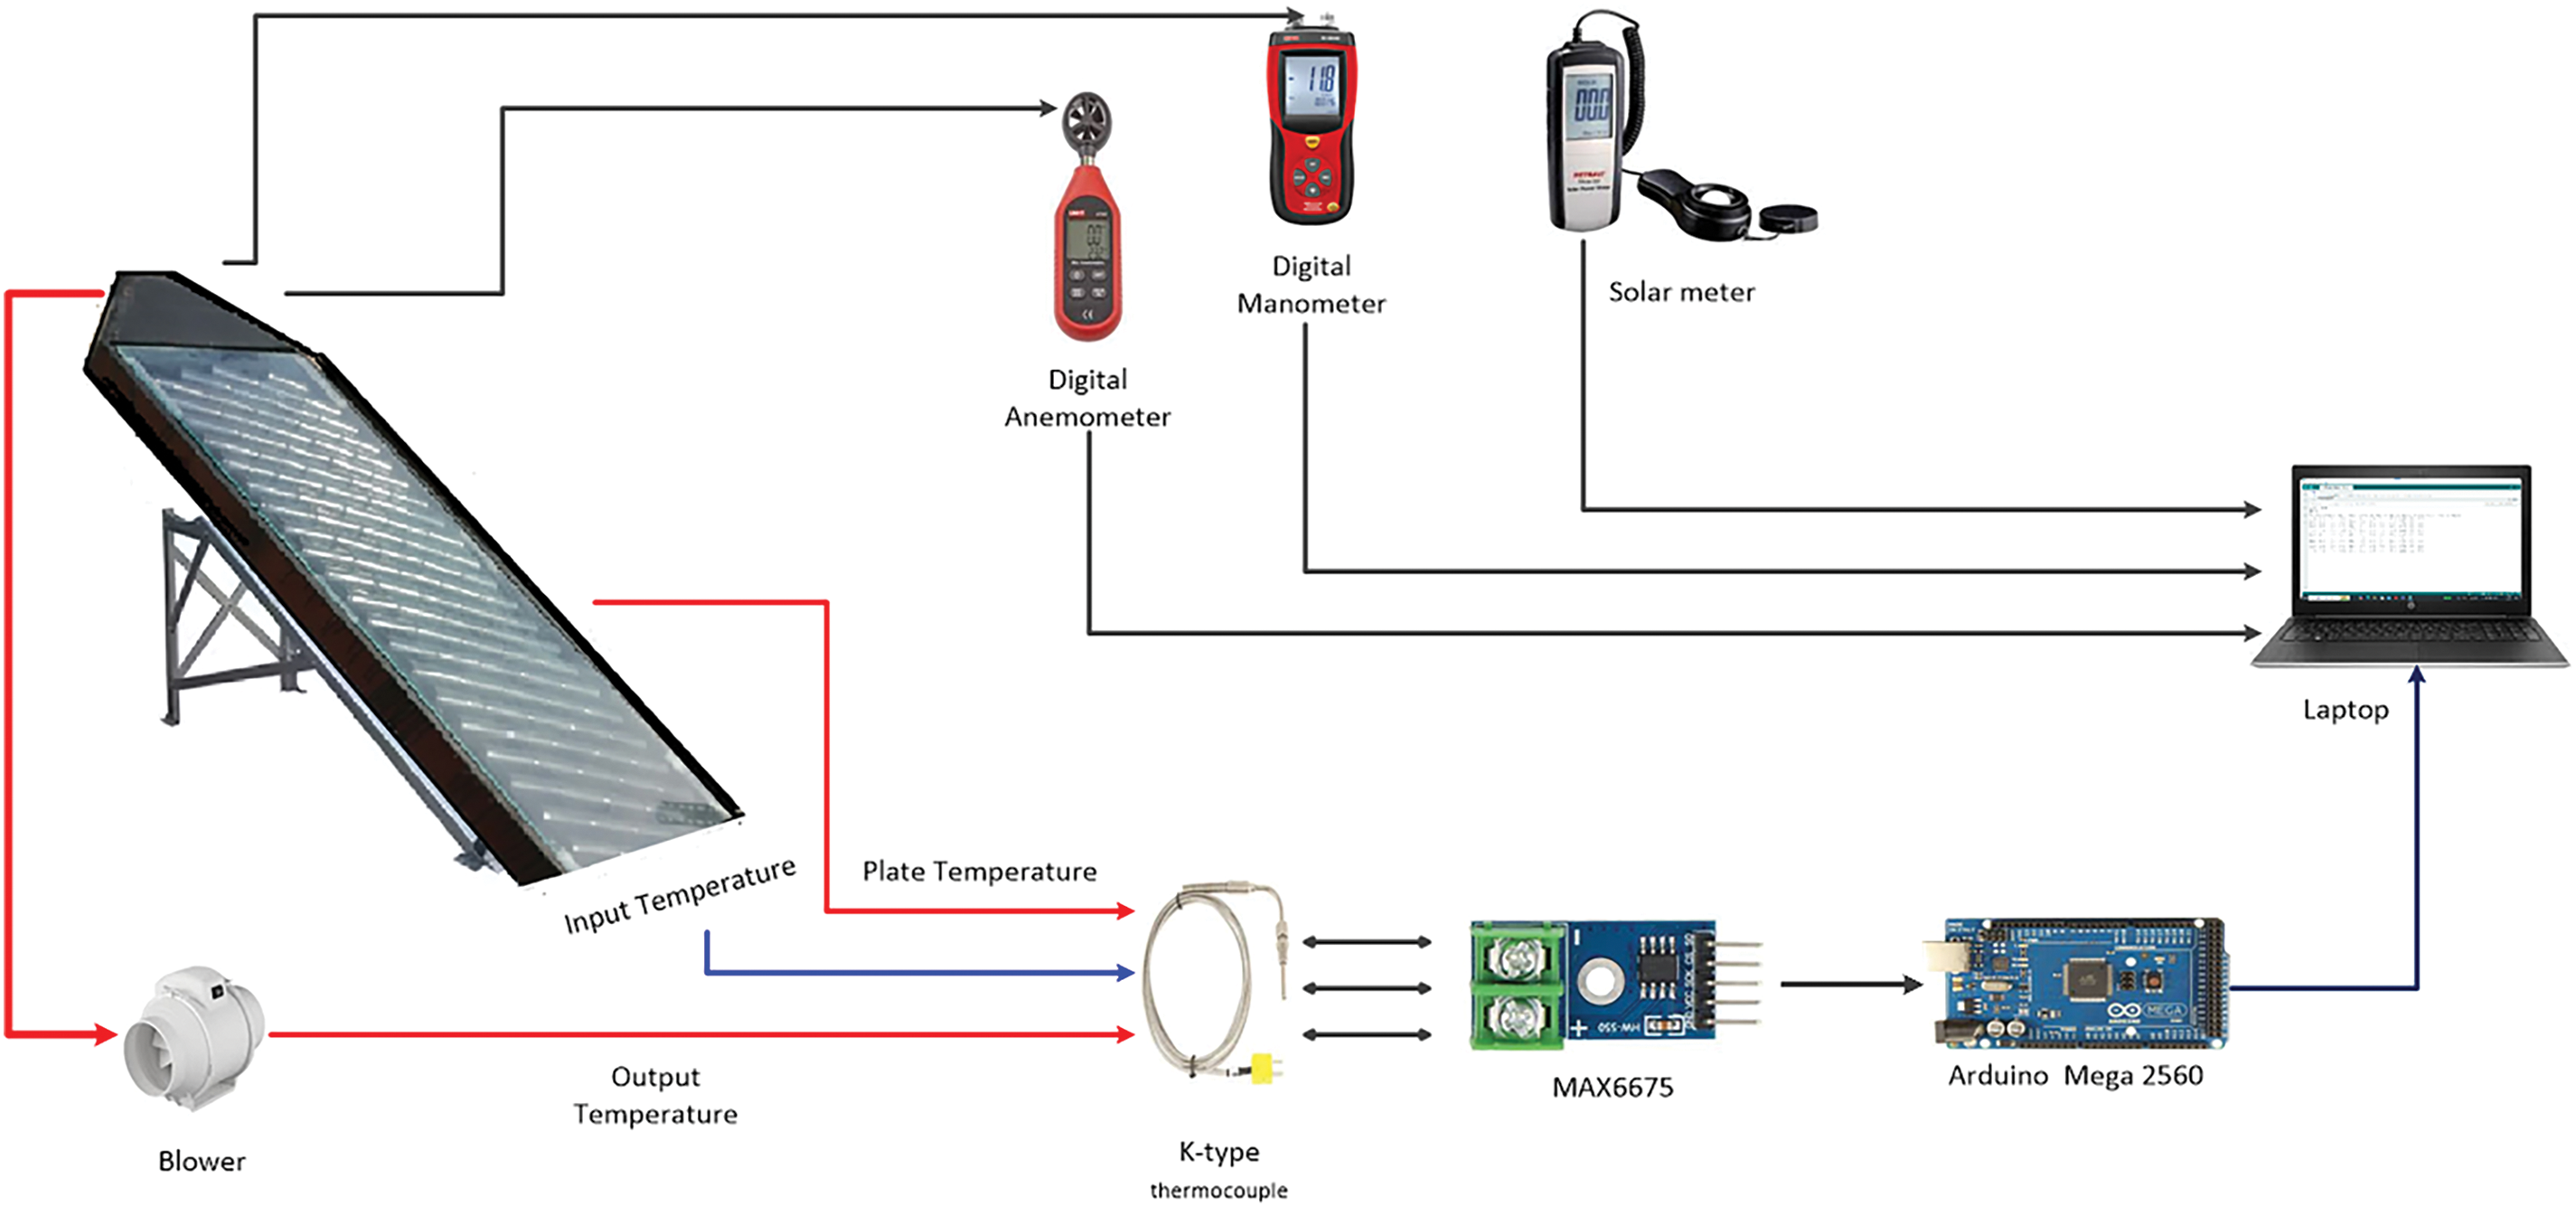
Figure 1: Sketch assembly of SAHs
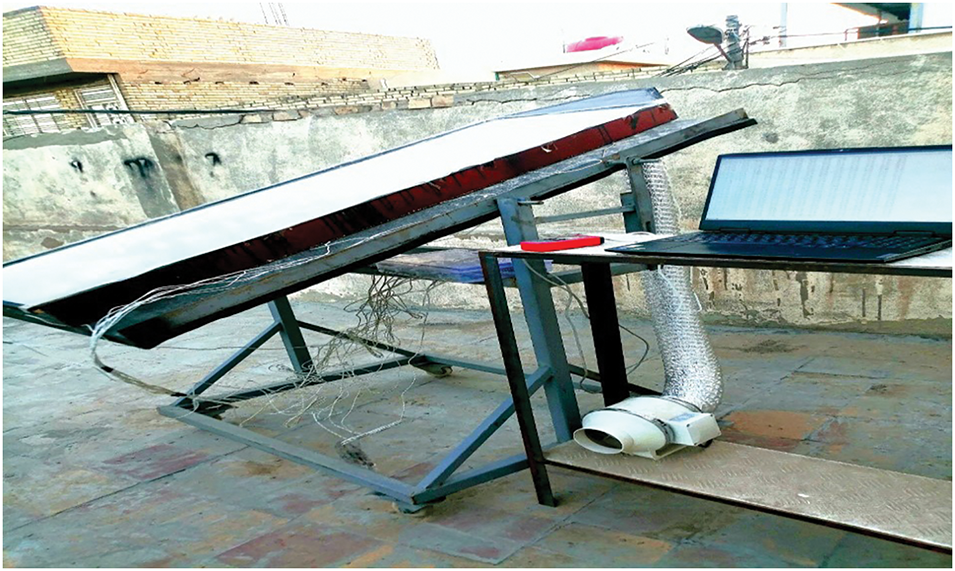
Figure 2: Graph of SAH
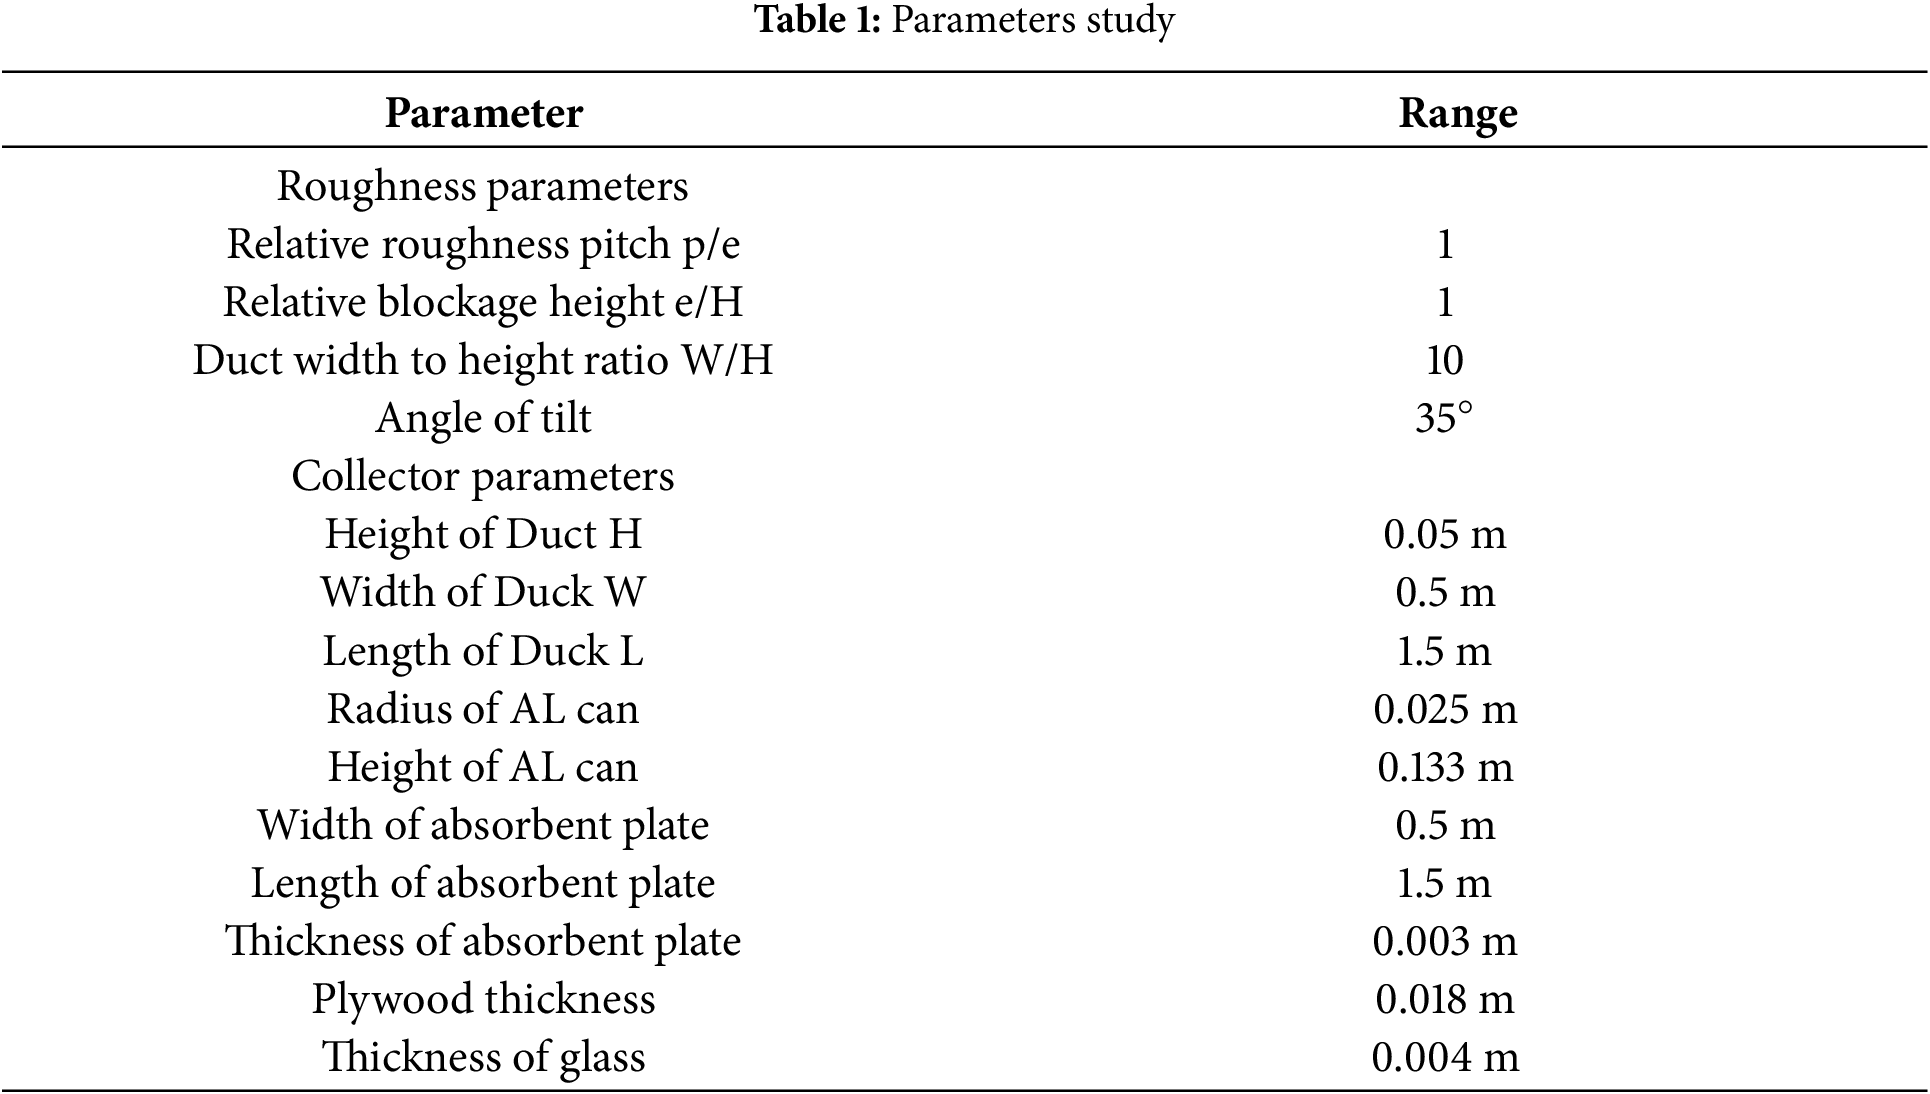
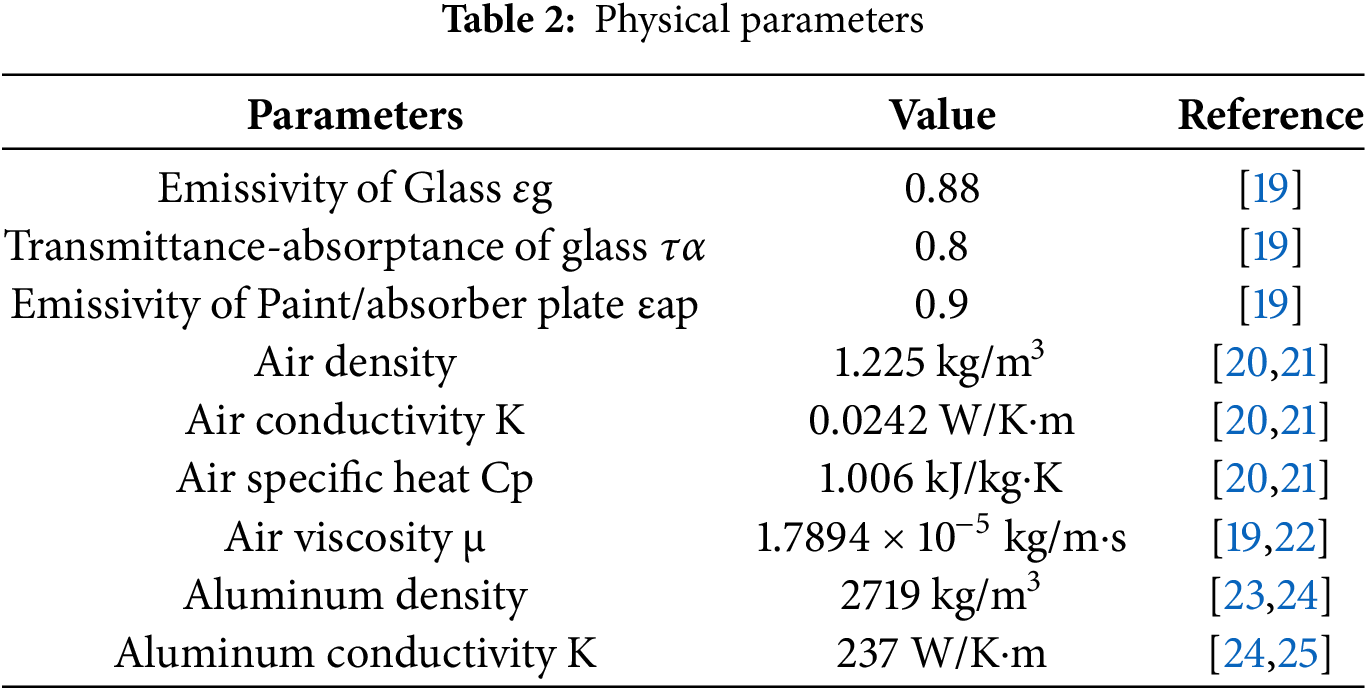
Four study cases and dimensions of AL cans were used that placed inside SAH, as shown in Figs. 3 and 4. In addition to shown in (Tables 1 and 2).
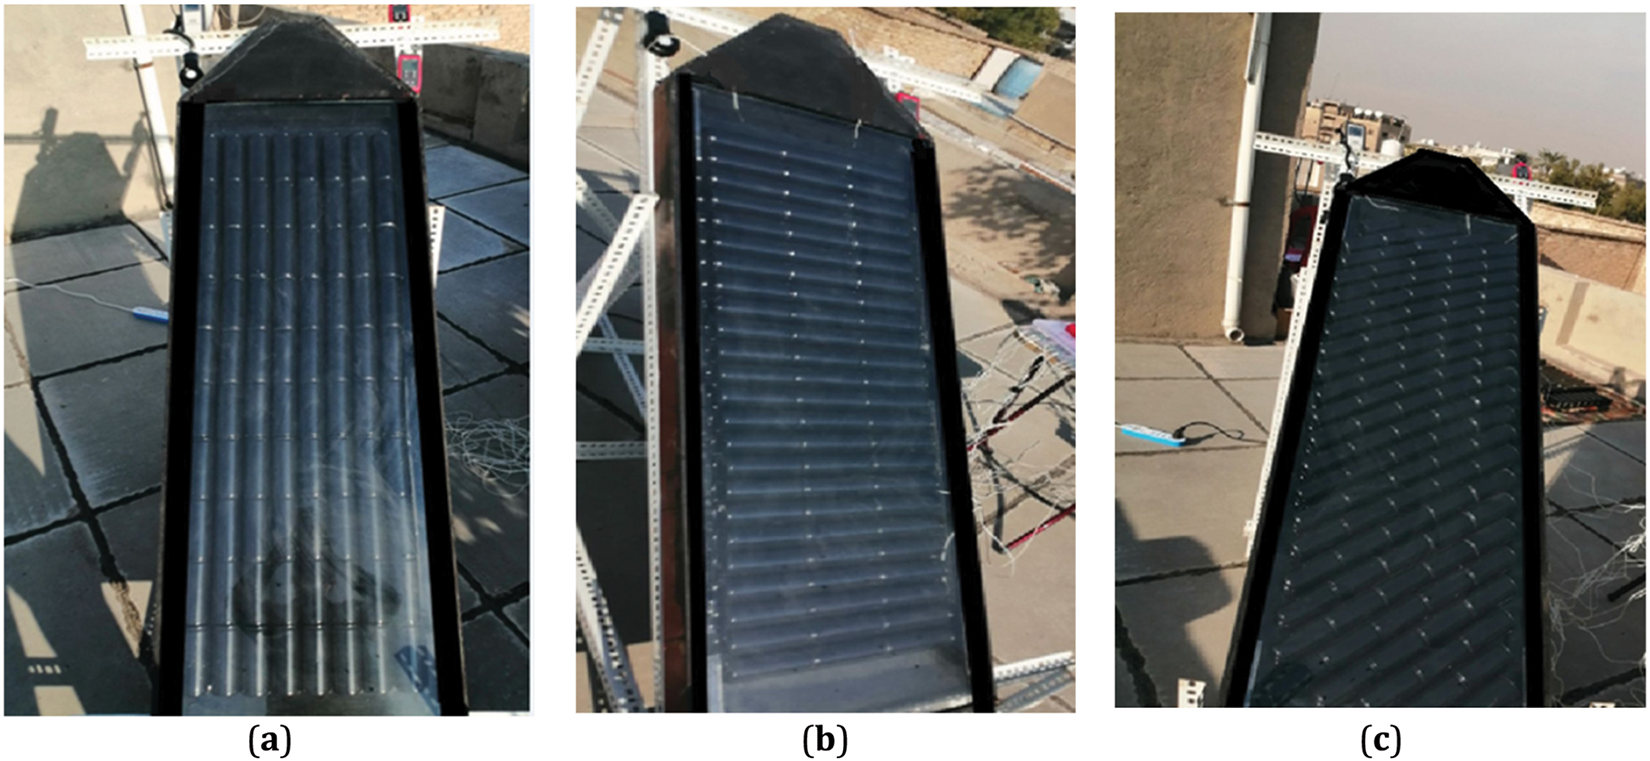
Figure 3: Graph of aluminum cans arrangement SAHs: case (a) longitudinally; case (b) transversely; case (c) diagonally
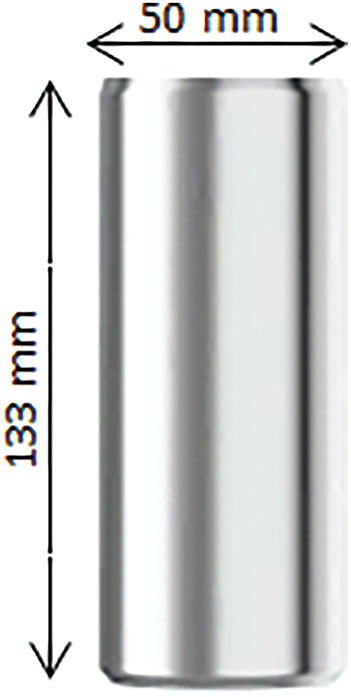
Figure 4: Graph of aluminum cans dimensions
Case 1: Results are compared using a smooth absorbent plate.
Case 2: Aluminum cans Arranged longitudinally.
Case 3: Aluminum cans Arranged Transversely.
Case 4: Aluminum cans Arranged diagonally.
3 Equations and Mathematical Expressions
For two days, from 6 January 2025, to 7 January 2025, all of the temperature, MF rate, pressure drop, and the tables of variables solar radiation measurements were made in Baghdad using an Arduino and measuring devices. The recordings were made every hour from 9:00 am to 4:00 pm for every case, using a constant and distinct MF rate ranging from 0.012, 0.018, 0.0245, 0.036, and 0.049 kg/s. The thermocouple measures the temperature of the absorber plate and the air. At 33° N and 44° E, the experiment was carried out outdoors. The average values of the temperatures and solar radiation were calculated and other parameters were by following equations:
In a rectangular duct, the air velocity V determines the mass flow rate m° [23]
The solar collector’s duct Reynold number value given by [26]
where μ is the air viscosity, ρ is air density, and
The rate of heat transfer Q between the heated plate and the air flow was calculated [28]
Fig. 5 shows how heat is transferred through a can arrangement. Let’s see how water moves through a single can. Because the star-patterned, evenly spaced fins at the bottom of each soda can impede the flow, it is presumed that the airflow through the can in the collector is turbulent.
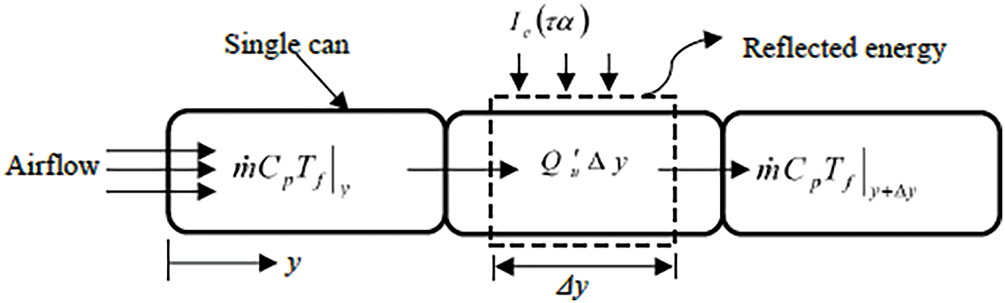
Figure 5: Heat transfer through AL cans [15]
The h value is computed using the following equation [29]:
where
Nusselt number determined as
where
Excepted smooth case it was used Blasius equation to determine smooth fraction factor
To determine thermal efficiency for collector
where
The combined effect of heat transfer enhancement and frictional losses collector with artificial roughness is measured by the thermo hydraulic performance parameter. It determines both the associated pressure drop because of flow resistance and the thermal efficiency [30].
The Nusselt number and fraction factor for an enhanced surface are represented by
The main objective of the current study was to determine and measure the increases in thermal efficiency of various aluminum can configurations and compare them to provide optimal solar air heater performance. Throughout the whole test period in June, the average temperature and intensity of solar radiation were noted. During the day the average temperature was 18°C and the average solar radiation was about 721 W/m2. Fig. 6 shows the evolution of solar radiation during the day in January along with the average inlet temperature. Fig. 7 explains the average outlet temperature for the case study during the same day.
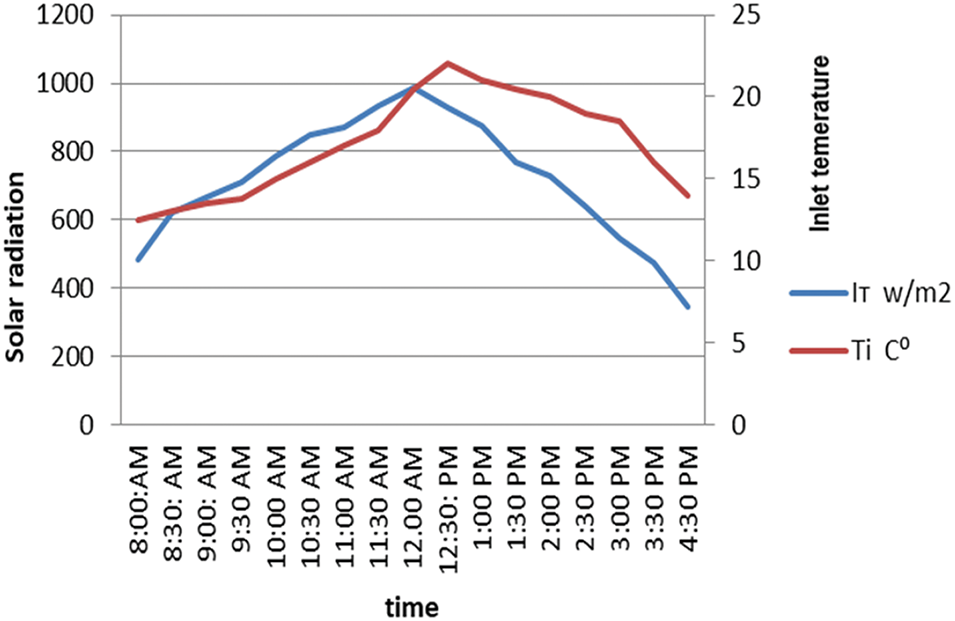
Figure 6: Average solar radiation and air inlet temperature during all experimental
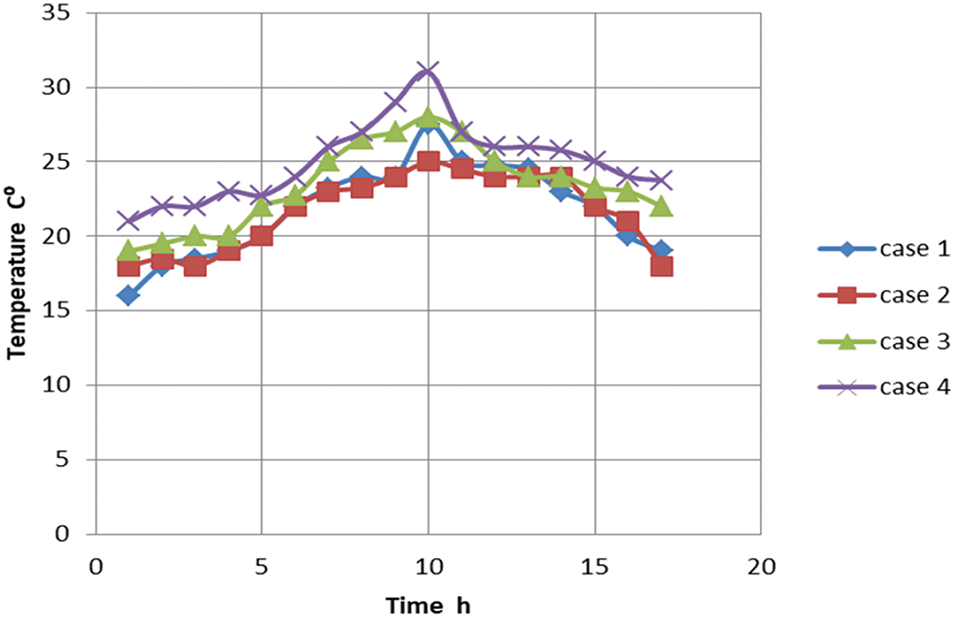
Figure 7: Average outlet temperature during all experimental
Displayed Fig. 8. In case 4, the maximum temperature was attained with a 60.5% improvement at Re = 2000 and as the flow increased, in comparison to the smooth scenario (case 1), the temperature dropped to achieve a maximum gain of 45% at Re = 10,000. This is an indication of an increase in temperature when the flow decreases, that by increasing turbulence and mixing, a higher Reynolds number improves convective heat transmission. The case 3 is the second best case in increasing temperature, while the case 2 is the lowest.
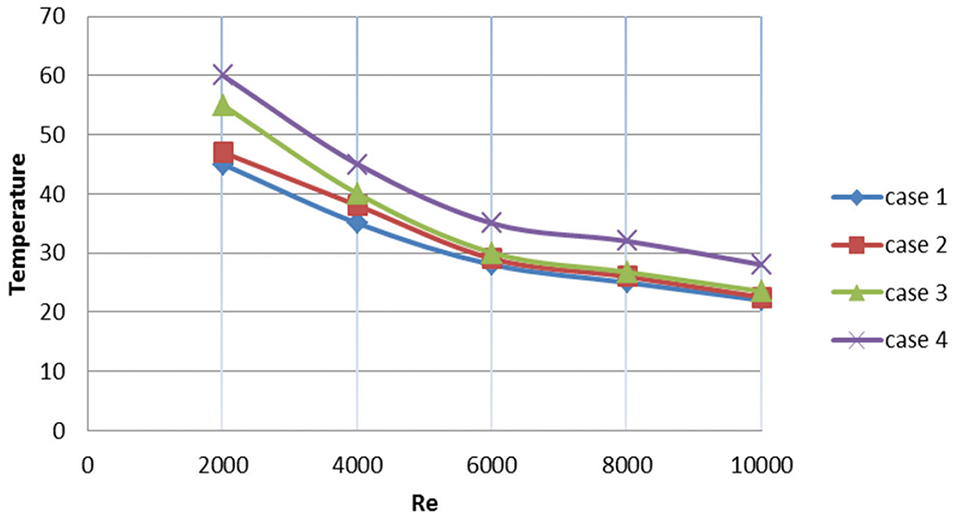
Figure 8: Average outlet temperature
Both the Nusselt number and the convective heat transfer coefficient rise with the rise Reynolds number as shown in Figs. 9 and 10 because the increasing of air turbulence when increase in air velocity that refers to increases the rate of heat transfer, the best rise in case 4.
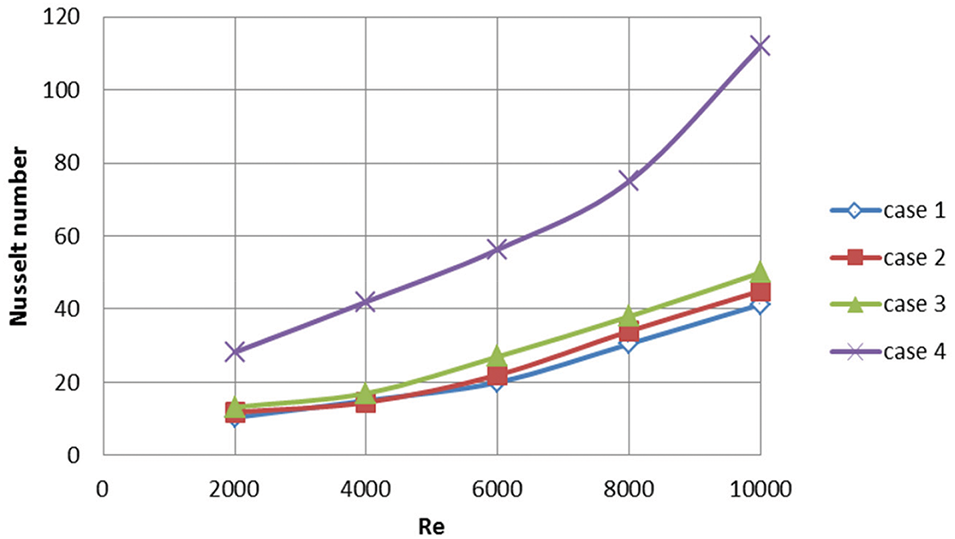
Figure 9: Average Nusselt number
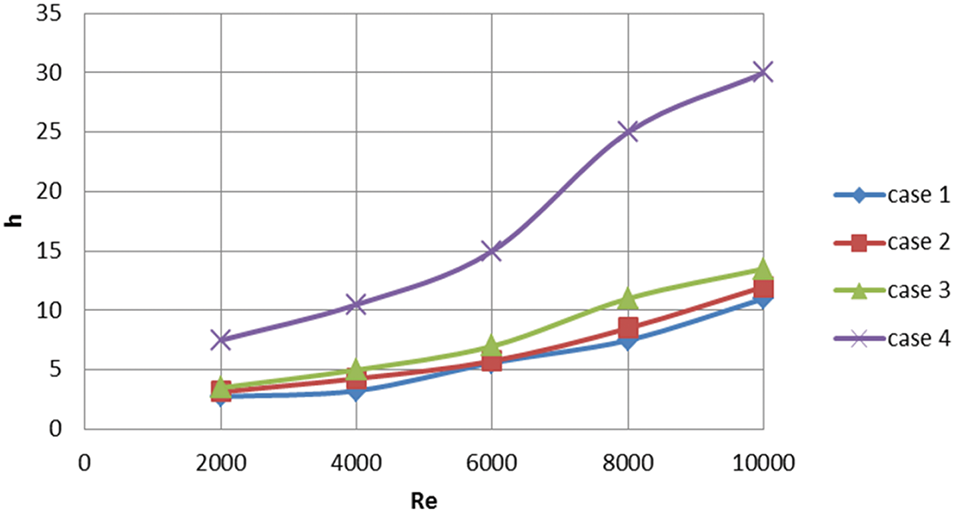
Figure 10: Heat transfer coefficient by convection with various in Reynolds number
Fig. 11 shows the inverse relationship between the fraction factor and the Reynolds number, which decreases with increasing Reynolds number, At high speed, it gives less fraction factor, its highest is in case 2, case 3 followed by case 4 decreases, respectively, because to the rise in air turbulence and have a value 0.435 when Re = 10,000, they are crucial for creating effective fluid transport systems because they aid in quantifying how variations in flow conditions impact the resistance to flow.
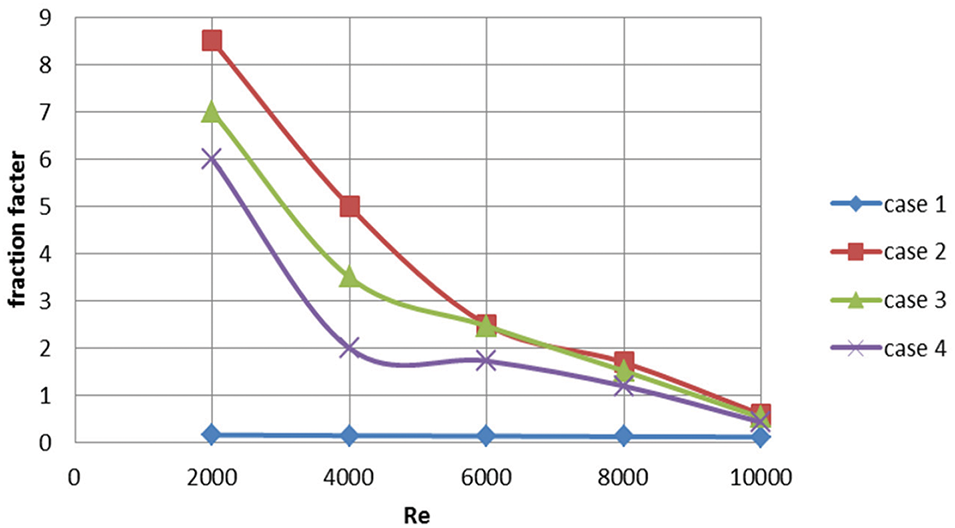
Figure 11: Fraction factor with various Reynolds number
The thermo-hydraulic performance factor (THPF) is one of the most crucial parameters for figuring out the optimal situation in terms of thermal and hydraulic performances, notice that in Fig. 12 case 3 had the best performance. With Re = 10,000, its FTTH was 1.75 and its efficiency was 98%, while when decreasing the flow, this reduced the Reynolds number and thus the friction factor increases, as observed at Re = 2000, its FTTH was 7 in the same case as shown in Fig. 13. Which resulted in air turbulence, greatly increasing the value of Nu and h while only slightly increasing the fraction factor. It is less efficient in case 2, which reaches 0.45 when Re = 10,000 as it reduced air turbulence well.
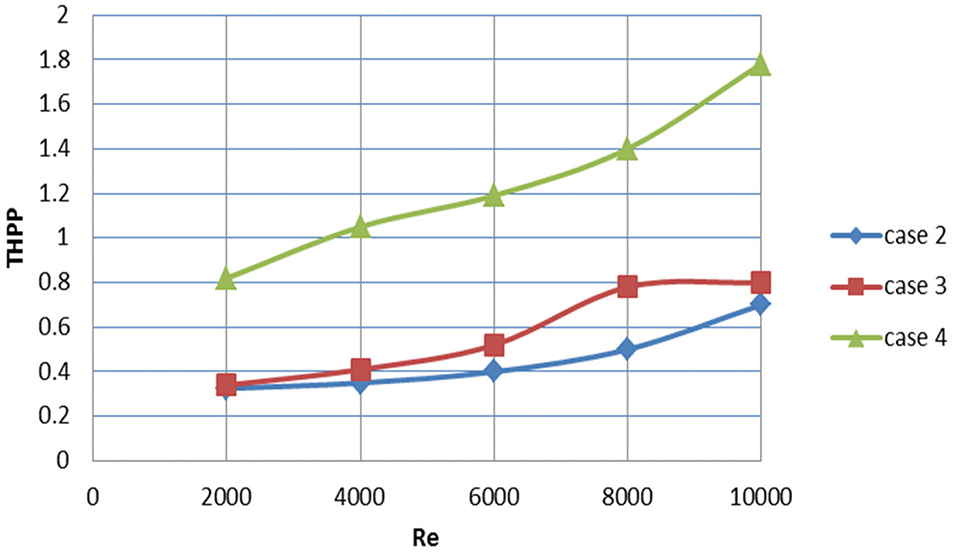
Figure 12: THPP with Reynolds number
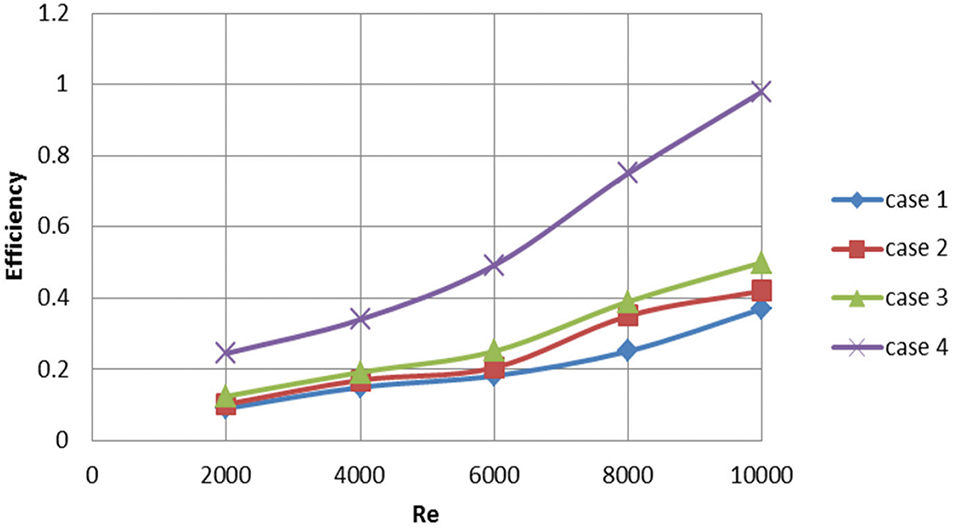
Figure 13: Efficiency with Reynolds number
Fig. 14 shows the direct relationship between pressure drop (ΔP) and Re in 4 cases, according to the results, pressure drop rises for all Reynolds numbers when cans are added to the flow channel. The longitudinal arrangement (case 2) produces the most frictional losses among the three can orientations, followed by the transverse (case 3) and diagonal (case 4). These results highlight the significance of striking a balance between gains in heat transmission and the related energy expenditures of greater pressure decreases.
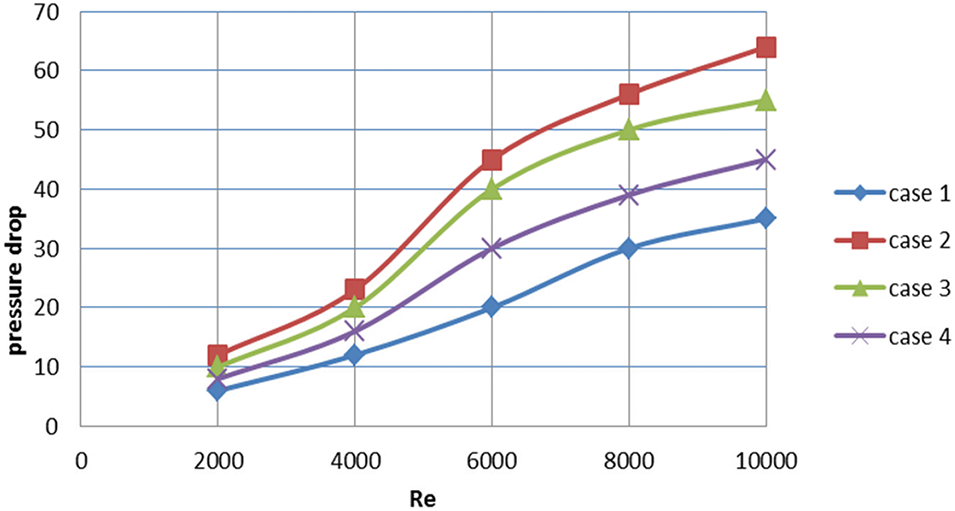
Figure 14: Effect pressure drop with Reynolds number
Fig. 15 shows the heat generation from the solar collector during the day depending on the solar radiation on that day. case 4 shows the best heat generation of approximately 665 w, followed by case 2 of 445 w at 12 noon.
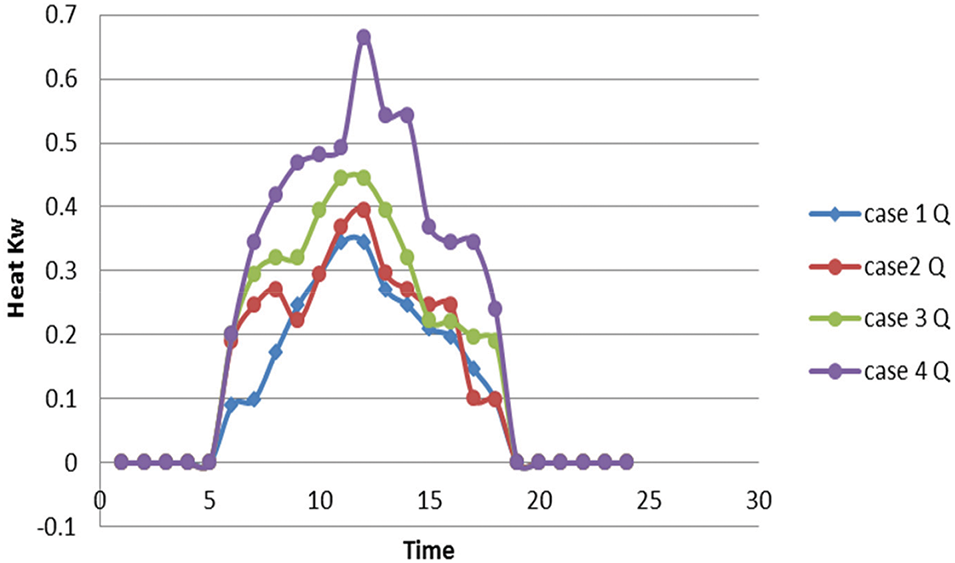
Figure 15: Heat transfer from solar collector with time
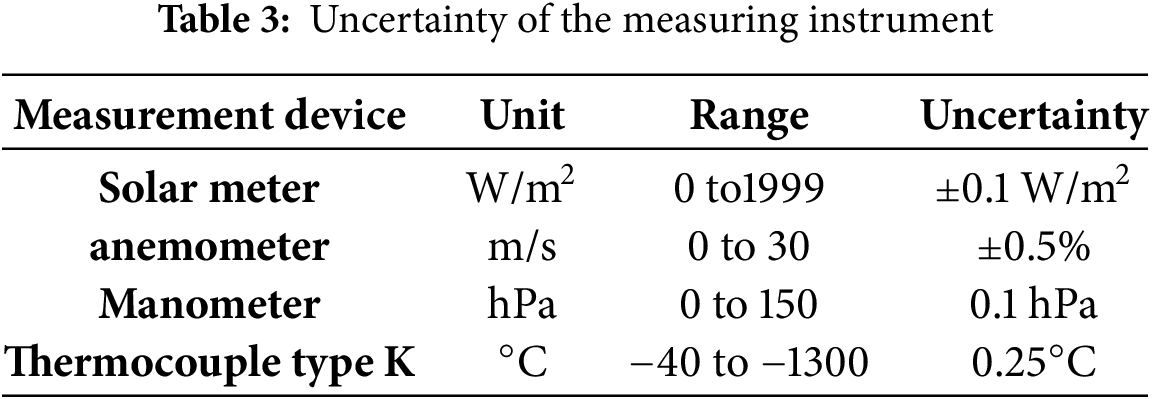
The accuracy of the equipment used in practical tests is displayed in Table 3. As a result, each parameter that was computed using these measurements contains a straightforward error percentage; nevertheless, these proportions are small and have no bearing on the overall outcomes. Thus, you can always rely on the outcomes.
It has been discovered that the values of the friction factor and Nusselt number strongly depend on the flow parameter, namely the Reynolds number, and the geometrical characteristics of the blockages, including relative pitch ratio, relative blockage height, open area ratio, angle of attack, and circularity. As a result, the following is the functional connection for the friction factor and Nusselt number in terms of these parameters:
The fact that forced convection heat transfer invariably produces a power law of the following form establishes the link between Nusselt number and Reynolds number:
where A is intercept and n is slope of lines, Logarithmic form of Nu equation can be written as
and solves by
By contrasting the Nusselt number experimental results with the correlation-predicted values for Nu in Figs. 16 and 17, For power equations of correlation, the average R square values are found to be 0.9. In Table 3, where R2, the degree to which the distribution matches the data, is indicated by the coefficient of determination. Its value ranges from 0 to 1. If R2 = 1 indicates that the distribution fits perfectly, but R2 = 0 indicates that the fit is quite weak. For each case, the Root Mean Squared Error is 2.62, 3.255, 3.181, and 7.562, respectively. Each case’s average absolute deviation is 0.272, 0.489, 0.158 and 0.75, respectively. The error percentage for each case is 10.6%, 15.02%, 10.26% and 9.2%, respectively. Therefore, it can be said that the correlation created in this work is capable of reasonably accurately predicting the values of the Nusselt number.
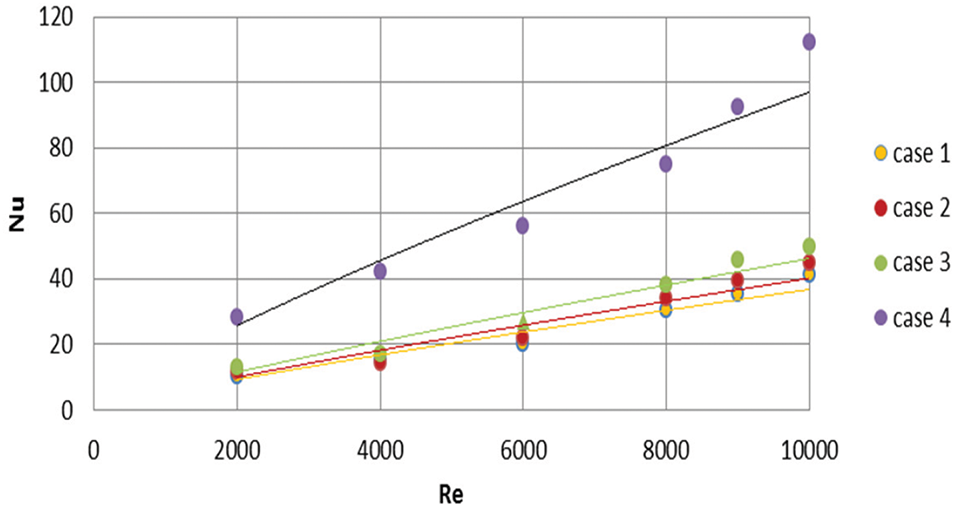
Figure 16: Nusselt number correlations
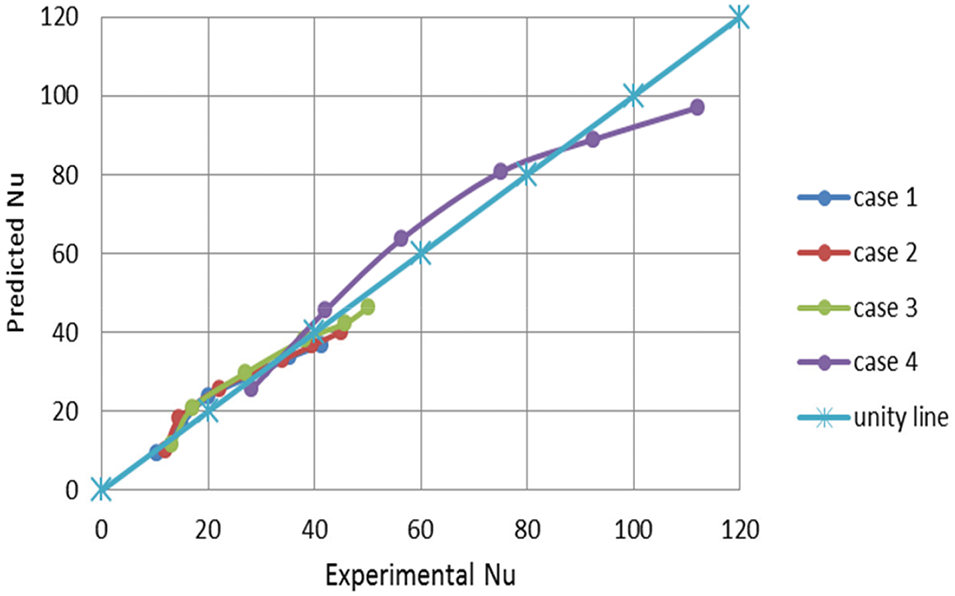
Figure 17: Comparison between experimental and predicted data of Nu
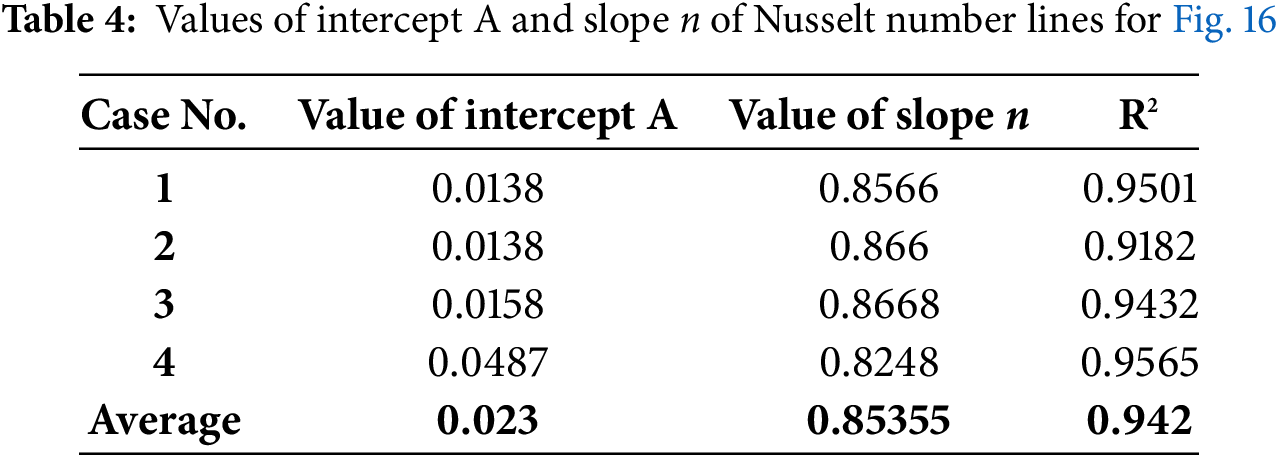
After analyzing four examples, the average intercept (A = 0.023) and slope (n = 0.85355) were determined, and the coefficient of determination (R2) was 0.942. This is in line with the correlation:
The Prandtl number (Pr) has been included in the correlation because we know that the fluid’s thermal characteristics also affect heat transfer in forced convection. For many turbulent forced convection correlations using an exponent of 0.4 for Pr, which is in line with correlations that have been shown in the literature, the extended correlation is as follows:
This formulation ensures that both the effects of flow dynamics (through Re) and thermal properties (through Pr) are accurately represented.
To analyze mathematical modeling and error propagation:
Prediction Model: The model-predicted Numodel value and the experimental values are compared for each case (cases 1–4). Each data point’s error is defined as
where i indexes the data points and c denotes the specific model case.
Absolute and Relative Errors: We calculate the absolute error as follows:
and the relative error by dividing by the experimental value, similar to the formula
This mathematical model for finding the Nusselt number and the same applies when finding the friction factor, it was calculated using Excel as shown in the error results above.
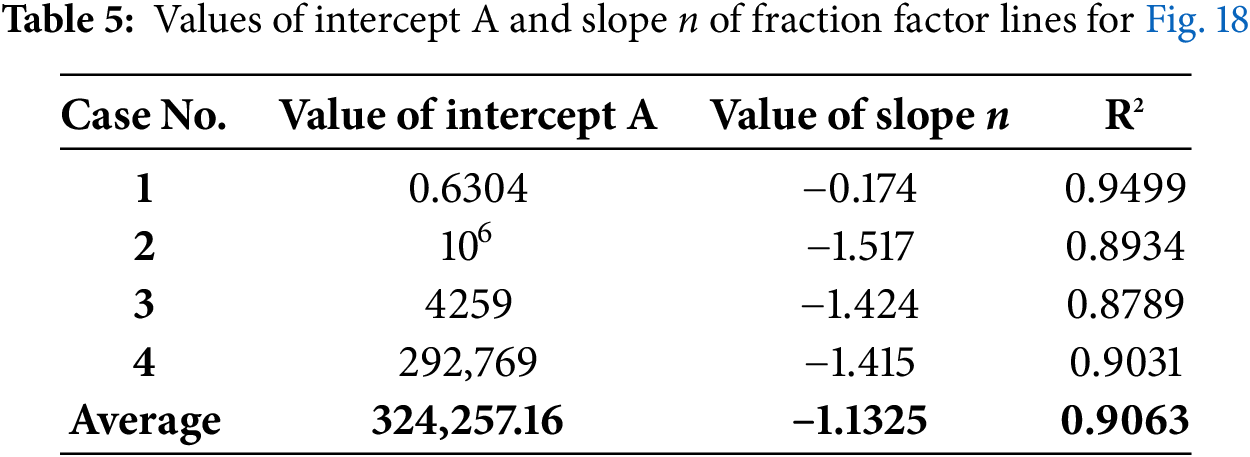
The Root Mean Squared Error for each case is determined by comparing the experimental values of the fraction factor with the values predicted by the correlation for the fraction factor is 0.022, 0.289, 0.308, and 0.259, respectively as shown in Figs. 18 and 19. The average Absolute Deviation for each case is 0.021, 0.276, 0.23, and 0.221, respectively. The error percentages for each case are 14.7%, 23.1%, 17.25% and 28.3%, respectively, data shown in Table 4, the average R square values are found to be 0.9. Therefore, the correlation in this study gives high accuracy when predicting the fraction factor.
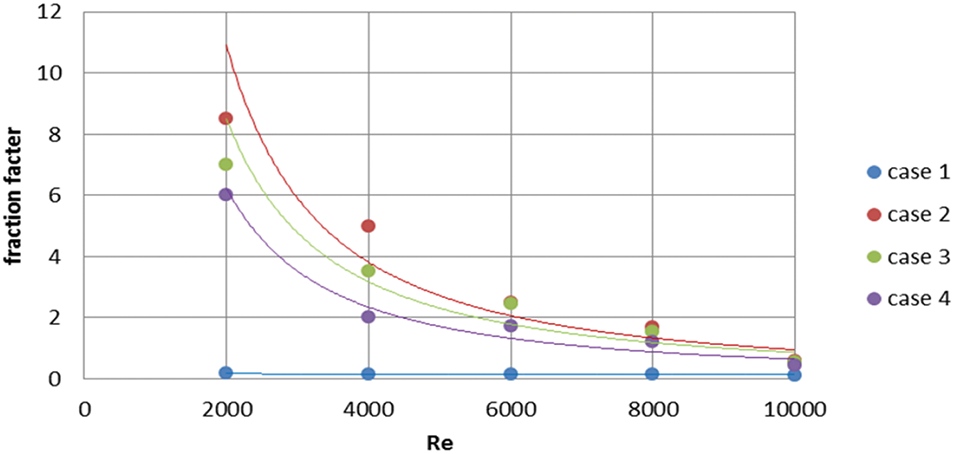
Figure 18: Fraction factor correlations
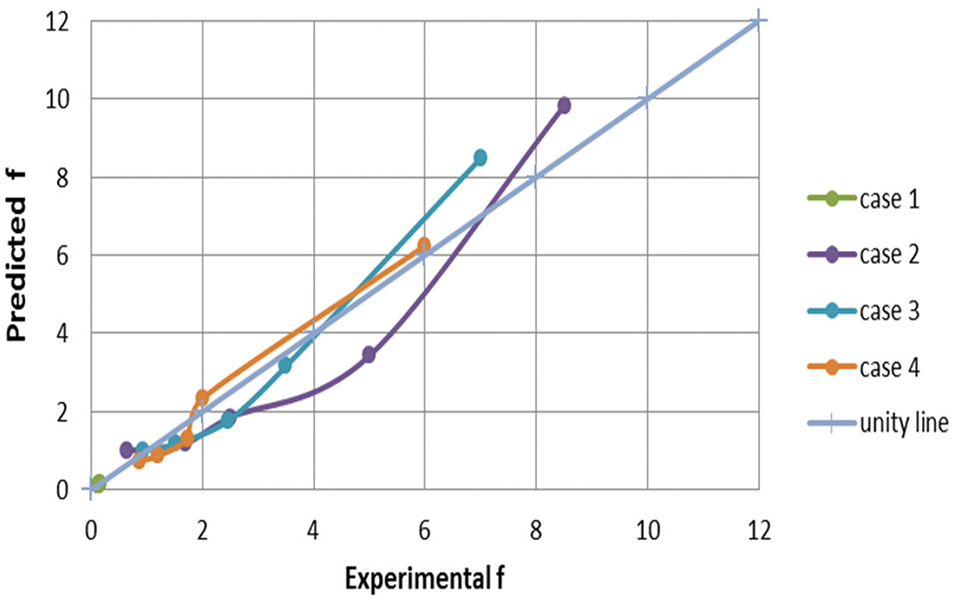
Figure 19: Comparison between experimental and predicted data of f
The majority of the data points for each of the four scenarios group together close to or along the unity line, suggesting that the model does a respectable job of capturing the overall pattern of the experimental findings. Small variations in some areas imply that, depending on the circumstances (e.g., at higher or lower Reynolds numbers), the model may marginally over-predict or under-predict (Table 5).
The study looked at three different arrangements of single-pass soda cans: longitudinal, transverse, and diagonal. When comparing these, it was found that diagonal cans provided the highest SAH performance. According to previous research, aluminum soda cans can provide a suitable temperature and act as good absorber materials for air collectors. Even when it’s raining. During January, the outdoor experiment was carried out in Baghdad at 33° N and 44° E. The testing began at 8 a.m. and lasted until 4 p.m., the other findings and the average results were collected for each instance.
• At the start of the air channel, the channel’s local convective heat transfer coefficient rises with each Re.
• The fraction factor for each case decreases with increasing Re.
• In case 3, Nu reached its maximum value of 112 at Re of 10,000 with f = 0.435.
• In each case, the thermal efficiency rises as Re increases; in case 4, 98% was achieved at Re = 10,000.
• The best thermo hydraulic performance parameter was 1.78 at re was 10,000 for case 4.
• Additionally, this system’s implementation encourages aluminum can recycling, which helps with solid waste management.
• This study is not limited to evaluating the performance of the solar collector but also achieves an economic aspect through recycling used aluminum cans to solve environmental problems.
Therefore, it is acceptable to say that the previously discarded soda cans can be utilized to capture solar energy for home heating, industrial air preheating, and agricultural drying, another factor to take into account while designing and choosing to employ the SCAH is the mass flow rate.
There are many studies that have dealt with aluminum cans in solar collectors, which makes their studies specific to the authors, which requires conducting additional studies for the purpose of comparison.
Future work requires studying it using other programming methods such as CFD to study the effect heat in each point, can support the idea or with other arrangements to compare with the experimental results as triangles or line grids for comparison purposes and under other operating conditions, makes it more widely used in daily applications.
Acknowledgement: We would like to express our sincere gratitude to University of Technology that have support this work.
Funding Statement: The authors received no specific funding for this study.
Author Contributions: Study conception and design: Mohammed Salam Abdl Ghafoor, Mohammed K. Al-Saad and Ameer Abed Jaddoa; data collection: Mohammed Salam Abdl Ghafoor, Mohammed K. Al-Saad and Ameer Abed Jaddoa; analysis and interpretation of results: Mohammed Salam Abdl Ghafoor, Mohammed K. Al-Saad and Ameer Abed Jaddoa; draft manuscript preparation: Mohammed Salam Abdl Ghafoor, Mohammed K. Al-Saad and Ameer Abed Jaddoa. All authors reviewed the results and approved the final version of the manuscript.
Availability of Data and Materials: All the data required to establish this work is available in the manuscript.
Ethics Approval: Not applicable.
Conflicts of Interest: The authors declare no conflicts of interest to report regarding the present study.
References
1. Dović D, Andrassy M. Numerically assisted analysis of flat and corrugated plate solar collectors thermal performances. Sol Energy. 2012;86(9):2416–31. doi:10.1016/j.solener.2012.05.016. [Google Scholar] [CrossRef]
2. Sabet GS, Sari A, Fakhari A, Afsarimanesh N, Organ D, Hoseini SM. An experimental and numerical thermal flow analysis in a solar air collector with different delta wing height ratios. Front Heat Mass Transf. 2024;22(2):491–509. doi:10.32604/fhmt.2024.048290. [Google Scholar] [CrossRef]
3. Atia DB, AL-Saadi MK, Jaddoa AA. Modeling of a domestic hybrid electric/solar water heating system. In: AIP Conference Proceedings; 2022 Jul 19–20; Baghdad, Iraq. doi:10.1063/5.0206383. [Google Scholar] [CrossRef]
4. Mahdi MM, Gaddoa A. An experimental study on optimization of a photovoltaic solar pumping system used for solar domestic hot water system under Iraqi climate. J Therm Eng. 2021;7(2):162–73. doi:10.18186/thermal.871296. [Google Scholar] [CrossRef]
5. Abedalh AS, Mohammed SH. Numerical investigation thermal performance of solar air heater using different angle V-grooved of corrugated absorber plate. Front Heat Mass Transf. 2023;21(1):227–43. doi:10.32604/fhmt.2023.041777. [Google Scholar] [CrossRef]
6. Zubairi LT, Danismaz M, Yasin NJ, Al-Shohani WAM. Comparative analysis of thermal performance in dual-flow solar air heaters utilizing diverse absorber plates. Int J Heat Technol. 2023;41(4):1014–34. doi:10.18280/ijht.410423. [Google Scholar] [CrossRef]
7. Hegde AK, Pai R, Karanth KV. Energy and exergy analysis of a cross flow solar air heater for thermohydraulic performance augmentation. Int J Therm Sci. 2023;194:108577. doi:10.1016/j.ijthermalsci.2023.108577. [Google Scholar] [CrossRef]
8. Goel V, Hans VS, Singh S, Kumar R, Pathak SK, Singla M, et al. A comprehensive study on the progressive development and applications of solar air heaters. Sol Energy. 2021;229(2):112–47. doi:10.1016/j.solener.2021.07.040. [Google Scholar] [CrossRef]
9. Abushanab WS, Zayed ME, Sathyamurthy R, Moustafa EB, Elsheikh AH. Performance evaluation of a solar air heater with staggered/longitudinal finned absorber plate integrated with aluminium sponge porous medium. J Build Eng. 2023;73:106841. doi:10.1016/j.jobe.2023.106841. [Google Scholar] [CrossRef]
10. Alam T, Kim MH. Performance improvement of double-pass solar air heater—a state of art of review. Renew Sustain Energy Rev. 2017;79:779–93. doi:10.1016/j.rser.2017.05.087. [Google Scholar] [CrossRef]
11. Chabane F, Moummi N, Benramache S, Bensahal D, Belahssen O. Collector efficiency by single pass of solar air heaters with and without using fins. Eng J. 2013;17(3):43–55. doi:10.4186/ej.2013.17.3.43. [Google Scholar] [CrossRef]
12. Prasad RS, Nayak RK, Nayak UK, Gupta AK. Performance analysis of longitudinal fin jet plate solar air heater under cross flow condition. Front Heat Mass Transf. 2022;19:1–12. doi:10.5098/hmt.19.22. [Google Scholar] [CrossRef]
13. Mgbemene C, Jacobs I, Agbo C, Nwanya S, Ozoegwu C. Experimentalinvestigation on the performance of a solar air heater with the absorber plate made of aluminum soda cans. In: Proceedings of the 35th National Solar Energy Forum; 2017 Nov; Abuja, Nigeria. [Google Scholar]
14. Dagwa IM, Adama KK. Property evaluation of pumice particulate-reinforcement in recycled beverage cans for Al-MMCs manufacture. Eng Sci. 2018;30(1):61–7. doi:10.1016/j.jksues.2015.12.006. [Google Scholar] [CrossRef]
15. Isiaku ELH. An experimental study and analysis on solar drying of some vegetables using locally fabricated solar food dehydrator in Zuba, Abuja, Nigeria. Int Res J Mod Eng Technol Sci. 2021;3(10):87–95. [Google Scholar]
16. Ifeanyi CAM, Jacobs O, Ndukwe A, Okoani AO, Ononiwu NH. Comparative experimental performance evaluation of longitudinal and transverse four-pass soda can solar air heaters. In: Proceedings of the 2nd African International Conference on Industrial Engineering and Operations Management; 2020 Dec 7–10; Harare, Zimbabwe. p. 484–95. [Google Scholar]
17. Kurhade AS, Waware SY, Munde KH, Biradar R, Yadav RS, Patil P, et al. Performance of solar collector using recycled aluminum cans for drying. J Mines Met Fuels. 2024;72(5):455–61. doi:10.18311/jmmf/2024/44643. [Google Scholar] [CrossRef]
18. Omotosho E, Hackney P. Performance prediction of single-pass and multi-pass low-cost solar air heater. Therm Sci Eng Prog. 2024;47:102322. doi:10.1016/j.tsep.2023.102322. [Google Scholar] [CrossRef]
19. Phu NM, Thao PB, Van Hap N. Effective efficiency assessment of a solar air heater having baffles spaced with different successive ratios. Case Stud Therm Eng. 2021;28(6):101486. doi:10.1016/j.csite.2021.101486. [Google Scholar] [CrossRef]
20. Rasham AM, Alaskari MM. Thermal analysis of double-pass solar air collector with different materials of ab-sorber plate and different dimensions of air channels. Int J Sci Res. 2017;6(8):901–8. [Google Scholar]
21. Kumar A, Sreenivaslu G, Rao PR, Vinod K, Pattanaik A. Experimental investigation on performance of solar air heaters with thermal storage. Int J Renew Energy Commer. 2019;5(1):37–46. [Google Scholar]
22. Incropera FP, DeWitt DP, Bergman TL, Lavine AS. Fundamentals of heat and mass transfer. 7th ed. Hoboken, NJ, USA: John Wiley & Sons; 2011. [Google Scholar]
23. Alam T, Saini RP, Saini JS. Experimental investigation of thermohydraulic performance of a rectangular solar air heater duct equipped with V-shaped perforated blocks. Adv Mech Eng. 2014;6:948313. doi:10.1155/2014/948313. [Google Scholar] [CrossRef]
24. Mahanand Y, Senapati JR. Thermo-hydraulic performance analysis of a solar air heater (SAH) with quarter-circular ribs on the absorber plate: a comparative study. Int J Therm Sci. 2021;161(27):106747. doi:10.1016/j.ijthermalsci.2020.106747. [Google Scholar] [CrossRef]
25. Singh S, Chander S, Saini JS. Exergy based analysis of solar air heater having discrete V-down rib roughness on absorber plate. Energy. 2012;37(1):749–58. doi:10.1016/j.energy.2011.09.040. [Google Scholar] [CrossRef]
26. Alam RPT, Saini JS. Effect of circularity of perforation holes in V-shaped blockages on heat transfer and friction characteristics of rectangular solar air heater duct. Energy Convers Manag Technol. 2014;86:952–63. doi:10.1016/j.enconman.2014.06.050. [Google Scholar] [CrossRef]
27. Lertnuwat B. Effect of the number and placement of punched holes in rectangular winglet vortex generators on solar air heater performance. Energy Convers Manag X. 2024;24:100714. doi:10.1016/j.ecmx.2024.100714. [Google Scholar] [CrossRef]
28. Aouissi Z, Chabane F, Teguia MS, Bensahal D, Moummi N, Brima A. Determination of the heat transfer coefficient by convection, according to shape of the baffles (solar air collector). J Ren Energies. 2022;25(1):43–54. doi:10.54966/jreen.v25i1.1070. [Google Scholar] [CrossRef]
29. Kumar A, Layek A. Nusselt number and friction factor correlation of solar air heater having twisted-rib roughness on absorber plate. Renew Energy. 2019;130(1):687–99. doi:10.1016/j.renene.2018.06.076. [Google Scholar] [CrossRef]
30. Bezbaruah PJ, Kumar R, Das RS. Thermohydraulic performance analysis of solar air heater with helical roughness. In: Proceeding of Proceedings of the 25th National and 3rd International ISHMT-ASTFE Heat and Mass Transfer Conference (IHMTC-2019); 2019 Dec 28–31; Roorkee, India. p. 233–7. doi:10.1615/ihmtc-2019.400. [Google Scholar] [CrossRef]
Cite This Article
 Copyright © 2025 The Author(s). Published by Tech Science Press.
This work is licensed under a Creative Commons Attribution 4.0 International License , which permits unrestricted use, distribution, and reproduction in any medium, provided the original work is properly cited.
 Downloads
 Citation Tools