
 Submit a Paper
 Propose a Special lssue
 Open Access
ARTICLE

Numerical Analysis of Non-Uniform Pollutant Distribution in an Internal Space of Tank and the Efficacy of an Active Purification Strategy
Key Laboratory of Thermo-Fluid Science and Engineering of MOE, School of Energy and Power Engineering, Xi’an Jiaotong University, Xi’an, 710049, China
* Corresponding Author: Peng Yang. Email:
(This article belongs to the Special Issue: Microscale Heat and Mass Transfer and Efficient Energy Conversion)
Frontiers in Heat and Mass Transfer 2025, 23(6), 1767-1788. https://doi.org/10.32604/fhmt.2025.070537
Received 18 July 2025; Accepted 11 October 2025; Issue published 31 December 2025
 View Full Text
 Download PDF
Abstract
Hazardous gas intrusion in tightly sealed and geometrically complex confined spaces, such as armored tanks, poses a critical threat to occupant health. The intricate internal structure of these systems may lead to non-intuitive pollutant transport pathways. However, the spatial and temporal evolution of these structures, as well as the intrinsic mechanisms of the purification systems, remain poorly elucidated. In this study, a high-fidelity, transient three-dimensional computational fluid dynamics (CFD) model was developed to simulate the leakage and dispersion of carbon monoxide (CO) and nitrogen dioxide (NO2) using the RNG k-ε turbulence model. Scenarios with and without an active purification system were systematically investigated under four leakage rate conditions: 0.33, 0.66, 1.32, and 2.64 m·s−1. Our results reveal that, flow recirculation driven by the compartment’s geometry leads to the formation of stable, high-concentration “hazard zones”. Following the activation of the purification system,Graphic Abstract
Keywords
Nomenclature
| Hamiltonian | |
| Spatial coordinate component (m) | |
| Pressure (Pa) | |
| Solution time (s) | |
| Velocity vector (m·s−1) | |
| Component of | |
| Density (kg·m−3) | |
| Dynamic viscosity (Pa·s) | |
| Unit body force (N·m−3) | |
| Mass fraction | |
| Diffusion coefficient (m2·s−1) | |
| Component mass source (kg·m−3·s−1) | |
| Temperature (K) | |
| Thermal conductivity (W·m−1·K−1) | |
| Specific heat capacity (J·kg−1·K−1) | |
| Turbulence kinetic energy (m2·s−2) | |
| Turbulence dissipation rate (m2·s−3) | |
| Reynolds stress (kg·m−1·s−2) | |
| Thermal expansion coefficient (K−1) | |
| Component of velocity parallel to the gravity direction (m·s−1) | |
| Component of velocity normal to the gravity direction (m·s−1) | |
| The effect of velocity gradient on turbulence (kg·m−1·s−3) | |
| The effect of buoyancy on turbulence (kg·m−1·s−3) | |
| Empirical constant in the RNG k-ε model | |
| The effect of buoyancy on the turbulent dissipation rate | |
| The reciprocals of the effective Prandtl numbers for k and ε, respectively | |
| Rε | Additional term incorporated into the ε equation (m2·s−4) |
| Dimensionless coupling parameter between the flow strain rate and the turbulent dissipation characteristics | |
| Critical value in the RNG k-ε model | |
| Model constant in the RNG k-ε model | |
| Additional terms in the ε-equation | |
| S | Magnitude of strain rate tensor (s−1) |
| ST | Viscous dissipation term (J·m−3·s−1) |
| Effective dynamic viscosity (kg·m−1·s−1) |
Ensuring adequate air quality within enclosed environments is a cornerstone of occupational health and public safety, a challenge amplified in settings where ventilation is restricted and internal pollutant sources are present. This issue has been extensively studied in diverse contexts, from residential buildings and transportation tunnels to underground mines, where hazardous gas leaks can have catastrophic consequences [1–3]. However, the cabins of military vehicles, particularly main battle tanks, represent a unique and exceptionally challenging environment. During combat operations, these platforms must maintain a high degree of airtightness against external threats, which paradoxically traps internally generated hazardous gases like carbon monoxide (CO) and nitrogen dioxide (NO2) emanating from engine exhaust or armament discharge. The complex, highly compartmentalized internal geometry further complicates natural diffusion, creating conditions where pollutant concentrations can rapidly reach and sustain life-threatening levels, severely compromising the health and combat effectiveness of the crew [4].
Physical simulation, mathematical simulation and CFD numerical simulation are the main methods used to study the diffusion of gas leaks [1]. When simulations of hazardous gas leakage diffusion are conducted, two or three methods often are employed in parallel to verify the accuracy of the simulation model.
To investigate such complex gas leakage and diffusion phenomena, researchers have employed a range of methods including physical experiments and analytical models. While tracer gas measurements and studies on alternative materials like coal briquettes provide valuable empirical data [5–7], and analytical models like Gaussian plume/puff approaches offer rapid risk assessment [8–10], these methods often struggle to capture the intricate details of turbulent flow within complex three-dimensional geometries. In this regard, Computational Fluid Dynamics (CFD) has emerged as an indispensable and powerful tool, offering high-resolution insights at a lower cost and with greater operational flexibility than physical experiments [2,11]. Numerous CFD studies, often employing the standard k-ε turbulence model or its variants, have successfully characterized pollutant dispersion in environments like laboratories [12,13], residential kitchens [14], diesel-based bus [15], thermal power plants [16], aircraft cabins [17], street [18] and tunnels [3], investigating the influence of factors such as ventilation strategies, source location, and external conditions [19–22]. In terms of gas leakage simulation in ventilated super cavities, numerical methods based on RANS equations have good computational accuracy [23]. Wang et al. [24] explained the effects of gravity and vehicle angle of attack on the formation of gas leakage in supercavity double vortex tubes by analyzing the causes of upward drift in the tail section of supercavities and the formation of double vortex tubes. Sun et al. [25] proposed combining RANS with FBM to study the physical mechanism of the ventilated partial cavitating flows. This numerical method showed good consistency with experimental measurements. Lee et al. [26] applied the RANS (Reynolds-averaged Navier-Stokes equations) and EDC (eddy dissipation concept) models with modified k-epsilon equations to analyze the effects of different oxygen dilution ratios on MILD combustion formation and NOx emission characteristics in co-flow. Within the actual air leakage range, the increase in N2 concentration under MILD combustion conditions had almost no effect on NO emissions. Ren et al. [27] used the RANS algorithm to simulate the impact range of a chlorine gas leak, which can predict the number of casualties within two minutes after the chlorine gas disperses, providing a reference for rescue operations. Lei et al. [28] studied the distribution of oxygen leakage concentrations in the triangular area of civil aircraft and the impact of ventilation systems. Oxygen is mainly concentrated on the floor and can be effectively diluted by ventilation systems. Mynarz et al. [29] used RANS equations to simulate the spatiotemporal evolution characteristics of methane leakage and diffusion from damaged natural gas pipelines in complex confined spaces, achieving the best match with actual measurement results. Góbi Santolin et al. [30] proposed three RANS-based CFD models, which showed maximum average percentage differences of 12.87%, 90.52%, and 53.10% in decompression, expansion, and dispersion during the pressurized gas leakage process in pipes, respectively, representing significant improvements over classical methods.
Despite these advances, research in a particular scenario such as tanks is still lacking. Much of the existing literature focuses on relatively open or simple confined spaces. The specific fluid dynamics of pollutant propagation within a tightly sealed, multi-compartmentalized enclosure like a tank, where internal obstacles dictate flow paths, remains less explored. Consequently, there is a lack of understanding of the spatiotemporal evolution of pollutants in such environments, particularly the formation mechanisms of stable, localized high-concentration zones (i.e., “hotspots”). Furthermore, while ventilation and purification systems are acknowledged as critical mitigation tools, their function is often assessed based on average concentration reduction. The more fundamental mechanism—how these systems actively re-engineer the internal flow field to break down hazardous hotspots and enforce a more uniform, safer concentration distribution—has not been systematically investigated and quantified.
The objective of this study is to address these issues. The development and validation of a transient 3D CFD model of a representative tank cabin has been undertaken in order to conduct a comprehensive numerical investigation with the following objectives in mind: The objectives of this study are threefold: firstly, to characterize the spatiotemporal diffusion patterns of hazardous gases (CO and NO2) in an uncontrolled state, with a view to identifying the formation of persistent hazard zones; secondly, to quantitatively analyze the impact of leakage rate on the dynamics of pollutant accumulation; and thirdly, to evaluate the efficacy of an active purification system, with a view to elucidating the underlying flow-homogenization mechanism. This paper proposes a shift in focus from mere concentration levels to the dynamics of spatial distribution, thereby facilitating a more profound comprehension of hazard mitigation in complex enclosures. This paper provides a scientifically grounded basis for the optimization of life-support and ventilation systems in critical operational environments.
To accurately capture the transient diffusion behavior of hazardous gases within the complex confined space of the tank cabin and to evaluate the intrinsic mechanism of the active purification strategy, a three-dimensional, transient, multi-component turbulent flow model was developed and solved. The entire numerical framework, from physical model construction to solution and validation, was designed to ensure high-fidelity simulation of key physical phenomena such as local vortices, concentration stratification, and forced convection.
2.1 Physical Model and Governing Assumptions
A schematic diagram of the 3D model of the tank is shown in Fig. 1. The tank’s outer profile is 7 m long, 3 m wide and 2.35 m high, the external profile of the tank is shown in Fig. 1a. The location of the leakage source and the air vents of the purifier are shown in Fig. 1a. Fourteen members distributed inside the tank are shown in Fig. 1b, Front (F)1–2 for cockpit crew, Turret (T)1–2 for tank gunner, Left (L)1–4 and Right (R)1–6 for combatants. To solve this intricate fluid dynamics problem within reasonable computational resources while maintaining accuracy, the following widely accepted assumptions were introduced:
1. The mixture of cabin air and the leaked hazardous gases (CO, NO2) is treated as an ideal gas.
2. The gas mixture is considered a Newtonian fluid, and its mean motion is handled as an incompressible flow, a standard and reasonable assumption for low-speed indoor flows.
3. No chemical reactions between the gas components or phase changes occur during the diffusion process [12].
4. The entire leakage process is considered isothermal, with a constant cabin temperature of 300 K. The temperature difference between the leaking gas and the cabin air, as well as heat exchange with the external environment, is neglected. This simplification is intended to focus the investigation entirely on the mass transport processes driven by concentration gradients and the flow field.
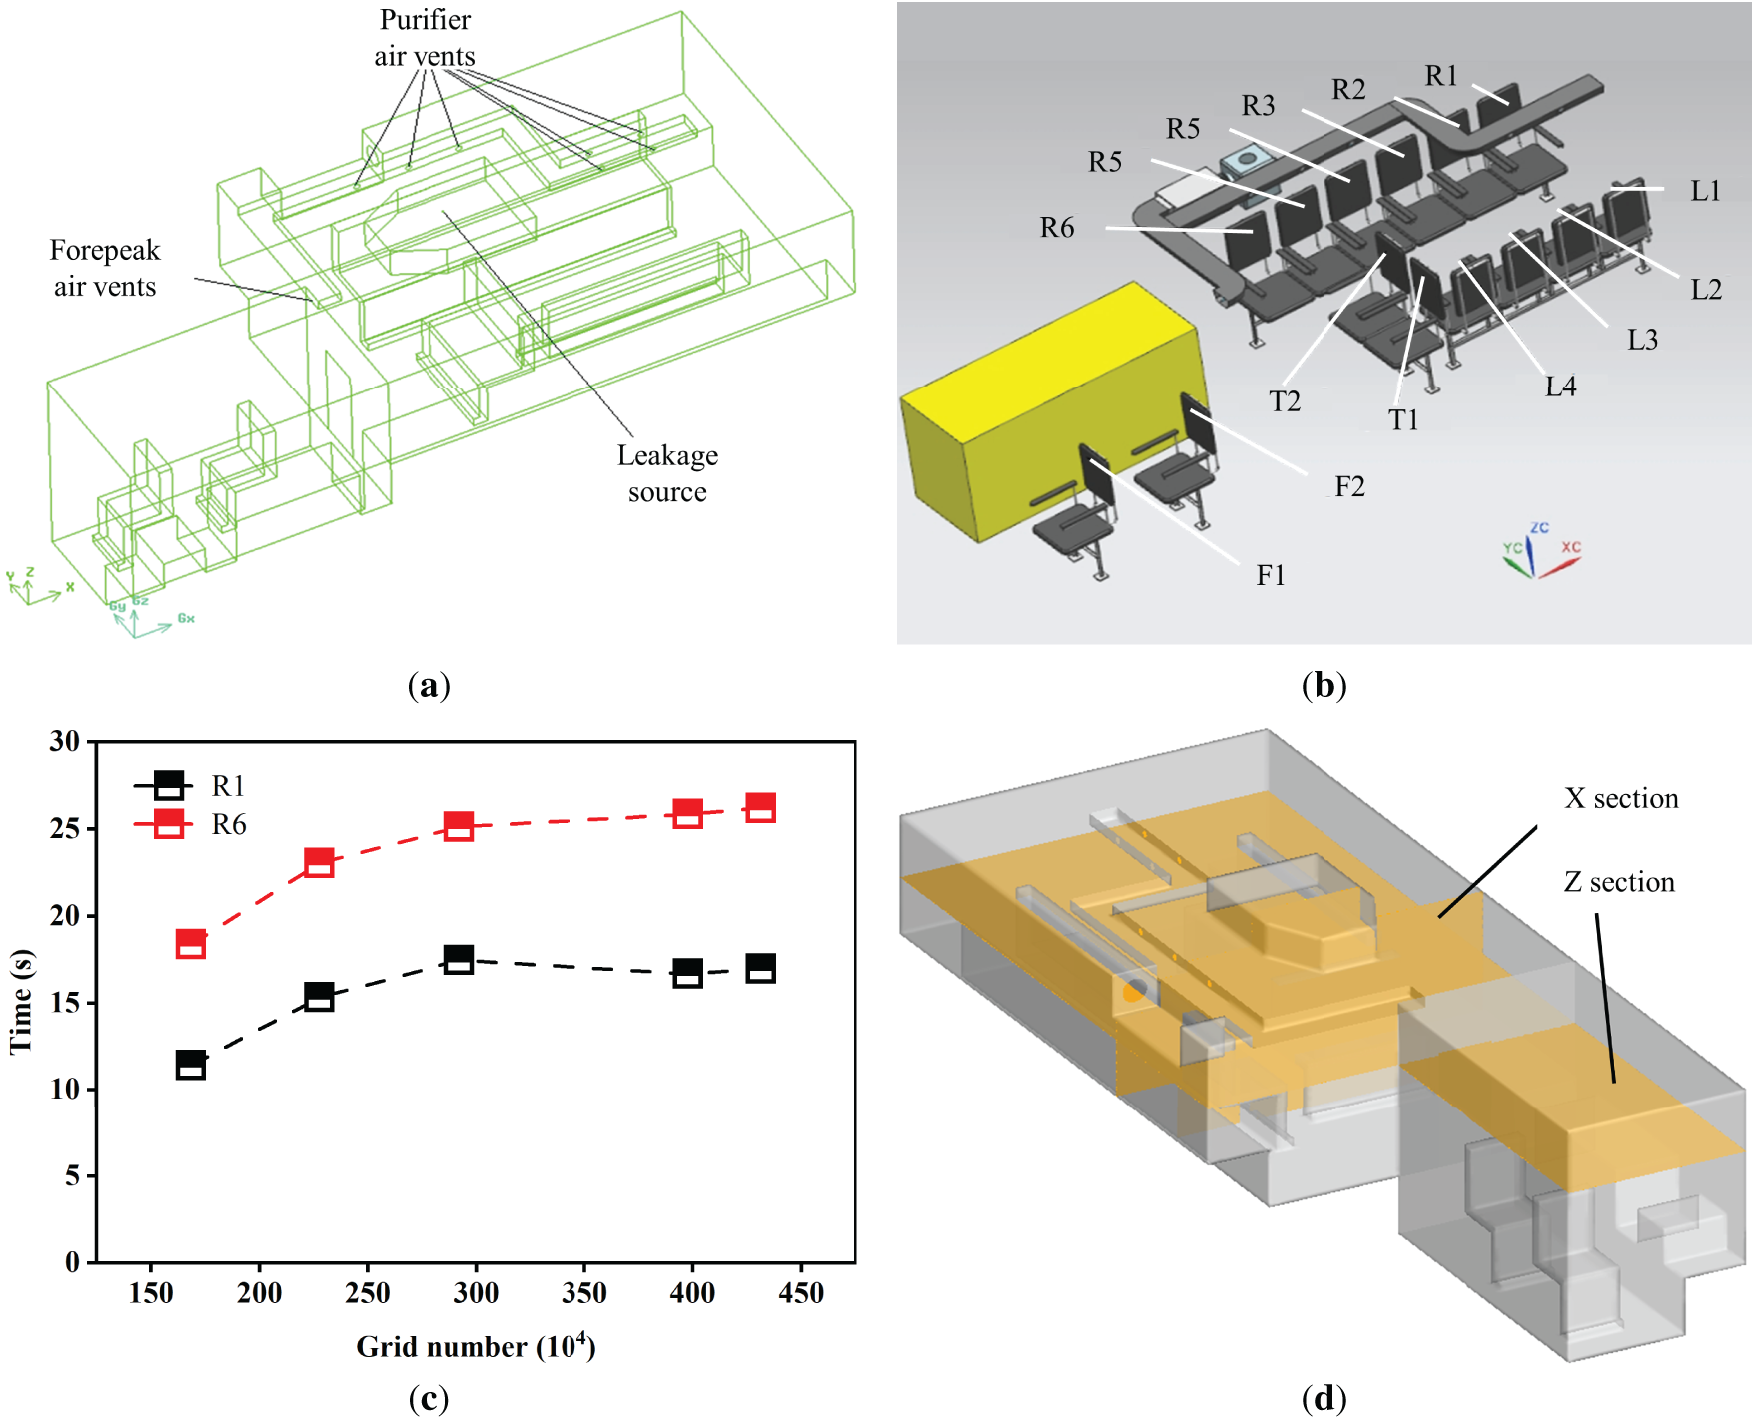
Figure 1: (a) 3D model of the tank; (b) Location of monitoring points; (c) the time required for the CO concentration at key monitoring points (R1 and R6) to reach a critical value (20 mg/m3); (d) Location of X and Z sections
2.2 Governing Equations and Turbulence Model
The flow and diffusion behavior of the transient, variable-density, multi-component gas mixture is described by a set of coupled conservation equations, including mass, momentum, energy and species mass fraction transport equations. The diffusion process is governed by the following set of equations.
The continuity equation is shown in Eq. (1)
The momentum conservation (Navier-Stokes) equation is shown in Eq. (2).
An explanation of the meaning associated with the “UU” representation is provided below.
The component conservation equation is shown in Eq. (3).
The energy conservation equation is shown in Eq. (4).
The turbulence within the cabin is highly complex, especially near the leakage port and in regions of interaction with the intricate internal structures. Turbulence characteristics are decisive for pollutant mixing and local enrichment (i.e., hotspot formation). To accurately capture these flow details, which are critical to this study, such as vortices and high-strain-rate regions, the Renormalization-Group (RNG) k-ε model was selected. Compared to the standard k-ε model, the RNG model provides higher fidelity in simulating flows with strong shear and streamline curvature by modifying the turbulent viscosity and adding an extra term to the ε-equation, making it more accurate for predicting complex indoor flows [2,10,14].
The turbulent kinetic energy equation is:
The dissipation rate equation is:
2.3 Simulation Scenarios and Boundary Conditions
This study was designed around two core simulation scenarios to comparatively analyze the effectiveness and underlying mechanism of the active intervention measure.
Scenario A: Uncontrolled Leakage
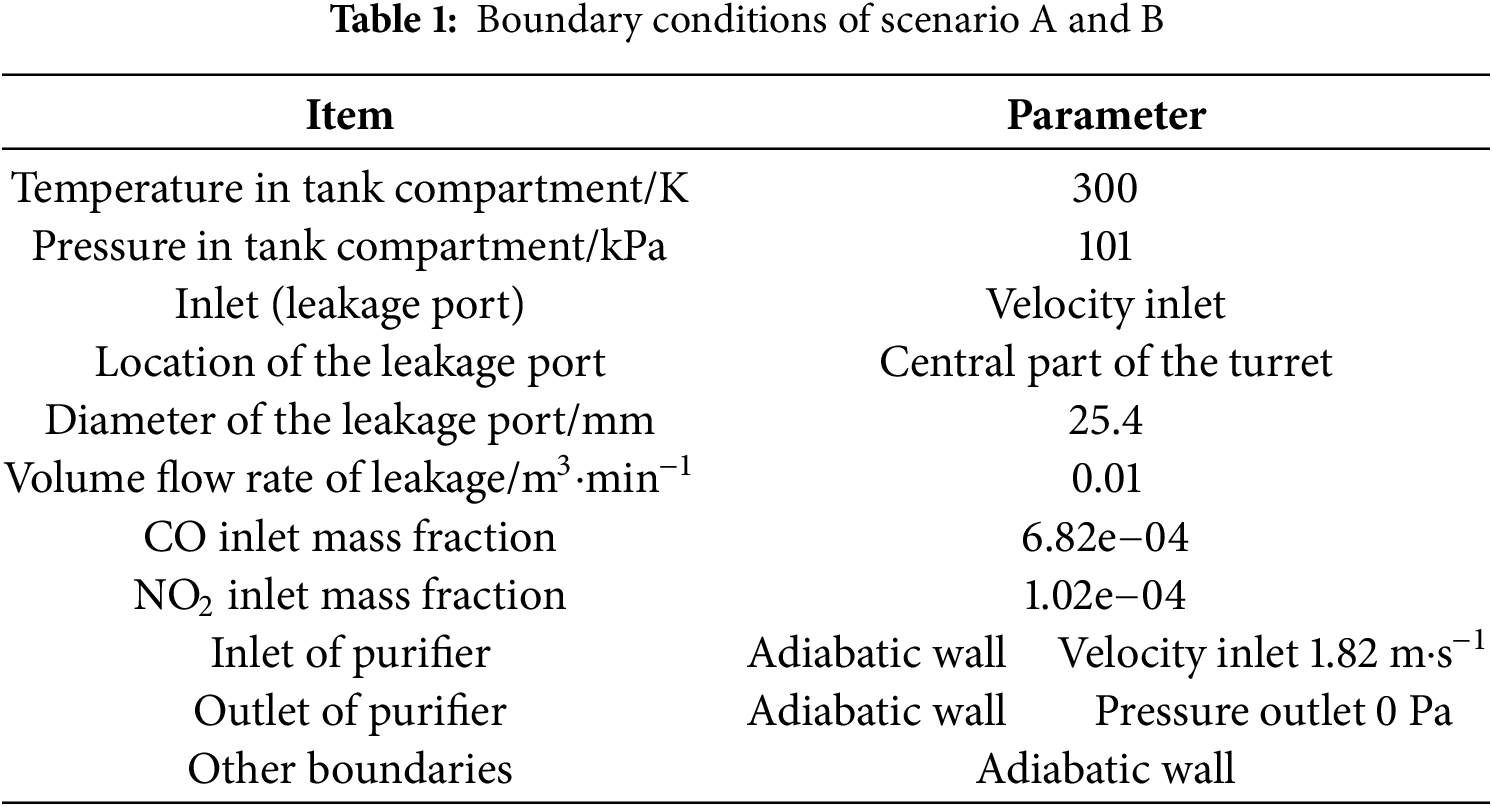
This scenario was designed to simulate the natural diffusion patterns of pollutants without any purification measures. The leakage source, located at the center of the turret, was defined as a velocity inlet with a diameter of 25.4 mm and an inlet volume flow rate of 0.01 m3·min−1. The gas that was leaked was a mixture of air and high concentrations of carbon monoxide (CO) and nitrogen dioxide (NO2). All internal walls of the cabin, including the vents of the purification system, were treated as no-slip, adiabatic walls. The boundary conditions for this scenario are shown in Table 1.
Scenario B: Active Purification
This scenario aimed to evaluate the performance and mechanism of the purification system. To simulate the “extraction-purification-recirculation” process, a custom User-Defined Function (UDF) as shown in Table A1 was implemented. In this setup, an exhaust port at the rear of the cabin was set as a pressure outlet. The UDF continuously monitored the mass flow rate of CO and NO2 passing through this outlet. Based on a preset single-pass purification efficiency (30% for CO and 25% for NO2), the mass of removed pollutants was calculated. The remaining “purified” gas was then reintroduced into the cabin through the eight purification vents, which were defined as velocity inlets. This source-sink model accurately simulates the dual role of the purification system in both removing pollutant mass and reconfiguring the cabin’s flow field. The boundary conditions for this scenario are shown in Table 1.
2.4 Numerical Solution and Verification
The aforementioned governing equations were discretized using the finite volume method and solved with the commercial CFD software ANSYS Fluent 17.0. The pressure-velocity coupling was handled by the SIMPLE algorithm. A second-order upwind scheme was used for the spatial discretization of momentum, turbulent kinetic energy, dissipation rate, and species transport equations to ensure computational accuracy. The simulation was run in a transient mode with a time step of 1 s, for a total duration of 1 h (3600 steps).
To ensure the accuracy and grid-independence of the results, a rigorous grid independence test was conducted as shown in Fig. 1c. By progressively increasing the number of mesh elements, the variation in the time required for the CO concentration at key monitoring points (Right 1 and Right 6) to reach a critical value (20 mg/m3) was examined. It was found that when the grid number reached 3.98 million elements, the relative error in the results from further mesh refinement was less than 5%. Consequently, this mesh configuration, which balanced computational accuracy and efficiency, was adopted for all subsequent simulations. This mesh scheme included local refinement in high-gradient areas, such as the leakage source and purification vents, to accurately capture critical flow details.
Time step sensitivity analysis
For transient computations, the magnitude of the time step directly impacts computational accuracy. Smaller time steps enhance numerical precision but simultaneously cause a steep increase in computational resource consumption. To determine an appropriate time step, simulations were conducted at five distinct intervals: 10, 5, 2, 1, and 0.5 s, each running for 1800 s. The comparative results are illustrated in Fig. 2. Between 1500 and 1700 s, the CO mass fraction progressively decreased as the time step diminished, with the relative change becoming progressively smaller. The CO concentration time-varying curves for step sizes of 1 and 0.5 s showed negligible difference. In summary, a 1 s time step effectively balances computational accuracy with computational resource efficiency, making it the optimal choice for simulation time step configuration.
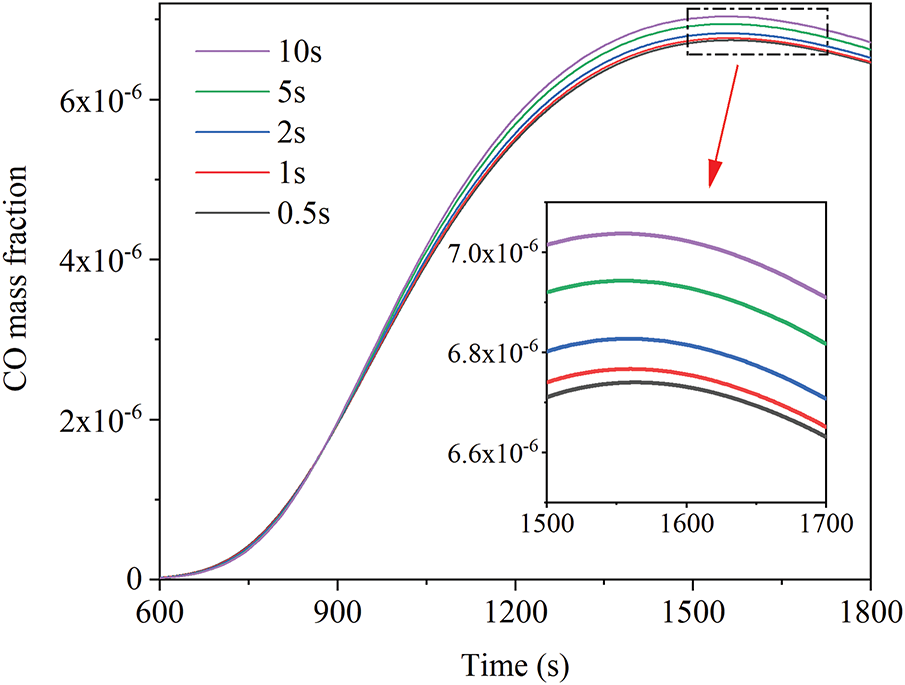
Figure 2: The effect of different time step on calculations
Grid sensitivity analysis
The inlet of the leakage source, as a critical geometric feature of the simulation model, directly influences the accuracy of computational results through its surrounding mesh resolution. Consequently, the variation in CO mass fraction over 1800 s was investigated for mesh sizes of 25.4, 10, 5, 2, 1, 0.5, and 0.25 mm at the leakage source inlet, with a time step of 1 s. As illustrated in Fig. 3, computational results exhibit minimal variation when mesh sizes are 5, 2, and 1 mm. However, further reduction in mesh size leads to a significant decline in computational accuracy. This indicates that when the inlet mesh size falls below 1 mm, computational resources become constrained, leading to excessive Courant numbers due to overly fine meshes and resulting in numerical distortion. Conversely, when the mesh size exceeds 5 mm, the resolution fails to adequately capture geometric features, causing local diffusion behavior to be neglected. In summary, a 1 mm grid size effectively captures local diffusion behavior at the inlet while balancing computational accuracy and efficiency, making it the optimal choice for simulating this pollutant’s diffusion. The inlet mesh is illustrated as shown in Fig. 4.
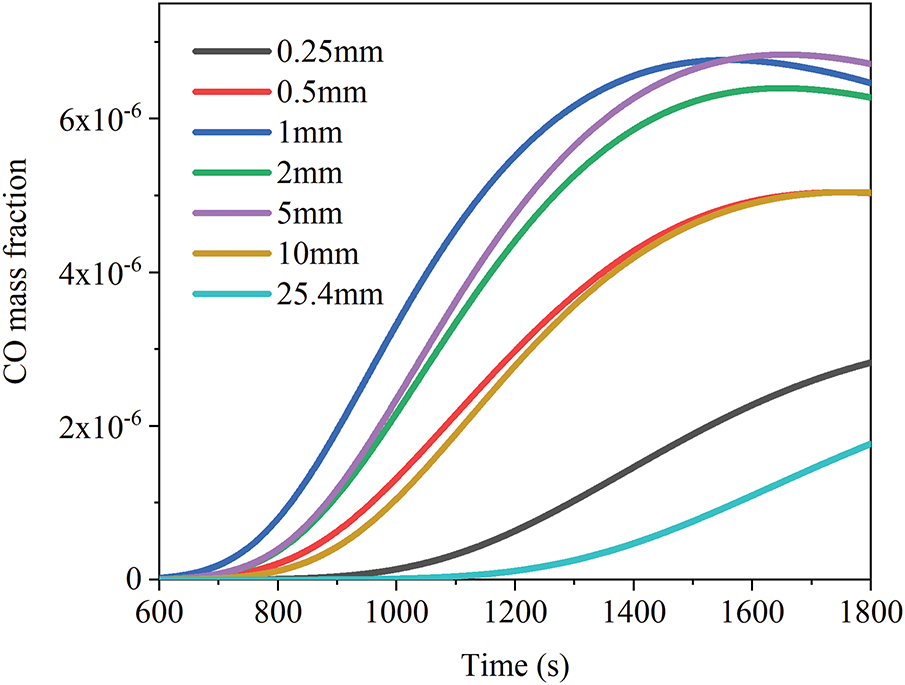
Figure 3: The effect of different mesh sizes at the leakage source on calculations
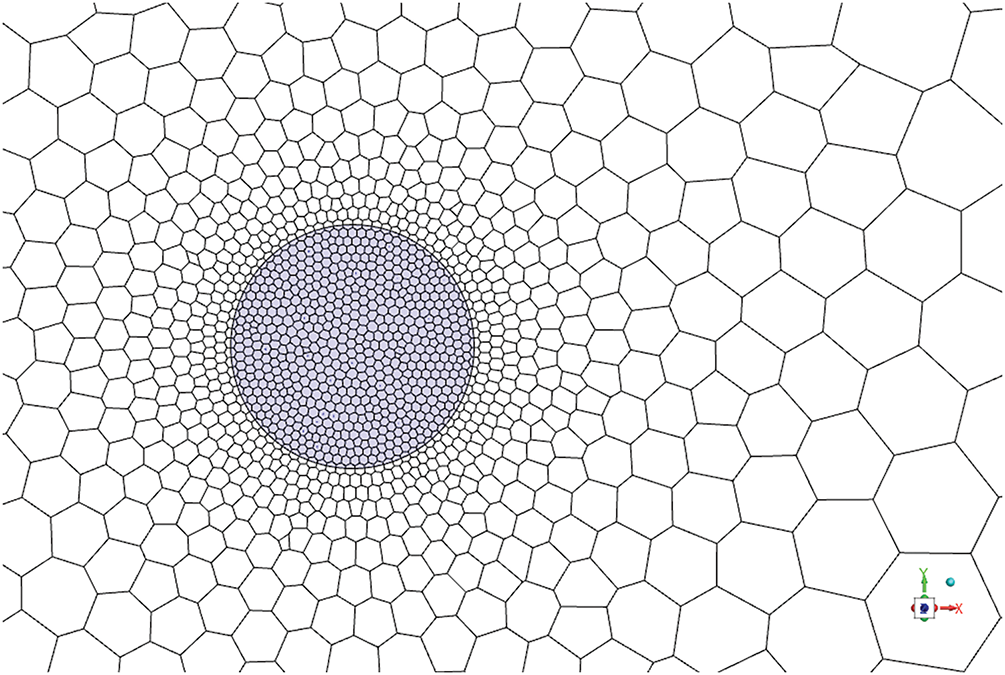
Figure 4: Mesh reinforcement at leakage source inlet
The experiments conducted by Huang et al. [31] serve as the model validation subject for this thesis. The research investigates the dispersion of natural gas leaks within a kitchen environment. The leak source is a natural gas pipeline, originating from a small orifice in the wall. The leaking gas is methane with a volume fraction of 1. Under initial conditions in the kitchen, the oxygen volume fraction is 0.233. Experimental testing at a leak pressure of 2000 Pa yielded a measured flow velocity of 6.4 m/s. An open door on the right side of the kitchen was designated as a 0 Pa pressure outlet. Detailed model dimensions are shown in Fig. 5. With the lower left corner of the kitchen as the coordinate origin, the leak source was positioned at (800, 0, 500), and the monitoring point at (800, 450, 800). When a leak occurs, the volume fraction of CH4 at the monitoring point is sampled every 60 s and transmitted via the gas sensor to the data acquisition equipment. As shown in Fig. 6, the relative error for most points is under 7%. During the initial 300 s, the calculated error was relatively large, with the mass fraction of CH4 exhibiting significant fluctuations and a rapid increase. This was due to the combined effect of buoyancy forces and viscous dissipation causing the small-hole jet to deflect upwards and pass beyond the monitoring point. However, this study primarily focuses on the trend over one hour and whether concentrations exceed standards after one hour. Therefore, the calculation error within the first 300 s does not affect the analysis of the results. Overall, the experimental and simulated results exhibit a high degree of agreement, indicating that the numerical method employed in this study is sufficiently reliable.
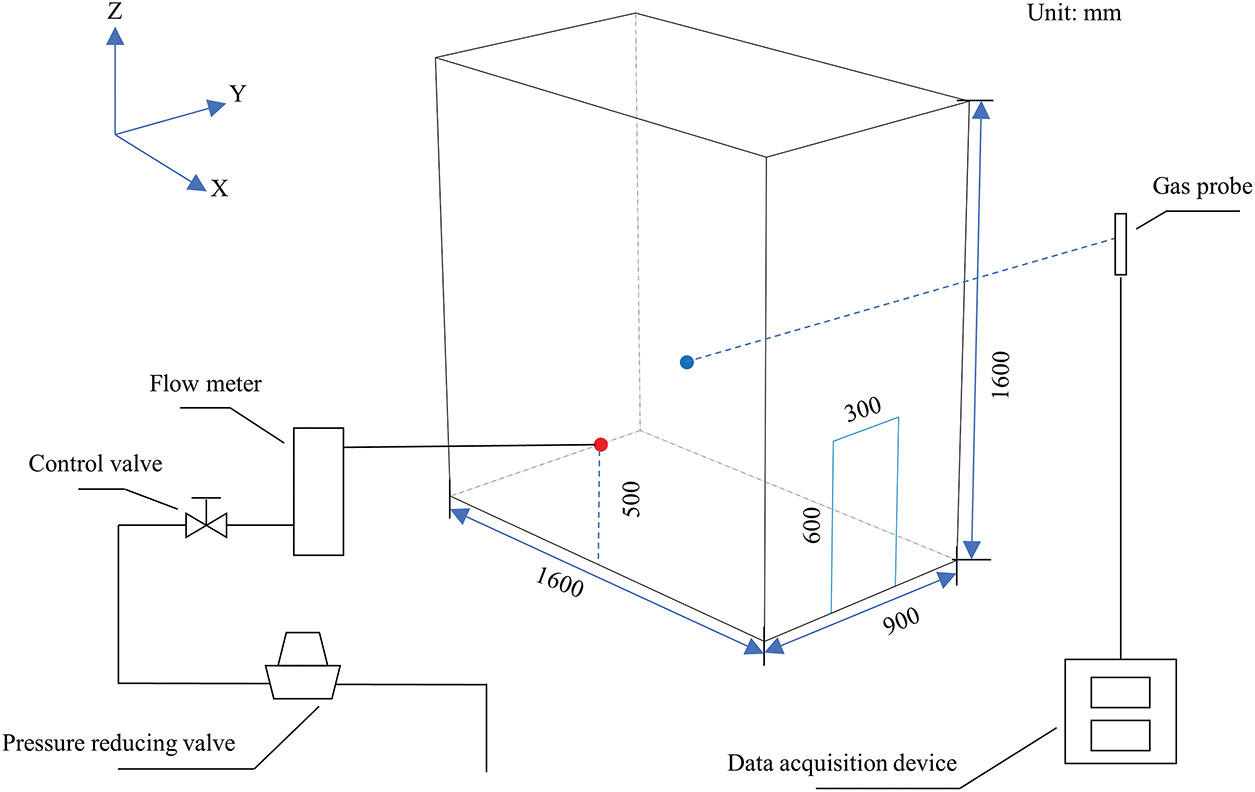
Figure 5: Model and experiment system in Huang’s research [31]
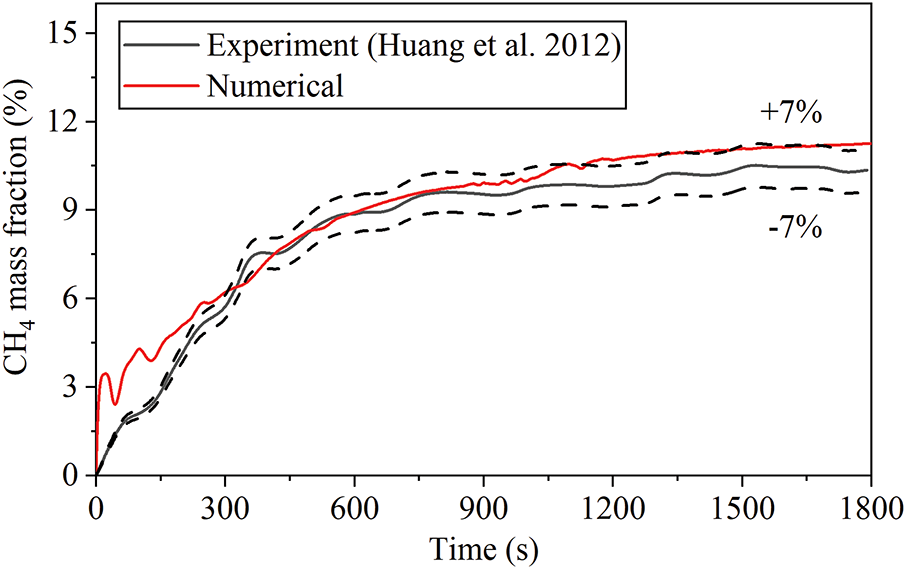
Figure 6: Data comparison of the simulation and the experiment by Huang et al. [31]
This section systematically presents and analyzes the numerical simulation results, constructing a complete logical chain from problem identification to mechanistic elucidation and finally to design guidance. We first reveal how the complex cabin geometry induces the formation of non-uniform “hotspots” in an uncontrolled state. In the following section, the process by which the active purification system mitigates risk through the reshaping of flow fields will be elucidated. In conclusion, the limits of the system’s performance are explored, and principles for future optimization are proposed.
3.1 The Uncontrolled Threat: Spatiotemporal Evolution and Hazard Zone Formation
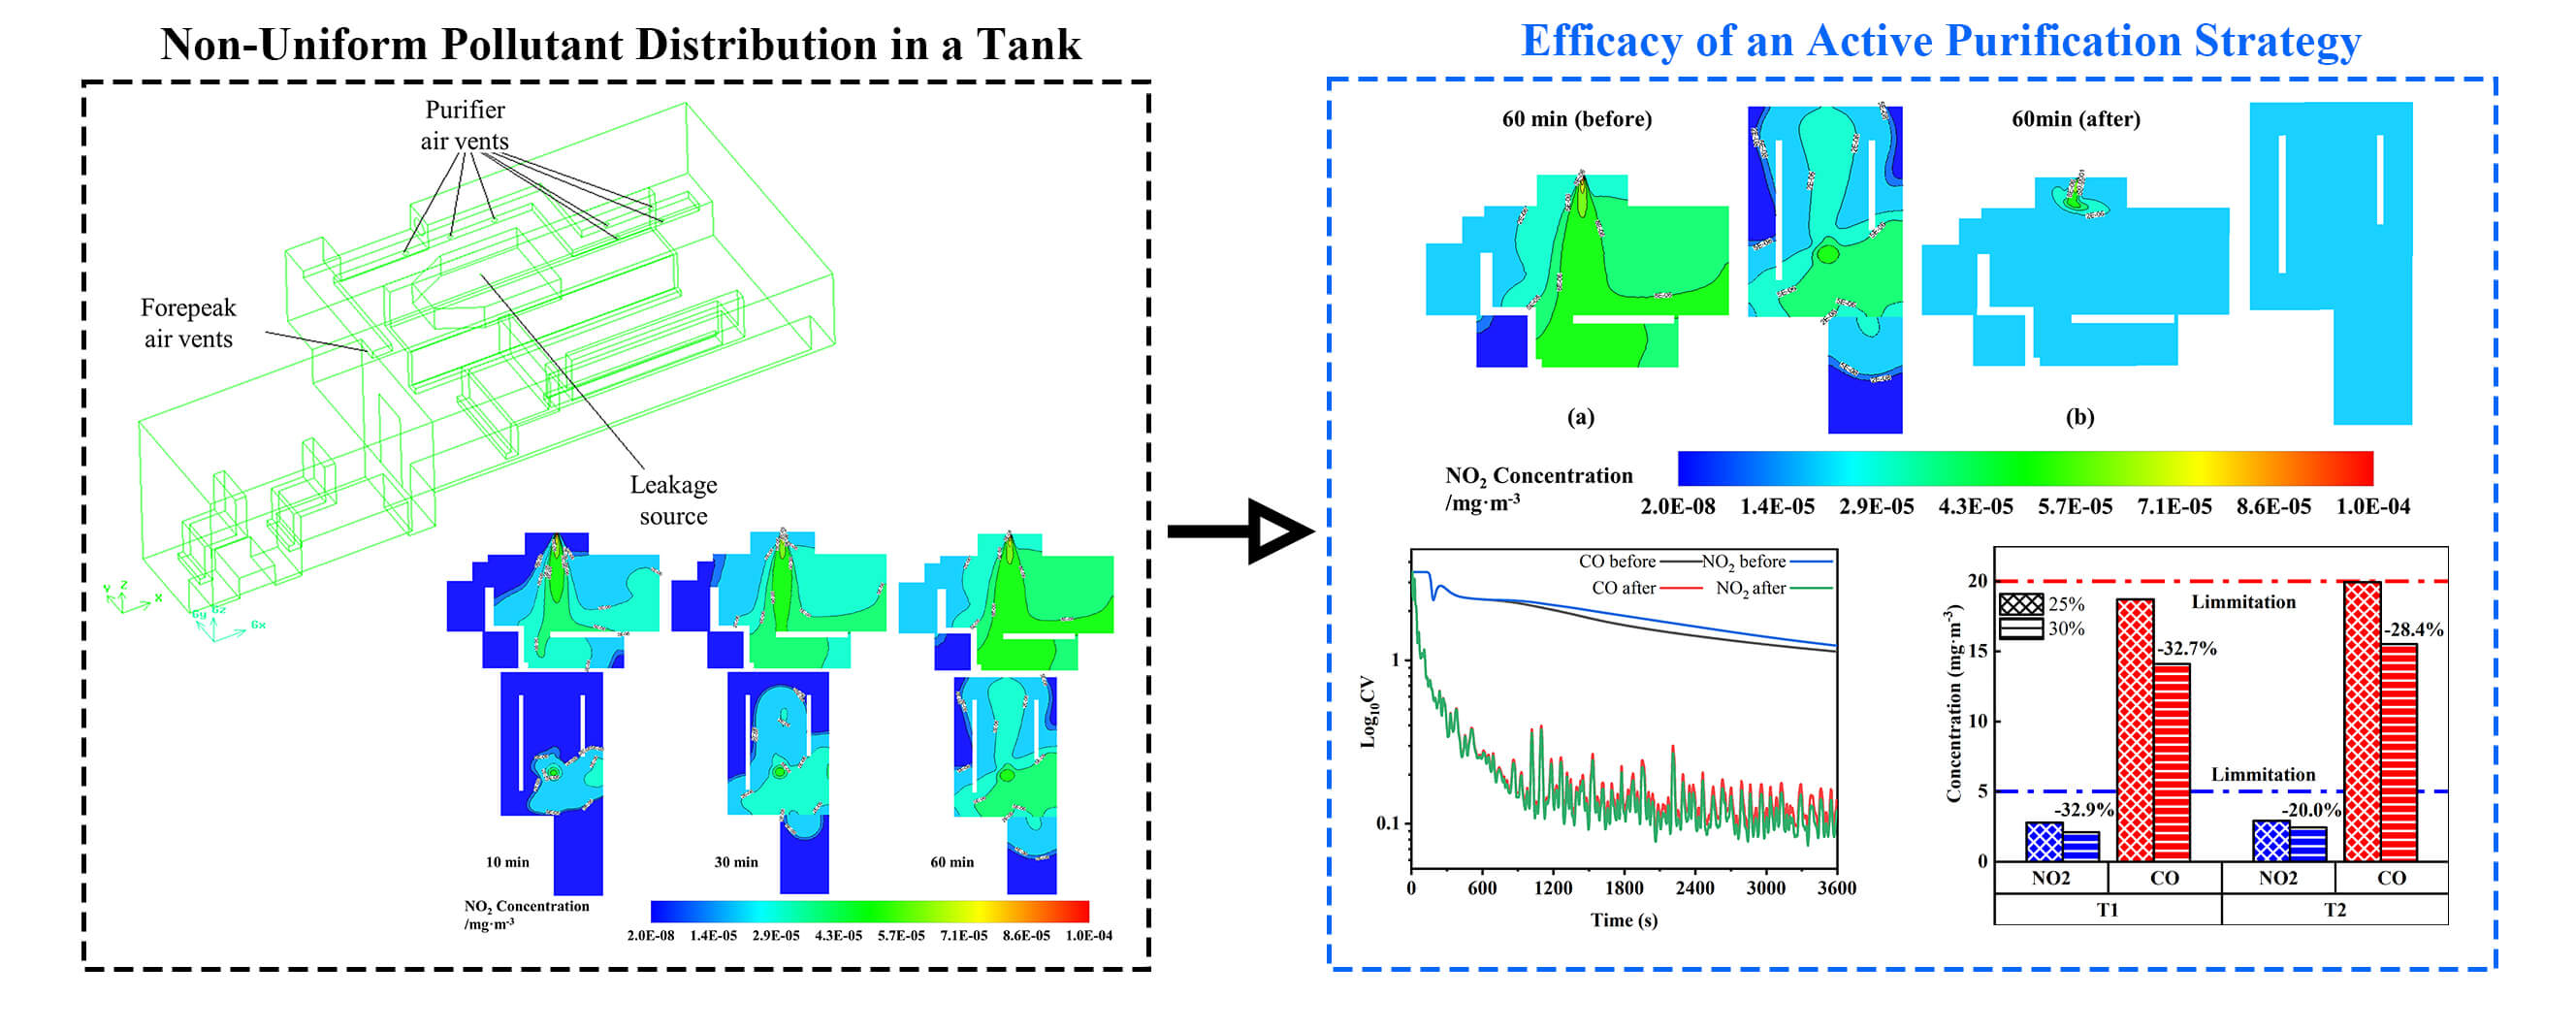
To reveal the intrinsic diffusion patterns of pollutants in an uncontrolled state, we first simulated the scenario without the purification system in operation. Fig. 7 visually presents the spatiotemporal evolution of the NO2 concentration field on the cabin’s X and Z cross sections. In the initial phase of the leak (t = 10 min), the pollutant plume jets vertically downwards from the source beneath the turret. As the plume impinges on the seat and crew models below, its momentum dissipates, and the flow bifurcates: one part disperses laterally, while another part forms a distinct recirculation pattern at the rear of the cabin due to spatial constraints. As time progresses (t = 30 min to 60 min), this recirculation effect is significantly intensified, creating a stable, high-concentration “hazard hotspot” in the left-rear section of the cabin. This finding is of paramount importance as it reveals that in a complex confined space, the most hazardous area may not be the region closest to the leakage source but rather a stagnation or recirculation zone dictated by the internal fluid dynamics. This contrasts sharply with the fundamental principle in simple spaces where pollutant concentration typically decreases with distance from the source [32].
Figure 7: Spatial and temporal evolution of NO2 concentration in x and z cross sections
To connect the macroscopic concentration field with the direct risk faced by the crew, Fig. 8 quantifies the hazard along two dimensions. Fig. 8a,b illustrates the temporal evolution of CO and NO2 concentration at monitoring points. It is evident that the monitoring points within the “hazard hotspot” and directly under the turret exceed the safety threshold within 60 min. Conversely, the monitoring points in the front cabin (Front series) remain at low levels throughout the one-hour simulation, thanks to the effective isolation provided by the partition. Fig. 9 further reveals the accelerating effect of the leakage rate on hazard accumulation. As the leakage rate increases, the time required to reach the critical concentration at the turret decreases non-linearly, with this acceleration being most pronounced at leakage rates below 1 m·s−1. This indicates that even a low-velocity, persistent leak can pose a severe threat to personnel in critical locations in a very short time.
Figure 8: (a) Temporal evolution of CO concentrations at monitoring sites; (b) Temporal evolution of NO2 concentrations at monitoring sites
Figure 9: Time taken for pollutant concentrations at key monitoring points to reach limit values
3.2 The Intervention: Mechanism and Efficacy from Hotspot Suppression to Flow Homogenization
Following the definition of the threat pattern in the uncontrolled state, the active purification system was introduced for the purpose of evaluating its control effectiveness. As demonstrated in Fig. 10, the intervention is evidently efficacious. At a constant leakage rate of 0.33 m/s, the concentrations of CO and NO2 at all monitoring points with the purification system activated are, after one hour of operation, orders of magnitude lower than those without the system. It is noteworthy that the concentrations in the previously identified “hazard hotspot” (e.g., R6) and the turret area (T1, T2) are effectively suppressed well below the safety threshold, thereby demonstrating the strategy’s effectiveness.

Figure 10: (a) Temporal evolution of CO concentrations at monitoring sites after control; (b) Temporal evolution of NO2 concentrations at monitoring sites after control
However, a more profound scientific question is raised: what is the physical mechanism behind this significant efficacy Fig. 11 provides a clear answer to this question. A comparison of the concentration cloud maps at t = 60 min with and without the purification system reveals two distinct physical scenarios. In the absence of the system (Fig. 11a), the cabin displays a markedly non-uniform state, characterized by the coexistence of high-concentration “hotspots” and low-concentration areas. Activation of the purification system (Fig. 11b) results in the complete re-engineering of the entire cabin flow field. The purified air emanating from the eight vents establishes a macroscopic circulation. This forced convection process has been shown to significantly enhance the mixing and momentum exchange of the cabin air [33]. Its primary function is to effectively disrupt and substantially reduces the stable vortices and stagnation zones that are formed by natural convection and geometric constraints. Consequently, newly leaked pollutants are prevented from “lingering” in any local area for an extended period. Instead, they are rapidly and uniformly dispersed throughout the entire cabin space, leading to a substantial reduction in local peak concentrations.

Figure 11: (a) Spatial distribution of NO2 concentration in X and Z sections at 60 min before control; (b) Spatial distribution of NO2 concentration in X and Z sections at 60 min after control
As demonstrated in Fig. 12a,b, a straightforward comparison of the differences in hazardous gas concentration at all monitoring points before and after the implementation of the control system reveals that the incorporation of the purification system did not result in a uniform decrease in concentration across all monitoring points. Instead, it appeared to enhance the circulation of air within the confined space, thereby leading to a more uniform distribution of concentration across all points. Moreover, statistical analysis was conducted to evaluate the homogeneity of the pollutant concentrations within the cabin. Utilizing the standard deviation and the coefficient of variation, as shown in Fig. 12c,d, it was observed that in the uncontrolled scenario, the standard deviation of the pollutants exhibited fluctuations, subsequently increasing and reaching a plateau. Concurrently, the coefficients of variation demonstrated a decline following a fluctuation. Conversely, in the controlled scenario, the standard deviation of the pollutants exhibited a pronounced increase, reaching a stable range and fluctuating within a limited interval. Concurrently, the coefficients of variation exhibited a decline, followed by fluctuations within a reduced range. Fluctuations. The standard deviation is indicative of the extent to which a sample deviates from the mean, with its magnitude being influenced by the mean. In contrast, the coefficient of variation is the ratio of the standard deviation to the mean and is a dimensionless indicator of homogeneity. The results demonstrate that uncontrolled natural leakage results in a gradual increase in the hazardous gas concentration at each location and a continuous increase in the overall pollutant mean. However, as the leakage progresses, the concentrations eventually converge at each location. In contrast, the pollutant concentrations at each location under control undergo a short period of concentration increase, after which the global pollutant concentration no longer rises and gradually converges to the same value at each location.

Figure 12: Comparison of pollutant uniformity in the cabin before and after control. (a) Comparison of CO concentration before and after purification at each monitoring point; (b) Comparison of NO2 concentration before and after purification at each monitoring point; (c) Temporal evolution of standard deviations of pollutant concentrations at all monitoring points in the back chamber; (d) Temporal evolution of coefficient of variation of pollutant concentrations at all monitoring points in the back chamber
This finding indicates the fundamental value of active intervention, as its primary mechanism is not merely pollutant “removal” but rather “hazard homogenization” achieved through flow-field reshaping. This mechanism is designed to ensure that there are no absolute “safe corners” or “danger hotspots” within the cabin. Instead, it maintains the overall risk at a uniform and controllably low level, which is crucial for ensuring the safety of all crew members, regardless of their position.
3.3 System Performance Boundaries and Guidance for Optimal Design System Performance Boundaries and Guidance for Optimal Design
It is imperative to acknowledge that each engineering system is subject to inherent performance constraints. Fig. 13 assesses the robustness of the purification system under four leakage rate conditions: 0.33, 0.66, 1.32, and 2.64 m·s−1. The graph demonstrates a clear correlation between the increase in leakage rate and the rise in concentration at the turret in the “no purification” scenario. Conversely, while the concentration in the “with purification” scenario also increases, its rate of growth is much more gradual. This outcome demonstrates the system’s effective inhibitory effect across a broad spectrum of threat levels. However, it is also observed that when the leakage rate exceeds a critical value (e.g., for CO, a rate approaching 1.32 m·s−1), the concentration directly beneath the turret may still breach the safety threshold after one hour, even with the system active. This delineates the “performance boundary” of the prevailing purification strategy, underscoring the paramount challenge of safeguarding the immediate vicinity of the leakage source.

Figure 13: (a) Changes in Log10CO concentrations at key monitoring points with leakage velocity at 3600 s before and after control; (b) Changes in Log10NO2 concentrations at key monitoring points with leakage velocity at 3600 s before and after control
As illustrated in Fig. 14, a clear path for optimization exists to address this challenge. When the single-pass purification efficiency was increased from 25% to 30%, the NO2 and CO concentrations at T1 decreased by 32.9% and 32.7%, respectively, while the NO2 and CO concentrations at T2 decreased by 20.0% and 28.4%, respectively. The findings demonstrate that, under constant leakage conditions, enhancing the single-pass purification efficiency of the system leads to a substantial, almost linear decline in the pollutant concentration at the turret. However, different locations and different pollutants are not equally sensitive to changes in single-pass purification efficiency. This is because different types of pollutants exhibit different movement patterns when exposed to purification fans due to differences in density, viscosity, and other factors. This result strongly suggests that once the macroscopic circulation pattern of the flow field is established, enhancing the efficiency of the purification unit itself (e.g., the filter medium) is the most direct and effective means of suppressing concentrations at the “source” region. This finding provides clear, quantifiable design guidance for future ventilation system upgrades. When designing such systems, the total circulation airflow (responsible for global homogenization) and the single-pass purification efficiency (responsible for source suppression) should be considered as two independent and equally important core parameters for optimization.

Figure 14: Comparison of pollutant concentrations at 60 min at the monitoring point under the turret before and after the enhancement of the cleaning efficiency
Through high-fidelity CFD numerical simulations, this study has systematically revealed the diffusion patterns of hazardous gases (CO and NO2) in the complex confined space of a tank and elucidated the profound working mechanism of an active purification strategy. The main conclusions are as follows:
1. In the absence of external control, the compartment’s intricate internal geometry exerts a dominant influence over the flow field, thereby inducing the formation of stable, high-concentration “hazard hotspots.” The spatial location of these hotspots is determined by fluid dynamic characteristics, such as recirculation and stagnation zones, rather than by simple proximity to the leakage source. This finding underscores the necessity for safety risk assessments in confined spaces to transcend conventional one-dimensional distance-decay models and incorporate three-dimensional flow field effects in their entirety.
2. The central contribution of this study lies in the mechanistic elucidation of the dual role of the active purification system. The fundamental value of this apparatus lies not only in its ability to reduce the average pollutant concentration through mass removal, but more crucially, in its capacity to completely reshape the internal flow field through forced convection. This results in a fundamental shift from “localized hazard enrichment” to “global risk homogenization.” This “homogenization” mechanism is pivotal in substantially reducing deadly concentration hotspots and ensuring the safety of all crew members within the cabin.
3. The present study proposes a set of design principles for advanced ventilation and life-support systems. The performance boundaries of the purification system have been quantified under various threat levels, and it has been identified that enhancing the single-pass purification efficiency is the key path to suppressing pollution at the “source” region and breaking through performance bottlenecks. This paper puts forward a new design philosophy, which advocates a shift in focus from the mere pursuit of high air exchange rates to the achievement of a synergistic optimization of global flow-field control (for homogenization) and high-efficiency source purification (for local suppression).
Although this study involves certain simplifications (such as the isothermal assumption), the physical mechanisms and design principles it reveals have broad applicability. They can provide important theoretical reference and data support for the design of safety assurance systems in a variety of high-risk confined environments, including submarines, space stations, and mine refuges.
Acknowledgement: Not applicable.
Funding Statement: This work was supported by the National Key Research and Development Program of China (Grant No.: 2022YFE0210200).
Author Contributions: Conceptualization, Peng Yang, Yingwen Liu; methodology, Peng Yang, Hui Chen; software, Xiaolong Li; validation, Peng Yang, Hui Chen; formal analysis, Xiaolong Li; investigation, Xiaolong Li; resources, Peng Yang, Yingwen Liu; data curation, Xiaolong Li; writing—original draft preparation, Xiaolong Li; writing—review and editing, Peng Yang, Hui Chen; visualization, Xiaolong Li; supervision, Peng Yang, Hui Chen, Yingwen Liu; project administration, Peng Yang; funding acquisition, Peng Yang, Hui Chen, Yingwen Liu. All authors reviewed the results and approved the final version of the manuscript.
Availability of Data and Materials: The data that support the findings of this study are available from the Corresponding Author, [Peng Yang], upon reasonable request.
Ethics Approval: Not applicable.
Conflicts of Interest: The authors declare no conflicts of interest to report regarding the present study.
Appendix A
References
1. Liu A, Huang J, Li Z, Chen J, Huang X, Chen K, et al. Numerical simulation and experiment on the law of urban natural gas leakage and diffusion for different building layouts. J Nat Gas Sci Eng. 2018;54:1–10. doi:10.1016/j.jngse.2018.03.006. [Google Scholar] [CrossRef]
2. Liu C, An J, Xie C, Wu H, Zhang Z. Numerical simulation-based pinhole leakage characteristics and hazard boundaries of buried natural gas risers. Process Saf Environ Prot. 2024;184:462–76. doi:10.1016/j.psep.2024.02.011. [Google Scholar] [CrossRef]
3. Chang X, Chai J, Luo J, Qin Y, Xu Z, Cao J. Tunnel ventilation during construction and diffusion of hazardous gases studied by numerical simulations. Build Environ. 2020;177:106902. doi:10.1016/j.buildenv.2020.106902. [Google Scholar] [CrossRef]
4. Rahman MM, Kim KH. Exposure to hazardous volatile pollutants back diffusing from automobile exhaust systems. J Hazard Mater. 2012;241-242:267–78. doi:10.1016/j.jhazmat.2012.09.042. [Google Scholar] [PubMed] [CrossRef]
5. Skoczylas N, Dutka B, Sobczyk J. Mechanical and gaseous properties of coal briquettes in terms of outburst risk. Fuel. 2014;134:45–52. doi:10.1016/j.fuel.2014.05.037. [Google Scholar] [CrossRef]
6. Widiatmojo A, Sasaki K, Sugai Y, Suzuki Y, Tanaka H, Uchida K, et al. Assessment of air dispersion characteristic in underground mine ventilation: field measurement and numerical evaluation. Process Saf Environ Prot. 2015;93:173–81. doi:10.1016/j.psep.2014.04.001. [Google Scholar] [CrossRef]
7. Widiatmojo A, Sasaki K, Widodo NP, Sugai Y, Sahzabi AY, Nguele R. Predicting gas dispersion in large scale underground ventilation: a particle tracking approach. Build Environ. 2016;95:171–81. doi:10.1016/j.buildenv.2015.07.025. [Google Scholar] [CrossRef]
8. He N, Wu Z. Risk evaluation and simulation of chemical pollutants diffused into atmosphere. In: 2009 3rd International Conference on Bioinformatics and Biomedical Engineering; 2009 Jun 11–13; Beijing, China. p. 1–4. doi:10.1109/ICBBE.2009.5163355. [Google Scholar] [CrossRef]
9. Zhang J, Wang W, Wu L, Li P. Research on the diffusion of hazardous gas leakage in road transportation and its influencing factors. J Balkan Tribol Assoc. 2016;22(1):483–92. [Google Scholar]
10. Liu W, Li L, Zhao D, Liao Y. Study on the leakage and diffusion characteristics of buried hydrogen-blended natural gas pipelines. J Press Vessel Technol. 2024;146:011001. doi:10.1115/1.4064204. [Google Scholar] [CrossRef]
11. Chen S, Zhou Z, Ma Y, Zhang L, Wang T, Wang S, et al. Study on hazardous areas of hydrogen fluoride diffusion based on CFD simulation. Processes. 2021;9(9):1545. doi:10.3390/pr9091545. [Google Scholar] [CrossRef]
12. Liu W, Liu D, Gao N. CFD study on gaseous pollutant transmission characteristics under different ventilation strategies in a typical chemical laboratory. Build Environ. 2017;126:238–51. doi:10.1016/j.buildenv.2017.09.033. [Google Scholar] [CrossRef]
13. Jiang DH, Li AG, Shi FE, Wang ZH. Numerical analysis of lab ventilation on double gaseous polluted sources. Adv Mater Res. 2012;374:475–9. doi:10.4028/www.scientific.net/amr.374-377.475. [Google Scholar] [CrossRef]
14. Li M, Chen S, Jiang W, Li Y, Xu Z, Guan B, et al. Numerical simulation analysis of the hydrogen-blended natural gas leakage and ventilation processes in a domestic house. ACS Omega. 2023;8(38):34610–28. doi:10.1021/acsomega.3c03551. [Google Scholar] [PubMed] [CrossRef]
15. Guevara-Luna MA, Guevara-Luna FA, Casallas A, Belalcázar-Cerón LC. Exposure risk to carbon monoxide concentrations inside a diesel-based bus rapid transport system: a CFD-Monte Carlo modeling approach. Model Earth Syst Environ. 2023;9(3):3403–14. doi:10.1007/s40808-023-01688-4. [Google Scholar] [CrossRef]
16. Gadelha AJF, Porto TRN, Freire de Andrade TH, de Farias Neto SR, Barbosa de Lima AG. Thermo-fluid dynamic of gaseous pollutant dispersion: fundamentals and applications in thermal power plants. Diffus Found. 2018;20:34–54. doi:10.4028/www.scientific.net/df.20.34. [Google Scholar] [CrossRef]
17. Wei Y, Zhang T. A model based on Markov chain for prompt prediction of the airborne gaseous pollutant transport in aircraft cabins. E3S Web Conf. 2022;356:04026. doi:10.1051/e3sconf/202235604026. [Google Scholar] [CrossRef]
18. Yassin MF, Kellnerová R, Jaňour Z. Impact of street intersections on air quality in an urban environment. Atmos Environ. 2008;42(20):4948–63. doi:10.1016/j.atmosenv.2008.02.019. [Google Scholar] [CrossRef]
19. Liu X, Zhang G, Wu M, Wu Z. Study on the potential risks under a hazardous gas leakage accident: effects of source characteristics and ambient wind velocities. Environ Sci Pollut Res Int. 2023;30(7):17516–31. doi:10.1007/s11356-022-23347-4. [Google Scholar] [PubMed] [CrossRef]
20. Luo Z, Liu L, Su B, Song F, Hao R, Zhang C, et al. Consequence analysis of CNG leakage at joint refueling and charging stations. Process Saf Prog. 2023;42(4):637–48. doi:10.1002/prs.12500. [Google Scholar] [CrossRef]
21. Cui W, Yuan Y, Tong L, Shen B. Numerical simulation of hydrogen leakage diffusion in seaport hydrogen refueling station. Int J Hydrogen Energy. 2023;48(63):24521–35. doi:10.1016/j.ijhydene.2023.03.208. [Google Scholar] [CrossRef]
22. Memarzadeh F. Effect of reducing ventilation rate on indoor air quality and energy cost in laboratories. J Chem Health Saf. 2009;16(5):20–6. doi:10.1016/j.jchas.2009.03.014. [Google Scholar] [CrossRef]
23. Zhou J, Yu K, Yang M. Numerical simulation of gas leakage mechanism of ventilated supercavity under the condition of low Froude number. Eng Mech. 2011;28(1):251–6. [Google Scholar]
24. Wang W, Wang C, Wei Y, Song W. A study on the wake structure of the double Vortex tubes in a ventilated supercavity. J Mech Sci Technol. 2018;32(4):1601–11. doi:10.1007/s12206-018-0315-5. [Google Scholar] [CrossRef]
25. Sun T, Zhang X, Xu C, Zhang G, Jiang S, Zong Z. Numerical modeling and simulation of the shedding mechanism and Vortex structures at the development stage of ventilated partial cavitating flows. Eur J Mech B. 2019;76:223–32. doi:10.1016/j.euromechflu.2019.02.011. [Google Scholar] [CrossRef]
26. Lee HY, Cha CL, Hwang SS. Numerical investigation on NOX formation in oxygen-CH4 MILD combustion with air leakage. J Mech Sci Technol. 2019;33(8):3733–41. doi:10.1007/s12206-019-0715-1. [Google Scholar] [CrossRef]
27. Ren XT, Ma XL, Liu JZ, Liu R, Zhao CQ, Wu H, et al. Diffusion simulation and risk assessment model establishment of chlorine gas leakage based on terrain conditions. Environ Sci Pollut Res Int. 2023;30(19):54742–52. doi:10.1007/s11356-023-26181-4. [Google Scholar] [PubMed] [CrossRef]
28. Lei M, Liu H, Wan S, Huang J. CFD investigation of crew oxygen cylinder leakage concentration in triangle area of civil aircraft. In: 2024 3rd International Symposium on Aerospace Engineering and Systems (ISAES); 2024 Mar 22–24; Nanjing, China. p. 290–3. doi:10.1109/ISAES61964.2024.10751510. [Google Scholar] [CrossRef]
29. Mynarz M, Tulach A, Bojko M. CFD-based simulation of flammable gas dispersion in a complex geometry. J Loss Prev Process Ind. 2025;94:105551. doi:10.1016/j.jlp.2025.105551. [Google Scholar] [CrossRef]
30. Góbi Santolin B, Silva Martins R, Ferreira Martins M. Advanced RANS model for simulating high-pressure gas leaks and dispersion dynamics. J Loss Prev Process Ind. 2025;98:105707. doi:10.1016/j.jlp.2025.105707. [Google Scholar] [CrossRef]
31. Huang XM, Guo YH, Peng SN, Liao B. CFD simulation and experimental verification for indoor gas dispersion after an accidental leakage. China Saf Sci J. 2012;22(4):27–31. (In Chinese). doi:10.16265/j.cnki.issn1003-3033.2012.04.023. [Google Scholar] [CrossRef]
32. Dong L, Zuo H, Hu L, Yang B, Li L, Wu L. Simulation of heavy gas dispersion in a large indoor space using CFD model. J Loss Prev Process Ind. 2017;46:1–12. doi:10.1016/j.jlp.2017.01.012. [Google Scholar] [CrossRef]
33. Zhang RH. Numerical simulation and influencing factors analysis of the leakage and infiltration diffusion for fuel underground storage tank. Adv Mater Res. 2012;524-527:1826–34. doi:10.4028/www.scientific.net/amr.524-527.1826. [Google Scholar] [CrossRef]
Cite This Article
 Copyright © 2025 The Author(s). Published by Tech Science Press.
This work is licensed under a Creative Commons Attribution 4.0 International License , which permits unrestricted use, distribution, and reproduction in any medium, provided the original work is properly cited.
 Downloads
 Citation Tools