
 Submit a Paper
 Propose a Special lssue
 Open Access
ARTICLE

Simulation and Performance Analysis of a Photovoltaic-Thermal Heat Pump System
1 School of Ecological Environment and Urban Construction, Fujian University of Technology, Fujian, 350118, China
2 Key Laboratory of New Energy and Energy Conservation in Buildings, Fujian University of Technology, Fujian, 350118, China
3 School of Electronic and Mechanical Engineering, Fujian Polytechnic Normal University, Fuqing, 350300, China
4 Shanghai Electric Power Co., Ltd., Minhang Power Plant, Shanghai, 200245, China
* Corresponding Author: Yubing Li. Email:
(This article belongs to the Special Issue: Direct Energy Conversion of Solar Energy: Photovoltaic-Thermoelectric Combinations, Hybrids, and Effects)
Frontiers in Heat and Mass Transfer 2025, 23(6), 2025-2049. https://doi.org/10.32604/fhmt.2025.072260
Received 22 August 2025; Accepted 04 November 2025; Issue published 31 December 2025
 View Full Text
 Download PDF
Abstract
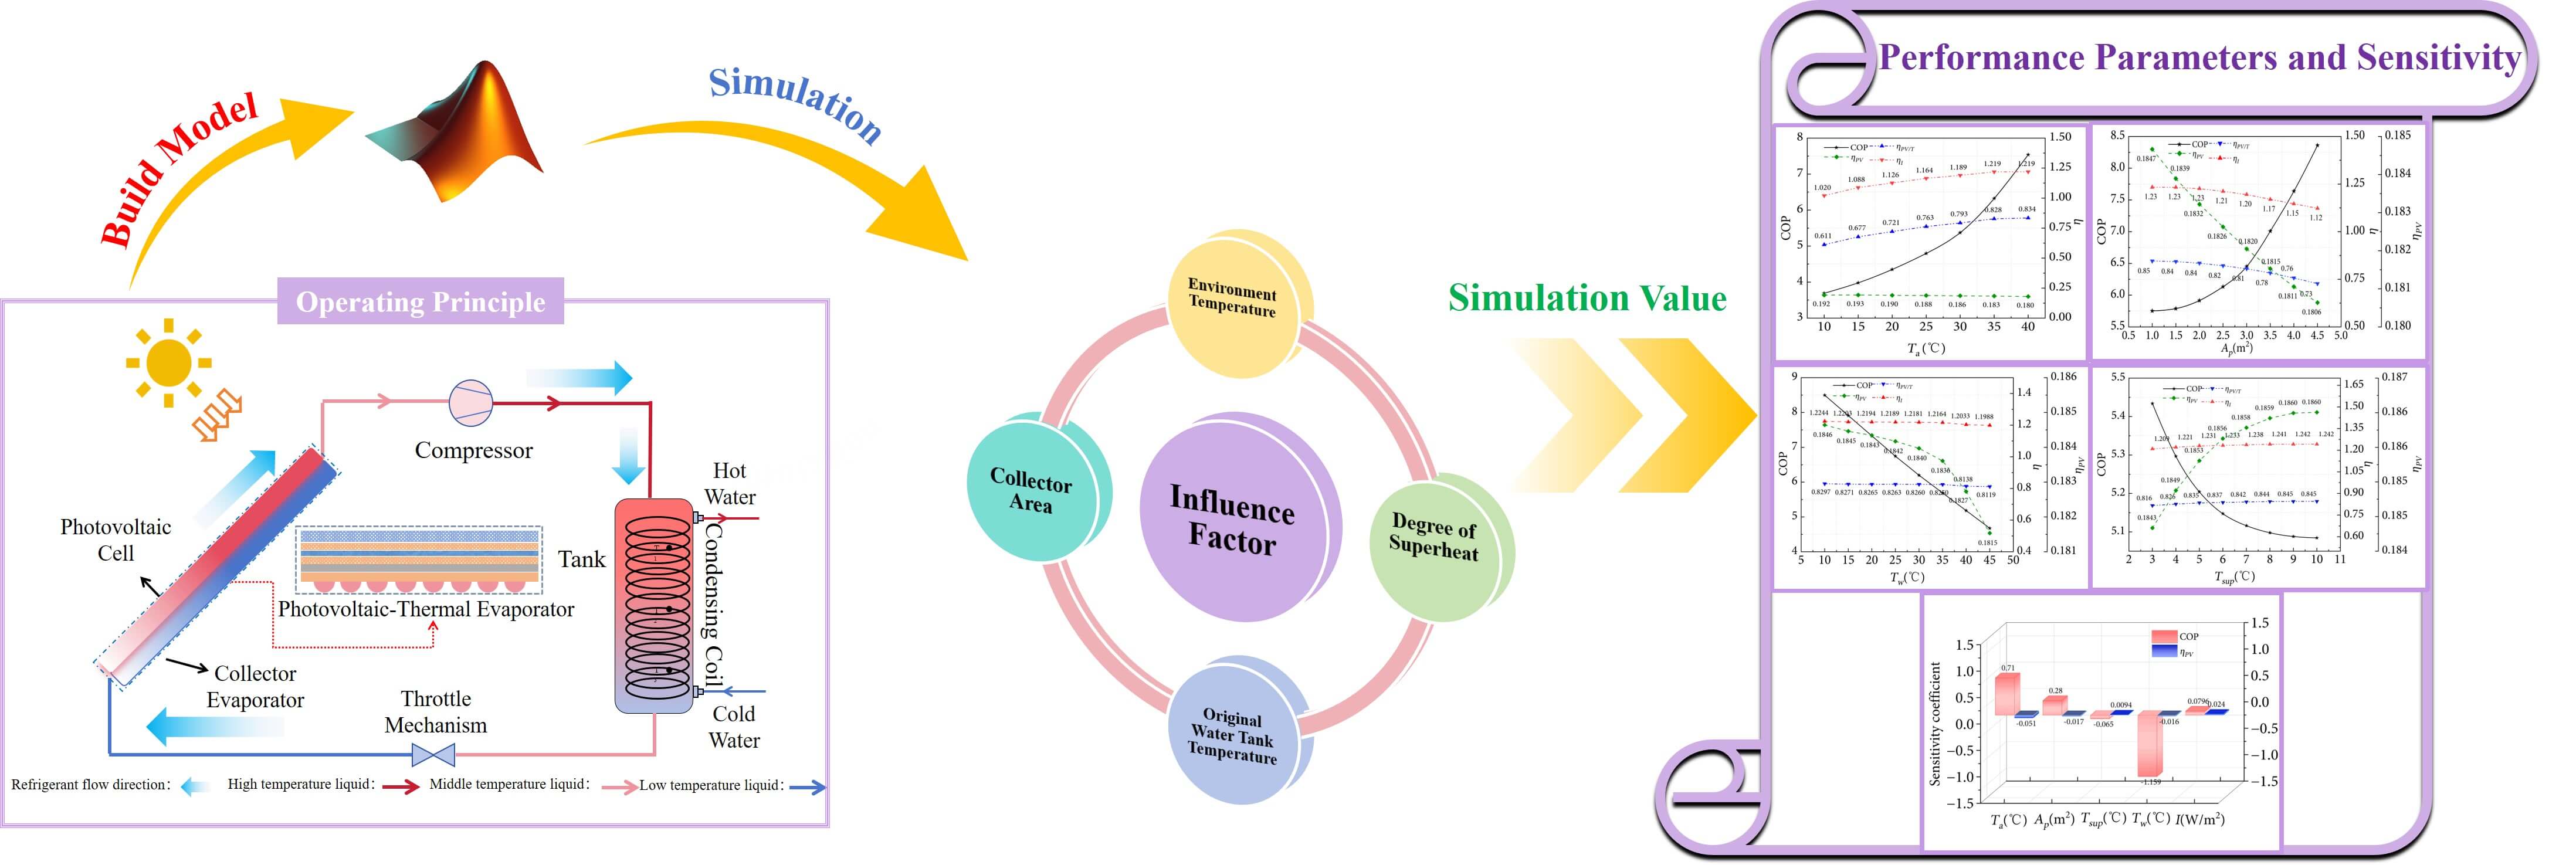
The growing demand for energy-saving and renewable heating solutions has made photovoltaic/thermal (PV/T) heat pump systems a promising technology. However, their thermal and electrical performance, as well as the overall utilization of solar energy, strongly depend on capacity configuration and operating parameters. To address this issue, this study proposes a PV/T heat pump system featuring a novel rhombic flow channel structure that functions as the collector-evaporator. An experimental test bench was established to evaluate system performance, and a one-dimensional numerical model was developed to investigate the effects of environmental and operating parameters. The simulation results deviated by approximately 10% from the experimental data, indicating good agreement between the two approaches. Analysis shows that hot-water heating time decreases with increasing solar radiation intensity. The system coefficient of performance (COP) rises by 50.9% and 45.9% with higher environmental temperature and collector area, respectively, but decreases by 6.61% and 45% with greater superheat and higher original tank temperature. The photovoltaic (PV) generation efficiency decreases by 6.25%, 2.16%, and 1.63% with increases in environmental temperature, collector-evaporator area, and original tank temperature, respectively, but increases by 0.92% with higher superheat. Sensitivity analysis further reveals that original tank temperature exerts the strongest influence on system COP, with a sensitivity coefficient of 1.159, while environmental temperature most significantly affects PV efficiency, with a sensitivity coefficient of −0.051. Overall, this study provides a pathway to enhance system stability and energy efficiency, offering theoretical and practical contributions to the intelligent control of PV/T heat pump systems.Graphic Abstract
Keywords
As global energy consumption rises each year, the widespread use of fossil fuels has worsened environmental and energy crises [1]. Solar energy, as a renewable source, has seen steady development recently, mainly through two methods: photovoltaic and photothermal applications [2]. However, one of the main concerns of researchers and consumers in this area of energy is preventing the cell’s temperature increasing, especially in areas with hot weather and intense sunlight. Studies show that about 12%–20% of sunlight falling on the surface of PV cells gets converted directly to electricity, and more than 80% of the remaining radiation is wasted [3]. The advent of PV/T components addresses this limitation by effectively lowering PV cell temperatures through heat collection media while also utilizing waste heat, thus improving overall solar energy utilization efficiency [4].
The PV/T heat pump system can be primarily classified into two types based on its operational mode: direct expansion (DX) and Indirect Expansion (IX) [5]. The direct expansion solar assisted heat pump (DX-SAHP) [6,7] system was first proposed by Sporn and Ambrose in 1955 [8]. In the DX system, solar collectors are directly used as evaporators [9], while the IX system absorbs heat from the collector through a heat exchanger. DX-SAHP has gained attention due to its simple structure and its potential for sustainable energy utilization [10].
The performance of PV/T heat pump systems depends on various operating parameters such as environmental temperature and radiation intensity, requiring parameters studied to optimize these systems. Abbas et al. [11] built a direct expansion PV/T heat pump system and conducted numerical simulations and experimental studies in Karachi, Pakistan. Results showed that the electrical gain of the PV/T heat collector-evaporator increased from 76 to 86 W when solar radiation intensity rose from 500 to 760 W/m2. Sami [12] developed a numerical simulation model for PV/T heat pump systems based on the meteorological data of Ecuador and studied how system performance changed under different solar radiation intensities. Zhang et al. [13] conducted field experiments in Hefei (China) to study the winter operational characteristics of large-scale direct expansion PV heat pump (DX-PVHP) system, and found that DX-PVHP system achieved a higher COP under higher solar radiation intensity. Xu et al. [14] developed a new low-concentration PV/T (LCPV/T) heat collector-evaporator and conducted experimental research in Nanjing, China, which experienced a subtropical monsoon climate with hot, rainy summers and mild winters. Results showed that under clear summer conditions (1360 W/m2), the output electrical efficiency of the LCPV/T heat collector-evaporator improved by 1.36 times compared to the LCPV heat collector-evaporator. Sun et al. [15] performed simulation modeling on a PV/T heat pump system using Beijing’s winter and summer environmental parameters as operating conditions. Results indicated that in summer, the PV/T module temperature was 20.2°C lower than the PV module, and 17.8°C lower in winter, with the average PV efficiency increasing by 15.4% and 8.9%, respectively.
Chen et al. [16] established a mathematical model for DX heat collector-evaporator based on experiments conducted in Shanghai, China, showing that the collector-evaporator could adapt well to low-temperature environment (−10°C) with a COP of 3.71. Othman et al. [17] conducted experimental studies on dual-fluid PV/T system at the National University of Malaysia in Bangi, to investigate the influence of radiation intensity and fluid mass flow rate on thermoelectric performance. Results indicated that optimal system operation occurred at a radiation intensity of 800 W/m2, an air flow rate of 0.05 kg/s, and a water flow rate of 0.02 kg/s. Misha et al. [18] found through numerical simulation and experiment in Melaka, that PV/T electrical and thermal efficiency increased with mass flow rate, achieving a maximum electrical performance of 11.71%. Prasetyo et al. [19] conducted numerical simulation for Indonesia and found that semi-circular collector achieved the best performance at a solar radiation intensity of 1000 W/m2 and a mass flow rate of 0.5 kg/s. Venugopal et al. [20] experimentally analyzed the effects of solar irradiation intensity and condenser outlet water temperature on the coefficient of performance of a PV/T heat pump system in India, which is characterized by tropical monsoon and subtropical mountain climates, and proposed corresponding optimization strategies. Sulaiman et al. [21] developed a coupled system integrating PV/T collector with a ground-source heat pump at Ulster University in Belfast, United Kingdom. The results showed that in cold climatic regions, the PV/T subsystem improved solar energy utilization, achieving a maximum overall efficiency of 70.02%. Almadhhachi et al. [22] proposed a PV/T system incorporating transparent thermally conductive materials and performed simulation analyses for Kufa, Iraq, and Gödöllő, Hungary, which represent hot desert and cold continental climates, respectively. The results showed that the best efficiency was achieved when the mass flow rate was 0.08 kg/s, and it was pointed out that this PV/T system was more effective in cold climates. Based on the above studies, it can be concluded that the operating parameters have a significant impact on the performance of PV/T heat pump systems. However, most of the research has focused on cold regions and regions with hot summers and cold winters, while there are relatively few studies on high-temperature and high-humidity areas.
The performance of PV/T heat pump systems is not only affected by operating parameters but is also largely constrained by the collector-evaporation structural parameters. To enhance system performance, researchers conducted extensive studies on the shape and structure of the flow channel. Zhou et al. [23] investigated the influence of the tube spacing, absorber material and tube arrangement position of the serpentine tube PV/T collector-evaporator on the temperature distribution. The study pointed out that reducing the tube spacing was the most effective method to improve the uniformity of the temperature distribution. Fudholi et al. [24] designed three different cooling structures, namely webbed, direct flow, and spiral flow, and through experimental research, found that the direct flow structure could achieve higher thermal efficiency. Che et al. [25] conducted mathematical modelling and simulation analysis on the DX type PV/T heat collector-evaporator. They determined that the collector area and absorptivity were the key design parameters, with their sensitivity coefficients being 0.201 and 0.223, respectively. Bisengimana et al. [26] studied the factors influencing temperature distribution in the PV/T evaporator of the PV/T system. The study showed that at a flow rate of 0.02 kg/s, the serpentine PV/T heat exchanger with fins and small tube spacing (62.5 mm) had better uniform temperature distribution, lower fluid pressure drop, and higher efficiency coefficient. Pang et al. [27] conducted experimental tests and simulations on rectangular and arched PV/T module. The results indicated that the arched module performed best when the flow channel size and spacing were 1:2. Shen et al. [28] optimized the heat transfer performance of PV module by altering the shape of the flow channels. Aghakhani et al. [29] numerically simulated the influence of the size of serpentine heat pipes and the number of loops on the cooling performance of solar panels. The results indicated that the system’s electrical efficiency was the highest when the flow rate was 1.5 lit/min, the pipe diameter was 15.88 mm, and there were 11 loops.
Previous studies have shown that different channel shapes of PV/T collectors have different impacts on the performance improvement of PV/T heat pump systems. Diverse channel shapes are conducive to the development of PV/T technology and provide more solutions for system performance optimization. However, the manufacturing processes of certain channel shapes are overly complex, making field experiments difficult to carry out and increasing the original investment cost of the system to a certain extent. Moreover, there is relatively little research on PV/T heat pump systems in high-temperature and high-humidity regions. Therefore, this study aims to design a new and simple rhombic channel-shaped PV/T heat pump system to reduce investment costs and manufacturing process complexity. An experimental platform was built, and based on environmental parameters, including environmental temperature and solar radiation intensity, and system operation parameters, including collector area, original water tank temperature, and degree of superheat, the performance variation trends of the system were studied. This study aims to provide insights into further performance optimization of the system.
2 Experimental Setup and Mathematical Method
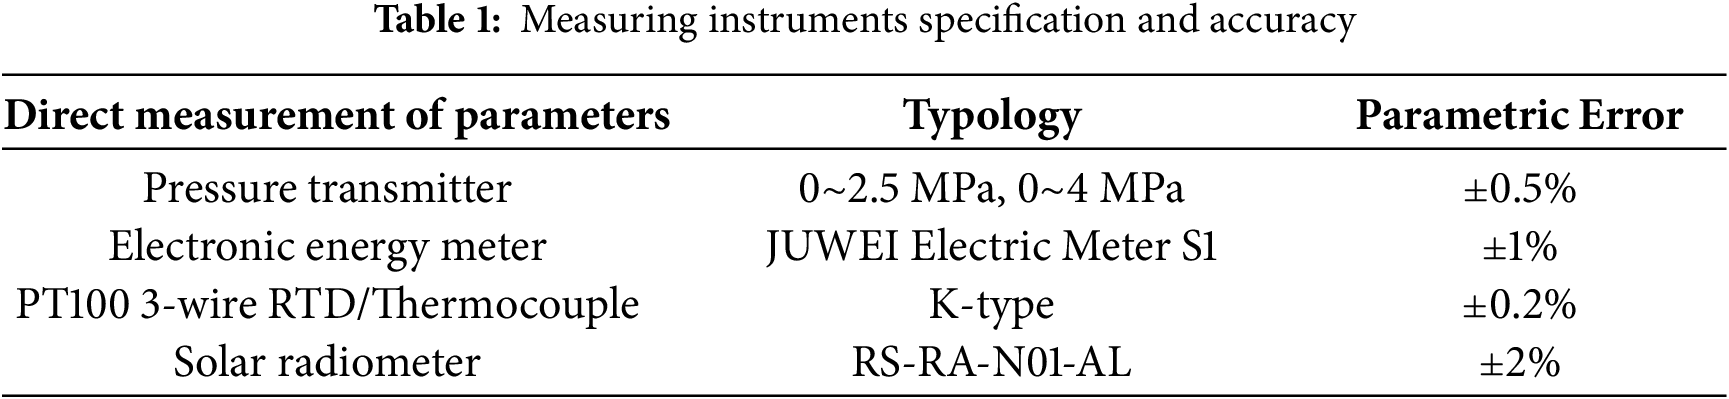
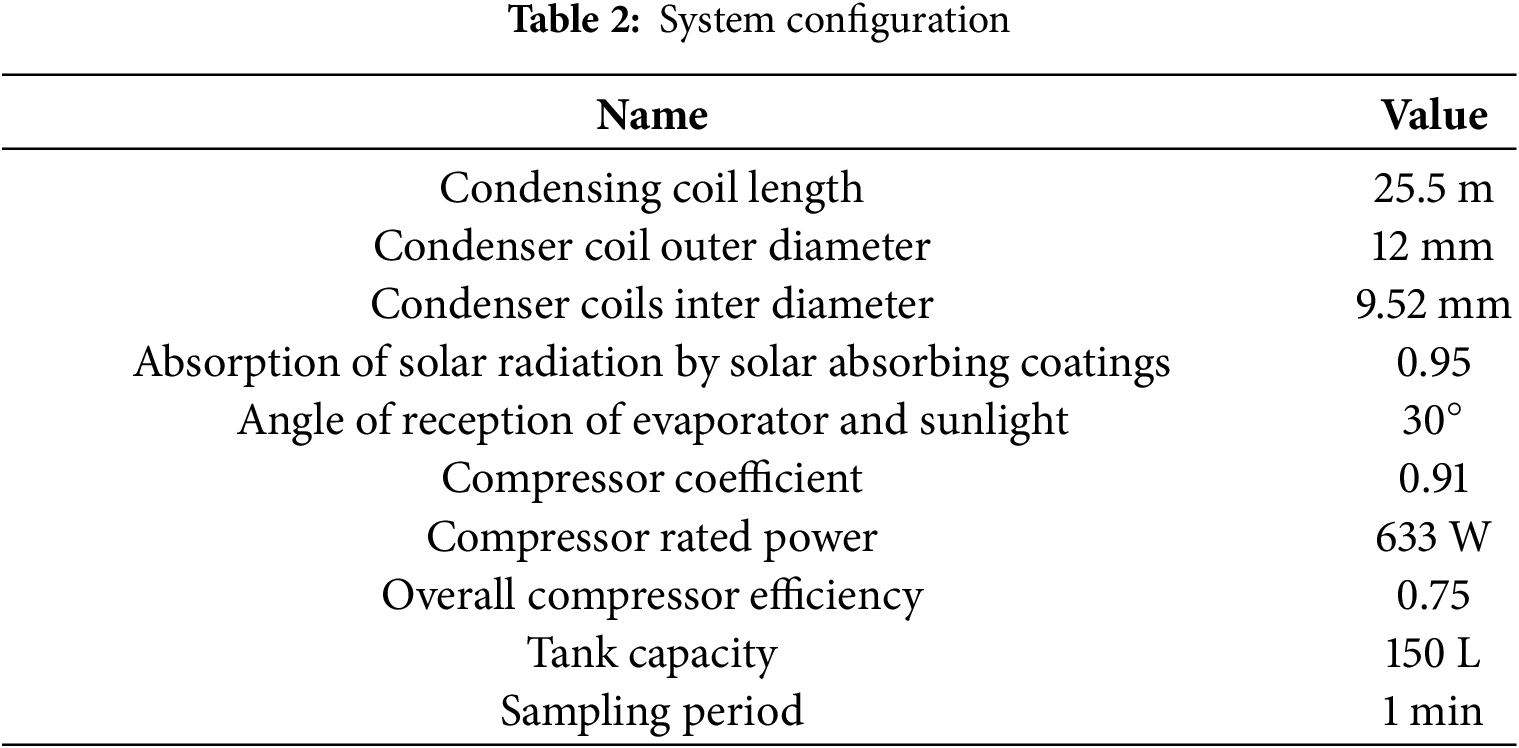
The experimental setup of a PV/T heat pump system has been built in Fuzhou, located in southeast of China, which belongs to a warm and humid subtropical climate, as shown in Fig. 1a. Refrigerant (R134a) is used as the working medium for the heat pump, consisting of a constant-frequency compressor, a rhombic channel collector-evaporator, an electronic expansion valve, a hot water storage tank with built-in condenser coil. To collect and process the experiment datas, some measuring instruments have been installed, as also shown in Fig. 1b, including temperature sensors, pressure sensors, pyranometer, anemometers, and a power meter. The detailed information of these sensors is listed in Table 1. The data acquisition instrument used adopted the Agilent-34970A system. The configuration of the system is listed in Table 2.
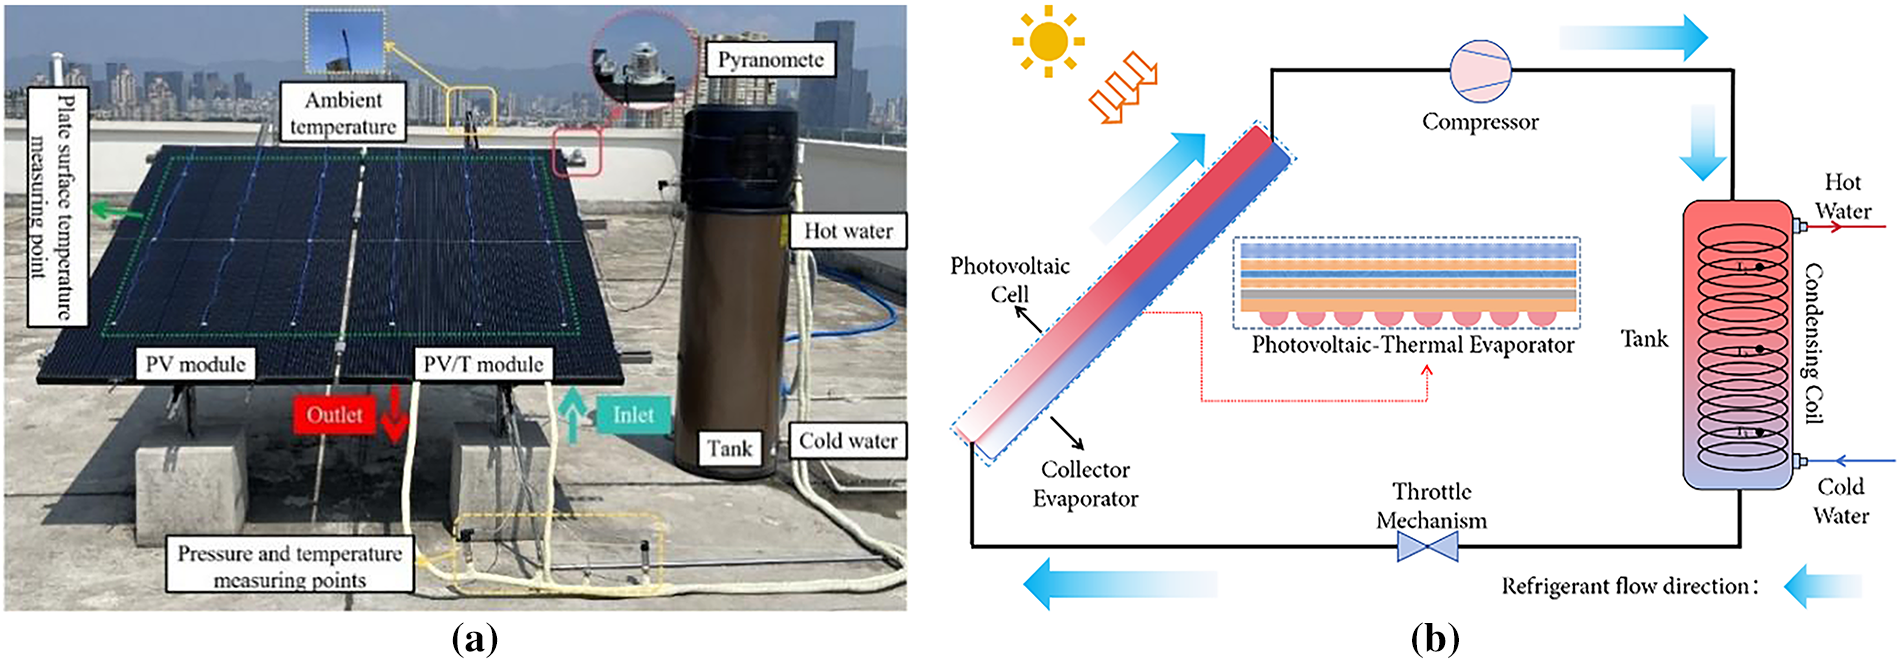
Figure 1: (a) Experimental system layout; (b) Schematic diagram
The refrigerant is heated in the collector-evaporator by solar energy and air and then compressed by the compressor. The high pressure and superheated refrigerant will heat the water in the water storage tank through the coils. After leaving the condenser, the refrigerant is throttled in the electronic expansion valve and finishes the cycle after reaching the collector-evaporator again. As opposed to the ordinary heat pump water heaters, the refrigerant in the circulation process will effectively reduce the operating temperature of the PV panels in the PV/T heat pump system, enhance their power generation efficiency, and thereby improve the overall energy utilization efficiency.
2.2 System Mathematical Model Building
To study the influence of environmental temperature, PV/T collector-evaporator area, degree of superheat and original water tank temperature on the performance of the PV/T heat pump, a dynamic simulation model has been established. The following assumptions are also proposed [30–32]:
(1) The system changes over time, but the changes in the physical properties of the refrigerant in each iteration step are considered to be quasi-steady within each component.
(2) The longitudinal heat conduction of the absorber panel is negligible. Heat loss of the PV/T solar evaporation collector frame is ignored.
(3) The flow of refrigerant inside the heat pump channels is simplified to a one-dimensional form along the flow direction. The refrigerant flows at a uniform speed in the micrometric tube section and the resistance to flow in the micrometric tube section is ignored.
(4) The physical properties, such as the dryness of the refrigerant, do not change in the same unit, and the temperature is uniform on the inner and outer surfaces of the tube section.
(5) Inside the water tank, the water temperature is uniform at all positions, without considering the phenomenon of water temperature stratification.
The establishment of the mathematical models for each component of the system is presented in Appendix A.
The lumped parameter method [33] is used in the models of the compressor and the electronic expansion valve, while the distributed parameter method [33] is used in the models of the collector-evaporator and the condenser by dividing into many calculation sections. The iterative criterions for the model convergence are the refrigerant enthalpy at the inlet heev_in and outlet heev_out of the electronic expansion valve and Mr_total. The calculation accuracies of heev_in, heev_out and Mr_total, which are set as 500 J kg−1 and 0.005 kg, respectively.
2.3 Simulation Parameter Settings and Programming
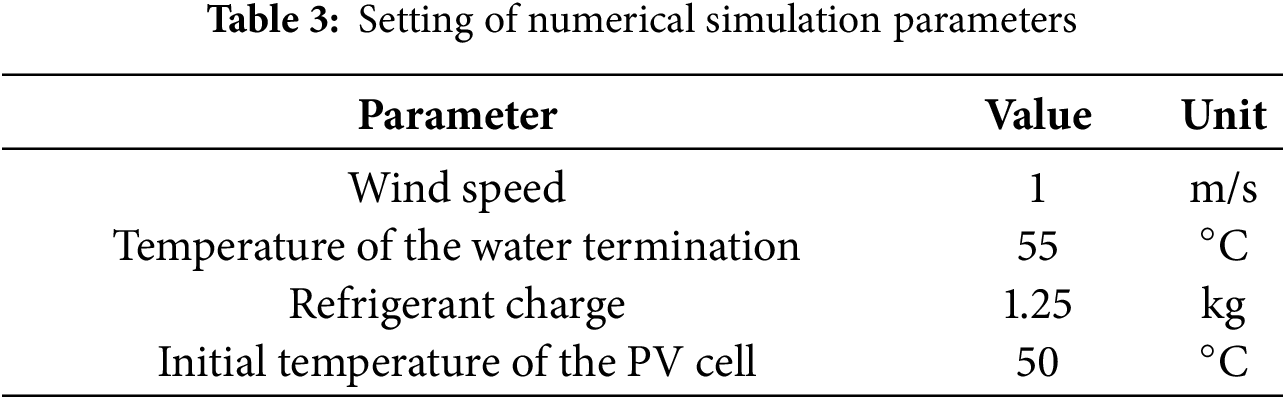
Some fundamental parameters, including solar insolation, environmental temperature, wind speed, condenser coil length Lc, degree of superheat at the outlet of the collector-evaporator Tsup, refrigerant charge of the heat pump system Mtrue, original water tank temperature in the hot water storage tank Tw, are shown in Table 3.
These coupled equations account for the major heat transfer processes in the system and are solved numerically using a MATLAB-based code to predict the electrical and thermal outputs under various operating and climatic conditions. The flowchart of the mathematical model is shown in Fig. 2.
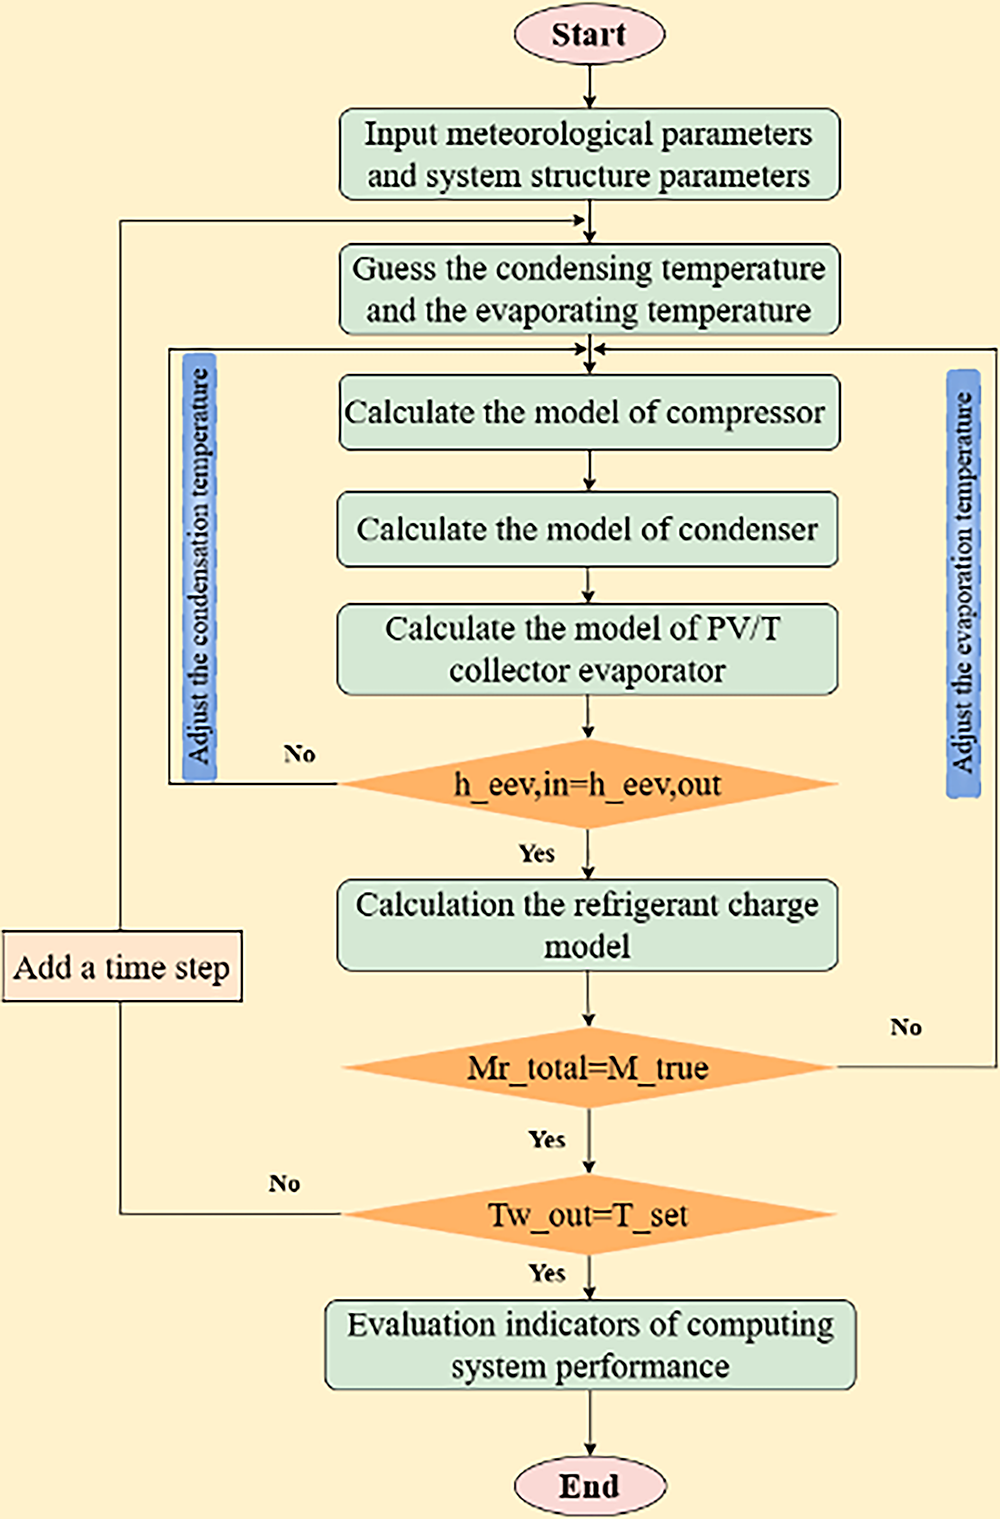
Figure 2: Flowchart of the mathematical model
The calculation process of the system simulation model is as follows:
(1) Set the structural parameters and meteorological data required for the simulation.
(2) Predict the condensation and evaporation temperatures and assign initial iteration values.
(3) Calculate the system mass flow rate, compressor power consumption, and discharge temperature using the compressor model.
(4) Call the condenser model to determine the refrigerant state at the condenser outlet and the variation in the thermal storage tank temperature.
(5) Call the PV/T collector–evaporator model to obtain the refrigerant inlet and outlet states and the variation in PV cell temperature.
(6) The enthalpy at the expansion valve inlet is equal to the refrigerant outlet enthalpy of the condenser, while the enthalpy at the expansion valve outlet is equal to the refrigerant inlet enthalpy of the PV/T collector–evaporator. Compare the inlet and outlet enthalpies of the expansion valve:
• If they are equal, proceed to the next step;
• If not, iterate the condensation temperature until convergence.
(7) Call the refrigerant charge model to compare the calculated total refrigerant charge with the actual total charge:
• If equal, proceed to the next step;
• If not, iterate the evaporation temperature until convergence.
(8) Check whether the current time step water tank temperature equals the preset target temperature:
• If equal, proceed to the next calculation stage;
• If not, increase the time step by one and start the next time step simulation loop.
The COP value of the heat pump system is calculated by using following equation:
The heat collecting efficiency [34] of PV/T collector-evaporator is calculated by:
The system’s comprehensive utilization rate of solar energy [35,36] is used:
where ηpw is the power generation efficiency of a thermal power plant, which is an average value as 38% [35].
The net energy consumption of the system is calculated by using following equation:
Experimental data error analysis encompasses direct and indirect measurement categories. Direct measurement obtains parameter values from calibrated instruments where instrument accuracy determines measurement error. Indirect measurement involves parameters lacking direct instrumental measurement capability but possessing known functional relationships with measurable variables. This process requires direct measurement of relevant variables followed by data input into functional relationships for desired parameter calculation. Measurement accuracy suffers from inaccuracies in direct variable measurements and their functional relationships [37]. Direct measurement parameters consist of data collected from temperature sensors, pressure sensors, solar radiometers, anemometers, and power meters including solar radiation intensity, environmental temperature, wind speed, PV/T heat collector-evaporator inlet and outlet temperatures, PV panel surface temperature, PV/T heat collector-evaporator outlet pressure, condenser coil inlet and outlet temperatures, water tank temperature, and compressor power consumption.
According to the error propagation principle in indirect measurement, the power generation PPV, system COP, and system heat output Qw are indirect measurement parameters, which include solar radiation intensify I, PV panel temperature TPV, water inlet temperature Tw_1, water outlet temperature Tw_2 and compress consumption Wcom. The uncertainty calculation for the indirect measurement parameters Qw, COP, and PPV is as follows [38]:
After the calculation, the uncertainty of Qw is ±2.57%, the uncertainty of COP is ±5.40%, and the uncertainty of PPV is ±3.79%.
The experiment was conducted from 07 September 2024–14 September 2027. To verify the accuracy of the system simulation model, four typical weather days existing experimental data from 11–14 September 2024, were selected for validation. Among the four days of experimental conditions, Day I represents overcast weather, Days III and IV represent sunny weather, and Day II represents cloudy weather. The system experimental parameters under the experimental conditions are listed in Table 4, and Fig. 3 presents a comparison between the experimental and simulated values of COP and compressor power consumption. As shown in Fig. 3a, the maximum relative errors of COP were 12.17%, −13.73%, −8.08%, and −11.68%, respectively, while the maximum relative errors of compressor power consumption were 11.31%, −10.74%, −10.26%, and −11.56%, respectively. The maximum relative errors of COP were lower than that of compressor power consumption, since the lumped parameter method calculated the actual internal motion of the compressor as a whole, and distributed parameter method took internal heat exchange into account and yields more accurate results. The experimental and simulated values agree well over the four days of testing, with relative error distributions generally within ±10%.
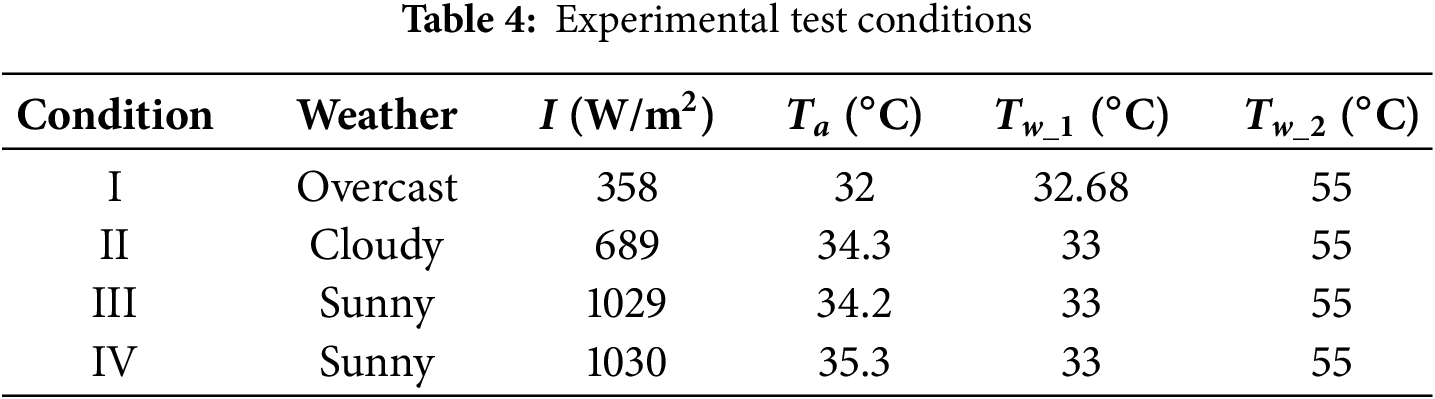
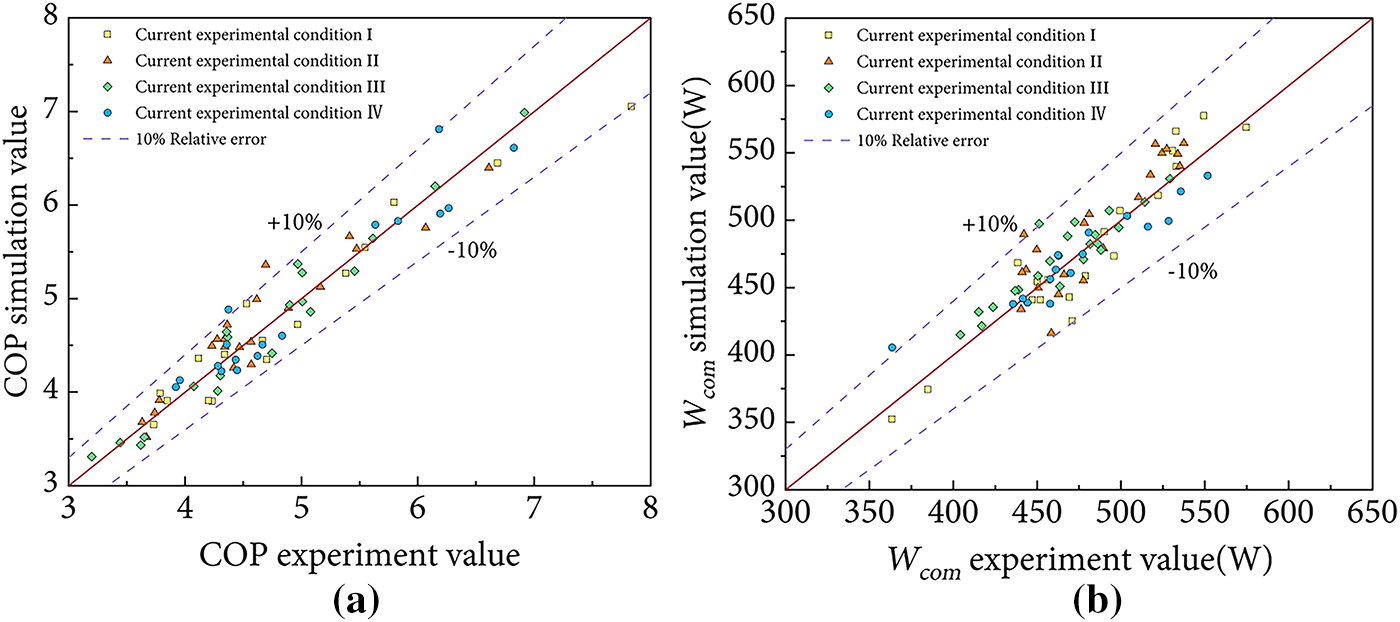
Figure 3: Relative error of the current experimental and simulation values: (a) COP experimental and simulation values; (b) Compressor power experimental and simulation values
Meanwhile, the determination coefficient R2 and the root mean square error (RMSE) can be expressed by the following equations [39]:
where Xi is the simulation value, Yi is the experimental value, N is the sample size, TSS is the total sum of squares.
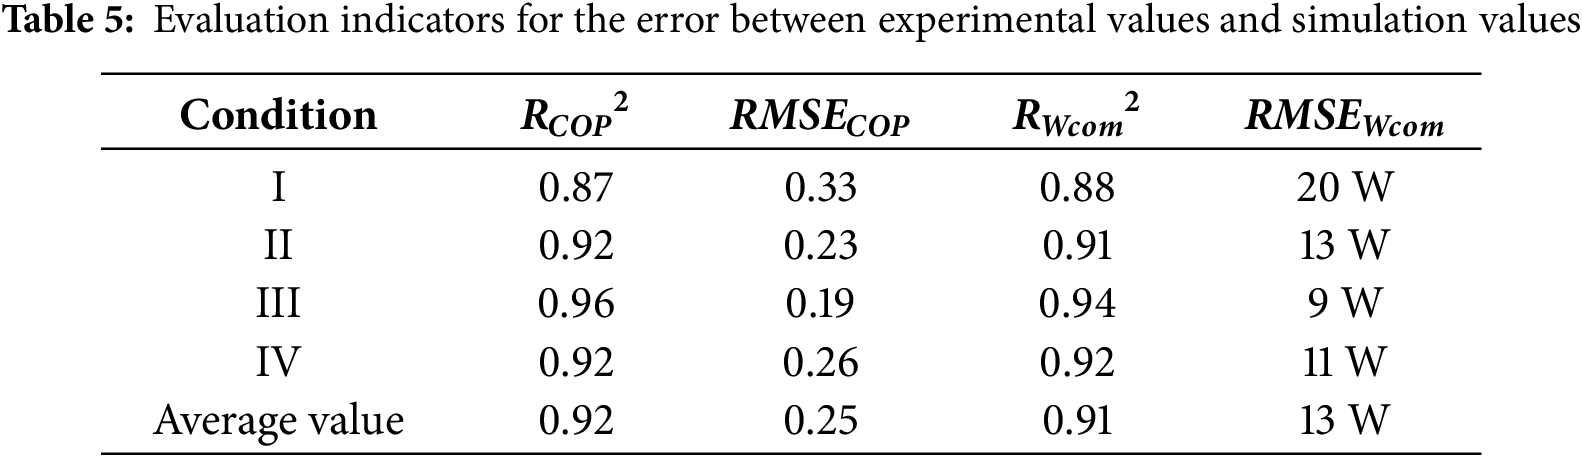
Table 5 presents the error evaluation indicators of the established system simulation model. From the perspective of COP, the determination coefficient RCOP2 of the model ranges from 0.87 to 0.96, with an average value of 0.92; the RMSECOP ranges from 0.19 to 0.33, with an average value of 0.25. When R2 is greater than 0.9 and the RMSE is low, it can be considered that the model has good fitting performance [39,40]. The results indicate that the model can well reflect the changing pattern of COP, and the relative deviation is generally controlled within 10%. In the simulation of compressor power, RWcom2 ranges from 0.88 to 0.94, with an average value of 0.91; the RMSEWcom ranges from 9 to 20 W, with an average value of 13 W. Considering that the rated power of the compressor is 633 W, this prediction error accounts for less than 10%, and thus also has high simulation accuracy.
Under cloudy conditions, cloud cover caused sharp fluctuations in solar radiation intensity, leading to relatively larger errors in Days II compared with Days I, III and IV. Overall the errors remained within an acceptable range, confirming that the system simulation model exhibits good reliability. Therefore, the established model has good simulation accuracy and reliability, and can provide strong theoretical support for the performance simulation and optimization of the subsequent system.
3.1 Environmental Temperature and Radiation Intensity
The PV/T heat pump system is obviously affected by environmental parameters (environmental temperature Ta and radiation intensity I) on system characteristics. A detailed analysis of the variation process of the evaporator and water tank of the heat pump system over time should be conducted to provide a theoretical basis for subsequent performance analysis. Fig. 4a presents the variation trends of PV cell temperature and power generation efficiency with operating time under working conditions I, II, and III. In the start stage, high PV cell temperature causes the low PV output and PV efficiency in three conditions. In the middle, lower PV cell temperature leads to high PV efficiency. The collection evaporation can remove the panel temperature in time to improve efficiency as time goes by. Therefore, there is a negative correlation between PV cell temperature and power generation efficiency—when the cell temperature decreases, the power generation efficiency increases. Fig. 4b shows the variation trend of system COP with operating time. It can be observed that as the operating time increases, the system COP exhibits a decreasing trend, since the compressor power consumes more as time increases.
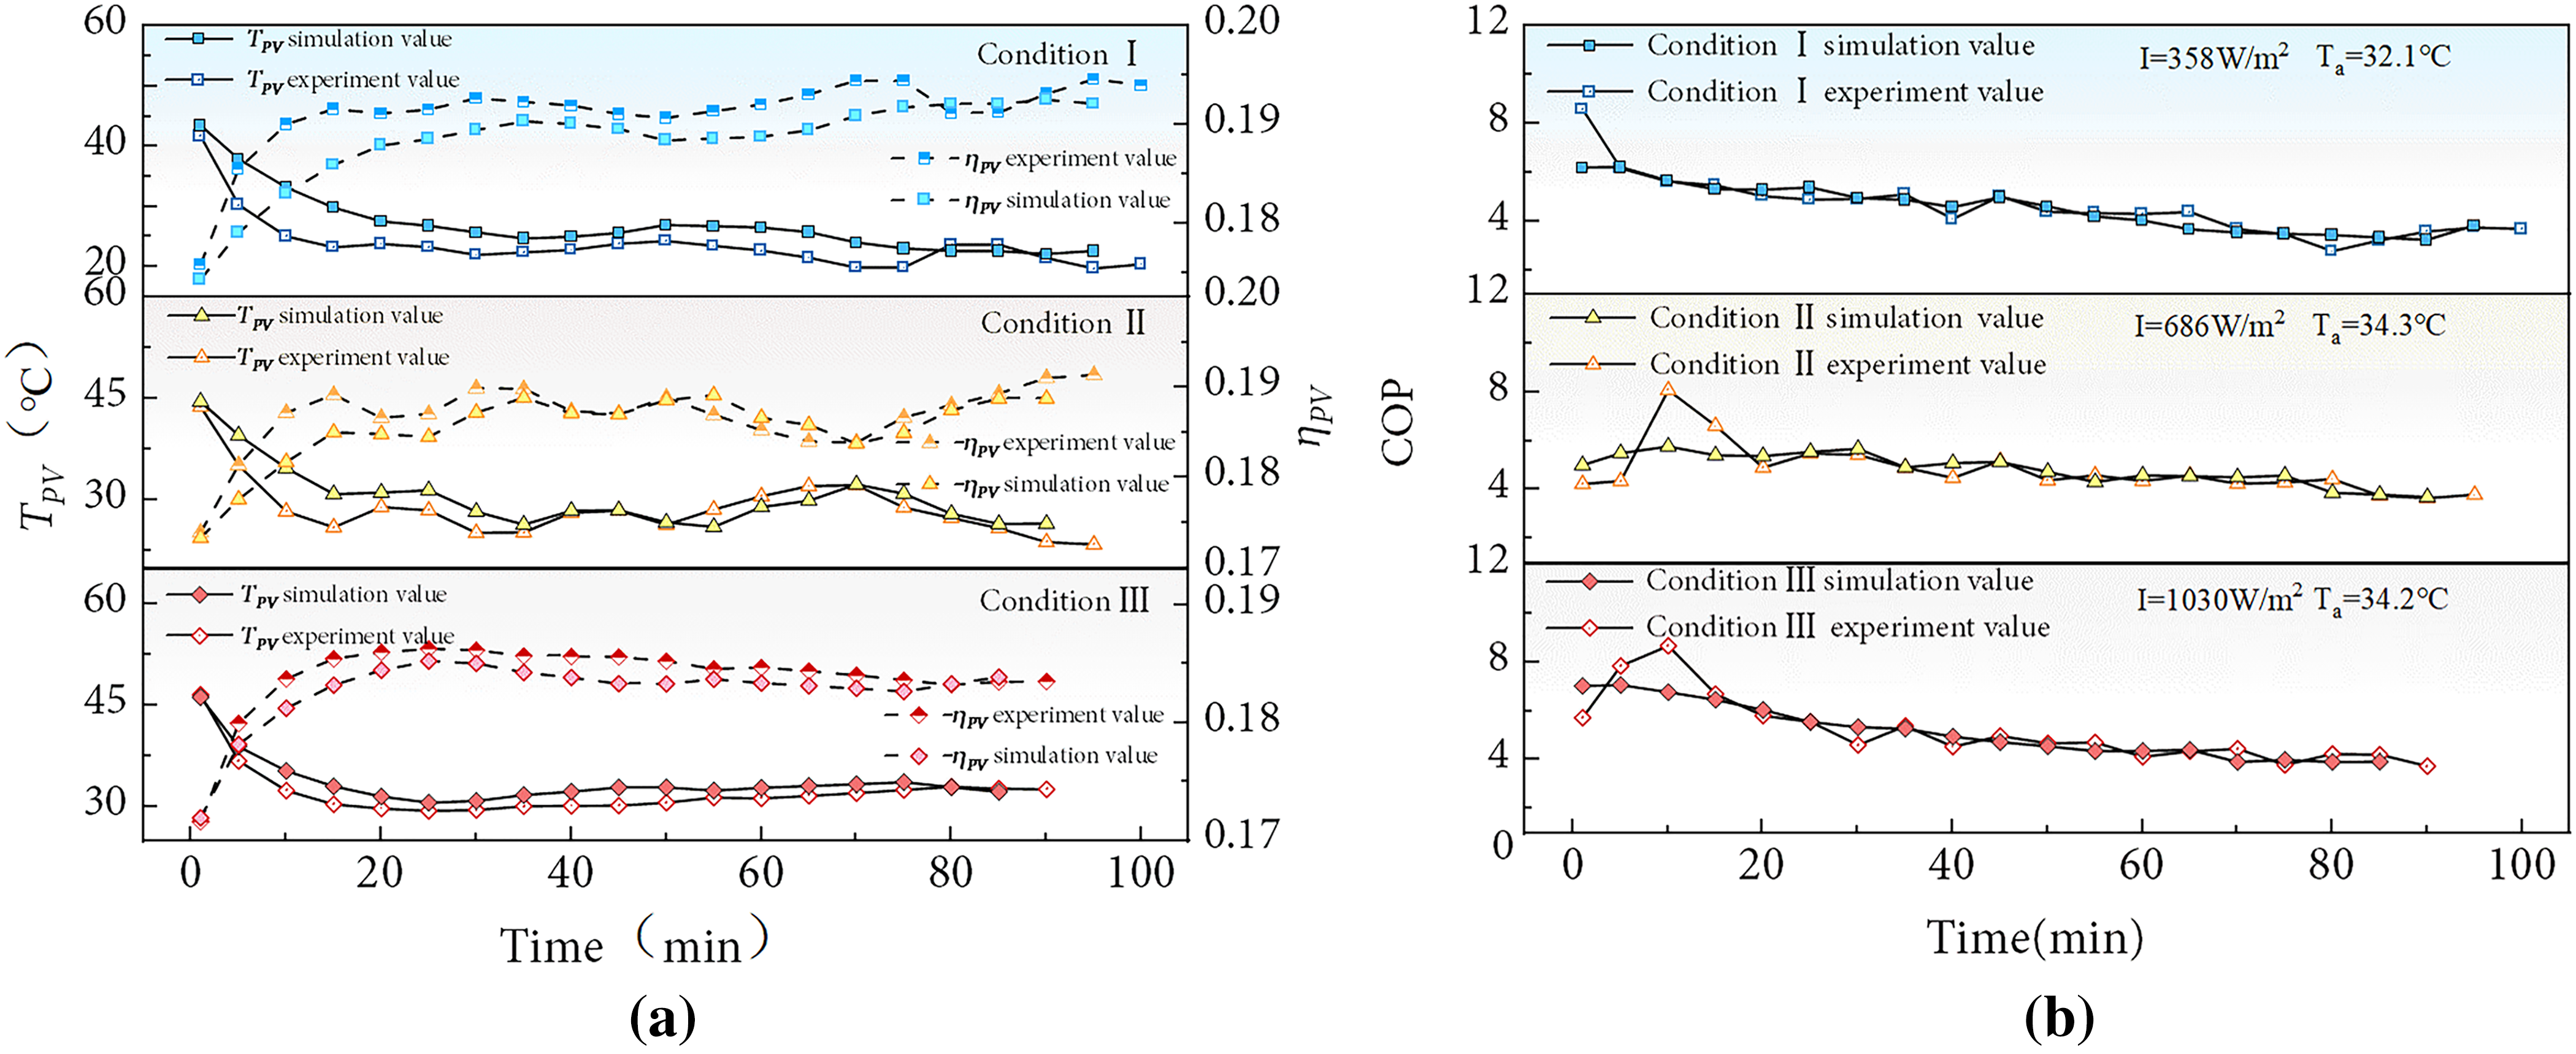
Figure 4: System performance varies with time: (a) PV cell temperature and PV efficiency changed with different ambient temperatures and irradiation; (b) COP changed with different ambient temperatures and irradiation
Fig. 5a shows the water tank temperature in hot-water heating time under three conditions. In this study, the original water tank temperature is set at 33°C, and the target temperature is 55°C. As expected, water temperature increases with the growth of time. In Fig. 5b, heating time exhibits a clear negative correlation with water temperature. At an environmental temperature of 20°C, when the original water tank temperature increased from 10°C to 35°C, the time required to reach the target temperature of 55°C is reduced by 51%, owing to the smaller temperature difference between the original and final water tank temperatures. In addition, when the original water tank temperature is 20°C, increasing environmental temperature from 10°C to 40°C shortened the heating time from 186 min to 126 min, a reduction of 32.3%. Therefore, environmental temperature has an inverse relationship with heating time.
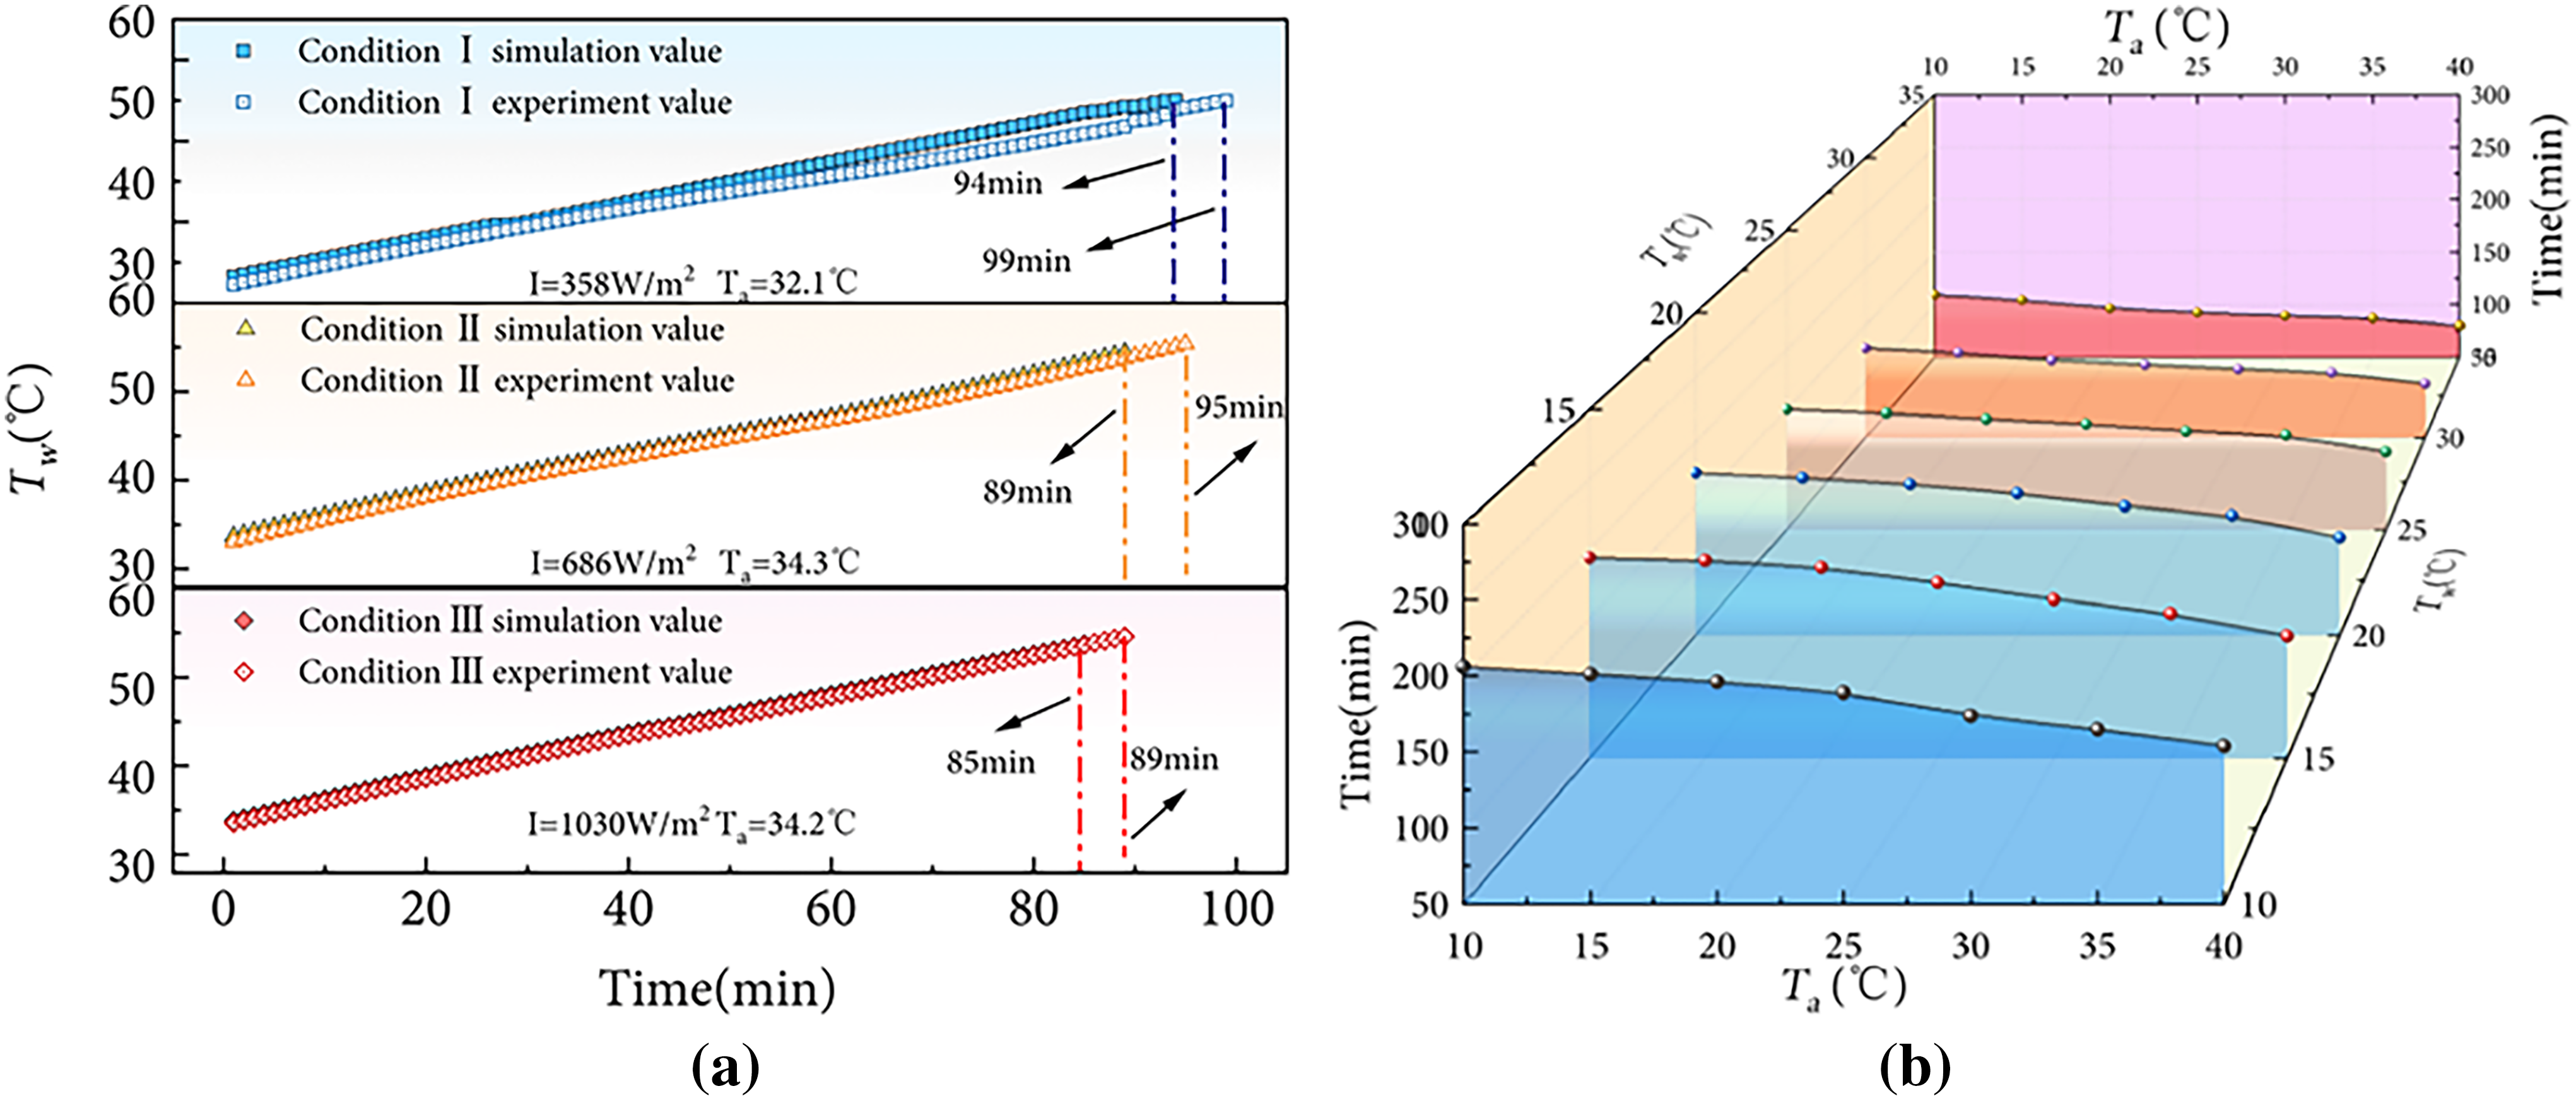
Figure 5: Influence of environmental parameter on condensation temperature: (a) Water tank temperature vs. heating time; (b) Environmental temperature and water tank temperature vs. heating time
From the above analysis, it can be found that ambient temperature strongly affects heat pump system features, Fig. 6 presents PV power generation PPV, compressor power consumption Wcom, working fluid evaporation temperature Te, compressor discharge temperature Tdis, COP, PV power generation efficiency ηPV, heat collection efficiency ηPV/T, and comprehensive solar energy utilization efficiency ηI varying with environmental temperature. PV power output in Fig. 6a and PV efficiency in Fig. 6b decrease linearly with increasing environmental temperature, indicating that higher temperatures suppress PV performance. However, compressor power consumption also decreases as environmental temperature rises: the reduction is 2.34% when environmental temperature increases from 10°C to 25°C, and 6.83% when it increases from 25°C to 40°C. As environmental temperature rises, the refrigerant absorbs more heat from the environment, causing the evaporation temperature to increase from 7.94°C to 26.3°C, an increase of 231.61%. During this process, the compress discharge temperature remains essentially unchanged. Consequently, the system pressure ratio decreases, leading to reductions in compressor power consumption and compressor discharge temperature.
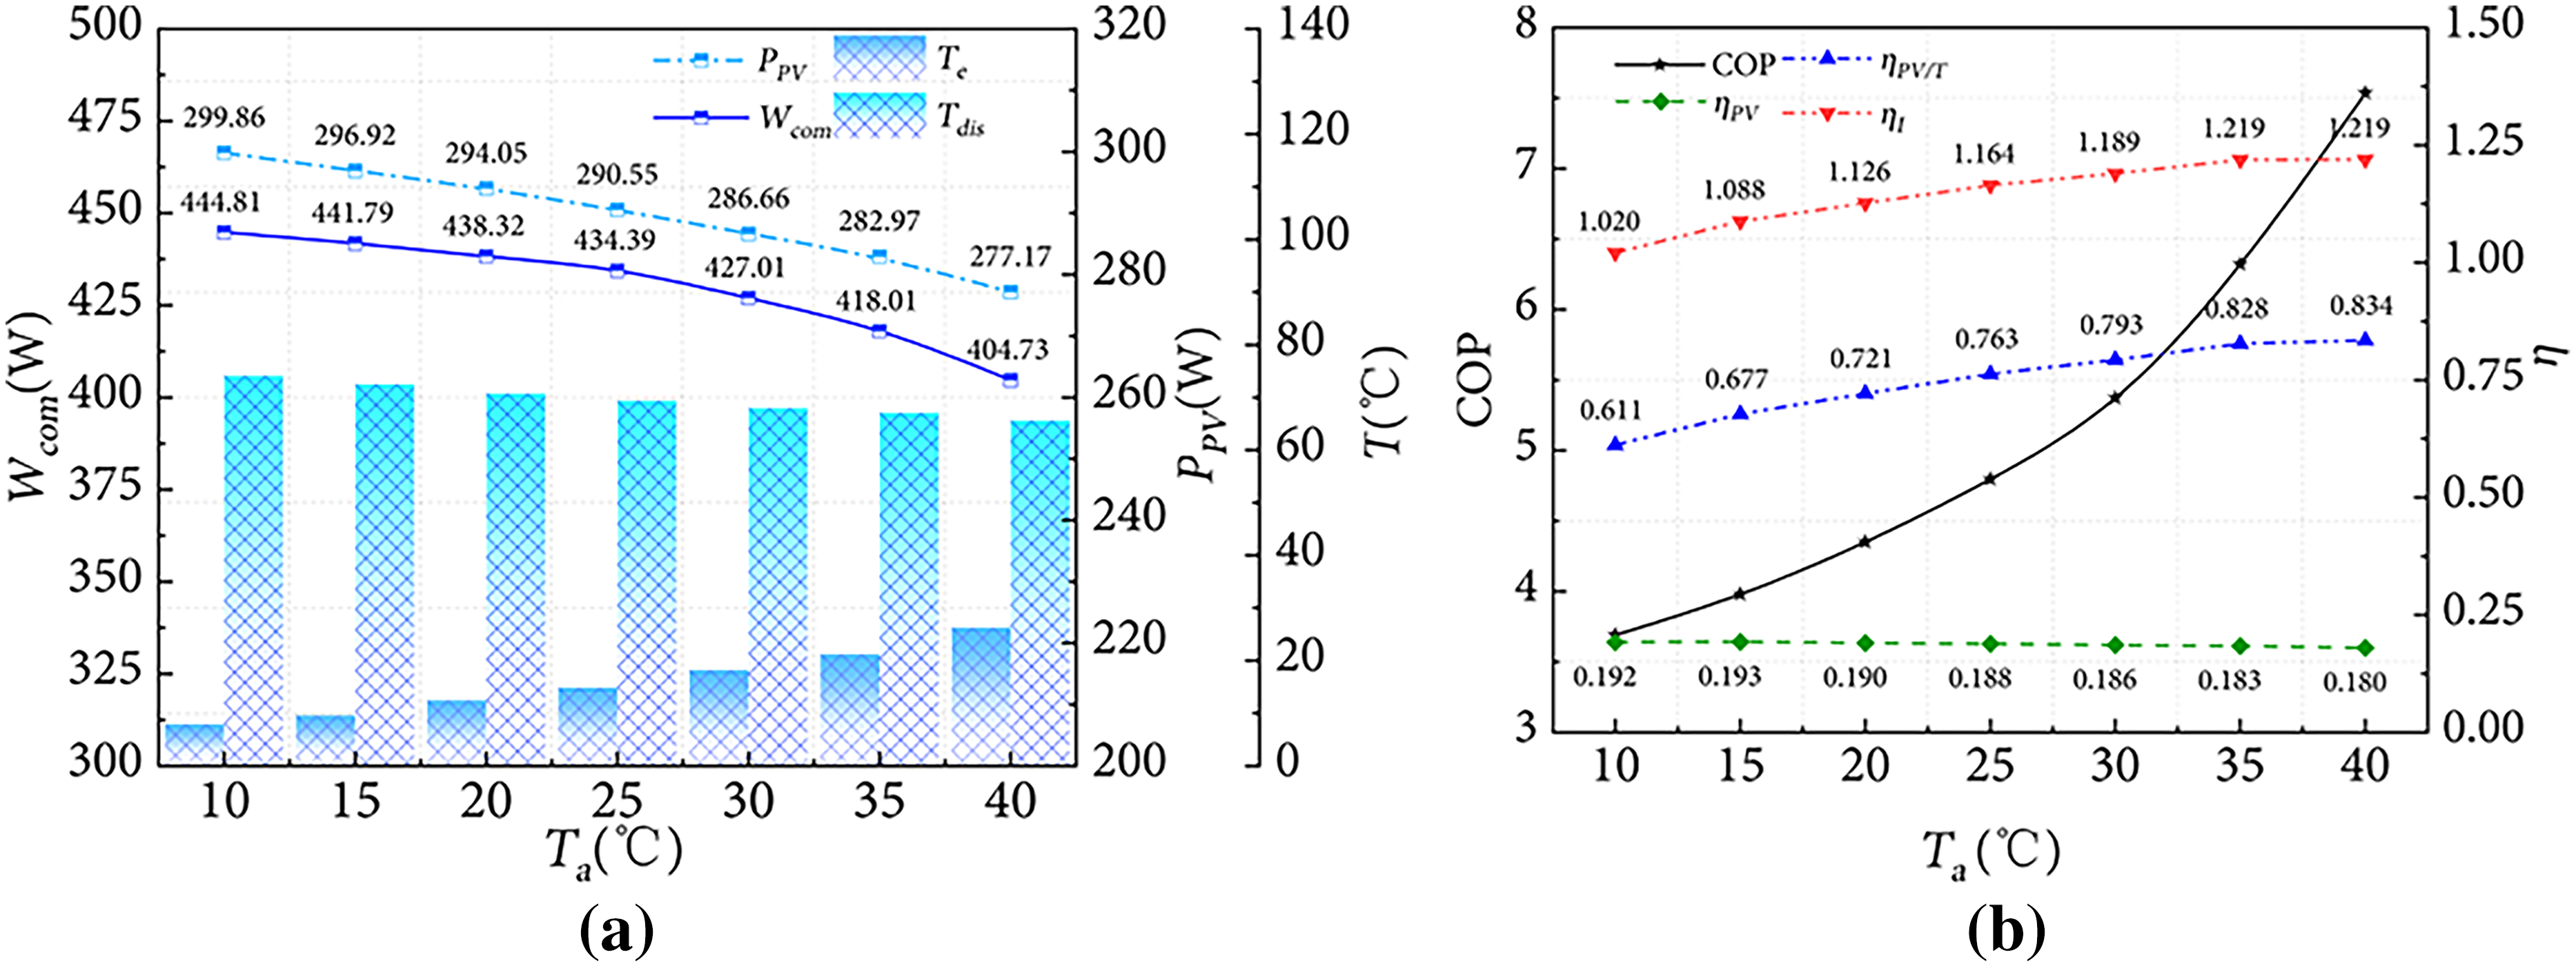
Figure 6: Influence of environmental temperature on heat pump performance: (a) Compressor and power generation performance; (b) System efficiency
COP and heat collection efficiency ηPV/T gradually improve, shown in Fig. 6b. When environmental temperature rises from 10°C to 40°C, COP increases from 3.69 to 7.53 (an increase of 50.9%); and heat collection efficiency increases from 0.611 to 0.834 (an increase of 36.5%). When the environmental temperature rises but does not exceed the PV cell’s heat-generation threshold, the temperature difference between the cell and its surroundings decreases, thereby reducing heat loss from the PV/T module to the environment. Since the increase in thermal efficiency with rising environmental temperature is greater than the decrease in electrical efficiency, the comprehensive utilization efficiency ηl of solar energy improves overall. This suggests that higher environmental temperatures are favorable for system heat performance. One of the primary functions of the PV/T heat pump system is hot-water production, making the heating time an important performance indicator.
Meanwhile, Figs. 4 and 5 also show that intensifying solar radiation strengthens the PV efficiency, COP and decreases the hot water heating time. As the radiation intensity increases, the average temperature of PV cells decreases and the average power generation efficiency increases. Irradiation changing from 358, 686 to 1030 W/m2, strengthens the average PV temperature from 23.88°C, 32.22°C, and 28.83°C, and weakens PV efficiency ranging from 0.1911, 0.1838, 0.1853, shown in Fig. 4a. In Fig. 4b, the system COP increases with the rise of radiation intensity. The average COP of the system is rising from 4.57, 4.77 to 5.15 with the growth of irradiation. As the radiation intensity increases, when producing hot water of the same volume, the compressor power consumption decreases, the heating time becomes shorter, thus the system COP increases and the heat pump performance improves. Condition II is cloudy day and make the PV panel temperature and efficiency more complicated. Fig. 5a shows that the higher the radiation intensity, the greater the heat supplied by the system and the faster the rate of temperature rise, with heating rates of 0.18°C/min, 0.23°C/min, and 0.25°C/min, respectively. When the radiation intensity increases, the heating time significantly reduces, indicating that reduced heating time under higher radiation intensity is beneficial for energy conservation.
Besides, Figs. 4a,b and 5a also show the error variation between the experimental values and simulated values of the system. Experimental values and simulated values of COP, PV cell temperature, and power generation efficiency show a consistent variation trend. However, the errors of PV cell temperature and power generation efficiency are higher than that of COP. This is mainly caused by the assumptions and simplification conditions made for the PV/T module, but the results are within an acceptable range. This further indicates the reliability of the established system simulation model.
3.2 Original Water Tank Temperature and Collector Area
From the above analysis in Fig. 5b, water temperature has a significant impact on system performance. Fig. 7 illustrates heat pump system performance varies with different original water tank temperatures. In Fig. 7a, as the original tank temperature increases, compressor power consumption rises, while PV power generation exhibits a slight downward trend. This is attributed to the fact that an increase in the initial water temperature of the tank causes a rise in condensation temperature, which leads to an elevated system pressure ratio and compressor consumption. Simultaneously, an increase in condensation temperature shortens the system’s operating duration under heating the same volume hot water, where the PV panels cannot be cooled in time and remains high temperature, thereby reducing power generation efficiency and further resulting in a decrease in PV power output.
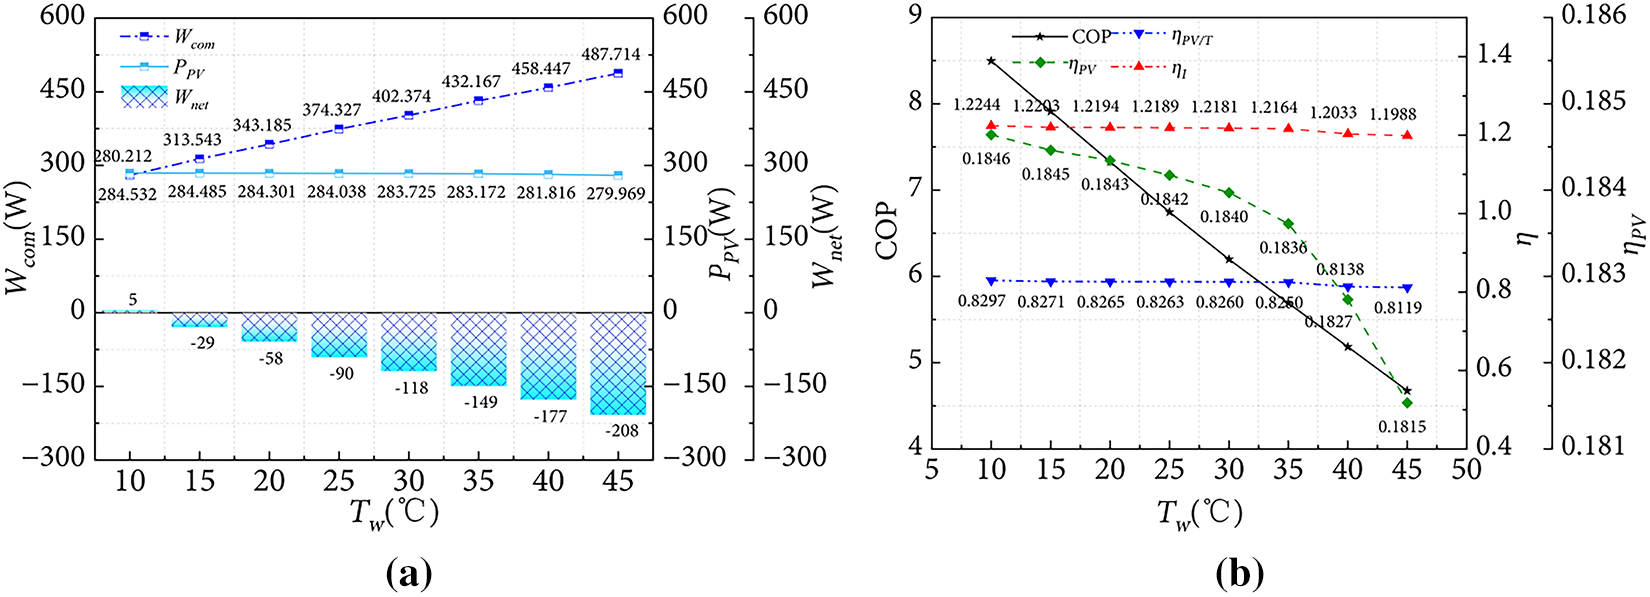
Figure 7: Influence of original water temperature on system performance: (a) Compressor power and generation capacity; (b) System efficiency
Besides, the difference between compressor energy consumption and PV power generation, named Wnet in Fig. 7a, also changes with the original water temperature. When this difference is greater than zero, the power generated by the system can support compressor demand, and there is even a surplus. Conversely, when the difference is less than zero, system power generation is lower than compressor demand, requiring additional external energy to maintain operation. Specifically, at an original water tank temperature of 10°C, the electricity generated by the PV cells is sufficient for compressor operation; however, the hot-water heating time is excessively long, reaching 169 min. When the original water tank temperature increases from 10°C to 45°C, compressor power consumption rises from 280.2 to 487.7 W, an increase of 74.1%. Fig. 7b summarizes the heat pump system performance varies with growth of initial water, where COP decreases, power generation efficiency decline, and heat collection efficiency and thermal efficiency show gradual reductions. The simultaneous declines in heat collection efficiency and power generation efficiency ultimately result in lower comprehensive solar energy utilization efficiency.
Furthermore, the geometric structure of the collector-evaporator has a direct impact on system performance, which can be reflected in terms of the heat collection area. In Fig. 8a, PV power generation increase with increasing collector area. As the collector area increases from 1 to 4.5 m2, PV power generation increases from 117.7 to 529.5 W, an increase of 349.9%. The solar radiation energy absorbed by the refrigerant increases with larger collector area, leading to a rise in evaporation temperature, which enhances the heat gain of the collector-evaporator and the PV cell temperature, and a decline power generation efficiency in Fig. 8b. Specifically, collector efficiency decreases from 0.85 to 0.73, a reduction of 14.1%, while power generation efficiency decreases from 0.185 to 0.1806, a reduction of 2.16%. The comprehensive utilization efficiency of solar energy and the rate of water temperature rise follow the same trend. Meantime, as the evaporation temperature continues to rise, the temperature difference between the PV/T panel and the environmental environment gradually decreases, thereby declining collection efficiency.
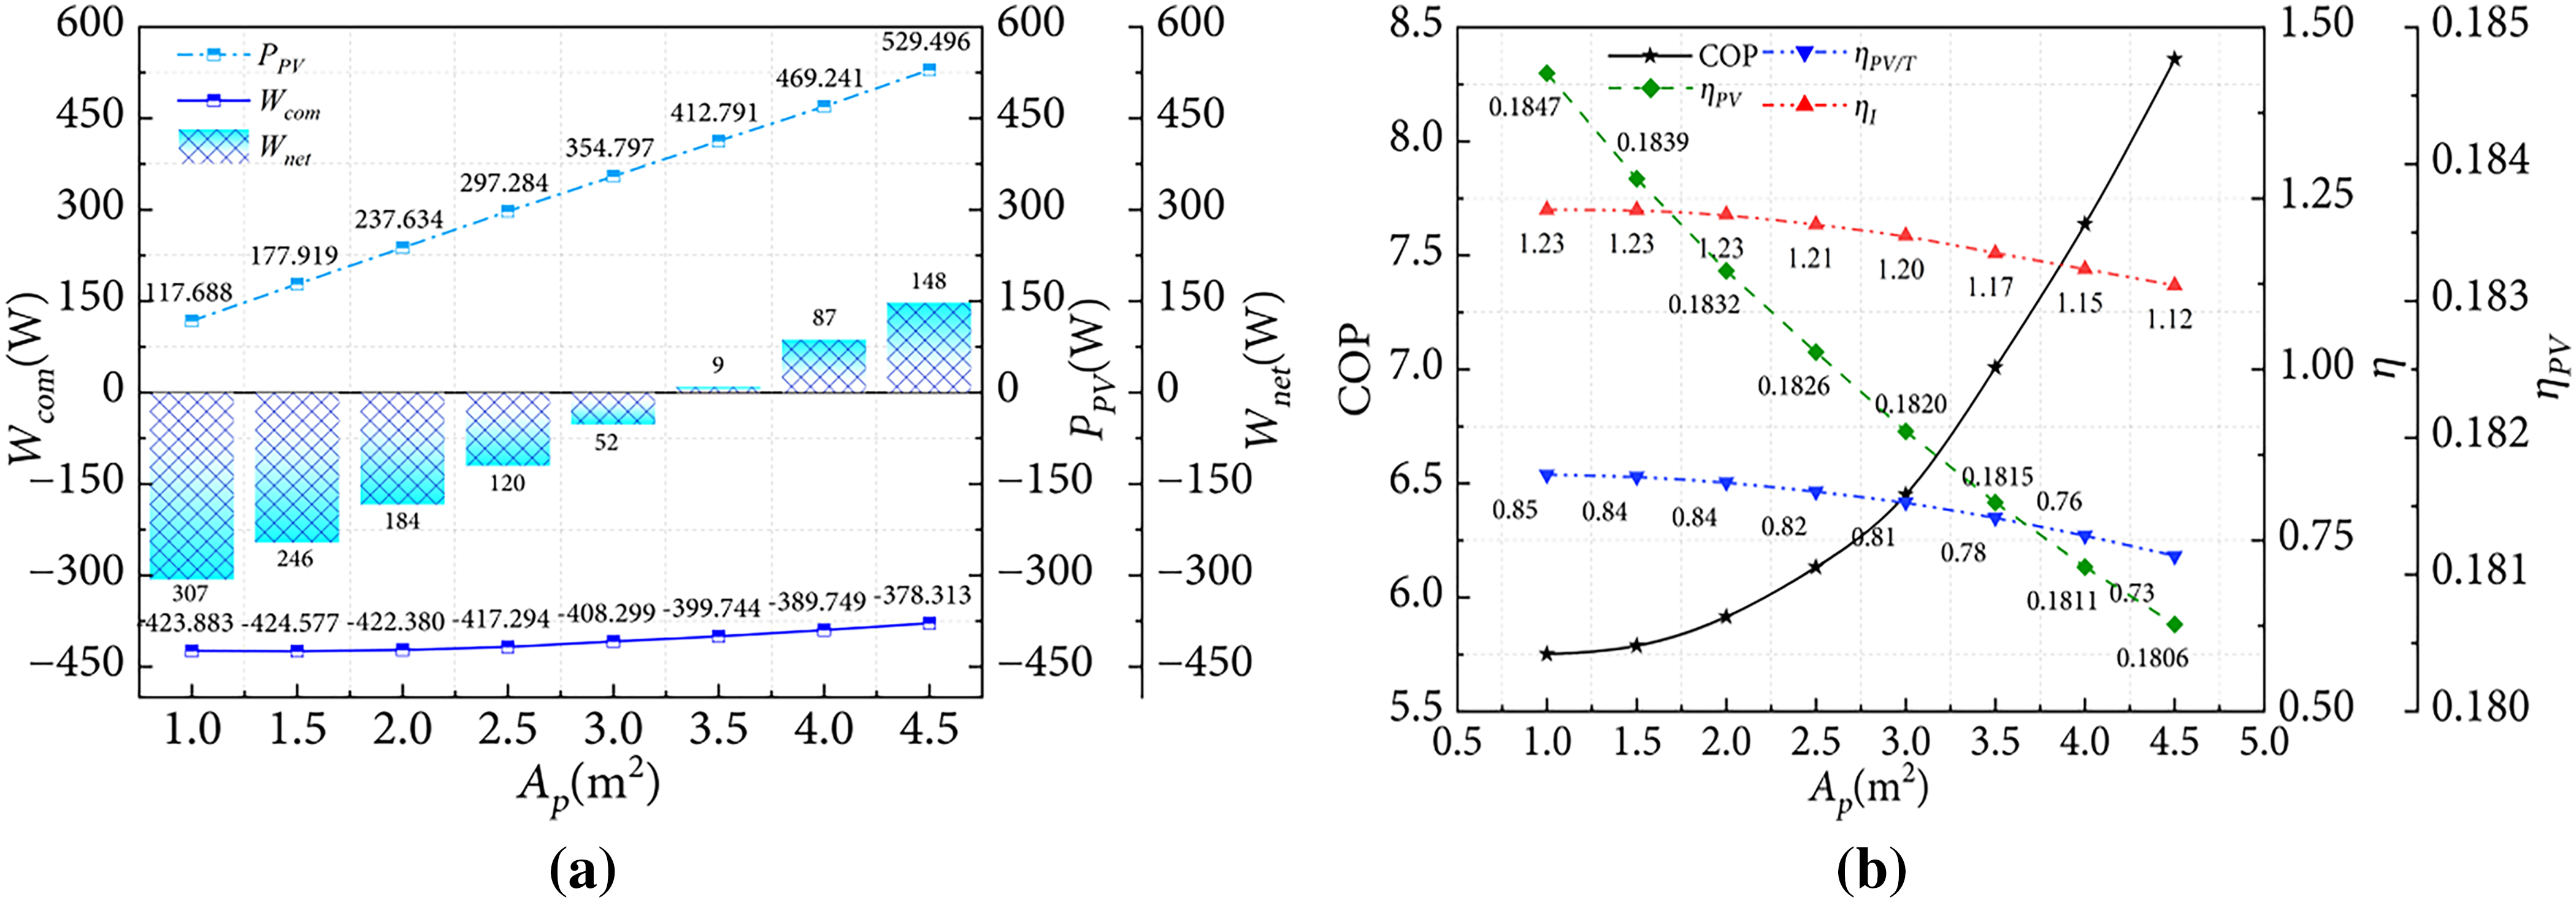
Figure 8: Influence of collector area on system performance: (a) Compressor power and generation capacity; (b) System efficiency
In Fig. 8a, compressor power consumption increases with increasing collector area. As the collector area increases from 1 to 4.5 m2, compressor power consumption decreases from 423.8 to 378.3 W, a reduction of 10.7%. The increase in evaporation temperature with the growth of areas leads to a decrease in the system pressure ratio and a reduction in compressor power consumption. Additionally, since the initial water temperature and the set water temperature of the heat storage tank remain constant, the total heat production of the system stays unchanged, resulting in an increase in the heat pump COP of the system.
When the area of the PV/T collector-evaporator is 3.5 m2, the electricity generated by the PV cells starts to meet the compressor demand in Fig. 8a. When the area exceeds 3.5 m2, the electricity generated not only meets compressor demand but also provides surplus power to the grid. It is also observed that the amplitude of performance change varies around a collector area of 3 m2: when the area increases from 1 to 3 m2, COP rises by 12.1%, whereas from 3 to 4.5 m2, COP increases by 29.6%.
Based on the above analysis, an appropriate original water tank temperature and an increased collector area are beneficial for improving system performance. However, it should be noted that in theoretical calculations, default numerical simulation conditions are set within the operating range of the compressor. In practical applications, continuous increases in collector area can result in relatively high suction pressure, causing the theoretical output power to exceed the actual upper limit of compressor capacity, potentially leading to compressor damage. Therefore, system performance is simultaneously constrained by collector area and compressor capacity. Under the premise of meeting operational requirements, system efficiency can be further improved through reasonable parameter selection.
3.3 Influence of Suction Superheat on the Performance of PV/T Heat Pump
Suction superheat of the compressor is a critical parameter to prevent liquid strike damage and ensure long-term reliable operation, as well as to maximize the heat exchange efficiency of the evaporator and optimize overall system energy efficiency. Fig. 9a shows that the pressure ratio increases with rising superheat, the PV cell temperature decreases with rising superheat, but the change is relatively small. Fig. 9b shows that compressor power consumption and PV power generation increase with rising superheat. However, the overall increase in power generation is smaller than that of compressor power consumption. For the heat collection evaporator, under unchanged external conditions, maintaining a constant heat absorption and optimal plate temperature requires that increasing superheat leads to a decrease in evaporation temperature. This, in turn, raises the system pressure ratio and ultimately results in a decrease in COP. The increase in compressor power consumption is more pronounced when superheat rises from 3°C to 6°C than from 6°C to 10°C. At a superheat of 10°C, compressor power consumption reaches 442.13 W, which is 1.33% higher than 436.33 W at 3°C. In summary, although reducing suction superheat leads to slight decreases in thermal efficiency, electrical efficiency and the comprehensive utilization efficiency of solar energy, the overall reductions are minor. Therefore, decreasing suction superheat is beneficial for improving overall system performance.
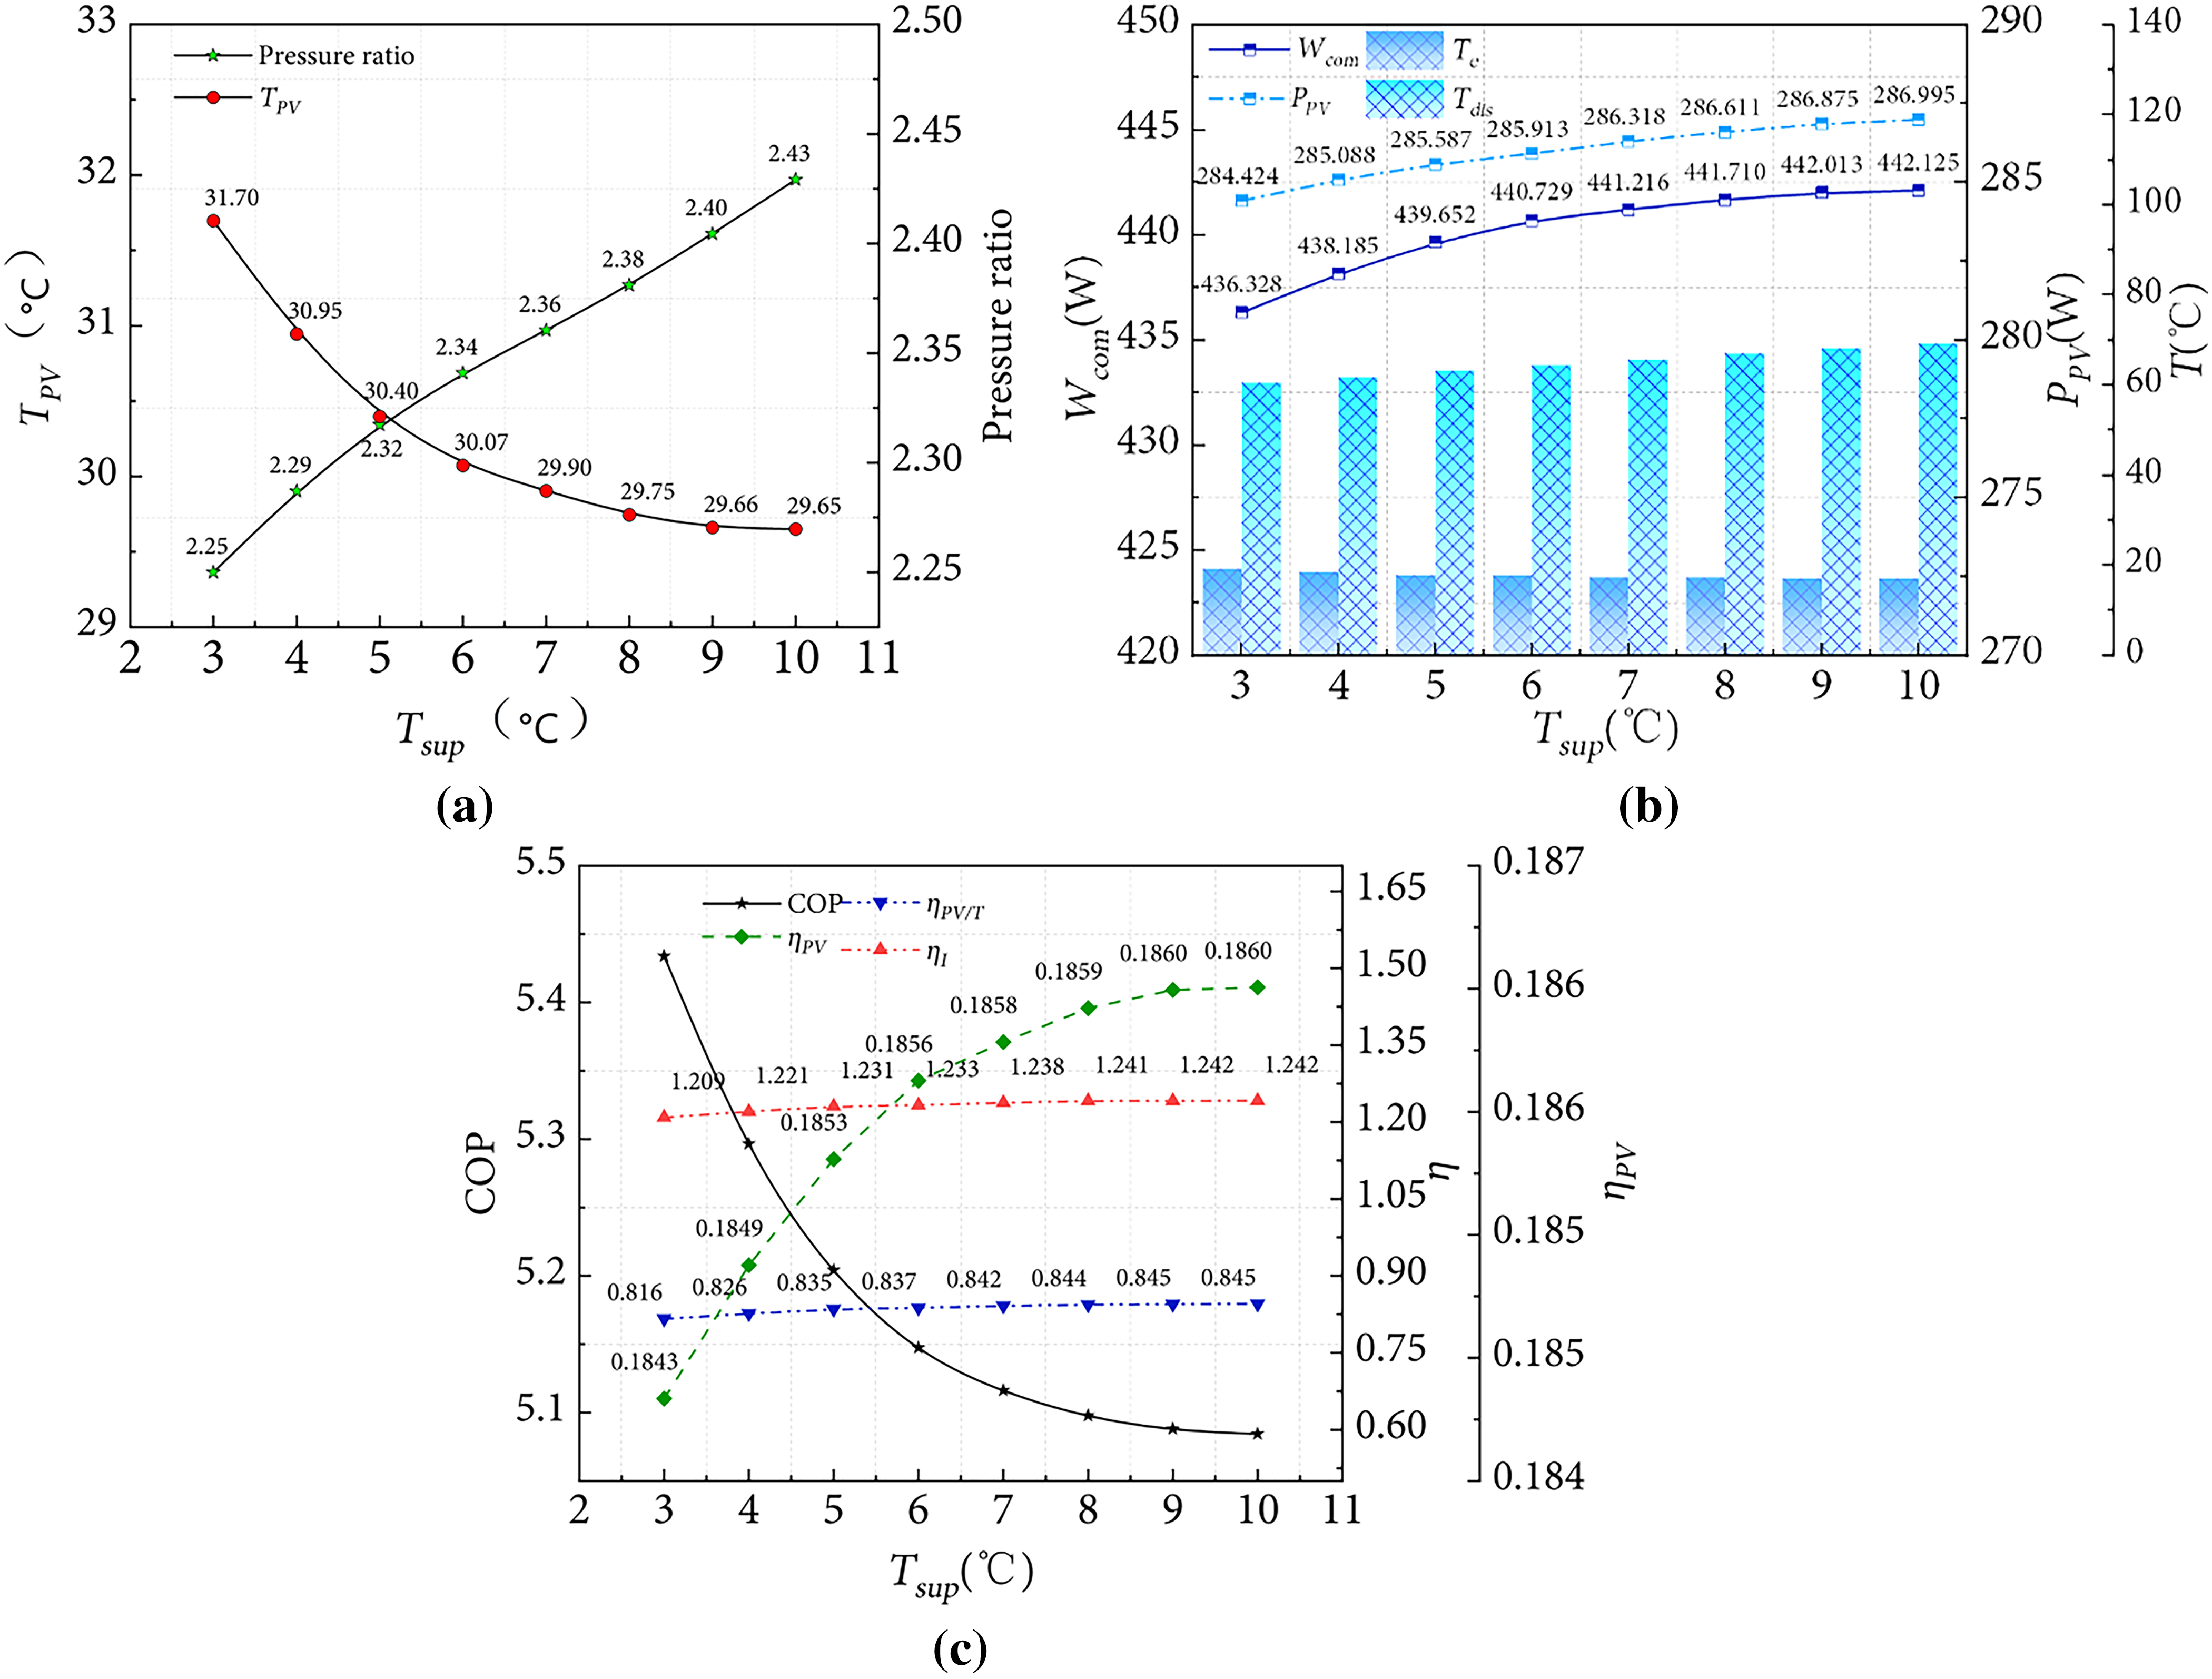
Figure 9: Influence of degree of superheat on system performance: (a) Pressure ratio and cell temperature; (b) Compressor power and generation capacity; (c) System efficiency
Fig. 9c illustrates the effect of superheat variation on system power generation efficiency, heat collection efficiency, and comprehensive utilization efficiency of solar energy. As suction superheat increases from 3°C to 10°C, system COP decreases from 5.44 to 5.08, a reduction of 6.61%. Since the initial water temperature and the set water temperature of the heat storage tank remain constant, the total heat production of the system stays unchanged. Meanwhile, the compressor power consumption increases, leading to a decrease in the heat pump COP of the system. The associated reduction in evaporation temperature enhances the cooling effect on PV cells, increasing the temperature difference between the heat collection evaporator and the environment, thereby allowing greater heat absorption from the surroundings. Consequently, heat collection efficiency and power generation efficiency increase with rising superheat.
3.4 Annual Simulation Analysis of the System
As the experimental tests were primarily conducted in September, it was not feasible to carry out experiments throughout the entire year due to time and experimental constraints. Therefore, to investigate the annual operational performance of the PV/T heat pump system, a numerical simulation is performed under the working conditions corresponding to each month of the typical meteorological year for Fuzhou City. The annual meteorological data for Fuzhou City are obtained using Meteonorm software. Owing to limited sunshine duration, the meteorological parameters used represent average values recorded between 8:00 a.m. and 4:00 p.m. Fig. 10 illustrates the monthly distribution of the average meteorological parameters for the typical meteorological year in Fuzhou City.
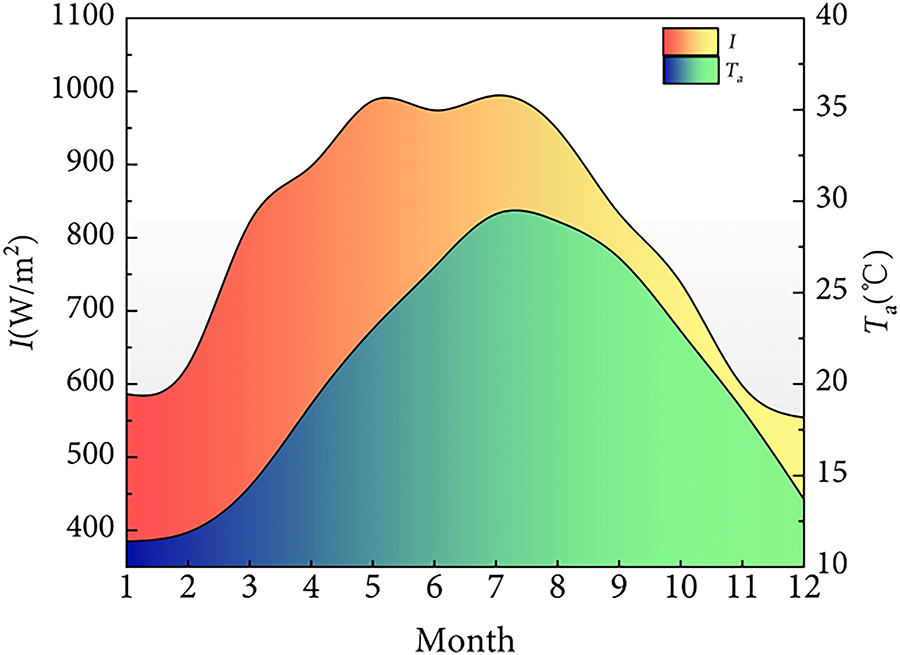
Figure 10: Typical meteorological year meteorological parameters of Fuzhou
The monthly average COP, heat collection efficiency, power generation efficiency, comprehensive solar energy utilization rate, compressor power, and PV cell power output of the system are obtained through numerical simulation in Fig. 11. An increase in environmental temperature leads to a reduction in power generation efficiency. As the environmental temperature rises, the compressor power consumption and PV cell power output exhibit a downward trend. From April to October, the electricity generated by the PV cells is sufficient to meet the compressor demand. Higher environmental temperatures further enhance overall system efficiency. As shown in Fig. 11b, the minimum monthly average COP is 3.75, occurring in January, while the maximum COP is 6.5, occurring in July. The lower COP in colder months is attributable to the reduced environmental temperature. The minimum power generation efficiency of 0.1861 occurs in July, when environmental temperatures are highest, whereas the maximum of 0.2136 occurs in January, when temperatures are lowest. These results demonstrate that the numerical simulation model accurately captures the system’s performance variations under different operating conditions.
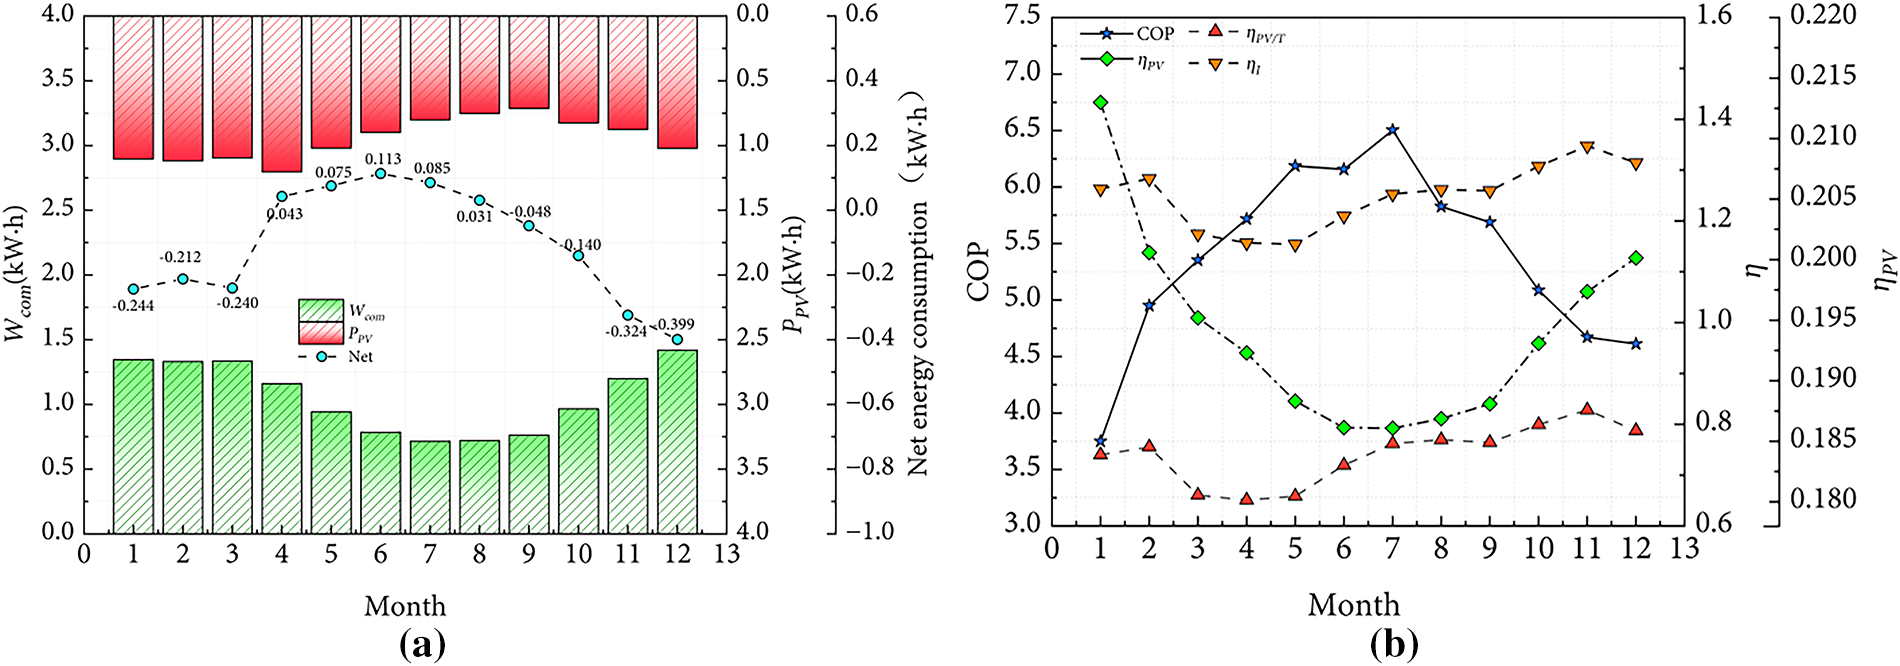
Figure 11: Year system performance: (a) Compressor power and generation capacity; (b) System efficiency
Sensitivity analysis is a method used to investigate the influence of various factors on an objective function, with the sensitivity coefficient serving as a quantitative indicator of the degree of influence [41]. The dependent variable should be chosen as a parameter that effectively reflects system performance. Therefore, in this study, the system COP and power generation efficiency are selected as the dependent variables. A local sensitivity analysis approach is employed to examine the effect of variations in a single parameter on the COP and power generation efficiency. A larger sensitivity coefficient indicates a greater influence of the factor on the evaluation index, warranting closer attention to its impact. Environmental temperature, the PV/T heat collector-evaporator area, suction superheat, and the original water tank temperature are chosen as the uncertain factors for sensitivity analysis. The local sensitivity factor is defined as follows [42]:
Fig. 12 shows the sensitivity coefficients varies with ambient factors, geometric structure, and operation conditions. The sensitivities of the five parameter variables on system COP and power generation efficiency were calculated using Eq. (12). For system COP, the sensitivity ranking is as follows: original water tank temperature > environmental temperature > collector area > radiation intensity > suction superheat, indicating that water temperature has the most significant impact on COP. For power generation efficiency, the sensitivity ranking is: environmental temperature > radiation intensity > collector area > original water tank temperature > suction superheat, with environmental temperature exerting the greatest influence on PV power generation efficiency.
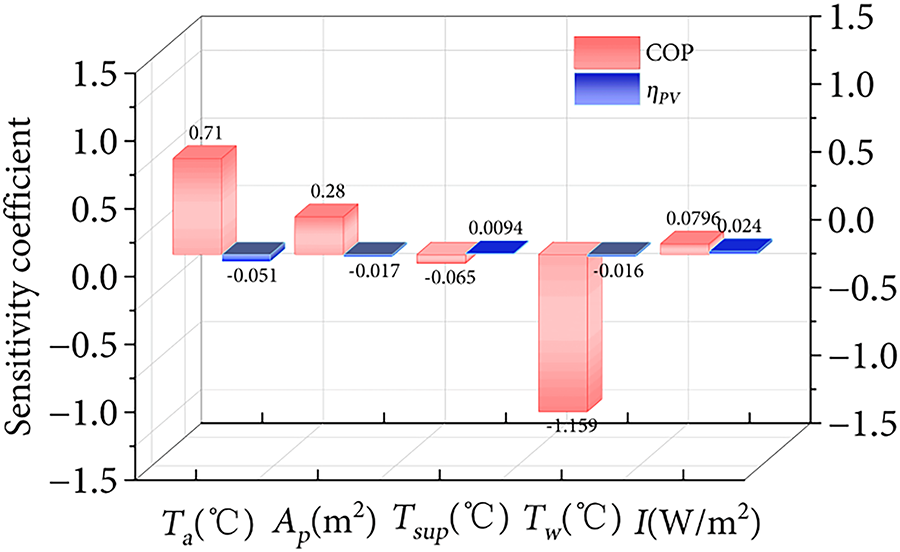
Figure 12: Parameter sensitivity analysis
This variation can be attributed to the system’s thermodynamic response under different boundary conditions. It can be found that sensitivity coefficient of ambient is 0.71 higher than that of collection areas 0.28. Ambient temperature and collection areas have a positive influence on the COP, and the influence of ambient temperature on COP is greater than that of area and radiation intensity. Initial water tank temperature and suction superheat show the highest sensitivity coefficient and lowest sensitivity coefficient, −1.59 and −0.665. They have a negative effect on the COP, which means increasing water temperature and superheat reduces the COP value, and water temperature has the most obvious effect. Water tank temperature is dominant factor among these factors, suggesting that adaptive control and dynamic thermal management are essential for maintaining high efficiency under varying climatic conditions.
For power generation efficiency, ambient temperature exerts the strongest influence because PV efficiency is inversely related to cell temperature. Sensitivity coefficient of ambient temperature, collection area and water tank temperature are lower than zero, −0.051, −0.017, −0.016 and have an inverse on the power generation efficiency. The radiation intensity and suction superheat show the positive sensitivity coefficient. Although suction superheat shows the positive sensitivity coefficient, the magnitude is smaller than that of other influencing factors, and its effect on efficiency is also not significant.
Enlarging the collector area improves solar energy absorption, boosts thermal and electrical outputs; however, excessive expansion raises system cost and heat losses, requiring a trade-off between cost and efficiency. Although suction superheat shows the lowest sensitivity, it still affects operational stability. Appropriate superheat control ensures complete refrigerant evaporation and prevents liquid slugging in the compressor. These factors would provide a more comprehensive understanding of system performance across diverse climatic and operational conditions.
This study conducted experimental research on a PV/T heat pump system and developed a one-dimensional steady-state numerical simulation model. It investigated key factors affecting system performance, including environmental temperature, PV/T collector-evaporator area, water tank temperature, and suction superheat. Comparison with present experimental data and simulation results, an average value RCOP2 of 0.92 and root mean square error (RMSECOP) ranges from 0.19 to 0.33, with an average value of 0.25, meet the accuracy. The results show:
(1) System performance improves with increasing environmental temperature and collector area, lower the initial with an optimal economic collector area of approximately 3 m2. Raising the initial water tank temperature from 10°C to 45°C shortens the heating time by 74.1%, though the COP decreases by 45%.
(2) Thermal performance peaks in July under high ambient temperatures, while PV efficiency is the highest in January when temperatures are lower. As ambient temperature rises, heat pump efficiency improves whereas electrical efficiency declines due to increased PV cell temperature.
(3) The sensitivity analysis shows that, for COP, the parameter importance follows: water tank temperature > ambient temperature > collector area > suction superheat. For power generation efficiency, the order is ambient temperature > collector area > water tank temperature > suction superheat. Accordingly, maintaining optimal ambient and water tank temperatures is crucial for sustaining high COP.
Overall, the system exhibits better performance in warm climates, and the optimization of collector area and suction superheat offers practical guidance for achieving cost-effective and energy-efficient system design. The system performs best in regions with strong solar radiation and can achieve near self-sufficiency in electricity from April to October, demonstrating significant potential for practical energy savings and optimized energy management. The sensitivity results provide quantitative guidance for system configuration and operation under different climatic conditions.
This work still has some limitations: the present study was validated under a single operating condition, and the selected environmental parameters may not fully represent broader climatic variations; certain simplifications were made regarding the refrigerant flow and the thermophysical properties of materials in order to reduce computational complexity; this work does not account for long-term component degradation, control system dynamics, or temperature stratification within the thermal storage tank.
Future research can be further extended in several directions: Employ low global warming potential (GWP) refrigerants to mitigate environmental impact; explore hybrid renewable energy configurations such as PV/T–geothermal or PV/T–air source coupling, to improve overall system efficiency and flexibility; integrate artificial intelligence and advanced control technologies to enhance the flexibility, stability and adaptability of system operation under varying climatic and load conditions.
Acknowledgement: Not applicable.
Funding Statement: This research is supported by the Chinese Natural Science Foundations (Grant No. 52176181), Natural Science Foundation Project of Fujian (Grant No. 2025J08222, Grant No. 2025J08247) and Scientific Research Foundation of Fujian University of Technology (Grant No. GY-Z220181).
Author Contributions: The authors confirm contribution to the paper as follows: data curation, investigation and writing, original draft: Jiale Liu; formal analysis, visualization and writing, review & editing: Jinyou Qiu, Yubing Li; validation and supervision: Shaogeng Zhong, Guilong Dai; methodology: Wenhua Liu. All authors reviewed the results and approved the final version of the manuscript.
Availability of Data and Materials: There is no data that is unavailable in this study.
Ethics Approval: Not applicable.
Conflicts of Interest: The authors declare no conflicts of interest to report regarding the present study.
Nomenclature
| A | Area (m2) |
| Ap | Area of PV/T heat collector-evaporator (m2) |
| COP | Coefficient of Performance |
| D | Equivalent width (m) |
| h | Specific enthalpy (kJ/kg) |
| I | Solar radiation intensity (W/m2) |
| L | Length (m) |
| M | Mass (kg) |
| mr | Mass flow rate (kg/s) |
| P | Pressure (pa) |
| T | Temperature (°C) |
| Ub | Dimensionless number |
| UL | Total heat loss coefficient of PV/T solar collector-evaporator |
| V | Volume (m3) |
| W | Width (m) |
| Wcom | Compressor power (W) |
| Greek symbols | |
| α | Absorptance |
| γ | Void fraction |
| δ | Thickness |
| η | Efficiency |
| λ | Thermal conductivity |
| ρ | Density |
| σ | Stefan-Boltzmann constant |
| τ | Time |
| κ | Adiabatic exponent |
| ν | Specific volume |
| Subscripts | |
| a | Air |
| c | Condenser |
| com | Compressor |
| dis | Discharge |
| e | Evaporator |
| r | Refrigerant |
| w | Water |
| i | Inlet |
| l | Liquid |
| g | Gas |
| o | Outlet |
| suc | Suction |
| sp | Single-phase |
| tp | Two-phase |
Appendix A.1 PV/T Collector-Evaporator Model:
Fig. A1shows the structural schematic diagram and thermal resistance network of the PV/T collector-evaporator. The solar radiation absorbed by the PV cells in the PV/T collector-evaporator is partially converted into electrical energy, while the rest is transformed into thermal energy.
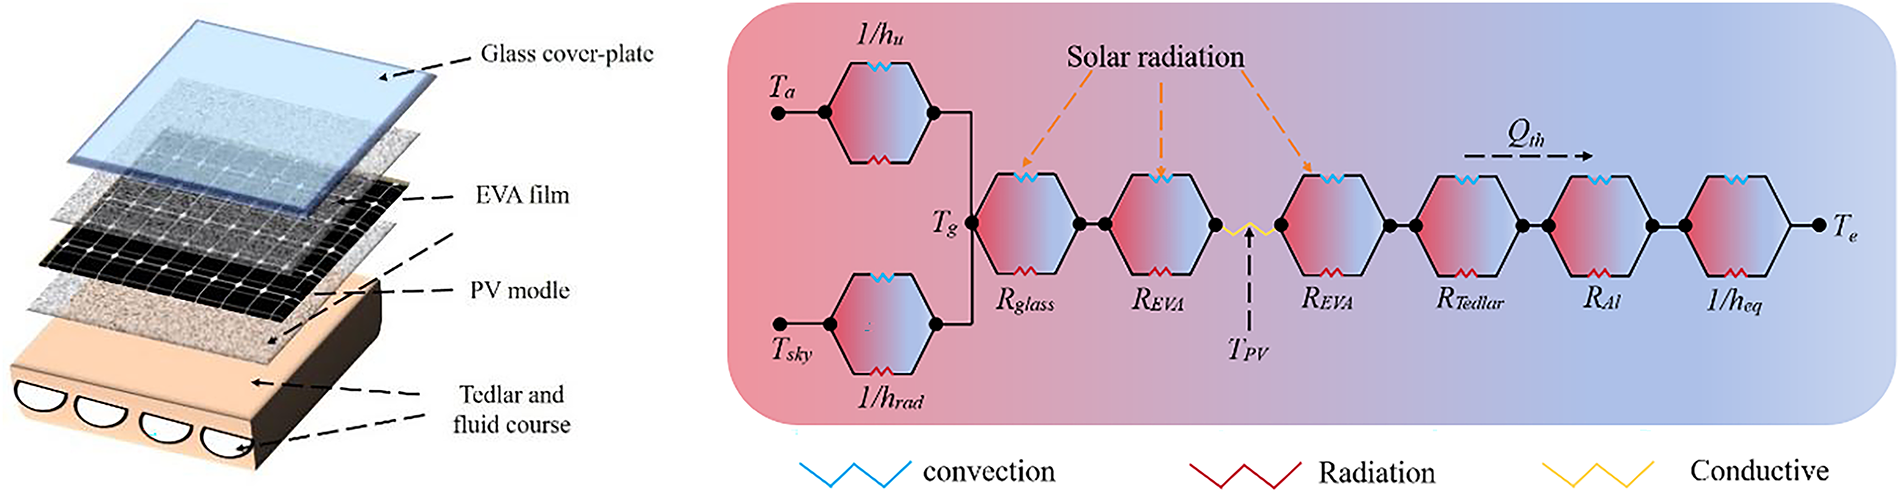
Figure A1: Schematic diagram of PV/T collector-evaporator and thermal resistance network diagram
The energy conservation equation of PV/T collector-evaporator can be expressed by:
where Qs is the solar radiation energy received by the PV cell, W, Qth is the heat absorbed by the refrigerant in the heat collection evaporator pipe, W, Qu is the convective heat transfer between the PV/T heat collection evaporator and the surrounding air, W, Qrad is the radiative heat transfer between the PV/T heat collection evaporator and the sky, W, mcell is the mass of the PV cell, kg, Ccell is the specific heat capacity of the PV cell, J/(kg·°C),
The energy absorbed by the refrigerant in the evaporation pipe, Qth can be determined using the energy conservation equation. However, this equation contains numerous temperature parameters that are difficult to obtain in practical calculations. Since the refrigerant temperature in the pipe can be easily measured (for calculation convenience, the refrigerant temperature is considered as the evaporation temperature, Te, collector efficiency factor F′ is introduced when calculating the heat absorption of the refrigerant [43].
where τg is the transmittance of glass cover plate, Ap is the area of PV/T heat collector-evaporator, m2, α is the represents the absorption rate of PV cell for solar radiation energy, I is the solar radiation intensity, W/m2, UL is the total heat dissipation coefficient.
where F ′ is the collector efficiency factor, which is represents the ratio of the actual useful energy gain to the useful gain when the inner surface of the collector is at fluid temperature, and is related to the structural parameters of the heat collector-evaporator and the physical parameters of each layer. F is the fin efficiency, heq is the convective heat transfer coefficient of the refrigerant in the evaporator tube, W/(m·K), q is the heat flux, r is the latent heat of refrigerant, Frl is the Froude number of the liquid phase refrigerant, G is the mass flux, kg/(m2·s), Achannel is the channel heat exchange area, m2.
The other non-dimensional coefficients, Ci, depends on the value of C0 [44]:
If C0 < 0.65:
C1 = 1.1360, C2 = −0.9, C3 = 667.2, C4 = 0.7, C5 = 0.3
If C0 > 0.65:
C1 = 0.6683, C2 = −0.2, C3 = 1058.0, C4 = 0.7, C5 = 0.3
Appendix A.2 Compressor Model
A compressor model [45] needs to calculate the outlet temperature, compressor power, and mass flow rate from the given inlet and outlet pressures and inlet temperature. The outlet temperature Tdiss can be expressed by:
where Tdis is the compressor exhaust temperature, °C, Tsuc is the Compressor suction temperature, °C, pc, pe are the condenser pressure and evaporation pressure, Pa, κ is the compress the variable exponent to a value of 1.15.
The compressor power Wcom is can be expressed by:
where νsuc is the suction specific volume, m3/kg, ηcom is the total efficiency of compressor.
Appendix A.3 Condensation and Electronic Expansion Valve
The condenser is the coiled tube type heat exchanger, wherein the refrigerant condenses and releases heat inside the tubes, and the heat released is used to heat the hot water in the water tank. The pressure drop of the condenser is approximately 0.2 bar based on experimental data; therefore, the pressure loss can be ignored. The condensation power is as follows:
where Acond is the heat transfer area between the condenser coil and hot water, m2, Ucond is the heat transfer coefficient of the condenser coil to water, W/(m2·K), Tc and Tw are the condensing temperature and water temperature, respectively, °C, the heat gain power of the water tank’s hot water can be expressed by:
where Cw is the specific heat capacity of water at constant pressure, J/(kg·°C), ρw is the density of water, kg/m3, Vw is the volume of the hot water storage tank, m3, Tw_1 is the original temperature of the water tank, °C, Tw_2 is the final temperature of the water tank, °C, τ is the heating time of hot water, s.
By considering the system as mass-conservative, the mass flow rate of the refrigerant remains consistent throughout the system. The electronic expansion valve model is further simplified by treating the throttling process as an ideal isenthalpic process, where the enthalpy values at the inlet and outlet of the electronic expansion valve are equal.
Appendix A.4 Refrigerant Charge Model:
Normally, in heat pump systems, the refrigerant flow may be either single phase or two-phase. The refrigerant mass [46] in the single-phase state Msp and Mtp are as follows:
where ρsp is the density of the single-phase refrigerant, kg/m3, V is the volume of the single-phase refrigerant, m3, ρg is the density of the gas phase refrigerant, kg/m3, ρl is the density of the liquid phase refrigerant, kg/m3, γ is the void fraction [47]. Accordingly, the refrigerant charge of the heat pump system Mr_total can be expressed by:
References
1. Caetano NS, Mata TM, Martins AA, Felgueiras MC. New trends in energy production and utilization. Energy Proc. 2017;107(8):7–14. doi:10.1016/j.egypro.2016.12.122. [Google Scholar] [CrossRef]
2. Li H, Lyu PX, Li Q, Hu ZQ. A review of performance studies and improvement measurements concerning solar photovoltaic and thermal collectors. Build Sci. 2025;41(2):16–24. (In Chinese). doi:10.13614/j.cnki.11-1962/tu.2025.02.03. [Google Scholar] [CrossRef]
3. Ghadikolaei SSC. Solar photovoltaic cells performance improvement by cooling technology: an overall review. Int J Hydrogen Energy. 2021;46(18):10939–72. doi:10.1016/j.ijhydene.2020.12.164. [Google Scholar] [CrossRef]
4. Miglioli A, Aste N, Del Pero C, Leonforte F. Photovoltaic-thermal solar-assisted heat pump systems for building applications: integration and design methods. Energy Built Environ. 2023;4(1):39–56. doi:10.1016/j.enbenv.2021.07.002. [Google Scholar] [CrossRef]
5. Sezen K, Gungor A. Comparison of solar assisted heat pump systems for heating residences: a review. Sol Energy. 2023;249(3):424–45. doi:10.1016/j.solener.2022.11.051. [Google Scholar] [CrossRef]
6. Ghasemipour S, Sameti M, Sharma MK. Annual comparative performance of direct expansion solar-assisted and air-source heat pumps for residential water heating. Int J Thermofluids. 2024;22(4):100651. doi:10.1016/j.ijft.2024.100651. [Google Scholar] [CrossRef]
7. Song Z, Ji J, Cai J, Zhao B, Li Z. Investigation on a direct-expansion solar-assisted heat pump with a novel hybrid compound parabolic concentrator/photovoltaic/fin evaporator. Appl Energy. 2021;299:117279. doi:10.1016/j.apenergy.2021.117279. [Google Scholar] [CrossRef]
8. Vahidhosseini SM, Rashidi S, Hsu SH, Yan WM, Rashidi A. Integration of solar thermal collectors and heat pumps with thermal energy storage systems for building energy demand reduction: a comprehensive review. J Energy Storage. 2024;95:112568. doi:10.1016/j.est.2024.112568. [Google Scholar] [CrossRef]
9. Omojaro P, Breitkopf C. Direct expansion solar assisted heat pumps: a review of applications and recent research. Renew Sustain Energy Rev. 2013;22(2A):33–45. doi:10.1016/j.rser.2013.01.029. [Google Scholar] [CrossRef]
10. Pourasl HH, Barenji RV, Khojastehnezhad VM. Solar energy status in the world: a comprehensive review. Energy Rep. 2023;10:3474–93. doi:10.1016/j.egyr.2023.10.022. [Google Scholar] [CrossRef]
11. Abbas S, Yuan Y, Hassan A, Zhou J, Zeng C, Yu M, et al. Experimental and numerical investigation on a solar direct-expansion heat pump system employing PV/T & solar thermal collector as evaporator. Energy. 2022;254:124312. doi:10.1016/j.energy.2022.124312. [Google Scholar] [CrossRef]
12. Sami S. Modeling and simulation of a novel combined solar photovoltaic-thermal panel and heat pump hybrid system. Clean Technol. 2019;1(1):89–113. doi:10.3390/cleantechnol1010007. [Google Scholar] [CrossRef]
13. Zhang S, He W, Fan Y, Wang K, Hu Z, Chu W, et al. Field experimental investigation on electricity and thermal performances of a large scale photovoltaic solar-thermal direct expansion heat pump system. Energy Convers Manag. 2022;267:115941. doi:10.1016/j.enconman.2022.115941. [Google Scholar] [CrossRef]
14. Xu G, Zhang X, Deng S. Experimental study on the operating characteristics of a novel low-concentrating solar photovoltaic/thermal integrated heat pump water heating system. Appl Therm Eng. 2011;31(17–18):3689–95. doi:10.1016/j.applthermaleng.2011.01.030. [Google Scholar] [CrossRef]
15. Sun T, Li Z, Gou Y, Guo G, An Y, Fu Y, et al. Modeling and simulation analysis of photovoltaic photothermal modules in solar heat pump systems. Energies. 2024;17(5):1042. doi:10.3390/en17051042. [Google Scholar] [CrossRef]
16. Chen DC, Yao J, Zhao Y, Dai YJ. Research on optimization of evaporator of direct expansion solar heat pump and its low temperature characteristics. Acta Energiae Solaris Sin. 2021;42(9):190–7. (In Chinese). doi:10.19912/j.0254-0096.tynxb.2019-0807. [Google Scholar] [CrossRef]
17. Othman MY, Hamid SA, Tabook MAS, Sopian K, Roslan MH, Ibarahim Z. Performance analysis of PV/T Combi with water and air heating system: an experimental study. Renew Energy. 2016;86(6):716–22. doi:10.1016/j.renene.2015.08.061. [Google Scholar] [CrossRef]
18. Misha S, Abdullah AL, Tamaldin N, Rosli MAM, Sachit FA. Simulation CFD and experimental investigation of PVT water system under natural Malaysian weather conditions. Energy Rep. 2020;6(6):28–44. doi:10.1016/j.egyr.2019.11.162. [Google Scholar] [CrossRef]
19. Prasetyo SD, Prabowo AR, Arifin Z. The use of a hybrid photovoltaic/thermal (PV/T) collector system as a sustainable energy-harvest instrument in urban technology. Heliyon. 2023;9(2):e13390. doi:10.1016/j.heliyon.2023.e13390. [Google Scholar] [PubMed] [CrossRef]
20. Venugopal J, Dubey R, Mahor V, Ramkumar G, Yadav AS, Tripathi V, et al. Analysis and performance enhancement of newly designed solar based heat pump for water heating application. Energy Rep. 2022;8(9594):302–12. doi:10.1016/j.egyr.2022.06.112. [Google Scholar] [CrossRef]
21. Sulaiman AY, Cotter D, Arpagaus C, Hewitt N. Theoretical evaluation of energy, exergy, and minimum superheat in a high-temperature heat pump with low GWP refrigerants. Int J Refrig. 2023;153(5):99–109. doi:10.1016/j.ijrefrig.2023.06.001. [Google Scholar] [CrossRef]
22. Almadhhachi M, Ajeena AM, Al-Madhhachi HS, Farkas I. Numerical analysis of the effects of transparent thermal materials in photovoltaic thermal systems. Results Eng. 2025;26(3):105582. doi:10.1016/j.rineng.2025.105582. [Google Scholar] [CrossRef]
23. Zhou J, Ke H, Deng X. Experimental and CFD investigation on temperature distribution of a serpentine tube type photovoltaic/thermal collector. Sol Energy. 2018;174:735–42. doi:10.1016/j.solener.2018.09.063. [Google Scholar] [CrossRef]
24. Fudholi A, Sopian K, Yazdi MH, Ruslan MH, Ibrahim A, Kazem HA. Performance analysis of photovoltaic thermal (PVT) water collectors. Energy Convers Manag. 2014;78(1):641–51. doi:10.1016/j.enconman.2013.11.017. [Google Scholar] [CrossRef]
25. Che JG, Nan XH, Liu LJ, Yan QH. Sensitivity analysis of design parameters of collector for direct-expansion solar assisted heat pump water heater. Acta Energiae Solaris Sin. 2021;42(5):343–9. (In Chinese). doi:10.19912/j.0254-0096.tynxb.2018-1412. [Google Scholar] [CrossRef]
26. Bisengimana E, Zhou J, Binama M, Yuan Y. Numerical investigation on the factors influencing the temperature distribution of photovoltaic/thermal (PVT) evaporator/condenser for heat pump systems. Renew Energy. 2022;194(10):885–901. doi:10.1016/j.renene.2022.05.154. [Google Scholar] [CrossRef]
27. Pang W, Zhang Y, Duck BC, Yu H, Song X, Yan H. Cross sectional geometries effect on the energy efficiency of a photovoltaic thermal module: numerical simulation and experimental validation. Energy. 2020;209(7):118439. doi:10.1016/j.energy.2020.118439. [Google Scholar] [CrossRef]
28. Shen C, Zhang Y, Zhang C, Pu J, Wei S, Dong Y. A numerical investigation on optimization of PV/T systems with the field synergy theory. Appl Therm Eng. 2021;185:116381. doi:10.1016/j.applthermaleng.2020.116381. [Google Scholar] [CrossRef]
29. Aghakhani S, Afrand M, Karimipour A, Kalbasi R, Mehdi Razzaghi M. Numerical study of the cooling effect of a PVT on its thermal and electrical efficiency using a Cu tube of different diameters and lengths. Sustain Energy Technol Assess. 2022;52(5):102044. doi:10.1016/j.seta.2022.102044. [Google Scholar] [CrossRef]
30. Cui J, Wang X, Zhang X, Liu F, Liu J, Yu H, et al. Analysis of performance of direct expansion photovoltaic heat pump based on flow distribution. Therm Sci Eng Prog. 2025;62(6):103613. doi:10.1016/j.tsep.2025.103613. [Google Scholar] [CrossRef]
31. Zhou J, Ma X, Zhao X, Yuan Y, Yu M, Li J. Numerical simulation and experimental validation of a micro-channel PV/T modules based direct-expansion solar heat pump system. Renew Energy. 2020;145(5):1992–2004. doi:10.1016/j.renene.2019.07.049. [Google Scholar] [CrossRef]
32. Du B, Quan Z, Hou L, Zhao Y, Lou X, Shao S. Simulation analysis of a photovoltaic/thermal-air dual heat source direct-expansion heat pump. Renew Energy. 2023;218:119019. doi:10.1016/j.renene.2023.119019. [Google Scholar] [CrossRef]
33. Ji J, Liu KL, Pei G, He W, He HF. Theoretical analysis on evaporator of solar assisted heat pump and numerical simulation based on distributed parameters. Acta Energiae Solaris Sin. 2006;27(12):1202–7. (In Chinese). doi:10.1007/978-3-540-75997-3_183. [Google Scholar] [CrossRef]
34. Ma T, Li M, Kazemian A. Photovoltaic thermal module and solar thermal collector connected in series to produce electricity and high-grade heat simultaneously. Appl Energy. 2020;261:114380. doi:10.1016/j.apenergy.2019.114380. [Google Scholar] [CrossRef]
35. Huang BJ, Lin TH, Hung WC, Sun FS. Performance evaluation of solar photovoltaic/thermal systems. Sol Energy. 2001;70(5):443–8. doi:10.1016/S0038-092X(00)00153-5. [Google Scholar] [CrossRef]
36. Jeong YD, Nam Y. Sensitive analysis of design factor for the optimum design of PVT system. KIEAE J. 2015;15(4):5–11. doi:10.12813/kieae.2015.15.4.005. [Google Scholar] [CrossRef]
37. Chen F, Hu M, Badiei A, Yu M, Huang Z, Wang Z, et al. Experimental and numerical investigation of a novel photovoltaic/thermal system using micro-channel flat loop heat pipe (PV/T-MCFLHP). Int J Low-Carbon Technol. 2020;15(4):513–27. doi:10.1093/ijlct/ctaa019. [Google Scholar] [CrossRef]
38. Liu Z, Wang Q, Wu D, Zhang Y, Yin H, Yu H, et al. Operating performance of a solar/air-dual source heat pump system under various refrigerant flow rates and distributions. Appl Therm Eng. 2020;178:115631. doi:10.1016/j.applthermaleng.2020.115631. [Google Scholar] [CrossRef]
39. Chicco D, Warrens MJ, Jurman G. The coefficient of determination R-squared is more informative than SMAPE, MAE, MAPE, MSE and RMSE in regression analysis evaluation. PeerJ Comput Sci. 2021;7(3):e623. doi:10.7717/peerj-cs.623. [Google Scholar] [PubMed] [CrossRef]
40. Onyutha C. A hydrological model skill score and revised R-squared. Hydrol Res. 2022;53(1):51–64. doi:10.2166/nh.2021.071. [Google Scholar] [CrossRef]
41. Dai Q, Duan SX, Cai T, Chen TJ, Huang L. Cost-benefit model and its sensitivity analysis for battery charging and swapping station for electric vehicles. Autom Electr Power Syst. 2014;38(24):41–7. (In Chinese). doi:10.7500/AEPS20131225004. [Google Scholar] [CrossRef]
42. Zhu W, Zhang G. Sensitivity analysis of influence of jointed rock parameters on damaged zone of surrounding rock. Undergr Space. 1994;1:10–5. (In Chinese). doi:10.20174/j.juse.1994.01.002. [Google Scholar] [CrossRef]
43. Yao J, Chen E, Dai Y, Huang M. Theoretical analysis on efficiency factor of direct expansion PVT module for heat pump application. Sol Energy. 2020;206(4):677–94. doi:10.1016/j.solener.2020.04.053. [Google Scholar] [CrossRef]
44. Gnielinski V. New equations for heat and mass transfer in turbulent pipe and channel flow. Int Chem Eng. 1976;16:359–68. [Google Scholar]
45. Zhang C. Fundamentals of vapor-compression refrigeration and air conditioning system modeling. Beijing, China: Chemical Industry Press; 2013. [Google Scholar]
46. Kong X, Yan X, Yue Z, Zhang P, Li Y. Influence of refrigerant charge and condenser area on direct-expansion solar-assisted heat pump system for radiant floor heating. Sol Energy. 2022;247(4):499–509. doi:10.1016/j.solener.2022.10.051. [Google Scholar] [CrossRef]
47. Tandon TN, Varma HK, Gupta CP. A void fraction model for annular two-phase flow. Int J Heat Mass Transf. 1985;28(1):191–8. doi:10.1016/0017-9310(85)90021-3. [Google Scholar] [CrossRef]
Cite This Article
 Copyright © 2025 The Author(s). Published by Tech Science Press.
This work is licensed under a Creative Commons Attribution 4.0 International License , which permits unrestricted use, distribution, and reproduction in any medium, provided the original work is properly cited.
 Downloads
 Citation Tools