
 Submit a Paper
 Propose a Special lssue
 Open Access
ARTICLE

Thermal Performance and Design Optimization of a High-Concentration Photovoltaic System for Arid Environments
1 Department of Mechanical and Energy Engineering, College of Engineering, Imam Abdulrahman Bin Faisal University, Dammam, Saudi Arabia
2 Department of Mechanical Engineering, College of Engineering, Prince Mohammad Bin Fahd University, Al Khobar, Saudi Arabia
3 Department of Civil and Construction Engineering, College of Engineering, Imam Abdulrahman Bin Faisal University, Dammam, Saudi Arabia
4 Environment and Sustainability Institute, University of Exeter, Penryn Campus, Cornwall, UK
* Corresponding Author: Taher Maatallah. Email:
Frontiers in Heat and Mass Transfer 2026, 24(1), 7 https://doi.org/10.32604/fhmt.2026.075763
Received 07 November 2025; Accepted 26 December 2025; Issue published 28 February 2026
 View Full Text
 Download PDF
Abstract
High-concentration photovoltaic (HCPV) systems present significant thermal management challenges due to the intense heat fluxes generated under concentrated solar irradiation, especially in arid environments. Effective heat dissipation is critical to prevent performance degradation and structural failure. This study investigates the thermal performance and design optimization of an enhanced HCPV module, integrating numerical, analytical, and experimental methods. A coupled optical-thermal-electrical model was developed to simulate ray tracing, heat transfer, and temperature-dependent electrical behaviour, with predictions validated under real-world desert conditions. Compared to a baseline commercial module operating at 106°C, the optimized design achieved a peak temperature reduction of 16°C, lowering the cell temperature toKeywords
The rapid growth of population, urbanization, industrialization, and technological advancement has led to a considerable increase in global energy demand. According to Raimi and Newell [1], worldwide energy consumption continues to rise by approximately 0.4% annually. The predominant reliance on fossil fuels for energy generation results in substantial greenhouse gas (GHG) emissions, exacerbating climate change and environmental degradation. Consequently, there is an urgent need to transition toward cleaner, renewable energy sources and to improve energy efficiency across all sectors. Solar energy represents a clean, abundant, and environmentally sustainable alternative, playing a fundamental role in expanding access to affordable and decarbonized electricity. Photovoltaic (PV) technology, which converts sunlight directly into electricity, has undergone significant advancements in recent decades, driven by reductions in material costs, improvements in cell efficiency, and increased investment in solar infrastructure.
High-Concentration Photovoltaics (HCPV) systems employ optical concentrators such as Fresnel lenses, parabolic dishes, or solar towers to focus sunlight onto high-efficiency multi-junction solar cells. The primary advantage of HCPV lies in its potential cost-effectiveness, as the use of inexpensive optical elements reduces the required area of expensive semiconductor materials [2]. However, the intense heat fluxes generated under high concentration ratios (typically 500× or more) pose significant thermal management challenges. Excessive temperatures degrade cell efficiency, increase thermal stress, and can lead to premature system failure [3]. Maintaining cell temperatures within an optimal range (typically 50°C–
Without adequate cooling, cell temperatures in multi-junction solar cells can exceed 1300°C under concentration ratios of 1000×, resulting in non-uniform temperature distributions and severe performance losses [5]. Electrical efficiency decreases by approximately 0.4%–0.65% per degree Celsius rise above the standard operating temperature [6]. Effective thermal management is thus essential to ensure the reliability and economic viability of HCPV systems, particularly in high-irradiance, arid environments where cooling resources may be limited. Thermal management strategies for HCPV can be broadly categorized as passive or active. Passive methods, such as natural convection and radiative cooling, require no external energy input and are generally low-maintenance, but their cooling capacity may be insufficient under extreme conditions [7]. Active cooling, using fluids or forced air, offers higher heat removal rates but introduces complexity, cost, and parasitic energy consumption [8]. Recent hybrid approaches seek to balance these trade-offs by combining passive heat spreading with selectively activated active cooling [9].
Recent studies have also highlighted the importance of considering the full lifecycle environmental impact of PV systems. As noted by Zhang et al. [10], “Ignoring the effects of photovoltaic array deployment on greenhouse gas emissions may lead to overestimation of the contribution of photovoltaic power generation to greenhouse gas reduction”. This underscores the need for holistic assessments that account for embodied emissions from manufacturing, installation, and decommissioning, in addition to operational benefits. Advanced thermal management can improve not only efficiency but also the lifetime and sustainability of HCPV systems, thereby amplifying their net environmental benefit.
Concentrator PV systems also offer opportunities for dual-use applications, such as combined power and thermal energy generation (CPV/T) [11] or integration with desalination processes in water-scarce regions [12]. Such hybrid systems can improve overall energy utilization and economic feasibility. The evaluation of cell temperature remains a crucial factor in predicting the energy yield and durability of HCPV systems [13]. Multi-junction cells are particularly sensitive to temperature variations, which affect key electrical parameters including open-circuit voltage, short-circuit current density, fill factor (FF), and overall conversion efficiency. Empirical correlations, such as those developed by Minano et al. [14], indicate a temperature coefficient of approximately −0.248%/∘ at 1× concentration and −0.098%/∘ at 200× concentration for triple-junction cells. Passive cooling has been demonstrated as a viable solution for many HCPV applications, particularly when cell sizes are reduced (<5 mm) to facilitate heat spreading [15]. However, for linear Fresnel concentrators with CR > 20×, passive methods may become inadequate without careful design optimization [16]. Computational fluid dynamics (CFD) simulations by Micheli et al. [17] revealed that wind speeds below 1 m/s significantly limit convective cooling, underscoring the interplay between environmental conditions and thermal design. Recent innovations in passive cooling include micro-finned heat sinks [18], heat pipe integration [19], and advanced thermal interface materials [20], which have shown promise in improving specific power (W/kg) and reducing thermal resistance. Experimental studies under real-world conditions, such as those by Renzi et al. [21], report cell temperatures of 55°C–65°C for passively cooled HCPV systems at CR ≈ 476×.
Nevertheless, thermal expansion mismatches between cell layers and module materials can induce significant thermomechanical stresses, leading to delamination, cracking, and hot-spot formation [22]. Abo-Zahhad et al. [23] demonstrated that increased concentration ratios exacerbate temperature non-uniformity and thermal stress, particularly at the cell center. Thus, effective thermal management must address both peak temperature reduction and gradient minimization.
This study presents a comprehensive thermal performance analysis and design optimization of a novel HCPV module tailored for arid, high-irradiance environments. By integrating optical, thermal, and electrical modelling with experimental validation under real desert conditions, we develop an enhanced module architecture that significantly improves convective cooling and reduces thermal resistance. Key innovations include an open conical-unit design that promotes airflow penetration and reduces thermal cross-talk between cells. The optimized system demonstrates a 16°C reduction in peak cell temperature and a 3.1% increase in electrical efficiency compared to a conventional baseline, while maintaining a fill factor above 78%. These results highlight the critical role of aerodynamic and geometric optimization in advancing the reliability and performance of high-concentration photovoltaics.
2 Numerical Modelling Methodology
This study employs a fully integrated modelling framework that combines optical ray-tracing, thermal analysis, and electrical performance modelling. Each subsystem is described in detail, followed by an explanation of how they are coupled to provide a holistic representation of the HCPV module under arid climate conditions.
The geometrical design of the optical system was built using COMSOL Multiphysics software® version 6.2, and all system materials were defined from the optical material library. The optical refractive indexes of the selected materials were identified, and the optical dispersion model coefficients were automatically loaded for the assigned boundaries and domains. The refractive index (n) of every material is dependent on air at a specific pressure and temperature. Therefore, a reference temperature (Tr) and pressure (Pr) were selected in the optical dispersion model to quantify the refractive index. The absolute refractive index,
The refractive index of air is modeled using the Ciddor equation [24], valid for wavelengths from 300 to 1690 nm, temperatures from 15°C to 30°C, and pressures near standard atmospheric conditions. The refractive index of air, which varies with wavelength, temperature, and pressure, is calculated using Eq. (2), followed by the dispersion relation given in Eq. (3). The refraction index of the air,
where
The ray optics model is derived from the electromagnetic module under geometrical optics physics, and the ray trajectories are simulated. Ray tracing is often a suitable approach to simulating the dispersion of electromagnetic waves. Ray tracing was used to simulate and test the proposed system since the wavelength of the radiation is modest in relation to the lowest geometric dimension of the system. A first-order ordinary differential equations are solved, as in Eqs. (4) and (5) [25]:
where
c is the speed of light (
The following conservation equations for mass, momentum, and energy (Eqs. (7)–(9)) are based on the incompressible Navier–Stokes formulation with the Boussinesq approximation for buoyancy-driven flow [26]. The fluid is assumed to be Newtonian with constant properties except for density in the buoyancy term. These equations are solved under steady-state, three-dimensional, and turbulent flow conditions.
Continuity:
Momentum equation:
Energy equation:
where
The Boussinesq approximation is employed, wherein density is treated as constant in all terms except in the buoyancy force of the momentum equation, where it varies linearly with temperature. This is valid for temperature differences below approximately 30°C, which is consistent with the operating range of the HCPV system [27]. Fig. 1 depicts a simplified scheme of the heat power balance for a single HCPV module sub-unit.
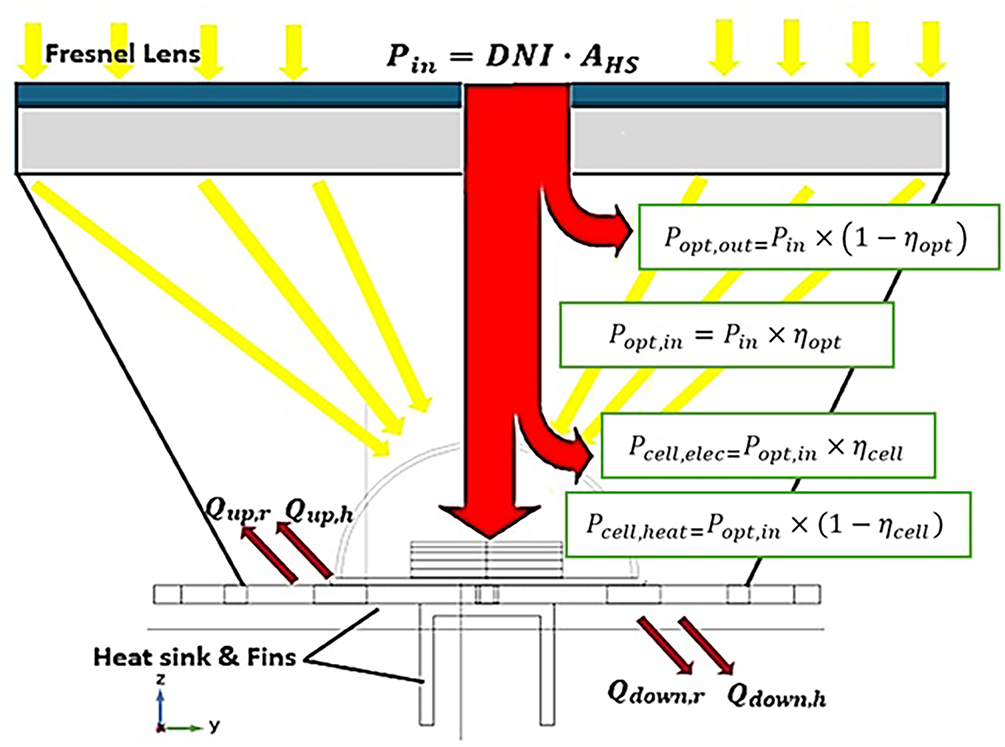
Figure 1: Thermal energy balance schematic for a single HCPV sub-unit.
Fig. 2 shows the internal and external free-convective and radiative heat transfer for a single HCPV module sub-unit.
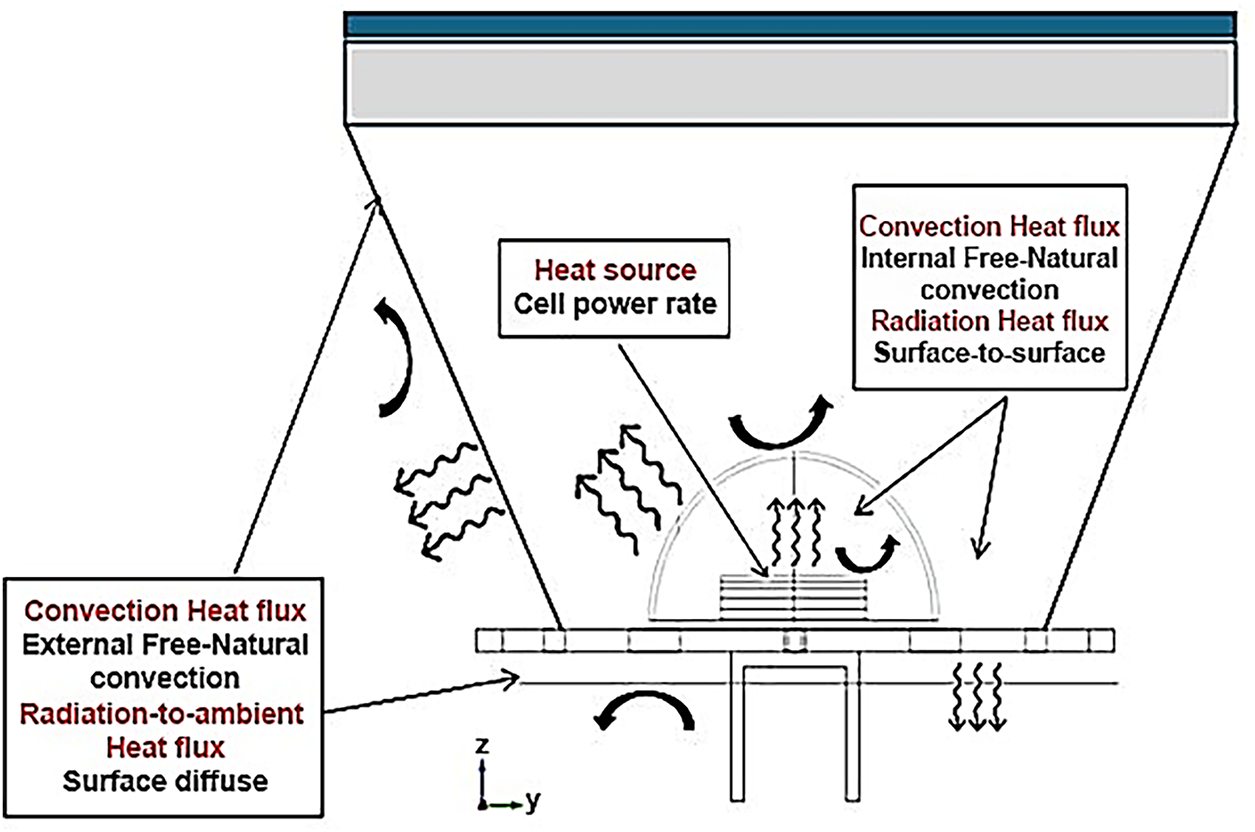
Figure 2: Dominant heat transfer pathways: Conduction, convection, and radiation in an HCPV sub-unit.
The other fraction from the deposited ray power flux is convertible to electrical power. The total input power received by the HCPV solar cells can be expressed using Eq. (10) [2]:
where
The optical losses refer to the optical misalignment errors losses due to the tracking errors, slope errors, and the broken-cloud conditions.
Thus, the actual input power to the HCPV system presented in Eq. (12):
The heat generated per meter square of the HCPV system,
The solar cell’s electrical efficiency is formulated as shown in Eq. (14) [2,6,28]:
where
Considering the electrical tracking load, the net electrical output power per meter square of the HCPV system is expressed in in Eq. (15):
where
2.4 Model Integration and Coupling
The initial conditions for the simulation are given by Eq. (16) [29]:
where
The modelling framework features bidirectional coupling between optical, thermal, and electrical domains to capture their interdependencies. First, the optical ray-tracing solution provides the non-uniform irradiance distribution incident on the cell, which is imposed as a heat flux boundary condition in the thermal simulation. The resulting temperature field then informs the electrical model, where temperature-dependent efficiency and open-circuit voltage are computed via empirical correlations. An energy feedback loop ensures self-consistency: the electrical efficiency determines the fraction of absorbed power converted to heat, which in turn updates the thermal boundary condition. This coupled approach was validated against experimental data collected under actual desert conditions, demonstrating agreement within 1.6°C for peak cell temperature and 99.5%, RMSE for power output.
The discussion interprets the numerical, analytical, and experimental findings in terms of the underlying physics and engineering principles. To maintain clarity, the Mesh Independence Study and Validation are treated as independent subsections before moving into thermal and electrical performance analysis.
The mesh accuracy validation figure illustrates the variation of the predicted maximum cell temperature as a function of the number of mesh elements. As the mesh is refined, the maximum temperature progressively approaches a stable value. Specifically, as shown in Fig. 3, beyond approximately 12 million elements, the change in the maximum temperature becomes less than
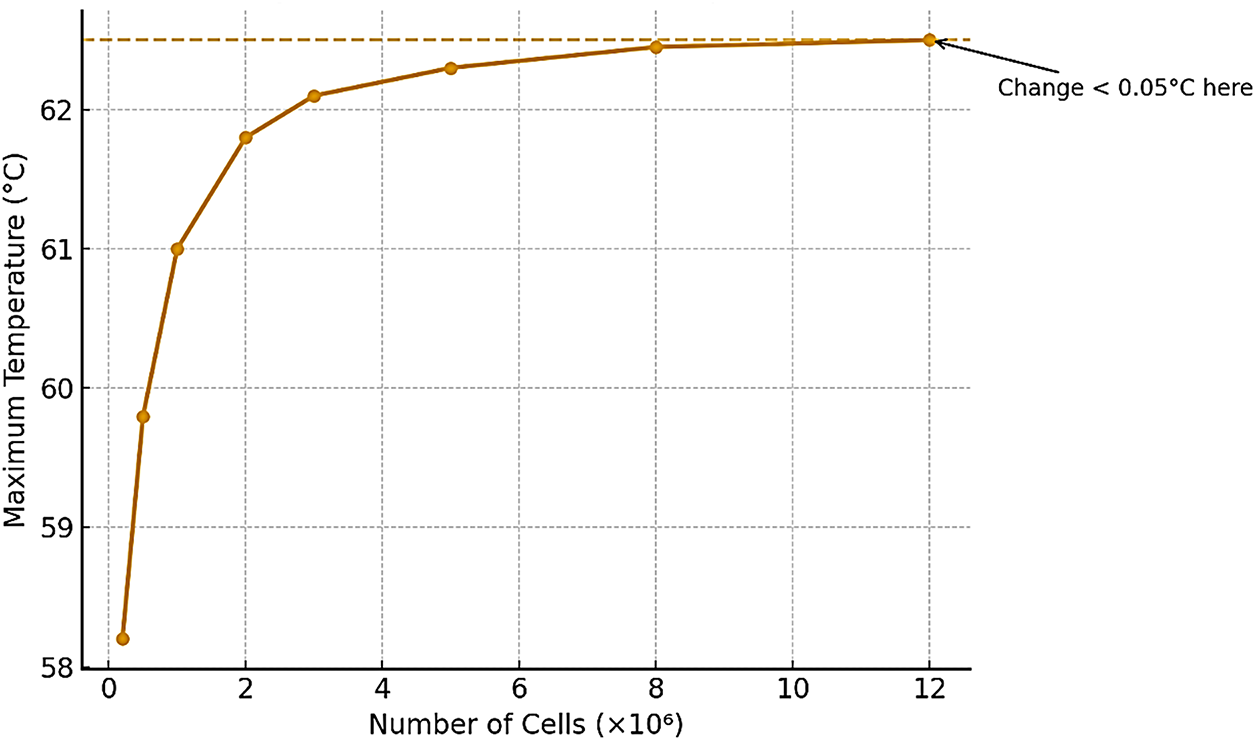
Figure 3: Grid sensitivity analysis: Convergence of maximum cell temperature with increasing mesh density.
3.2 Validation of the Developed Heat Transfer Model
Simulations were conducted using COMSOL Multiphysics® version 6.2. The numerical model was customized to account for the geometrical and physical dimensions of the reference model. Afterward, the model used a numerical approach to solve the thermal model. To establish the boundary condition for the heat transfer in the solid model, all optics were assigned for the thermal load (
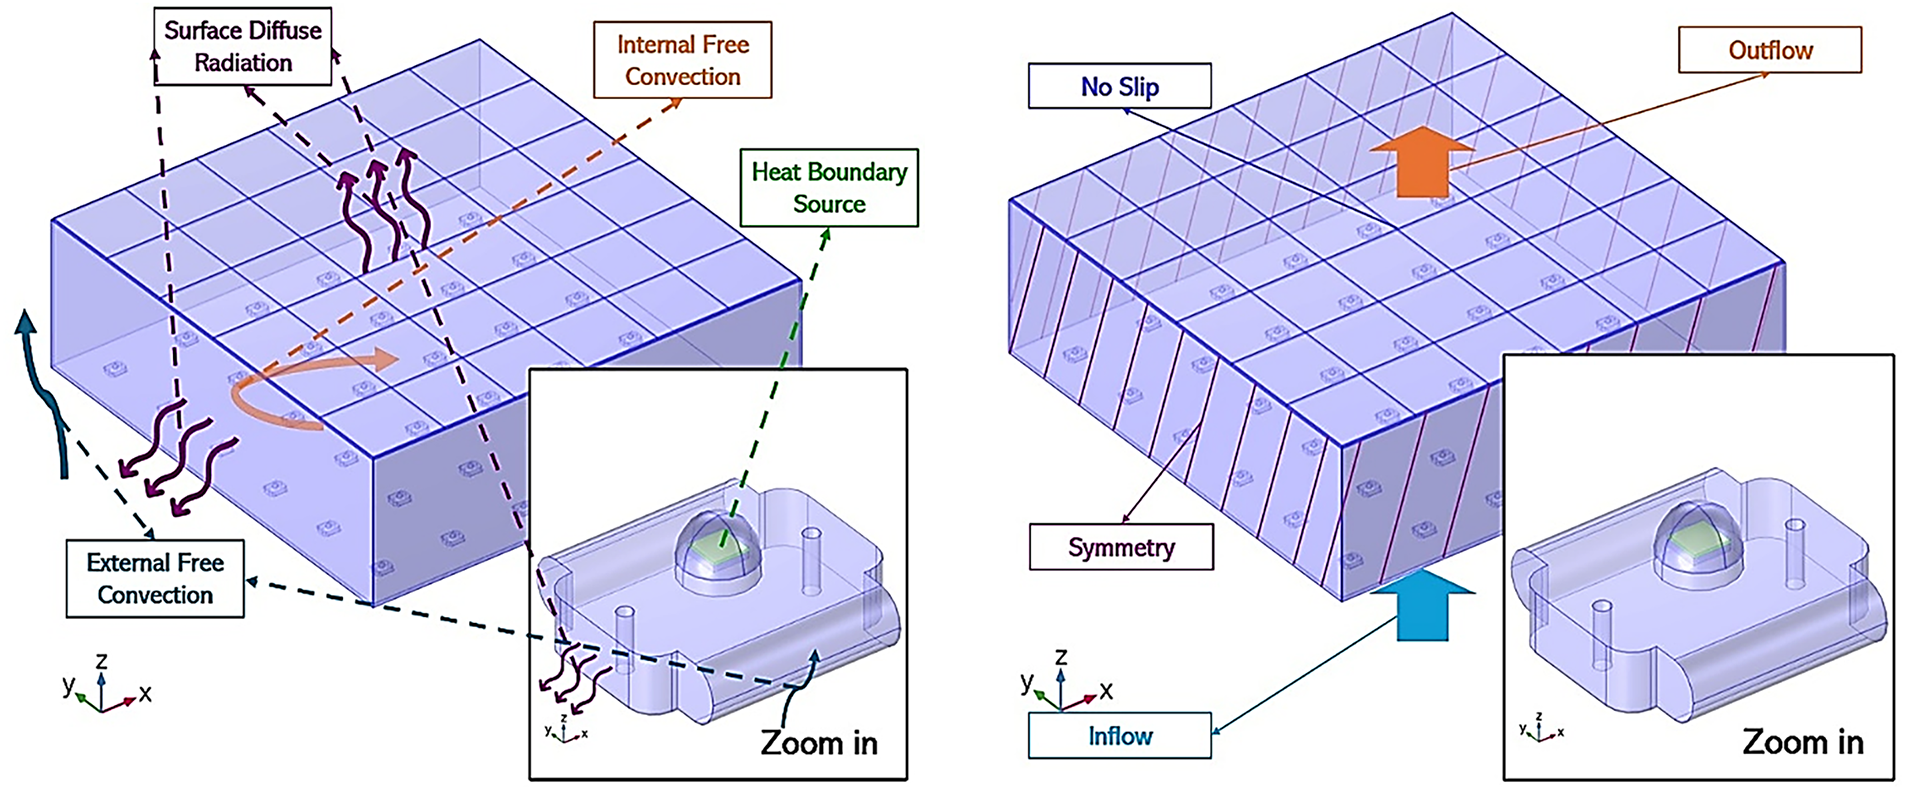
Figure 4: Computational domain and applied thermal boundary conditions for the baseline HCPV model.
For an accurate and fair validation of the developed numerical model (FEM-based model), similar material properties, geometric dimensions, boundary, and initial conditions have been applied:
Symmetric Boundary Condition (BC) at the side vertical walls of the module (no shear, no normal component of velocity, and no normal gradient of pressure at those walls);
1. Air velocity of
2. No-Slip BC at the walls.
3. Suppress the backflow at the outlet flow on the side walls.
Optimization of heat sink substrate dimension through analytical analysis was conducted by Al-Amri et al. [30] to reduce the redundant areas, the weight and the cost of the tracking system and the materials used for the manufacturing of such a system. Such optimization was effective in reducing the operational cost of the HCPV system without compromising the heat dissipation rate and the cell operating temperature. In the current study, the baseline configuration of the HCPV module was the same, being analytically and experimentally investigated by the above-mentioned references.
Validation was performed by comparing numerical predictions against both analytical and experimental datasets. Numerical predictions of maximum cell temperature were validated against experimental data from Nishioka et al. [6], analytical models from Al-Amri [30], and numerical results presented by Mi et al. [31] across an irradiance range of 644–982 W/m2. These results demonstrate the model’s capability to predict thermal behavior with high accuracy, with maximum errors consistently below
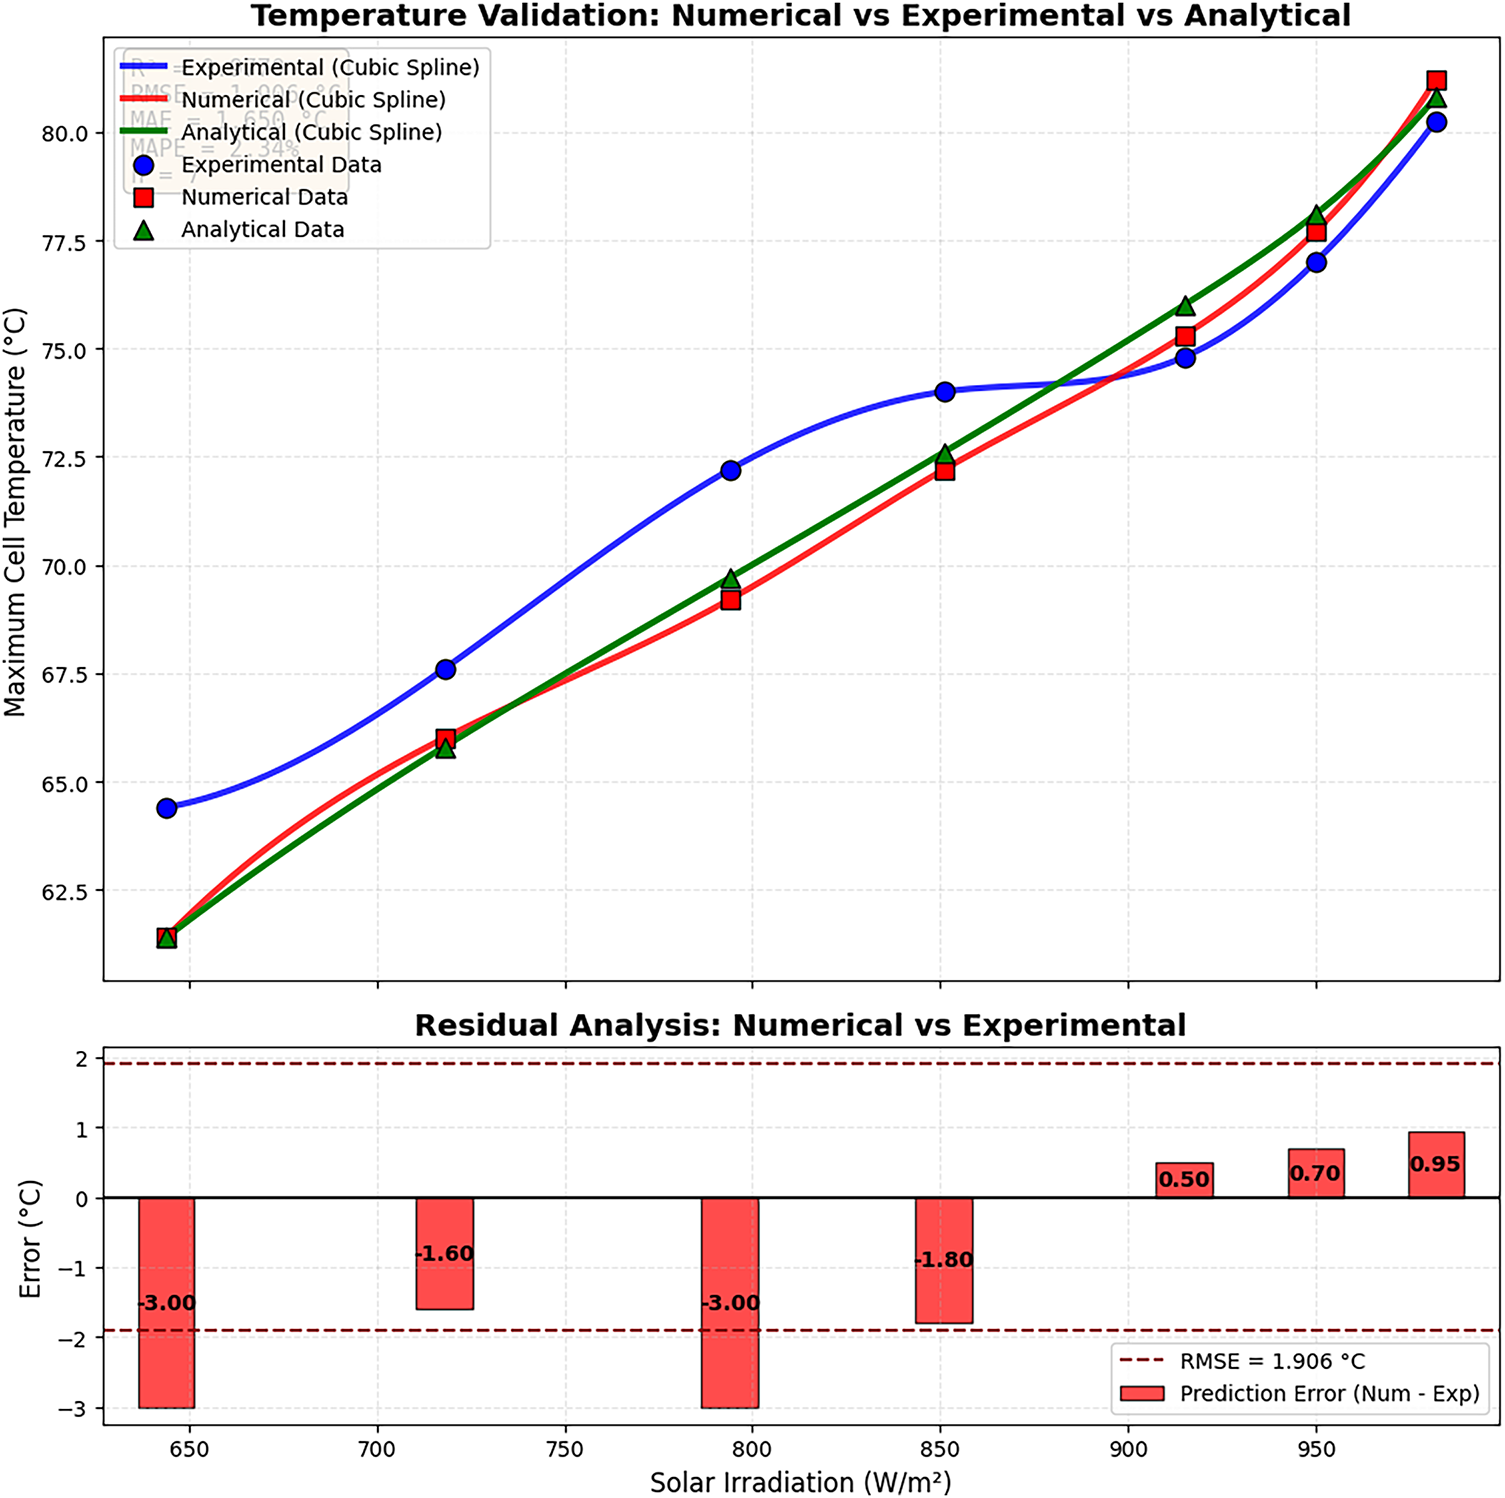
Figure 5: Thermal validation of the numerical model: Comparison of predicted cell temperatures with experimental data from Nishioka et al. [6], analytical results from Al-Amri [30], and numerical data published by Mi et al. [31], and across varying irradiance levels.
Electrical performance validation against experimental data is shown in Fig. 6, demonstrating the model’s capability to accurately predict power output across varying irradiance conditions.
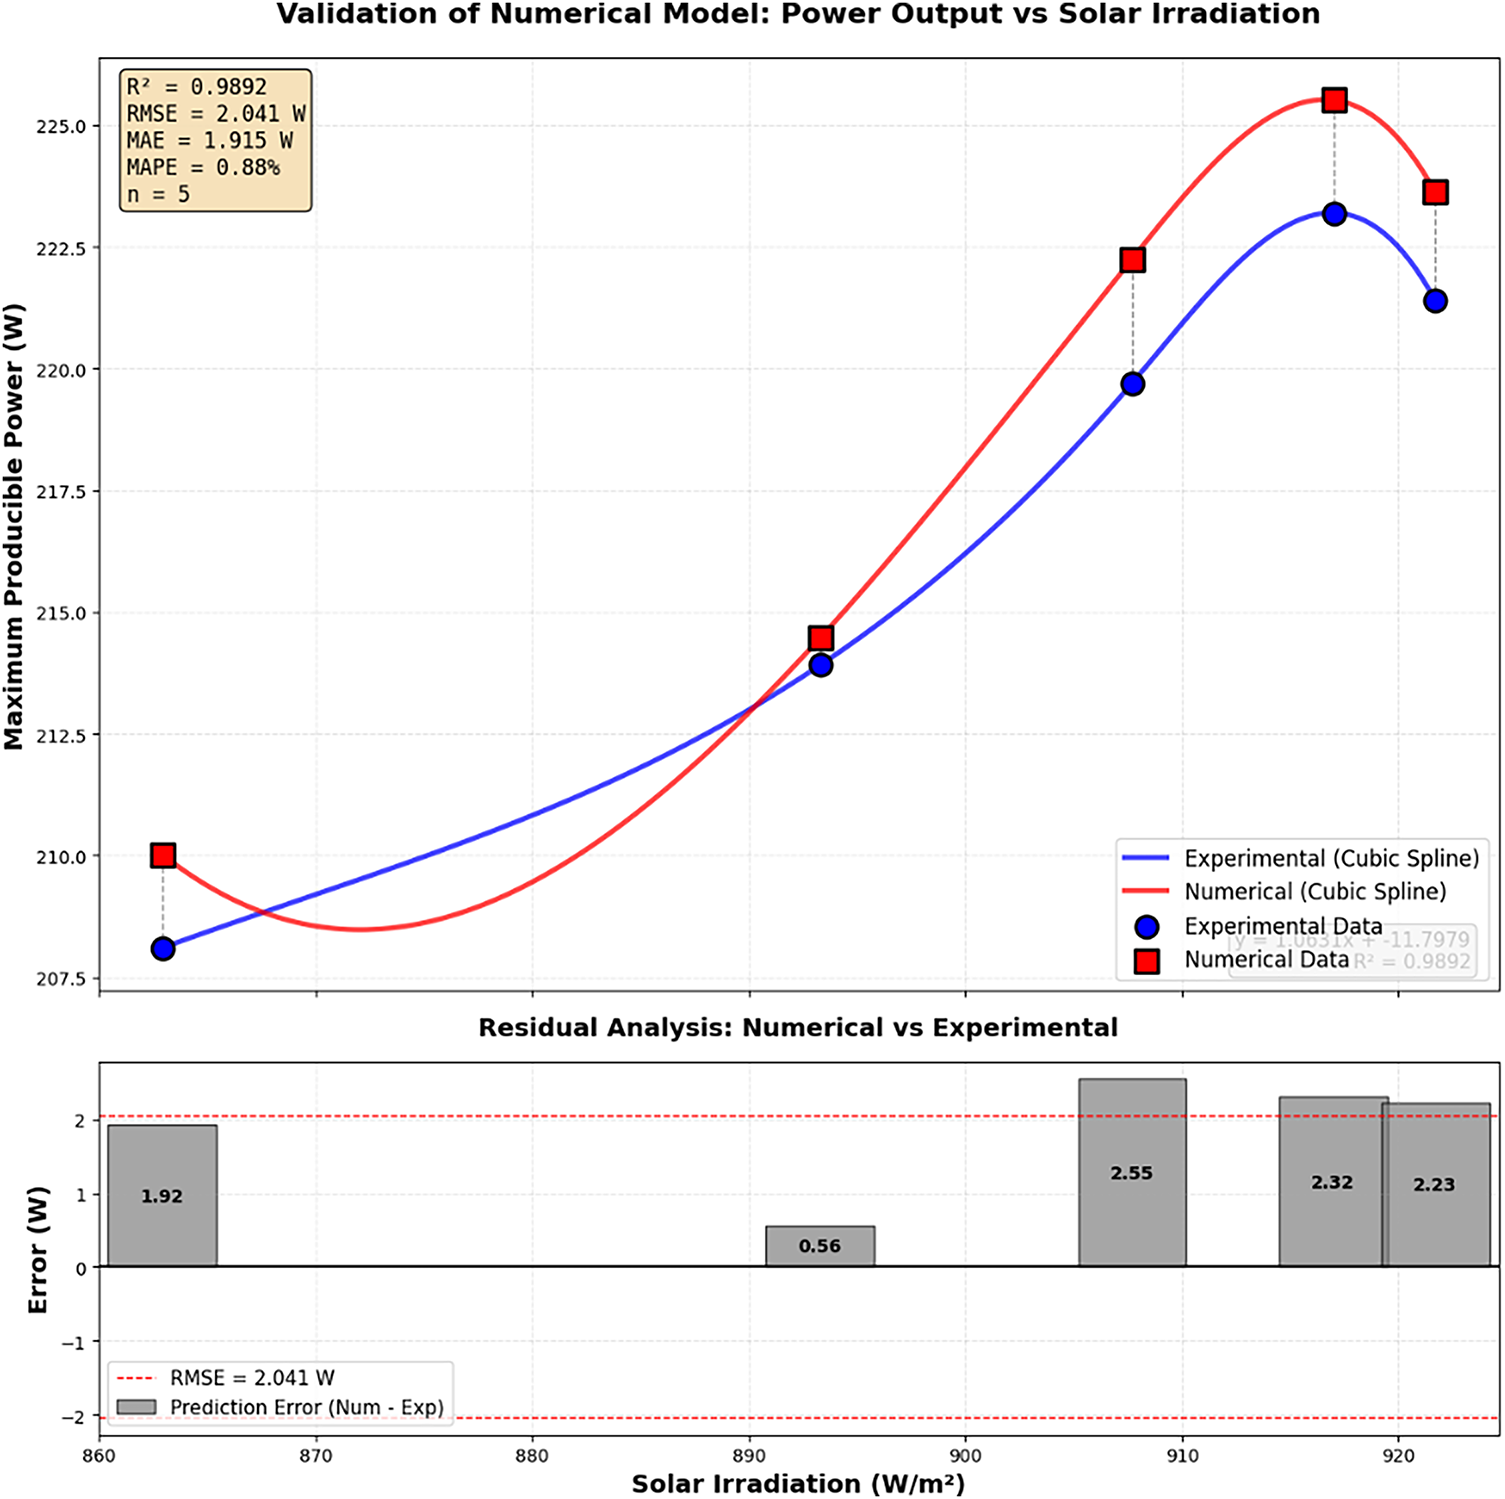
Figure 6: Electrical validation of the numerical model: Comparison of predicted power output with experimental data from Nishioka et al. [6].
3.3 Validation of the Developed Electrical Model
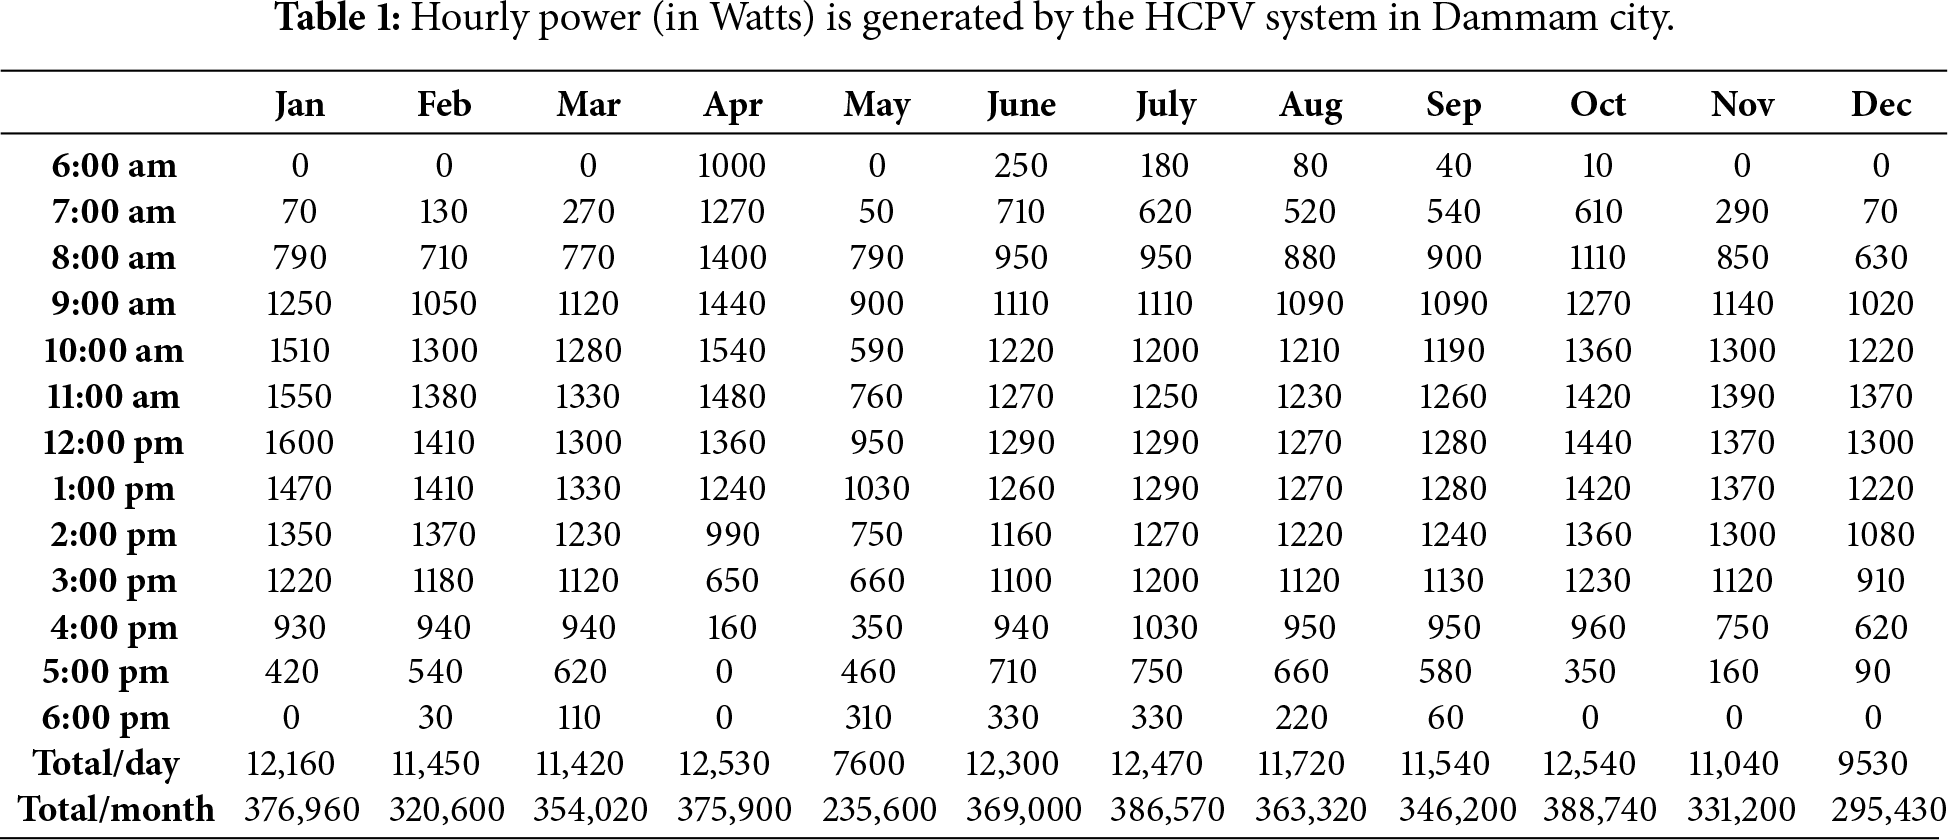
The hourly, daily and monthly power generated by the HCPV has been calculated analytically and recapitulated in Table 1.
A comparison of the generated power estimated analytically and by using the software SAM is displayed in Fig. 7. The comparison showed that the values calculated analytically are very close to those estimated by using the software SAM for all months except the month of May.
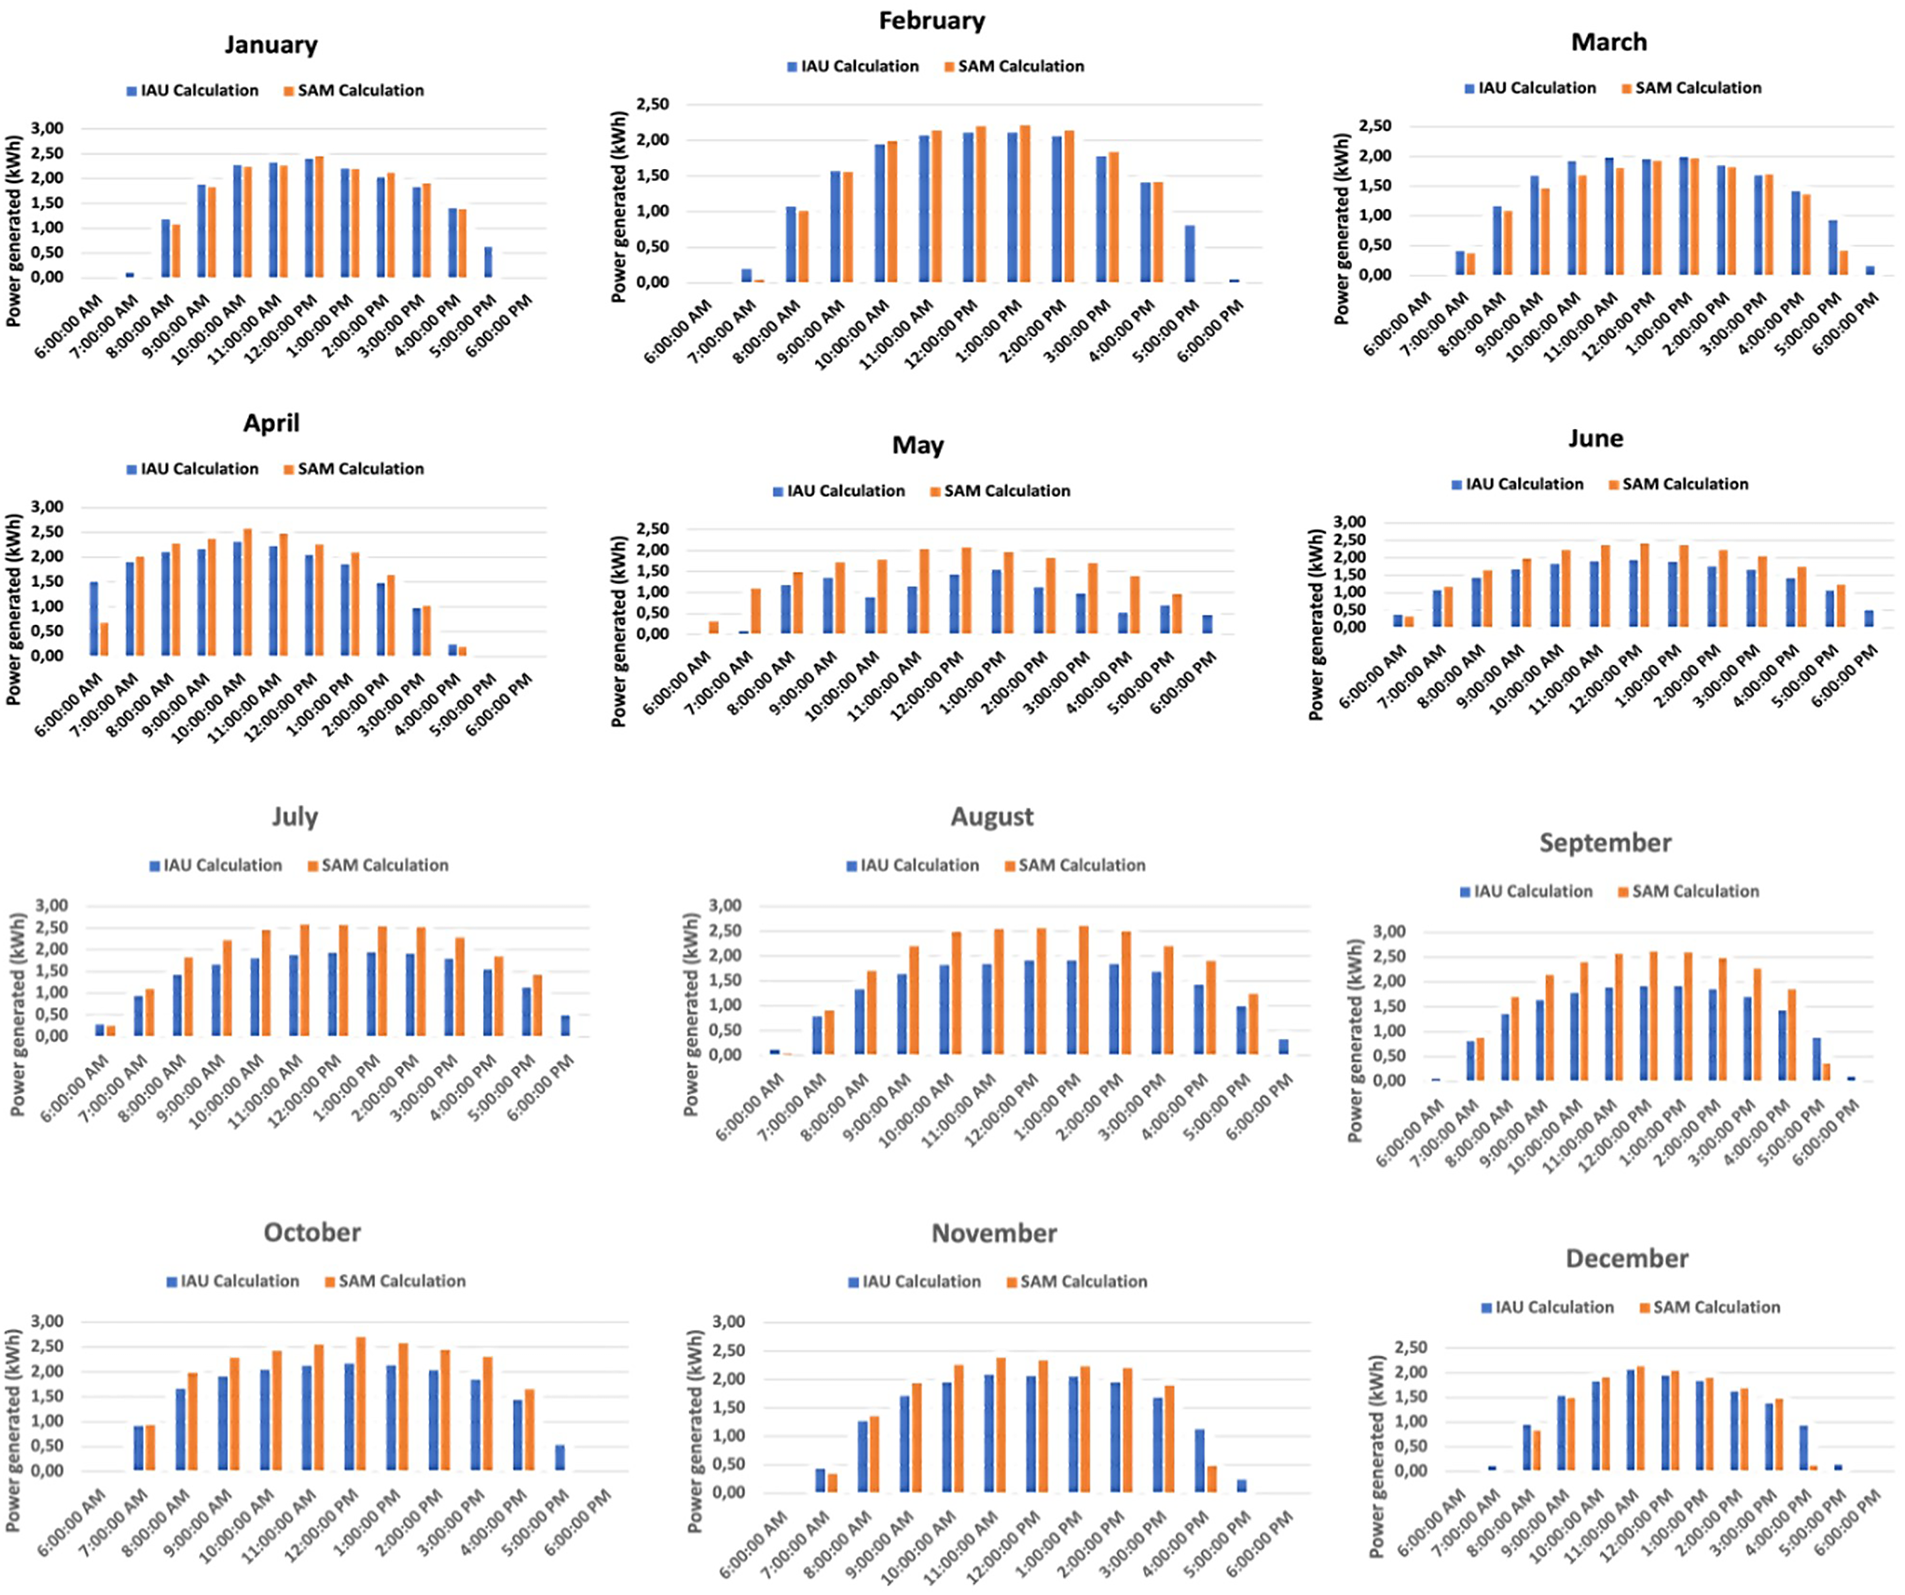
Figure 7: Comparison between the numerical and analytical generated output power of the HCPV.
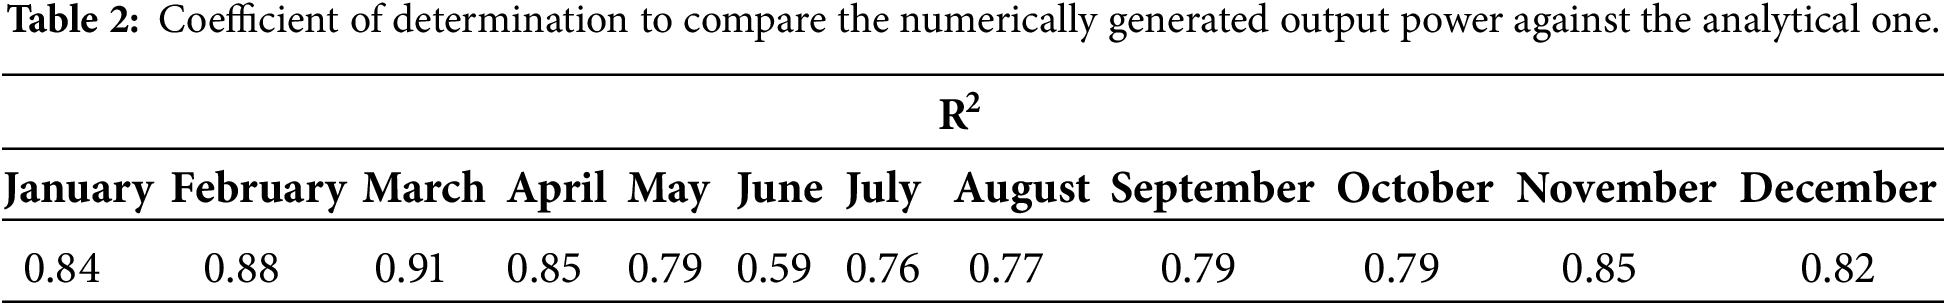
A comparison between the generated power by HCPV estimated analytically and by using the software SAM using the coefficient of determination, R2, is shown in Table 2 for the twelve months. The lowest value of R2 is equal to 59% in the month of June, while the highest Root Mean Square error is obtained in the month of February.
To analyse and evaluate the thermal and electrical performance two HCPV are used, the enhanced IAU Module and the Conventional Arzon HCPV. This section evaluates the thermal and electrical performance.
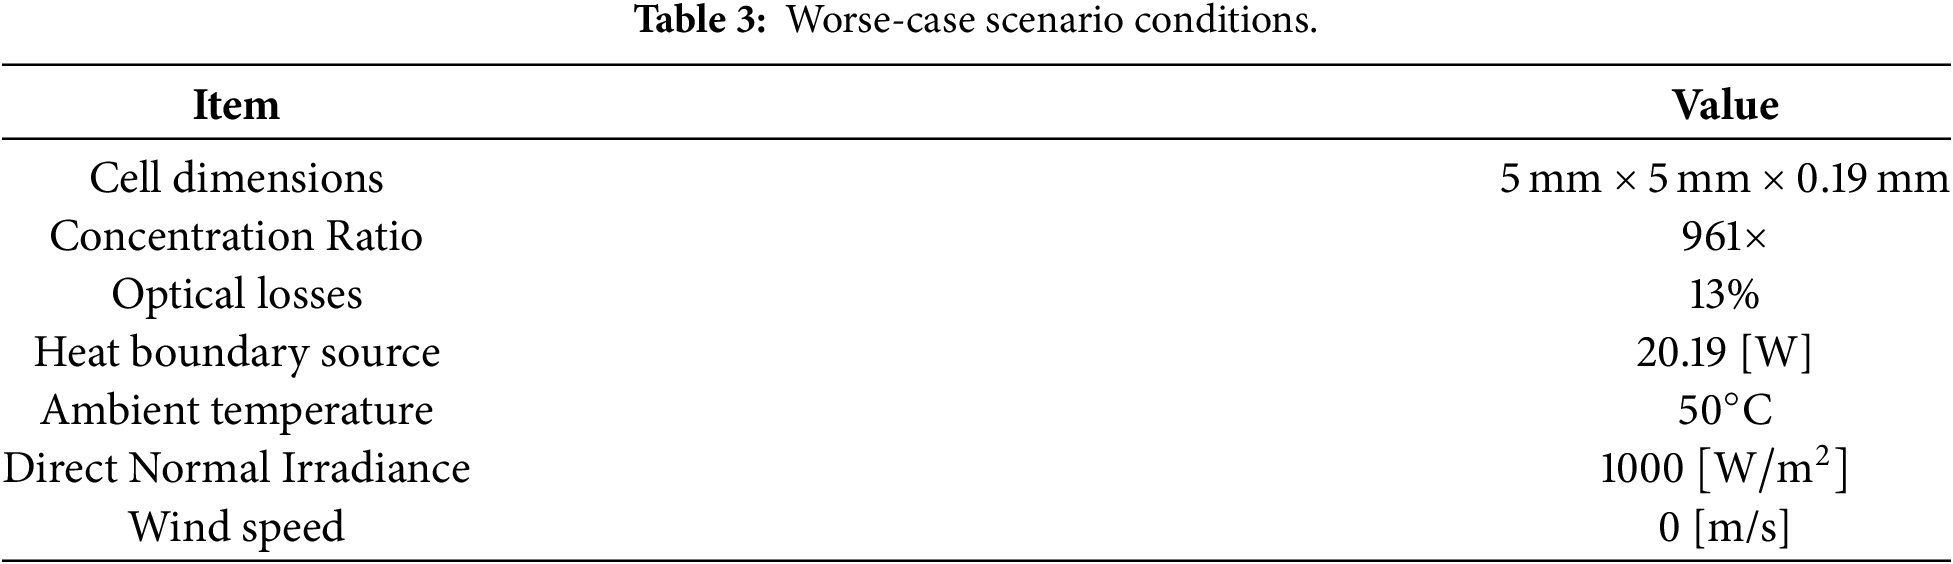
Performance under the Worst-Case Scenario
The conventional/original design of the HCPV module, uM2, manufactured by Arzon Solar company, is tested under the worst-case operational scenario. The geometry of the commercially available (uM2) was built-in COMSOL Multiphysics software® version 6.2. The maximum cell temperature and the uniformity of the solar cell will be performed under the worst-case operational scenario, assuming that only the optical losses have been considered, and the entire input Sun power is converted into heat. Table 3 shows the worse-case scenario condition.
The experimental set-up of the enhanced HCPV in the installation location and an upper view of a single enhanced HCPV module are presented in Fig. 8.
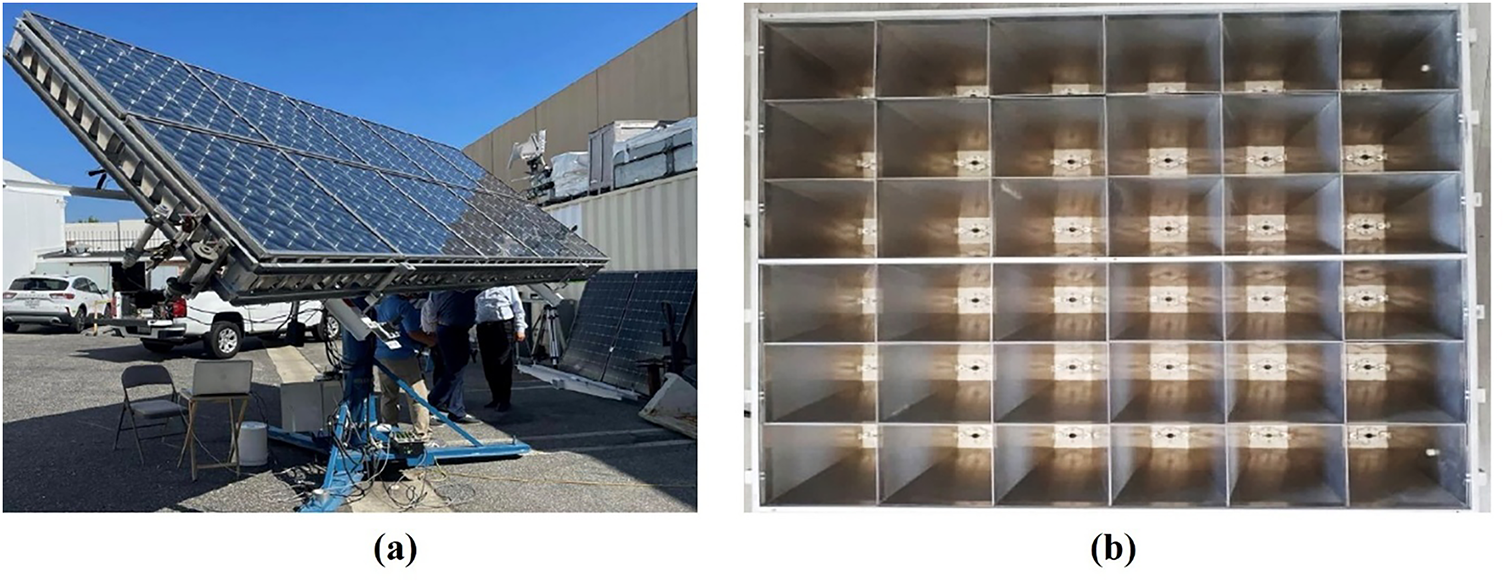
Figure 8: (a) Experimental set-up of the enhanced HCPV system, (b) Upper view of a single enhanced HCPV module.
A schematic view of a sub-unit of the enhanced HCPV module with views of the cross-sectional and upper part is presented in Fig. 9.
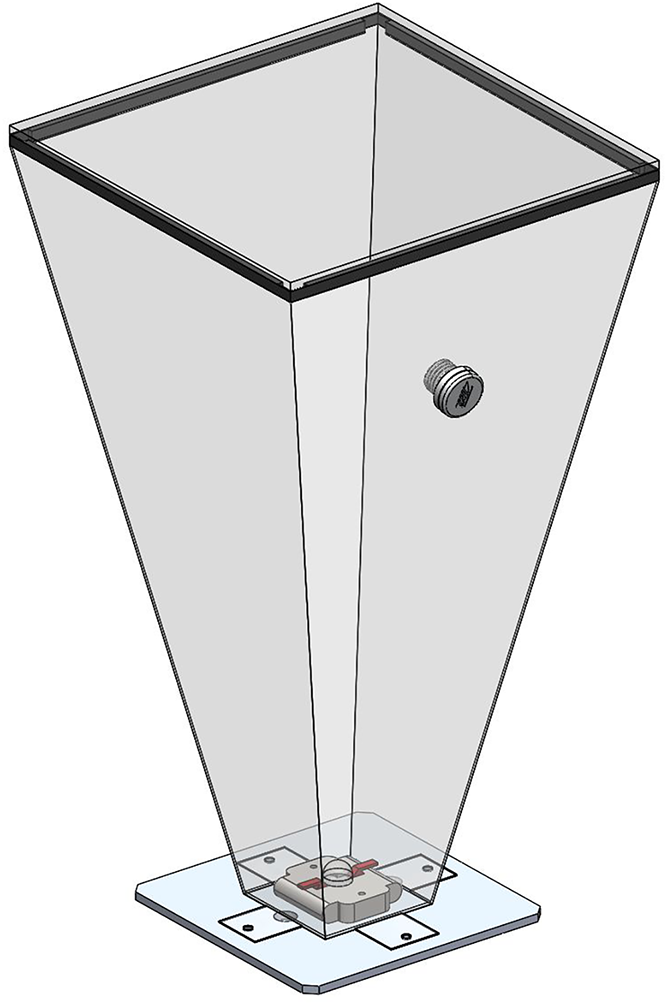
Figure 9: Schematic view of a sub-unit of the enhanced HCPV module.
A schematic presentation of the cell package is displayed in Fig. 10, and a real picture of the solar cell package is depicted in Fig. 11.
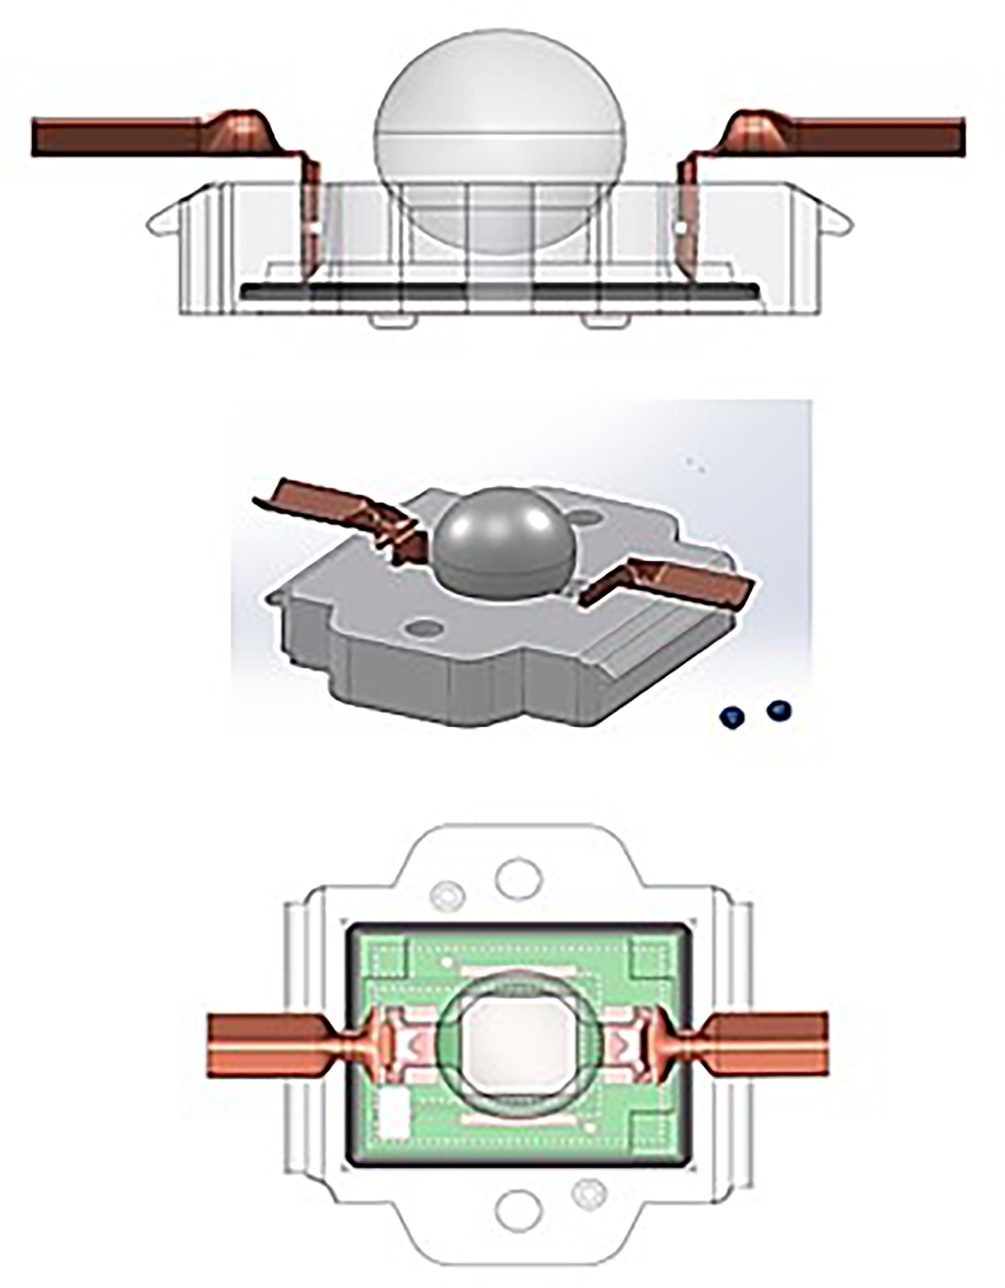
Figure 10: Schematic views of the cell package.
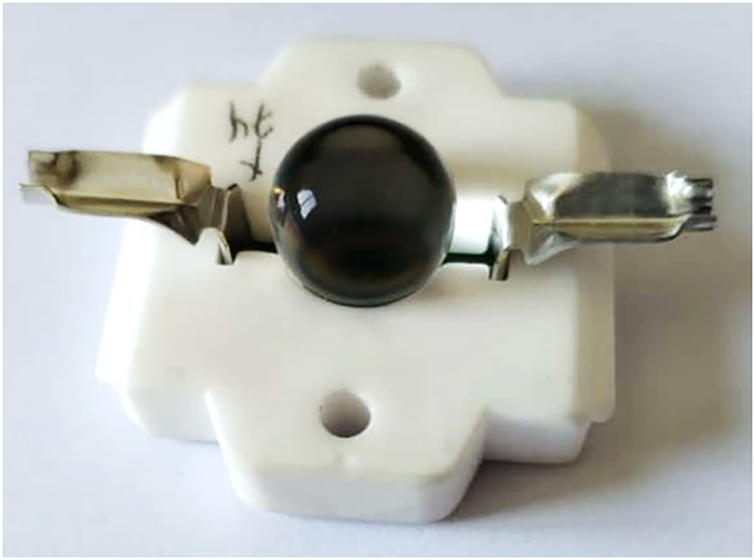
Figure 11: Experimental structure of the cell package.
Fig. 12 demonstrates in detail the different mechanical and optical parts of a sub-unit of the enhanced HCPV module, as well as the five layers underneath the solar cell (on the right-hand side). Within the thermal load, the model was investigated with a parametric sweep for the ambient temperature at
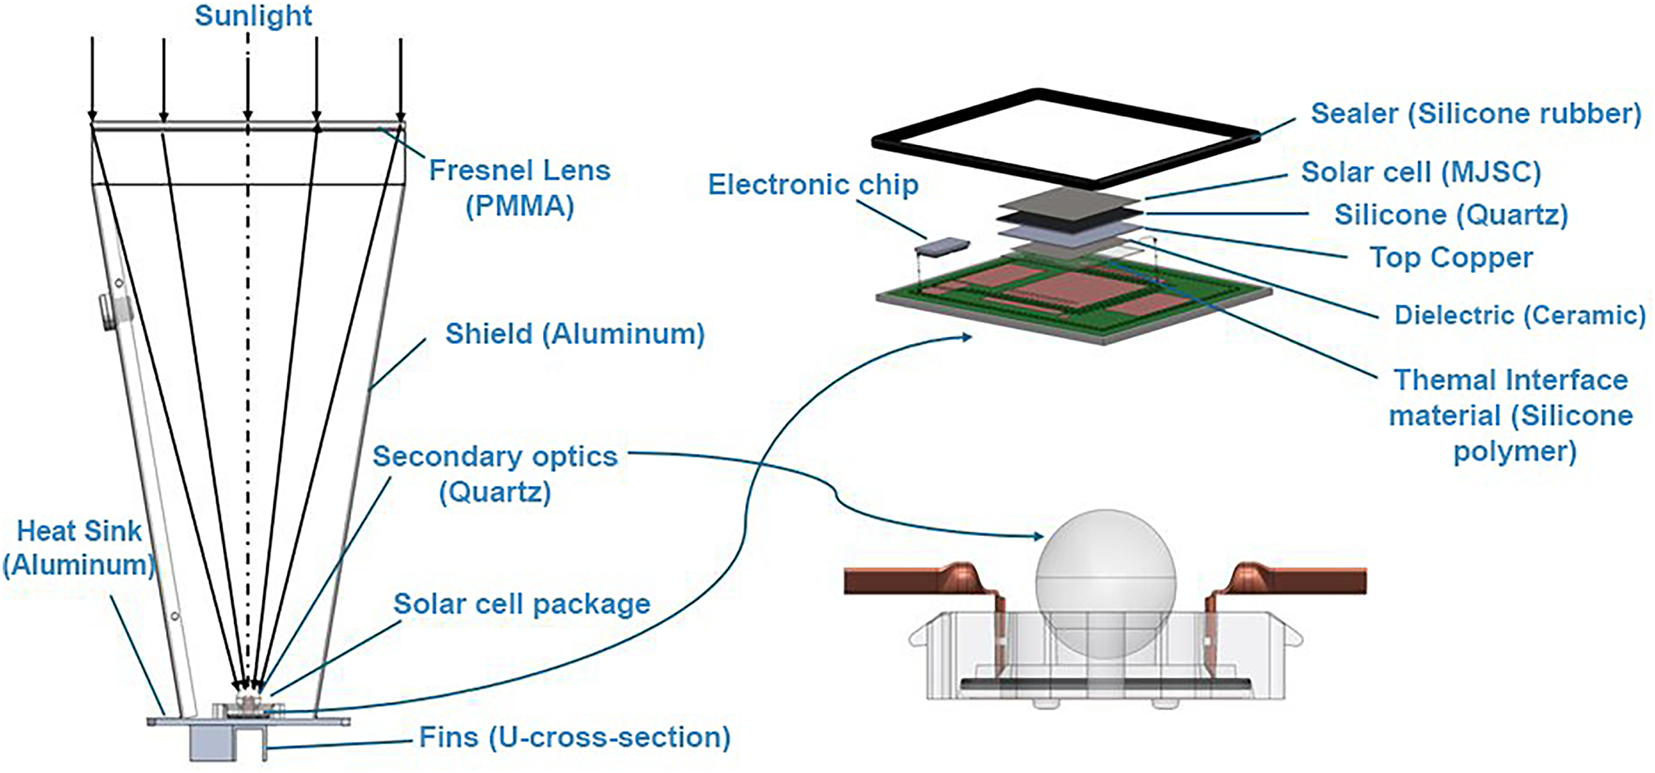
Figure 12: Sub-assembly of the receiver and the different layers underneath the cell.
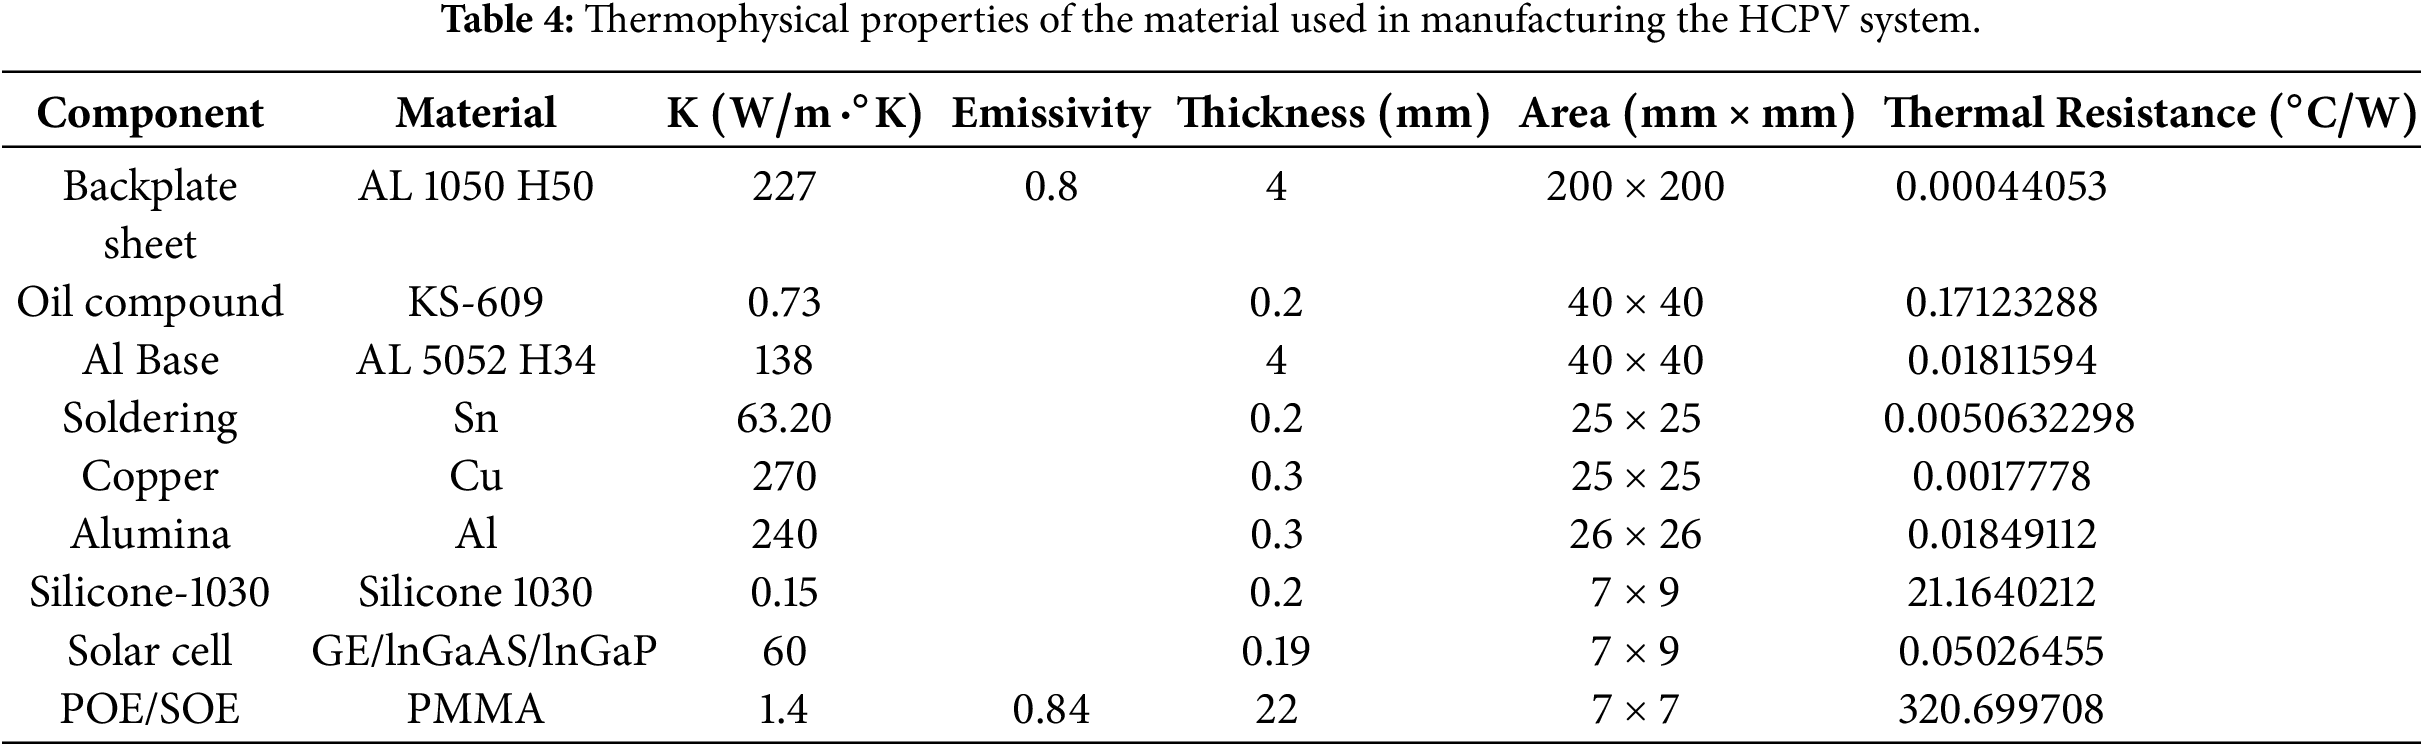
Table 4 lists the different dimensions and material properties, including the overall thermal resistance, of each internal sub-layer integrated under the cell.
This integrated approach reduces the peak cell temperature by 16°C, directly enhancing electrical efficiency via the temperature coefficient
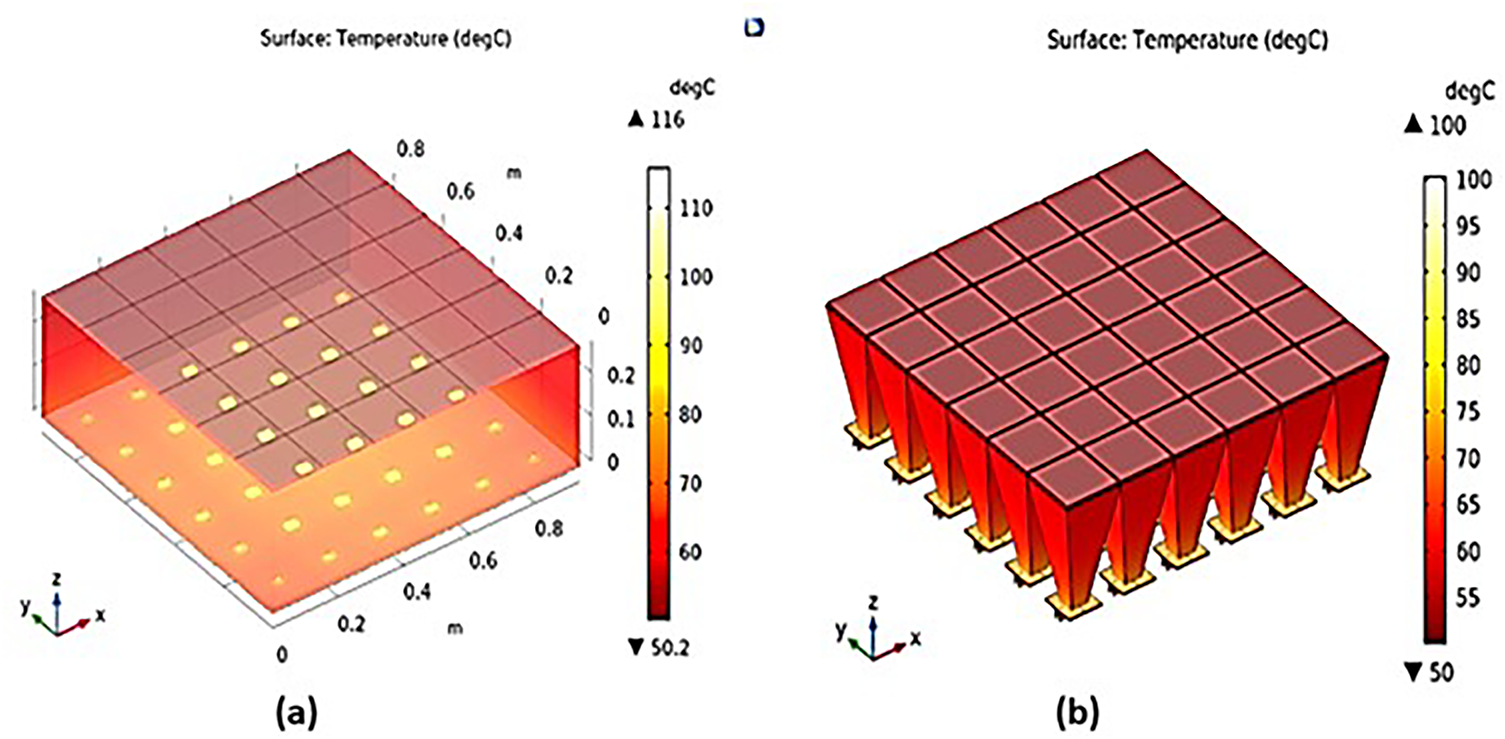
Figure 13: 3D temperature distribution illustrating enhanced convective cooling in the modified HCPV module (b) compared to conventional design (a).
Fig. 14 illustrates the steady-state axial temperature distribution along the heat-flow path (Z-direction) for HCPV designs under free-stream convection. The conventional module shows a steep thermal gradient, with a sharp temperature drop across high-resistance layers such as the silicone-1030 adhesive and POE/SOE optical layer. This results in elevated cell temperatures under concentrated irradiance. The enhanced module, however, demonstrates a flatter axial gradient and lower cell temperature, corresponding to the ~16°C reduction observed in Fig. 13. This improvement is attributed to the open architecture, which improves convective cooling at the heat-sink interface, thereby reducing the effective thermal resistance experienced by each cell. The flatter profile indicates more efficient heat extraction, contributing directly to higher photovoltaic efficiency and reduced thermomechanical stress.
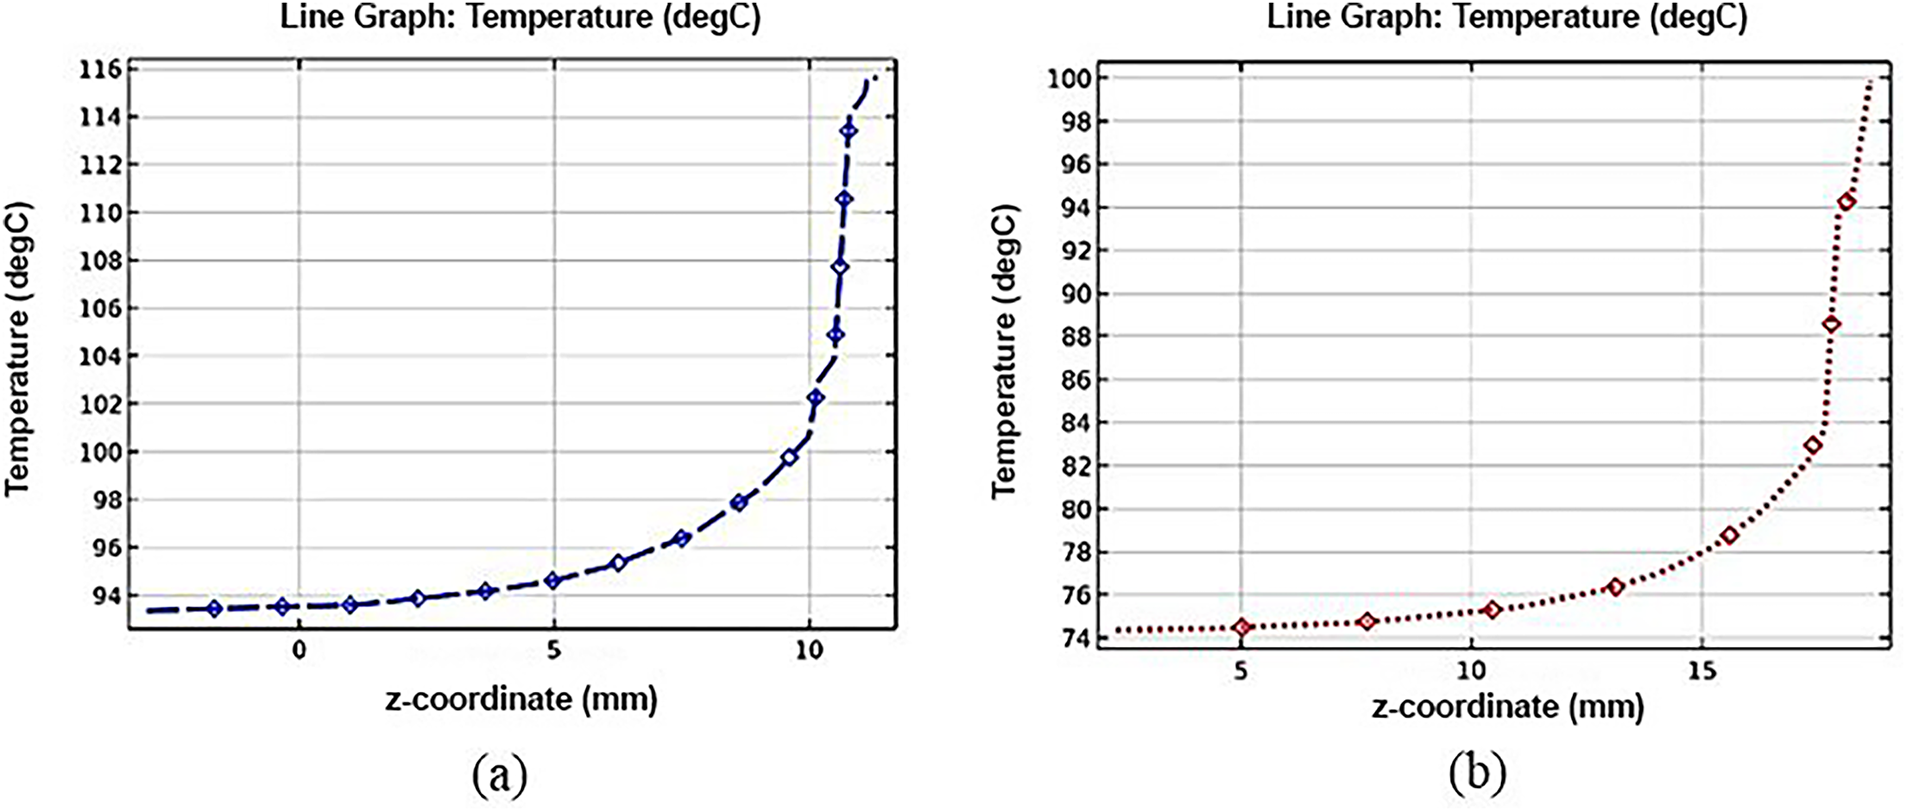
Figure 14: Axial temperature profiles vs. depth (Z-direction) for (a) conventional and (b) enhanced HCPV designs.
The 40% reduction in total thermal resistance (from
Fig. 15 presents cross-sectional temperature contours for the conventional (Fig. 15A) and enhanced (Fig. 15B) HCPV modules under free-stream convection. The conventional design exhibits a concentrated high-temperature region (up to ~116°C) near the cell plane, with steep lateral gradients indicating limited in-plane heat spreading and inefficient convective cooling. In contrast, the enhanced module shows a markedly lower thermal load, with a maximum temperature of approximately 100°C and more uniform temperature distribution across the cross-section. This improvement results from the open conical-unit architecture, which not only enhances vertical heat extraction but also promotes lateral heat spreading by allowing ambient airflow to penetrate the module structure. The reduced thermal gradients and lower peak temperature confirm that the enhanced design effectively mitigates localized heating, thereby lowering thermomechanical stress and improving the reliability of the module under high-flux conditions.
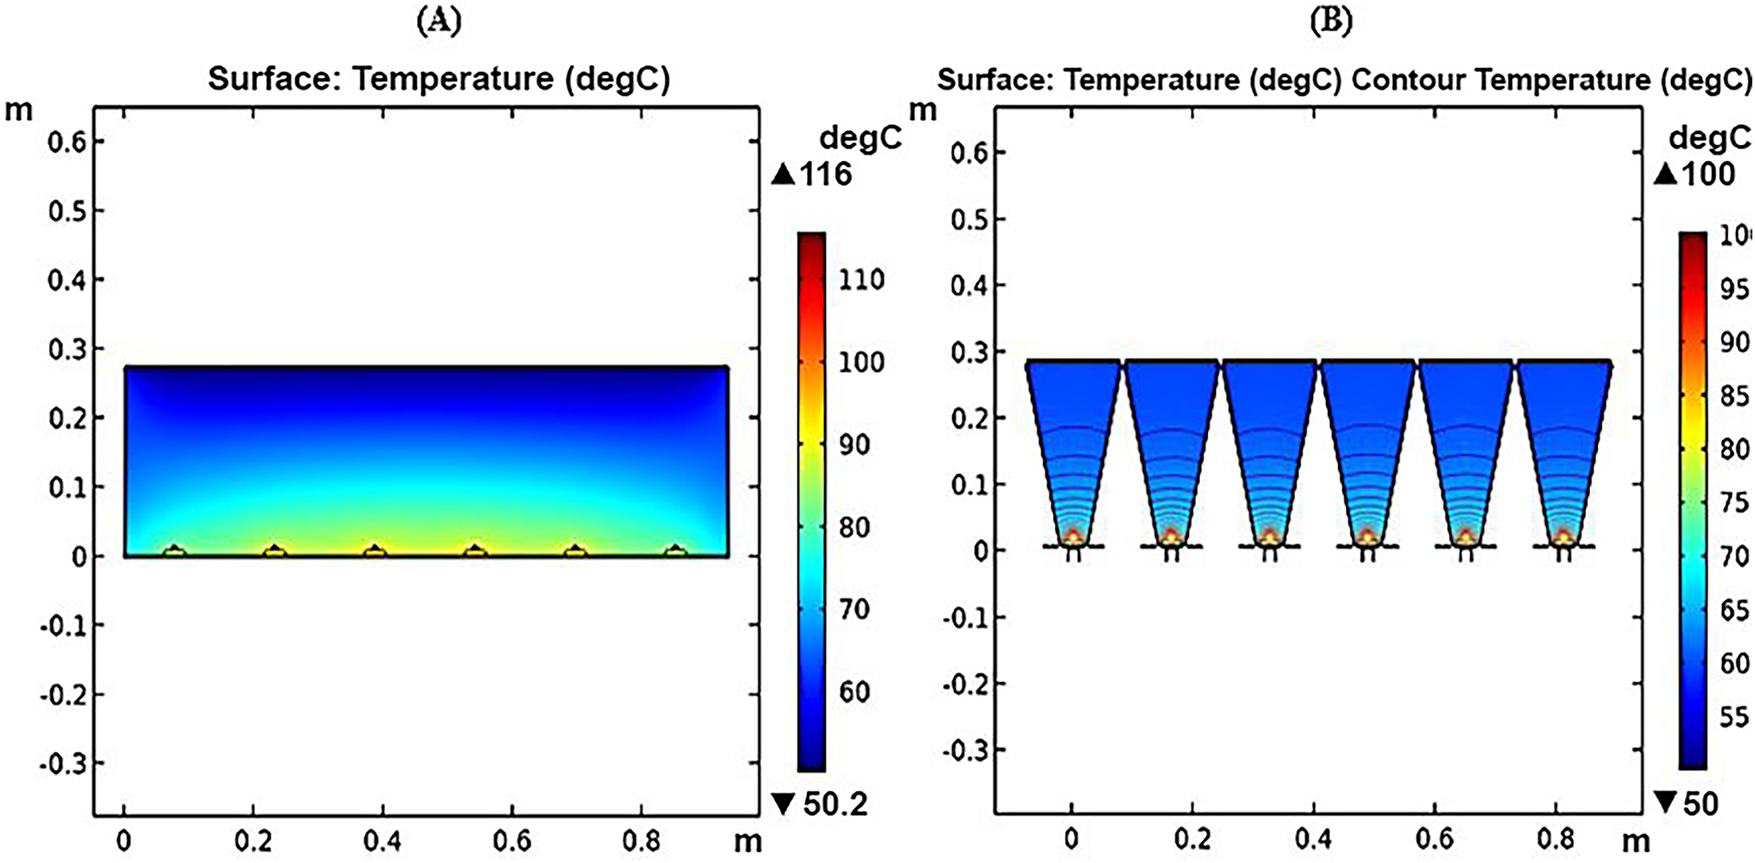
Figure 15: Cross-sectional temperature contours highlighting improved heat spreading (A) and lower thermal load in the enhanced design (B).
Fig. 16 compares the in-plane temperature distribution at the solar cell mid-plane for conventional and enhanced HCPV modules under free-stream convection. The conventional design exhibits a sharp, concentrated hotspot with a peak temperature approximately 16°C higher than that of the enhanced design, accompanied by abrupt lateral temperature gradients that indicate poor heat spreading and localized thermal stress. In contrast, the enhanced module demonstrates a markedly more uniform temperature profile, with a gradual radial decay from the center outward and a wider, more evenly distributed contour pattern. This improvement reflects the superior lateral heat spreading enabled by the open conical-unit architecture, which facilitates enhanced convective cooling and reduces thermal cross-talk between adjacent cells. The more equitable contour spread confirms effective hotspot mitigation and underscores the role of aerodynamic module design in achieving thermal uniformity, a critical factor for maintaining cell efficiency and longevity under high-flux operation.
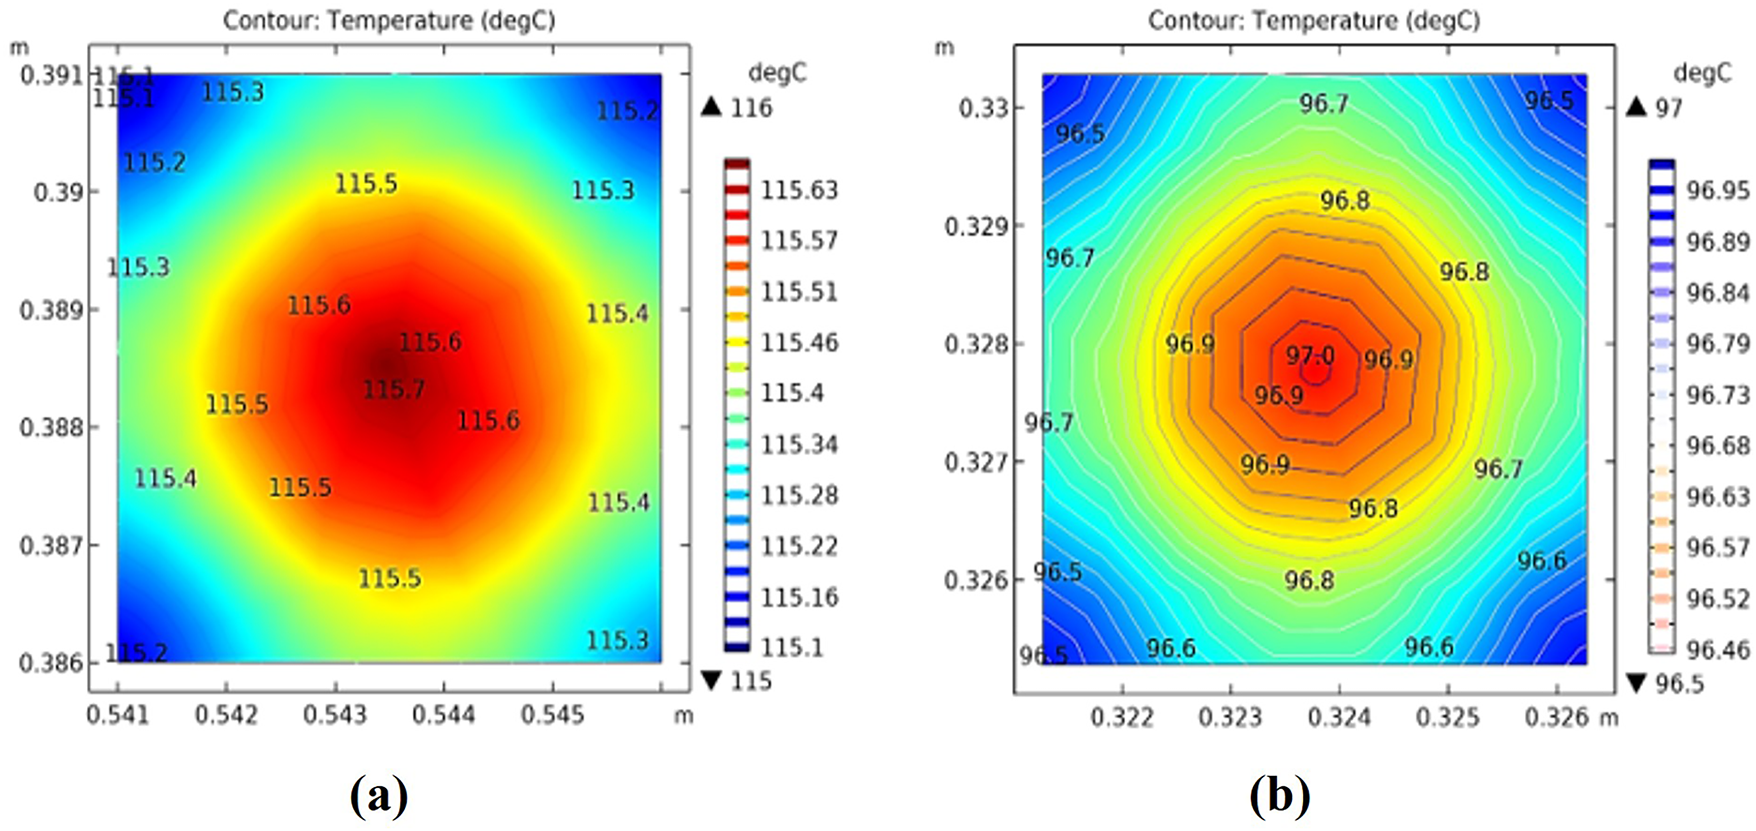
Figure 16: Surface temperature contours at the solar cell mid-plane, indicating superior thermal uniformity (A) and hotspot mitigation in the enhanced design (B).
Performance under the Concentrators Solar Test Conditions
The Concentrators Solar Test Conditions (CSTCs) are mentioned in Table 5.
Fig. 17 presents streamline visualizations of the velocity field around (Fig. 17A) conventional and (Fig. 17B) enhanced HCPV modules under free-stream convection. In the conventional enclosed design, airflow is largely deflected around the module exterior, with limited penetration into the internal structure, resulting in stagnant zones and reduced convective heat transfer along the cell plane. In contrast, the enhanced open-architecture module promotes organized, channeled flow through the conical-unit array, as evidenced by the concentrated and coherent streamlines wrapping each subunit. This flow structuring indicates enhanced fluid-structure interaction, which increases the convective heat transfer coefficient (
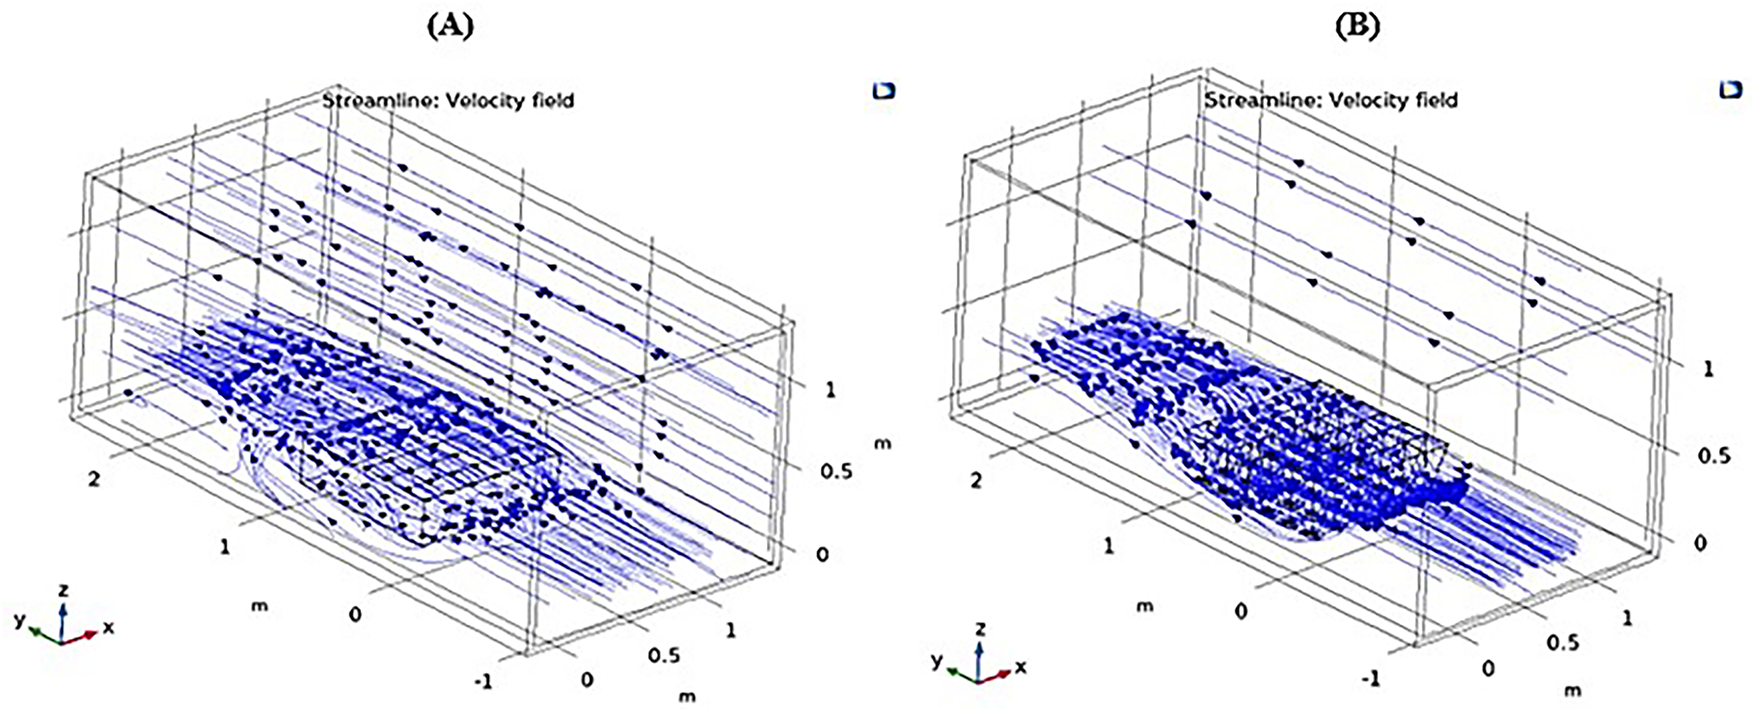
Figure 17: Streamline visualization of airflow around conventional (A) and enhanced HCPV (B) modules.
Fig. 18 quantifies the velocity magnitude fields and streamline topologies for both HCPV configurations; conventional (Fig. 18A) and Enhanced (Fig. 18B) design under free-stream convection. The conventional design induces pronounced flow separation, creating distinct high-velocity shear layers alongside recirculating low-momentum zones resulting in spatially uneven convective coefficients. Conversely, the enhanced geometry promotes attached, aerodynamically stable flow characterized by a homogeneous velocity distribution and streamlined penetration through the module’s open lattice. This flow structuring minimizes hydrodynamic stagnation and enhances momentum transport to critical thermal interfaces, ensuring uniform convective heat removal. The observed aerodynamic uniformity substantiates the module’s improved thermal homogeneity and highlights the efficacy of passive flow guidance as a scalable strategy for thermal management in high-flux photovoltaic applications.
Figure 18: Velocity magnitude fields and streamline topologies for both HCPV configurations: conventional (A) and Enhanced (B) design.
The observed improvement in convective cooling for the enhanced HCPV module can be attributed to three fundamental aerodynamic and geometric mechanisms inherent to the open conical-unit design. First, the protruding conical fins actively disrupt the formation of thick thermal boundary layers along the heat sink surfaces. This disruption promotes turbulent mixing and frequent renewal of cooler ambient air at the solid-fluid interface, thereby enhancing the local convective heat transfer coefficient (
A 3D temperature distribution and a cross-sectional temperature from around solar cells are displayed in Fig. 19.
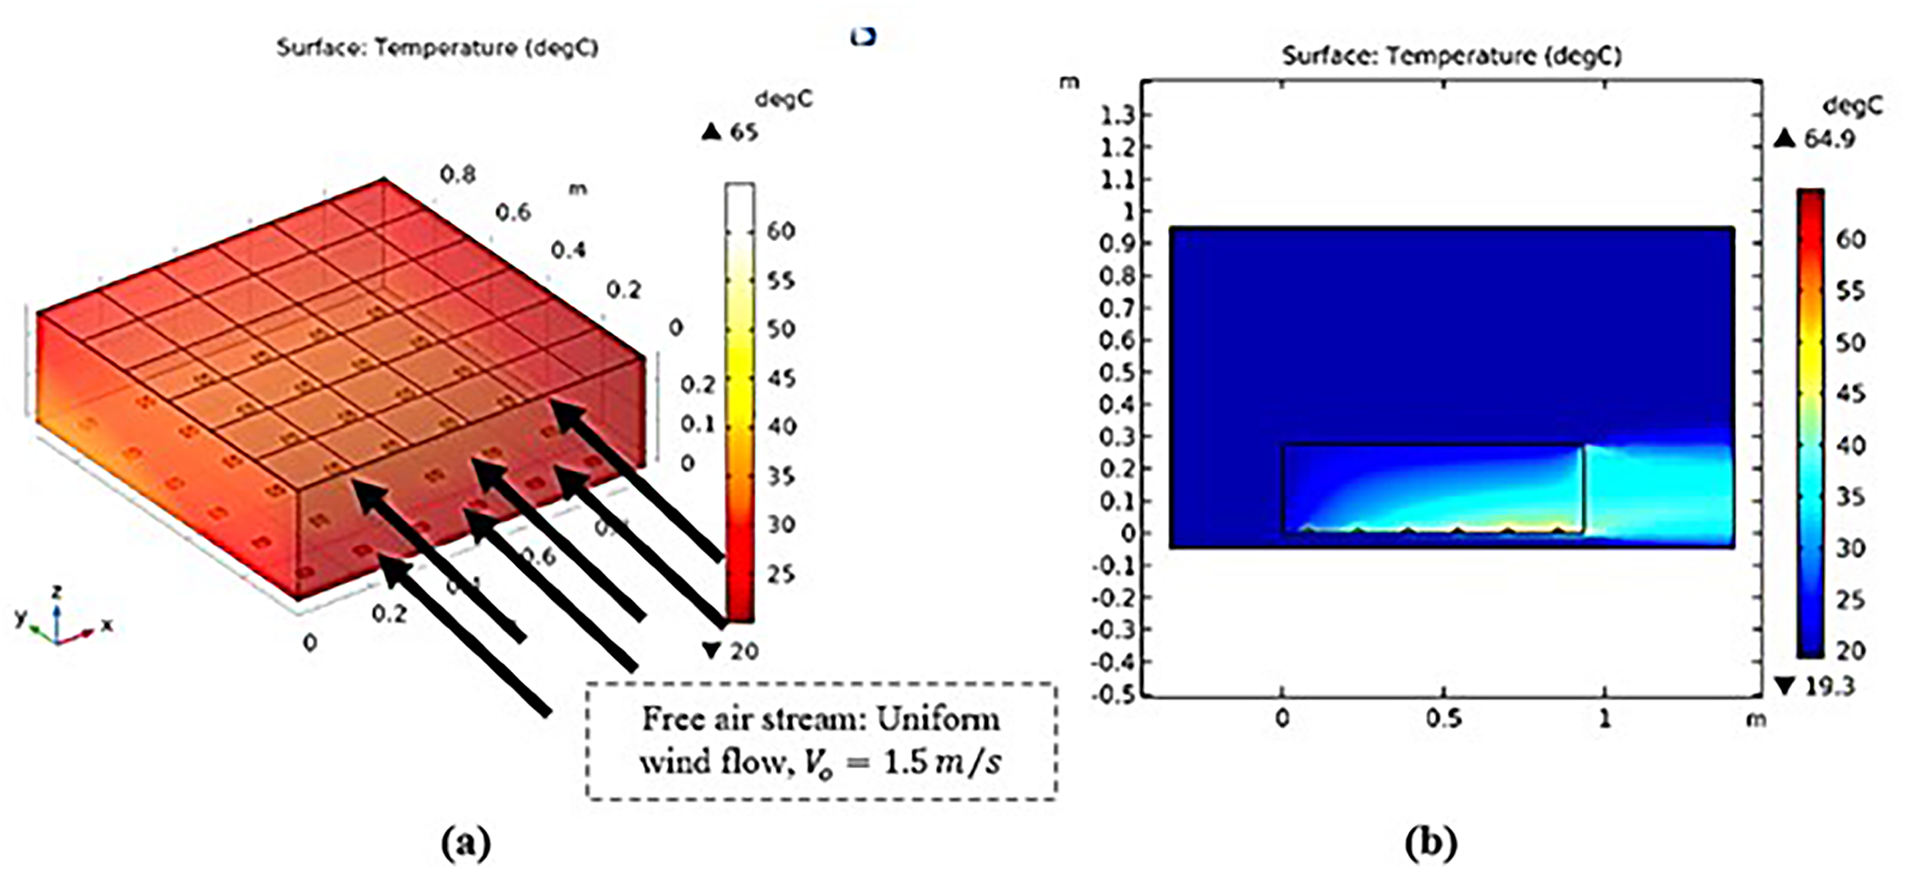
Figure 19: Thermal performance under CSTC: (a) Volumetric temperature distribution and (b) cross-sectional thermal profile illustrating effective cell cooling.
A color-coded temperature map at the top Fresnel array and at the back plate sheet of the HCPV module is shown in Fig. 20.
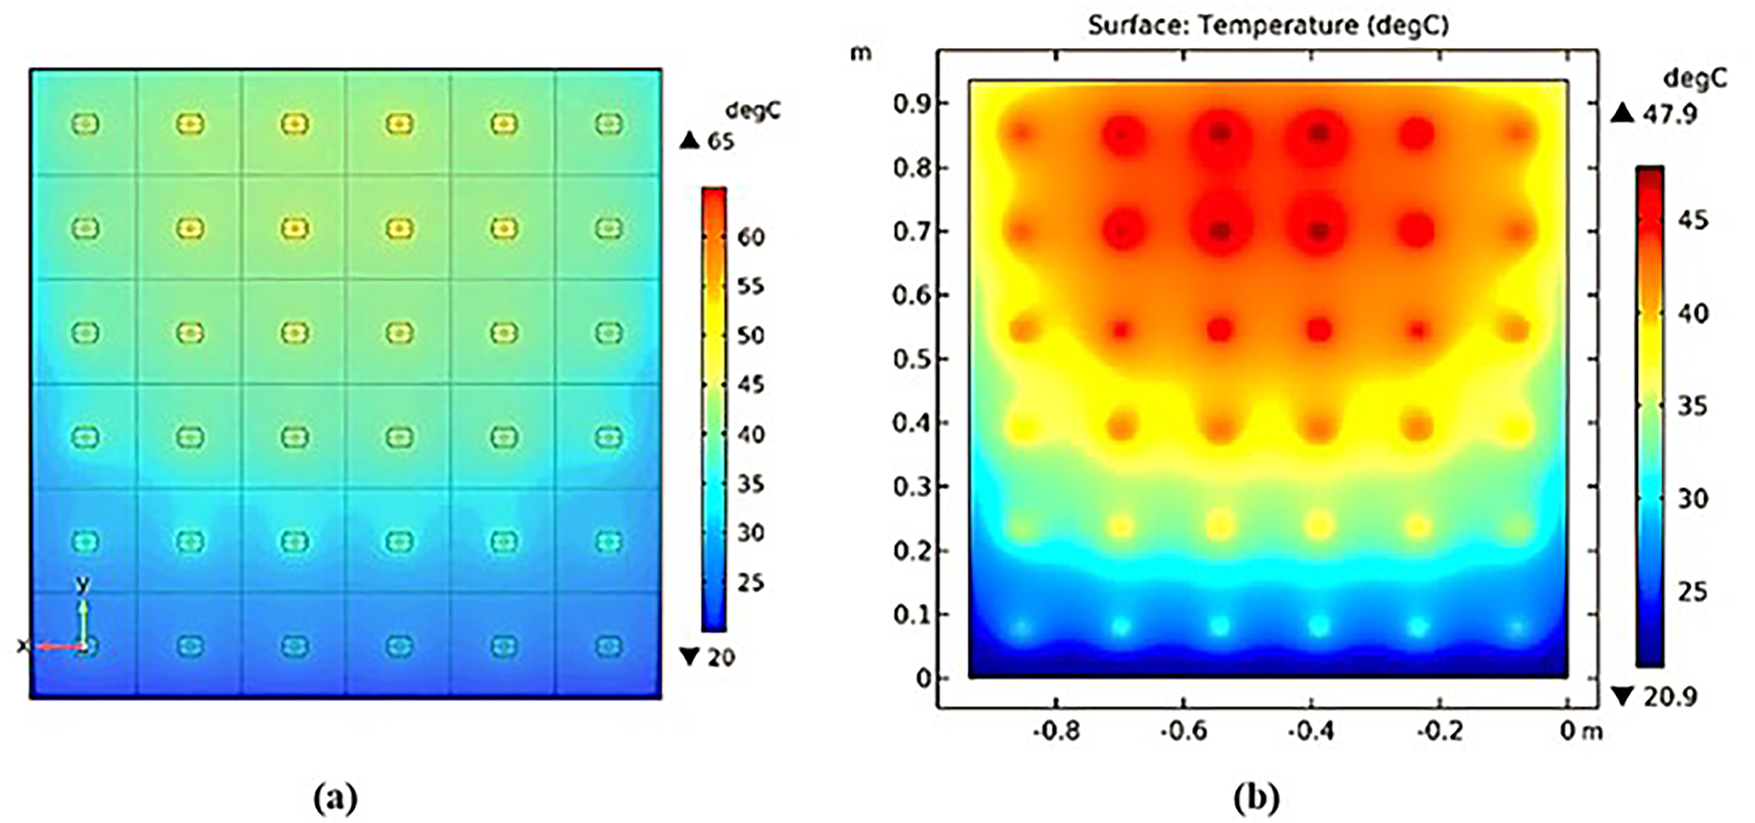
Figure 20: Thermal mapping of external surfaces: (a) Primary optics and (b) rear heat sink plate, showing effective waste heat rejection.
Fig. 21 demonstrates the uniformity of the subjected solar fluxes upon the solar cell, yielding uniform cell temperature distribution and minimum temperature gradient magnitude over the solar cells (in ∘C/m). A maximum of 0.31°C was recorded as a range of temperature at the mid-cell of the conventional HCPV module (the difference between the maximum and minimum temperature over the cell.).
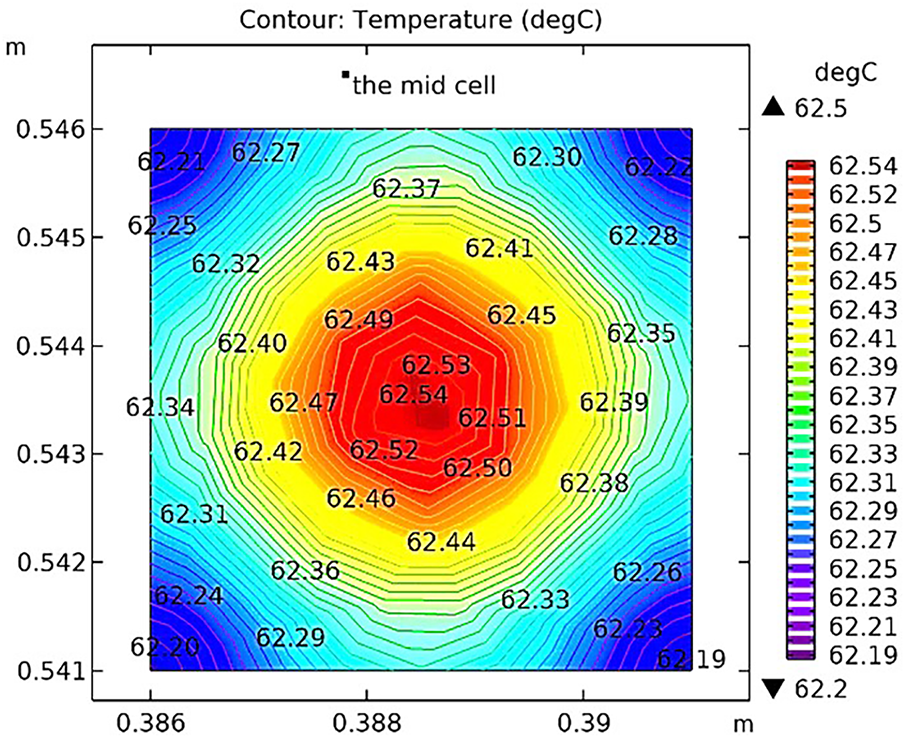
Figure 21: Temperature contours at the mid-cell of the conventional HCPV module.
Fig. 22 shows temperature contours of the top-right and top-left cells in the conventional (enclosed) HCPV module undern forced convection (1.5 m/s). Upstream cells (Fig. 22A,B) benefit from direct exposure to cooler incoming airflow, resulting in lower temperatures. Downstream cells (Fig. 22C,D) experience significantly higher temperatures due to airflow pre-heating, restricted recirculation, and limited convective mixing within the enclosed module cavity, even at an air velocity of 1.5 m/s. This persistent thermal gradient demonstrates the inadequate convective cooling performance of conventional enclosed HCPV designs under moderate forced airflow conditions.
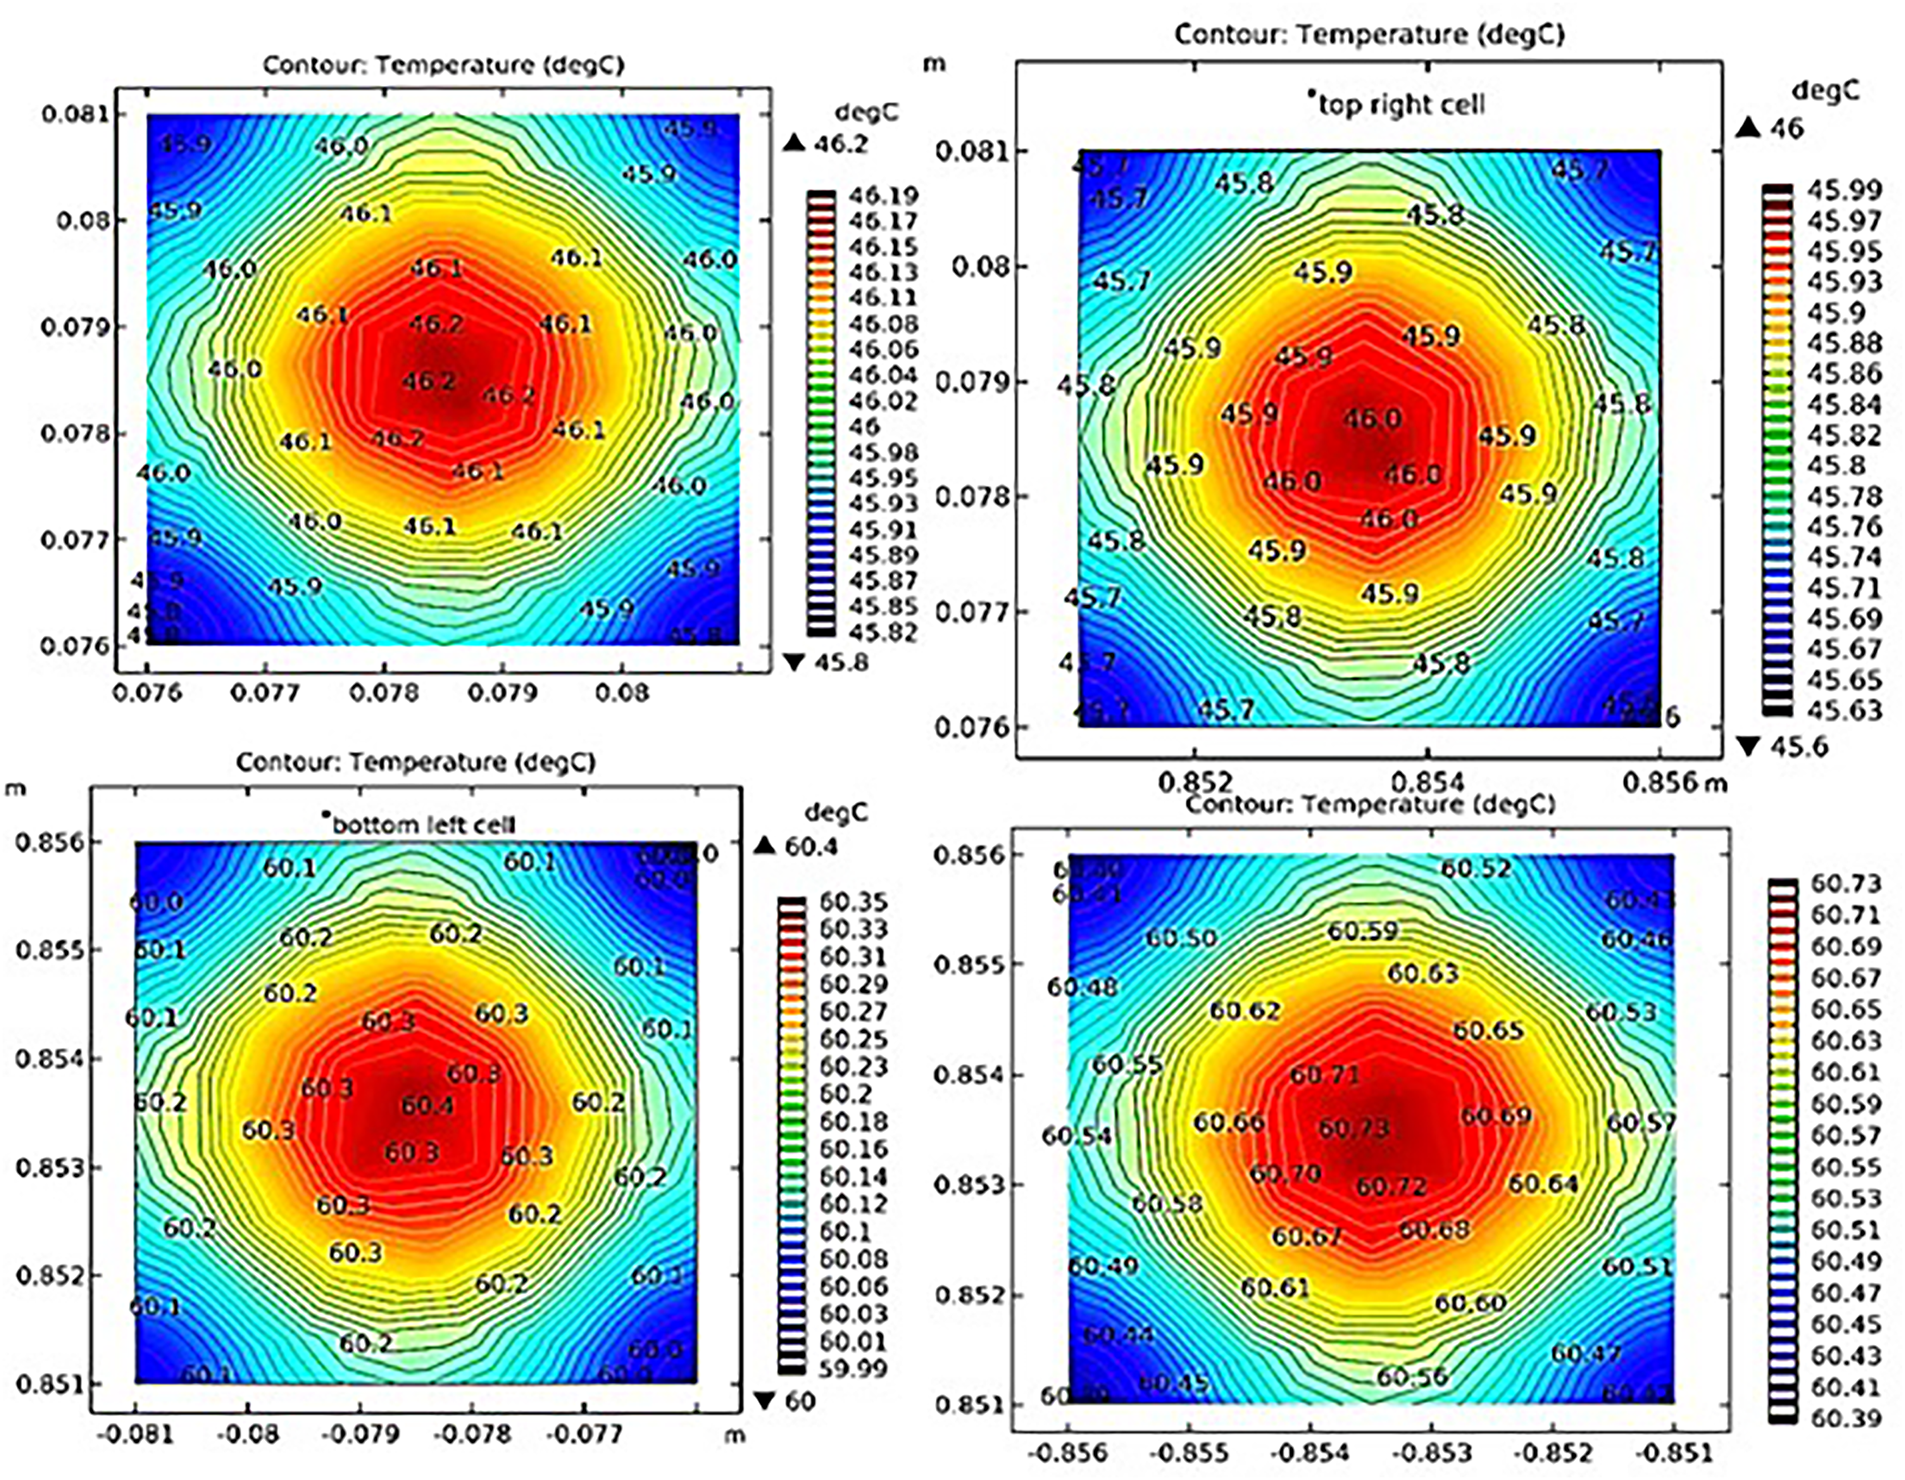
Figure 22: Temperature distribution in top cells of the conventional HCPV module under convective cooling: (A) top-left upstream cell, (B) top-right upstream cell, (C) bottom-left downstream cell, (D) bottom-right downstream cell.
Fig. 23 demonstrates that the enhanced module performs better under an external forced convection heat transfer mechanism. The temperature difference becomes bigger, jumping from
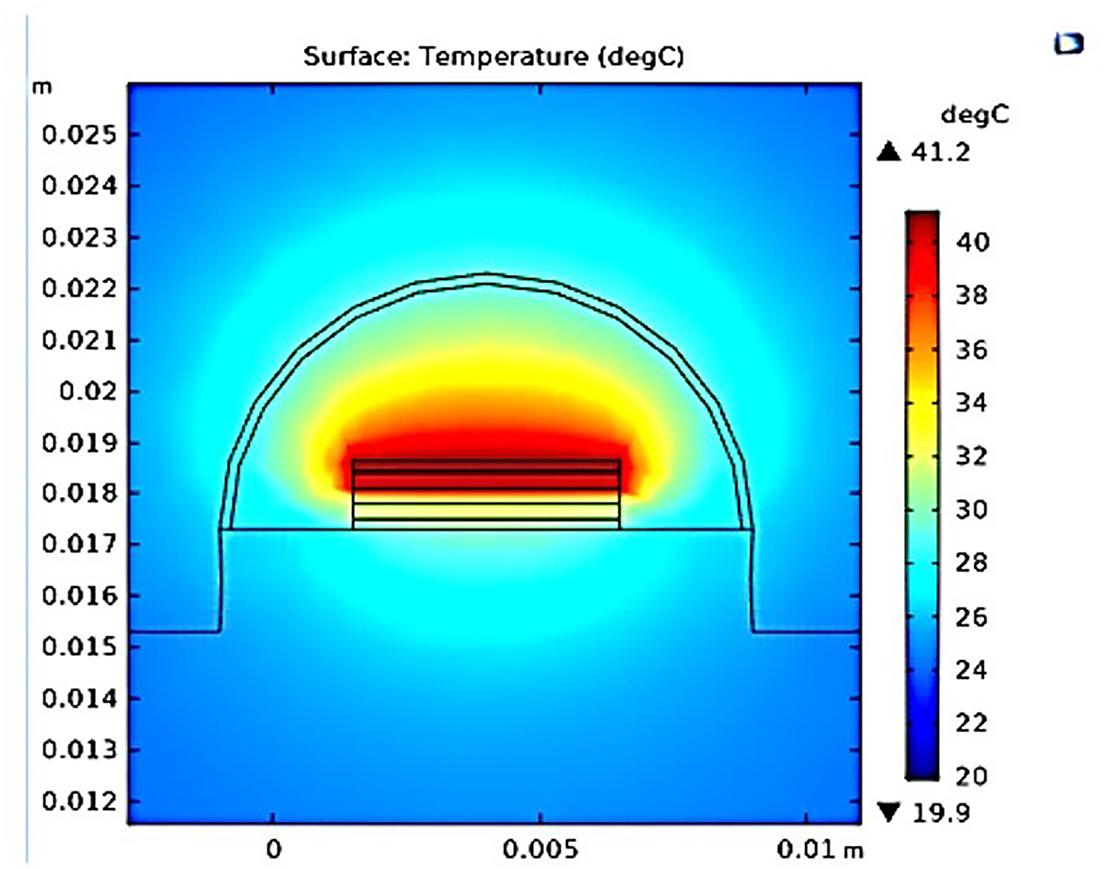
Figure 23: Cross-sectional profile of Temperature highlighting as
Fig. 24 presents cross-sectional temperature contours at the back plate sheet of a subunit receiver under operational conditions. The contours reveal a temperature drop of approximately
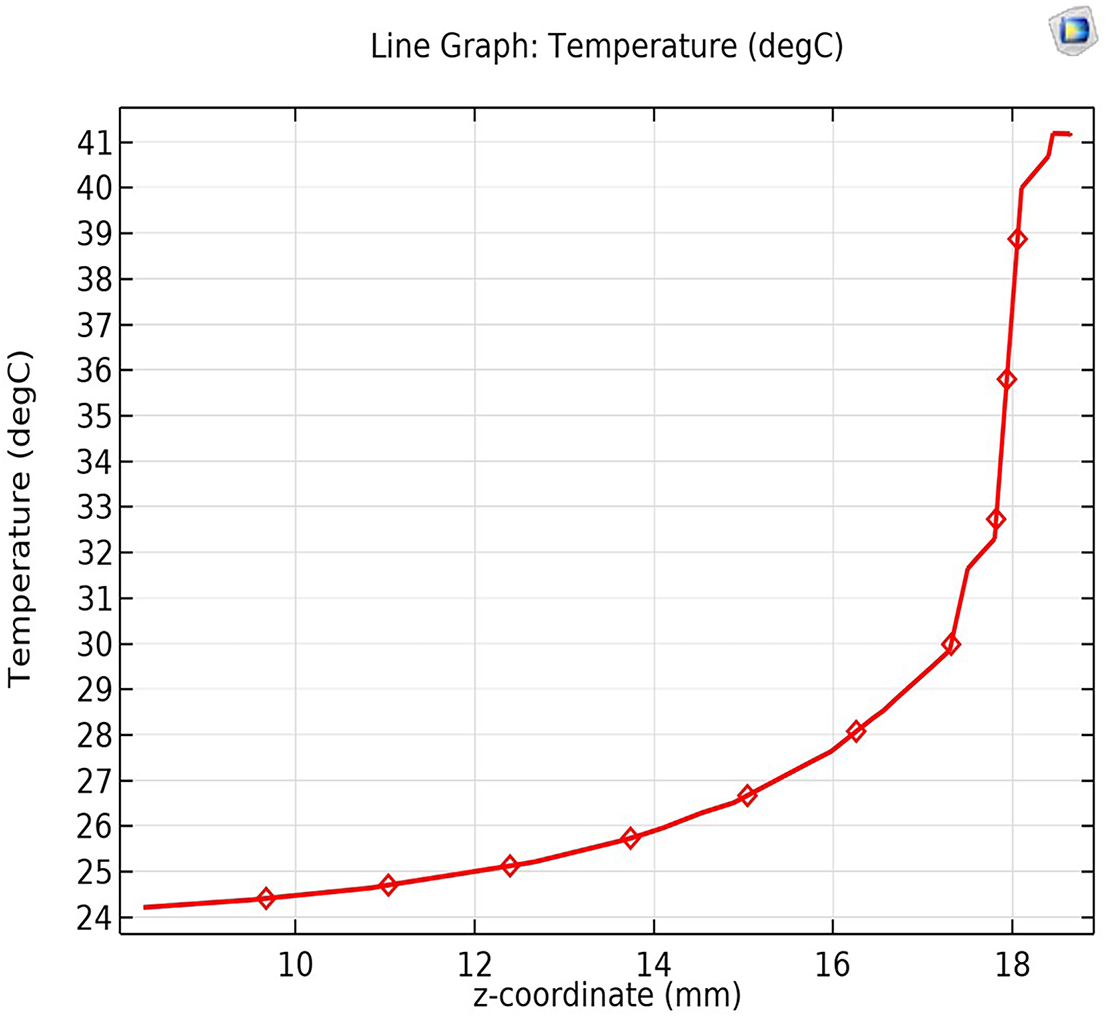
Figure 24: Cross-sectional temperature contours at the back plate sheet of the sub-unit of the receiver.
Cross-sectional temperature contours at the back plate sheet of the subunit of the receiver are displayed in Fig. 25, and the cell temperature contour is displayed in Fig. 26.
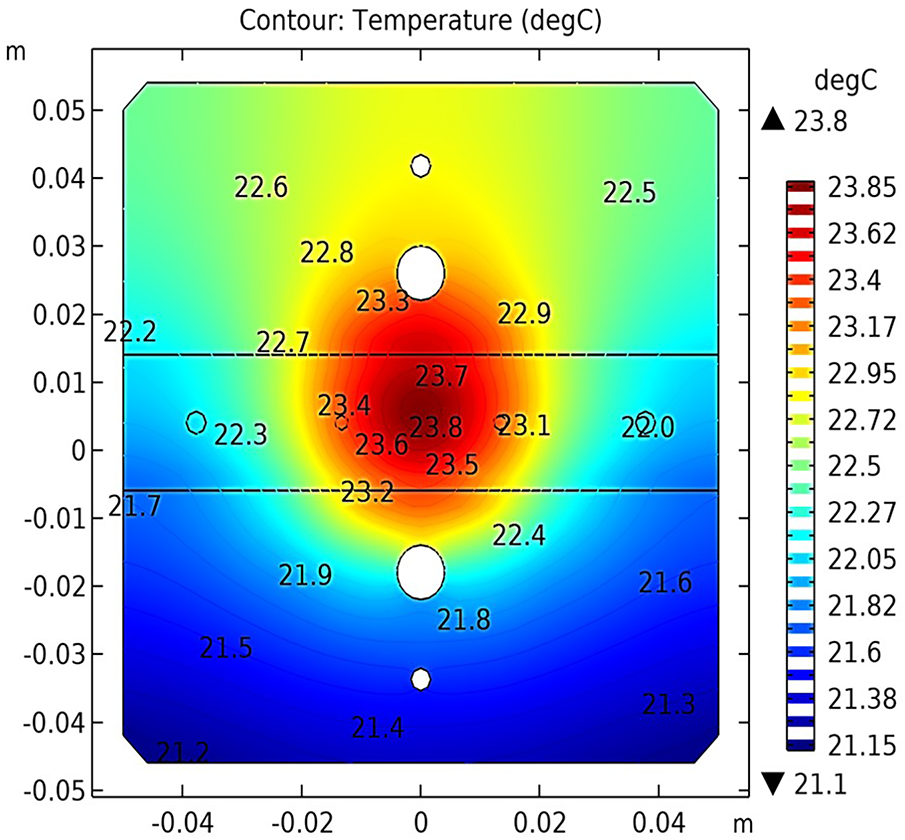
Figure 25: Cross-sectional temperature contours at the back plate sheet of the sub-unit of the receiver.
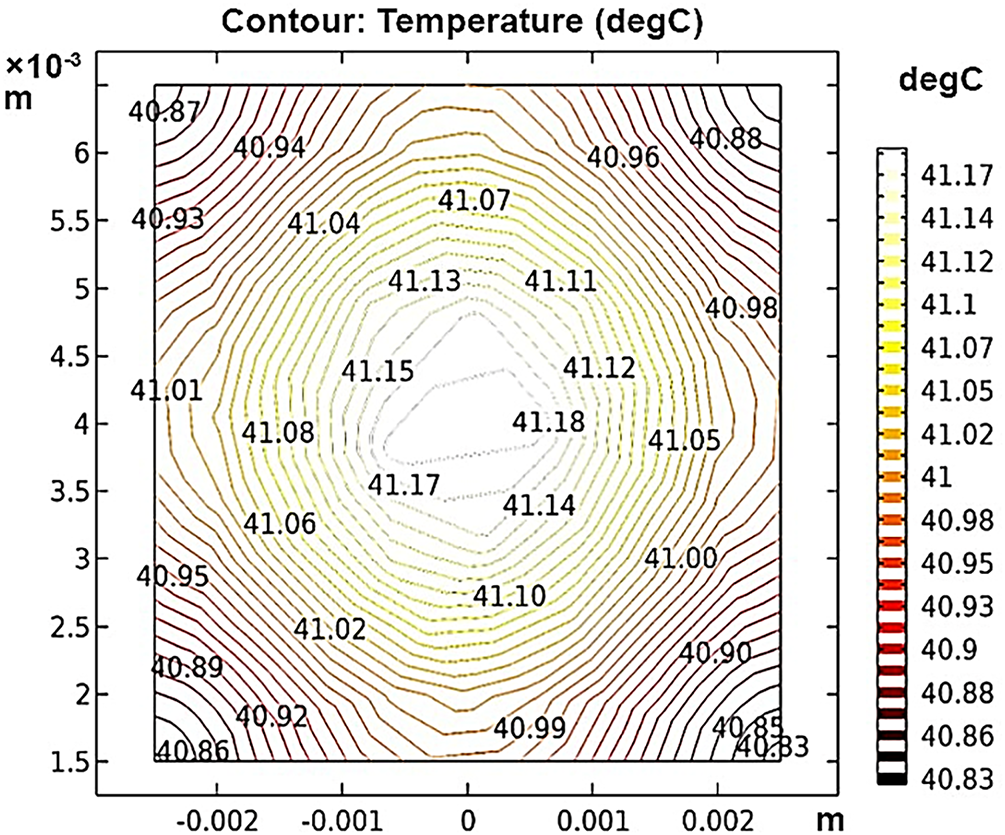
Figure 26: Cell temperature contours.
Performance under Real-World Testing Conditions
For a qualitative comparison between the enhanced and conventional modules, an infrared thermography analysis was conducted to snapshot the thermal image of the entire surface area of each module using radiation from the infrared spectrum, as shown in Fig. 27. The TI-128 Digital Thermal Imaging camera was used to measure the multiple points within the backplate sheet of each module. The TI-128 has pixel dimensions of 640 by 480. Each pixel dimension acts as the individual temperature sensing element, providing 300,000 individual temperature points in each thermal image. Such thermal has offered us robust sensing and reliable measurement tools (less sensitivity to the convection and/or conduction heat on the accuracy of the readings) to extend the comparison to a broader surface area in each module. The reliability/validity of the numerically developed model and the performance of the enhanced and Arzon HCPV modules have been assessed under the real-world climatic conditions of Dammam city (26°23′57.3000″ N and 49°59′3.6960″ E.). The average typical operating temperature difference between the two modules was about
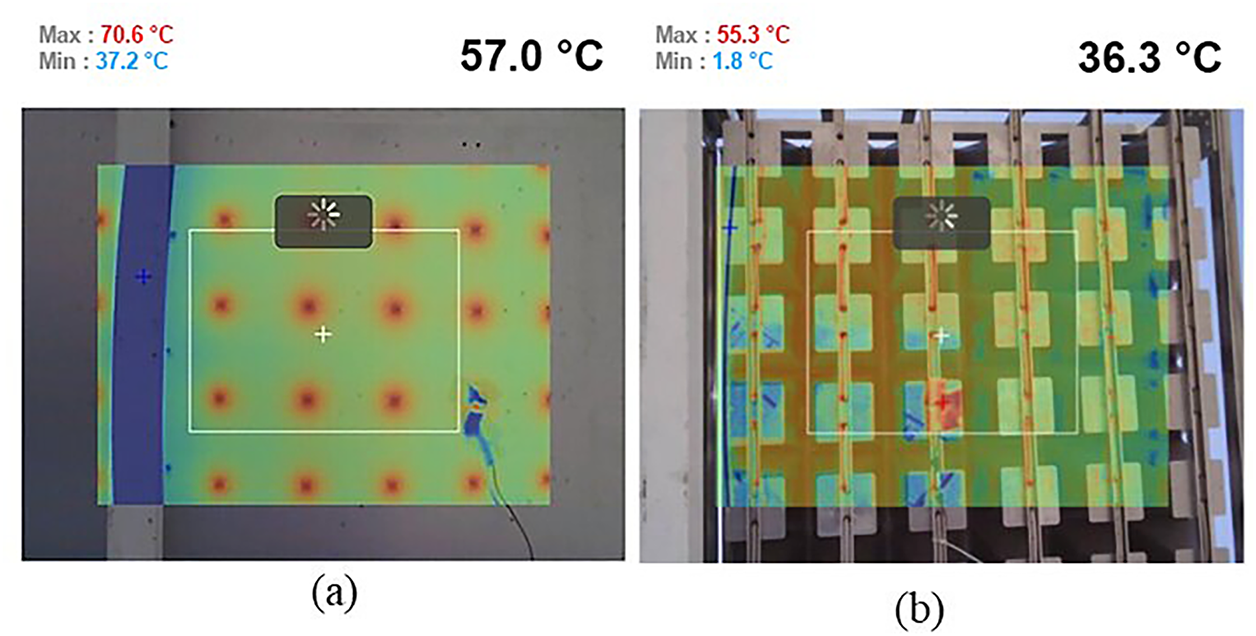
Figure 27: Experimental validation via infrared thermography: Comparative backplate temperature maps showing (a) ~
Fig. 28 shows the temperature measured by the thermocouples connected at similar locations in both systems. The hourly average temperature difference between the readings of both thermocouples was about
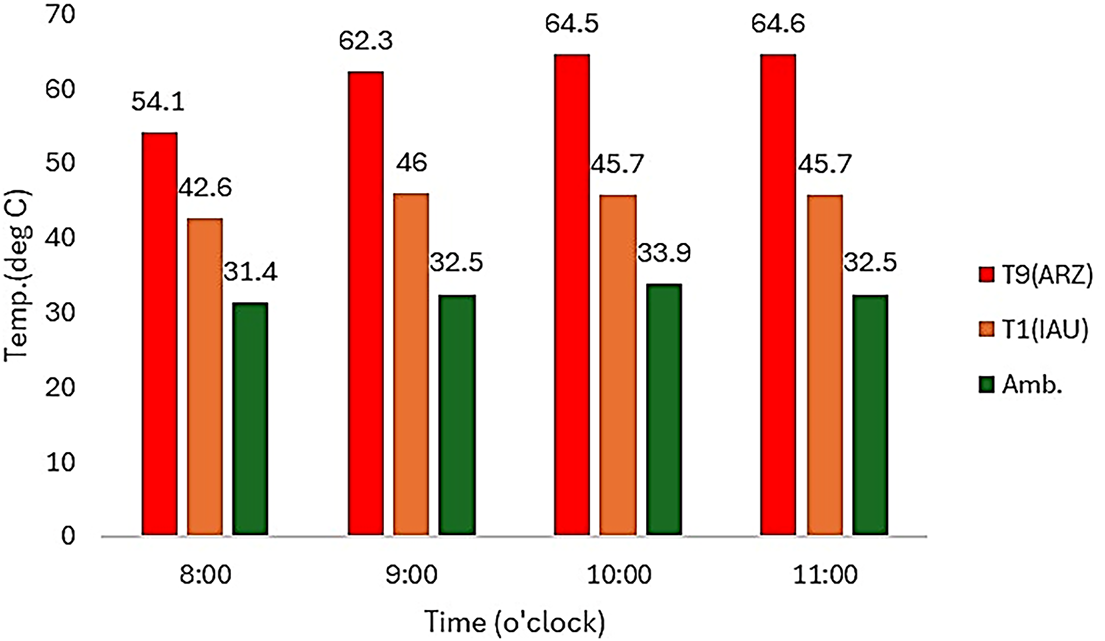
Figure 28: Time-series temperature data from embedded thermocouples, confirming a ~
After testing each cell of both conventional and enhanced HCPV modules, results indicate a successful achievement of a consistent fill factor that exceeds 78% in the case of enhanced design in terms of Fill Factor, it was found theoretically that for GaInP/GaAs/Ge (1.82/1.42/0.67 eV) lattice-matched triple-junction the higher concentration than 20 Suns, FF decreases due to the increase of the series resistance and drops to reach about 0.75 at around 1000 Suns [30]. As shown in Fig. 29, it is evident from the I-V characteristics being recorded on 25th February that the IAU-proposed modules are 3.1% more efficient than the Arzon modules, which equates to approximately
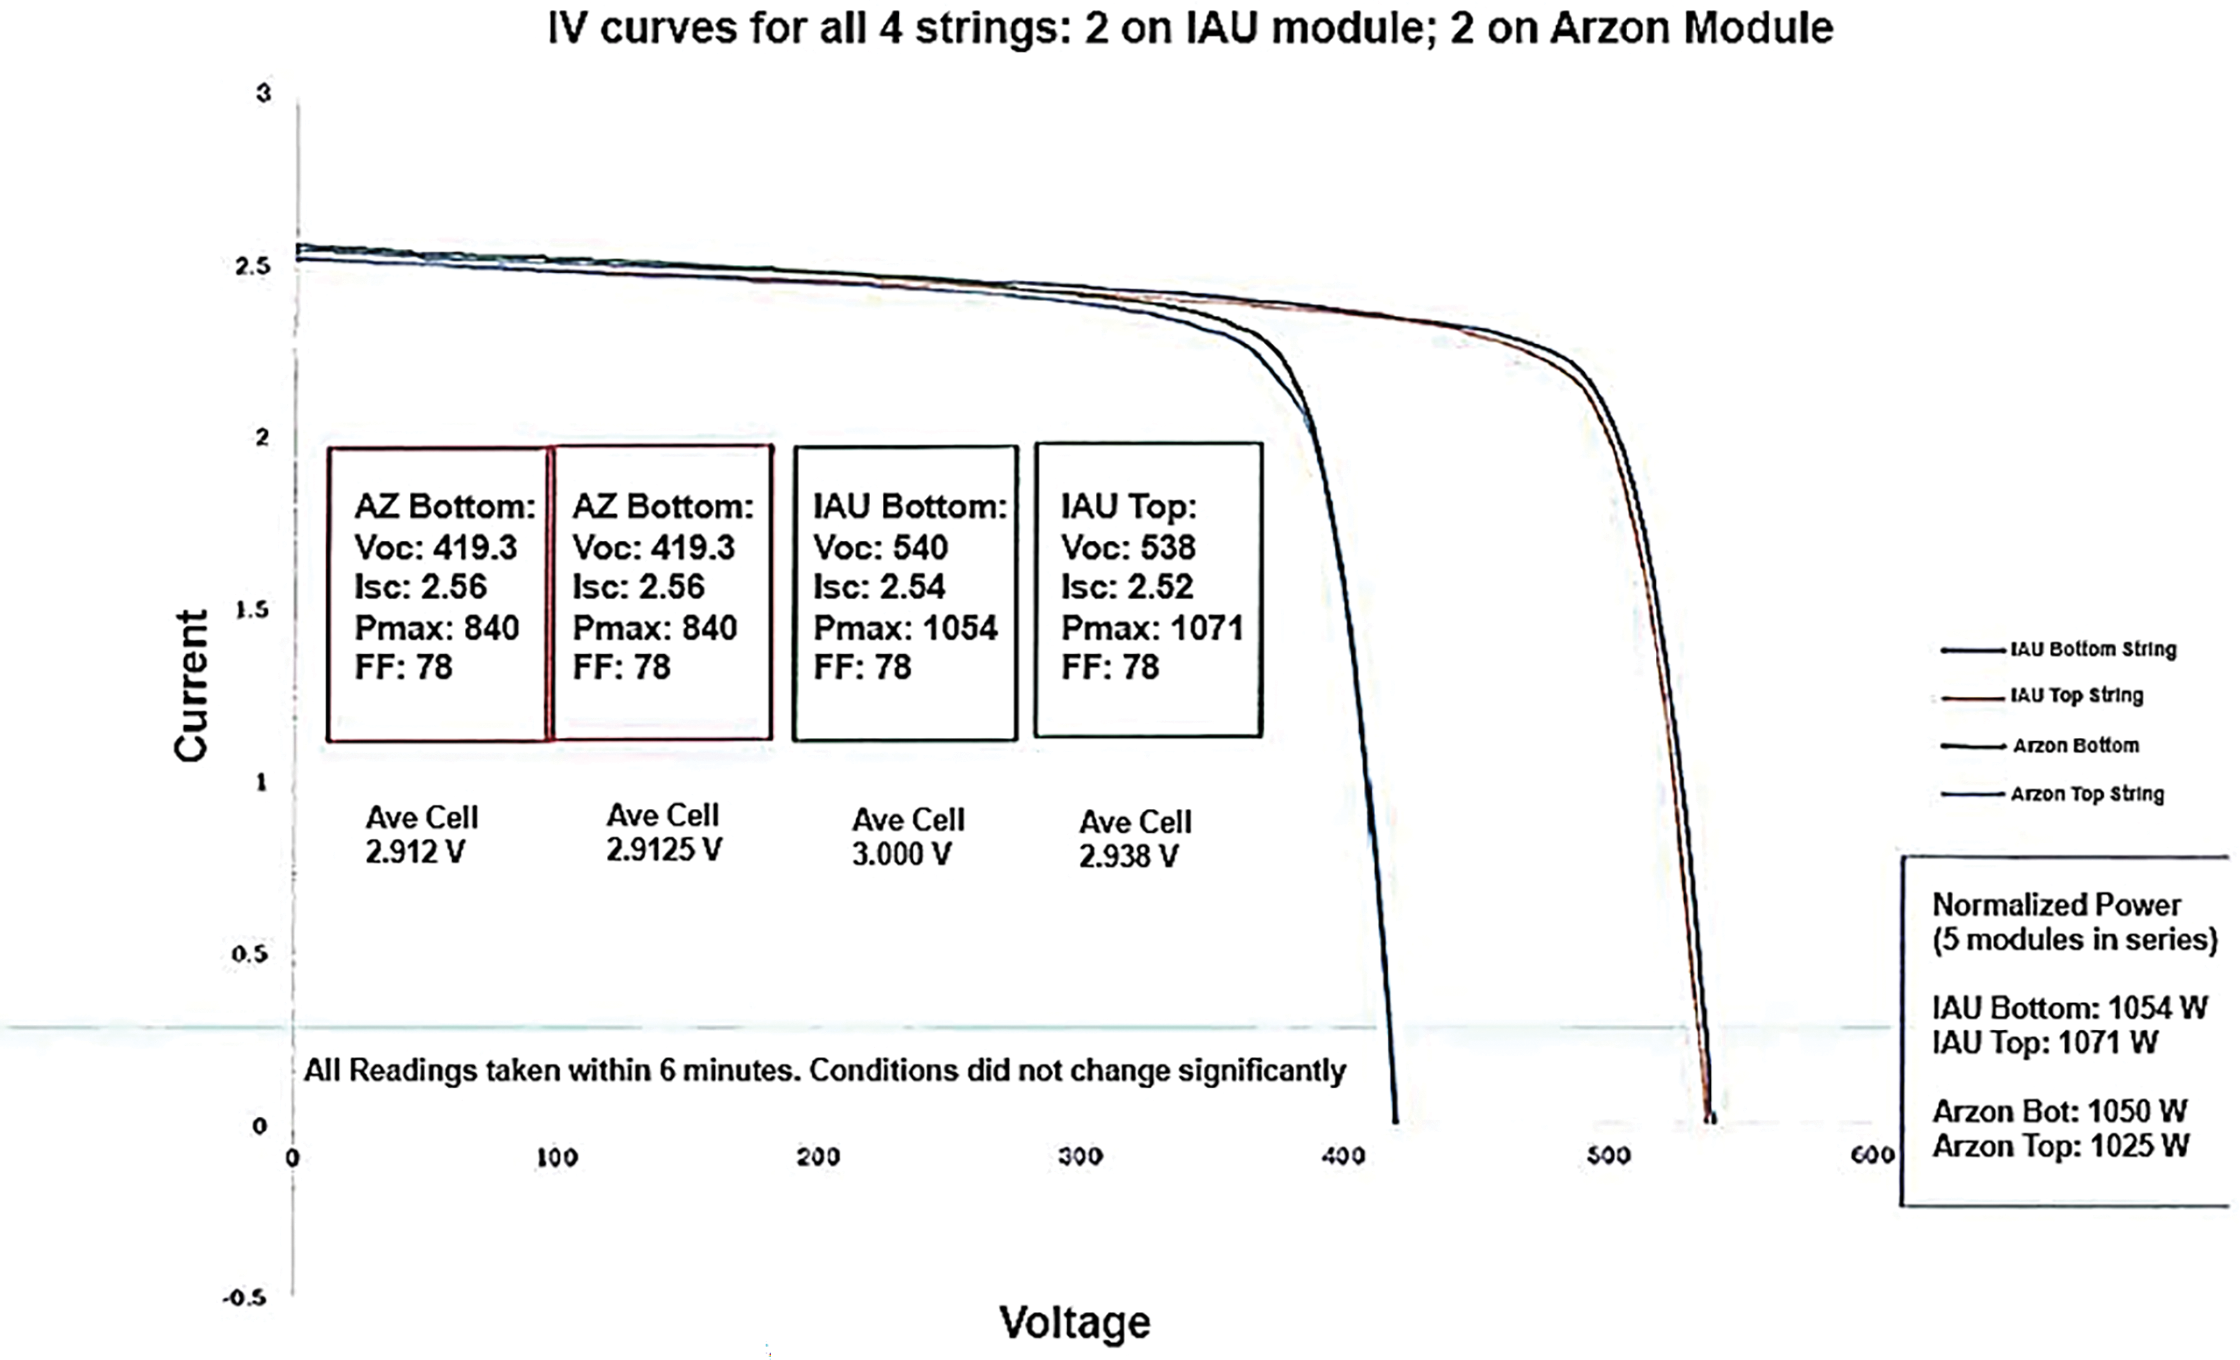
Figure 29: Current-Voltage characteristics correlating improved thermal management with a 3.1% gain in electrical conversion efficiency.
Temperature uniformity is a critical factor influencing both immediate electrical performance and long-term reliability. The enhanced design’s superior thermal homogeneity, demonstrated in Figs. 15 and 16, directly sustains a high fill factor (FF > 78%) under high concentration. Non-uniform temperature distributions create localized increases in series resistance and can induce current mismatch between the sub-cells of a multi-junction device, typically degrading the FF. By maintaining a uniform temperature profile, the enhanced module mitigates these loss mechanisms. Furthermore, minimizing thermal gradients and eliminating sharp hotspots are essential for longevity. Localized overheating (hotspots) accelerates thermomechanical degradation processes such as solder joint fatigue, delamination of encapsulants, and cell cracking. The conical design’s promotion of lateral heat spreading suppresses these hotspots, thereby reducing cyclical thermomechanical stress during daily insolation cycles. Consequently, the improved temperature management not only yields an immediate 3.1% gain in conversion efficiency but also promises enhanced durability and a slower degradation rate over the system’s operational lifetime.
This study has systematically addressed the critical thermal management challenges of High-Concentration Photovoltaic (HCPV) systems operating under arid, high-irradiance conditions. Through an integrated optical-thermal-electrical modeling framework validated experimentally under real desert conditions, an enhanced HCPV module with optimized convective architecture was developed and benchmarked against a conventional commercial design. The principal findings and their implications are summarized as follows:
• A coupled optical-thermal-electrical model demonstrated exceptional predictive accuracy (
• The geometrically optimized module, featuring an open conical-unit architecture, achieved a peak cell temperature reduction of 16°C under worst-case passive cooling (CR = 961×, DNI = 1000 W/m2). This improvement scaled to 21°C under forced convection, underscoring the design’s adaptability to varying environmental cooling regimes.
• The superior thermal management translated into a 3.1% relative gain in electrical conversion efficiency and sustained a fill factor above 78%. This performance, validated against experimental I–V characteristics, confirms the critical coupling between temperature control and electrical output in multi-junction cells.
• Contour analyses revealed significantly flatter axial and lateral temperature gradients in the enhanced module, effectively mitigating hotspot formation and reducing cyclical thermomechanical stress, key factors in extending operational lifetime.
• Streamline and velocity field visualizations demonstrated that the open architecture promotes attached, channeled airflow, minimizes flow separation, and maximizes convective heat transfer without parasitic energy input, a pivotal advancement for sustainable thermal management in resource-constrained environments.
• Field testing in Dammam, Saudi Arabia, using infrared thermography and embedded thermocouples, confirmed an average operational temperature reduction of 14°C–
• The enhanced HCPV module architecture presented in this study characterized by its open conical-unit design has been granted a U.S. patent [32] underscoring its novelty and potential for commercial deployment in arid, high-irradiance environments.
Future Work:
Future research should prioritize three key areas: (1) transient thermal analysis under real-world fluctuating irradiance and wind; (2) economic and lifecycle assessment of the enhanced design; and (3) advanced thermal management through phase-change materials or hybrid cooling systems for extreme environments. Ultimately, these efforts must converge on scaling the patented HCPV architecture for reliable field deployment.
Acknowledgement: The authors extend their appreciation to the King Abdullah City for Atomic and Renewable Energy (KACARE) in Saudi Arabia for funding this research work at Imam Abdulrahman bin Faisal University/College of Engineering.
Funding Statement: This research was funded by King Abdullah City for Atomic and Renewable Energy (KACARE), grant number “PC-2020-1”.
Author Contributions: Conceptualization, Taher Maatallah, Tapas Kumar Mallick; methodology, Taher Maatallah, Tapas Kumar Mallick, Nagmeldeen A. M. Hassanain; software, Taher Maatallah, Gaydaa Al Zohbi; validation, Taher Maatallah, Gaydaa Al Zohbi, Nagmeldeen A. M. Hassanain; formal analysis, Taher Maatallah, Tapas Kumar Mallick, Nagmeldeen A. M. Hassanain, Gaydaa Al Zohbi; investigation, Taher Maatallah, Farooq Saeed, Muhammad Saleem, Fahad Gallab Al-Amri.; resources, Taher Maatallah, Fahd Al-Amri, Nagmeldeen A. M. Hassanain; data curation, Taher Maatallah, Farooq Saeed, Mohamed Elsharawy, Nassir Hariri, Fahad Gallab Al-Amri; writing original draft preparation, Taher Maatallah, Muhammad Saleem, Gaydaa Al Zohbi; writing review and editing, Taher Maatallah, Tapas Malick, Nagmeldeen A. M. Hassanain, Muhammad Saleem, Gayda Al-Zohbi; visualization, Taher Maatallah, Fahad Gallab Al-Amri, Tapas Malick, Gayda Al-Zohbi; supervision, Taher Maatallah, Fahad Gallab Al-Amri, Tapas Malick; project administration, Fahad Gallab Al-Amri, Muhammad Saleem, Taher Maatallah, Tapas Malick; funding acquisition, Fahad Gallab Al-Amri. All authors reviewed and approved the final version of the manuscript.
Availability of Data and Materials: The data that support the findings of this study are available from the corresponding author, upon reasonable request.
Ethics Approval: Not applicable.
Conflicts of Interest: The authors declare no conflicts of interest.
Nomenclature
| Symbol | Description Unit |
| Effective surface area m2 | |
| Speed of light m/s | |
| Tracking system factor – | |
| DNI | Direct Normal Irradiance W/m2 |
| E | Total energyJ |
| F | Body force N/m3 |
| G | Gravitational acceleration m/s2 |
| GC | Geometric concentration ratio – |
| K | Wave vector rad/m |
| Kn | Knudsen number – |
| N | Refractive index – |
| na | Absolute refractive index – |
| Refractive index of air – | |
| Refractive index of air at standard conditions – | |
| Relative refractive index – | |
| Pressure Pa | |
| Pressure Pa | |
| Electrical output power per unit area W/m2 | |
| Reference pressure Pa | |
| Standard pressure (101.325 Pa) Pa | |
| Ray position vector m | |
| Total input power to solar cells W | |
| Actual optical input power W | |
| Optical losses W | |
| Heat generated per unit area W/m2 | |
| Radiative heat flux W/m2 | |
| Time s | |
| Temperature ∘C or K | |
| Reference temperature ∘C or K | |
| Standard temperature (15°C) ∘C or K | |
| Velocity vector m/s | |
| Vertical coordinate m | |
| Greek Symbols | Description Unit |
| Scaling factor – | |
| Cell efficiency degradation coefficient 1/∘C | |
| Electrical efficiency – | |
| Reference electrical efficiency – | |
| Optical efficiency – | |
| Wavelength nm | |
| Kinematic viscosity m2/s | |
| Density kg/m3 | |
| Reference density kg/m3 | |
| Stress tensor Pa | |
| Viscous dissipation W/m3 | |
| Angular frequency rad/s | |
| Subscripts | Meaning |
| Absolute | |
| Air | |
| Solar cell | |
| Electrical | |
| Optical | |
| Reference or relative | |
| Standard | |
| Coordinate directions | |
| Abbreviations | Meaning |
| BC | Boundary Condition |
| CFD | Computational Fluid Dynamics |
| CPV/T | Combined Power and Thermal generation |
| CR | Concentration Ratio |
| CSTC | Concentrator Standard Test Conditions |
| DNI | Direct Normal Irradiance |
| FF | Fill Factor |
| GHG | Greenhouse Gas |
| HCPV | High-Concentration Photovoltaic |
| IAU | Imam Abdulrahman Bin Faisal University |
| MAPE | Mean Absolute Percentage Error |
| PV | Photovoltaic |
| RMSE | Root Mean Square Error |
| SAM | System Advisor Model |
| SPF | Scaling Factor |
References
1. Raimi D, Newell RG. Global energy outlook comparison methods: 2023 update. Washington, DC, USA: Resources for the Future; 2024. 31 p. [Google Scholar]
2. Luque A, Hegedus S. Handbook of photovoltaic science and engineering. Hoboken, NJ, USA: John Wiley & Sons, Inc.; 2010. 1132 p. doi:10.1002/9780470974704. [Google Scholar] [CrossRef]
3. Espinet-González P, Algora C, Núñez N, Orlando V, Vázquez M, Bautista J, et al. Evaluation of the reliability of commercial concentrator triple-junction solar cells by means of accelerated life tests (ALT). AIP Conf Proc. 2013;1556(1):222–5. doi:10.1063/1.4822236. [Google Scholar] [CrossRef]
4. Ma T, Yang H, Zhang Y, Lu L, Wang X. Using phase change materials in photovoltaic systems for thermal regulation and electrical efficiency improvement: a review and outlook. Renew Sustain Energy Rev. 2015;43(1):1273–84. doi:10.1016/j.rser.2014.12.003. [Google Scholar] [CrossRef]
5. Laguna G, Vilarrubí M, Fernàndez A, Sisó G, Rosell J, Ibañez M, et al. Dense array CPV receivers: impact of the cooling device on the net PV output for different illumination profiles. AIP Conf Proc. 2018;2012(1):080008. doi:10.1063/1.5053536. [Google Scholar] [CrossRef]
6. Nishioka K, Takamoto T, Agui T, Kaneiwa M, Uraoka Y, Fuyuki T. Annual output estimation of concentrator photovoltaic systems using high-efficiency InGaP/InGaAs/Ge triple-junction solar cells based on experimental solar cell’s characteristics and field-test meteorological data. Sol Energy Mater Sol Cells. 2006;90(1):57–67. doi:10.1016/j.solmat.2005.01.011. [Google Scholar] [CrossRef]
7. Oropeza-Perez I, Østergaard PA. Active and passive cooling methods for dwellings: a review. Renew Sustain Energy Rev. 2018;82(1):531–44. doi:10.1016/j.rser.2017.09.059. [Google Scholar] [CrossRef]
8. Abdul-Ganiyu S, Quansah DA, Ramde EW, Seidu R, Adaramola MS. Techno-economic analysis of solar photovoltaic (PV) and solar photovoltaic thermal (PVT) systems using exergy analysis. Sustain Energy Technol Assess. 2021;47:101520. doi:10.1016/j.seta.2021.101520. [Google Scholar] [CrossRef]
9. Nandan R, Arumuru V, Das MK. Prospects of hybrid cooling technologies for thermal management of electronic gadgets: a review. Int J Heat Mass Transf. 2026;255:127766. doi:10.1016/j.ijheatmasstransfer.2025.127766. [Google Scholar] [CrossRef]
10. Zhang B, Zhang R, Li Y, Wang S, Xing F. Ignoring the effects of photovoltaic array deployment on greenhouse gas emissions may lead to overestimation of the contribution of photovoltaic power generation to greenhouse gas reduction. Environ Sci Technol. 2023;57(10):4241–52. doi:10.1021/acs.est.3c00479. [Google Scholar] [PubMed] [CrossRef]
11. Ong CL, Escher W, Paredes S, Khalil ASG, Michel B. A novel concept of energy reuse from high concentration photovoltaic thermal (HCPVT) system for desalination. Desalination. 2012;295:70–81. doi:10.1016/j.desal.2012.04.005. [Google Scholar] [CrossRef]
12. Balghouthi M, Trabelsi SE, Ben Amara M, Ali ABH, Guizani A. Potential of concentrating solar power (CSP) technology in Tunisia and the possibility of interconnection with Europe. Renew Sustain Energy Rev. 2016;56:1227–48. doi:10.1016/j.rser.2015.12.052. [Google Scholar] [CrossRef]
13. Renno C, Petito F. Design and modeling of a concentrating photovoltaic thermal (CPV/T) system for a domestic application. Energy Build. 2013;62:392–402. doi:10.1016/j.enbuild.2013.02.040. [Google Scholar] [CrossRef]
14. Minano JC, Gonzalez JC, Zanesco I. Flat high concentration devices. In: Proceedings of the 1994 IEEE 1st World Conference on Photovoltaic Energy Conversion—WCPEC (A Joint Conference of PVSC, PVSEC and PSEC); 1994 Dec 5–9; Waikoloa, HI, USA. p. 1123–6. doi:10.1109/WCPEC.1994.520159. [Google Scholar] [CrossRef]
15. Micheli L, Fernández EF, Almonacid F, Mallick TK, Smestad GP. Performance, limits and economic perspectives for passive cooling of high concentrator photovoltaics. Sol Energy Mater Sol Cells. 2016;153:164–78. doi:10.1016/j.solmat.2016.04.016. [Google Scholar] [CrossRef]
16. Wang YN, Lin TT, Leong JC, Hsu YT, Yeh CP, Lee PH, et al. Numerical investigation of high-concentration photovoltaic module heat dissipation. Renew Energy. 2013;50:20–6. doi:10.1016/j.renene.2012.06.016. [Google Scholar] [CrossRef]
17. Micheli L, Reddy KS, Mallick TK. Thermal effectiveness and mass usage of horizontal micro-fins under natural convection. Appl Therm Eng. 2016;97:39–47. doi:10.1016/j.applthermaleng.2015.09.042. [Google Scholar] [CrossRef]
18. Wang S, Shi J, Chen HH, Schafer SR, Munir M, Stecker G, et al. Cooling design and evaluation for photovoltaic cells within constrained space in a CPV/CSP hybrid solar system. Appl Therm Eng. 2017;110:369–81. doi:10.1016/j.applthermaleng.2016.08.196. [Google Scholar] [CrossRef]
19. Gualdi F, Arenas O, Vossier A, Dollet A, Aimez V, Arès R. Determining passive cooling limits in CPV using an analytical thermal model. AIP Conf Proc. 2013;1556(1):10–3. doi:10.1063/1.4822187. [Google Scholar] [CrossRef]
20. Sharaf M, Yousef MS, Huzayyin AS. Review of cooling techniques used to enhance the efficiency of photovoltaic power systems. Environ Sci Pollut Res Int. 2022;29(18):26131–59. doi:10.1007/s11356-022-18719-9. [Google Scholar] [PubMed] [CrossRef]
21. Renzi M, Egidi L, Comodi G. Performance analysis of two 3.5 kWp CPV systems under real operating conditions. Appl Energy. 2015;160:687–96. doi:10.1016/j.apenergy.2015.08.096. [Google Scholar] [CrossRef]
22. Al-Amri FG, Maatallah T, Zachariah R, Okasha AT, Alghamdi AK. Enhanced net channel based-heat sink designs for cooling of high concentration photovoltaic (HCPV) systems in Dammam city. Sustainability. 2022;14(7):4142. doi:10.3390/su14074142. [Google Scholar] [CrossRef]
23. Abo-Zahhad EM, Ookawara S, Radwan A, El-Shazly A, El-Kady M, Esmail MF. Thermal stress and performance limits of passively cooled high-concentration triple-junction solar cells under non-uniform illumination. Appl Therm Eng. 2020;2022(211):118501. doi:10.1016/j.applthermaleng.2019.114497. [Google Scholar] [CrossRef]
24. Ciddor PE. Refractive index of air: new equations for the visible and near infrared. Appl Opt. 1996;35(9):1566–73. doi:10.1364/AO.35.001566. [Google Scholar] [PubMed] [CrossRef]
25. Luneburg RK. Mathematical theory of optics. Berkeley, CA, USA: University of California Press; 1964. [Google Scholar]
26. Incropera FP, deWitt DP, Bergman TL, Lavine AS. Fundamentals of heat and mass transfer. 6th ed. Hoboken, NJ, USA: John Wiley & Sons, Inc.; 2007. [Google Scholar]
27. Anderson JD. Computational fluid dynamics. New York, NY, USA: McGraw-Hill; 1995. [Google Scholar]
28. Albert P, Jaouad A, Hamon G, Volatier M, Valdivia CE, Deshayes Y, et al. Miniaturization of InGaP/InGaAs/Ge solar cells for micro-concentrator photovoltaics. Prog Photovolt. 2021;29(9):990–9. doi:10.1002/pip.3421. [Google Scholar] [CrossRef]
29. Theristis M, O’Donovan TS. Electrical-thermal analysis of III–V triple-junction solar cells under variable spectra and ambient temperatures. Sol Energy. 2015;118:533–46. doi:10.1016/j.solener.2015.06.003. [Google Scholar] [CrossRef]
30. Al-Amri F. Optimum heat spreader size for producing maximum net power from high-concentration photovoltaic systems. IET Renew Power Gener. 2021;15(15):3645–60. doi:10.1049/rpg2.12261. [Google Scholar] [CrossRef]
31. Mi Z, Chen J, Chen N, Bai Y, Wu W, Fu R, et al. Performance analysis of a grid-connected high concentrating photovoltaic system under practical operation conditions. Energies. 2016;9(2):117. doi:10.3390/en9020117. [Google Scholar] [CrossRef]
32. Al-Amri FG. High-concentrating photovoltaic (HCPV) system: U.S. Patent No. 12094993B2. Alexandria, VA, USA: U.S. Patent and Trademark Office; 2024. [Google Scholar]
Cite This Article
 Copyright © 2026 The Author(s). Published by Tech Science Press.
This work is licensed under a Creative Commons Attribution 4.0 International License , which permits unrestricted use, distribution, and reproduction in any medium, provided the original work is properly cited.
 Downloads
 Citation Tools