
 Submit a Paper
 Propose a Special lssue
 Open Access
ARTICLE
Mango Pest Detection Using Entropy-ELM with Whale Optimization Algorithm
1 Department of Computer Science and Engineering, Sri Shanmugha College of Engineering and Technology, Sankari, 637304, India
2 Department of Computer Science and Engineering, Er. Perumal Manimekalai College of Engineering, Hosur, 635117, India
* Corresponding Author: U. Muthaiah. Email:
Intelligent Automation & Soft Computing 2023, 35(3), 3447-3458. https://doi.org/10.32604/iasc.2023.028869
Received 20 February 2022; Accepted 19 April 2022; Issue published 17 August 2022
 View Full Text
 Download PDF
Abstract
Image processing, agricultural production, and field monitoring are essential studies in the research field. Plant diseases have an impact on agricultural production and quality. Agricultural disease detection at a preliminary phase reduces economic losses and improves the quality of crops. Manually identifying the agricultural pests is usually evident in plants; also, it takes more time and is an expensive technique. A drone system has been developed to gather photographs over enormous regions such as farm areas and plantations. An atmosphere generates vast amounts of data as it is monitored closely; the evaluation of this big data would increase the production of agricultural production. This paper aims to identify pests in mango trees such as hoppers, mealybugs, inflorescence midges, fruit flies, and stem borers. Because of the massive volumes of large-scale high-dimensional big data collected, it is necessary to reduce the dimensionality of the input for classifying images. The community-based cumulative algorithm was used to classify the pests in the existing system. The proposed method uses the Entropy-ELM method with Whale Optimization to improve the classification in detecting pests in agriculture. The Entropy-ELM method with the Whale Optimization Algorithm (WOA) is used for feature selection, enhancing mango pests’ classification accuracy. Support Vector Machines (SVMs) are especially effective for classifying while users get various classes in which they are interested. They are created as suitable classifiers to categorize any dataset in Big Data effectively. The proposed Entropy-ELM-WOA is more capable compared to the existing systems.Keywords
Mango, often known as Kings of Fruits, is an important fruit crop that grows in various places throughout the world. India is the world’s leading mango producer, accounting for over 40% of worldwide mango cultivation. Insects in crop production have been described as several animals supposed to feed on the tissue of crops (Phytophagous), leading to economic losses. Alternaria leaves detect anthracnose, stem mining company, mango deformity, webbers strike, and gall infection are among the common illnesses of the mango crop caused by pathogens including such pathogens, microorganisms, viruses, germs, and others, and also undesirable climatic circumstances. On the other hand, infections and parasites are predicted to take 30%–40% of the agricultural output.
Insects grow primarily due to local weather, exterior insect pressures, greenhouse architecture, and crops management methods. Whenever plant diseases disrupt the photosynthetic process, the plants die. Such animals pose a hazard not just to the farmers but also to other nearby estates. It could be capable of extensively harming plants, increasing financial damages (in addition to the investment, revenue, and production), socioeconomic loss (including such population decline in remote regions), and eventually psychological loss.
The field of machine learning and image processing has a wide range of applications, including diagnostic imaging, agricultural, and several other people. Data pre-processing of raw leaves pictures, identifying the diseased area, features retrieval utilizing customized approaches, and reductions and categorization are crucial phases in an automated procedure [1]. The detection and characterization of plants and crop pathogens is the widespread use of image analysis in agriculture. Furthermore, due to a succession of stages, detecting mango abnormalities and then categorizing them via the image processing method is a critical task.
Scabs, angled bacterial leaf, downy fungus, and bacterial blight are caused by the cucumber crop development and productivity. Numerous illnesses on the leaf, diverse locations of affected regions on the plates, and a more significant amount of possible features make disease identification and localization difficult for cucumber crops. Colors modifications, Support Vector Machines (SVM), convolutional neural networks, and statistical and thresholding approaches are computer vision-based methodologies used for the automatic detection and characterization of cucumber crop illnesses [2]. The filter-based techniques will be independent. Filter-based, wrapper-based, and embedding attribute selection techniques are described. Wrapper-based and integrated approaches are more likely to integrate feature extraction with a training process for selecting appropriately selected features [3].
The searching for the best solution for non-polynomial issues is nearly hard to perform because it necessitates a wide range of resources and a more extended construction period. Specific metaheuristic methods [4], such as Genetic Algorithms (GA), provide an appropriate alternate solution. The Particle Swarm Optimization (PSO) [5] was already utilized as a population-based and unpredictable optimization technique.
An SVM will recognize the border functional that divides statements into two categories, each of which is a point in a multidimensional space. A novel, the unlabeled dataset will be given to classes, which may be determined by its geometrical position about the classifier’s functionality. It is becoming critical to optimize feature extraction and classifications together to ensure the most outstanding performance possible by the grants program [6].
The proposed methodology helps to identify the solution for
• Bacterial blight (mango) is an illness that causes most crops’ components, including the fruit, leaf, blooms, bud, stems, twigs, and trunks. Proper elimination of diseased fruit, stems, and branches, and the cleansing of operating tools, are all part of illness management.
• The first signs of Alternaria leaf spots are tiny brown round dots on the leaf’s surfaces. Mango leaves will become evenly coated with a heavy proportion of brown and black dots. The infection is controlled with a traditional field spraying program that includes copper and depends on pesticides.
• Most prevalent dangerous infection that affects mango trees is anthracnose. The infection is characterized by seeds and spreads through agricultural debris in the ground. This fungus is propagated through water droplets and is more prevalent in hot, humid climates. Darker, flat patches or lesions appear due to this fungal infection.
The significant contribution of the proposed work is given below:
Ø An optimal feature selection strategy based on Entropy-ELM is presented. The suggested method is employed just on input vectors and the fusion vectors, which are then sequentially combined for final prediction.
Ø A whale optimization technique was used to choose the optimal subset of features.
The rest of the paper is structured as follows: Section 2 briefly explains the literature on existing methods. Section 3 describes the Whale Optimization Algorithm and Entropy-ELM for feature selection, Section 4 shows the experimental results, and Section 5 shows the conclusion of the proposed work.
In [7], Modified Rotation Kernel Transformation (MRKT), based on a directed extracting features approach, was given to manage difficulties caused by color, structure, or other deceiving aspects during crop identifying diseases. [8] image analysis using multi-SVM and Gray-Level Co-Occurrence Matrix (GLCM) to identify anthracnose, borers, and sooty mold with a reliability of 85 percent. In [9], the patterns of mangoes information were determined using the Guided filter on several examples of image characteristics from various varieties of mango and then extracting features findings’ levels using Artificial Neural Networks (ANN). Reference [10], the reliability of a mango tree retrieved might be improved. There’s also a specific strategy for breaking the leaves into several levels using K-means grouping.
In [11] have been organisms attributes, particularly demographic groups, community structure (plots), documents of organisms incidence, and environmental layouts such as remote sensing-based and also everyone else, which were needed for forecasting worldwide change’s effect on plant different populations via the use of spatial variability designs. In [12] used, cotton insect information to implement three classifiers: Decision Tree (DT), Naive Bayes (NB), and K-Nearest Neighbour (K-NN). The DT classifier was the best classifier for estimates based on these installations. In [13], the goal was to provide suitable methods for detecting pest attacking situations in areas that use big data technologies to make wise choices and high agricultural production inside Andhra Pradesh. In [14], the goal was to categorize the insects of agricultural production into different color groups. Feature extraction, information extraction, and C5.0 techniques that use Map Reduce are also part of the study.
Reference [15] attempted to forecast the frequencies of pest management in cotton fields based on different parameters using clustering approaches. Reference [16] described a new development and compared two techniques for vision-based pest detection and identification using learning strategies. A system that combines deep learning with computer vision has been comparable to the developed deep learning methods. A suggested technique discovers insects and assesses their precision. In [17], he introduced a hybrid approach for detecting and classifying illnesses in citrus trees. The proposed method is divided into different phases: (a) identifying problem spots on fresh fruits and foliage; and (b) classifying citrus illnesses.
The novel aspect of the suggested protocol was using heuristic algorithms to select features inside the detection of mango skin infection. A particle that has been chosen and lately picked depends on its impact on the architecture’s effectiveness by using a combination metaheuristic-based wrapper-based feature selection method [18]. Those characteristics were used as the inputs to an Artificial Neural Network (ANN). In [19], an automated skin condition detection method again for fruits was proposed. An initial set of features was used to select the best collection of parts. The Artificial Bee Colony (ABC) optimization was used to find the best features and functionality.
In [20], the Bacterial Foraging Optimization (BFO) based Radial Basis Function Neural Network (RBFNN) (BRBFNN) technique was introduced for the rapid recognition and categorization of leaf disease detection. The BFO was used to give the ideal weight to the RBFNN in this method. Throughout this way, the channel’s reliability and efficiency for identifying and classifying plant leave areas affected by various illnesses improved.
3 Proposed Mango Pest Detection Methodology
The proposed methodology works with the following steps to identify the mango pest. Initially, the data was collected, and then the collected data were extracted by using SIFT method. Then feature selection is carried out using Entropy-ELM with Whale Optimization Algorithm (WOA). And then, the training and testing process was conducted; after collecting the optimal feature subset, it uses an SVM classifier for classifying the pest. Fig. 1 shows the architecture of the proposed system.
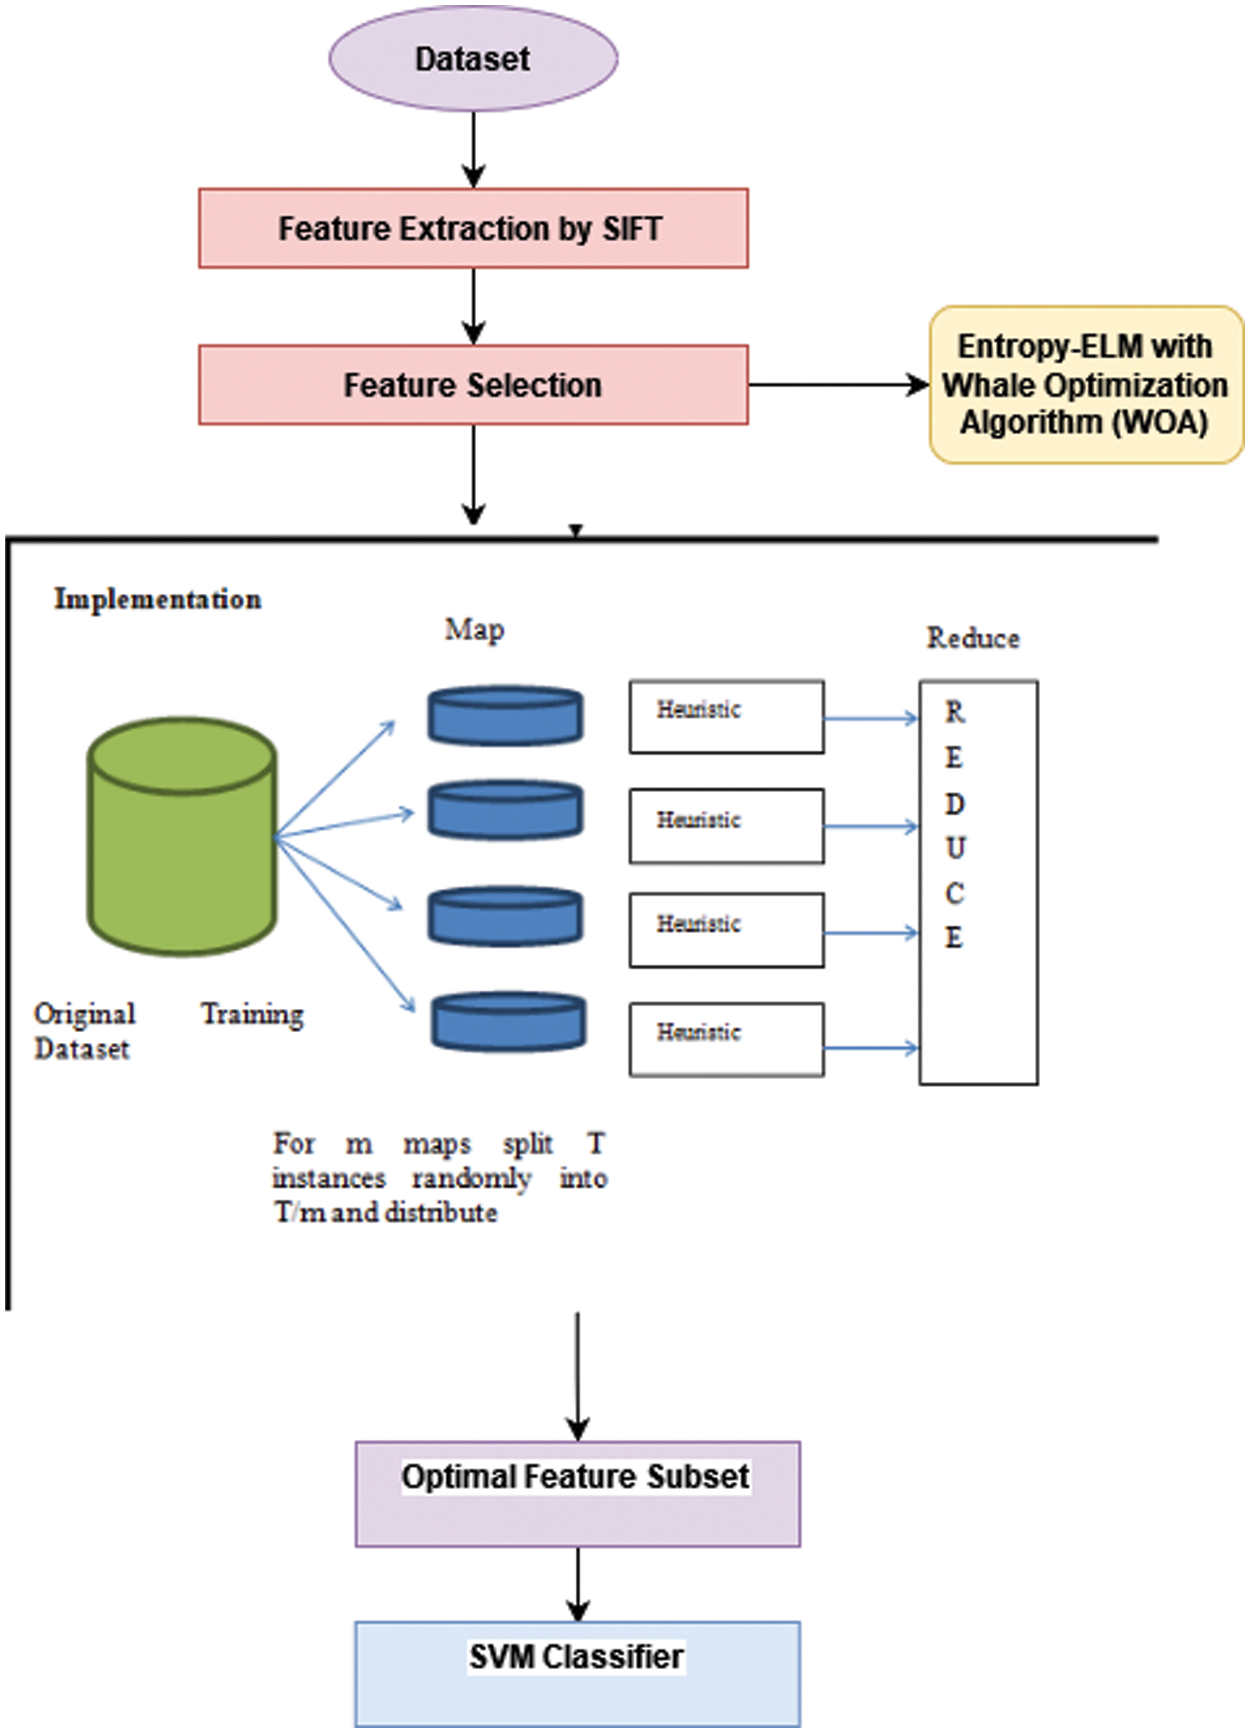
Figure 1: Architecture of the proposed system
Initially, the data is collected. It uses 75 images for pest detection in the mango tree.
3.2 SIFT Method for Feature Extraction
According to the research conducted at the University of British Columbia, David G. Lowe presented additional unique extraction of features in 1999, called the Scale-Invariant Feature Transform. The Scale-Invariant Feature Transform is the name of the technique (SIFT). It is a method unaffected by changes in lighting, spin, or scaling. The approach is appropriate for describing distinct batiks with comparable qualities using the following information for this study (the batik image): The goal is to locate several critical points and their places by identifying extreme values inside the image space.
Thus, the SIFT method has several routes, including identifying and removing all major problematic points bordered by low-resolution areas using quadratic functional matching, making the technique fast and durable. Both paths of the gradients and the number of pixels are used to determine the values of each major point. The most conspicuous direction in its main point is then evaluated after that. The orienting impact will be canceled entirely, keeping the spin constant. The SIFT extracted features are being generated.
Lowe proposes that critical points be described using 4 * 4 initial centroids identified in precise measurements to improve pairing power. A maximum of 128 pieces of data were extracted for each significant issue, equivalent to a 128-dimensional SIFT vector. Then, the SIFT vectors are no longer affected by geometric transformations such as scaling and rotations. SIFT characteristics would be capable of explaining all special features in 128-dimensional pictures for each key point, allowing them also to be separated easily from one another.
3.3 Proposed Feature Selection Method Using Entropy-ELM with Whale Optimization Algorithm (WAO)
Selection of features is a current field of research that is both essential and trendy [21]. The fundamental objective of the part is to enhance overall reliability while reducing computing time by concentrating on most major characteristics [22]. Again for optimum selection of the features, a novel technique called Entropy-ELM is suggested in this study. (i) calculate the entropy of an input sequence, (ii) depending just on values recorded, apply a threshold function that returns two parameters, those that satisfy a threshold level (chosen) and those who do not, (iii) ELM [23] as an optimization process with selected threshold passing characteristics as an input. This entropy concept is described mathematical equation:
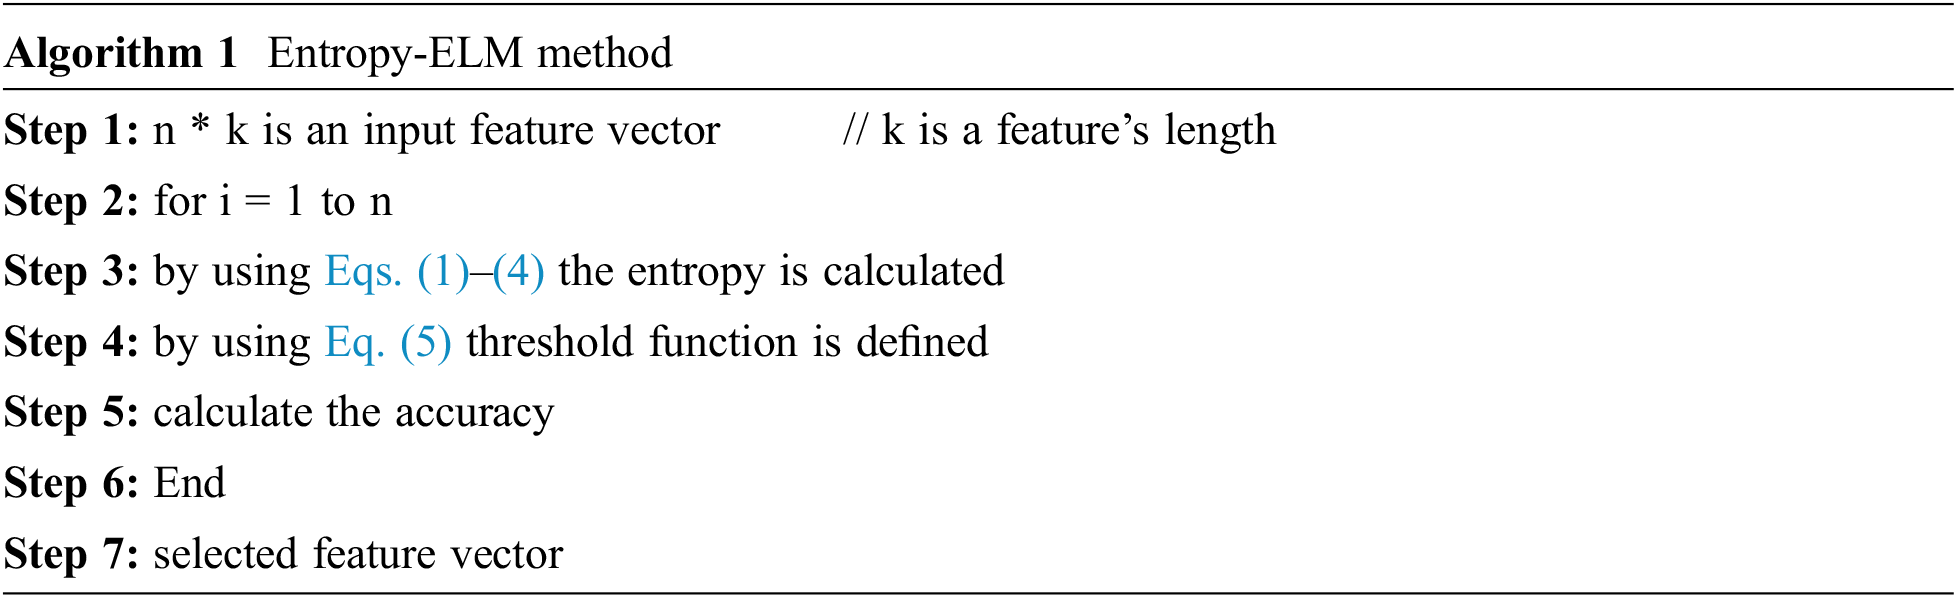
Algorithm 1 describes the Entropy-ELM process; finally, the feature vector is selected.
3.3.2 Whale Optimization Algorithm
Various algorithms are used in crop detection of disease to optimize the information for accurate diagnosis of the disease. For reducing unnecessary features, feature optimization strategies improve the efficiency of machine algorithms. In the suggested method for crop disease classification, the whale optimization algorithm (WOA) is used for feature optimization.
The metaheuristic technique based on nature WOA optimizes problem-solving by imitating the behavior of humpback whales. For prey, humpbacks use two different potential attacks. A randomized or optimal search agent first pursues a target. Then whales move all-around fish-like bubbles net in the second sense, creating a winding-shaped loop of comprehensive food. All critical stages of the approach are described as follows.
While forming a bubble net ring, humpback whales may locate food. Because the position of food in WOA is uncertain, the best answer is the present searching agents. A best search agent’s identification aids another agent in adjusting their positions in the best possible directions. The optiessarymal search agents and repositioning can be stated as
Here T indicates the total number of iterations,
During the exploratory and exploitative stage, the quantity of b decreased from 2 to 0 during the iterations period. [0, 1].
In Eq. (10) the number of b decreases as the area of prey shrinks. A searching agent’s role is determined by the history of agents’ location during the shrinkage technique of encircled methods, as well as the agents attained the best location. To form a bubble net, the humpies surround the prey by blowing bubbles in a radius of 12 m all around the victim. The following formula is used to determine the position of prey and the range among whales:
Here P is a randomized number from 0 and 1. Humpback whales use the bubbles net approach to look for prey at randomness.
During multiple examples, humpback whales execute a randomized prey hunt in addition to a bubbles net method. These mathematical models represent the repetition for prey exploration:
A
3.4 Classification Using Support Vector Machine (SVM)
SVM has been used extensively in supervised learning. The SVM is known as research experiential learning and aims to improve the generalization ability of classification models created by the approach. This SVM classification-based technology utilizes training examples to accurately predict instances, with two independent class labels of −1 and 1. A hyperplane is specifically defined:
Here
The SVM’s goal is to make the gap between these two hyperplanes larger. The true separation of the two hyperplanes can be calculated utilizing
Minimize:
Our suggested approach is tested on mango datasets [1] with 60:20:20 proportions, indicating that 60% of the photos are used to construct the system. In comparison, 20% are used for test results, and 20% for test results validations after combining the testing and implementation photographs (40 percent). All experimental outcomes were calculated using K-Fold cross-validation, with K equal to 10. A recall rate, precision rate, F-Measure, correctness, and duration are all used to demonstrate the effectiveness of each classifier. Simulink MATLAB2021a is used to run the complete architecture experiments on a Personal Computer, Fig. 2.
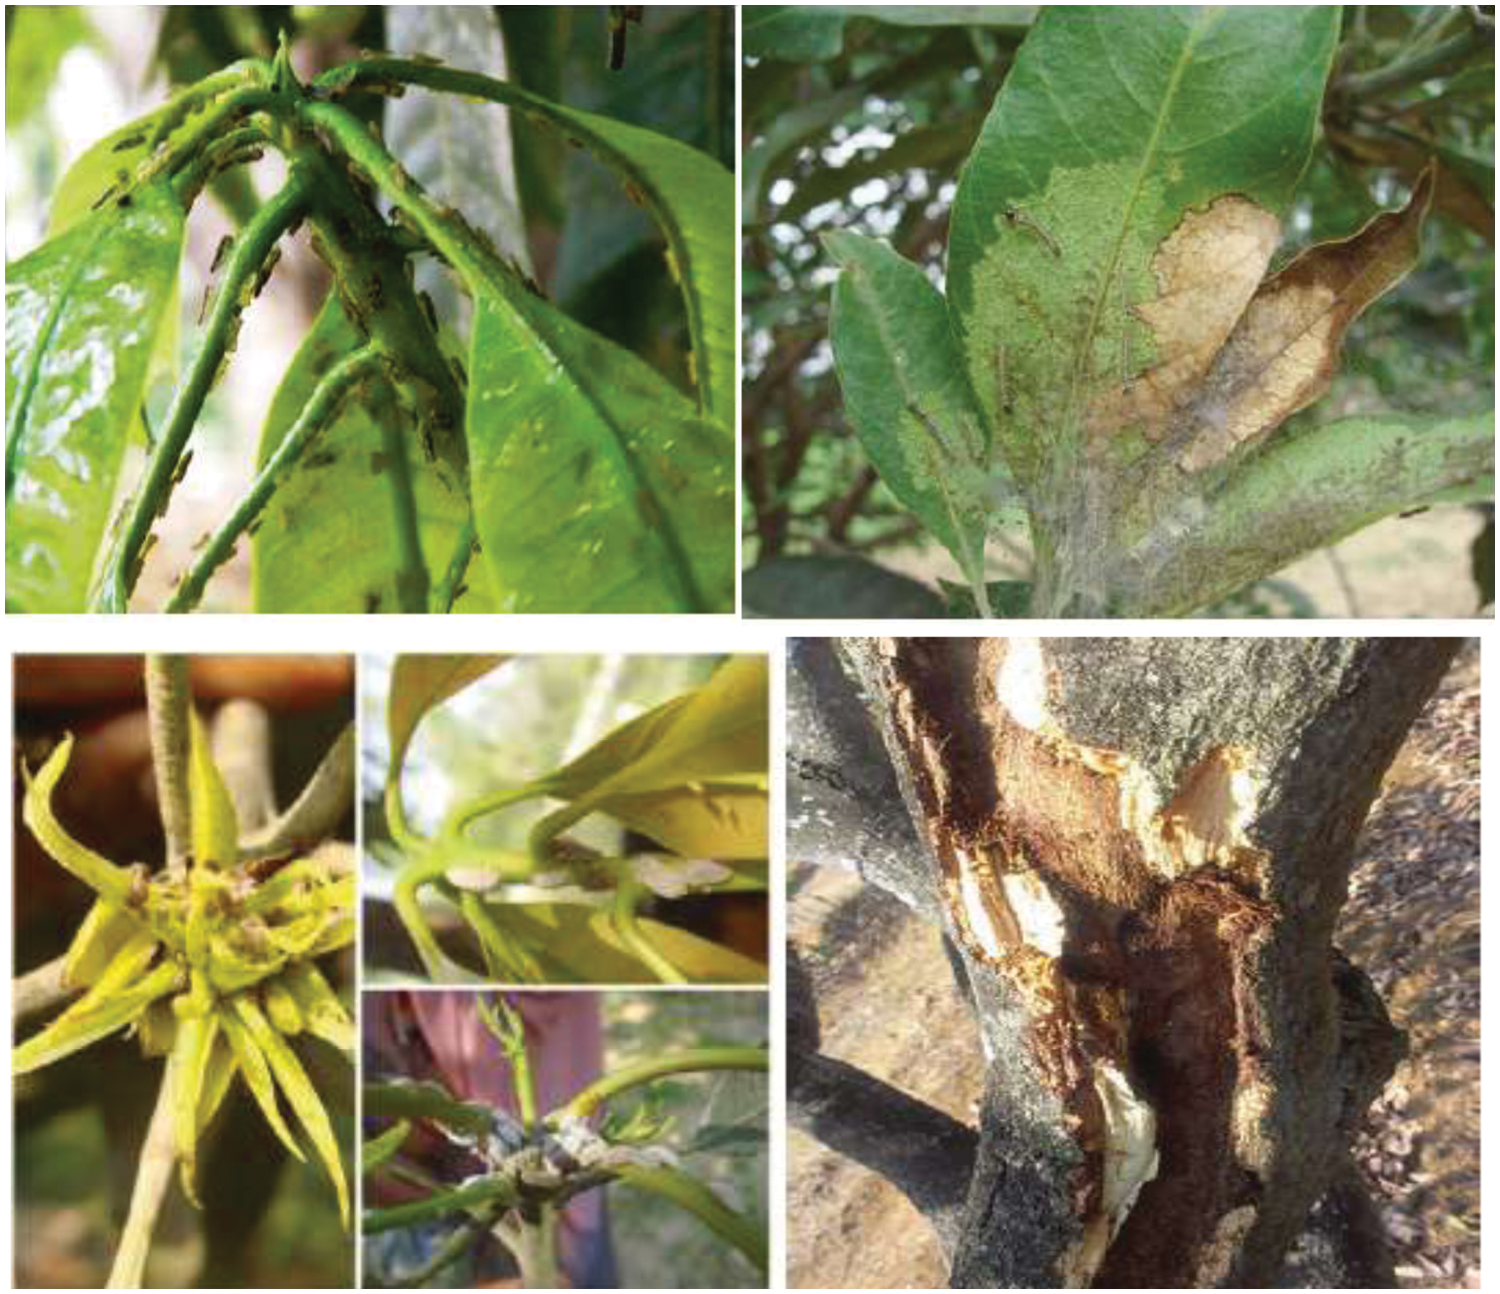
Figure 2: Mango pests datasets
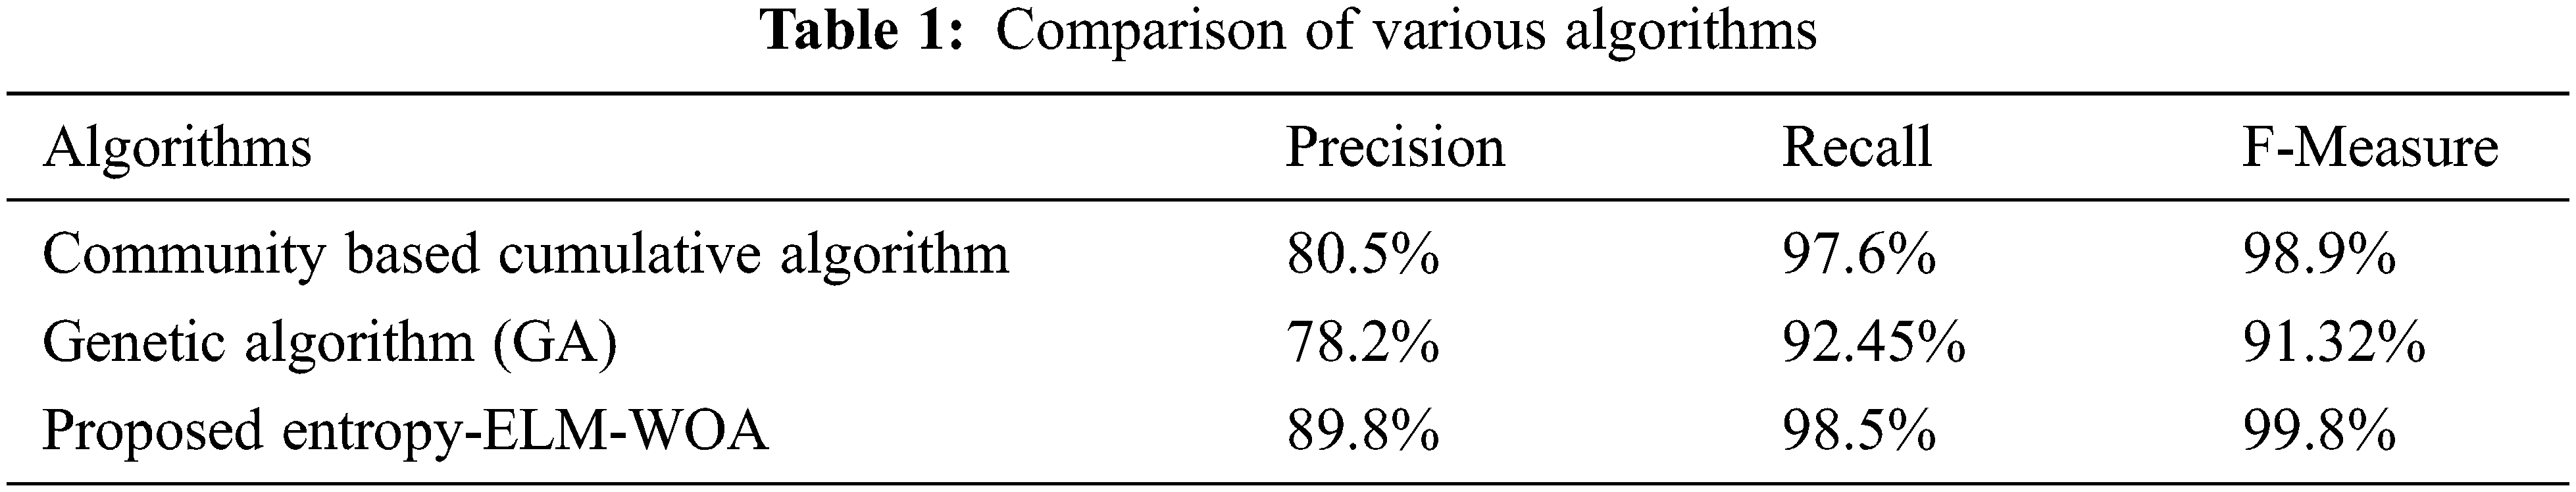
The evaluation metrics such as precision, recall, F measure and execution time were calculated. Mango Hopper, Mango Mealy Bug, Inflorescence midge, Fruit fly, stem borer, Weevil, leaf Webber, shoot borer, and Shoot Gall were evaluated. The proposed method is compared with existing feature selection methods such as community-based cumulative algorithm and Genetic Algorithm (GA). Tab. 1 shows the comparison results of algorithms used in mango pest detection.
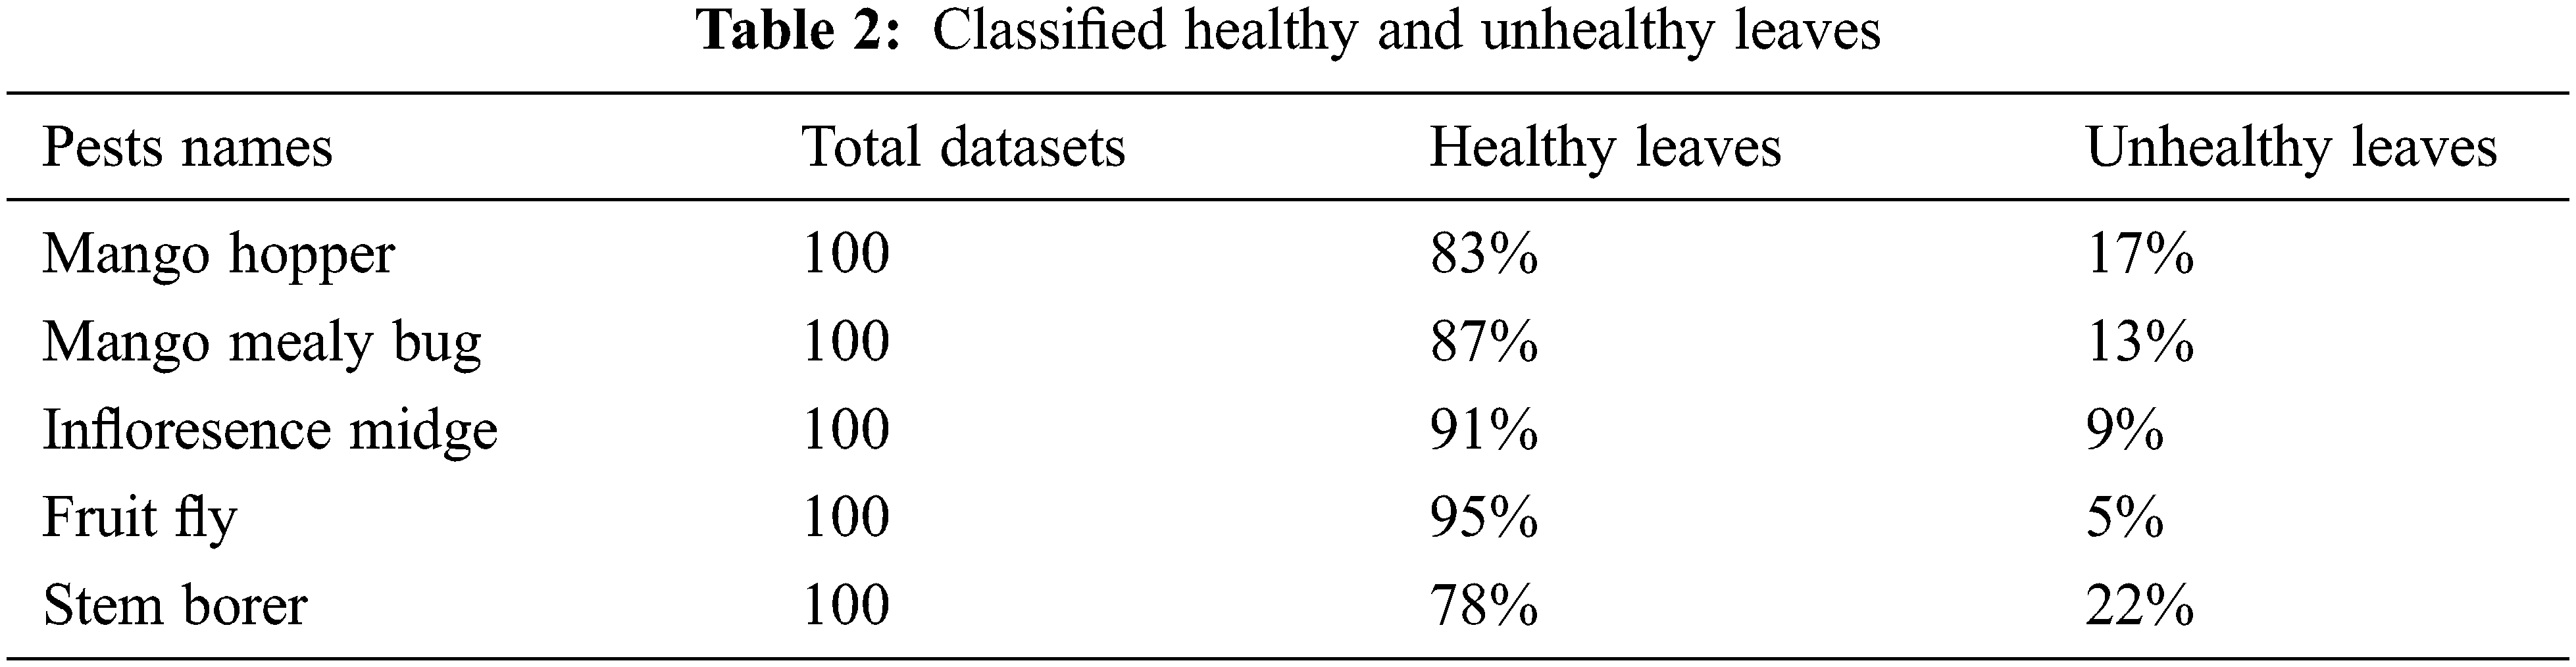
In our proposed method, 100 images were taken for the experiment, 60 images were used to train the model, 20 images were used for testing, and 20 were used for validation. Tab. 2 shows, Healthy leaves and Unhealthy leaves.
The recall can be measured using
Fig. 3 shows the recall of mango pest detection, the proposed Entropy-ELM-WOA method performs higher recall. It achieves 9.85% of recall compared with existing algorithms such as Community based cumulative algorithm and GA.
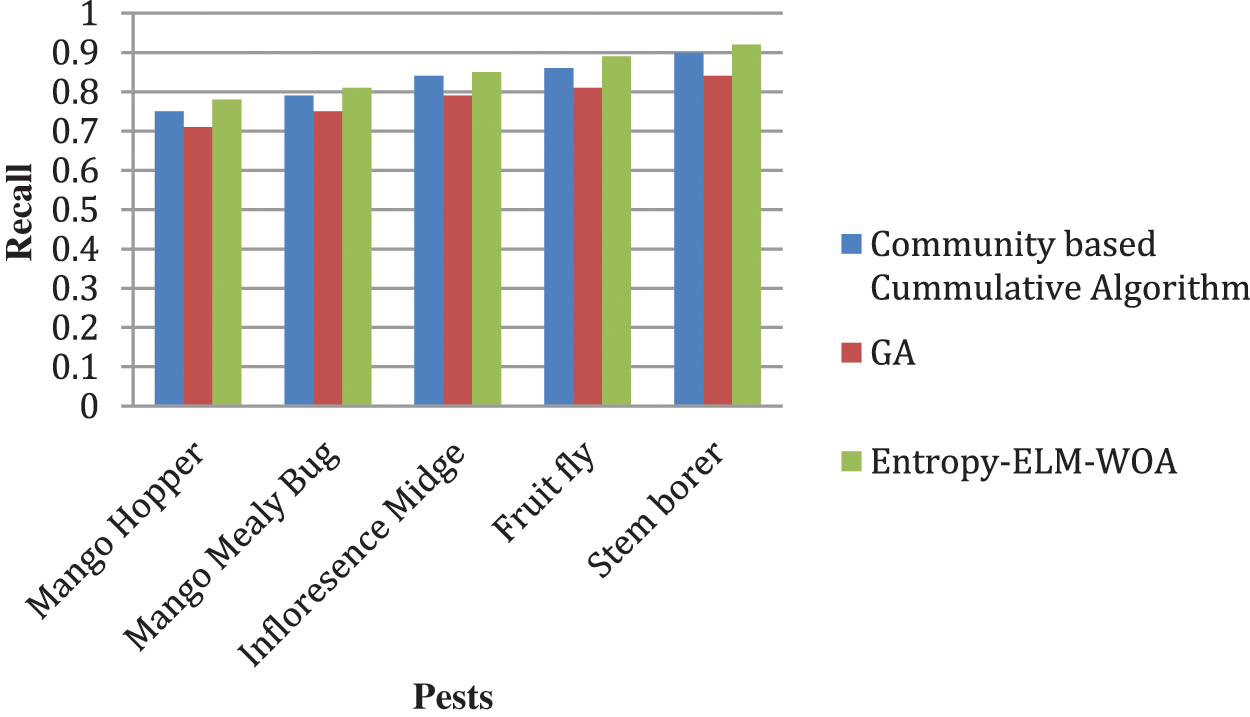
Figure 3: Recall
The precision can be measured by
Fig. 4 shows the precision of mango pest detection, the proposed Entropy-ELM-WOA method performs higher recall. It achieves 8.98% of precision compared with existing algorithms such as Community based cumulative algorithm and GA.
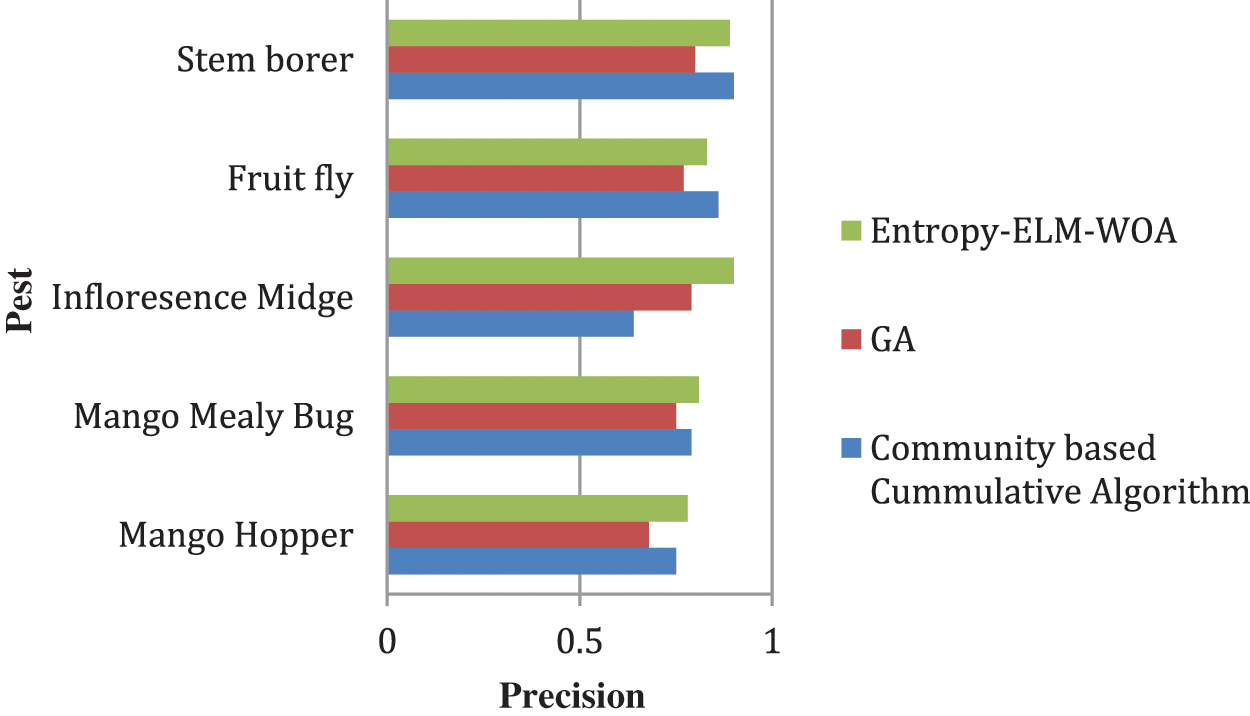
Figure 4: Precision
Also known as F1-score is the harmonic mean of precision and recall given by:
Fig. 5 shows the F measure of mango pest detection, the proposed Entropy-ELM-WOA method performs higher recall. It achieves 9.98% of F measure compared with existing algorithms such as Community based cumulative algorithm and GA.
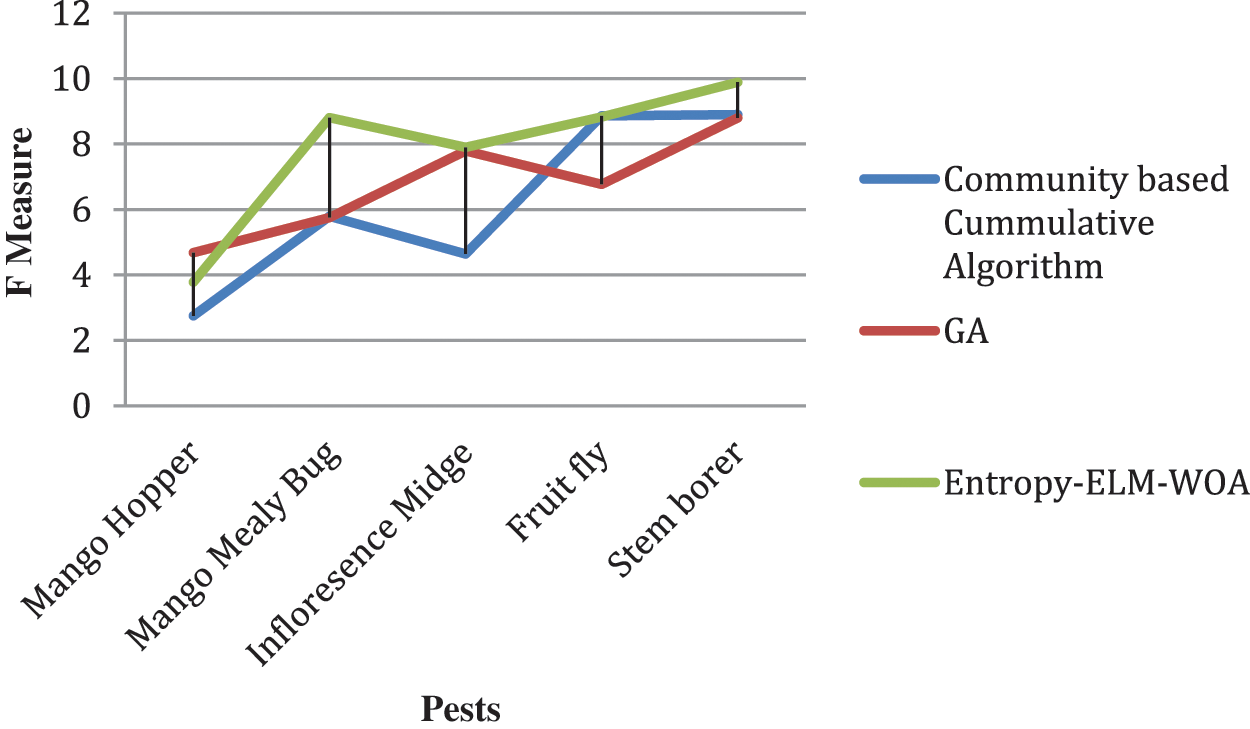
Figure 5: F Measure
Big Data analysis has grown in popularity due to data analysis that provides quick insights and aids in strategic decision-making. Big data is a system that collects and analyses large amounts of data created by several sectors engaged in agriculture, both directly and indirectly. Plant diseases have caused a reduction in productivity, which has led to economic losses. Diseases and their research are founded on characteristics that can be seen on the surface of plants. Several illnesses have previously affected agriculture, including bug and pest harm. The study introduces a unique features selection based on Entropy-ELM using Whale Optimization Algorithm (WOA) to categorize all agricultural pests. The proposed Entropy-ELM-WOA-based feature selection achieves 98.5% of recall, 89.8% of precision, and 99.8% of F Measure. Compared with the existing methods, the Community-based cumulative algorithm and GA, the proposed method selects the features effectively.
Funding Statement:The authors received no specific funding for this study.
Conflicts of Interest: The authors declare that they have no conflicts of interest to report regarding the present study.
References
1. M. A. Khan, A. Alqahtani, A. Khan, S. Alsubai, A. Binbusayyis et al., “Cucumber leaf diseases recognition using multi level deep entropy ELM feature selection,” Applied Sciences, vol. 12, no. 2, pp. 593–602, 2022. [Google Scholar]
2. N. Hussain, M. A. Khan, U. Tariq, S. Kadry, M. A. Yar et al., “Multiclass cucumber leaf diseases recognition using best feature selection,” Computers, Materials & Continua, vol. 70, no. 2, pp. 3281–3294, 2022. [Google Scholar]
3. S. Yadav, A. Ekbal and S. Saha, “Information theoretic PSO based feature selection: An application in biomedical entity extraction,” Knowledge and Information Systems, vol. 60, pp. 1–26, 2018. [Google Scholar]
4. S. B. Ullagaddi and S. V. Raju, “Disease recognition in mango crop using modified rotational kernel transform features,” in Proc. 4th Int. Conf. on Advanced Computing and Communication Systems (ICACCS), Coimbatore, India, pp. 1–8, 2017. [Google Scholar]
5. G. S. Tumang, “Pests and diseases identification in mango using MATLAB,” in Proc. 5th Int. Conf. on Engineering, Applied Sciences and Technology (ICEAST), Pattaya, Thailand, pp. 1–4, 2019. [Google Scholar]
6. F. Thaib, G. Tomasila, G. V. Nivaan and A. J. Santoso, “Radial basis function neural network in identifying the types of mangoes,” in Proc. 8th Int. Conf. on Information and Communication Technology (ICoICT), Bandung, Indonesia, pp. 1–6, 2018. [Google Scholar]
7. R. P. L. Durgabai, P. Bhargavi and S. Jyothi, “Classification of cotton crop pests using big data analytics,” in Proc. Int. Conf. On Computational and Bio Engineering, Coimbatore, India, pp. 37–45, 2019. [Google Scholar]
8. R. Revathy, S. Balamurali and R. Lawrance, “Classifying agricultural crop pest data using hadoop mapreduce based C5. 0 algorithm,” Journal of Cyber Security and Mobility, vol. 8, no. 3, pp. 393–408, 2019. [Google Scholar]
9. S. Priya and M. Abinaya, “Feature selection using random forest technique for the prediction of pest attack in cotton crops,” International Journal of Pure and Applied Mathematics, vol. 118, no. 18, pp. 2899–2903, 2018. [Google Scholar]
10. A. Gutierrez, A. Ansuategi, L. Susperregi, C. Tubío Rankić and L. Lenža, “A benchmarking of learning strategies for pest detection and identification on tomato plants for autonomous scouting robots using internal databases,” Journal of Sensors, vol. 2019, no. 4, pp. 1–15, 2019. [Google Scholar]
11. M. Sharif, M. A. Khan, Z. Iqbal, M. F. Azam, M. I. Lali et al., “Detection and classification of citrus diseases in agriculture based on optimized weighted segmentation and feature selection,” Computers and Electronics in Agriculture, vol. 150, no. 1, pp. 220–234, 2018. [Google Scholar]
12. T. N. Pham, L. Van Tran and S. V. Dao, “Early disease classification of mango leaves using feed-forward neural network and hybrid metaheuristic feature selection,” IEEE Access, vol. 8, pp. 189960–189973, 2020. [Google Scholar]
13. A. D. Andrushia and A. T. Patricia, “Artificial bee colony based feature selection for automatic skin disease identification of mango fruit,” Nature Inspired Optimization Techniques for Image Processing Applications, vol. 150, pp. 215–233, 2019. [Google Scholar]
14. S. S. Chouhan, A. Kaul, U. P. Singh and S. Jain, “Bacterial foraging optimization based radial basis function neural network (BRBFNN) for identification and classification of plant leaf diseases: An automatic approach towards plant pathology,” IEEE Access, vol. 6, pp. 8852–8863, 2018. [Google Scholar]
15. R. Azhar, D. Tuwohingide, D. Kamudi and N. Suciati, “Batik image classification using sift feature extraction, bag of features and support vector machine,” Procedia Computer Science, vol. 72, pp. 24–30, 2015. [Google Scholar]
16. M. Radovic, M. Ghalwash, N. Filipovic and Z. Obradovic, “Minimum redundancy maximum relevance feature selection approach for temporal gene expression data,” BMC Bioinformatics, vol. 18, no. 1, pp. 273, 2017. [Google Scholar]
17. S. Ramírez Gallego, I. Lastra, D. MartínezRego, V. BolónCanedo, J. Benítez et al., “Fast-mRMR: Fast minimum redundancy maximum relevance algorithm for high dimensional big data,” International Journal of Intelligent Systems, vol. 32, no. 2, pp. 134–152, 2017. [Google Scholar]
18. F. Catak and T. Bilgem, “Genetic algorithm based feature selection in high dimensional text dataset classification,” WSEAS Transactions on Information Sciences and Application, vol. 12, no. 1, pp. 290–296, 2015. [Google Scholar]
19. M. Attique Khan, M. Sharif, T. Akram, S. Kadry and C. H. Hsu, “A two stream deep neural network based intelligent system for complex skin cancer types classification,” International Journal of Intelligent Systems, vol. 12, 2021. [Google Scholar]
20. M. A. Khan, M. Alhaisoni, U. Tariq, N. Hussain, A. Majid et al., “COVID-19 case recognition from chest CT images by deep learning, entropy controlled firefly optimization, and parallel feature fusion,” Sensors, vol. 21, no. 21, pp. 7286, 2021. [Google Scholar]
21. G. B. Huang, Q. Y. Zhu and C. K. Siew, “Extreme learning machine: Theory and applications,” Neurocomputing, vol. 70, no. 1–3, pp. 489–501, 2006. [Google Scholar]
22. M. Qasim, H. M. J. Lodhi, M. Nazir, K. Javed, S. Rubab et al., “Automated design for recognition of blood cells diseases from hematopathology using classical features selection and ELM,” Microscopy Research and Technique, vol. 84, no. 2, pp. 202–216, 2021. [Google Scholar]
23. S. Mirjalili and A. Lewis, “The whale optimization algorithm,” Advances in Engineering Software, vol. 95, no. 12, pp. 51–67, 2016. [Google Scholar]
Cite This Article
 Copyright © 2023 The Author(s). Published by Tech Science Press.
This work is licensed under a Creative Commons Attribution 4.0 International License , which permits unrestricted use, distribution, and reproduction in any medium, provided the original work is properly cited.
 Downloads
 Citation Tools