
 Submit a Paper
 Propose a Special lssue
 Open Access
ARTICLE
Encephalitis Detection from EEG Fuzzy Density-Based Clustering Model with Multiple Centroid
1 Department of Information Systems, College of Computer and Information Sciences, Princess Nourah Bint Abdulrahman University, Riyadh, 11671, Saudi Arabia
2 Department of Information Systems, College of Computer and Information Sciences, King Saud University, Riyadh, Saudi Arabia
3 Department of Computer Sciences, College of Computer and Information Sciences, Princess Nourah Bint Abdulrahman University, P.O. Box 84428, Riyadh 11671, Saudi Arabia
* Corresponding Author: Hanan A. Hosni Mahmoud. Email:
Intelligent Automation & Soft Computing 2023, 35(3), 3129-3140. https://doi.org/10.32604/iasc.2023.030836
Received 03 April 2022; Accepted 17 May 2022; Issue published 17 August 2022
 View Full Text
 Download PDF
Abstract
Encephalitis is a brain inflammation disease. Encephalitis can yield to seizures, motor disability, or some loss of vision or hearing. Sometimes, encephalitis can be a life-threatening and proper diagnosis in an early stage is very crucial. Therefore, in this paper, we are proposing a deep learning model for computerized detection of Encephalitis from the electroencephalogram data (EEG). Also, we propose a Density-Based Clustering model to classify the distinctive waves of Encephalitis. Customary clustering models usually employ a computed single centroid virtual point to define the cluster configuration, but this single point does not contain adequate information. To precisely extract accurate inner structural data, a multiple centroids approach is employed and defined in this paper, which defines the cluster configuration by allocating weights to each state in the cluster. The multiple EEG view fuzzy learning approach incorporates data from every single view to enhance the model's clustering performance. Also a fuzzy Density-Based Clustering model with multiple centroids (FDBC) is presented. This model employs multiple real state centroids to define clusters using Partitioning Around Centroids algorithm. The Experimental results validate the medical importance of the proposed clustering model.Keywords
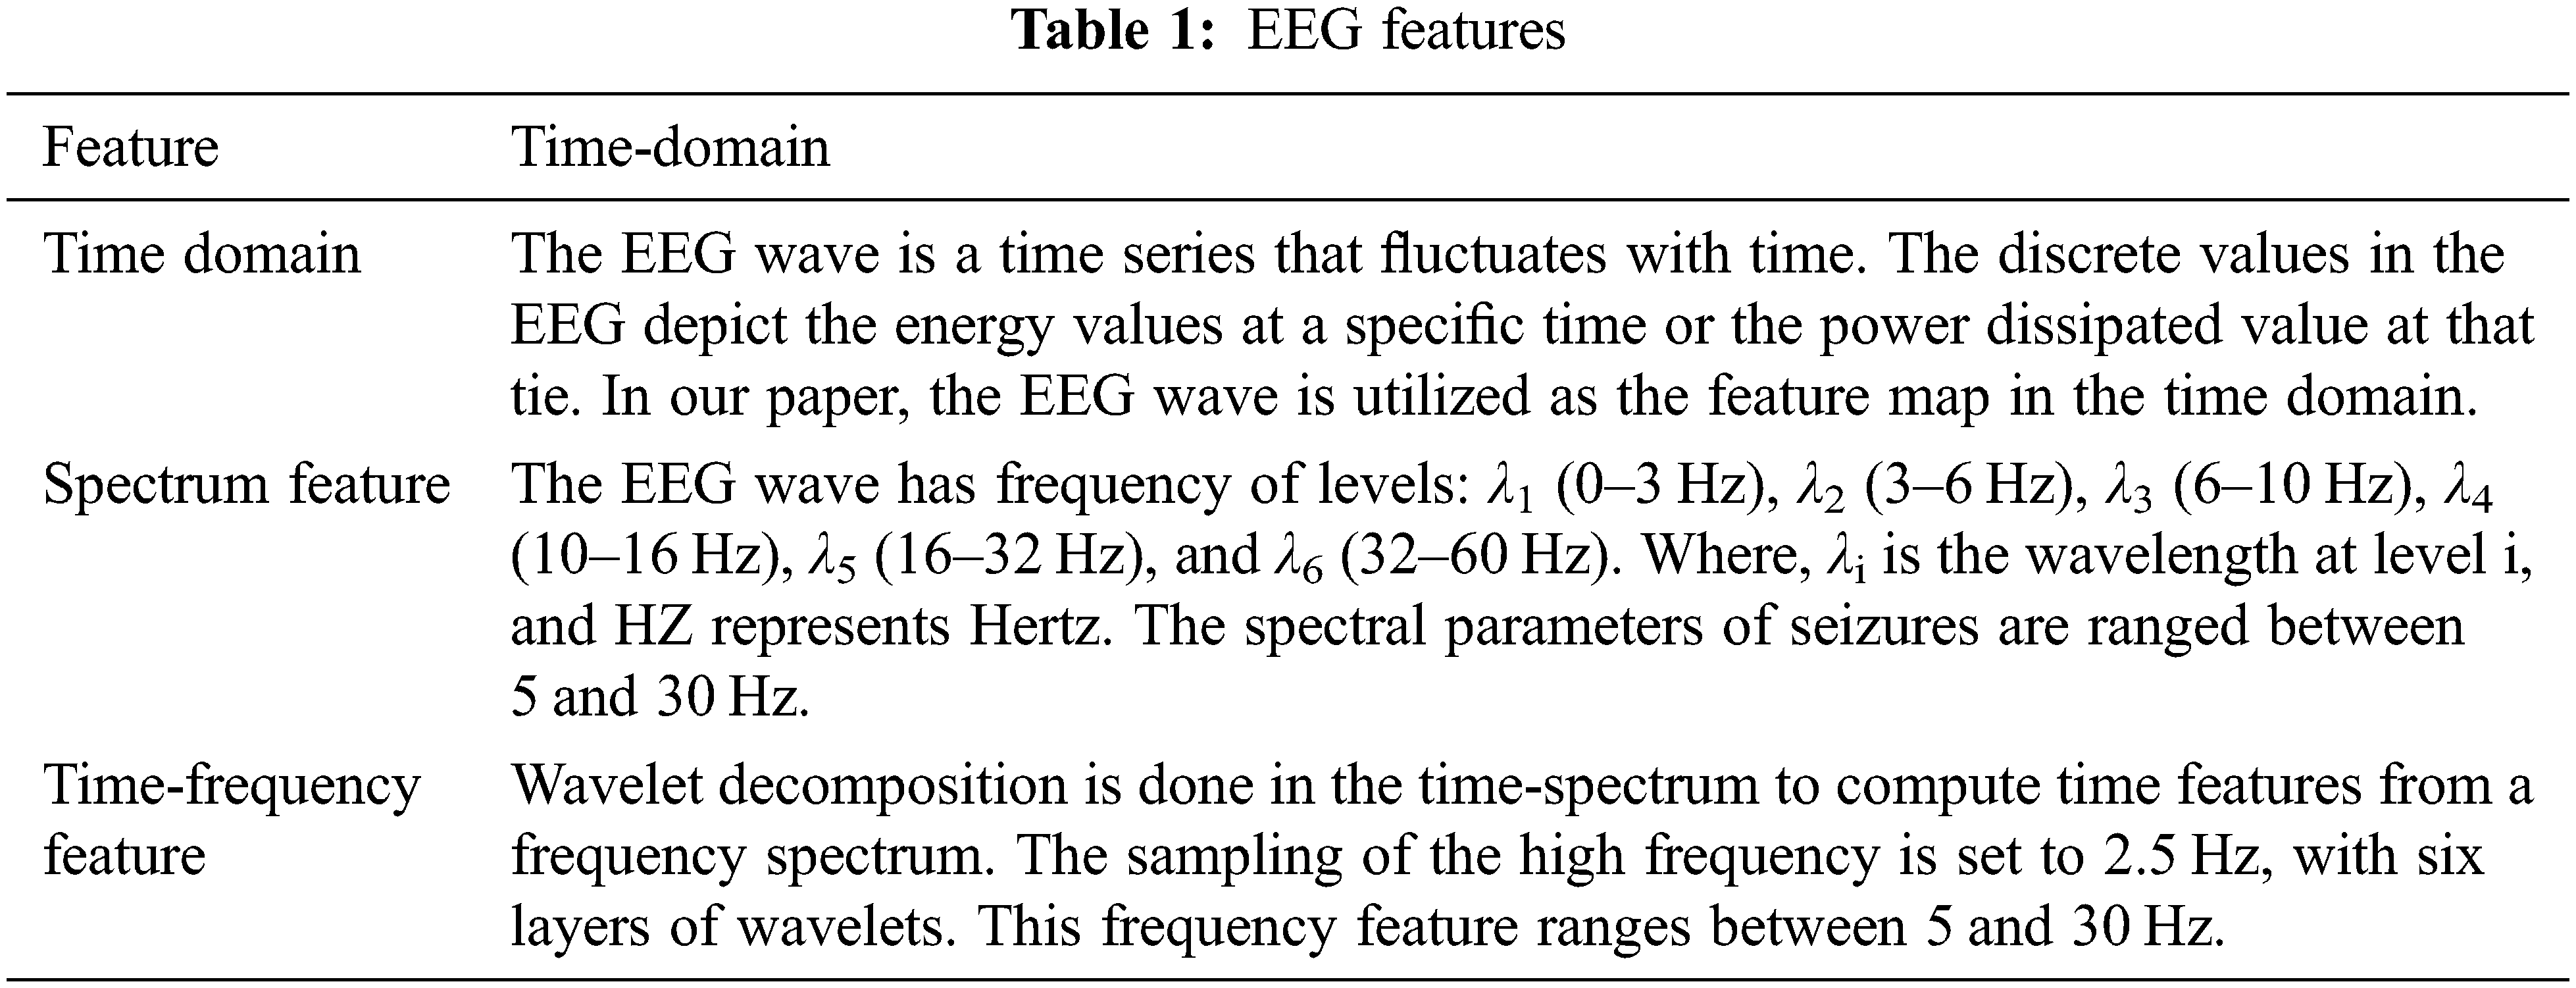
Encephalitis is a brain disorder that yields dysfunction in sensation, mentality, motion, and consciousness, instigating pain and physical damage [1]. Seizures can be cauterized by the abnormal activity in brain neurons [2–5]. EEG is a significant technique that is utilized in the classification of the electrophysiological functions of the brain. Encephalitis strikes 10–15 people per 100,000 each year. Hence, the study of EEGs waves of patients has a true value for the detection of Encephalitis and the ruling of seizure type. Nevertheless, comprehending EEG is still grounded on the subjective opinion of the medical personnel via visual examination. Depending on that, issues such as subjectivity and unreliable inspection take manpower and can induce errors. Hence, it is essential to utilize computerized methods to analyze EEG waves [6–9]. The EEG features are depicted in Tab. 1.
The current EEG waves analysis techniques are the time domain models [10], frequency analysis techniques [11], time-frequency spectrum analysis [12–14] and nonlinear analysis method [15]. The time-domain model evaluates the time spectrum of the EEG data and computes period and periodic rhythm to detect seizures caused by Encephalitis. Its perception has a clear physical interpretation. Frequency analysis of EEG waves is computed by the Fourier spectrum computation power of the EEG data in all frequency spectrums. EEG data is random and fluctuating, Time and frequency-spectrum analysis do not deliver the joint information required to describe the relationship between the frequency with time. Hence, a time-frequency analysis model is employed for Encephalitis EEG feature selection. The EEG waves acquired by various analysis techniques have several characteristics.
Currently, the methods utilized for the diagnosis of Encephalitis mainly incorporate convolutional neural networks [2–5]; time analysis algorithms [6–8]; and clustering techniques [9–14], and multiple EEG view-tasking clustering [14–19]. The authors in [20] projected a radial neural architecture and studied Encephalitis EEGs to increase the method stability. The authors in [21] utilized support vector machines (SVM) and used this technique to multiple channel EEGs to detect Encephalitis. Authors in [22] utilized wavelet discrete transforms to identify Encephalitis. In [23], they presented the entropy based neural networks to categorize Encephalitis EEG data. In [24], they utilized a discrete cosine transform for preprocessing and classification to enhance the performance. In [25] they studied the fluctuations variations between the wave frequencies and the EEG backgrounds. This technique can classify Encephalitis with higher specificity and sensitivity. In [26] they preprocessed the waves and then utilized neural computing to classify the EEG. The benefit of this method was a rise the speed of computations. In [27] they presented a new time-series spike computation technique and verified it in EEG data with high performance results. Fuzzy Clustering models can diagnose Encephalitis by predicting EEG waves of seizure cases. In [28], they employed the fuzzy c-means clustering model to Encephalitis detection. In [29] they presented a self-attention fuzzy Clustering model and used the model for brain disorder recognition. The segmentation attained by the model were highly adaptive. In [30] the authors compared the performance of Encephalitis detection by k-means clustering models. All of the aforementioned models utilized computed single EEG center to define the cluster, which is not an actual instance. Hence, drift could happen under the impact of outliers, deeming this model unable to capture the internal state of the cluster. Also, for medical scans, the simulated center does not represent tissues.
To address the aforementioned issues, an FDBC model is proposed, and the model utilizes Encephalitis EEG. The key contributions are depicted as follows:
• Utilizing a single state centroid in defining the cluster configuration is disposed to lacking information. To precisely get more accurate inner cluster representational information, a cluster configuration expression approach based on multiple state centroid points is proposed.
• A new multiple EEG view Density-Based Clustering model that studies each view and assigns conforming weights depending on each view, which improves the clustering model performance.
• Experiments confirm that the efficiency of the FDBC model; expressing the cluster configuration with real state centroids is more significant for medical data.
2.1 Multiple Centroid State Point Model
The multiple centroid state point model deals with all instances as possible centers and allocates a weight to each instance to specify the degree it characterizes the cluster. hence, the cluster configuration in the instance space can be demonstrated by the involved instances, and more cluster configuration information can be extracted by the center being stated as a single state centroid. To generalize this model, it can be denoted that each instance in the dataset may be defined as a state point of the considered cluster, and this probability can be computed into a weight factor in the range [0,1]. Instance of higher weight will represent its cluster. The flow diagram of the model is depicted in Fig. 1 which depicts the model of the instance graph of the single-centroid state cluster configuration. Fig. 2 depicts an instance graph of the multiple centroid states cluster configuration. The cluster centers depicted in Fig. 2 are all actual instance points, which can highly define the cluster configuration.
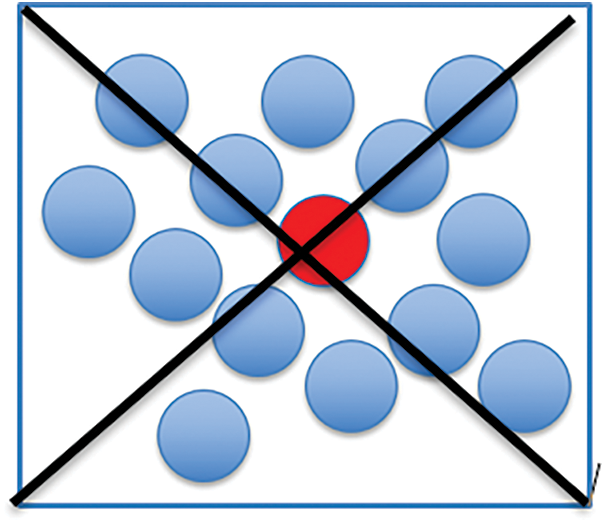
Figure 1: Instance graph of the single centroid (red circle) state point cluster configuration
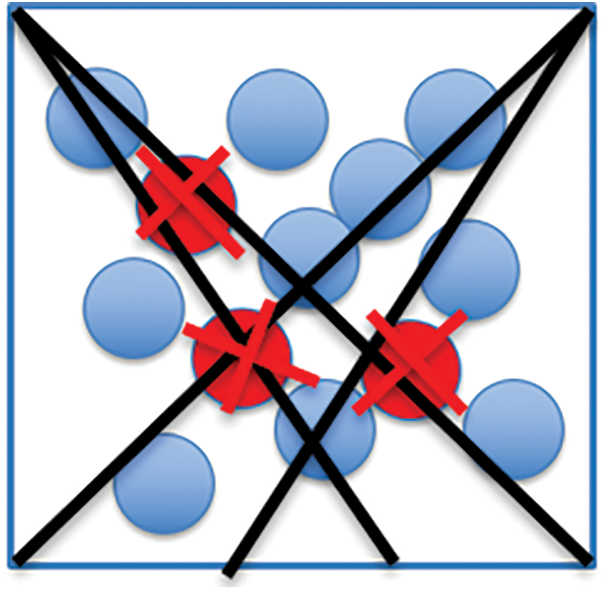
Figure 2: Instance graph of the real multiple centroid state point (red circles) cluster configuration
2.2 Multiple EEG View Fuzzy Learning Model
We propose the multiple EEG view fuzzy learning model for datasets with complex configurations or many instances.is. The amplified complexity of the structure of the dataset leads to represent the dataset via multiple EEG views to achieve multiple EEG view data. Multiple EEG views denote that some objects might be represented by multiple features from various attribute spaces and multiple forms of features from several views. The key feature of the multiple EEG view fuzzy learning model is the evaluation of the evaluates data instances of the several features of the same entity. We then utilize the interaction between the several perspectives to compute similar components and achieve a consistent global decision. Fuzzy learning models broadly deliberate the representative information of the object from different views, the achieved decision is more robust and consistent than the classical decision of a single view. In the multiple EEG view fuzzy learning model, the worth of each view is diverse and contributes differently to the result. The multiple EEG view problem is depicted as the first view splitting quality and is better than the second and third views. The splitting quality of the second view is better than the third view. To get better result, this research proposes the view weighting model, which computes individual weights to the defined views based on the quality of the view splitting. The norm is that high quality data state view will be assigned a high weight, and the data with a low quality state view will be assigned a low weight.
The procedure of the classical clustering for handling multiple EEG view data is depicted by: Classical models process each single view distinctly. The joining model [31] is utilized to attain the result. These models split the multiple EEG view data into many view sets with bad impact on the final result. This causes the difference in the clustering output of the several views and declines the final segmentation and the results in unstable performance. The multiple EEG view fuzzy learning model solves these issues. Many researchers studied many models using the multiple EEG view model. The authors in [32] utilized a clustering model to lever multiple EEG view prospect. In [33], they extended the spectral data clustering and introduced a multiple EEG view clustering model. In [34], they introduced a fuzzy learning model and presented a helpful accurate method. The authors in [35] presented a multiple EEG view C-means based on fuzzy clustering. In [36], the authors presented a lightweight neural network based on transfer learning for Covid-19 diagnosis. In [37], the authors proposed a deformation expression of soft tissue based on neural network.
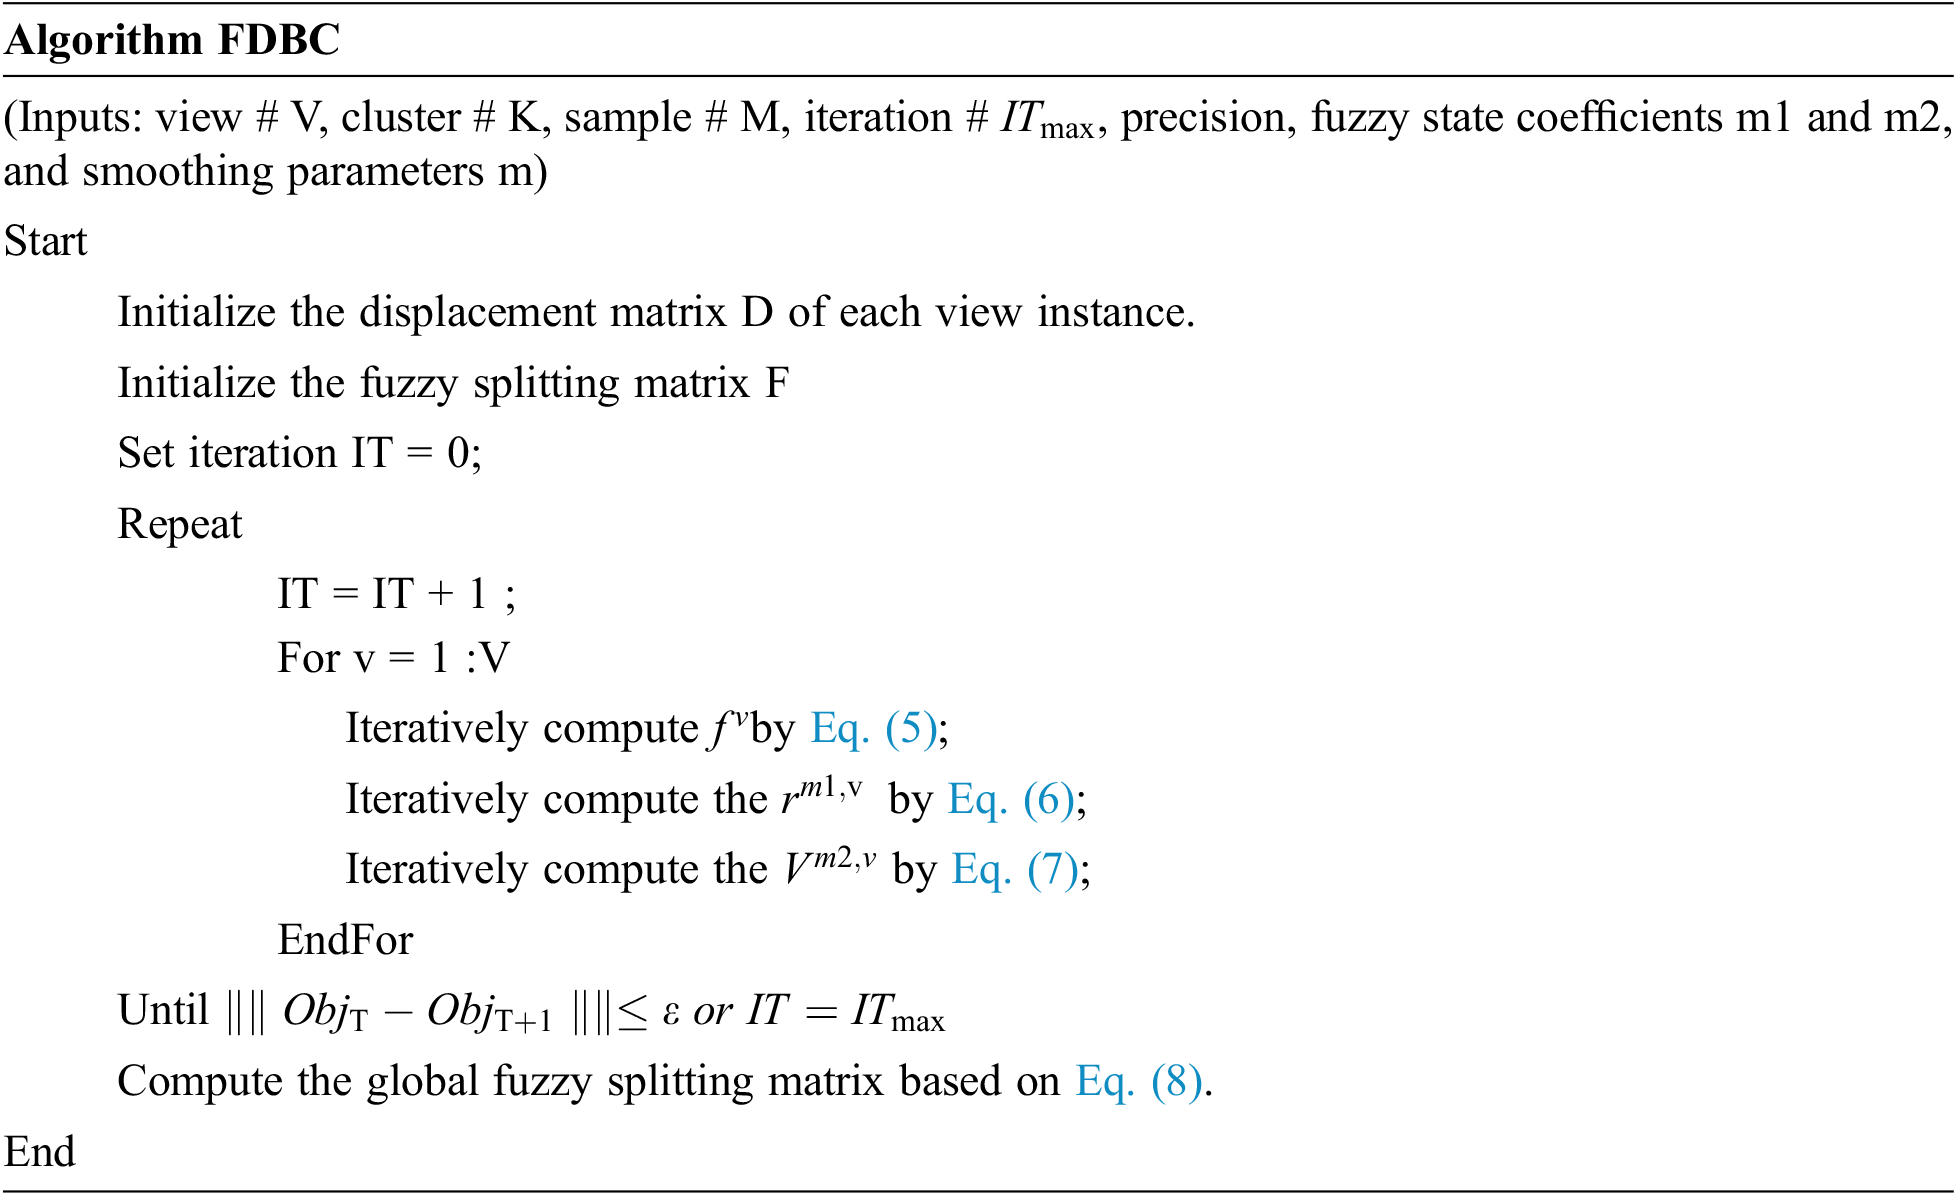
3 The Proposed Multiple EEG View Fuzzy Density-Based Clustering Model with Multiple Centroid
EEG datasets impose great dimensions and high complexity. Such data typically has several clustering patterns. Previous clustering models focused on solo pattern in the data, while multiple EEG view clustering techniques can extract multiple patterns. Multiple EEG clustering enhances the clustering with no redundancy.
The proposed multiple EEG view fuzzy learning model is depicted in the following equations.
A multiple EEG view fuzzy Density-Based Clustering model with multiple centroid (FDBC) is proposed. Given a instance set
Where,
The integration for the global splitting result is depicted as follows:
This vector denotes the centroid of the
From the abovementioned formulas,
4 The Deep Learning Proposed Model
In this paper, a deep learning convolutional neural network model (D-CNN) is used to classify the EEG data of cases with Encephalitis to realize deep learning of Encephalitis features. The D-CNN architecture, proposed in the paper, has several convolutional, pooling, and Dropout layers successively. The model framework is depicted in Fig. 3. First, Encephalitis EEG from multi-views is acquired. Discrete Fourier and discrete wavelet transforms compute the spectrum wave and time frequency waves of the EEG records. Then, for each single view, the proposed D-CNN is utilized for feature extraction to decrease the instance dimension of each single view. At this phase, the deep model features of multiple EEG view Encephalitis EEG are attained. At the last phase, a novel classification model, using unsupervised multiple EEG view results, is employed to acquire the final classification result.
The model framework is depicted in Fig. 3. First, Encephalitis EEG waves from multi-views is acquired. Discrete Fourier and discrete wavelet transforms are utilized to compute the spectrum, time and time-frequency data of the EEG signals. The D-CNN extracts feature to lessen the instance dimension for each single view. At this phase, the multiple EEG view features of Encephalitis EEG are acquired. At the last phase, a novel unsupervised classification model, employing multiple EEG view clustering, is utilized.
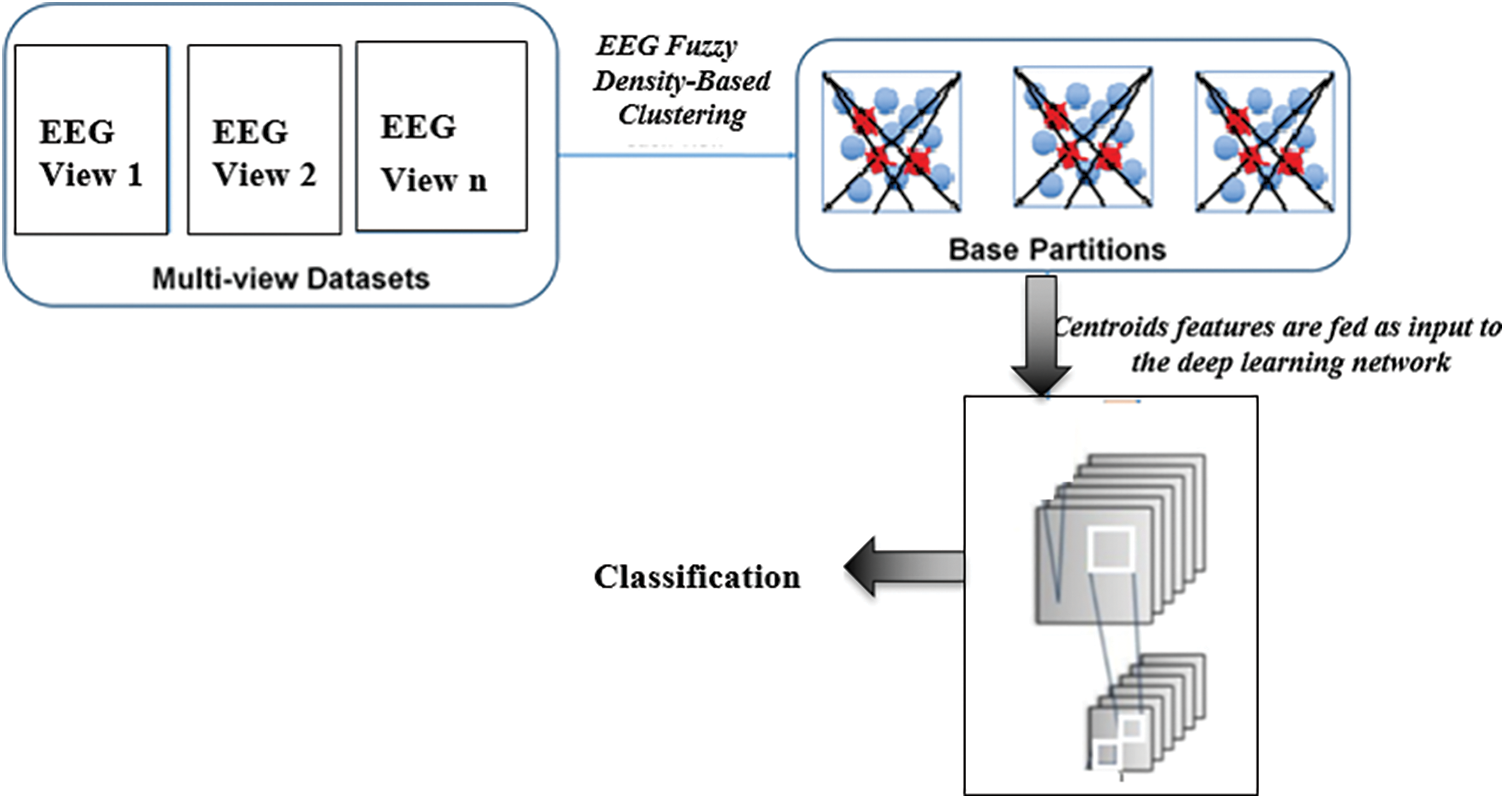
Figure 3: The model framework
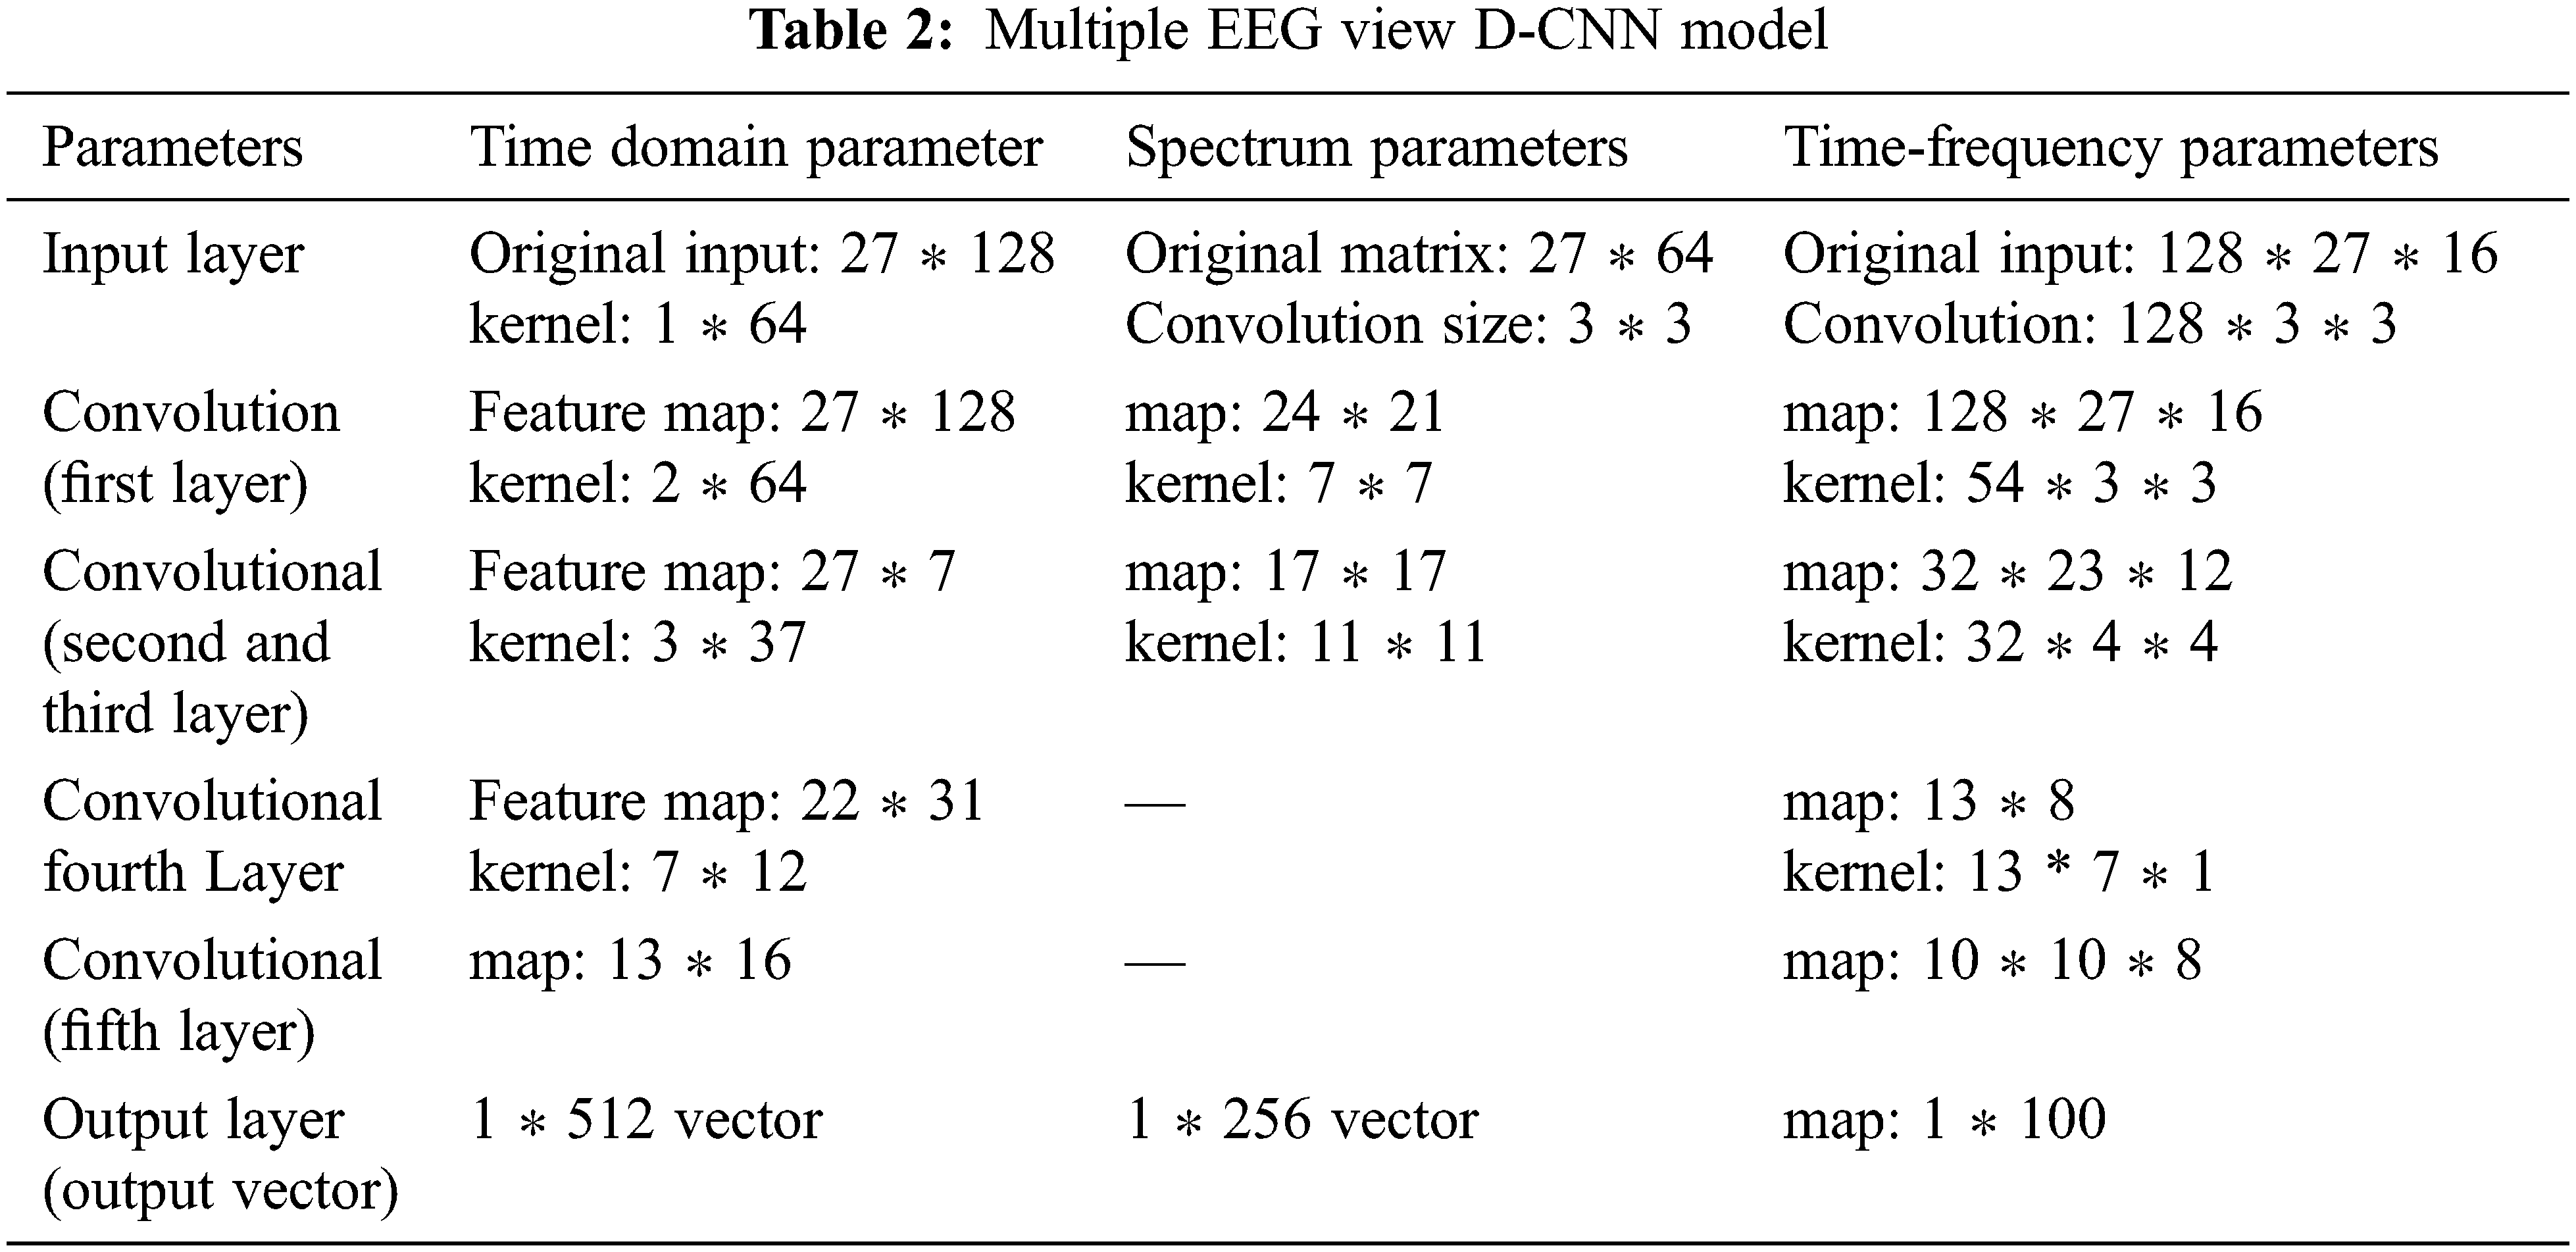
D-CNN is utilized to mine features from several perspectives to attain the spectrum features, time domain and time frequency features. Our model then Creates a multiple EEG view dataset of Encephalitis EEG founded on deep EEG extracted features. The D-CNN model structure and layers are depicted in Tab. 2.
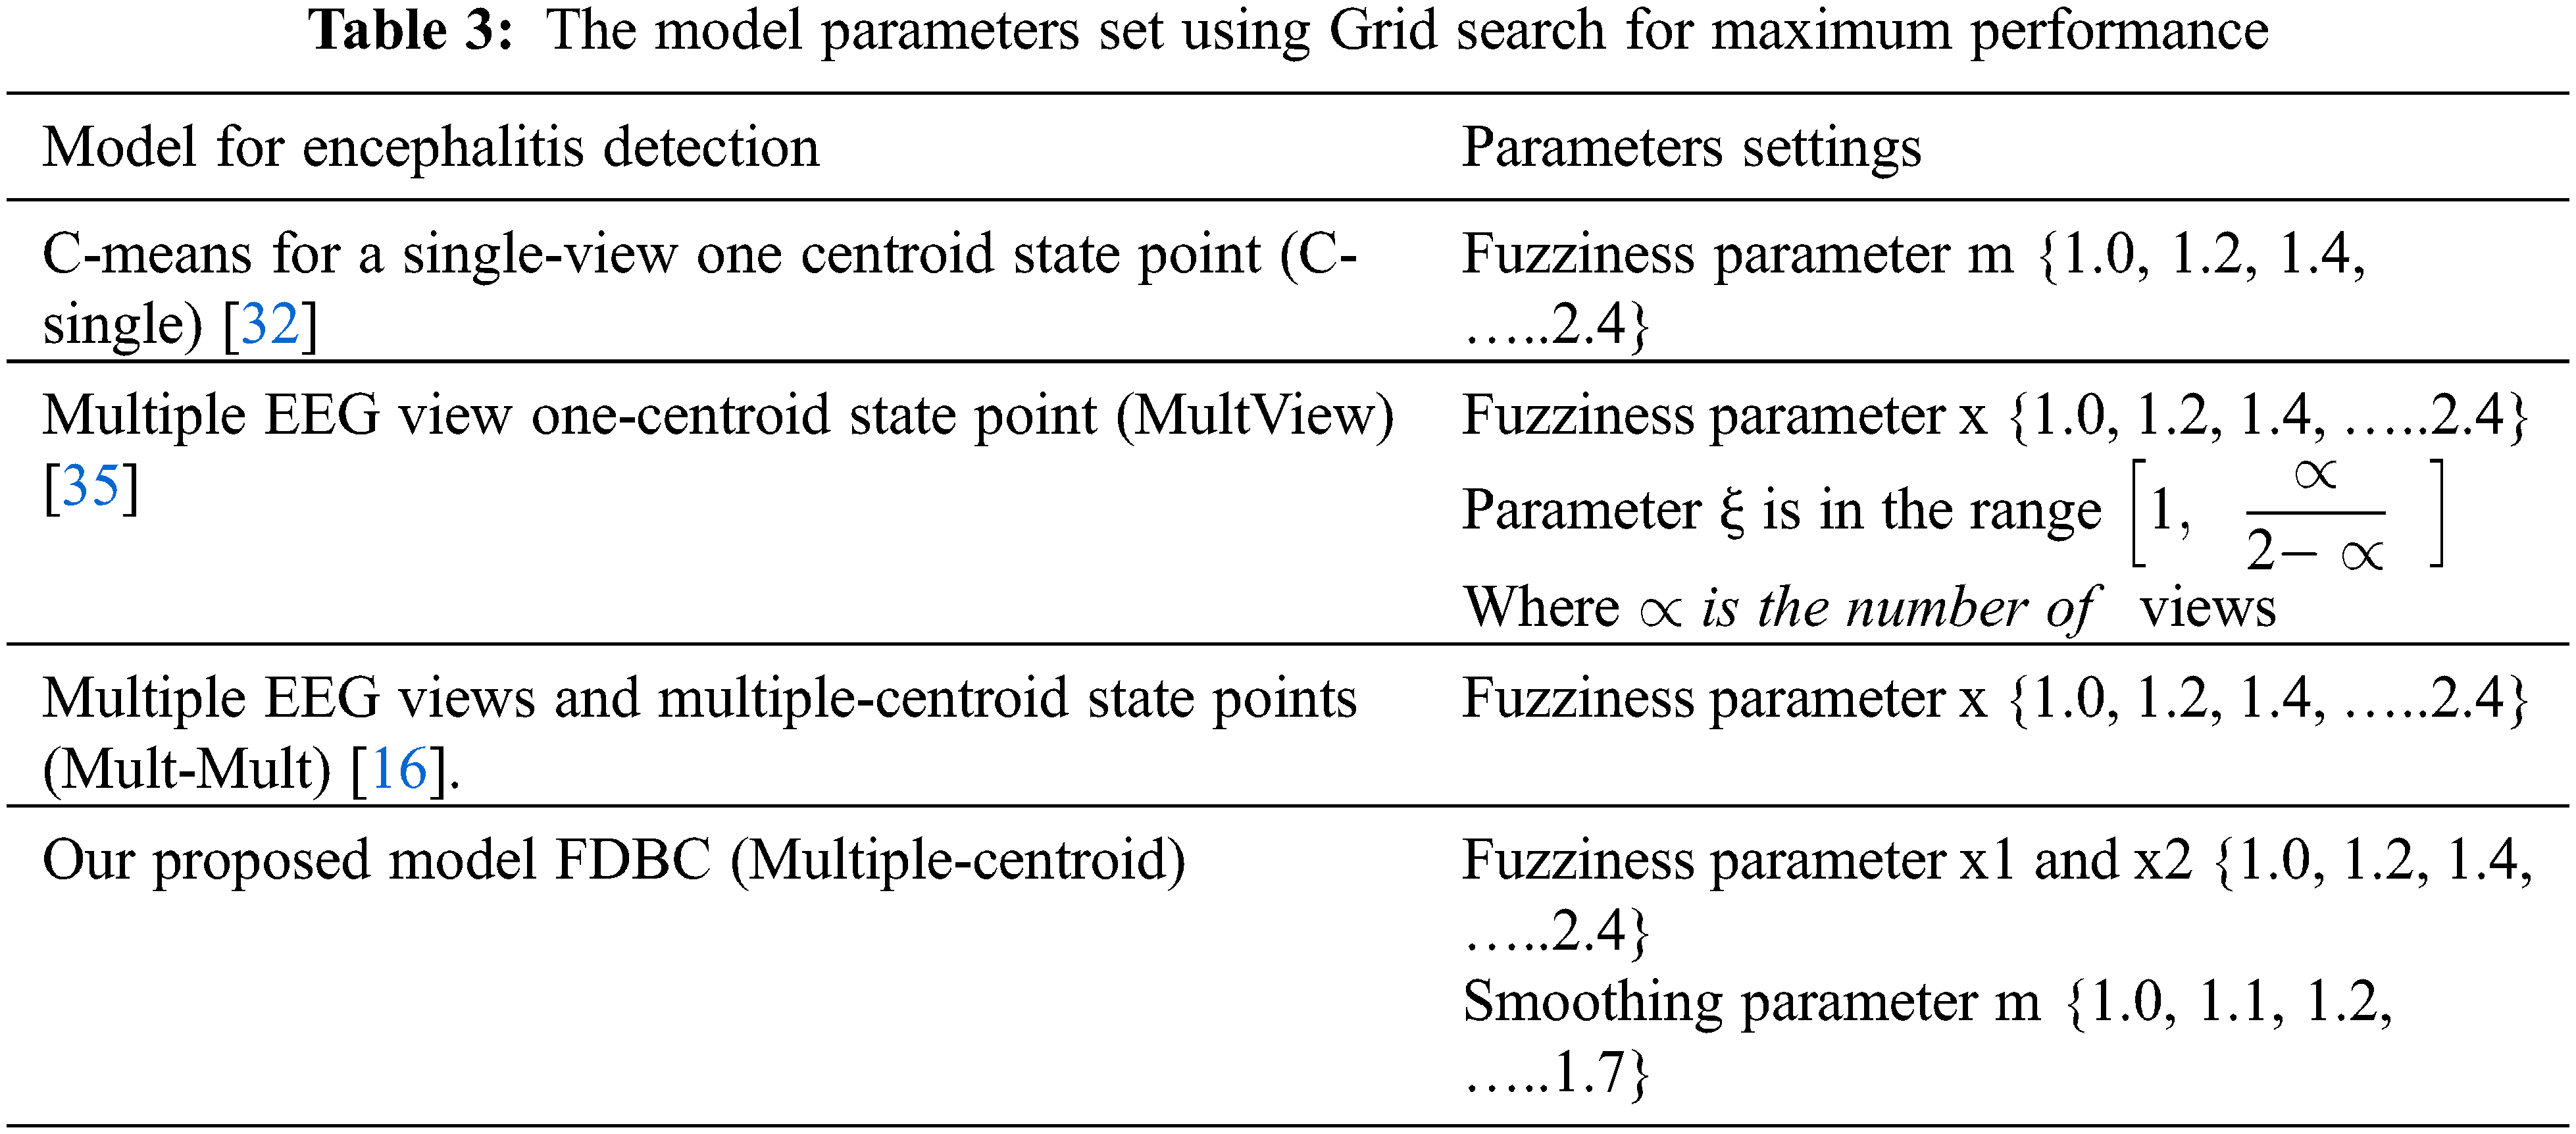
To validate the performance of the FDBC model in handling multiple EEG view data, three contrast comparative algorithms are chosen. The first algorithm is the C-means for a single-view one centroid state point (C-single) [32]. The second is a multiple EEG view one-centroid state point (MultView) [35] utilizing WV-C-means [26]. The third algorithm utilizes multiple EEG views and multiple centroids state points (Mult-Mult) [16]. To compare the precision and accuracy of each algorithm, the indication evaluation metrics utilized here are the normalized Information gain between 0 1nd 1 (NIG) and the Fowlkes–Mallows Index (FMI) depicted in Eq. (9). FMI defines the decline in the entropy of classes among the clusters [33]. The range of both metrics is between 0 and 1. the metric value is directly proportional to the cluster accuracy metric. The specific computation of the two indicators is referenced [23].
where
The model parameters are set using Grid search for maximum performance. Theses parameters are set to specific values for each model under comparison as well as for our model and depicted in Tab. 3.
The Processor (CPU), utilized in the executing the experiment, is an Intel i7-8200 CPU @ 3.30 GHz, the memory is 16.00 GB. We used MATLAB R3012a. The experiments were executed 200 runs and we took the average for the results.
The dataset utilized in this research is obtained from [15,16], they are public datasets. The dataset consists of 720 instances of healthy and Encephalitis EEG data and is divided into six subsets of 120 instances each. subsets 1 and 2 are EEG of from healthy cases, and subsets 3–6 are EEG of Encephalitis cases.
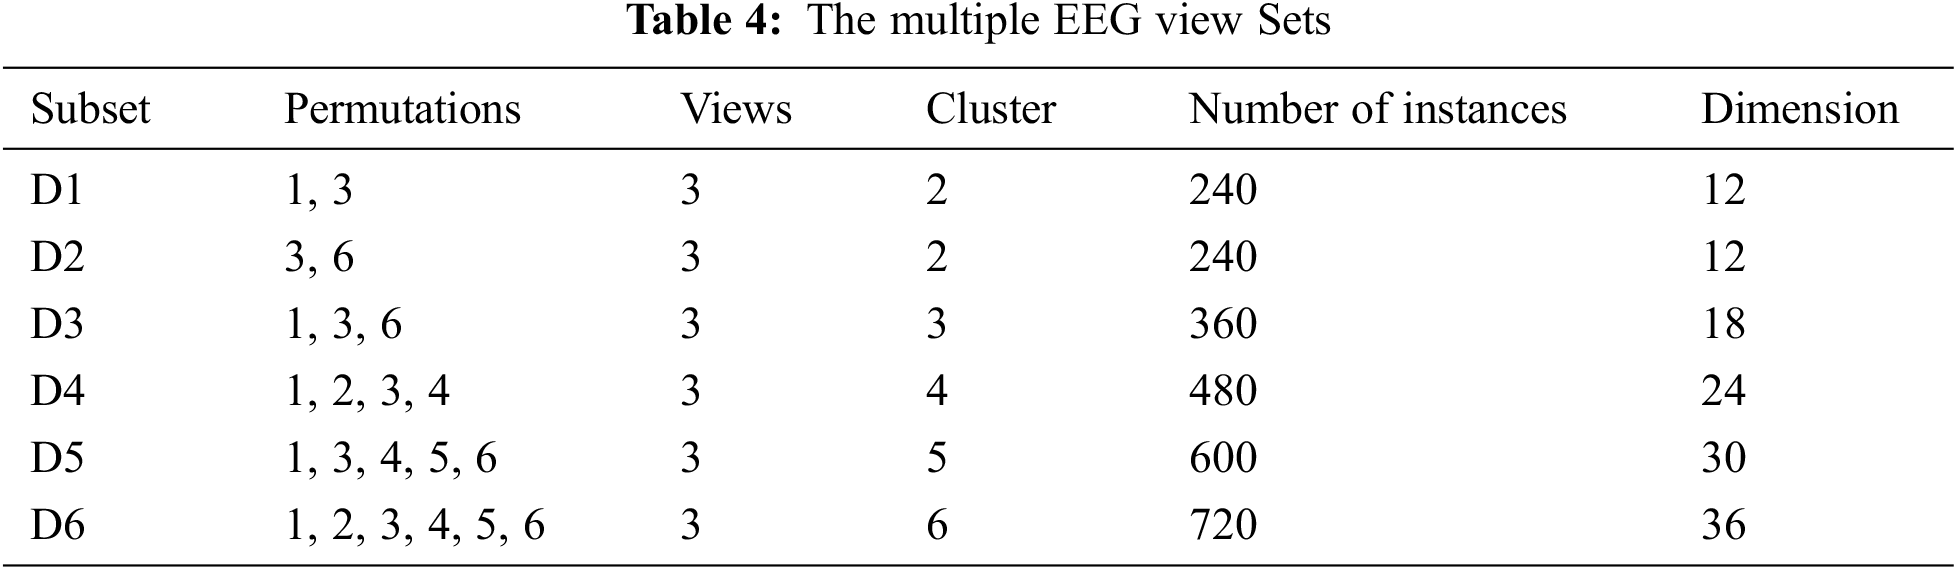
To build the multiple EEG view dataset necessary for our experiment, our work first utilizes feature extraction to mine the deep features from the EEG wave and, lately we incorporate the mined features into several permutations. One permutation is viewed as the employed dataset. The view order is equal to the feature extraction technique number. The feature extraction techniques utilized in this work are kernel component extraction (KCE), wavelet feature decomposition (WFD) and Discrete Fourier transform (DFT). There are three views and six constructed datasets. Tab. 4 depicts the details of the multiple EEG view sets, where Di is the dataset number i.
The results of the process of each model on the several multiple EEG view EEG sets are depicted in Tabs. 5 and 6.
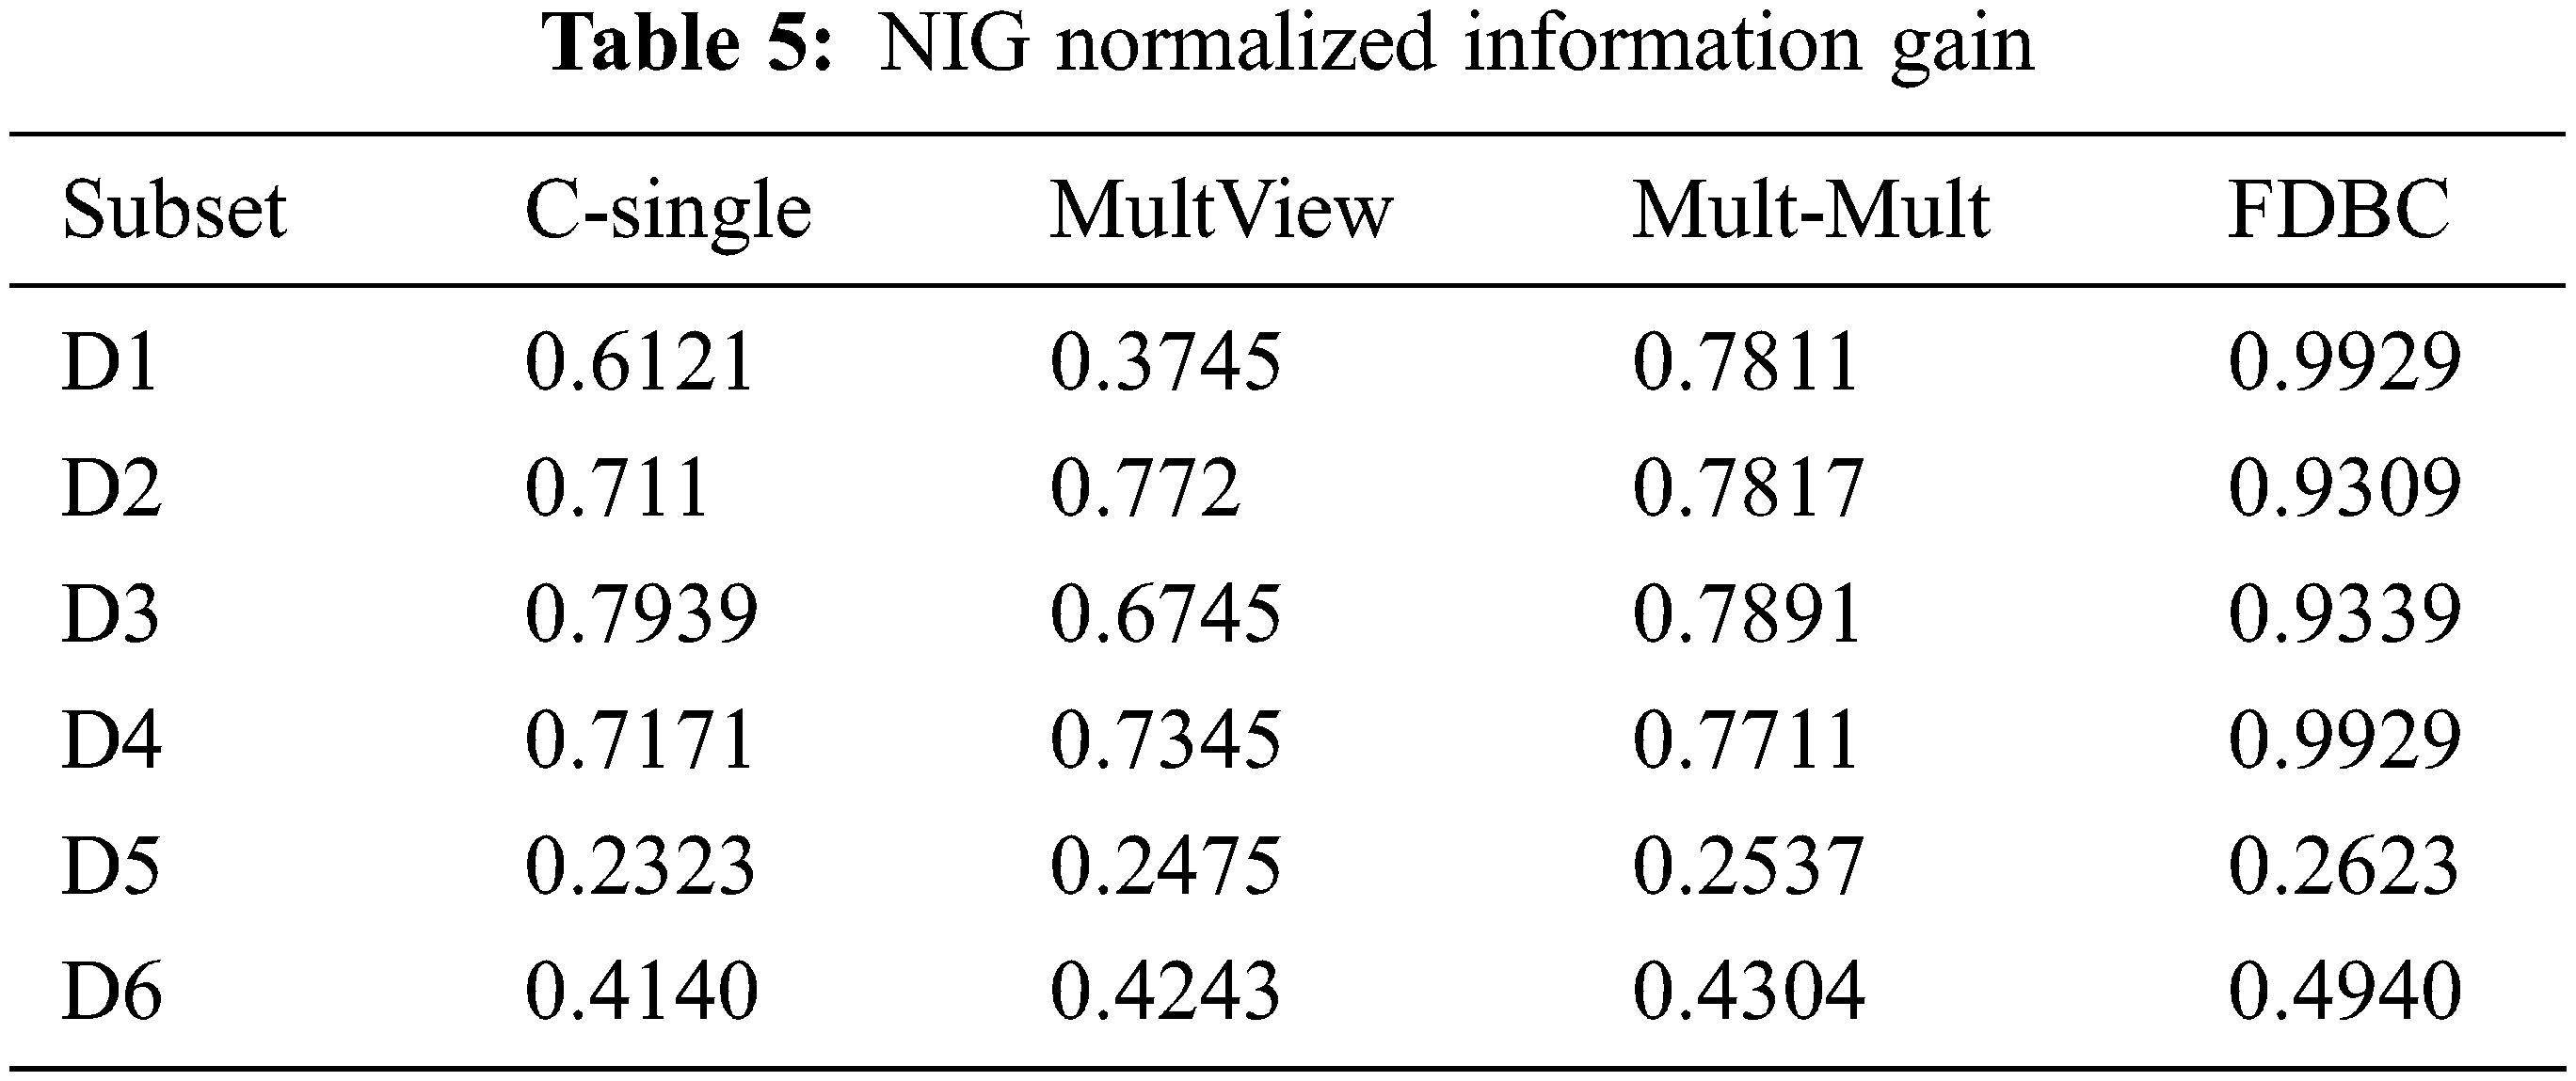
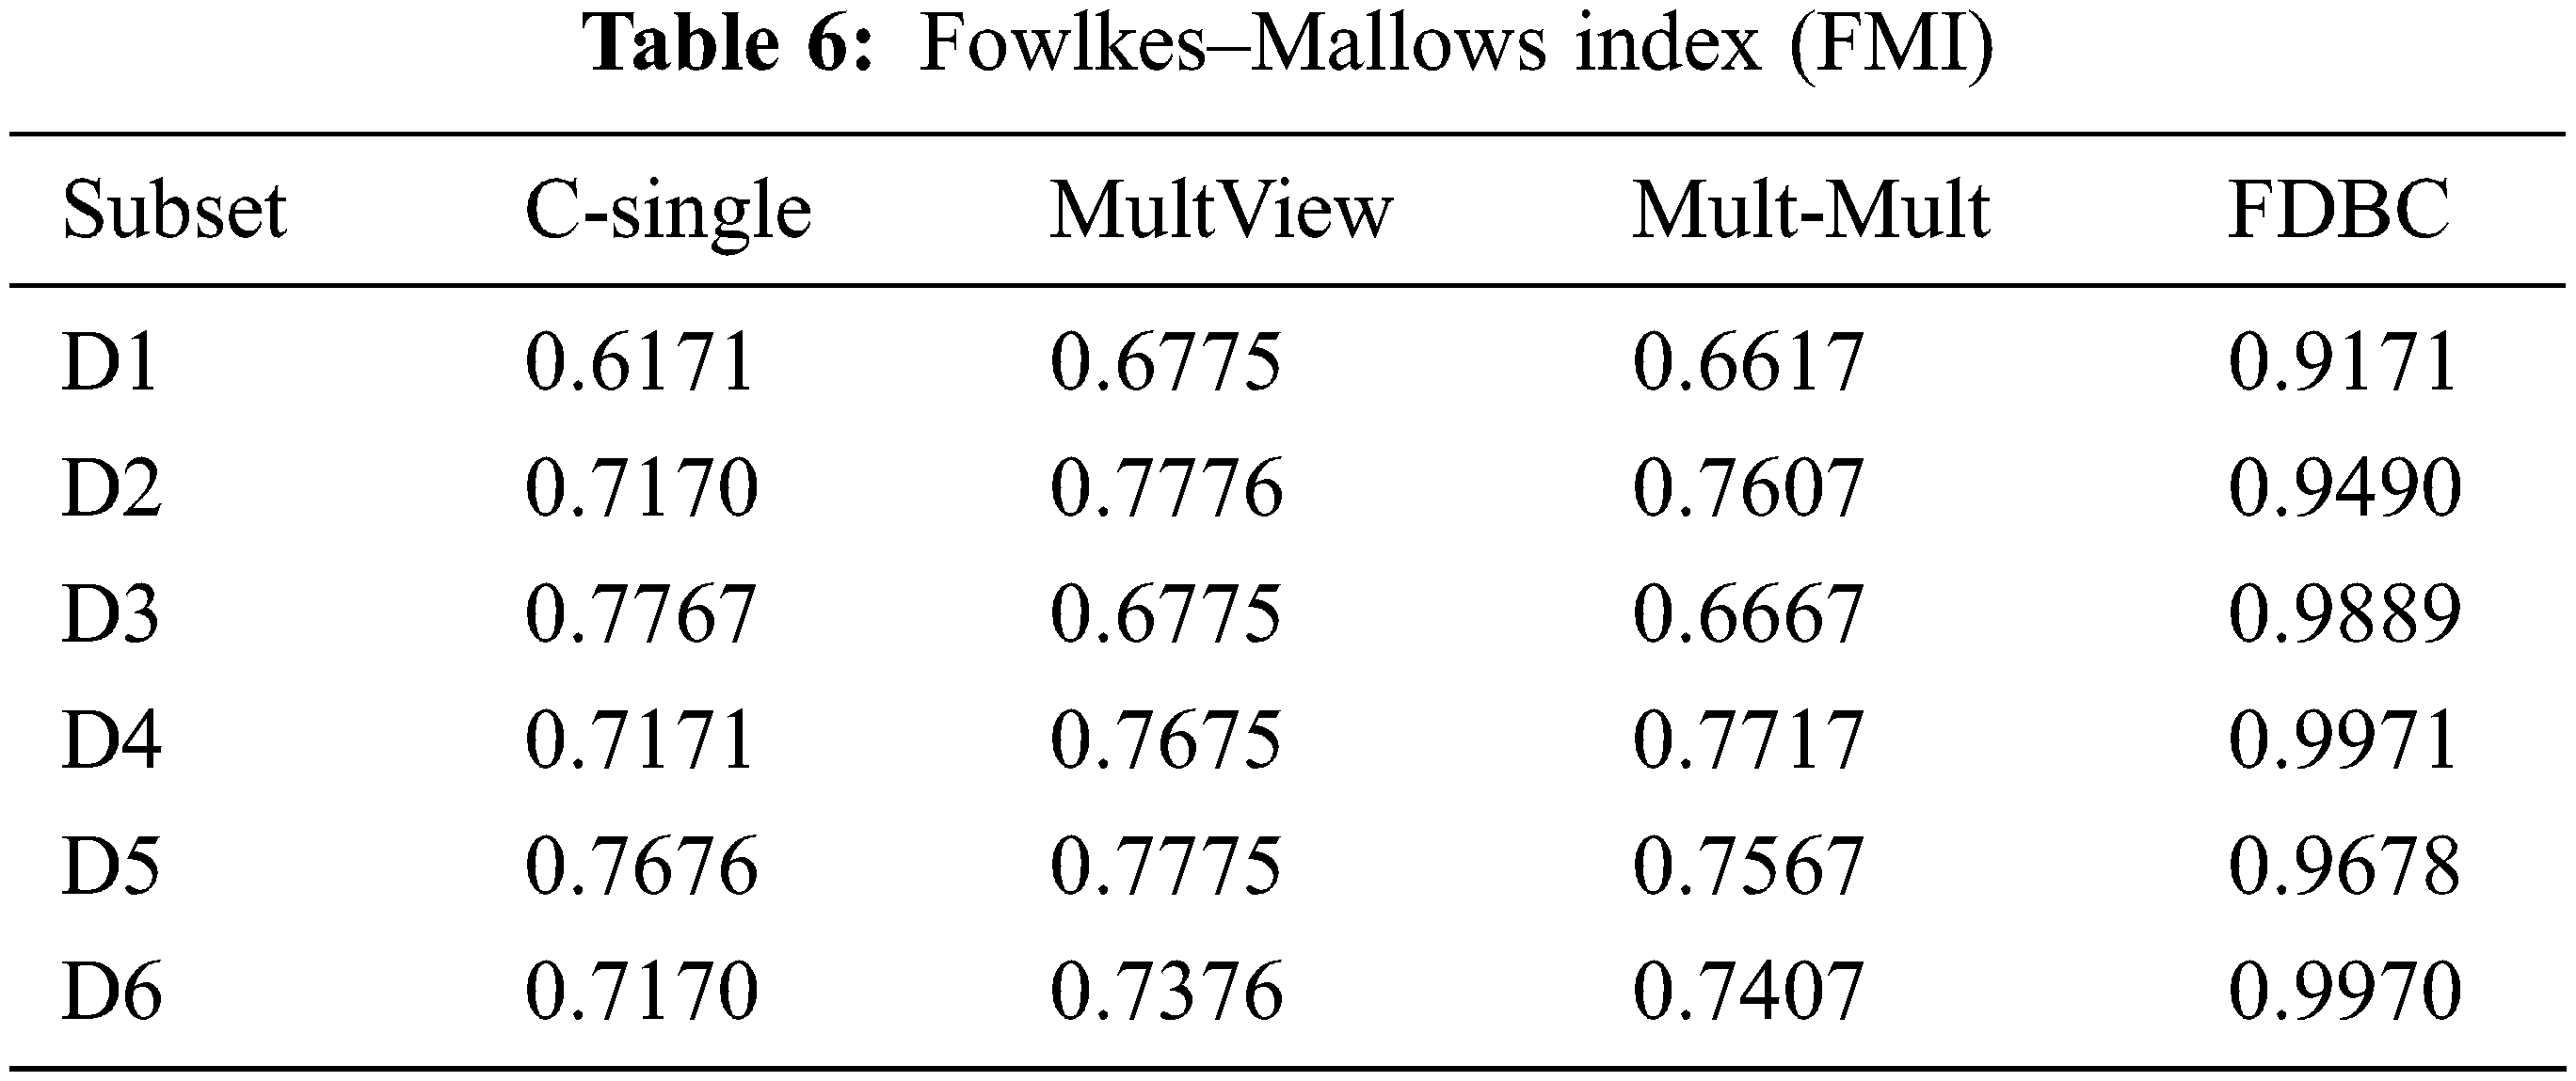
From the results depicted in Tab. 6, these conclusions are as follows:
1. For the multiple EEG view, it can be concluded from the results data of D1 to D6 that the clustering accuracy of the C-means for a single-view one centroid state point (C-single) [32] is worse than that of MultView [35], MultMult [16] and our proposed FDBC model. These observed results validate that the performance of the multiple EEG view models outperforms single-view models and more fit for multiple EEG view.
2. The performance of the multiple view MultView [35] is comparable to MultMult [16], indicating that this model did not improve the clustering accuracy which is very essential for the representation of medical data.
3. The FDBC model presented in this research has the best performance for D2 and D4, but the impact on the other subsets D1, D3, D5, and D6 was not optimal. Nevertheless, the FDBC model performance on the six data subsets outperforms that of single-view C-means, which validates that multiple EEG view model is more appropriate for multiple EEG view data. However, the FDBC model yields both an increase in clustering accuracy and an enhancement in the representation EEG data. It is validated that multiple centroids are wealthier and more precise because multiple centroids are medically expressive.
Other multi-view clustering techniques consider the significance of a single view to be similar for all clusters. But it was noted that in practice, there are many situations of higher clustering impact of some views than others. The final results are impacted by the weak views that have no small clustering features. This will reduce the clustering accuracy in many techniques. To alleviate this situation, our proposed FDBC model computes fuzzy scoring for each view and allocates scores according to the significance of each view. The impact of the computing of the view score on the clustering accuracy has also been investigated.
To define the score of each single view. Fig. 4 depicts the scoring of each view in the model for the D1 set, a multi view donates a different score in a different way to the resultant clustering. The scores of both the first two views are insignificant, demonstrating that the overlap between them is great, and the score of third view is higher, with the highest score is for view 4 and 5, demonstrating its high spatial features. The proposed technique enhances the clustering accuracy and prevents the sample interference that has lower quality.
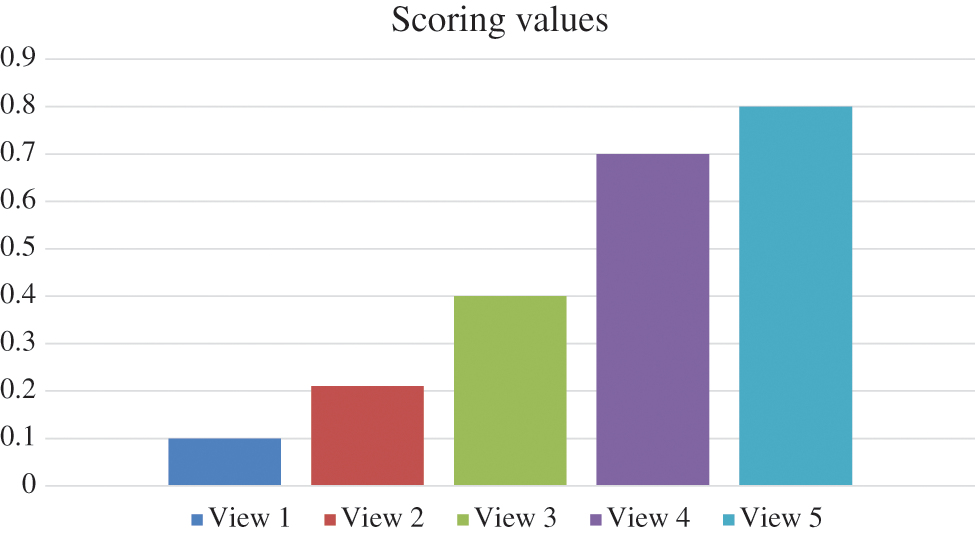
Figure 4: Average five scoring for the datasets from D1 to D5 in the proposed FDBC model
In this article, a EEG Fuzzy Density-Based Clustering Model with Multiple Centroid is proposed to investigate Encephalitis EEG spatial data. A multiple fuzzy view training model, using view scoring mechanism based on the objective function defined in Eq. (1), is proposed. The scoring system reflects the correlations and dissimilarities between the different view data; thus, the resultant accuracy inclines to be steady and robust. The fuzzy scoring mechanism assigns corresponding scores based on the impact of the view contribution. This enhances the clustering accuracy and prevents bad interference from unreverent data. The proposal of multiple centroids defines the cluster configuration in a more precise weight. EEG data definition needs typical points that can be medically significant. The clustering accuracy of the proposed FDBC model outperforms the state of the art methods, and improves the clustering accuracy considerably. The multiple centroids are then used in the training phase of the deep learning model. This technique enhances Encephalitis EEG data classifying. The multiple centroids are more medically expressive for the classifying of EEG data.
Although the model proposed in this article has an enhanced clustering impact resulting from the multiple EEG view of the Encephalitis records, future development in such research is anticipated. For instance, it will be imperative to study the impact of improving the clustering precision by preventing bad interference from irrelevant data and also from noises from EEG recordings.
Acknowledgement: we would like to thank Princess Nourah bint Abdulrahman University Researchers Supporting for supporting our Project with number (PNURSP2022R113), Princess Nourah bint Abdulrahman University, Riyadh, Saudi Arabia.
Funding Statement: This research was funded by Princess Nourah bint Abdulrahman University Researchers Supporting Project number (PNURSP2022R113), Princess Nourah bint Abdulrahman University, Riyadh, Saudi Arabia.
Conflicts of Interest: The authors declare that they have no conflicts of interest to report regarding the present study.
References
1. S. Chang and D. Lowenstein, “Encephalitis,” New England Journal of Medicine, vol. 12, no. 2, pp. 1257–1266, 2003. [Google Scholar]
2. K. Leemput, F. Maes, D. Vandermeulen, A. Colchester and P. Suetens, “Automatic segmentation of Encephalitis lesions by model outlier detection,” IEEE Transactions on Medical Imaging, vol. 12, no. 2, pp. 677–688, 2019. [Google Scholar]
3. O. Pampliega, M. Domercq, P. Villoslada, J. Sepulcre, A. Rodrígucz-Antigu ëdad et al., “Association of an eaat2 polymorphism with higher glutamate concentration in relapsing multiple sclerosis,” Journal of Neuro Immunology, vol. 1, no. 2, pp. 194–202, 2018. [Google Scholar]
4. A. Akselrod-Ballin, M. Galun, J. M. Gomori, M. Filippi, P. Val-sasina et al., “Automatic segmentation and classification of Encephalitis in multichannel EEG,” IEEE Transactions on Biomedical Engineering, vol. 9, no. 3, pp. 241–249, 2019. [Google Scholar]
5. J. Liu, C. D. Smith and H. Chebrolu, “Automatic Encephalitis detection based on integrated square estimation,” in Proc. IEEE Computer Society Conf. on Computer Vision and Pattern Recognition Workshops, Beingo, China, pp. 31–38, 2019. [Google Scholar]
6. S. Jain, D. Sima, A. Ribbens, M. Cambron, A. Maertens et al., “Automatic segmentation and volumetry of Encephalitis brain lesions from MR images,” NeuroImage: Clinical, vol. 3, no. 1, pp. 145–153, 2015. [Google Scholar]
7. Z. Zeng, S. Chen, L. Yin and R. Zwiggelaar, “Unsupervised segmentation for Encephalitis lesions in multimodality magnetic resonance images,” in 2015 8th Int. Conf. on Biomedical Engineering and Informatics (BMEI), Thania, Italy, pp. 126–130, 2015. [Google Scholar]
8. S. M. Ali and A. Maher, “Identifying Encephalitis lesions in MR images using image processing techniques,” in Proc. Al-Sadeq Int. Conf. on Multidisciplinary in IT and Communication Science and Applications (AIC-MITCSA), Riyadh, KSA, pp. 1–5, 2016. [Google Scholar]
9. T. Brosch, L. Tang, Y. Yoo, D. Li, A. Traboulsee et al., “Deep 3D convolutional encoder networks with shortcuts for multiscale feature integration applied to Encephalitis lesion segmentation,” IEEE Transactions on Medical Imaging, vol. 12, no. 5, pp. 1229–1239, 2016. [Google Scholar]
10. N. Gunawardena, R. Rajapakse and N. Kodikara, “Applying convolutional neural networks for pre-detection of Alzheimer’s disease from structural EEG data,” Information Systems, vol. 1, no. 1, pp. 1–7, 2017. [Google Scholar]
11. S. P. Washimkar and S. D. Chede, “Prediction of Encephalitis in brain EEG images using hybrid segmentation,” in Proc. Int. Conf. on Signal Processing and Communication (ICSPC), Paris, France pp. 234–239, 2017. [Google Scholar]
12. M. Alshayeji, M. Al-Rousan, H. Ellethy hanem and S. Abed, “An efficient Encephalitis segmentation and detection system using neural networks,” Computers Electrical Engineering, vol. 7, no. 1, pp. 191–205, 2018. [Google Scholar]
13. S. Aslani, M. Dayan, L. Storelli, M. Filippi, V. Murino et al., “Multi-branch convolutional neural network for Encephalitis lesion segmentation,” Bioinformatics, vol. 3, no. 1, pp. 34–42, 2018. [Google Scholar]
14. Y. Samah, B. Yassine and A. Naceur, “Encephalitis lesions detection from noisy magnetic resonance brain images tissue,” in Proc. 15th Int. Multi-Conf. on Systems Signals Devices (SSD), Paris, France, pp. 240–245, 2018. [Google Scholar]
15. Y.-D. Zhang, C. Pan, J. Sun and C. Tang, “Encephalitis identification by convolutional neural network with dropout and parametric Relu,” Journal of Computational Science, vol. 28, no. 2, pp. 123–132, 2018. [Google Scholar]
16. Q. Zhou and X. Shen, “Encephalitis identification by grey-level co-occurrence matrix and biogeography-based optimization,” in Proc. IEEE 23rd Int. Conf. on Digital Signal Processing (DSP), Cairo, Egypt, pp. 1–5, 2018. [Google Scholar]
17. E. Kats, J. Goldberger and H. Greenspan, “Soft labeling by distilling anatomical knowledge for improved MS lesion segmentation,” in Proc. IEEE 16th Int. Sym. on Biomedical Imaging (ISBI 2019), Athens, Greece, pp. 1563–1566, 2019. [Google Scholar]
18. P. Narayana, I. Coronado, S. Sujit, J. Wolinsky, F. Lublin et al., “Deep learning for predicting enhancing lesions in Encephalitis from non contrast EEG,” Radiology, vol. 2, no. 2, pp. 191–199, 2019. [Google Scholar]
19. X. Chen and J. H. Jiang, “A method of virtual machine placement for fault-tolerant cloud applications,” Intelligent Automation & Soft Computing, vol. 22, no. 4, pp. 587–597, 2016. [Google Scholar]
20. M. Salem, S. Valverde, M. Cabezas, D. Pareto, A. Oliver et al., “Encephalitis lesion synthesis in EEG using an encoder-decoder U-net,” IEEE Access, vol. 7, no. 2, pp. 171–184, 2019. [Google Scholar]
21. F. Rosa, A. Abdulkadir, M. Fartaria, R. Rahmanzadeh, P. Lu et al., “Encephalitis cortical and MS lesion segmentation at 3t EEG: A deep learning method based on flair and mp2rage,” NeuroImage: Clinical, vol. 2, no. 3, pp. 102–109, 2020. [Google Scholar]
22. G. Bujdosó, O. Novac and T. Szimkovics, “Developing cognitive processes for improving inventive thinking in system development using a collaborative virtual reality system,” in Proc. IEEE Int. Conf. Cognitive Infocommunications (CogInfoCom), Alexandria, Egypt, pp. 156–163, 2019. [Google Scholar]
23. L. Gazdi, K. D. Pomazi, B. Radostyan, B. Forstner and L. Szegletes, “Experimenting with classifiers in biofeedback-based mental effort measurement,” in Proc. IEEE Int. Conf. on Cognitive Infocommunications (CogInfoCom), Alexandria, Egypt, pp. 186–193, 2019. [Google Scholar]
24. R. Vassiliki, D. Arfani, K. Fragkopoulou, E. Danasi, S. Varlokosta et al., “Automatic detection of linguistic indicators as a means of early detection of Alzheimer’s and of related dementias: A computational linguistics analysis,” in Proc. IEEE Int. Conf. on Cognitive Bioinformatics, London, England, pp. 245–253, 2020. [Google Scholar]
25. J. Katona and A. Kovári, “Examine the learning efficiency by a brain-computer interface system,” Acta Polytechnica Hungarica, vol. 15, no. 3, pp. 251–280, 2018. [Google Scholar]
26. A. Hajdu, J. Toth, Z. Pistar, B. Domokos and Z. Torok, “An ensemble based collaborative framework to support customized user needs,” in Proc. IEEE Int. Conf. on Cognitive Infocommunications, Ostrava, CZ, pp. 285–290, 2019. [Google Scholar]
27. L. I. Komlosi and P. Waldbuesser, “The cognitive entity generation: Emergent properties in social cognition,” in Proc. IEEE Int. Conf. on Cognitive Infocommunications, Rome, Italy, pp. 439–442, 2020. [Google Scholar]
28. A. Danelakis, T. Theoharis and D. Verganelakis, “Survey of automated Encephalitis lesion segmentation techniques on magnetic resonance imaging,” Computerized Medical Imaging and Graphics, vol. 2, no. 3, pp. 451–462, 2019. [Google Scholar]
29. L. Farhi, R. Zia and Z. Ali, “Performance analysis of machine learning classifiers for brain tumor MR images,” Sir Syed University Research Journal of Engineering and Technology, vol. 8, no. 1, pp. 23–28, 2018. [Google Scholar]
30. C. Loizou, E. Kyriacou, I. Seimenis, M. Pantziaris, S. Petroudi et al., “Brain white matter lesion classification in Encephalitis subjects for the prognosis of future disability,” Intelligent Decision Technologies, vol. 7, no. 1, pp. 3–10, 2020. [Google Scholar]
31. C. Loizou, V. Murray, M. Pattichis, I. Seimenis, M. Pantziaris et al., “Multiscale amplitude-modulation frequency-modulation (AM--FM) texture analysis of encephalitis in brain EEG images,” IEEE Transactions on Information Technology in Biomedicine, vol. 12, no. 1, pp. 119–129, 2021. [Google Scholar]
32. C. Loizou, M. Pantziaris, C. Pattichis and I. Seimenis, “Brain MR image normalization in texture analysis of Encephalitis,” Journal of Biomedical Graphics and Computing, vol. 3, no. 1, pp. 148–159, 2019. [Google Scholar]
33. C. Loizou, S. Petroudi, I. Seimenis, M. Pantziaris and C. Pattichis, “Quantitative texture analysis of brain white matter lesions derived from T2-weighted MR images in MS patients with clinically isolated syndrome,” Journal of Neuroradiology, vol. 12, no. 2, pp. 99–114, 2019. [Google Scholar]
34. D. Collins, A. Zijdenbos, V. Kollokian and C. Evans, Design and Construction of a Realistic Digital Brain Phantom. Lafayette, LA, USA: McGill University brain database, 2019, [Online]. Available: http://www.bic.mni.mcgill.ca/brainweb/. [Google Scholar]
35. R. K.-S. Kwan, A. C. Evans and G. B. Pike, “EEG simulation-based evaluation of image-processing and classification methods,” IEEE Transactions on Medical Imaging, vol. 18, no. 11, pp. 1085–1097, 2019. [Google Scholar]
36. X. R. Zhang, J. Zhou, W. Sun and S. K. Jha, “A lightweight CNN based on transfer learning for COVID-19 diagnosis,” Computers, Materials & Continua, vol. 72, no. 1, pp. 1123–1137, 2022. [Google Scholar]
37. X. R. Zhang, X. Sun, W. Sun, T. Xu and P. P. Wang, “Deformation expression of soft tissue based on BP neural network,” Intelligent Automation & Soft Computing, vol. 32, no. 2, pp. 1041–1053, 2022. [Google Scholar]
Cite This Article
 Copyright © 2023 The Author(s). Published by Tech Science Press.
This work is licensed under a Creative Commons Attribution 4.0 International License , which permits unrestricted use, distribution, and reproduction in any medium, provided the original work is properly cited.
 Downloads
 Citation Tools