
 Submit a Paper
 Propose a Special lssue
 Open Access
ARTICLE
Twitter Media Sentiment Analysis to Convert Non-Informative to Informative Using QER
1 Department of Computer Science and Engineering, Sri Ranganathar Institute of Engineering and Technology, Coimbatore, 641009, Tamilnadu, India
2 Department of Artificial Intelligence and Machine Learning Saveetha School of Engineering, Chennai, 602105, Tamil Nadu, India
3 Department of Computer Science and Engineering, Sreesakthi Engineering College, Karamadai, 641104, Tamil Nadu, India
4 Department of Computer Science and Engineering, Mahendra Engineering College, Namakkal, 637503, Tamil Nadu, India
* Corresponding Author: C. P. Thamil Selvi. Email:
Intelligent Automation & Soft Computing 2023, 35(3), 3545-3555. https://doi.org/10.32604/iasc.2023.031097
Received 10 April 2022; Accepted 13 May 2022; Issue published 17 August 2022
 View Full Text
 Download PDF
Abstract
The term sentiment analysis deals with sentiment classification based on the review made by the user in a social network. The sentiment classification accuracy is evaluated using various selection methods, especially those that deal with algorithm selection. In this work, every sentiment received through user expressions is ranked in order to categorise sentiments as informative and non-informative. In order to do so, the work focus on Query Expansion Ranking (QER) algorithm that takes user text as input and process for sentiment analysis and finally produces the results as informative or non-informative. The challenge is to convert non-informative into informative using the concepts of classifiers like Bayes multinomial, entropy modelling along with the traditional sentimental analysis algorithm like Support Vector Machine (SVM) and decision trees. The work also addresses simulated annealing along with QER to classify data based on sentiment analysis. As the input volume is very fast, the work also addresses the concept of big data for information retrieval and processing. The result comparison shows that the QER algorithm proved to be versatile when compared with the result of SVM. This work uses Twitter user comments for evaluating sentiment analysis.Keywords
Mind reading is the greatest challenge in sentiment analysis. Generally, the output of such reading results in the information that a user actually wants. Rather than asking others what they feel, instead of reading their mind is rather an interesting task [1]. The challenges in reading online information when compared with the data growth rate that has grown drastically in volumes. While fetching the enormous volumes of data that are both times consuming and have both relevant and irrelevant information. Moreover, the tremendous growth of online users also makes an urge of using sentiment analyzing techniques in order to provide the desired results [2].
It’s a type of natural language processing where the review comments are categorized as either positive/or negative. Generally, all observations in the sentimental analysis are labelled only in these two categories whereas the third category is neutral [3,4]. In this work, the third category is highlighted to trigger the irrelevant cases into irrelevant. The following are the observations are done to evaluate sentimental analysis (1) Feature selection (2) Information processing and (3) Information classifications.
Before subjecting the data for processing, the irrelevant information was removed using traditional statistical methods like CHI square test. Such methods improve the data efficacy. The introduction of supervised learning methods like SVM, Bayes methods, and Decision tree supports in decision making and reviews.
The text-based classifications are the key term to be addressed in sentimental analysis. In order to forecast sentiment analysis based on reviews like “Great”, “Super”, and “Awesome” are some of the key terms to be used to describe positivity in review comments. Such comments will assist in positive review analysis based on the comments posted by the users. While using such terms like “Great” in sentimental analysis the remaining portion of the comments also justifies the same expressions. Example “The Mobile is Great”. In this example, the “Great” keyword is alone considered to make a positive impact to express sentiment feelings.
When such terms are not used in a review result in negative feedback and the results of neutral comments arise when there are no comments or there are no special tag hints like “Good” or “Bad” that justify the review. In this work, the review in the sentimental analysis is evaluated using QER algorithm that reduces the maximum factors that are considered for evaluating sentiments. The use of QER algorithm classifies the review as informative or non-informative using a sentimental analysis algorithm. The work also addresses the key concepts of introducing traditional statistical methods CHI Square test to classify the review in either of two categories like information or non-informative. On receiving the results as non-informative they are further subjected to QER. The results are compared with SVM for feature selection on different review comments data sets. The objective of this paper is to reduce the overall data size along with the time constraints. Since the time consumption is directly proportional to data volume. Such evaluation provides accuracy in sentimental analysis when data volumes are increased.
The concepts of this paper are organized as follows. The survey addresses the earlier works addressing the same on different perspectives. The algorithm addresses different classifications of the algorithm used to deal with sentiment analysis. Existing and proposed methods compare the present work with the earlier algorithm versions. Results and discussion addressing the results achieved with fixed and variable data sets and finally conclusion and future works deal with the extended approaches to be made from the present conditions.
Sentimental Analysis (SA) plays a vital role in analyzing sentiments using natural language processing. It also supports Artificial intelligence along with the machine language to automate the process of handling sentiment analysis. When a comment is made and taken as a review, it is classified as positive and negative. There is no need to focus on the positive and whereas in the case of the negative, efforts have to be taken to fine-tune the process based on review comments.
Apart from negative comments, there is another zone to be focused i.e., neither positive nor negative. Such cases need to be focused and given the additional privilege of sentiment analysis to predict how to convert neither positive nor negative case to positive [5]. This work addresses this as a special case and uses simulated annealing to classify the comments using QER instead of traditional classifier methods like Bayes, entropy modeling, SVM and decision trees. From the various list of studies made to address these issues, the work of Yuan et al. [6] addresses SVM methods for analyzing accurate internet traffic classifications. The use of SVM identifies network classification based on network flow parameters using multiple classifier selection. Ranking methods based on classification are not mentioned in the work despite using multiple classifiers.
Utkin et al. [7] address double quality representation using the mini-max strategy in decision making. The concepts also deal with binary and single classification for SVM related issues. The data set used in this work uses set and interval-valued training set and proved the efficacy of machine learning using this approach. Nie et al. [8] address the need of using Stochastic Variational Bayes (SVB) on large datasets using by-vector multiplications. The concepts address parallel computing interpreted with a multi-core server. The results shown in this work use an algorithm to give stable performance via an interface using a framework like Lib-Linear toolbox.
Liu et al. [9] addresses the need for SVM using a wide range of traversal algorithms and intelligent iterative algorithms that uses parameterized optimizations. When using traditional methods, is not suitable for huge volumes of datasets. The work also addresses various optimization methods that use contour plots with cross-validation for ensuring their accuracy. Using optimization techniques, reduces the overall factors based on verification factors. Anjaria et al. [10] address the factors for providing opinion-based text mining using supervised learning. The user influence factor is addressed to predict the outcome of the evaluation results. The concept also deals with hybrid mechanisms using either direct or indirect data. The use of principal component analysis along with SVM is used to reduce dimensional reduction.
Lakshmanaprabu et al. [11] uses the concepts of Social IoT to address the hierarchical framework for feature extraction. The noise in data is removed using Gabor filter and the unwanted data is received using the supervised classifier model. The work also addresses the concept of Hadoop Map Reduce in order to improve the efficiency of the proposed work. The use of Elephant herd optimization is used to filter data based on feature selection. Nirmal et al. [12] use a huge volume of data for an unstructured approach using parallel preprocessing algorithms. This preprocessing algorithm eliminates words, and symbols along with frequency mapping. The work takes input from Twitter input feeds with Hadoop map architecture. The timely processed data addresses the pros and cons of pre-processed data. Sapountzi et al. [13] proposes a sophisticated classification of data by considering the diversity of practices, methods and techniques. The proposed method demonstrated the entire spectrum of social data networking study and their associated frameworks.
3 Sentimental Classification Algorithm
The major difference between Naïve Bayes and Bayes multinomial is that the former uses independence assumption whereas the prior uses multinomial distributions.
The naïve Bayes assumes every case as an independent assumption instead of independent distributions whereas conditional independency addresses various classes. The features of formality for probability observation using the features f1 till fn. The function of the class is defined as c and the naïve Bayes makes the assumptions as follows.
In the classification of naïve bayes, the probability of class functions is defined by
The above function excludes a few functions based on its limitations. The above function is used to count the entire text that including word counts.
For any variable x defined in overall chain functions Ck then and x is the individual variable
When X is the proof of vector based on the functions
Bayes Assumptions
The function
While substituting the above-mentioned probability class functions yields
Bayes Multinominal
When comparing two words for assumption the use of multinomial functions as distribution makes the generalization of the binomial distribution.
In order to observe the overall count, then the observed count in the document is measured by
Text processes in general deal with Information retrieval, Sentiment Analysis, Information extraction, Machine translation and finally Question answering. Out of all in-text processing, decision tree plays a vital role in sentiment analysis. Generally, sentiment analysis deals with extracting features based on textual datasets. The data sets deal with more volume of user input. All such input has many dimensions of approaches either to send a comment or to receive feedback. The biggest challenges in these approaches are data segregation.
Decision tree decides on the factors of positive, negative or neutral. The value for positive is set as 1 and for negative is 0 and for neutral is neither 1 nor 0 in specific its −1. While considering the Corpus (Collection of texts) represented as C and the detection factors are represented as D. The list makes the analysis within C for every D in the list. The observation factors of D within C represent the overall search factors of text that leads to the Cartesian factors for every D of C is D × C.
If we have two sets of the list has the overall comments made by the user for a product is represented by
D1: The product is good
D2: Superb
In both the cases it describes the quality of the product, whereas one vertical gives a clear picture in terms of the comment and whereas the other simply addresses its edibility. While combining these two factors for evaluating the overall comment of the product, and which is described by the list of product corpus
C = {PRODUCT, SPECIFICATION, PERFORMANCE}
Then D x C is represented by the Tab. 1.
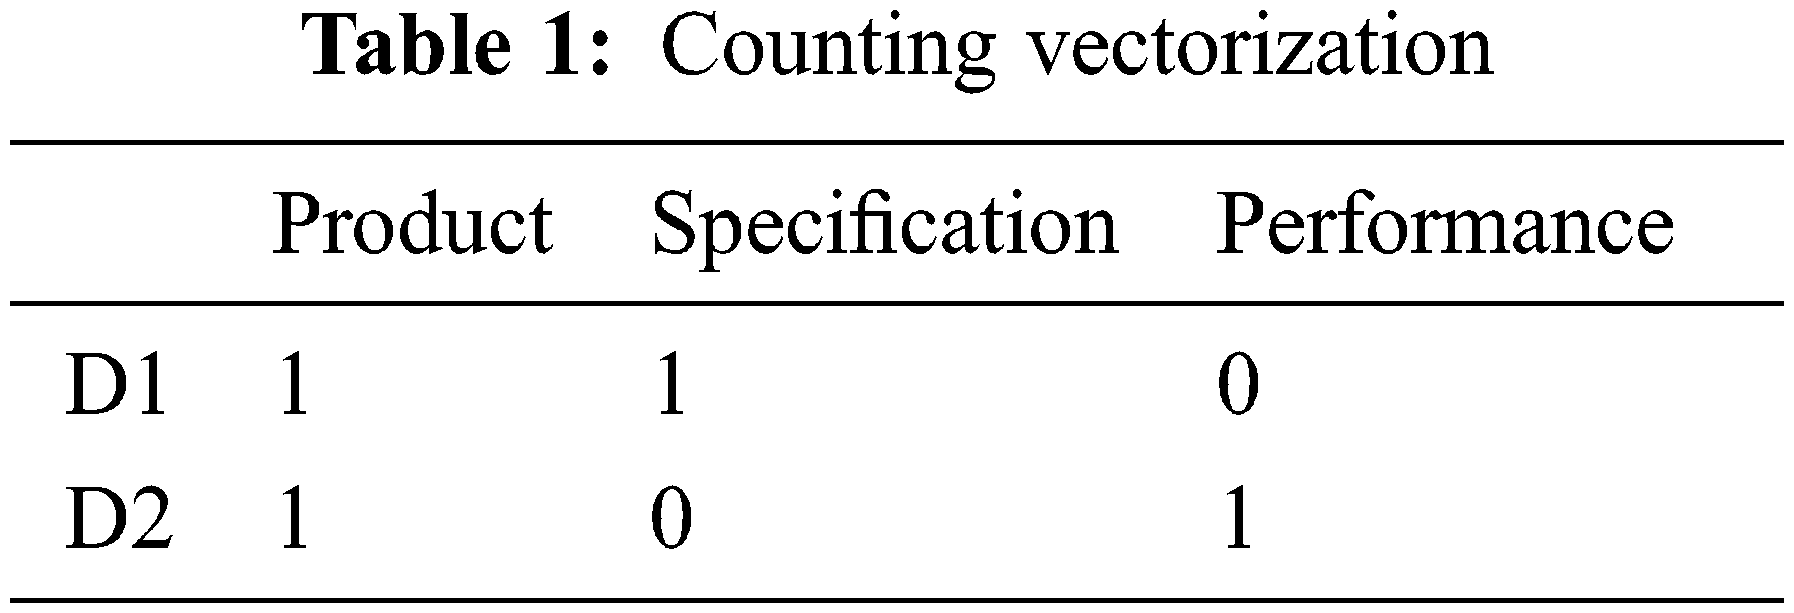
Tab. 1 represents the counting vectorization and the combination of terms gives the exact prediction of the terms. The importance of term frequency is addressed by TF for the Decision tree is given by the equation as mentioned below:
DTF = No. of time a work occurs in the corpus
If a corpus consists of 200 words then the overall count of the words occurring in the document is 30, then the resultant 30/200 = 0.15
In order to identify the reverse factor of Term frequency, then based on the assumption if the overall identified word comes as 10000 from 1 lac words of the overall document, then it is calculated by
The next step in this evaluation is to separate training set along with data validation.
The existing method uses the concept of SVM for evaluating customer preference and their choice along with their review report. The work deals only with Yes/No type and it didn’t focus on neutral comments. The existing work deals with word correlation using association miner. The fitness value is calculated using word frequency with dendrograms to measure the frequency distance. The concept of simulated annealing is used along with SA-MSVM in order to convert the evaluation into a heuristic search. The following are the key observation and updation done in the proposed work based on the existing work. The overall process flow of the proposed work is shown in Fig. 1.
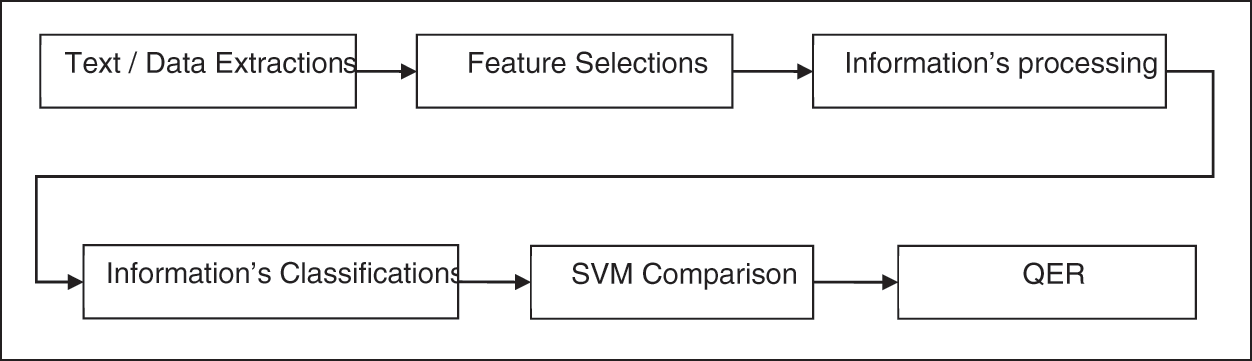
Figure 1: The overall process flow
Stage 1: Retrieves data and converts data into a prescribed format for data validations
Stage 2: Implements feature selection from the data validations
Stage 3: The data is preprocessed to separate from a training data set
Stage 4: The data is classified based on Yes/No types as one division and Neutral comments as to other division
Stage 5: Data set comparisons
Stage 6: Implement QER to convert neutral comments into near positive
The QER feature selection uses feature scores taken from two different tables that are evaluated and stored from earlier evaluations. The concept behind QER is evaluated when the feature score is low as the positive and negative values are high. The resultant process again two different evaluation platforms as feature scores with positive and negative. Let us assume the feature score as a neutral comment and enhance this score to make it more positive. The classification process has the most impact score towards sentimental analysis as the input parameters are yes/no as one parameter and neutral score as another.
QER, when compared with other algorithms like IG, OCFS, DFD, CHI2, are good at classifying features whereas QER gives feature analysis along with probabilities and provides summation between two probabilities. The analyses were done with yes/no as one set of probabilities and the other set deals with a neutral score.
While calculating F measures using QER that provide results based on precision and recall as its performance metrics. The correct classification set is precision and recall is the entire set of classifications.
The F measures in this analysis deals with neutral comment and its evaluated based on the equation
The work deals with the market basis analysis for evaluating and recommending the product based on customer satisfaction. Generally, the analysis is done based on yes or no pattern. Such a pattern gives analysis of the product strictly only on two evaluating values and results conclude whether the product is recommended or not. The confidence levels are evaluated based on 49122 rules using a scatter plot by setting the confidence level. The result of the above confidence level is represented in the Fig. 2. The confidence level is increased based on the percentage increase in either acceptance or rejection of a specific product either individually or as a whole product. The data validation is done for the training data set based on the frequent word used in the word evaluation using DTF. The total number of times a word is used for evaluating the product is done based on the frequency. The reverse factor (IDTF) is not evaluated as the above confidence level is done for the yes/no pattern.
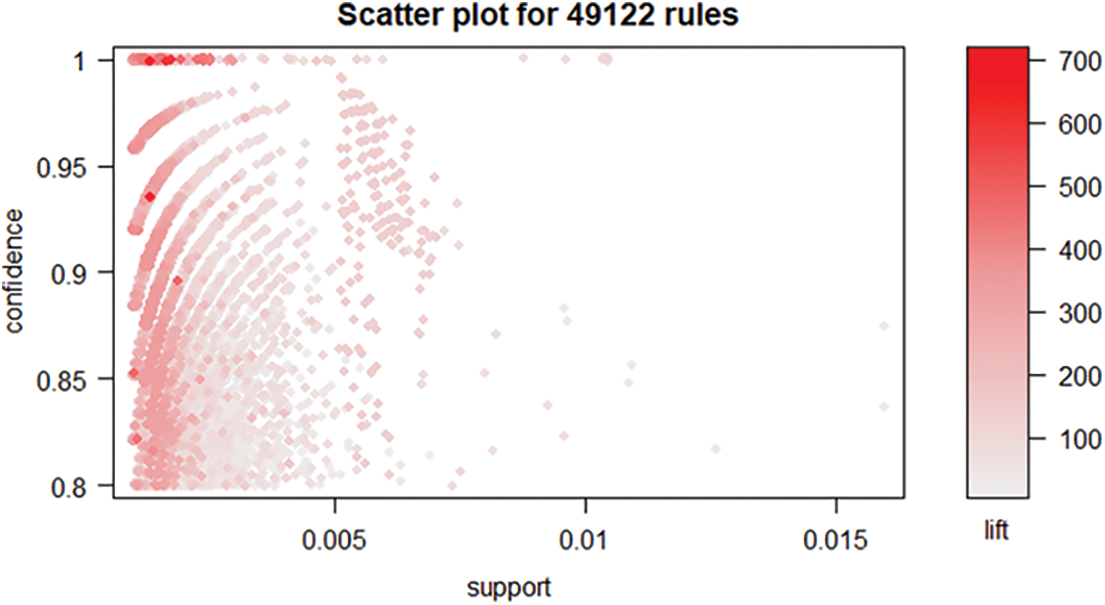
Figure 2: Scatter plot for a confidence level
In order to focus on yes/no type for separating key data for interpreting the results for QER, the work implements two key plots for overall observation based on the customer input for product recommendations and evaluations. The two key plots take the rules-object and measure as parameters for result interpretations and the below Fig. 3 shows the results of the rules-object method based on the product ordered by a customer.
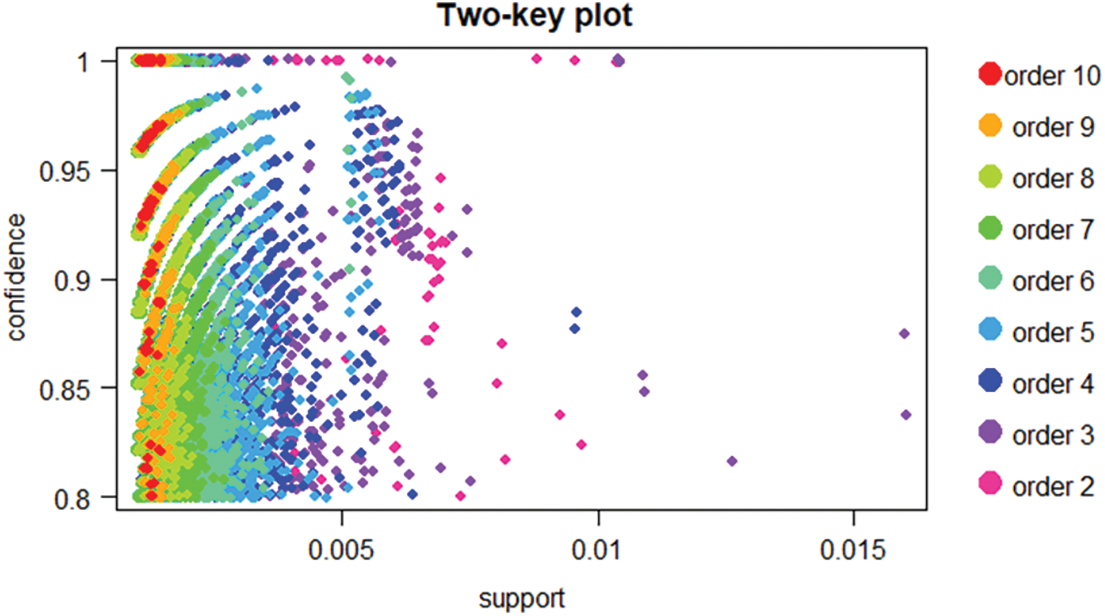
Figure 3: Two key plot for confidence level for order
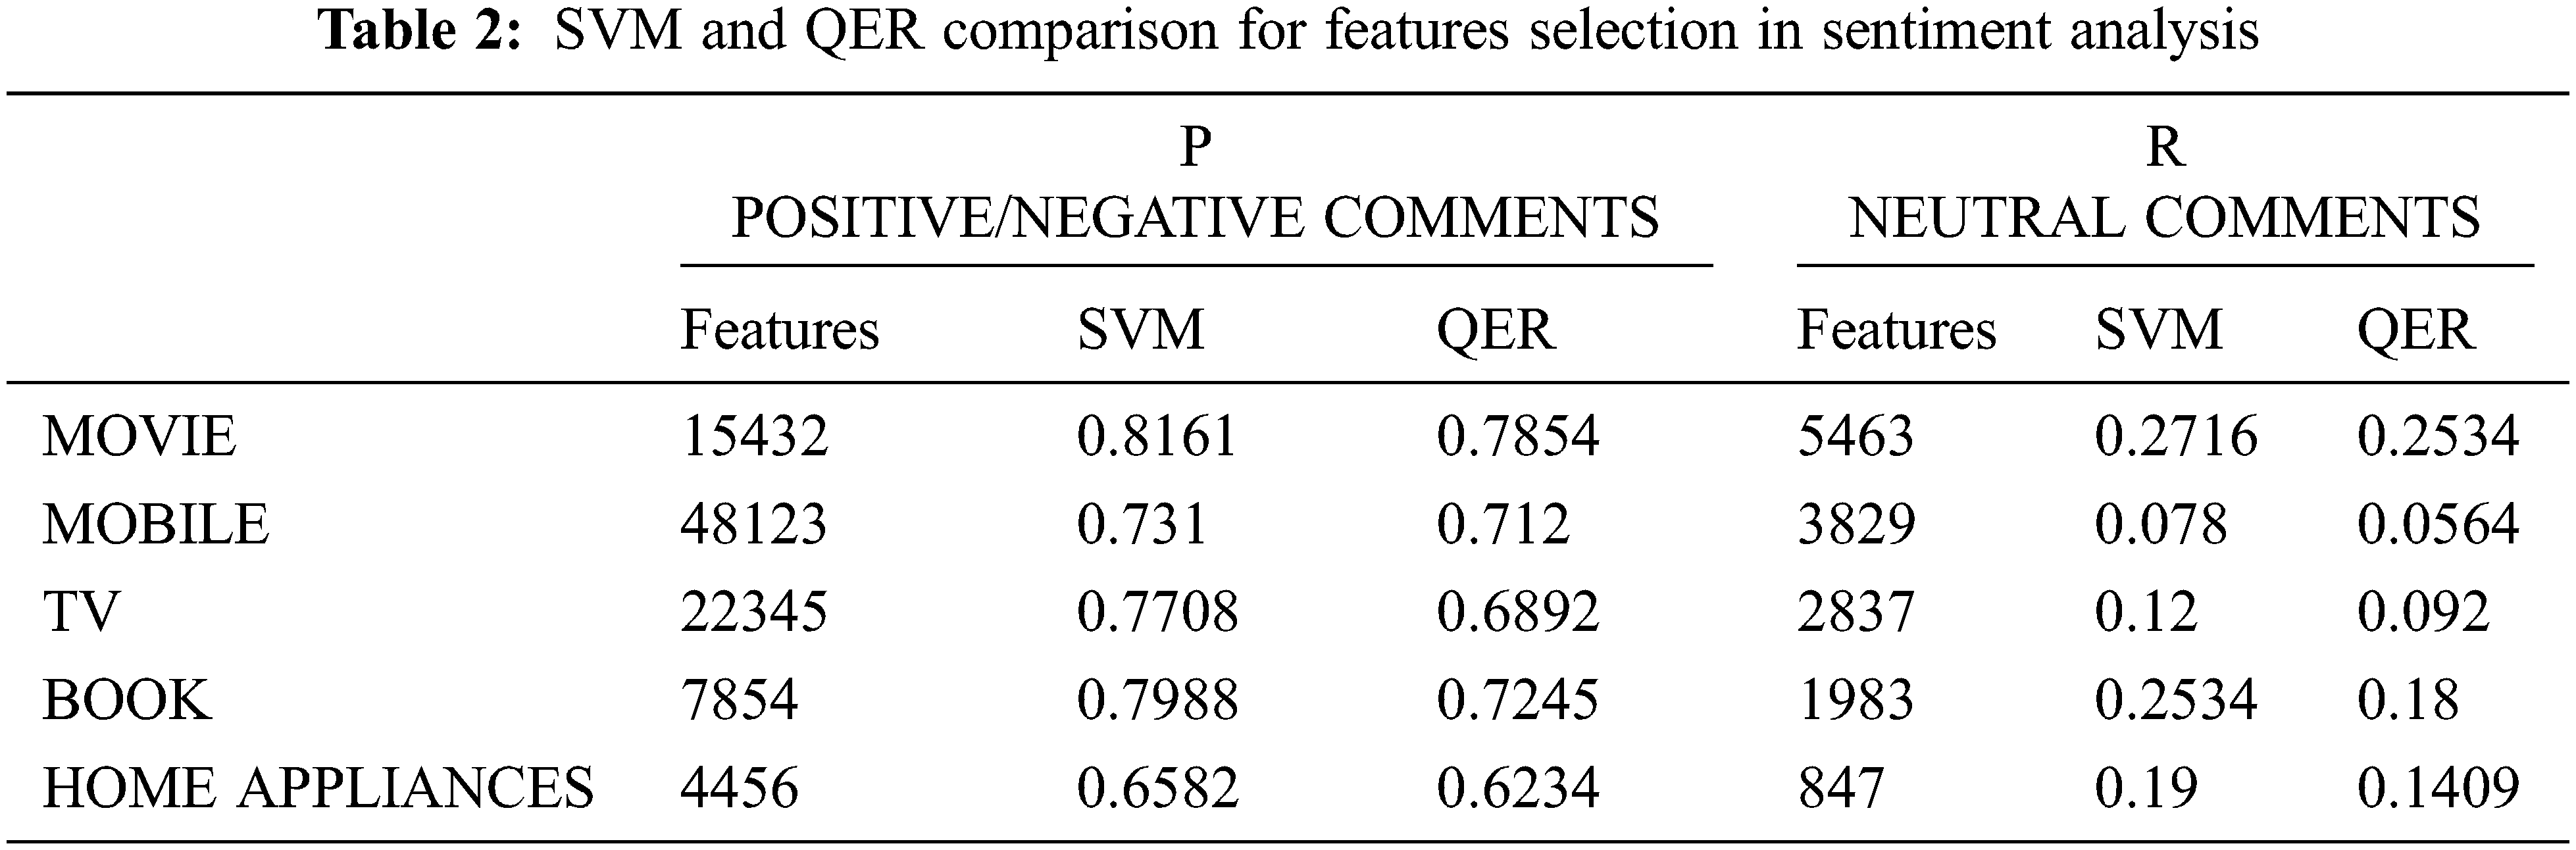
Tab. 2 gives the analysis of the comparison between SVM and QER for extraction feature comparison based on the comments and in-depth analysis QER has proven to be slightly better than SVM. While comparing with feature score QER difference is .96 when compared with SVM based on the first observations. The remaining observations are also proven to be versatile where QER is better than SVM analysis.
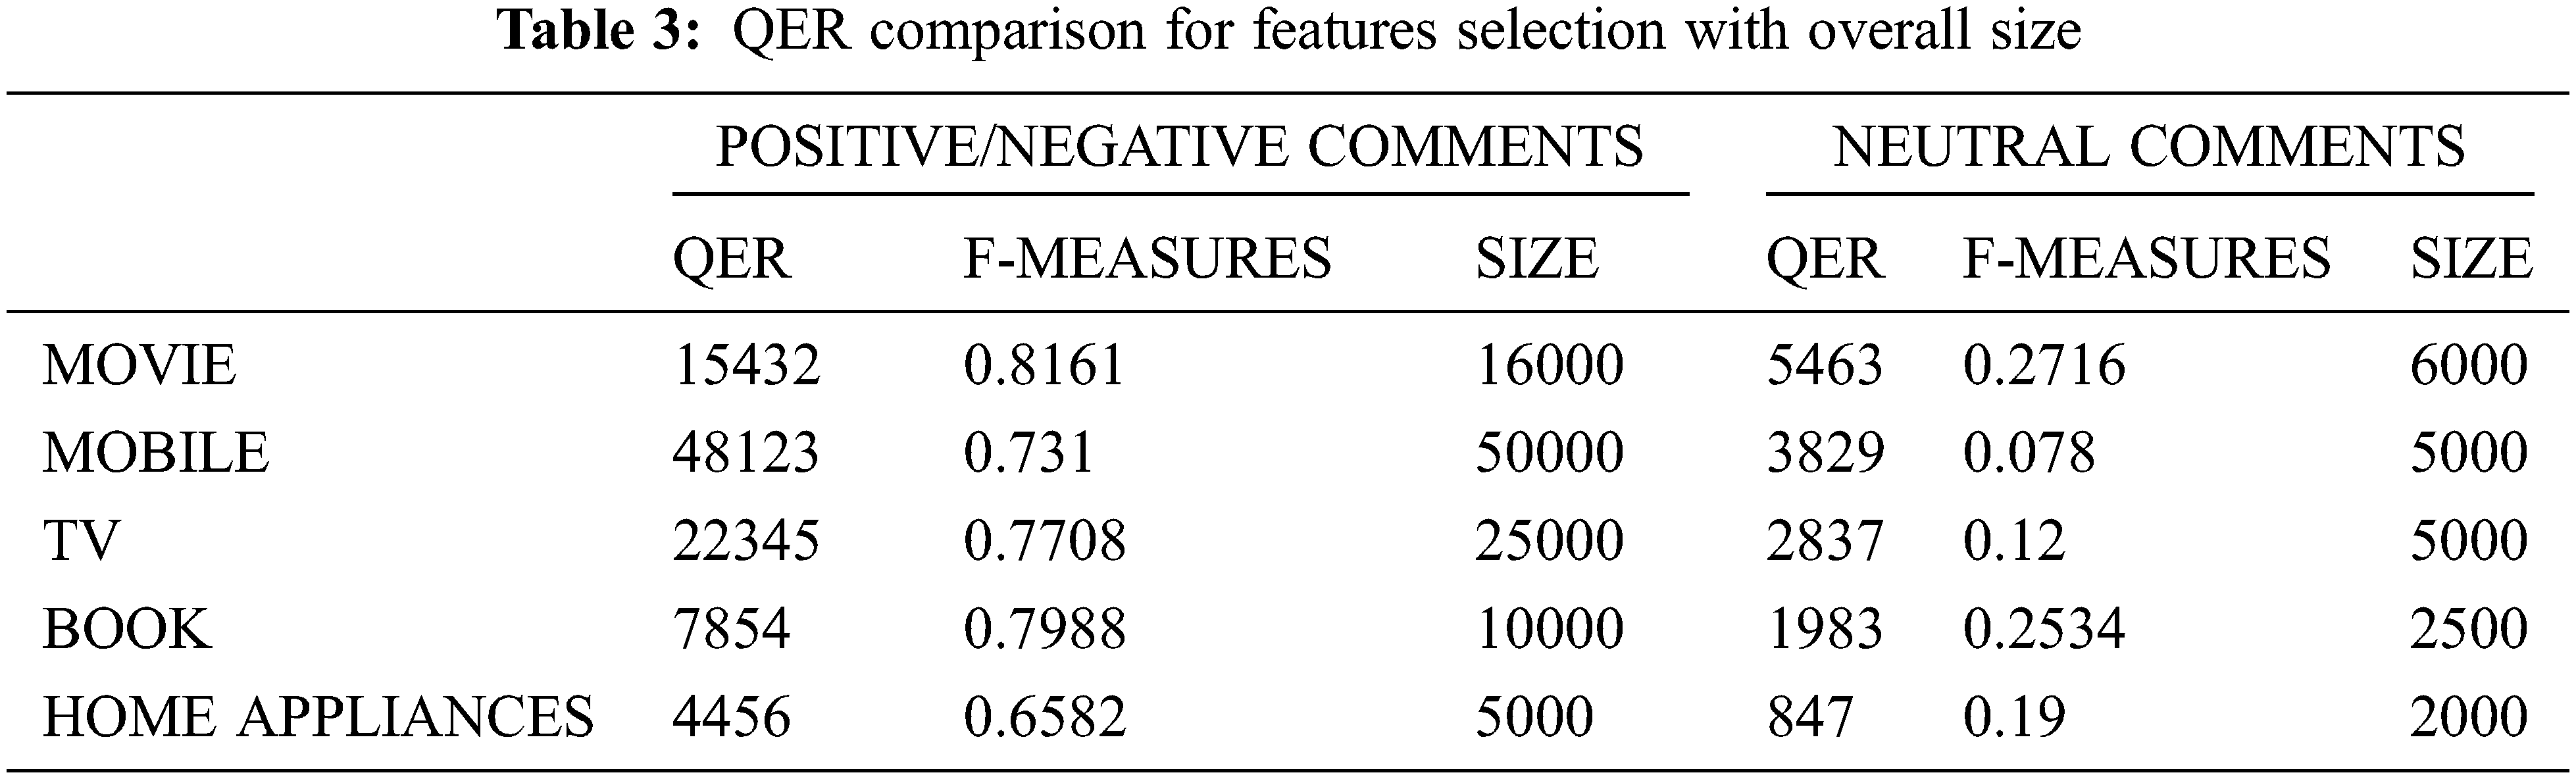
Tab. 3 observations state that F-measures features based on their size provide far better results based on the probability distribution of P and R respectively. The main objective of choosing QER is to focus on feature extraction in extreme probability factors of P and R where P is informative and R in Non-information as per the scope of this work.
The work also focuses on the overall positive and negative commands and in parallel with neutral commands. Based on the observation F measure scores of the neutral commands is very less and while comparing with the probability score positive and negative.
The comparison classifies text and provides the best classification of the results based on the probability score. The classification categorises the text from neutral content and makes similar associations with the positive content and eradicates negative associations. The F measures take only the filled content and skip comment that is empty. The word to word is compared and the F measures are done for positive and neutral comment and taken the F measures with the optimized value.
Fig. 4 compares SVM and QER for feature measures. The impact score of QER is slightly higher when compared to SVM observations. The size factors also act as a specific factor for evaluating the results with SVM and QER.

Figure 4: Feature measures for SVM and QER
Fig. 5 elaborates the results for neutral comments. Since neutral comments impact factors are more when compared with positive comments. The score is taken when both positive and neutral comments both has equal impact factors in sentiment analysis.
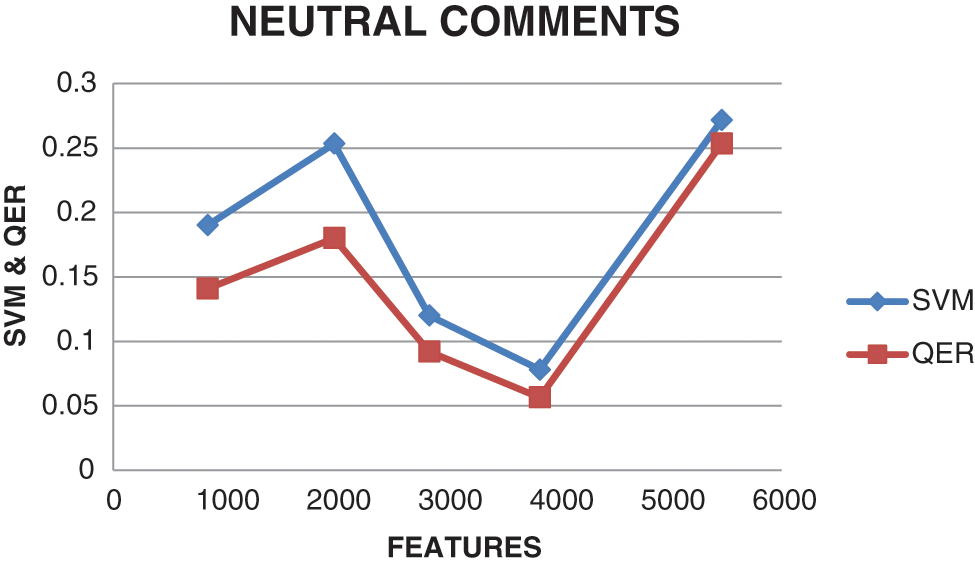
Figure 5: SVM and QER observations for Neutral comments
Fig. 6 gives the results for QER evaluation score based on the F measures. F measure features the comparison between the probability factors of positive comments with neutral comments. The P and R values give the probability score and interpret the results for sentiment analysis with positive and neutral comments. The observations show that QER gives maximum access to positive and neutral comments and results in positive by converting the neutral comments into positive ones. Fig. 7 gives the QER result interpretations for F measure scores using QER algorithm. The probability score is set for neutral comments that are considered non-informative comments and the resultant probability score is compared with the probability score of Positive comments. When there are probability score interpretations of positive and negative comments, the first level of comments is taken by F measures the stored value. The Neutral probability score is compared with the Positive probability score and makes the F-measure even.
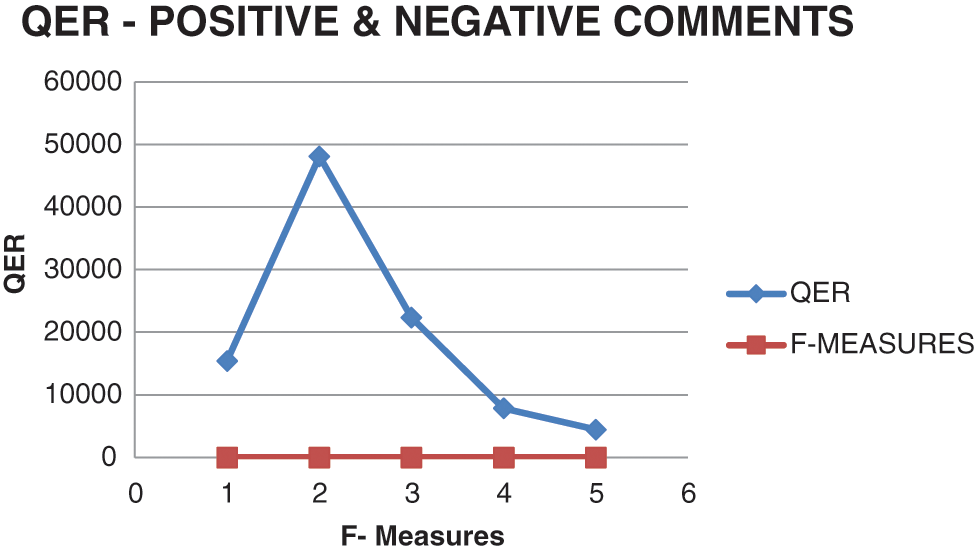
Figure 6: QER observation for calculating F-measures
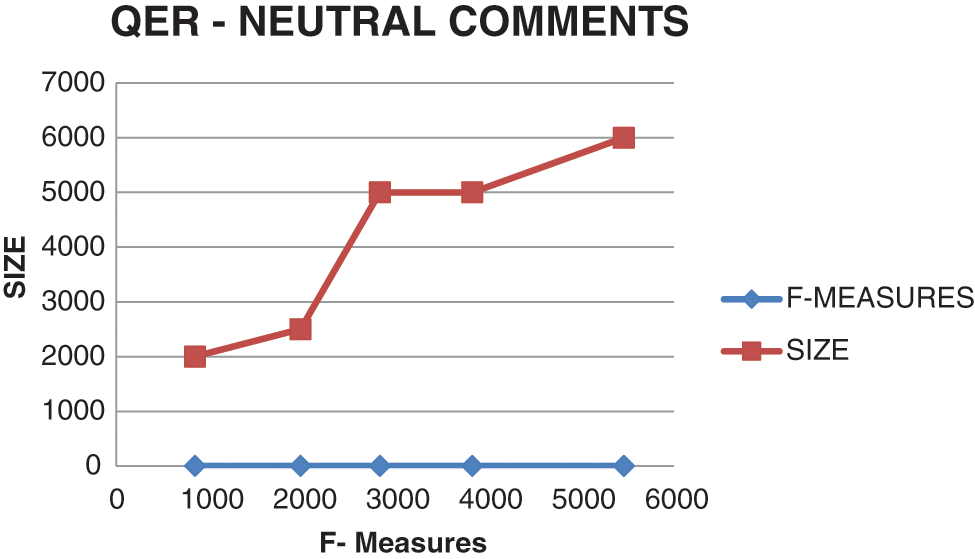
Figure 7: QER observation for neutral comments
In this work, the QER algorithm is implemented for converting the neutral (non-informative) comments into positive using probability factors. The F-measure scores are implemented using feature selection by converting training data sets into validating data sets that are taken as a part of result observations. The QER algorithm is used to interpret the probability factors for simulated annealing for information processing and classification. This work gives the way for converting the non-informative data into informative using sentiment analysis. Such initiative can be adapted to market analysis for converting the missed-out observations into formidable outcomes.
Funding Statement: The authors received no specific funding for this study.
Conflicts of Interest: The authors declare that they have no conflicts of interest to report regarding the present study.
References
1. A. A. Aziz, A. Starkey and E. N. Madi, “Predicting supervise machine learning performances for sentiment analysis using contextual-based approaches,” IEEE Access, vol. 8, no. 1, pp. 17722–17733, 2019. [Google Scholar]
2. S. E. Saad and S. Yang, “Twitter sentiment analysis based on ordinal regression,” IEEE Access, vol. 7, no. 1, pp. 163677–163685, 2019. [Google Scholar]
3. M. E. Abo, R. G. Raj and A. Qazi, “A review on arabic sentiment analysis: State-of-the-art, taxonomy and open research challenges,” IEEE Access, vol. 7, no. 1, pp. 162008–162024, 2009. [Google Scholar]
4. N. S. Mohd Nafis and S. Awang, “An enhanced hybrid feature selection technique using term frequency-inverse document frequency and support vector machine-recursive feature elimination for sentiment classification,” IEEE Access, vol. 9, no. 3, pp. 52177–52192, 2021. [Google Scholar]
5. M. Lopez-Martin, B. Carro and A. Sanchez-Esguevillas, “Network traffic classifier with convolutional and recurrent neural networks for internet of things,” IEEE Access, vol. 5, no. 1, pp. 18042–18050, 2021. [Google Scholar]
6. R. Yuan and Z. Li, “An svm-based machine learning method for accurate internet traffic classification,” Information Systems Frontiers, vol. 5, no. 3, pp. 149–156, 2010. [Google Scholar]
7. S. Utkin and V. Lev, “An imprecise extension of SVM-based machine learning models,” Neurocomputing, vol. 33, no. 1, pp. 18–32, 2019. [Google Scholar]
8. F. Nie and Y. Huang, “New primal SVM solver with linear computational cost for big data classifications,” Proceedings of the 31st International Conference on International Conference on Machine Learning, vol. 33, no. 1, pp. 1115–1123, 2014. [Google Scholar]
9. Y. Liu and D. Jiongjun, “Parameter optimization of the svm for big data,” in 2015 8th Int. Symp. on Computational Intelligence and Design (ISCID), Hangzhou, China, vol. 2, no. 1, pp. 362–375, 2015. [Google Scholar]
10. M. Anjaria and R. Mohana Reddy Guddeti, “Influence factor-based opinion mining of twitter data using supervised learning,” in 2014 Sixth Int. Conf. on Communication Systems and Networks (COMSNETS), Bangalore, India, 2014. [Google Scholar]
11. S. K. Lakshmanaprabu, “Effective features to classify big data using social internet of things,” IEEE Access, vol. 6, no. 5, pp. 24196–24204, 2015. [Google Scholar]
12. V. J. Nirmal and D. Amalarethinam, “Parallel implementation of big data pre-processing algorithms for sentiment analysis of social networking data,” International Journal of Fuzzy Mathematical Archive, vol. 6, no. 2, pp. 149–159, 2015. [Google Scholar]
13. A. Sapountzi and K. E. Psannis, “Social networking data analysis tools & challenges,” Future Generation Computer Systems, vol. 8, no. 6, pp. 902–918, 2018. [Google Scholar]
Cite This Article
 Copyright © 2023 The Author(s). Published by Tech Science Press.
This work is licensed under a Creative Commons Attribution 4.0 International License , which permits unrestricted use, distribution, and reproduction in any medium, provided the original work is properly cited.
 Downloads
 Citation Tools