
 Submit a Paper
 Propose a Special lssue
 Open Access
ARTICLE

Human Factors While Using Head-Up-Display in Low Visibility Flying Conditions
1 Academy of Scientific and Innovative Research (AcSIR), Ghaziabad, 201002, India
2 CSIR-Central Scientific Instruments Organisation, 160030, India
* Corresponding Author: Vinod Karar. Email:
Intelligent Automation & Soft Computing 2023, 36(2), 2411-2423. https://doi.org/10.32604/iasc.2023.034203
Received 09 July 2022; Accepted 29 September 2022; Issue published 05 January 2023
 View Full Text
 Download PDF
Abstract
Flying an aircraft in low visibility is still a challenging task for the pilot. It requires precise and accurate situational awareness (SA) in real-time. A Head-up Display (HUD) is used to project collimated internal and external flight information on a transparent screen in the pilot’s forward field of view, which eliminates the change of eye position between Head-Down-Display (HDD) instruments and outer view through the windshield. Implementation of HUD increases the SA and reduces the workload for the pilot. But to provide a better flying capability for the pilot, projecting extensive information on HUD causes human factor issues that reduce pilot performance and lead to accidents in low visibility conditions. The literature shows that human error is the leading cause of more than 70% of aviation accidents. In this study, the ability of the pilot able to read background and symbology information of HUD at a different level of background seen complexity, such as symbology brightness, transition time, amount of Symbology, size etc., in low visibility conditions is discussed. The result shows that increased complexity on the HUD causes more detection errors.Keywords
Controlling an aircraft under situations of poor visibility and heavy workload is challenging. It requires internal & external information in real-time. This information is commonly known as SA. Situational awareness is the information necessary to inform the pilot about the exterior surroundings. It includes both flight and external environmental information. The information should be acknowledged to the pilot in real-time to keep aware of the surroundings.
Formerly HDD was used in the cockpit to display the flight data on different instruments panel and external data through the windshield. To obtain SA, the pilot must continuously re-focus his eyes between various gazes in the cockpit and windshield. It takes more transition time and increases the workload for the pilot. Controlling a fast-moving aircraft in high workload conditions near the ground using HDD is difficult for the pilot. A high workload environment causes the error of accident [1,2].
A HUD system that projects flight information on a transparent screen in the pilot’s normal eye position and collates with outer information at infinity has been introduced. It reduces the scanning area and provides more time to focus on outer information, increasing the pilot’s SA [3]. But the operational advantage of aircraft is that they cover the destination with the shortest route in less time, increasing their demand in military and civilian applications [4]. The International Civil Aviation Organization (ICAO) reported that world air traffic volume would grow at an annual rate of 4.4% year over year [5]. Rapid developments in aviation are constantly increasing air traffic worldwide and complicating the flight environment. In accordance with it, airport facilities and display features have been improved by adding more information. The increasing visual complexity of HUDs causes human factor issues that lead to human error and accidents. The human factor is also caused by the types of aircraft, whether combat or civil. Flying speed, altitude, terrain etc., are different for each. It depends on instrument types, analogue types like a gauge or digital types like digital speedometer meters. Digital type speedometer has a higher tracking error than analogue type. It also depends on the phase of flight, whether the cruise, takeoff or landing phase flight. In the takeoff and landing phase, they have to receive more external information. The pilot’s high workload in low visibility conditions deteriorates human performance [6,7]. So, despite the minimum flying time of these two phases, the rate of accidents is maximum. The study of the human factor is significant to avoid similar accidents or incidents in future.
Implementation of HUD enhances the pilot’s SA but also has potential drawbacks that degrade pilot performance. With the advancement in aviation technology (like speed and communication systems etc.), with time and efforts of researchers to improve pilot’s capability have increased the visual complexity of display that causing human factor issues [8]. Human factors are those characteristics of the device that affect human performance and cause human error and accidents. It is the main contributing factor in more than 70% of aviation accidents [9–11]. Literature has reported various factors that affect pilot performance and lead a human error. These are clutter, changes in blindness, information and work overload, in-conformal Symbology on display, symbol location and clutter, symbol format and salience, symbology brightness, and limited others have arisen along with the development of display technology [12,13].
With the rapid development in the quality and quantity of aircraft systems, cockpit displays are constantly being developed for maximum pilot performance. However, the visual complexity of the display is a concern that harms pilot performance. It takes longer to find critical information in high workload conditions, which increases response delay and flight control error. The importance of understanding and minimizing complexity on display have been widely acknowledged [14–16].
Some concerns also have been recognized related to the information change rate. It causes change blindness for pilots who cannot read the information in fast-moving environments and degrades their performance. Multiple information sometimes changes, forcing the pilot to quickly scan and remember the previous information before receiving the new information. During the transition of objects in the HUD or exterior view in the cockpit visor, the rate of change in information plays a more significant role than the display condition. In this state, object disappearances are more challenging to detect for the pilot than monitoring the other vital parameters of the aircraft. It is also reported that multiple changes in a central position are detected easily compared to the extreme end [17,18]. Avionics display intends to provide better SA but also depends on display brightness. The luminance and contrast ratio also plays a crucial role in event detection. Aircraft interact with various luminance levels during flying (night, sunny day, fog etc.) that produce unwanted reflection and adversely affect the pilot’s contrast sensitivity, affecting pilot event detection capacity. The contrast ratio should be good to maintain the event detection accuracy [19].
The experiments are conducted to examine the effects of background complexity in terms of the number of objects displayed (low, medium, high), change in the pattern of HUD Symbology at the same time (one, two, three), background brightness (low, medium, high), frequency of change in the pattern of HUD Symbology (low, medium, high). These variables are varied to check the effects on the pilot’s performance in low visibility conditions.
A total of 15 volunteers participated in the study, aged 21 to 40. They involved ten males and five females. All participant’s average age was 33.50, and SD = 5.52. They all had good eyesight and health to participate in the experiments. They had a good academic background. Most are researchers with a doctorate or master’s degree in engineering or science; the rest are engineering graduates. Initially, they were briefed about the study, and a training session was conducted under the supervision of experts to understand the system and maintain the necessary discipline during the experiments. Furthermore, they have been given time to become familiar with the system and understand its role.
A stable cockpit simulation facility was developed to generate the actual flight environment that pilots have to phase during takeoff & landing in low visibility conditions. It includes a HUD unit, symbology generator (park-card), TV monitor, camera, projector, laptop and a pilot seated chair. Park-card is a computer used to generate different symbology at various locations. It uses a Windows DOS programming language. The external view that the pilot had to encounter was projected through a projector on a fixed screen at an optical infinity distance. A high-resolution camera and a 32-inch TV monitor were used to capture the view of the collimated HUD Symbology. The system also included multiple light sources to vary the external brightness and an adjustable height of single-seat chairs to accommodate different users. The intensity of the HUD Symbology and the objects displayed in the background, as depicted in Fig. 1, were measured using a chroma lux metre. Fig. 2 shows the experiment’s fundamental block diagram. The experiment’s cockpit simulator as shown in Fig. 3 can be found at the CSIR-Central Scientific Instruments Organization Laboratory in Chandigarh, India.
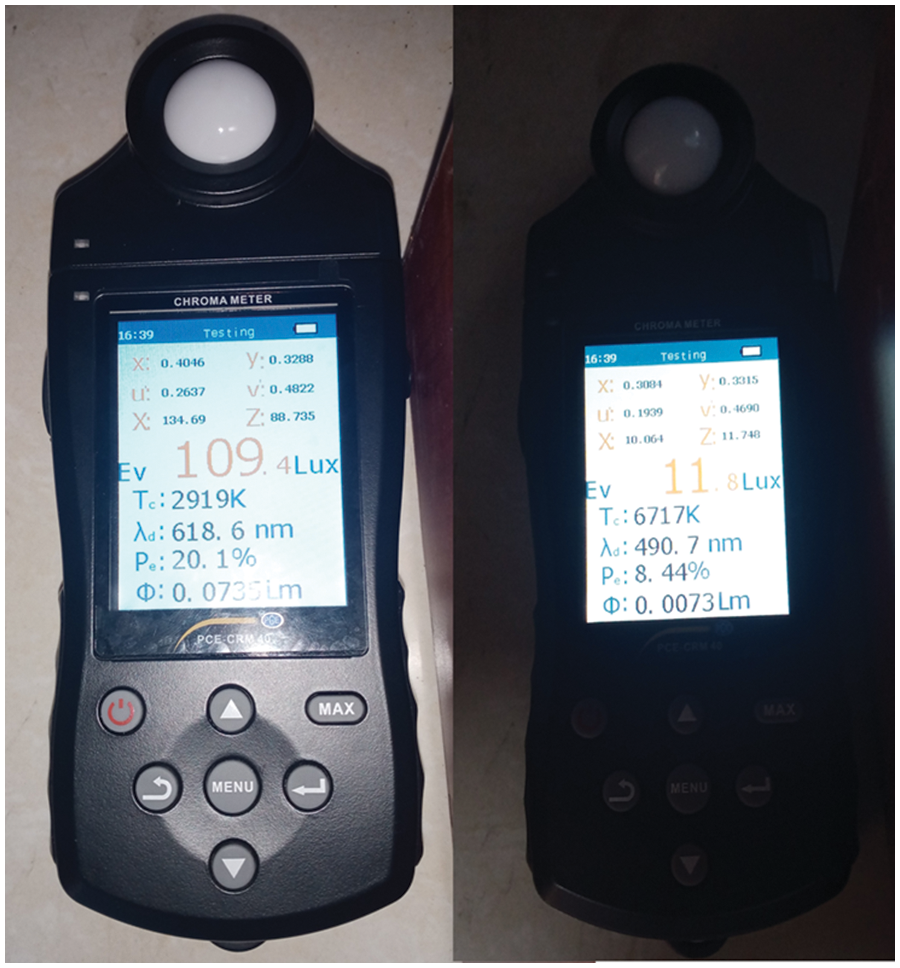
Figure 1: Reading of ambient light through lux meter during the experiment
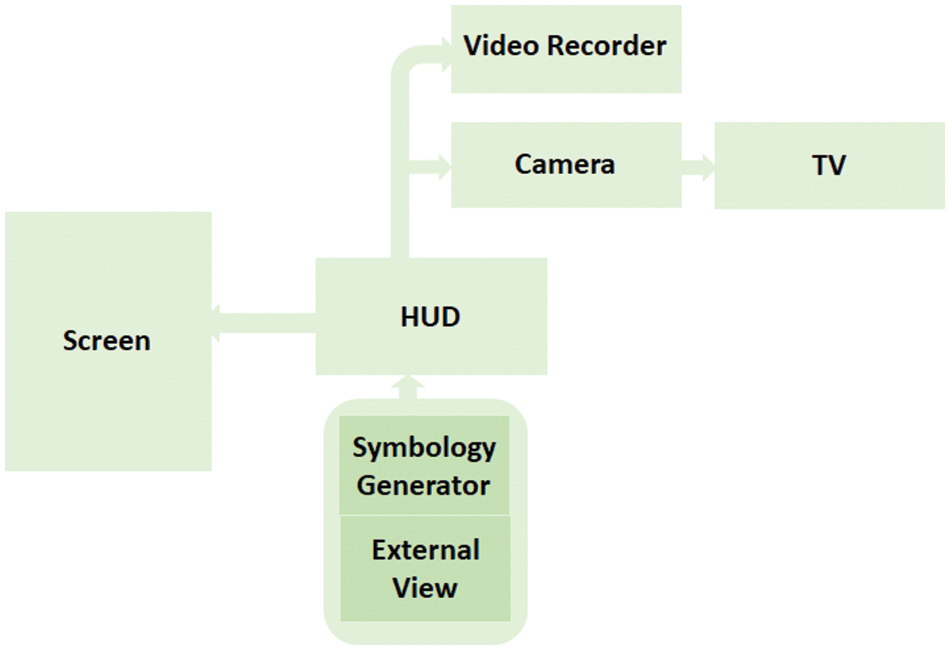
Figure 2: Basic block diagram of the experiment conducted on the cockpit simulator
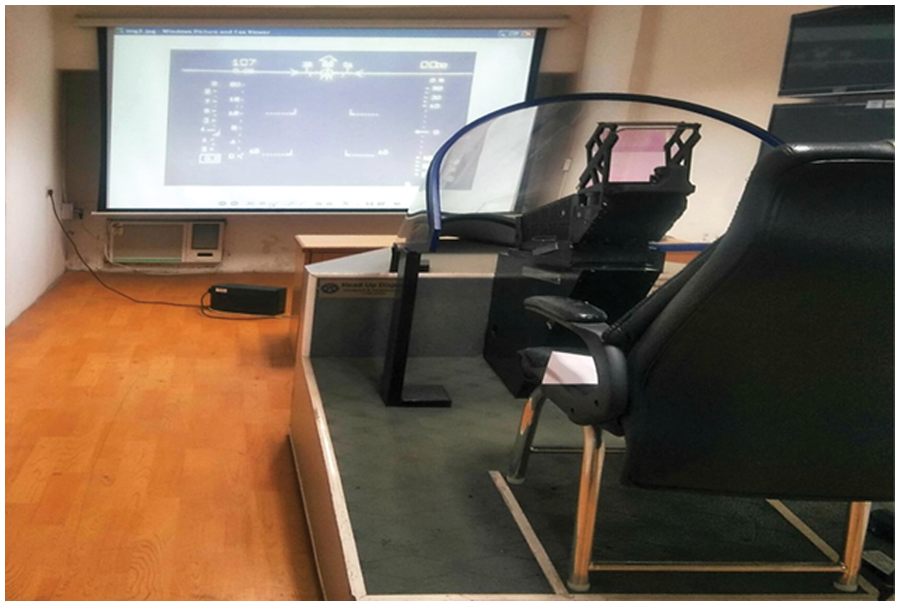
Figure 3: Cockpit simulator setup used for the experiment
A set of HUD and background Symbology were displayed on the HUD to examine the effects of variables on user’s responses. These were considered design variables and displayed as icons, shapes or symbols on the screen. Variables include the number of HUDs and background Symbology, the number of symbology changes at a time, background brightness, frequency of HUD and background Symbology and colour. These symbology patterns were generated at different locations on a 140-degree viewing screen.
Experiments were performed under low visibility conditions. It was performed on different types of background, varying number of Symbology, rate of change of Symbology at a time, background brightness, and display time. The simulator was programmed to generate different symbols, characters, shapes and digits at the specified location for a set period. HUD and outer Symbology were superimposed and projected at an optical infinity distance. Optical infinity distance is the minimum distance of approximately 6 meters or 20 feet over which rays of light travel parallel to each other. The experiment considered the distance between the HUD glass screen and the projection screen of approximately 20 feet and between the participant’s eyes and ground level of around 5.2 feet.
Users had to press the start button to run the experiments. Participants were asked to carefully read it, maintain discipline, and focus on superimposed Symbology through HUD. He had to read and note down the Symbology that appeared on the screen. The user’s feedback was recorded to analyze the data. An interview was also conducted after the completion of each experiment to ascertain the difficulty arising due to any parameter during the experiments. Fig. 4 describes the location of the patterns of the Symbology used in the see-through display of the Head-up display device. The study was carried out in the time duration of 1, 2 and 3 s. But the time duration of two seconds was chosen because one second was a very short duration to study the effect of transition of the environment on the pilot. At the same time, the time duration of 3 s was too long, which could increase the latency time affecting the pilot’s response to the environment’s transition.
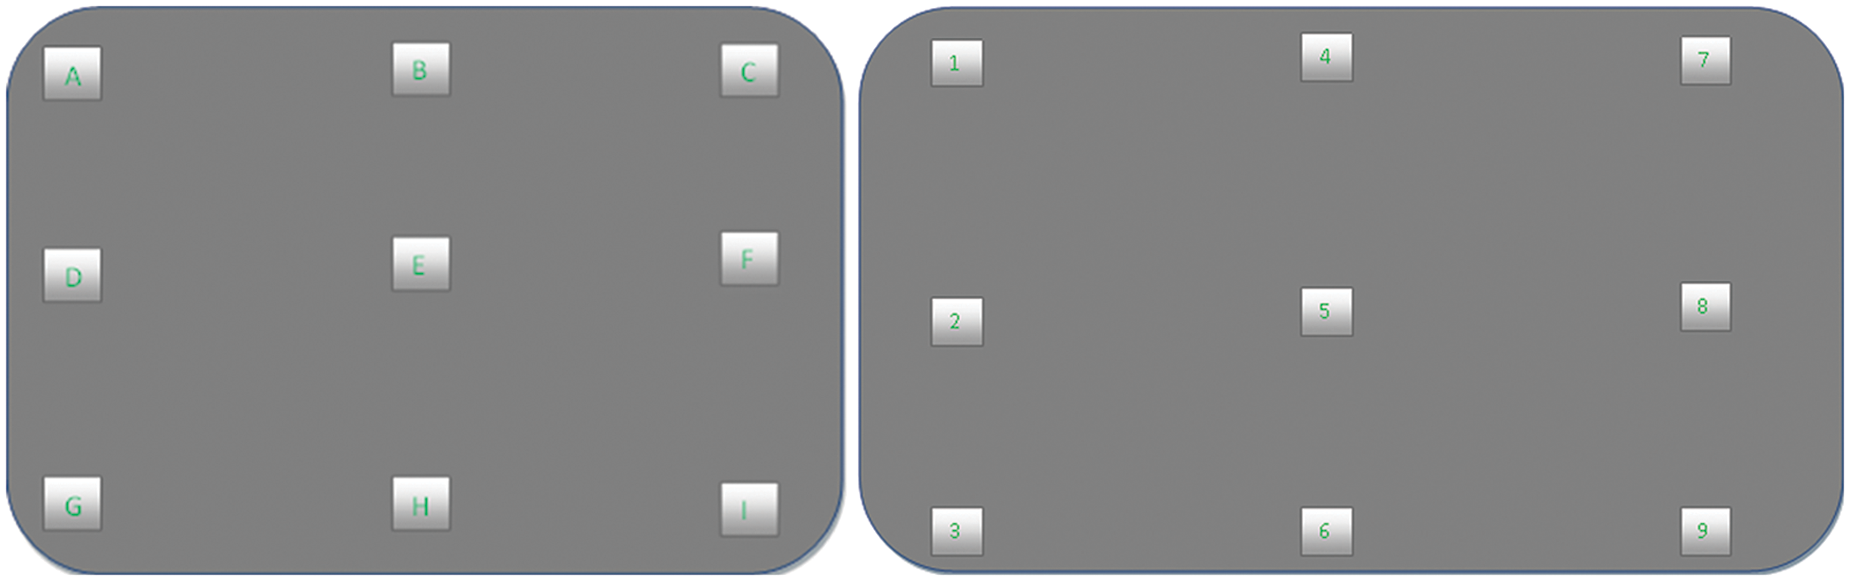
Figure 4: Location pattern of the symbology used in the experiment
Experiments were conducted multiple times to increase the accuracy. The variable was transition time of Symbology, size of objects, brightness, time duration of HUD Symbology, time duration of obstacles and background complexity of the environment. Fig. 5 represents the experiment set up in the low visibility outside premises.
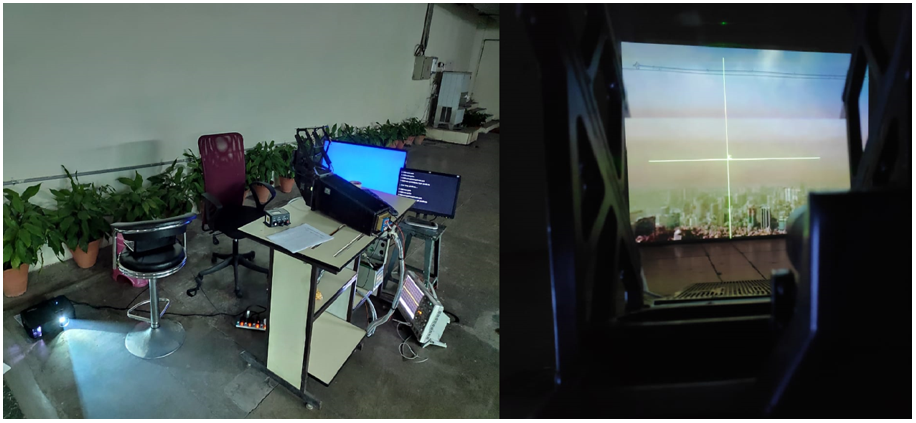
Figure 5: Setup of experiment in the low visibility outside premises
Fig. 6 represents the actual and projected view of the Symbology generated outside the cockpit simulator and on the Head-up-display. Fig. 7 illustrates the real-time examination of the effects of background complexity and change in Symbology in the HUD.
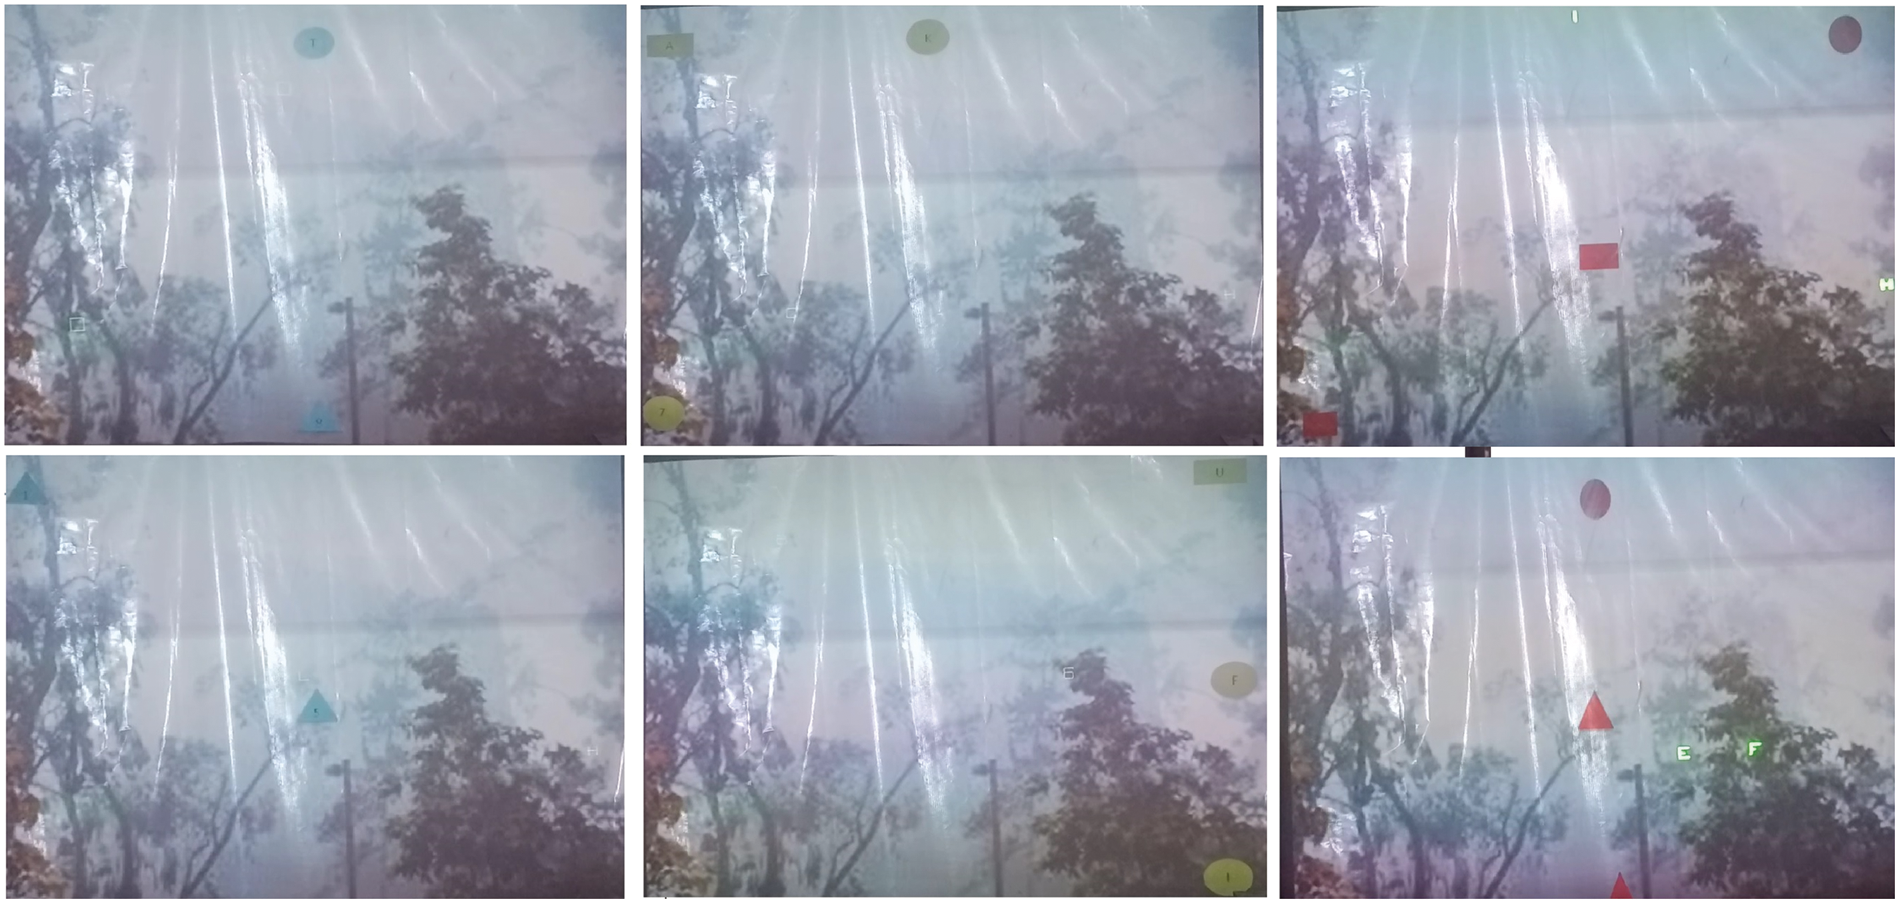
Figure 6: Actual and projected view of the symbology generated outside the cockpit simulator and on the head-up-display
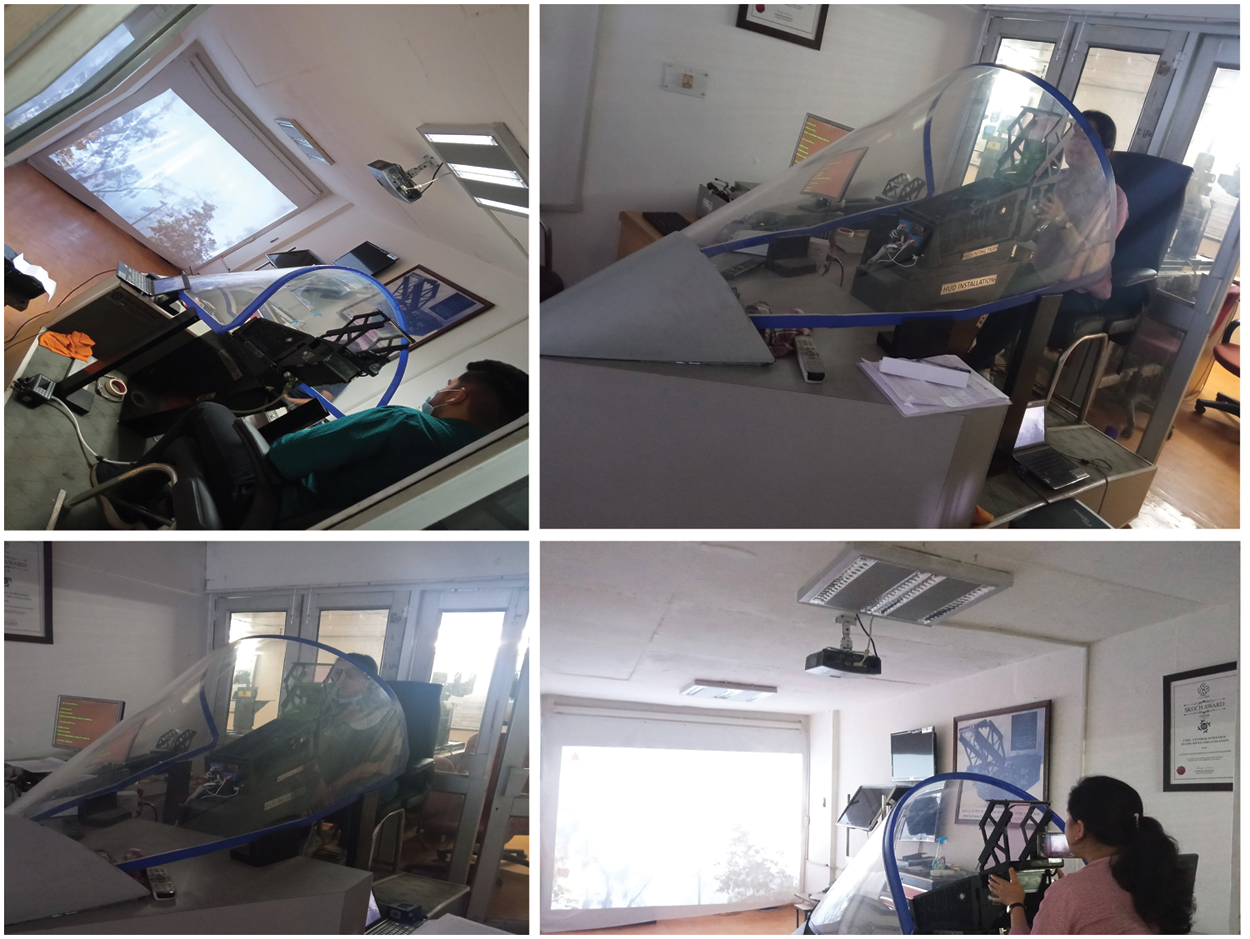
Figure 7: Real-time examination of the effects of background complexity and change in symbology
Objects of three different colours are missed in the background outside the cockpit visor under different luminances.
Case-1: When the background luminance is low
The average of the missed objects during the transition of 2 s is 6.6, 7.3 and 8. Therefore, from Fig. 8, it can be inferred that the tendency of the missed objects of red colour is less when the object size is large and maximum when the object size is small. The average of the missed objects during the transition of 2 s is 6, 6.8 and 7.8. Therefore, from Fig. 9, it can be inferred that the tendency of the missed objects of green colour is less when the object size is large and maximum when the object size is small. The average of the missed objects during the transition of 2 s is 6.5, 7.2 and 8. Therefore, from Fig. 10, it can be inferred that the tendency of the missed objects of blue colour is less when the object size is large and maximum when the object size is small.
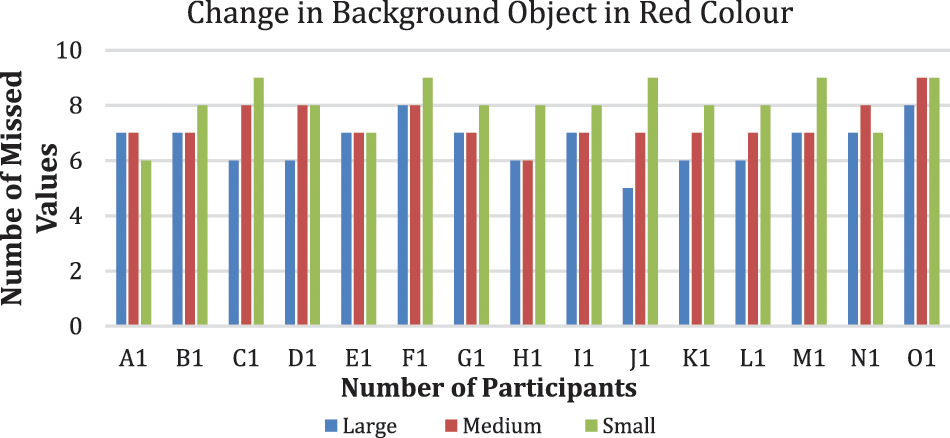
Figure 8: Change of red coloured object in the background with low luminance
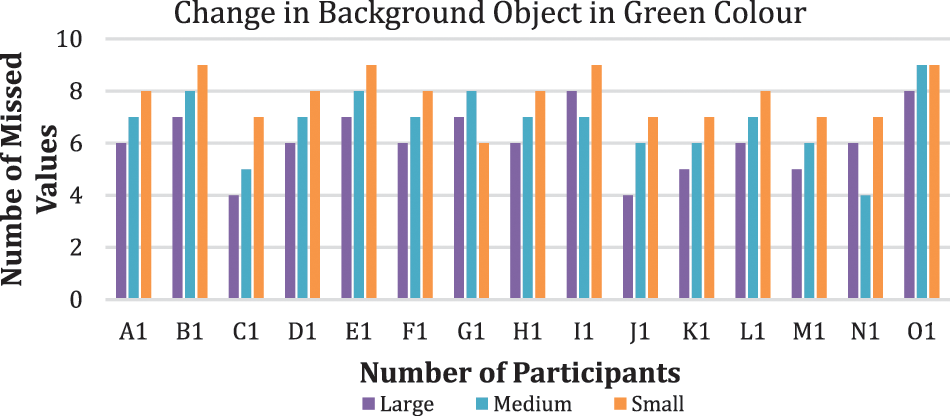
Figure 9: Change of green coloured object in the background with low luminance
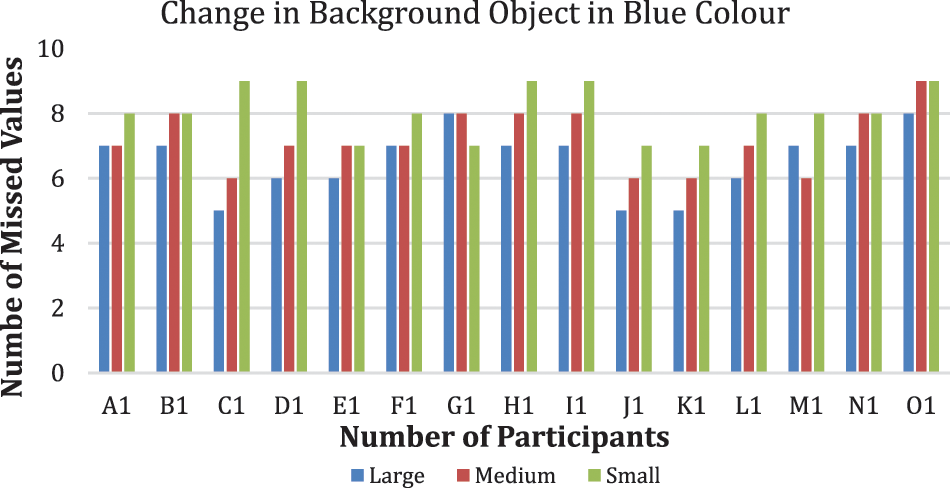
Figure 10: Change of blue coloured object in the background with low luminance
Case-2: When the background luminance is medium
The average of the missed objects during the transition of 2 s is 5.6, 6.3 and 7.2. Therefore, from Fig. 11, it can be inferred that the tendency of the missed objects of red colour is less when the object size is large and maximum when the object size is small. The average of the missed objects during the transition of 2 s is 5, 5.8 and 6.8. Therefore, from Fig. 12, it can be inferred that the tendency of the missed objects of green colour is less when the object size is large and maximum when the object size is small. The average of the missed objects during the transition of 2 s is 5.4, 6.2 and 7. Therefore, from Fig. 13, it can be inferred that the tendency of the missed objects of blue colour is less when the object size is large and maximum when the object size is small.
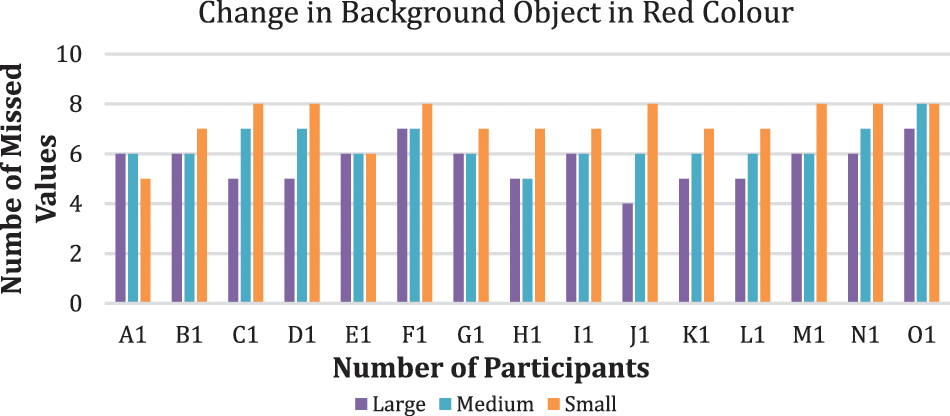
Figure 11: Change of red coloured object in the background with medium luminance
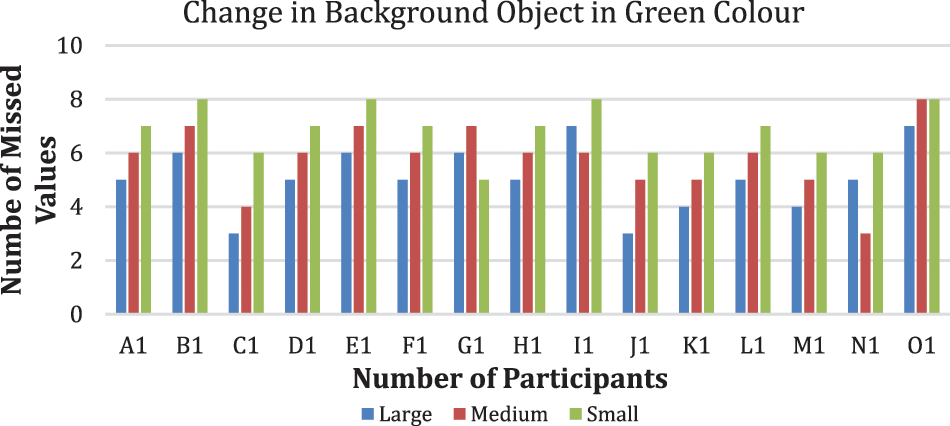
Figure 12: Change of green coloured object in the background with medium luminance
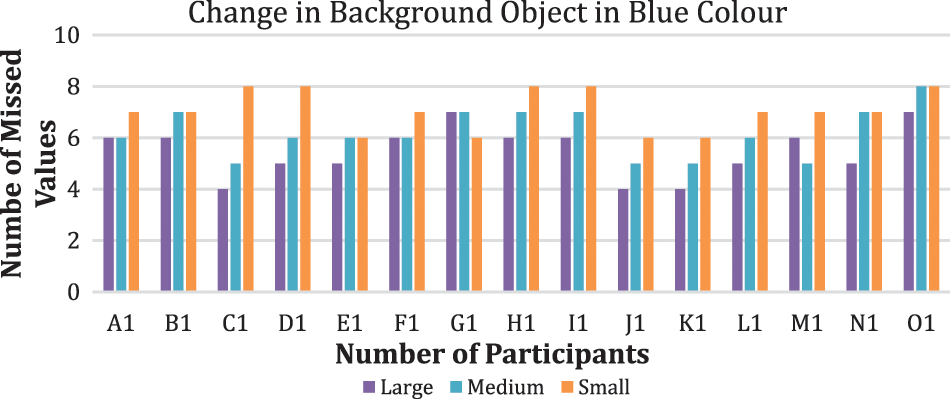
Figure 13: Change of blue coloured object in the background with medium luminance
Case-3: When the background luminance is high
The average of the missed objects during the transition of 2 s is 3, 3.5 and 4.7. Therefore, from Fig. 14, it can be inferred that the tendency of the missed objects of red colour is less when the object size is large and maximum when the object size is small. The average of the missed objects during the transition of 2 s is 2.5, 2.9 and 4.4. Therefore, from Fig. 15, it can be inferred that the tendency of the missed objects of green colour is less when the object size is large and maximum when the object size is small. The average of the missed objects during the transition of 2 s is 2.6, 3 and 4.6. Therefore, from Fig. 16, it can be inferred that the tendency of the missed objects of blue colour is less when the object size is large and maximum when the object size is small.
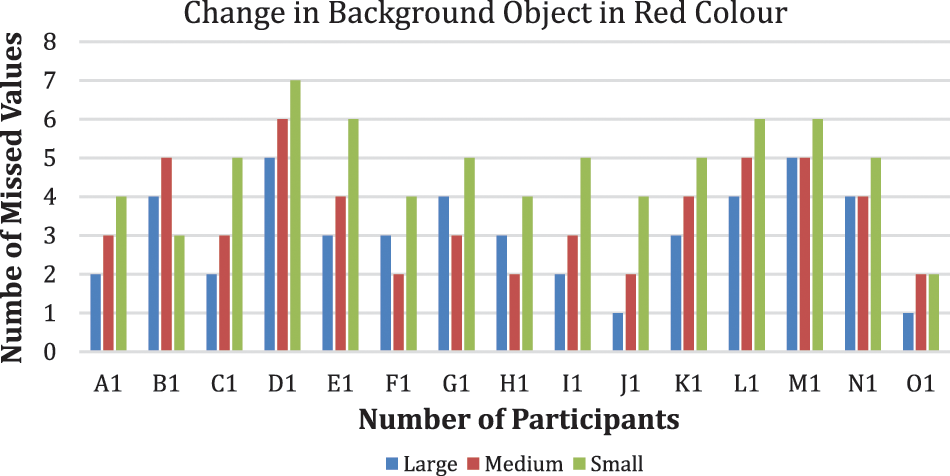
Figure 14: Change of red coloured object in the background with high luminance
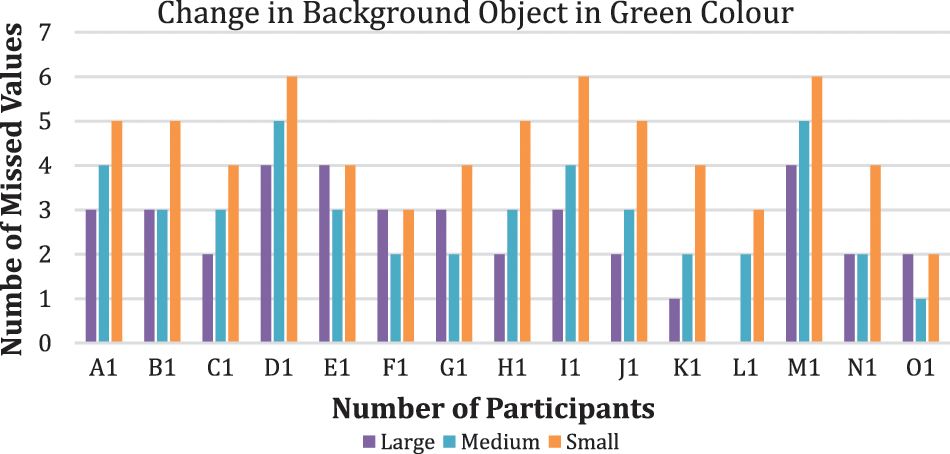
Figure 15: Change of green coloured object in the background with high luminance
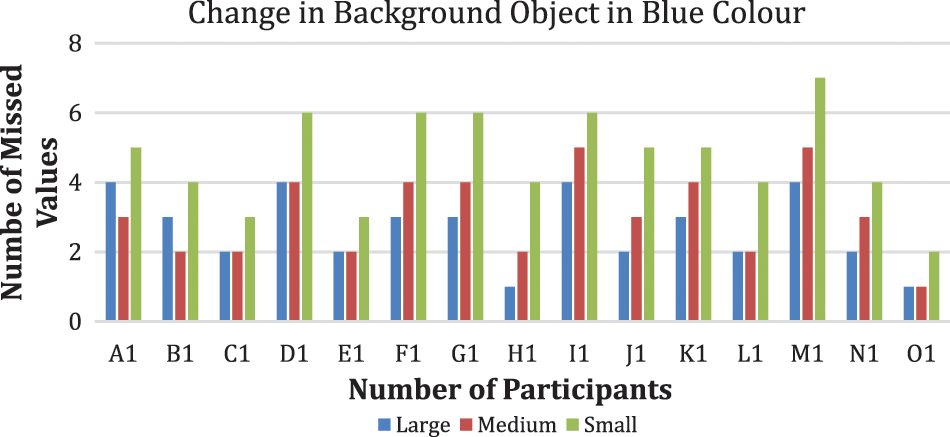
Figure 16: Change of blue coloured object in the background with high luminance
Pattern missed under different luminance of HUD Symbology. The Symbology pattern in the HUD is studied while monitoring the background objects of three sizes in synchronization. According to Figs. 17–19, the average of the missed pattern in the HUD Symbology during the transition of 2 s is 1.375, 1.270, and 1.333. The luminance of HUD Symbology is low in this case when the background objects of three different colours (Red, Green, and Blue) transit along with transition in the pattern of HUD Symbology.
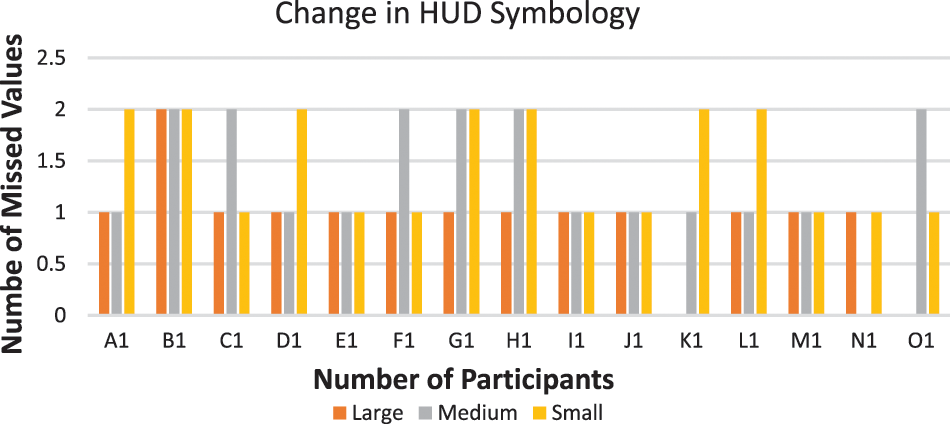
Figure 17: Change of head-up-display symbology of low luminance in synchronised with red coloured object in the background of low luminance
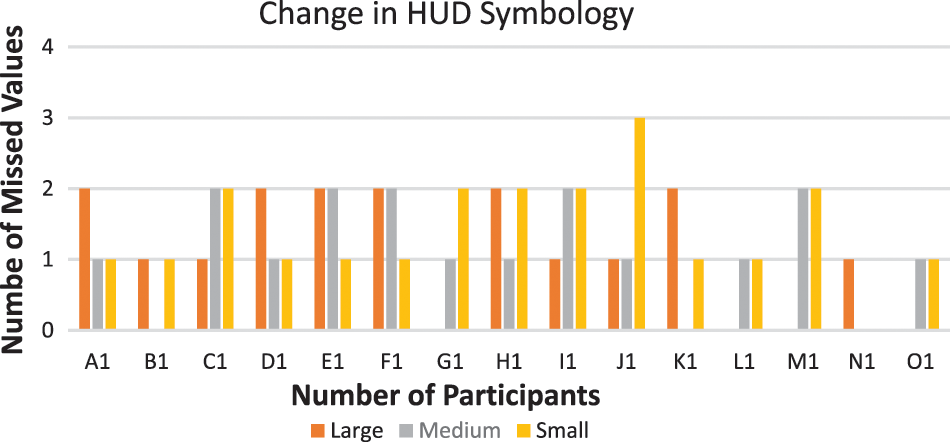
Figure 18: Change of head-up-display symbology of low luminance in synchronised with green coloured object in the background of low luminance
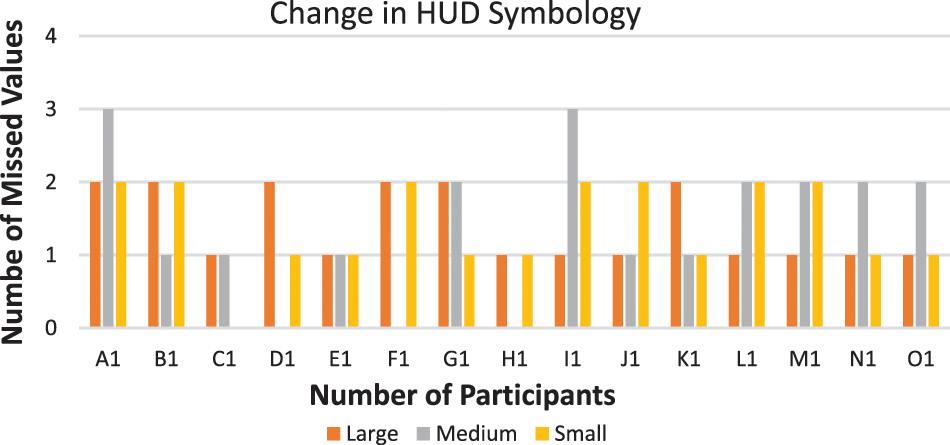
Figure 19: Change of head-up-display symbology of low luminance in synchronised with blue coloured object in the background of low luminance
When the luminance of HUD Symbology is medium, and when the background objects of three different colours (Red, Green, and Blue) transit along with transition in the pattern of HUD Symbology, it is observed in Figs. 20–22 the average of the missed pattern in the HUD Symbology during the transition of 2 s is 1.312, 1.250, and 1.208.
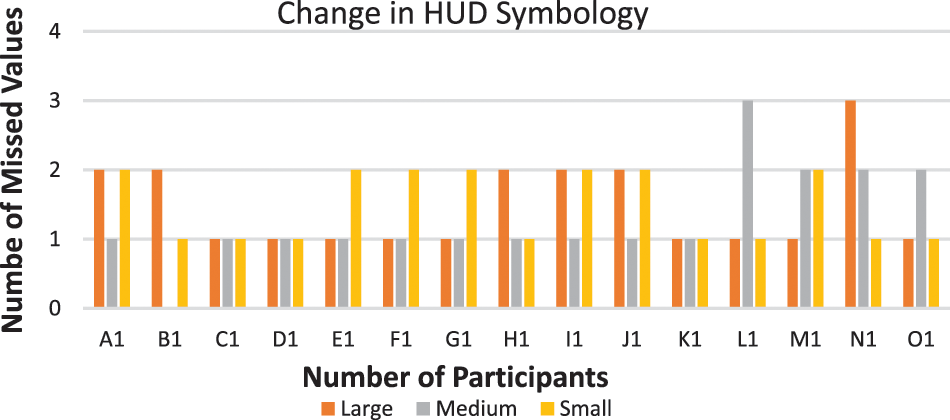
Figure 20: Change of head-up-display symbology of medium luminance in synchronised with red coloured object in the background of medium luminance
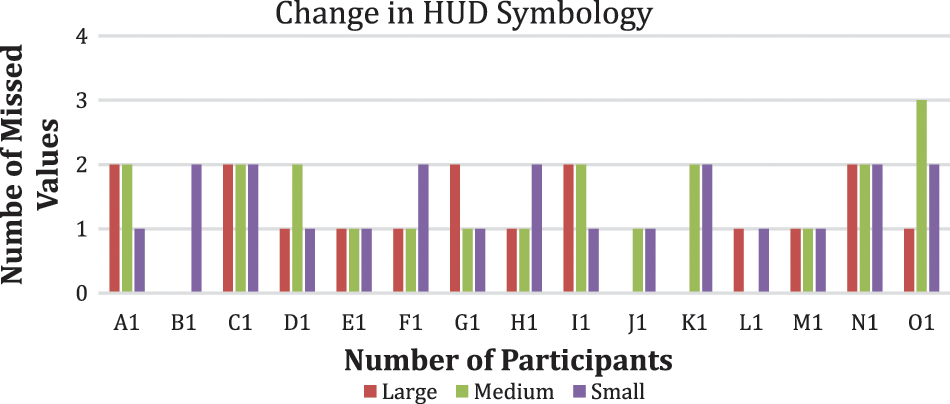
Figure 21: Change of head-up-display symbology of medium luminance in synchronised with green coloured object in the background of medium luminance
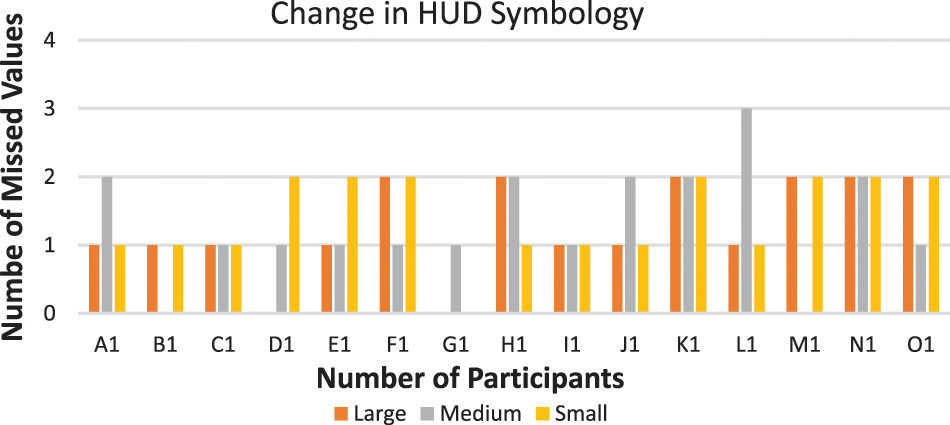
Figure 22: Change of head-up-display symbology of medium luminance in synchronised with blue coloured object in the background of medium luminance
According to Figs. 23–25, the average of the missed pattern in the HUD Symbology during the transition of 2 s is 1.270, 1.206, and 1.229. The luminance of HUD Symbology is low in this case when the background objects of three different colours (Red, Green, and Blue) transit along with transition in the pattern of HUD Symbology. The average of missing patterns in HUD Symbology was minimum when the luminance in HUD Symbology was high and maximum when it was low.
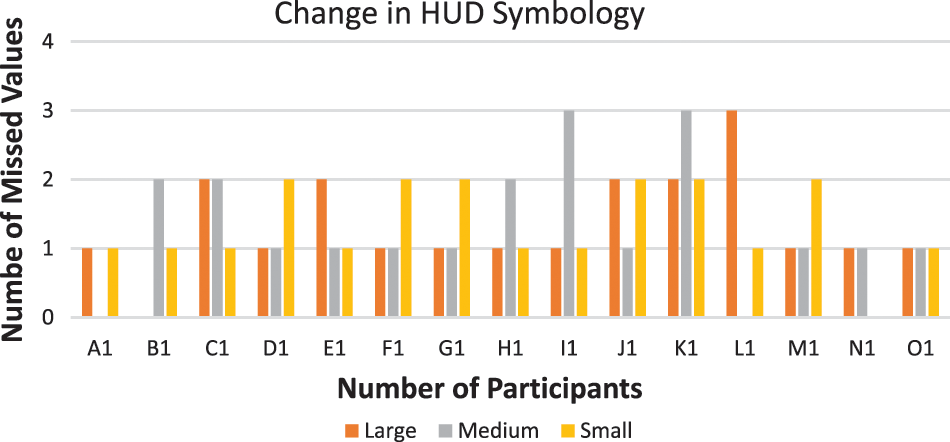
Figure 23: Change of head-up-display symbology of high luminance in synchronised with red coloured object in the background of high luminance
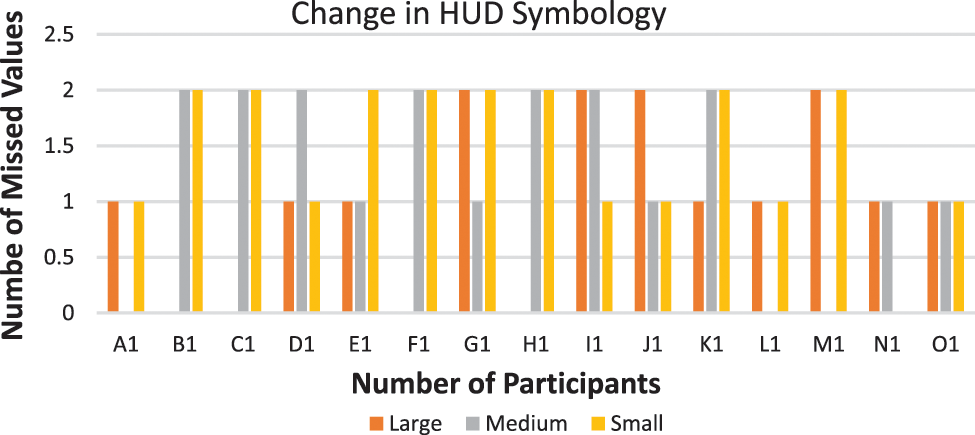
Figure 24: Change of head-up-display symbology of high luminance in synchronised with green coloured object in the background of high luminance
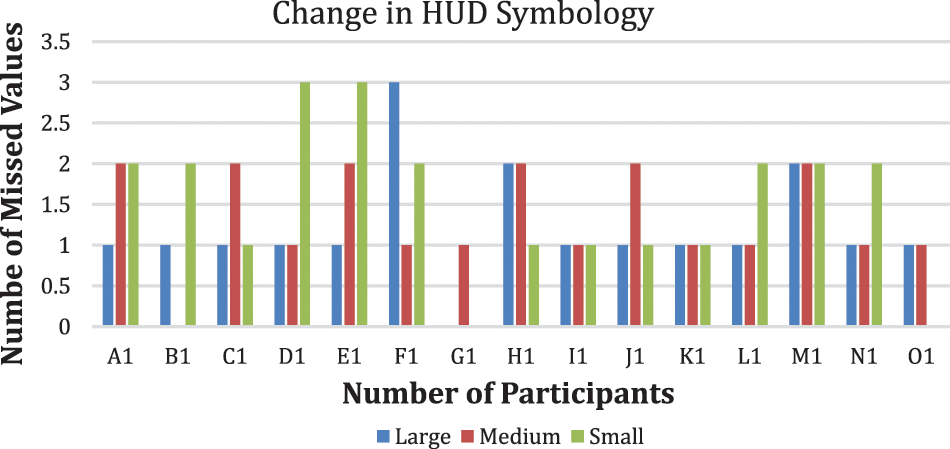
Figure 25: Change of head-up-display symbology of high luminance in synchronised with blue coloured object in the background of high luminance
In this paper, various experiments were carried out to judge the pilot’s situational awareness. Multiple participants studied the transition of background images outside the cockpit visor. Simultaneously, the participants were also involved in studying the transition of Symbology in the see-through glass of the Head-up display. To gather the information on transition in the background images through the participants, the different luminance and size of the objects in the background exterior to the cockpit display were kept. Similarly, to detect the transition in Symbology, the see-through display of HUD was also of three different luminance, i.e., low, medium and high. It was observed that the tendency of missing objects during the transition of the objects of the background was more in small and low luminance objects. Similarly, during the transition of HUD Symbology, the minimum number of detections was missed during the high luminosity of the HUD. This method can help judge the extent of distraction and situational awareness in the cockpit simulator during the preliminary training of the pilot.
Funding Statement: The authors received no specific funding for this study.
Conflicts of Interest: The authors declare that they have no conflicts of interest to report regarding the present study.
References
1. N. J. Ward and A. Parkes, “Head-up displays and their automotive application: An overview of human factors issues affecting safety,” Accident Analysis & Prevention, vol. 26, no. 6, pp. 703–717, 1994. [Google Scholar]
2. S. Shappell and D. Wiegmann, “HFACS analysis of military and civilian aviation accidents: A North American comparison,” in Proc. of the Annual Meeting of the Int. Society of Air Safety Investigators, Australia, pp. 2–8, 2004. [Google Scholar]
3. N. A. Stanton, K. L. Plant, A. P. Roberts and C. K. Allison, “Use of highways in the sky and a virtual pad for landing head up display symbology to enable improved helicopter pilots situation awareness and workload in degraded visual conditions,” Ergonomics, vol. 62, no. 2, pp. 255–267, 2019. [Google Scholar]
4. J. T. Hwang and A. Ning, “Large-scale multidisciplinary optimization of an electric aircraft for on-demand mobility,” in “2018 AIAA/ASCE/AHS/ASC Structures, Structural Dynamics, and Materials Conf,” Kissimmee, Florida, pp. 1384, 2018. [Google Scholar]
5. K. Lee, “Effects of flight factors on pilot performance, workload, and stress at final approach to landing phase of flight,” Ph.D. Dissertation, Industrial Engineering and Management Systems, College of Engineering and Computer Science, Florida, 2010. [Google Scholar]
6. V. Karar and S. Ghosh, “Estimation of tunneling effect caused by luminance non-uniformity in head-up displays,” Chinese Optics Letters, vol. 12, no. 1, pp. 013301, 2014. [Google Scholar]
7. K. Vinod, S. Yaduvir, P. Bajpai and H. Garg, “Study of attention capture aspects with respect to contrast ratio for wide background luminance range in head-up displays,” Lecture Notes in Engineering and Computer Science, pp. 1328–1333, 2012. [Google Scholar]
8. S. Shappell, C. Detwiler, K. Holcomb, C. Hackworth, A. Boquet et al., “Human error and commercial aviation accidents: An analysis using the human factors analysis and classification system,” in Human Error in Aviation, 1st ed., vol. 1. London, UK: Routledge, pp. 73–88, 2017. [Google Scholar]
9. V. Peysakhovich, O. Lefrançois, F. Dehais and M. Causse, “The neuroergonomics of aircraft cockpits: The four stages of eye-tracking integration to enhance flight safety,” Safety, vol. 4, no. 1, pp. 8, 2018. [Google Scholar]
10. J. Pullukat, S. Tanaka and J. Jiang, “P-25: Effects of image distance on cognitive tunneling with augmented reality head up displays,” in SID Symp. Digest of Technical Papers, Bascom Avenue, Campbell, CA 95008, pp. 1427–1430, 2020. [Google Scholar]
11. D. Kelly and M. Efthymiou, “An analysis of human factors in fifty controlled flight into terrain aviation accidents from 2007 to 2017,” Journal of Safety Research, vol. 69, pp. 155–165, 2019. [Google Scholar]
12. R. Martin-Emerson and C. D. Wickens, “Superimposition, symbology, visual attention, and the head-up display,” Human Factors, vol. 39, no. 4, pp. 581–601, 1997. [Google Scholar]
13. V. Charissis and M. Naef, “Evaluation of prototype automotive head-up display interface: Testing driver’s focusing ability through a VR simulation,” in 2007 IEEE Intelligent Vehicles Symp., Istanbul, pp. 560–565, 2007. [Google Scholar]
14. M. Yeh, J. L. Merlo, C. D. Wickens and D. L. Brandenburg, “Head up versus head down: The costs of imprecision, unreliability, and visual clutter on cue effectiveness for display signaling,” Human Factors, vol. 45, no. 3, pp. 390–407, 2003. [Google Scholar]
15. S. -H. Kim, L. J. Prinzel, D. B. Kaber, A. L. Alexander, E. M. Stelzer et al., “Multidimensional measure of display clutter and pilot performance for advanced head-up display,” Aviation, Space, and Environmental Medicine, vol. 82, no. 11, pp. 1013–1022, 2011. [Google Scholar]
16. M. J. Lazaro, Y. Kang, M. H. Yun and S. Kim, “The effects of visual complexity and decluttering methods on visual search and target detection in cockpit displays,” International Journal of Human–Computer Interaction, vol. 37, no. 7, pp. 588–600, 2021. [Google Scholar]
17. Y. Wang, Y. Wu, C. Chen, B. Wu, S. Ma et al., “Inattentional blindness in augmented reality head-up display-assisted driving,” International Journal of Human–Computer Interaction, vol. 38, no. 9, pp. 837–850, 2022. [Google Scholar]
18. A. White and D. O’Hare, “In plane sight: Inattentional blindness affects visual detection of external targets in simulated flight,” Applied Ergonomics, vol. 98, pp. 103578, 2022. [Google Scholar]
19. J. Wan and O. Tsimhoni, “Effects of luminance contrast and font size on dual-plane head-up display legibility (“the double 007 rule for HUDs”),” Journal of the Society for Information Display, vol. 29, no. 5, pp. 328–341, 2021. [Google Scholar]
Cite This Article
 Copyright © 2023 The Author(s). Published by Tech Science Press.
This work is licensed under a Creative Commons Attribution 4.0 International License , which permits unrestricted use, distribution, and reproduction in any medium, provided the original work is properly cited.
 Downloads
 Citation Tools