
 Submit a Paper
 Propose a Special lssue
 Open Access
ARTICLE

Optimal Allocation of STATCOM to Enhance Transient Stability Using Imperialist Competitive Algorithm
1 Department of Energy, Zarqa University, Zarqa, 13133, Jordan
2 Department of Mechanical Engineering, Al-Zaytoonah University of Jordan, Amman, 11733, Jordan
3 Abdul Aziz Al Ghurair School of Advanced Computing (ASAC), Luminus Technical University College, Jordan
4 Department of Energy, Zarqa University, Zarqa, 13133, Jordan
5 Department of Electrical and Electronics Engineering, Faculty of Engineering and Architectures, Nisantasi University, Istanbul, Turkey
6 Department of Electrical Engineering, Jouybar Branch, Islamic Azad University, Jouybar, Iran
7 Renewable Energy Research Centre (RERC), Department of Teacher Training in Electrical Engineering, Faculty of Technical Education, King Mongkut’s University of Technology North Bangkok, 1518, Pracharat 1 Road, Bangsue, Bangkok, 10800, Thailand
* Corresponding Author: Mehrdad Ahmadi Kamarposhti. Email:
Intelligent Automation & Soft Computing 2023, 36(3), 3425-3446. https://doi.org/10.32604/iasc.2023.034854
Received 29 July 2022; Accepted 26 October 2022; Issue published 15 March 2023
 View Full Text
 Download PDF
Abstract
With the daily expansion of global energy consumption, developing the power grids is of uttermost importance. However, building a new transmission line is costly and time-consuming, so utilizing the same lines with possible higher transmission capacity is very cost-effective. In this regard, to increase the capacity of the transmission lines, the flexible alternating current transmission system (FACTS) has been widely used in power grids in recent years by industrialized countries. One of the essential topics in electrical power systems is the reactive power compensation, and the FACTS plays a significant role in controlling the reactive power current in the power grid and the system voltage oscillations and stability. When a static synchronous compensator (STATCOM) is embedded in a power system to increase the bus voltage, a supplementary damping controller can be designed to enhance the system oscillation damping. Given the expansion of the grids in the power system, the complexity of their optimization and the extraordinary ability of the imperialist competitive algorithm (ICA) for solving such problems, in this paper, the ICA has been used to determine the optimal position and size of the FACTS devices.Keywords
Generally, the concept of FACTS is utilizing the power electronics-based devices on the high-voltage side of the grid, which can be electrically controlled. In this regard, some specific methods are proposed for developing and using the power electronic-based devices aiming for controlling power distribution on the high-voltage side of the grid. The FACTS devices have two main goals as follows [1]:
• Enhancing the power transmission ability of transmission systems
• Passing power through desired paths
The first goal means that if the system stability can be maintained during the error occurrence, the transmission power can be increased until approaching the thermal limit by applying the real-time power control. This does not mean that the lines always operate at their thermal limit (because the power losses will be high and unacceptable); however, this can be applied in emergency conditions. Using FACTS controllers instead of considering a large stability margin will significantly increase the power transmission in normal condition. One of the limitations of exploiting the transmission system is that increasing the transmission power of a line in a system will decrease its stability [2].
If the transmission power gradually increases, the system suddenly becomes unstable at a specific level of transmission power. This level is the maximum power that can be transmitted in a steady state. This bound is not an irreversible value stabilized by designing a synchronous motor and transmission line; this can change by different factors. The main factors affecting the bound are synchronous motor excitation, number and connection of lines, types of synchronous motors connected to the grid and compensating devices. Compensators enable the system to pass more power through the lines in the stability limit by injecting the reactive power; as a result, the loadability of the power system is increased. The second goal defines that if the line current is controllable, for example, by changing effective impedance of the line, the power can be transmitted through arbitrary power transmission corridors and restricts the power transmission. Besides, this goal implicitly expresses that a rapid change of power transmission path should be possible in the case of event occurrence so that the power transmission can be done desirably in the whole transmission system. Fulfilling the two above-mentioned goals demand the improvement of controllers and high-power compensators [3–6].
In recent years, voltage collapse has become one of the main concerns in the field of power grids. There is a direct relationship between several large turnouts in countries like Japan, Italy, and US and the voltage collapse. The voltage instability occurs whether a high load is fed into the grid or a local reactive power shortage occurs. Several attempts have been made to overcome this challenge and ensure voltage stability in the grid, and eventually, the FACTS devices were invented. It was found that these devices are useful tools for enhancing the voltage static stability margin in the power grid and can operate near the steady-state stability limit. Another advantage of the FACTS devices is increasing the capacity of transmission lines. Of course, exploiting the advantages of FACT devices is highly dependent on their placement. The optimal placement of FACTS devices has attracted the attention of many researchers in the field of power systems, and the researchers have proposed different solutions [7–10].
There are different types of mathematical methods for solving optimal placement such as the modal analysis method. The modal analysis or eigenvalues is used to identify the busses near the voltage collapse point or recognize the point at which the power feeding is more useful [11]. In [12], the authors have used a combination of dynamic and static methods to optimize the compensators’ location, type, and size. This method is based on the continuous and optimal load distribution and analyzes the eigenvalues. The results show that the proposed method was useful in coordinating the performance of FACTS performance to increase the power system dynamic. Besides, in [13], authors have investigated the location and number of compensators in the power market using the mixed integer nonlinear program (MINLP) method. It should be noted that this method has some problems in detecting optimal points when there are some local extremums. Despite the methods mentioned above, optimization methods have also been used for solving this problem. The basic of these methods is using optimization algorithms. The genetic and particle swarm algorithms fall in this type of method [14–16].
In [17], the ant colony and genetic algorithms are used to optimize the location and capacity of STATCOM for enhancing voltage stability. The voltage stability is a critical problem in power systems, especially in the load peak. Therefore, the authors have used the STATCOM with equivalent-current-inject (ECI) to compensate for the reactive power and have optimized it using the above-mentioned algorithms. Finally, they evaluate IEEE 30-bus test, which shows enhanced voltage stability. In [3], the particle swarm optimization (PSO) method is used to determine the optimal location and controller parameters of STATCOM. First, a systematic procedure has been provided to determine the optimal location of STATCOM in order to enhance the transient stability after severe disturbances. The proposed algorithm is applied in a two-area system that uses the PSO for finding the optimal location of STATCOM. In addition, the STATCOM-based damping controller is presented, and the controller parameter along with PSSs was determined synchronously by using the PSO. The nonlinear simulation results reveal that the optimal STATCOM has extended the cleaning time of the critical error, which as a result, enhances the transient stability of the system. Besides, a coordinated design of STATCOM-based controllers and power system stabilizer (PSS) which use this method can significantly enhance the system stability. This is done by rapid damping of the power system oscillations under small and severe disturbance conditions. Eventually, the coordinated design problem has been extended to the four-machine two-area power system.
In [4], the advanced PSO algorithm has been used to determine the desired size and appropriate assignment of STATCOM in a power system. This algorithm has successfully found the optimal settings for current infrastructures as well as the optimal locations, size, controller settings, and STATCOM settings. The effectiveness of this algorithm has been tested in an IEEE 30-bus test standard system. The results show that the proposed algorithm is able to find the best solution with high statistical significance and high-level of convergence. In [5], a time-varying acceleration coefficients particle swarm optimization (TVAC-PSO) method has been proposed to find the optimal location and size of STATCOM to increase the voltage safety in probable line outage conditions in the power systems. The most severe line outage conditions were considered, then the PSO-TVAC optimization algorithm was used, and the efficiency of the method was evaluated in IEEE 30-bus test standard. This method can be performed for large-size power systems. More target functions can be considered instead of the two target functions of this study.
In [6], a novel method has been proposed for detecting the optimal location of STATCOM and static var compensator (SVC). The power system which operates in a stability boundary lost its stability by occurring disturbance. Given the probable outage, knowing the instability voltage in the assignment of FACTS devices is significant. This article defines the optimal location for installing SVC and STATCOM by considering the power system possibilities and their effects on the constant voltage. The stability voltage of the Khuzestan’s power grid, as a case study, and the optimal location for installing have been studied. By analyzing the location of the weakest bus in constant conditions, it was found that the STATCOM has a higher voltage stability margin than the SVC.
In [7], the quantitative evaluation and appropriate installation of SVC have been addressed to enhance the transient stability in a post. The evaluation procedure includes recognizing areas with low voltage safety and key errors, creating unsafety voltage in power system based on the quantitative analysis and installing SVC, which brings stability and safety for a power system.
In [8], the unified power flow controller (UPFC) locating has been performed to increase the voltage safety and reduce the congestion using the PSO algorithm. In addition to the optimal location, the optimization of size and number of UPFC has been performed. This method recognizes the compact transmission line and weak BUSs as the candidate places for UPFC installation based on the maximum probable intensity index and the L index. The optimal location of UPFC for reducing the congestion and enhancing the safety of voltage is modeled as an optimization problem and has been solved by the PSO algorithm. This algorithm is an effective and practical method for selecting and assigning UPFC in electrical power systems.
Damping the oscillations of the power system between the interconnected areas is vital for the safe operation of the system. In addition to PSSs, the FACTSs are also used for improving system stability. Specifically, utilization of traditional PSS in multi-machine systems cannot lonely provide enough damping for inter-area oscillations. In such cases, the flexible AC transmission system (FACTS) with power oscillation damping (POD) have been considered as a more effective solution. In addition, given that the electricity market has been deregulated in recent years, the traditional concepts and procedures used in the power systems have been changed. Therefore, the available power systems should be used in a more efficient way so that their capacities increase by installing FACTS devices. These devices play an increasingly significant role in the operation and control of power systems. Nevertheless, the non-coordinated local control of PSSs and FACTS devices can lead to unstabilize interactions. Various works have been done regarding the coordination between FACTS POD and PSSs controller to enhance overall system performance. Some of these methods are based on complicated nonlinear simulations, while the others are based on the linear power system model.
In [9], an optimization-based algorithm has been proposed for simultaneous coordination between some controllers. This algorithm uses a hybrid second-order programming method to enhance the system’s overall performance. The interaction between these controllers will enhance by minimizing the target function in which the effects of PSSs and FACTS POD controllers have not been considered. Therefore, the overall performance of the system will be optimized.
In [10], the investigation of three heuristic methods (GA, TS, SA) in the optimization of FACTS devices in a power system has been addressed. The optimization has been done on three factors, including location, size, and type of FACTS devices. Five FACTS controllers have been used for modeling the steady-state. The proposed method was performed in the IEEE 118-bus test. The results show that these three convergence algorithms have similar optimal solutions. However, the TS and GA algorithms are converged faster than the SA. The simulation shows that the FACTS devices can enhance the system stability margin, while some limitations may be observed.
In [16], the nondominated sorting genetic algorithm (NSGA) has been proposed to optimize the location and size of SVC to minimize power loss and enhance the voltage profile. The desired placement of SVC can considerably increase the voltage safety in a power system. The effectiveness of the proposed method has been tested in the IEEE 30-bus test. It was found that this algorithm could be implementable in the power system.
In this paper, the ICA algorithm has been used to determine the optimal location and size of STATCOM by considering the transient stability of the power system. In Section 2, the STATCOM is introduced. The introduction of the ICA algorithm and the problem analysis procedure are addressed in Section 3. In Section 4, the modeling of the problem is presented. In Section 5, the discussion of the results of simulations performed in MATLAB software and the plots’ analysis are provided. Finally, the conclusions and future works are provided in Section 6.
2 Static Synchronous Compensator (STATCOM)
The basis of STATCOM performance is the same as the synchronous condenser. Since the power electronic devices are used in building such devices, they are called static compensators. The converters used in this compensator provide the required reactive power locally (at the grid-STATCOM connection location), and its output can be continuously regulated. For this reason, in some scenarios in which the power grid voltage is widely changed (when a disturbance occurs or after error correction), this compensator is used. Fig. 1 shows a schematic of STATCOM and its V-I characteristic. Production or absorption of reactive power by the voltage source converter (VSC) is done by regulating the Vref voltage.
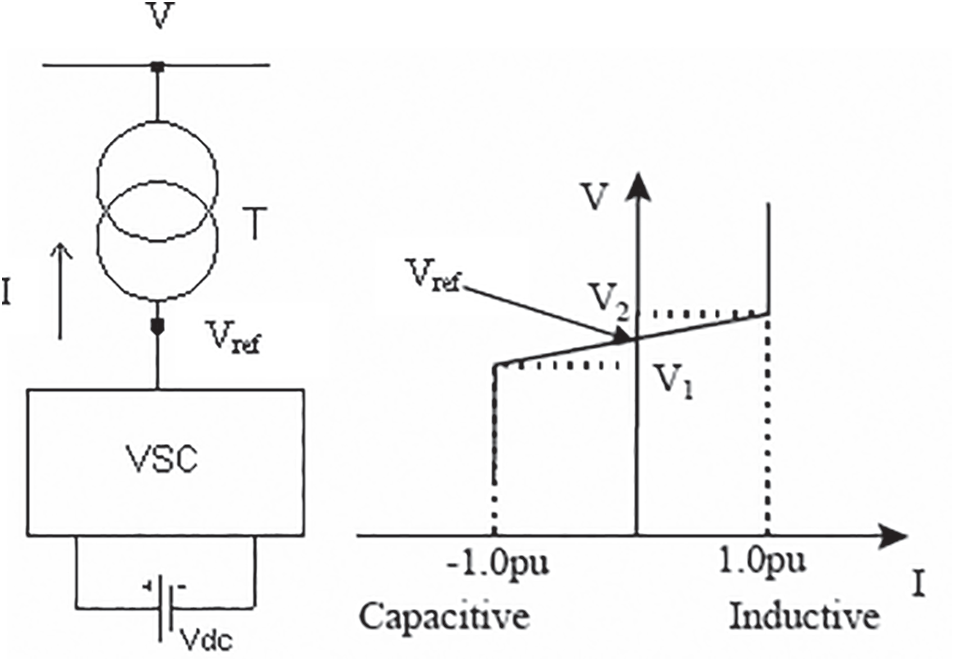
Figure 1: STATCOM and its V-I characteristic
The most important applications of STATCOM include:
• Voltage dynamic control
• Transient stability improvement
• Eliminating power oscillations in power grid
• Controlling both reactive and real powers
3 Imperialist Competitive Algorithm (ICA)
In optimization, the goal is to find an optimal answer in terms of the problem variables. Here, an array of problem variables should be created, optimized by the target. In the ICA, this array is called a country. In an optimization problem with N variables, a country has N features, each being equal to a variable. These features determine the power of that country (the corresponding cost function). In the optimization problem, this algorithm seeks for the best country. In fact, finding this country is equal to finding the best parameters of the problem, which produces the minim cost function.
To start the algorithm, an N country should be created. These countries are the possible answers to the problem and are equal to the chromosome in the genetic algorithm and particle in the particle swam optimization.
The Nimp of best members of this population, i.e., countries with a minimum cost function, are selected as imperialists. The remaining countries form the colonies, each belonging to an empire. First, some colonies, based on the power of the imperialist, are given to each imperialist. Therefore, the total countries are divided into two groups: the majority group called a colony, and the minority group called empire or colonialist. An emperor, along with its colonies, is called an empire. As stated earlier, this algorithm seeks to find the best country, and to this end, some policies (operators) are defined. The main policies (operators) of this algorithm are:
• Assimilation (attraction)
• Translational motion or revolution
• Colonial competition
• Eliminating the weakest empire
The two first policies are done in every empire, while the third one is done between empires. Finally, the fourth policy is applied to the weakest empire.
Under the assimilation policy, every colony moves toward its colonialist to obtain the empire features. Under the revolution policy, some of the colonies of every empire are located in a new location which is adopted randomly. Under the colonial competition, the weakest empire loses one of its colonies, and as a result, its power will degrade. Finally, under the elimination policy, the empire with no colony will be eliminated and itself become a colony of other empires.
The power of an empire depends on the power of the empire and all its colonies. Finally, the power of every empire is equal to the power of empire plus to a percentage of its average colonial power. The pseudocode of the ICA flowchart shown in Fig. 2 is as follows:
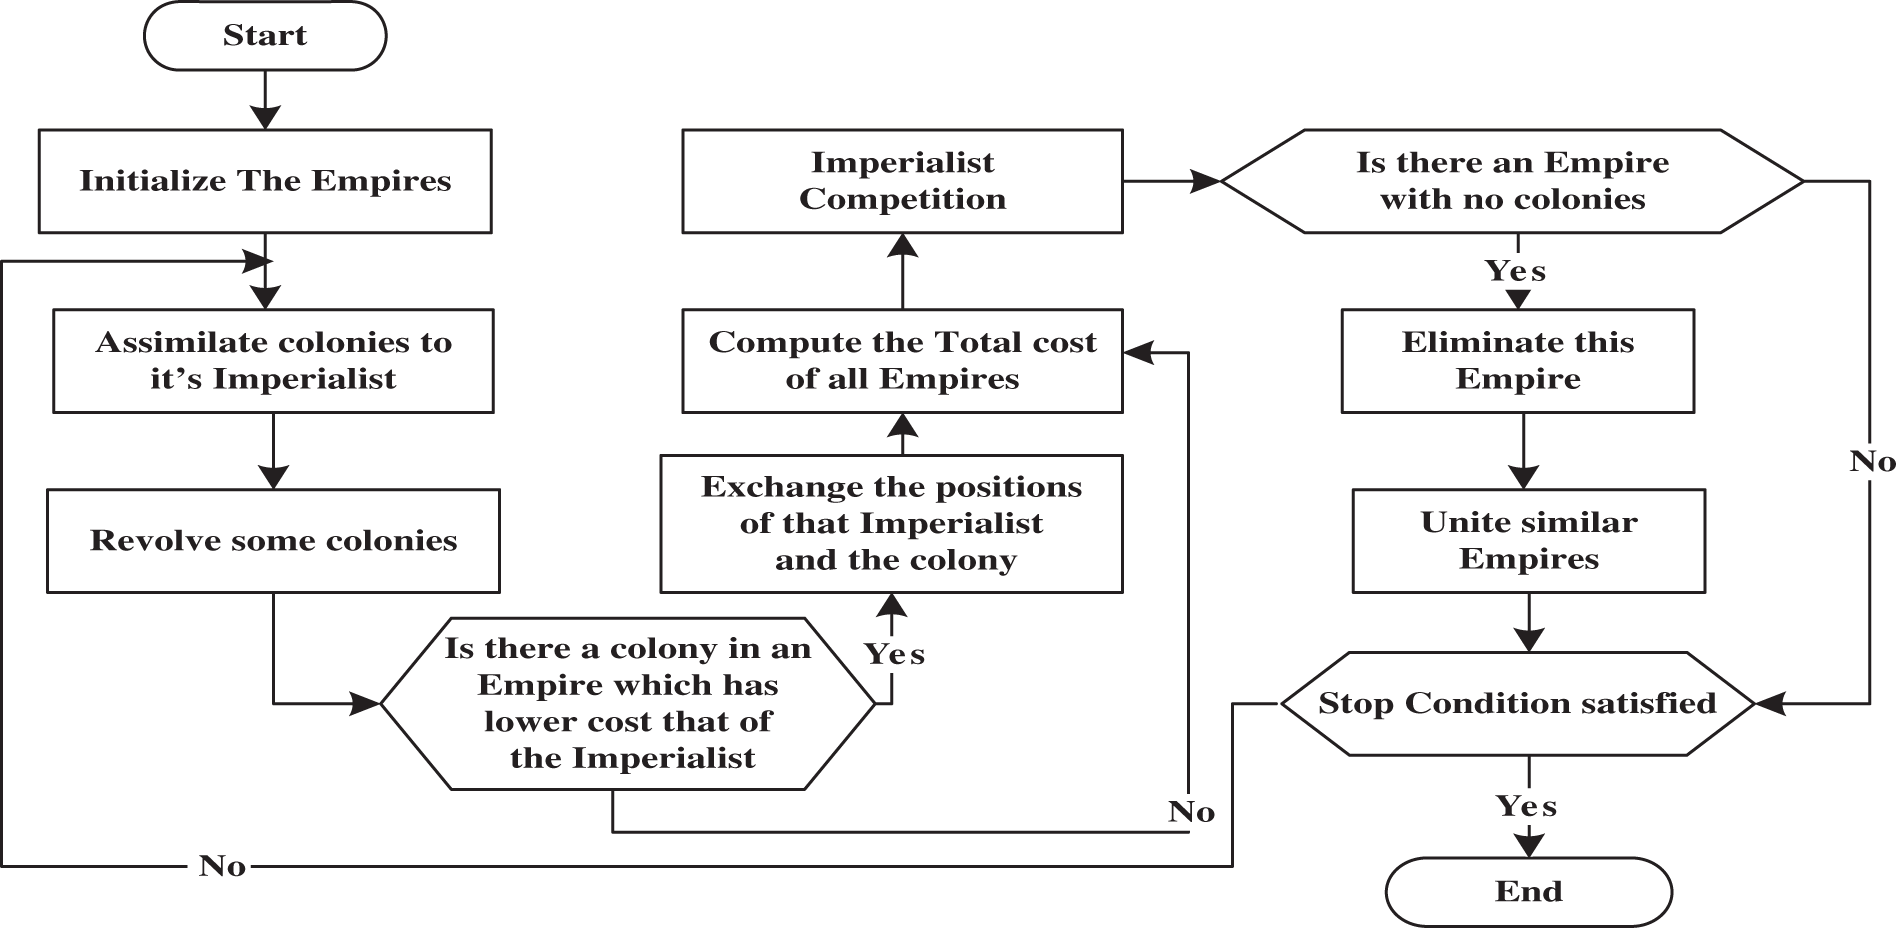
Figure 2: Flowchart of ICA
• Select some random points on the function and forms the initial empires.
• Moves the colonies toward the imperialist countries (assimilation policy).
• A small number of colonies of each empire are moved to a new position that is selected as randomly (revolution policy).
• If there is a colony in an empire who has a cost less that the imperialist, switch the location of colony and imperialist.
• Calculate the cost (power) of whole empire (by considering the cost of imperialists and their colonies).
• Select one colony from the weakest empire, and give it to the empire with maximum possibility for taking it up.
• Eliminate the weakest empire who have no colony.
• If two empires are getting very close to each other, merge them and forms a single empire.
• If only a single empire is left, stop, otherwise move back to 2.
By having cost (power) of all imperialists, the normalized power can be considered as follows:
where
where
where
The power of jth empire,
where is a value between 0 and 1. The normalized power of jth empire,
By using the power of jth empire, the possibility of conquering a colony by the jth empire can be obtained by following equation.
The assimilation policy (see Fig. 3) is defined as Eq. (7) in the ICA, which leads to move the colonies toward emperor:
where
Hint: in the modified method, the obtained value of U every time is minus from one (1-U), and for these points, the algorithm also performs the seeking and calculating.
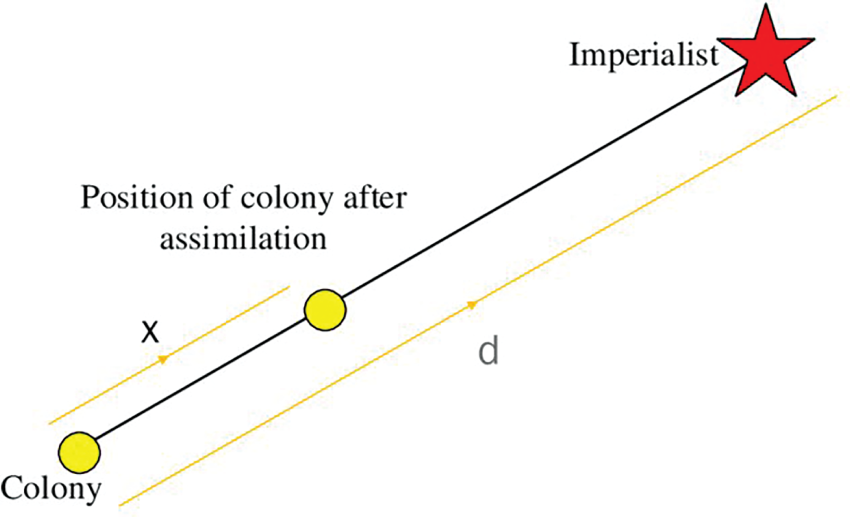
Figure 3: Assimilation policy
The algorithm is repeated until the convergence condition is fulfilled and/or the total number of iterations is reached. After some time, all empires fall, and only a single one remains, and the other countries will be under the control of the remained empire. In this new ideal world, all colonies are administered by a single empire, and the location and cost of colonies are equal to the location and cost of the imperialist country. In this new world, there is no difference between the colonies and between the colonies and the imperialist country. In other words, all countries at the same time are colonies and colonialists. In such situations, the imperialistic competition is over, and the algorithm is stopped [18–26].
The power transmission capacity and the system’s transient stability can be enhanced by changing the location of STATCOM from the middle point toward the sending point. For certain initial operational conditions, there is an optimal location for STATCOM at which the maximum power of sending point related to Section 1 of the transmission line is equal to the maximum power of receiving point related to Section 2 of the transmission line. In view of transient stability, the maximum power of sending point is considered a power of productive terminals that can be received immediately after an error affecting the transient stability. So, the target function for preserving the transient stability can be defined as follows:
where
If
where
The following steps should be followed for seeking the optimal location for STATCOM in order to enhance the transient stability.
Step 1: firstly, a fault-clearing time (TFC) is selected high enough so that the system be unstable in all STATCOM locations.
Step 2: using the ICA to minimize the target function J
Step 3: examining the system stability
Step 4: if the system is unstable, the TFC value is reduced and Step 2 is repeated. Stop if the system becomes stable.
At TFC = TFCF, system is stable if the STATCOM is located in the optimal location obtained from the above-mentioned method, and for TFC > TFCF, the system is unstable in all locations.
The PSS block related to Sim Power System (SPS) tool is used to add damping to rotor oscillations related to the machine by controlling its stimulation. The output signal related to PSS is used as the additional input (VS) for the stimulation system block. The PSS input signal can be either machine speed deviation or the accelerator power. The PSS model uses a low pass filter, an overall gain, washout high pass filter, a phase compensator system, and an output limiter (see Fig. 4). The overall gain, KP, determines the damping produced by stabilizing. The washout filter eliminates the low frequencies that exist in the input signal and enables PSS to respond only to the input changes. The compensator system is used to compensate for the phase delay between phase stimulation and the electrical torque of the synchronous machine [27–32]. It should be noted that the PSS and STATCOM-based controllers have been designed to minimize the power system oscillations after a huge oscillation to enhance the power system stability (Fig. 4).
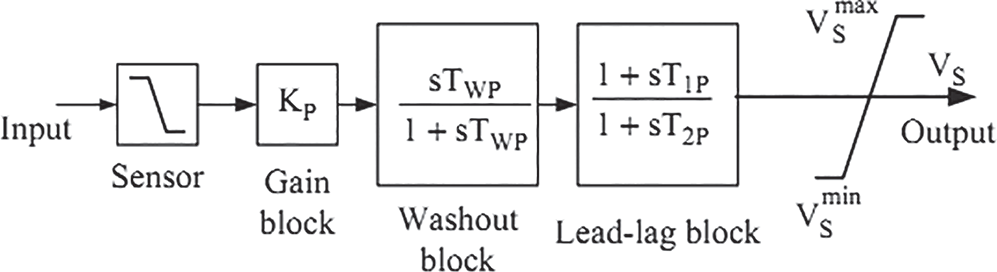
Figure 4: Structure of power system stabilizer
5 Simulation and Results Analysis
The MATLAB/SIMULINK model has been designed using a set of SPS blocks to determine the optimal location and size of STATCOM. The system under study comprises two hydraulic generator units, one with power of 1000 MVA in area 1 and the other with the power of 5000 MWA in area 2. A six-order model (shown in Fig. 5) has represented the generators. Both generators are equipped with a hydraulic turbine and governor (HTG) and a stimulation system. The HGT represents a nonlinear hydraulic turbine model, and a proportional–integral–derivative controller (PID) system, and servomotor. The stimulation system is composed of a DC voltage regulator without an actuator saturation function. Generators with output voltages of 13.8 kV are connected by a 700 km three-phase transmission line with zero sequence impedance
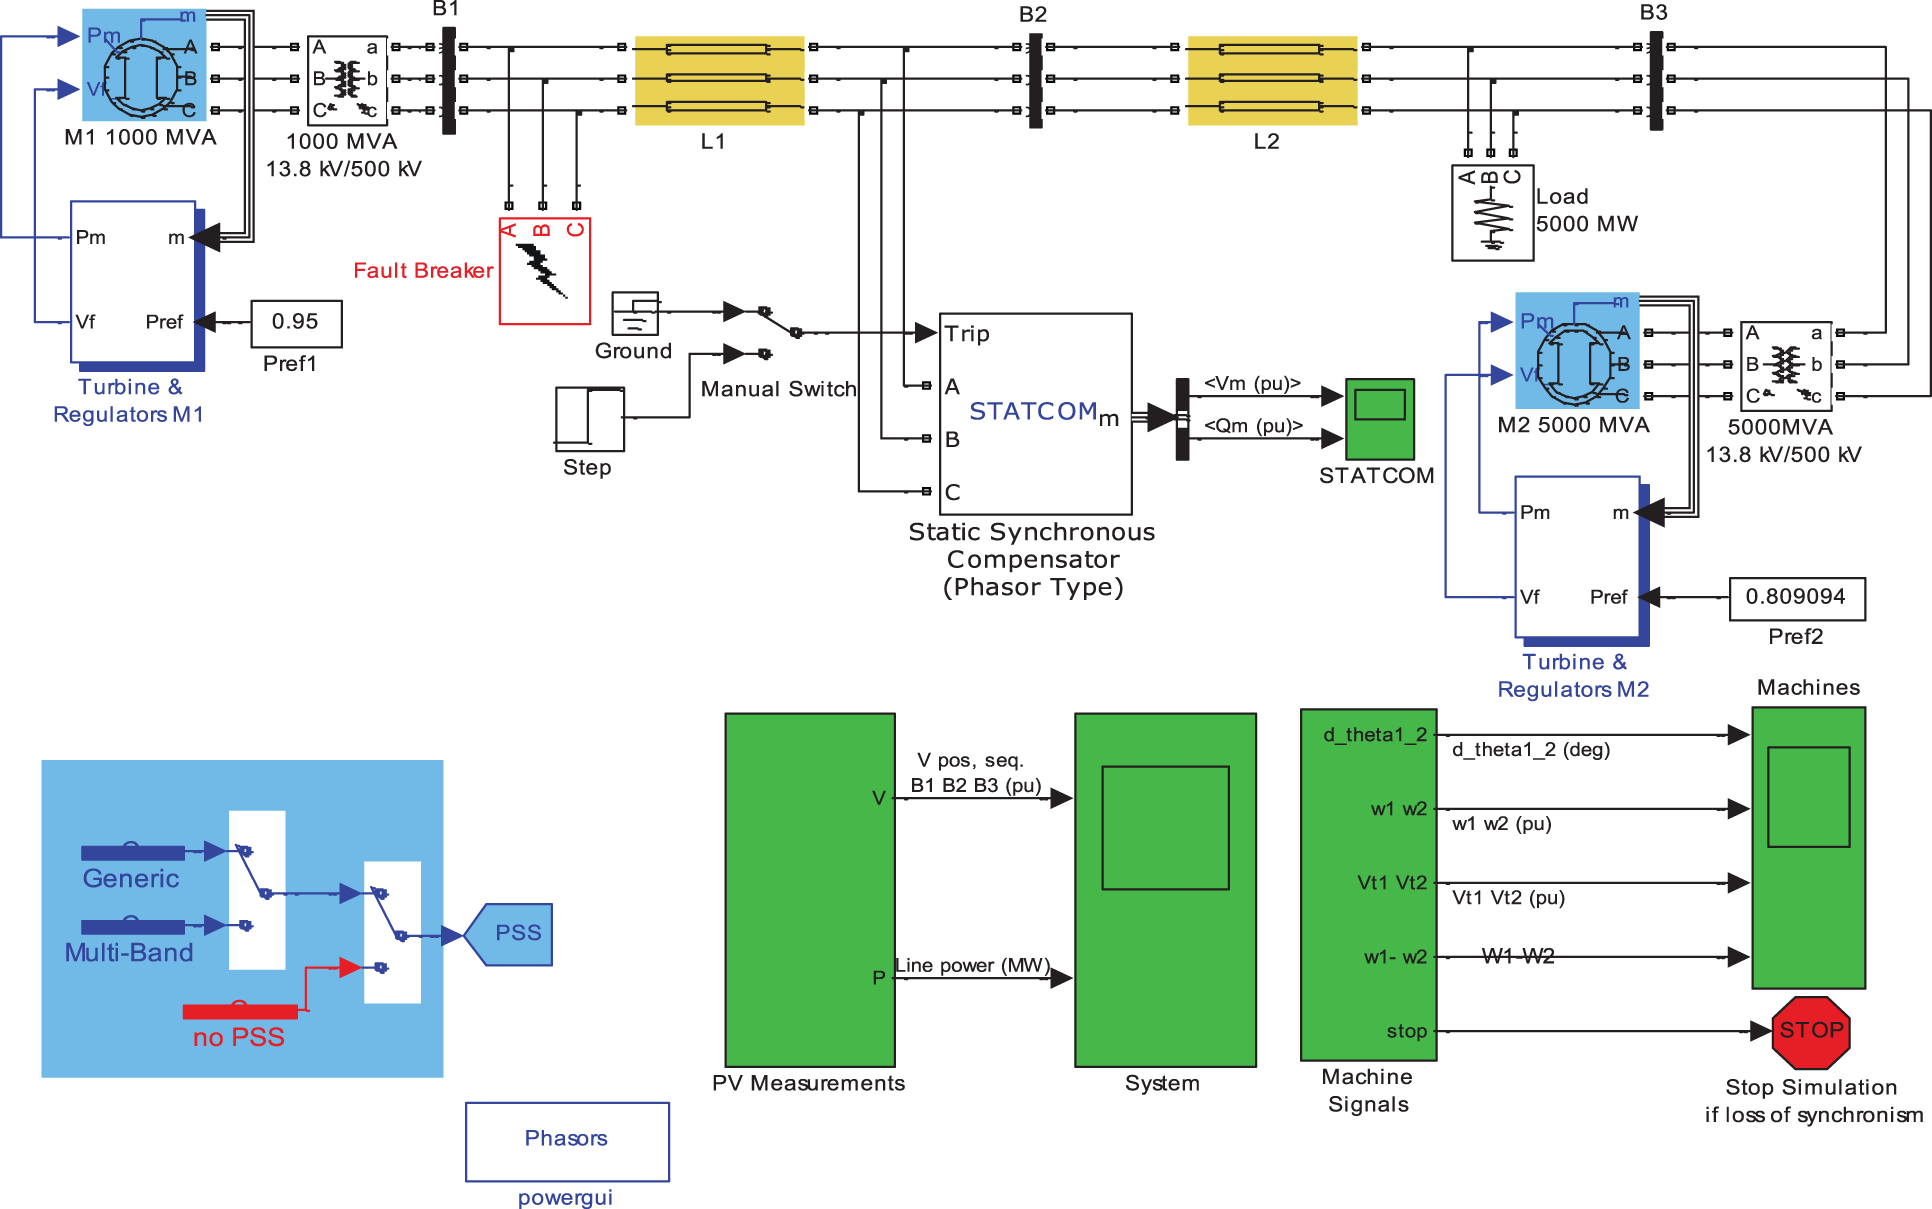
Figure 5: Two-motor system designed with MATLAB simulink
First, the STATCOM is eliminated from the system, then a three-phase error is applied to the system at t = 1 s, and the error is cleaned at t = 1.1 s. It can be seen that the system represents stable behavior after cleaning the error. As can be seen from Figs. 6–11, after the occurrence of an error, the rotor angular difference, rotor speed, voltage of terminals 1 & 2, and buss’s voltages move toward instability, and as a result, the system become unstable. The wave shape of voltages and power after error cleanness will be as undamped oscillations, denoting the system’s instability (Figs. 6 to 11).
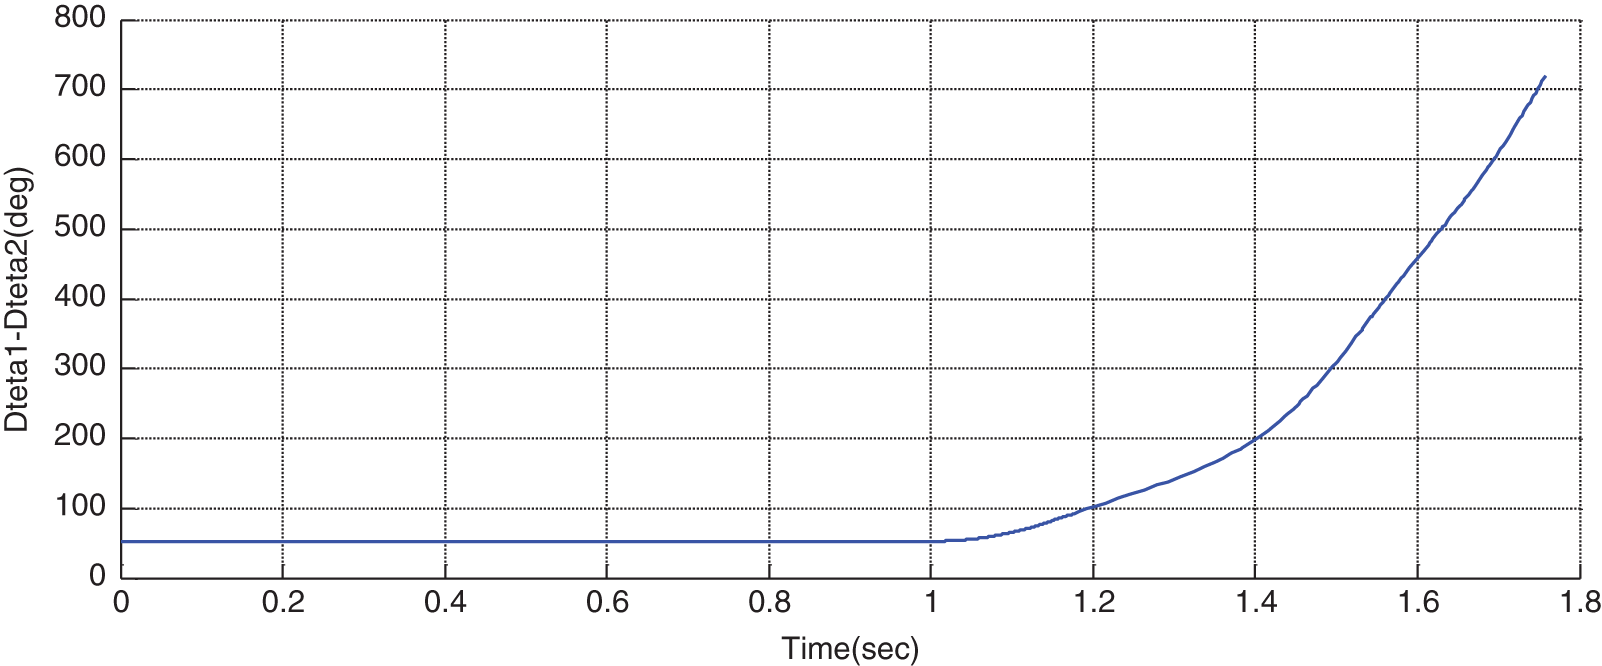
Figure 6: Variations of rotor angular difference in the absence of STATCOM
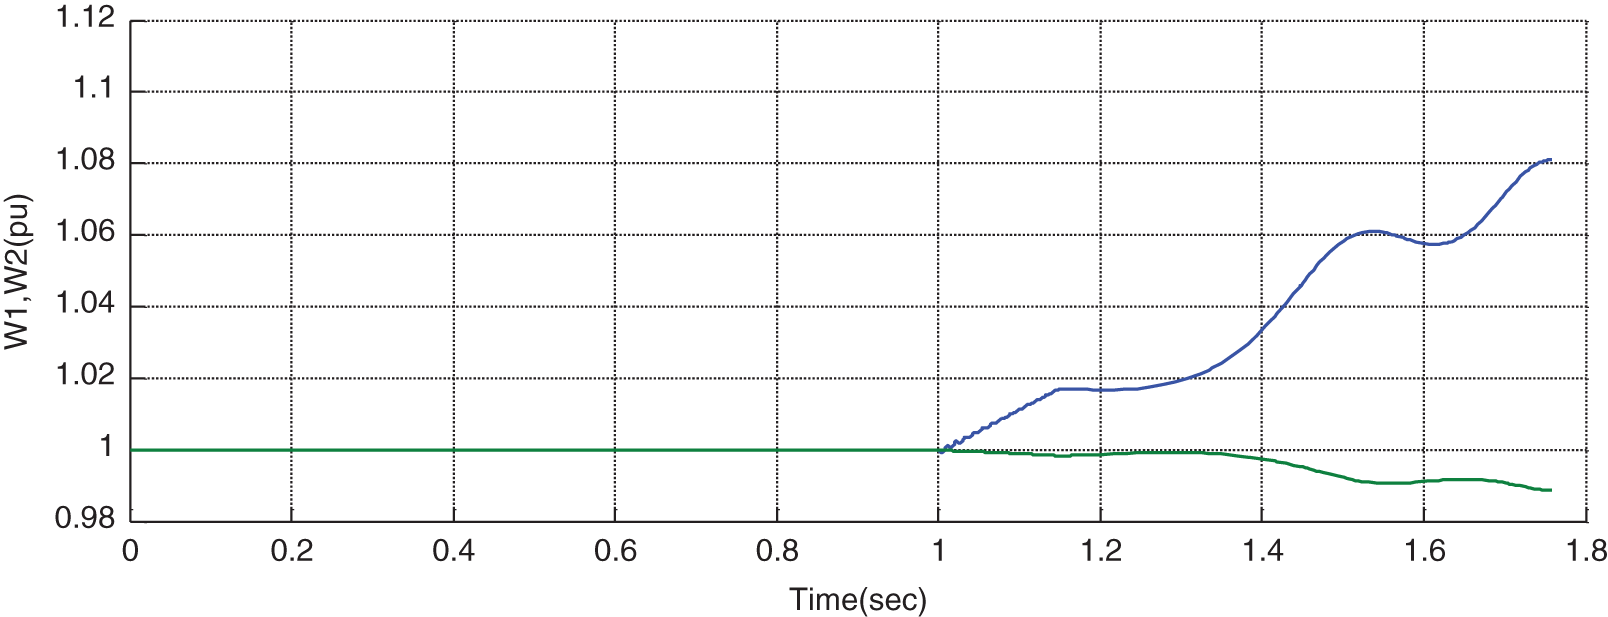
Figure 7: Variations of rotor speed (W1,W2) in the absence of STATCOM
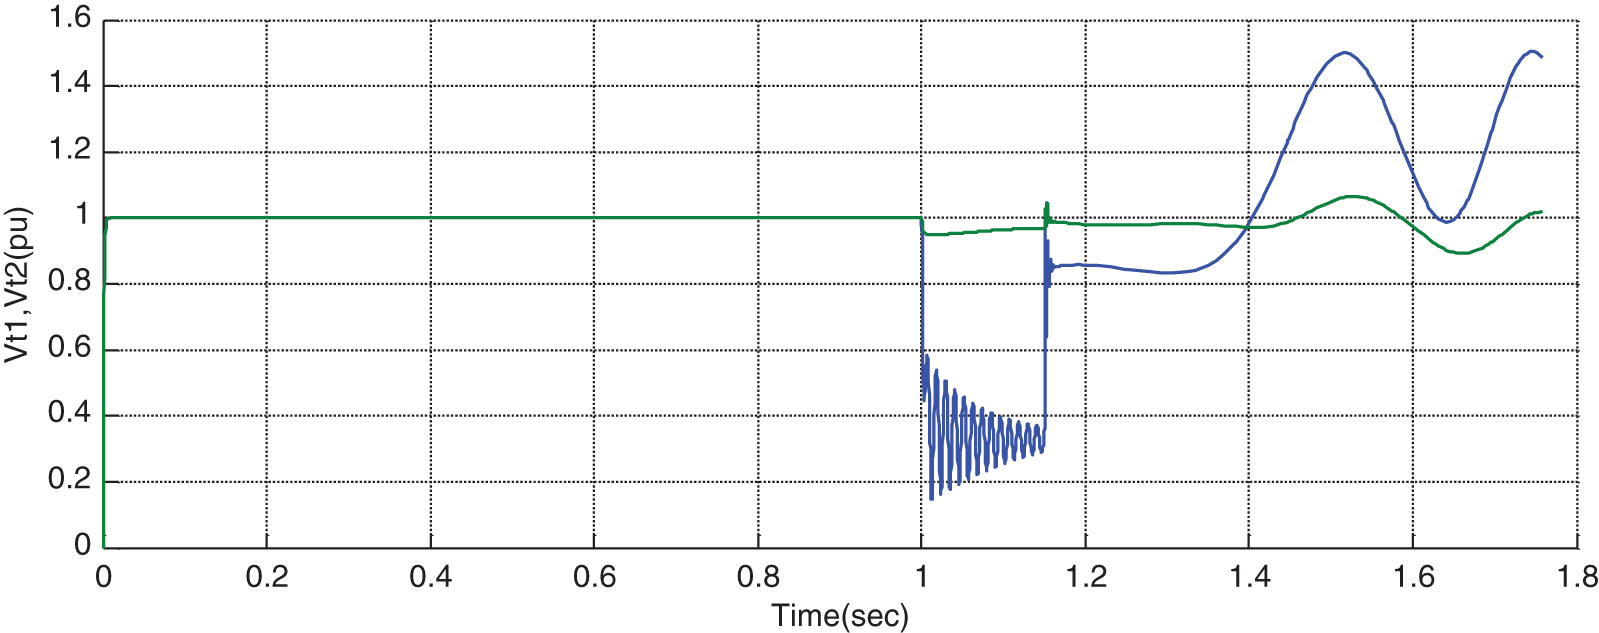
Figure 8: Variations of voltage of terminals 1 and 2 in the absence of STATCOM
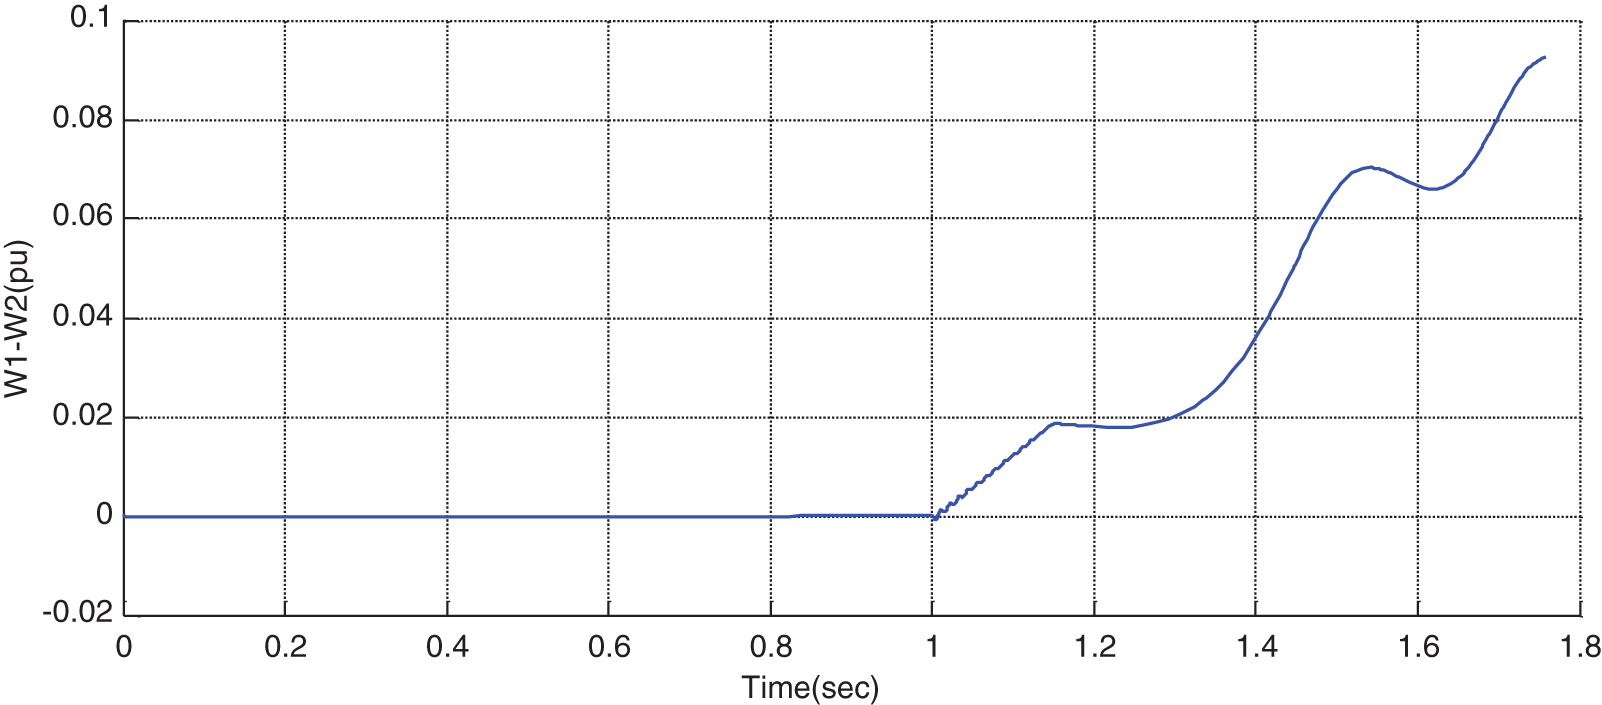
Figure 9: Variations of rotor speed difference in the absence of STATCOM
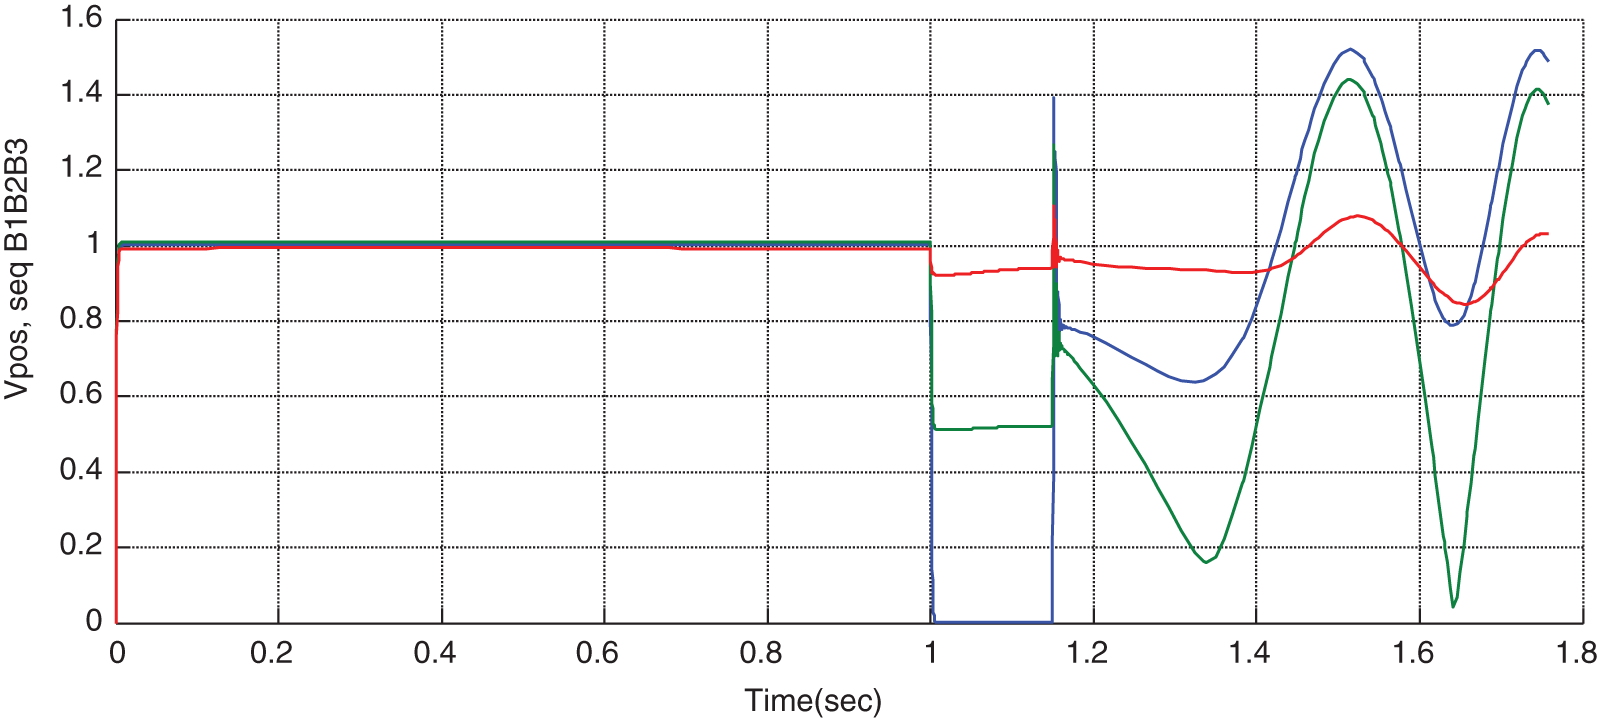
Figure 10: Variations of positive sequence voltage B1, B2, and B3 in the absence of STATCOM
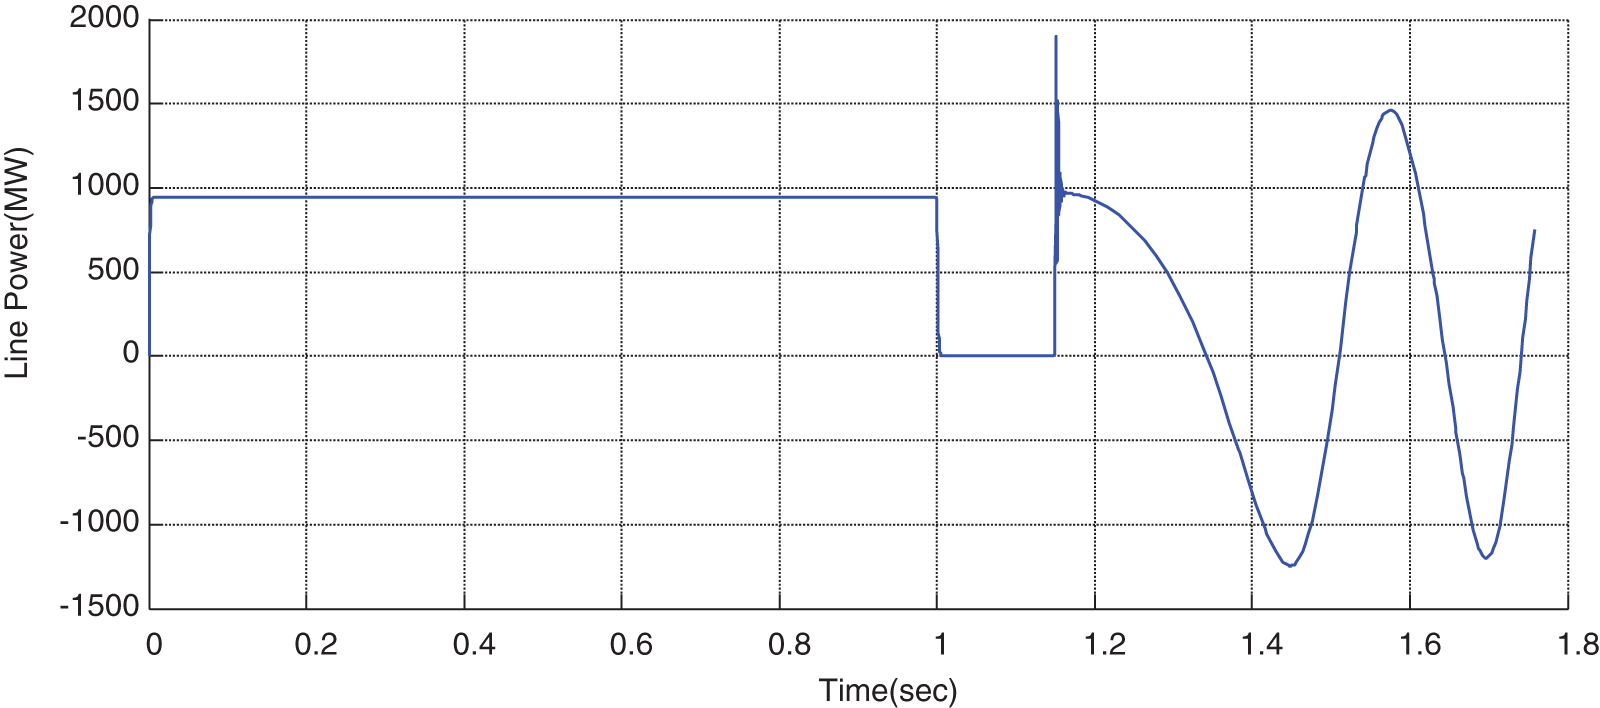
Figure 11: Variations of line power in the absence of STATCOM
In the next step, the STATCOM is embedded in the system, and the cleaning time will be longer. It can be seen that, for TFC > TFCF, the system is unstable in all locations. As can be observed from Figs. 12 to 17, after the occurrence of error and by considering the cleaning time of 1.15 s, the rotor angular difference, rotor speed, line power, voltage of terminals 1 & 2, and the bus’s voltage are unstable. In this case, if STATCOM is placed anywhere in the system, the system will not be stable.
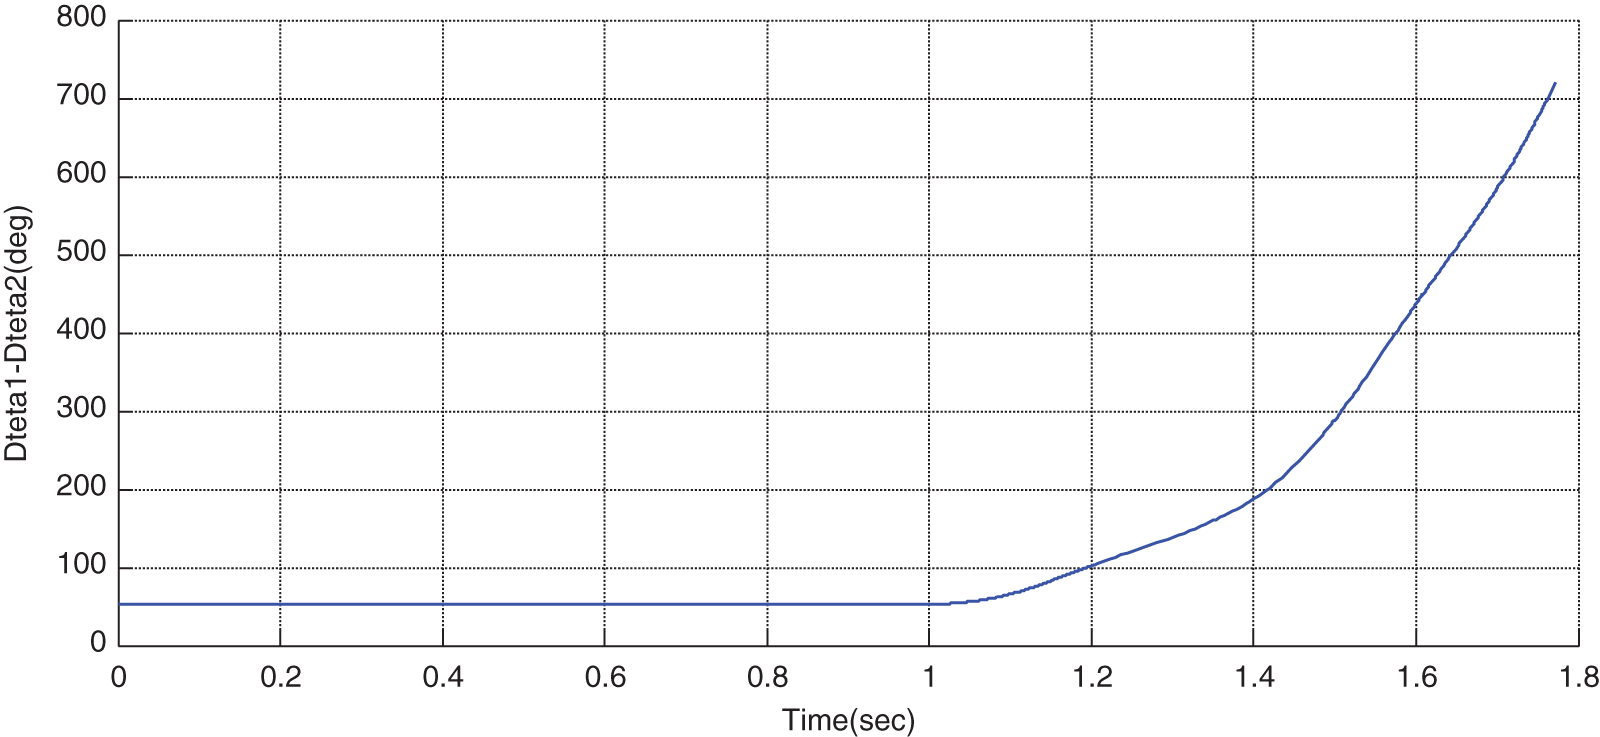
Figure 12: Variations of rotor angular difference in the presence of STATCOM for TFC > TFCF
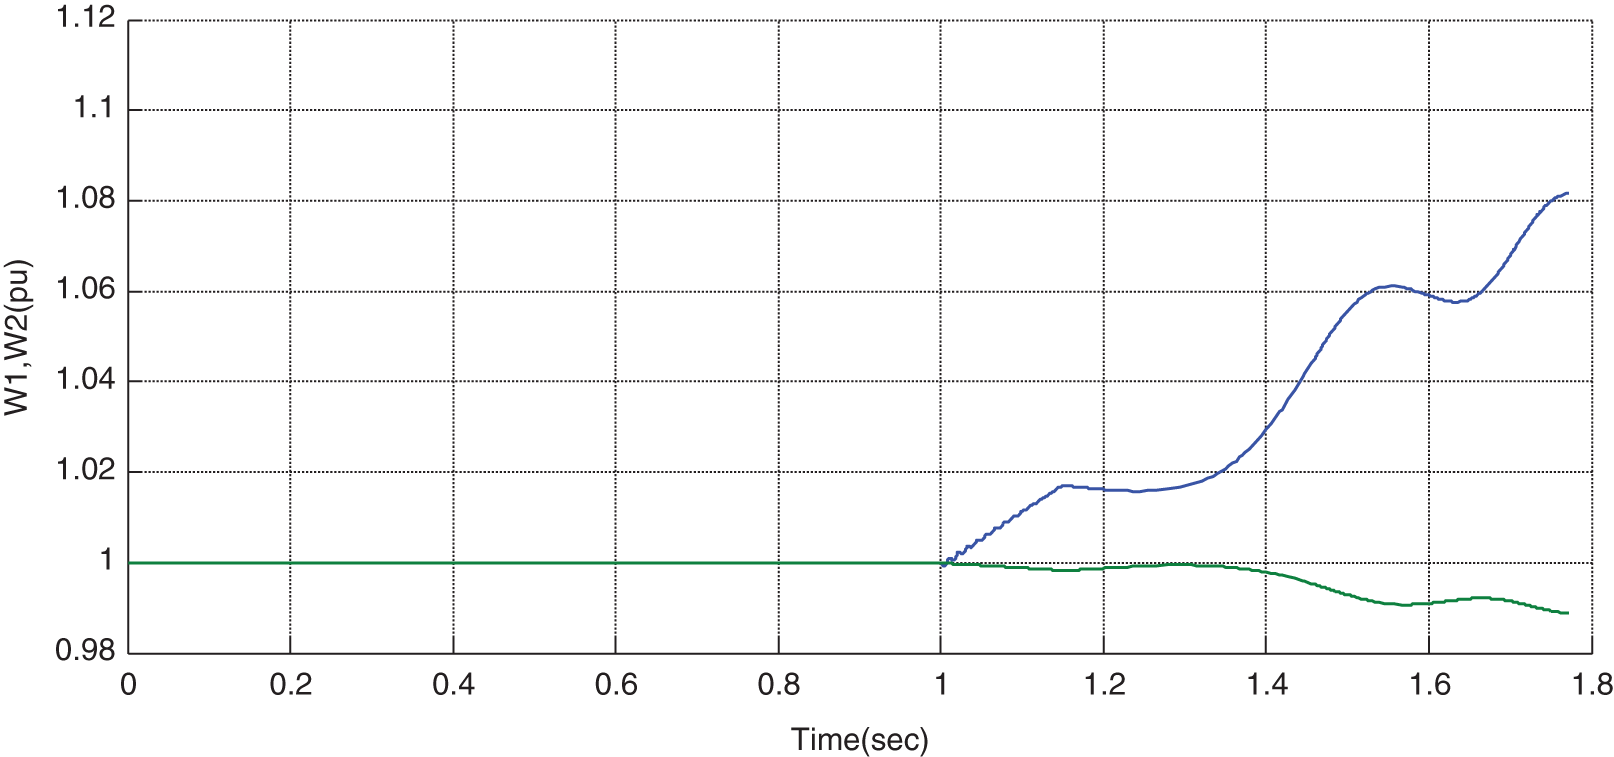
Figure 13: Variations of rotor speed (W1,W2) in the presence of STATCOM for TFC > TFCF
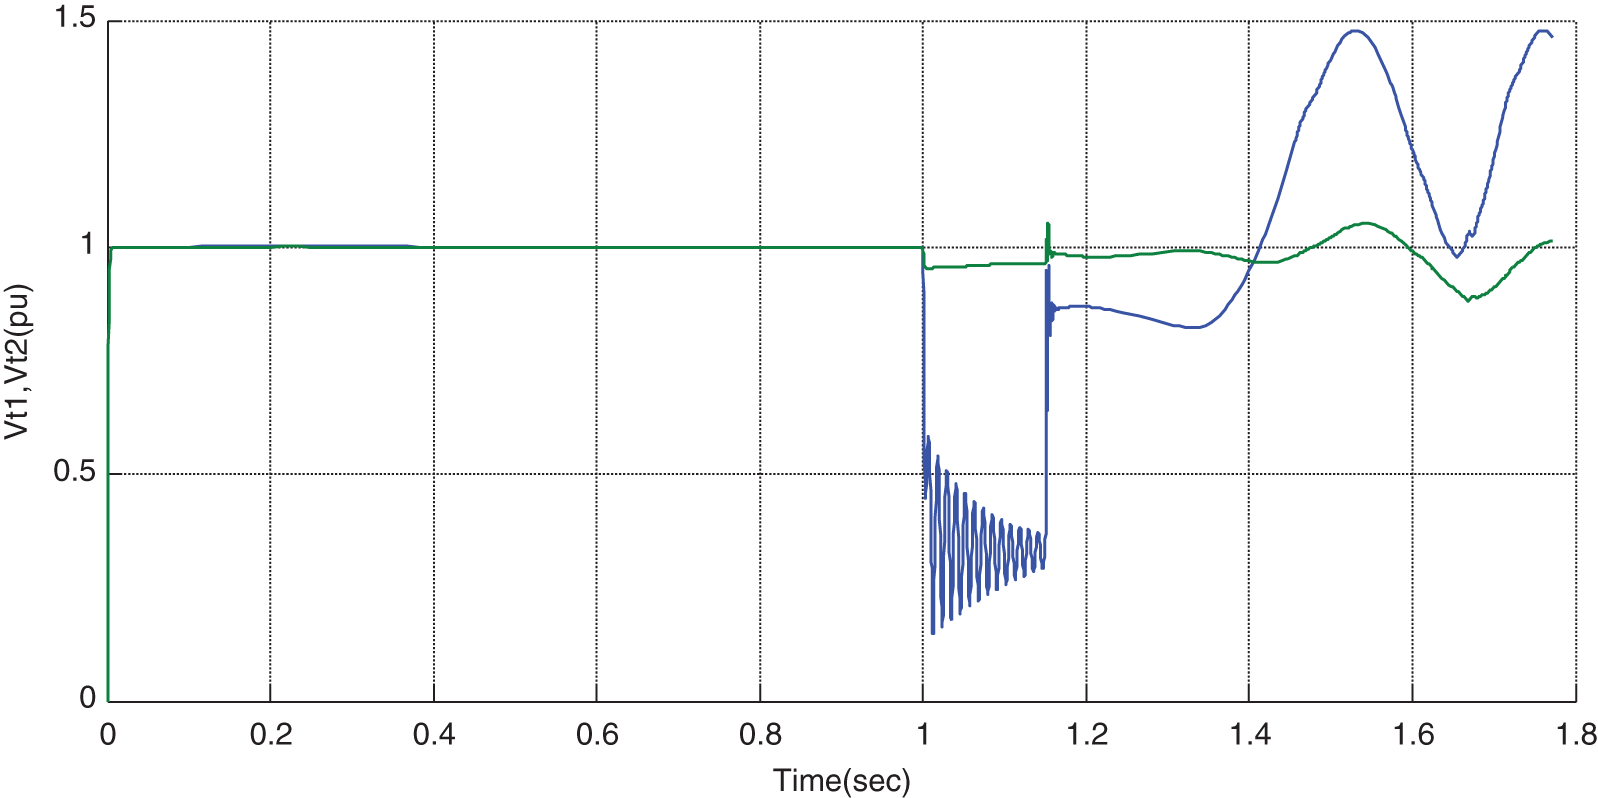
Figure 14: Variations of voltage of terminals 1 and 2 in the presence of STATCOM for TFC > TFCF
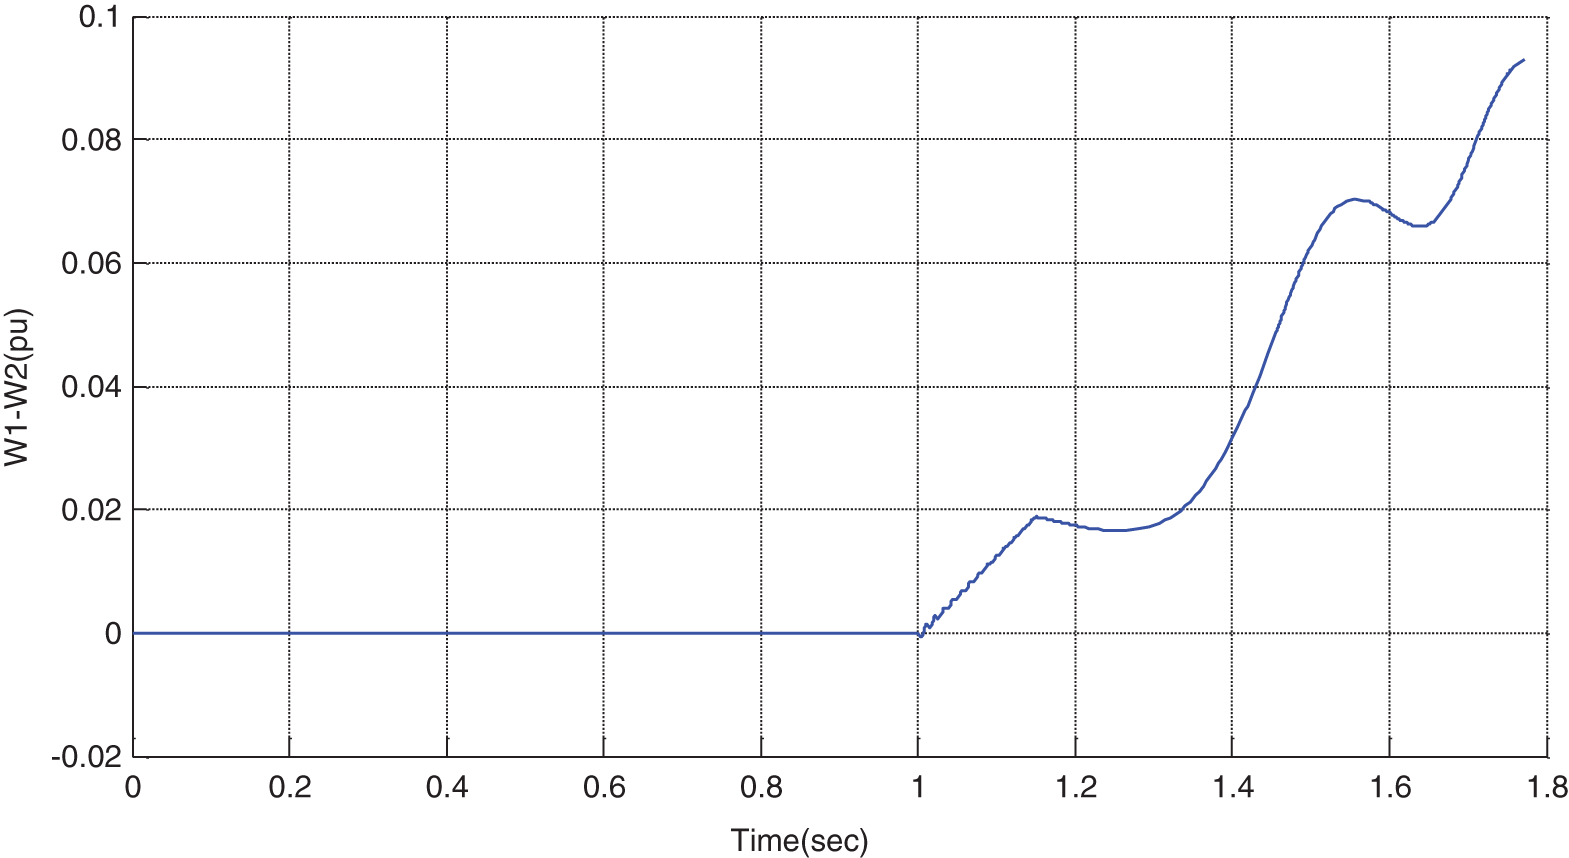
Figure 15: Variations of rotor speed difference in the presence of STATCOM for TFC > TFCF
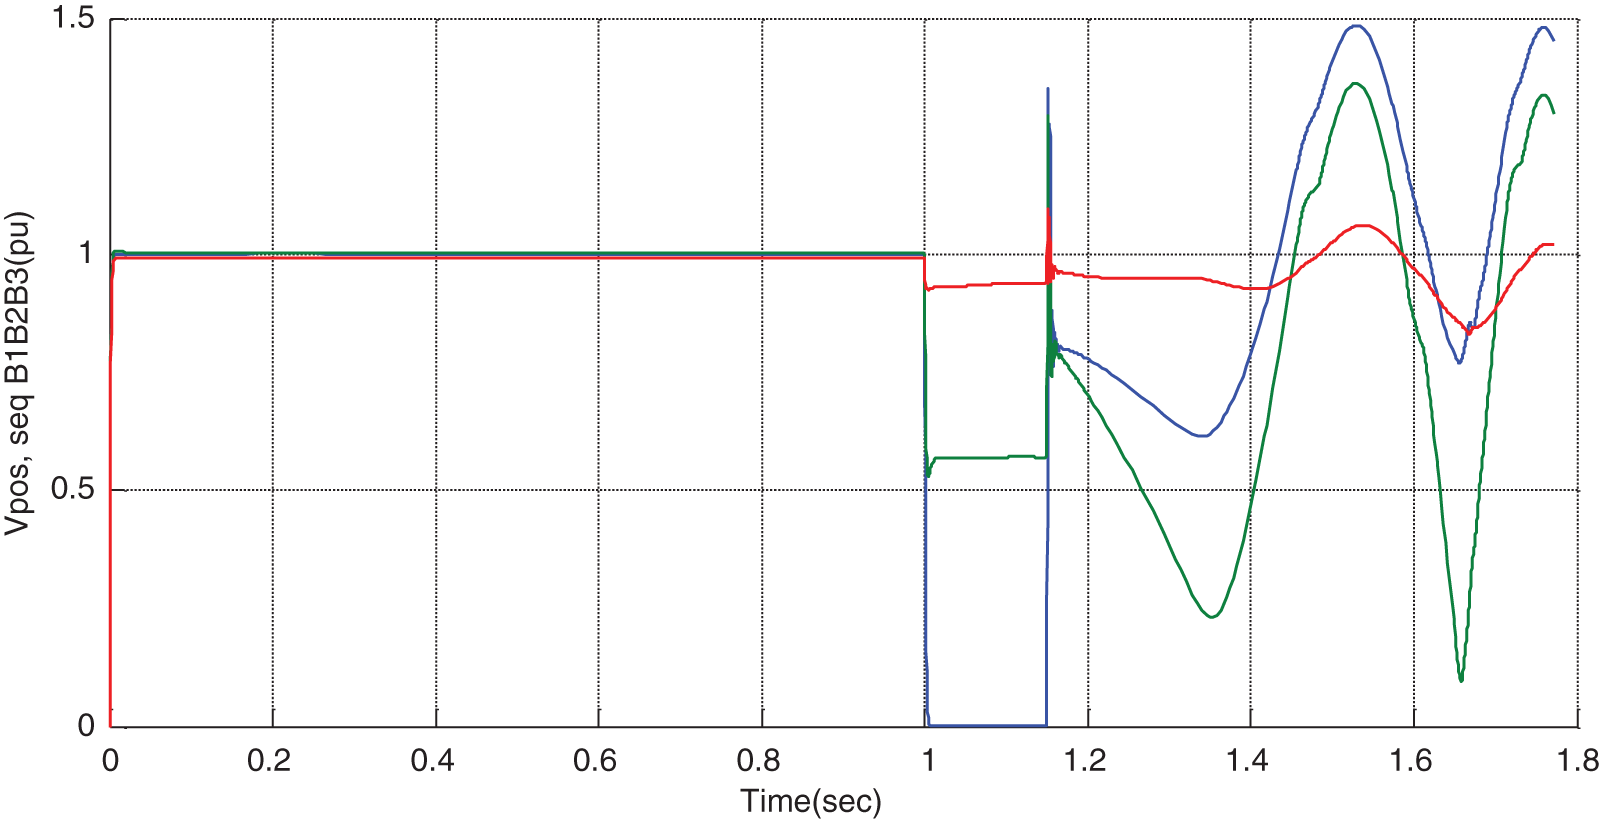
Figure 16: Variations of positive sequence voltage B1, B2, and B3 in the presence of STATCOM for TFC > TFCF
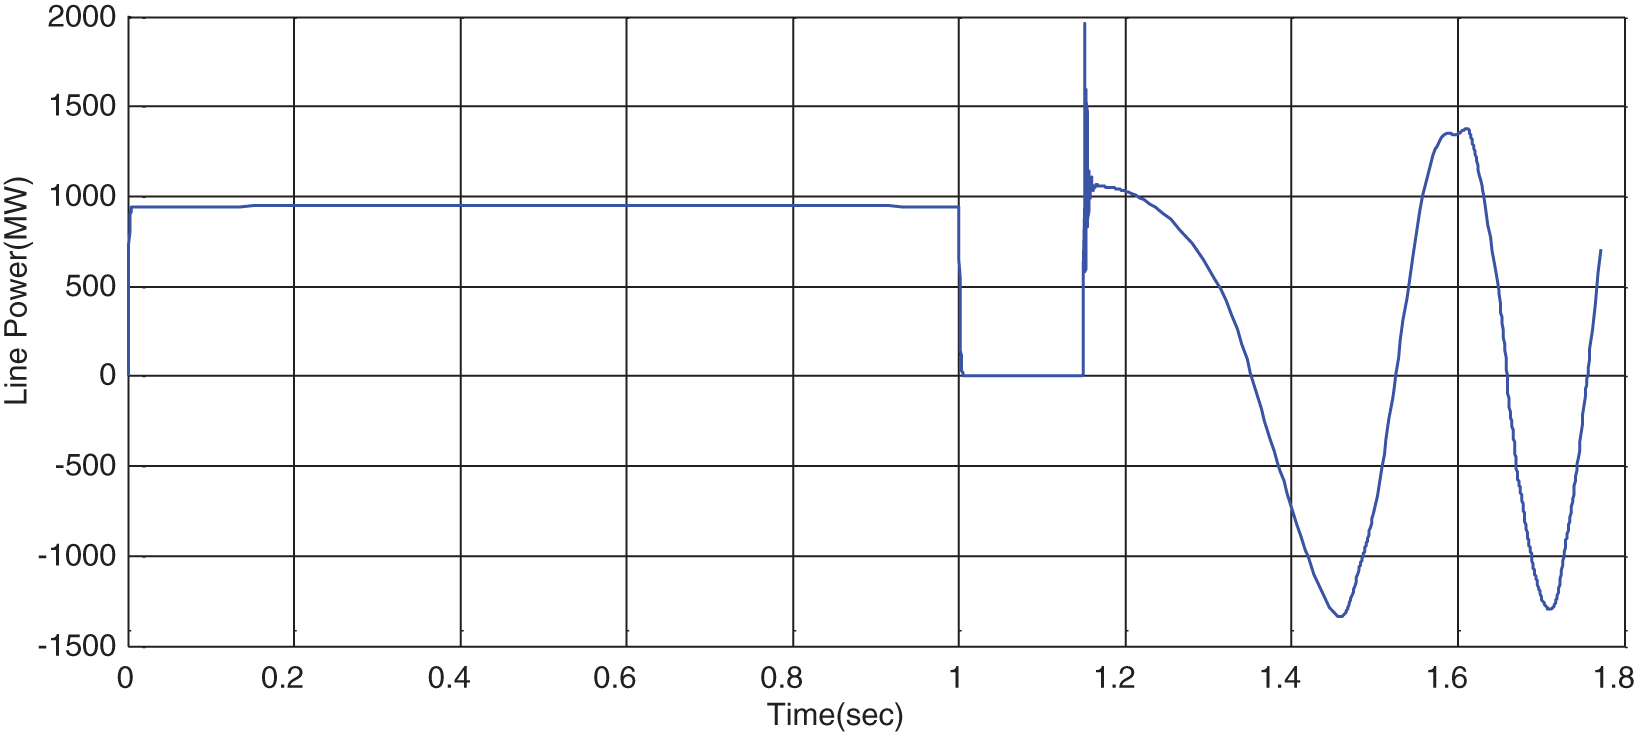
Figure 17: Variations of line power in the presence of STATCOM for TFC > TFCF
In the next step, the STATCOM is located in the middle point of the transmission line, and the cleaning time is reduced. The following values are used:
It can be observed that the waves are damped in an oscillation form, and the system will be stable (Figs. 18 to 23). According to the target function of the system transient stability, a system is stable if:
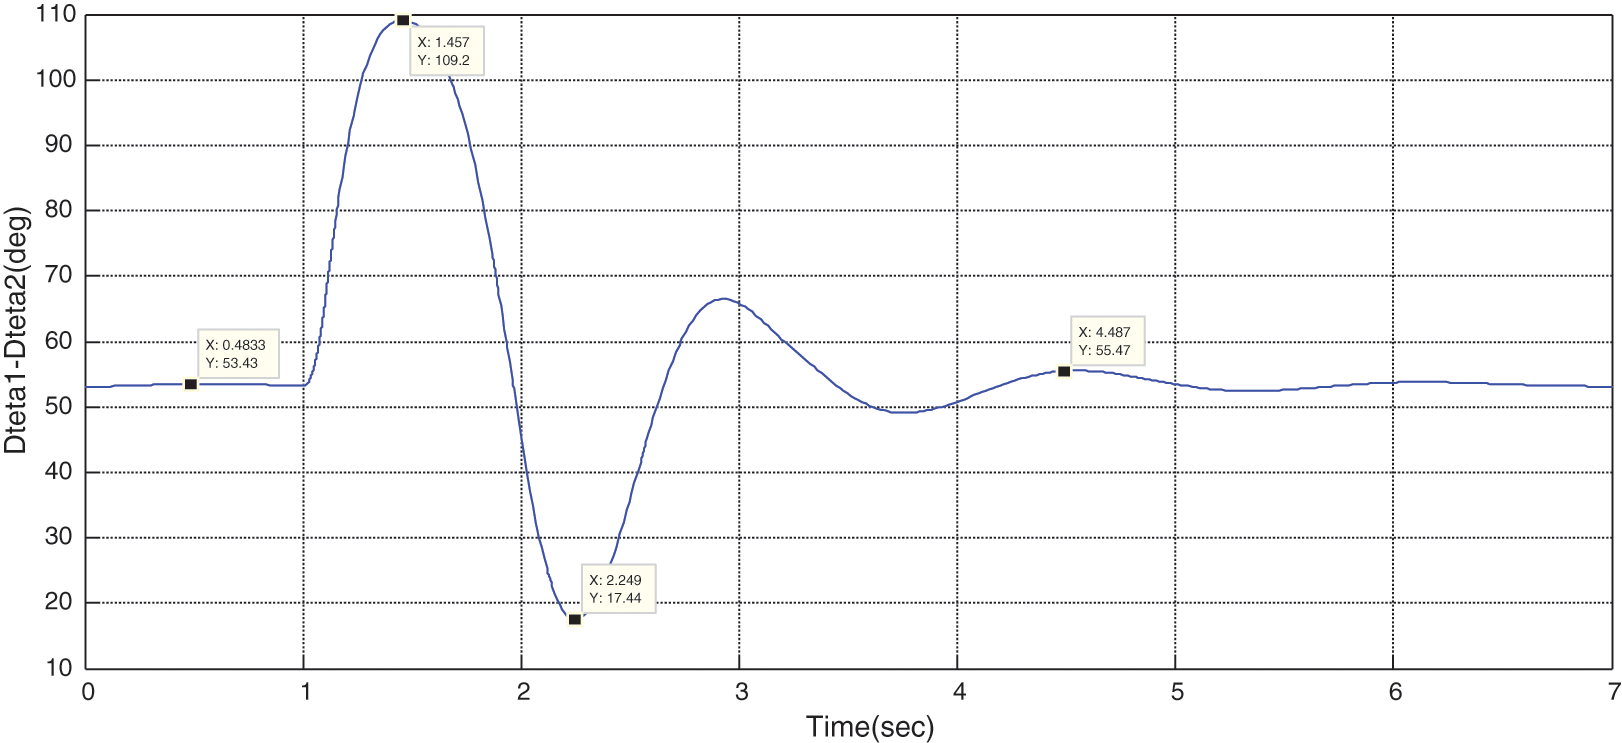
Figure 18: Variations of rotor angular difference in the presence of STATCOM without optimization
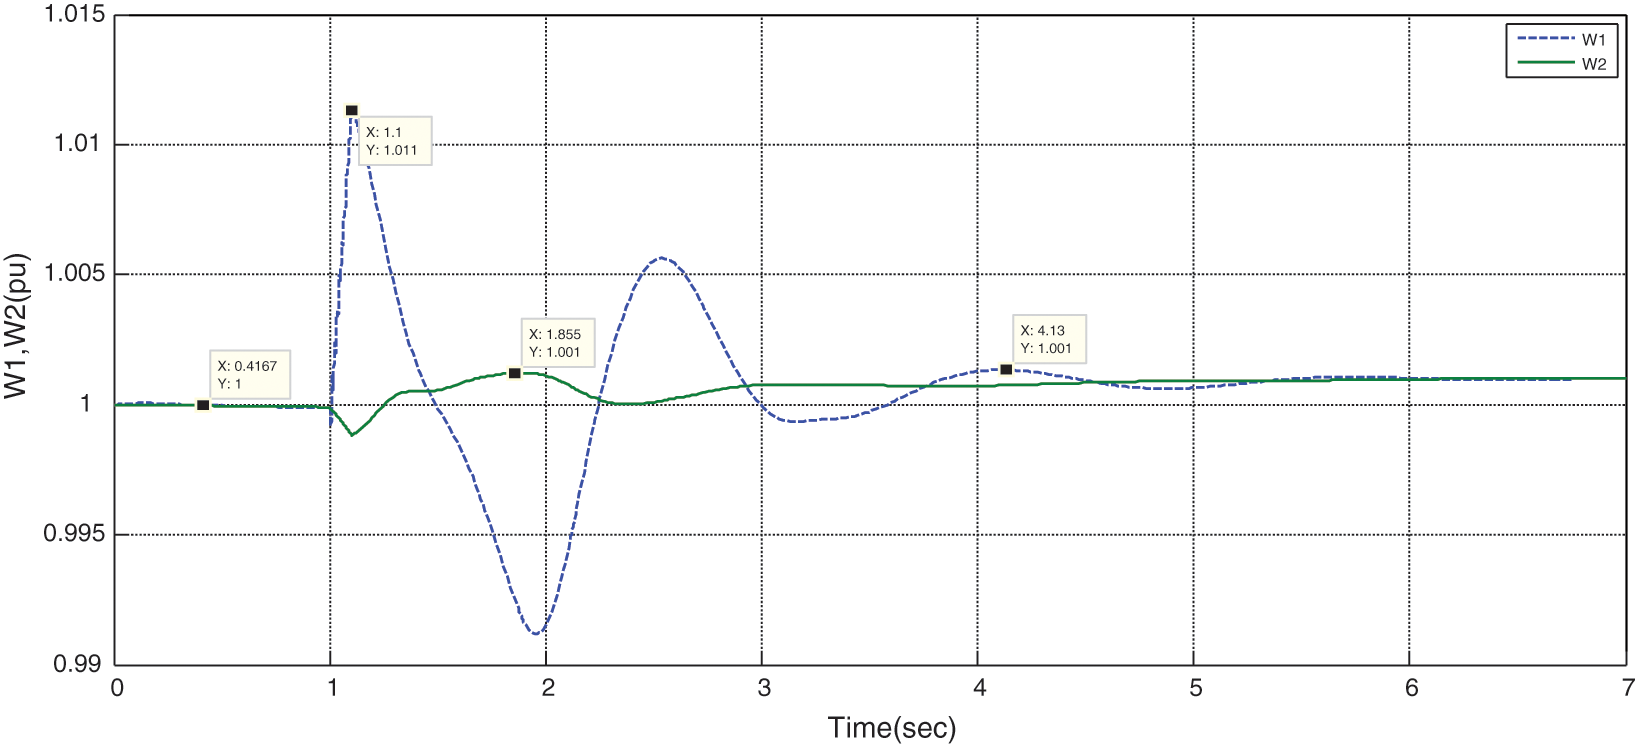
Figure 19: Variations of rotor speed (W1,W2) in the presence of STATCOM without optimization
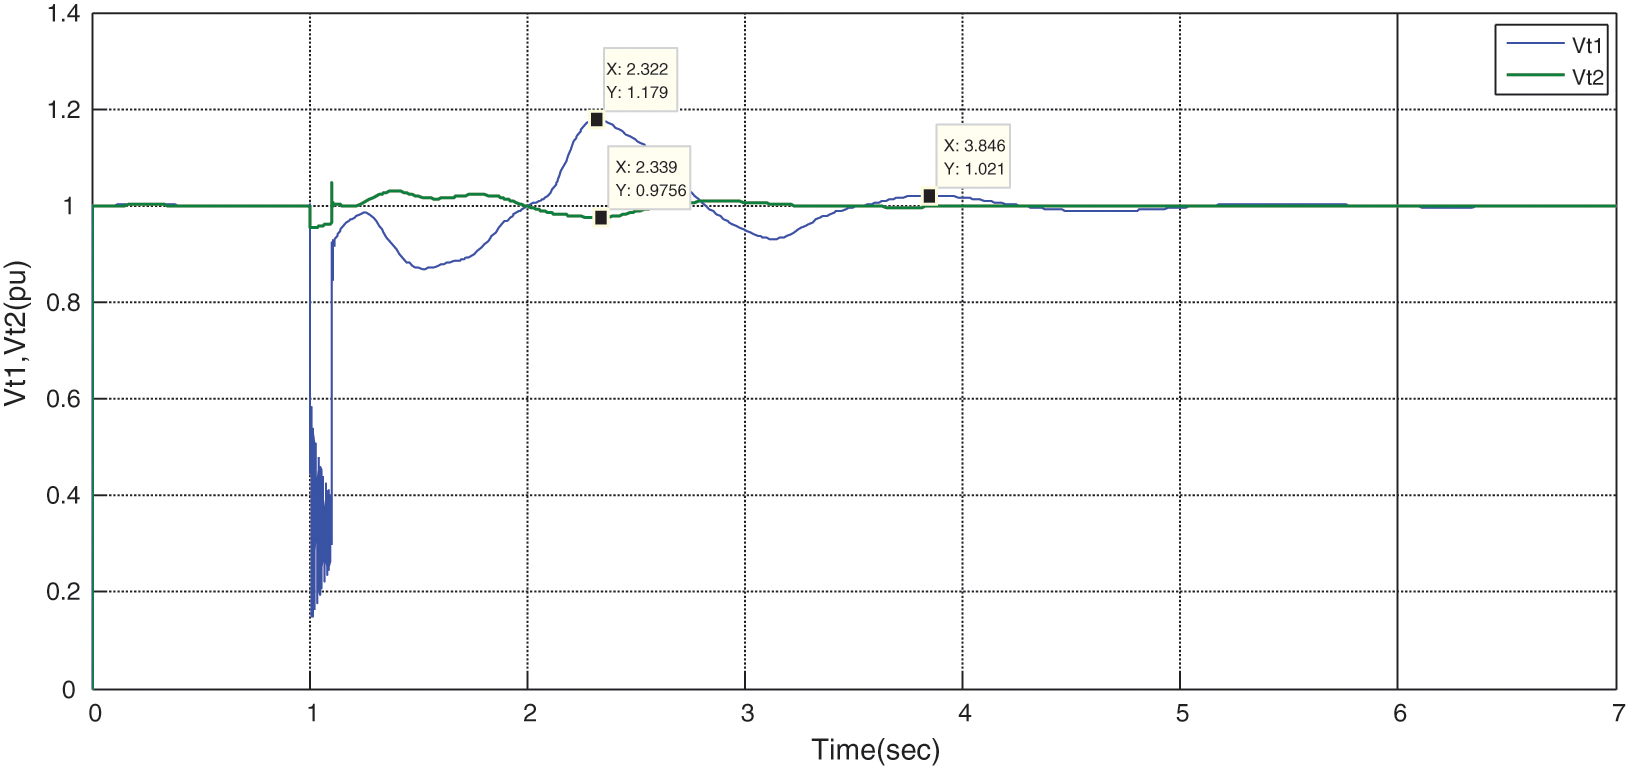
Figure 20: Variations of voltage of terminals 1 and 2 in the presence of STATCOM withoutoptimization
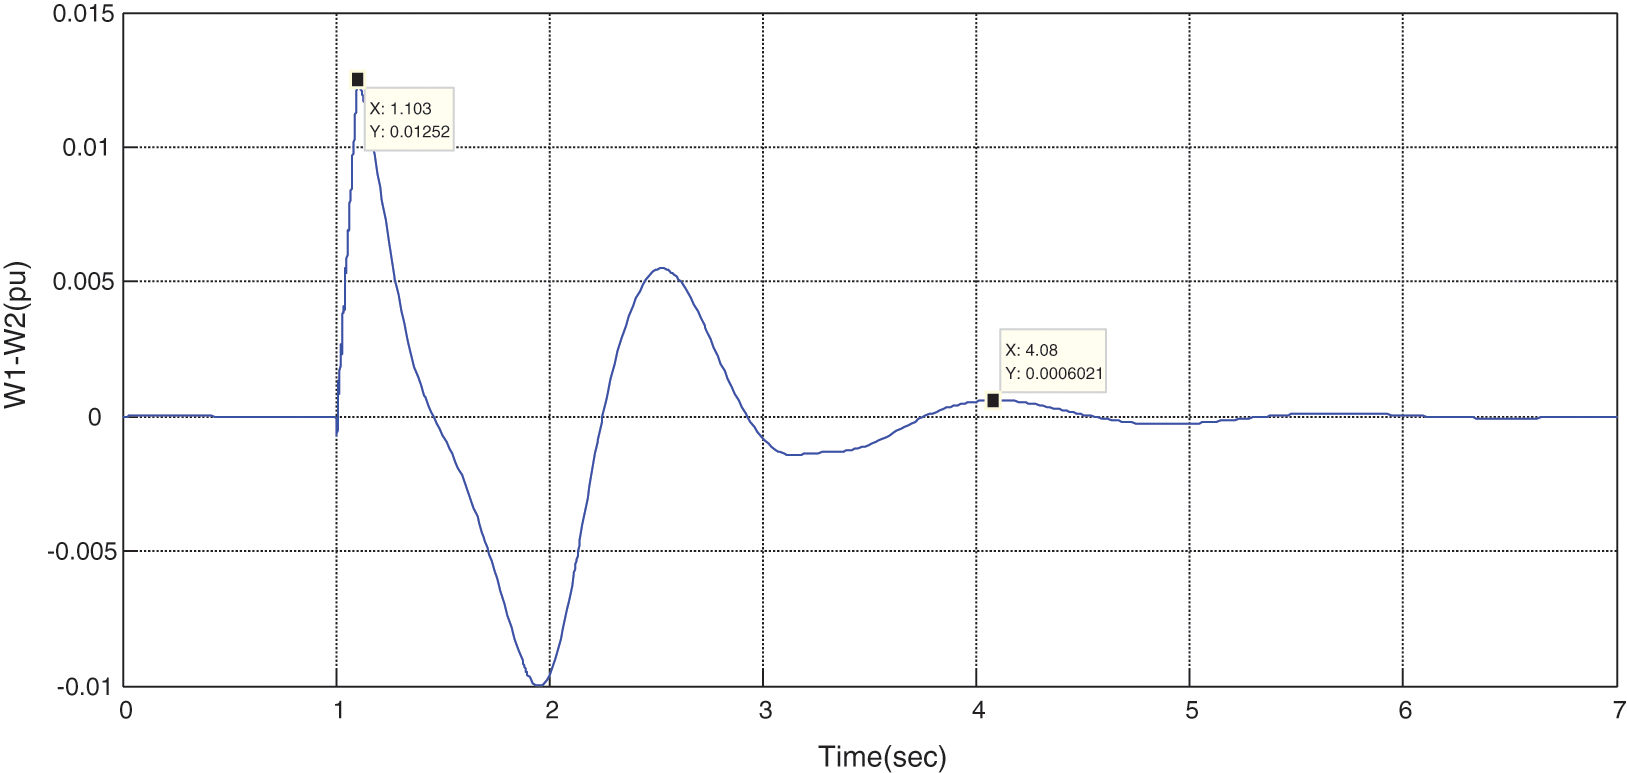
Figure 21: Variations of rotor speed difference in the presence of STATCOM without optimization
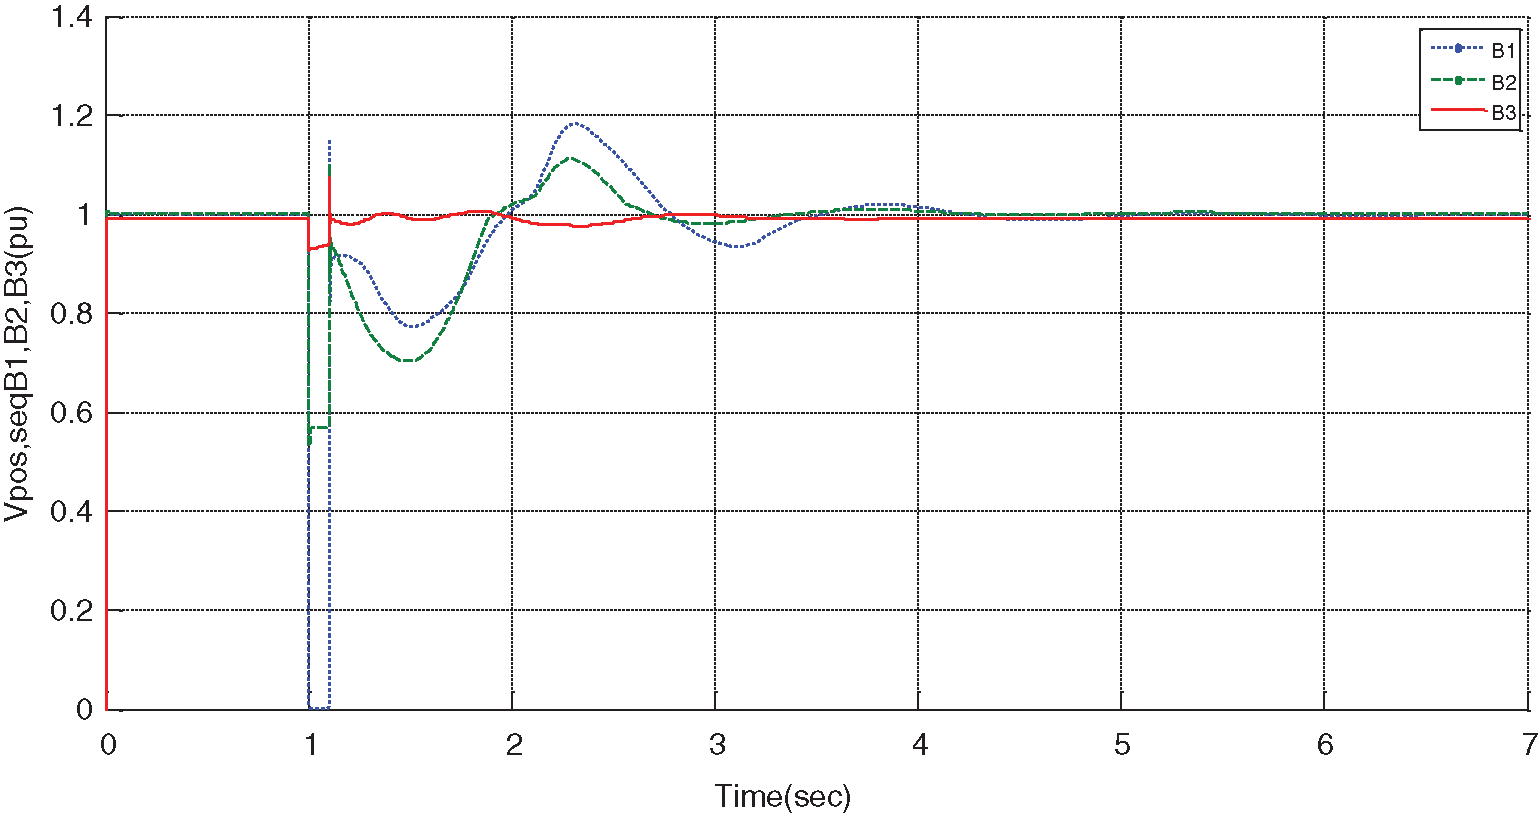
Figure 22: Variations of positive sequence voltage B1, B2, and B3 in the presence of STATCOM without optimization
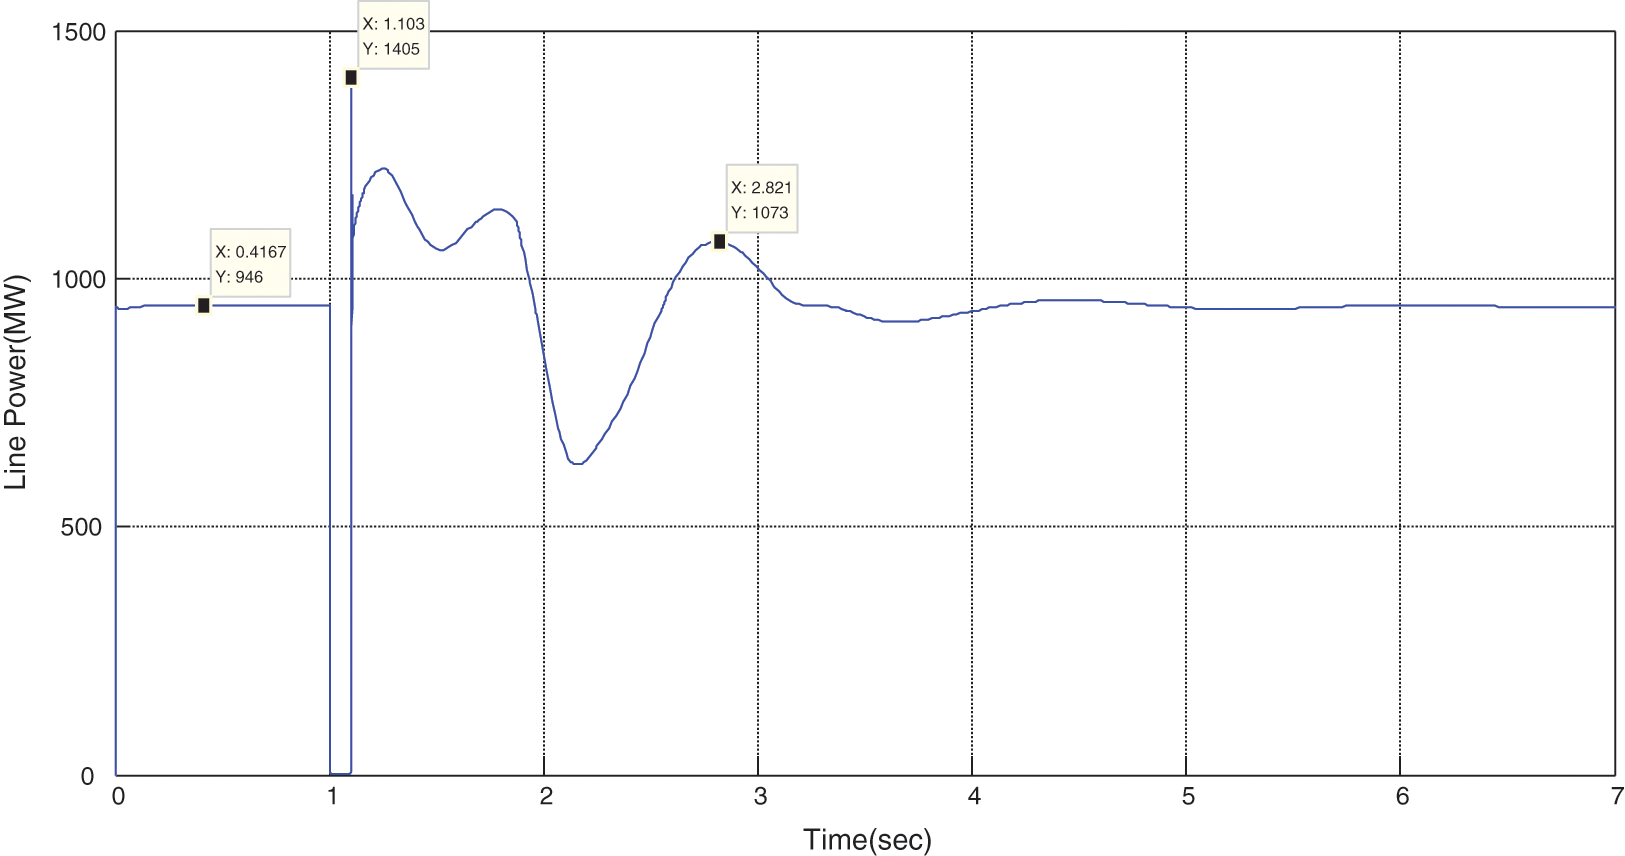
Figure 23: Variations of line power in the presence of STATCOM without optimization
It can be observed from Fig. 18 that
By observing the wave shapes and creating the error at t = 1 s, some oscillations and noises have occurred in the system, resulting in instability in the grid. However, these oscillations have been damped by the presence of STATCOM, and the grid reaches stability. As can be seen from the above figures, at the moment of error occurrence, a severe increase in generators’ speed is occurred, with or without STATCOM. Besides, the angular difference of generator rotors is increased, but this increase is not applied suddenly and as impact because of generators’ inertia; however, the buss voltage and generator terminals experience a severe step drop, and some electromagnetic transients are created. It should be noted that in mechanical systems, these transients are significantly lower due to the inertia of such systems.
In the next step, the optimal location and size of STATCOM were obtained by using ICA and the steps provided in Section 4. The procedures of the ICA toolbox have been used to optimize the target function. Some certain numbers of parameters are needed to implement the ICA technique. Table 1 shows the parameters used in the ICA algorithm.
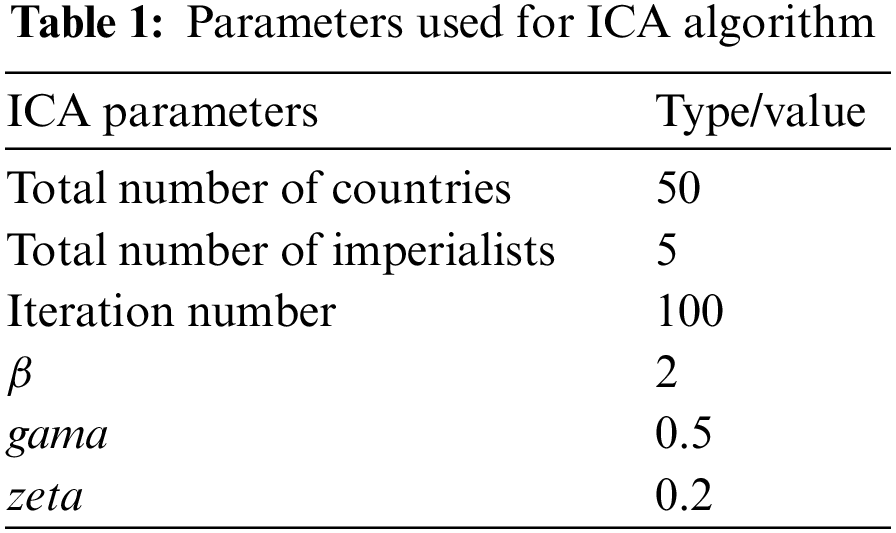
After implementing the ICA optimization procedure, the optimal size of STATCOM and longest critical error cleaning time are shown in Table 2. Figs. 24 to 29 represent the simulation results considering the parameters optimized by the ICA method.
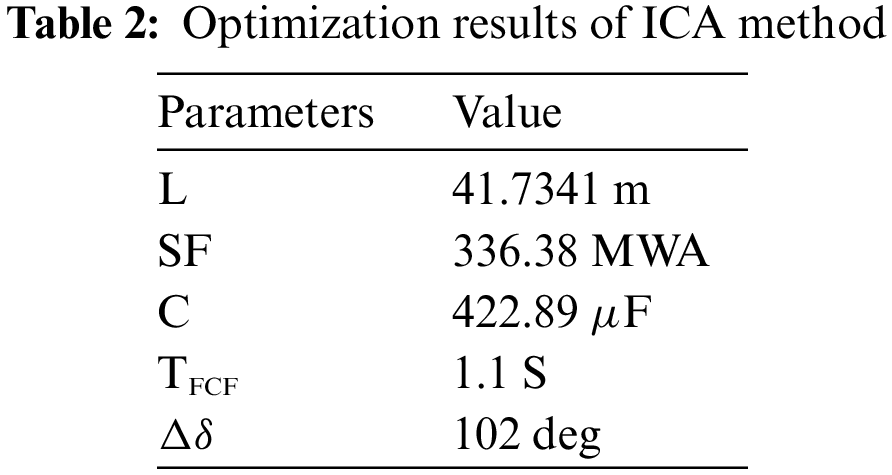
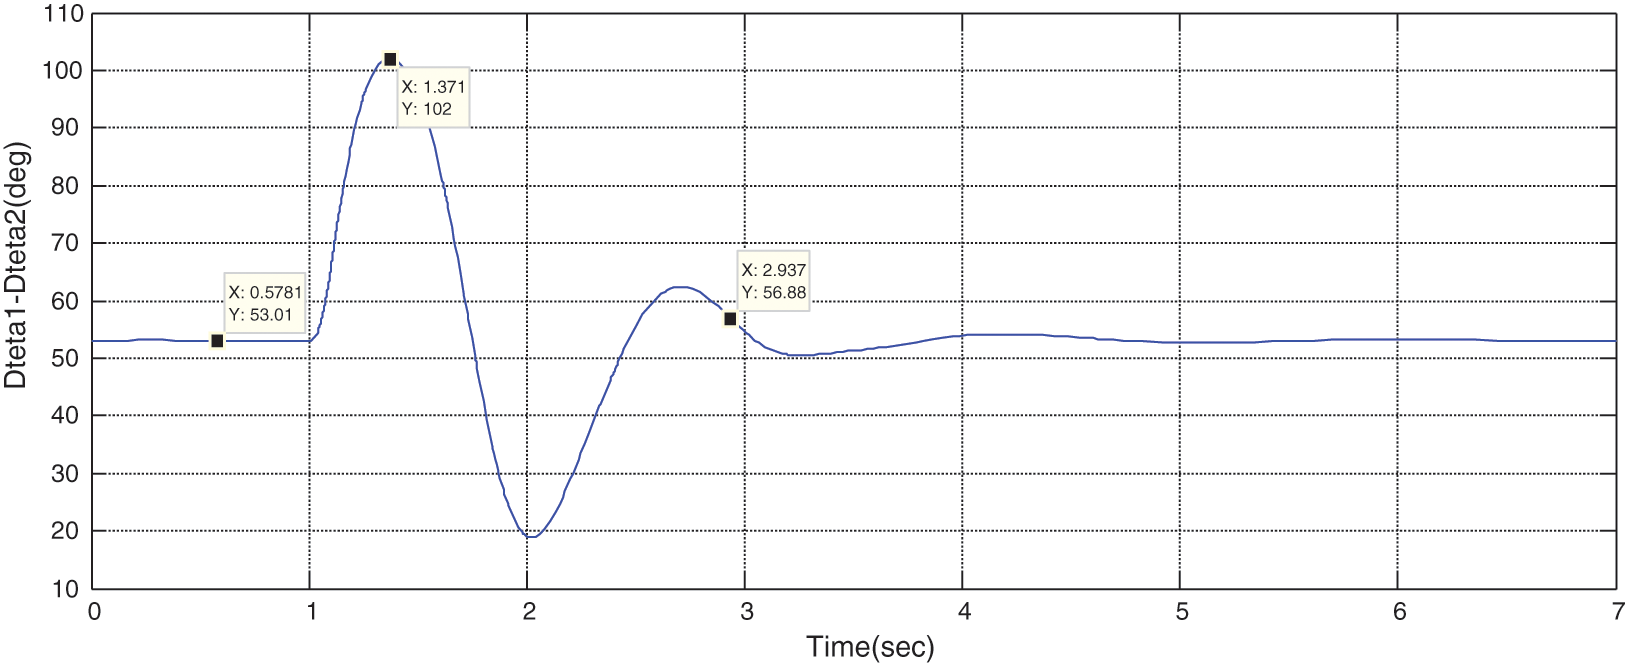
Figure 24: Variations of rotor angular difference considering for the parameters optimized by ICA
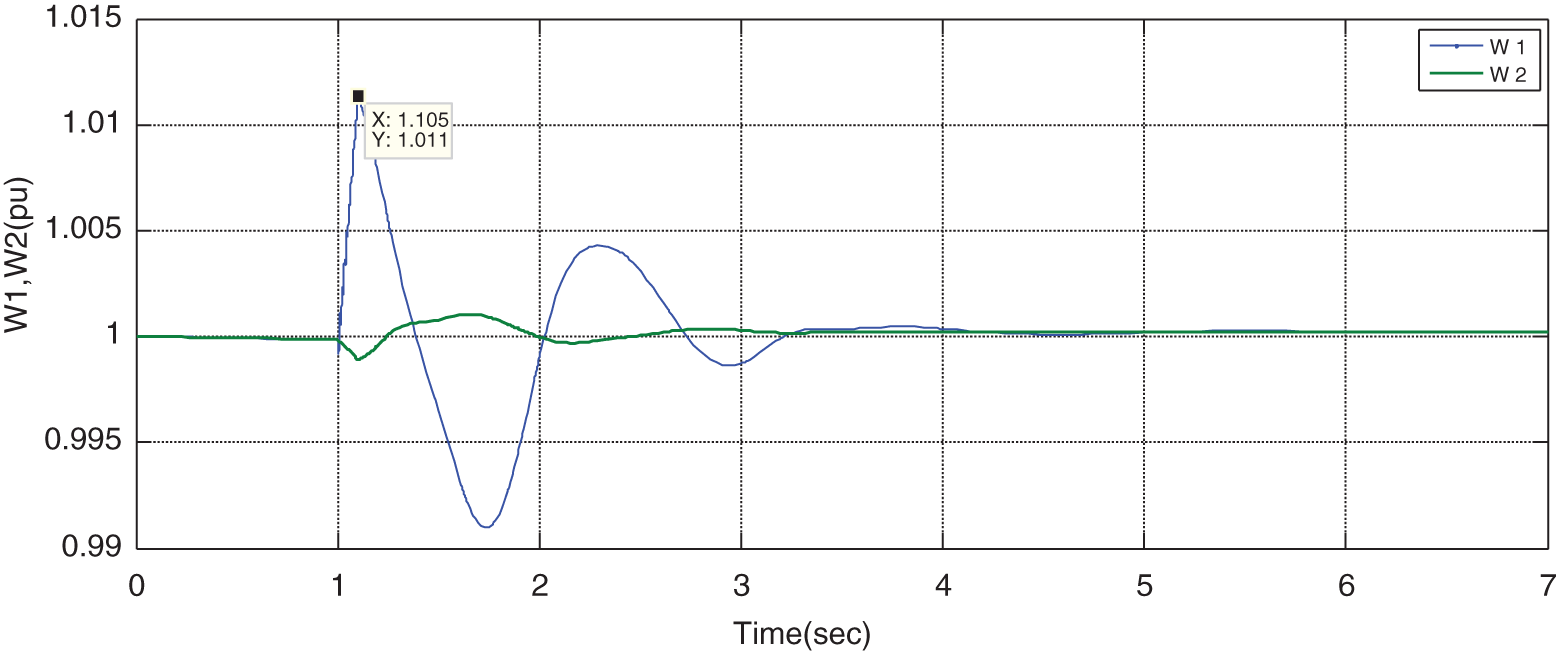
Figure 25: Variations of rotor speed (W1,W2) for the parameters optimized by ICA
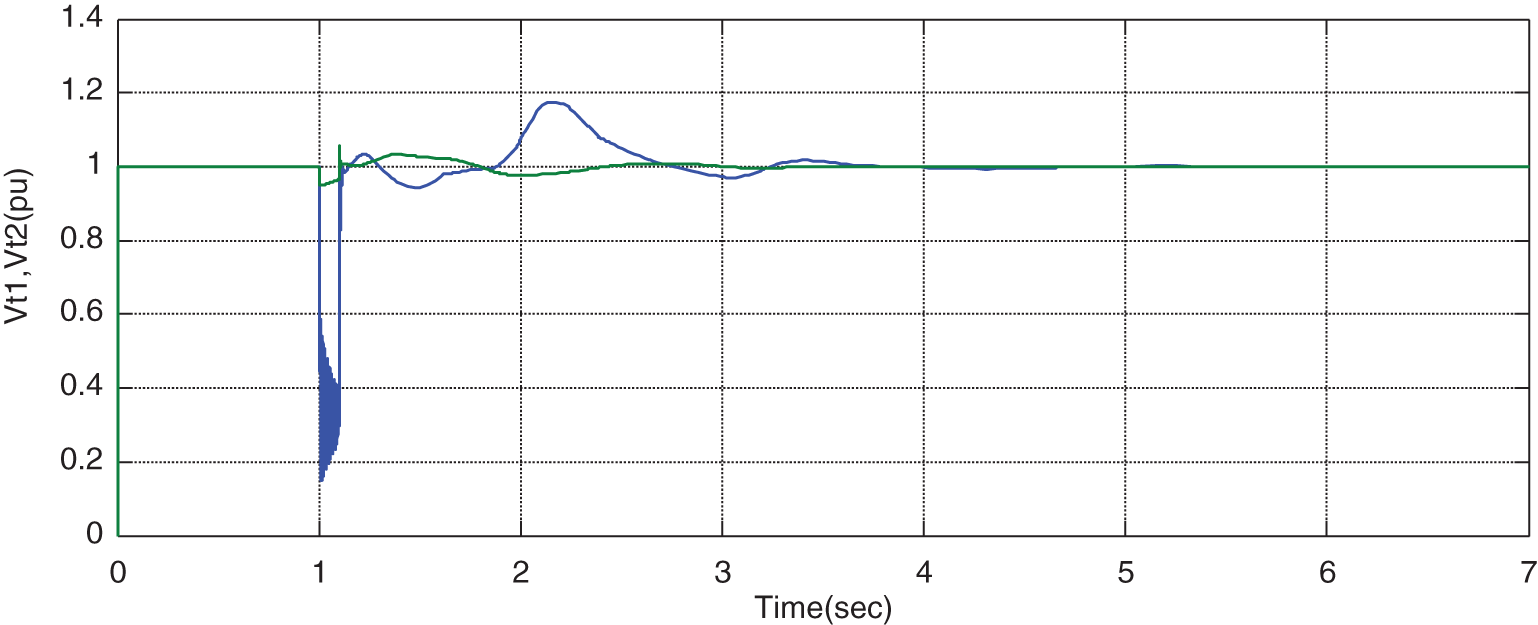
Figure 26: Variations of voltage of terminals 1 and 2 for the parameters optimized by ICA
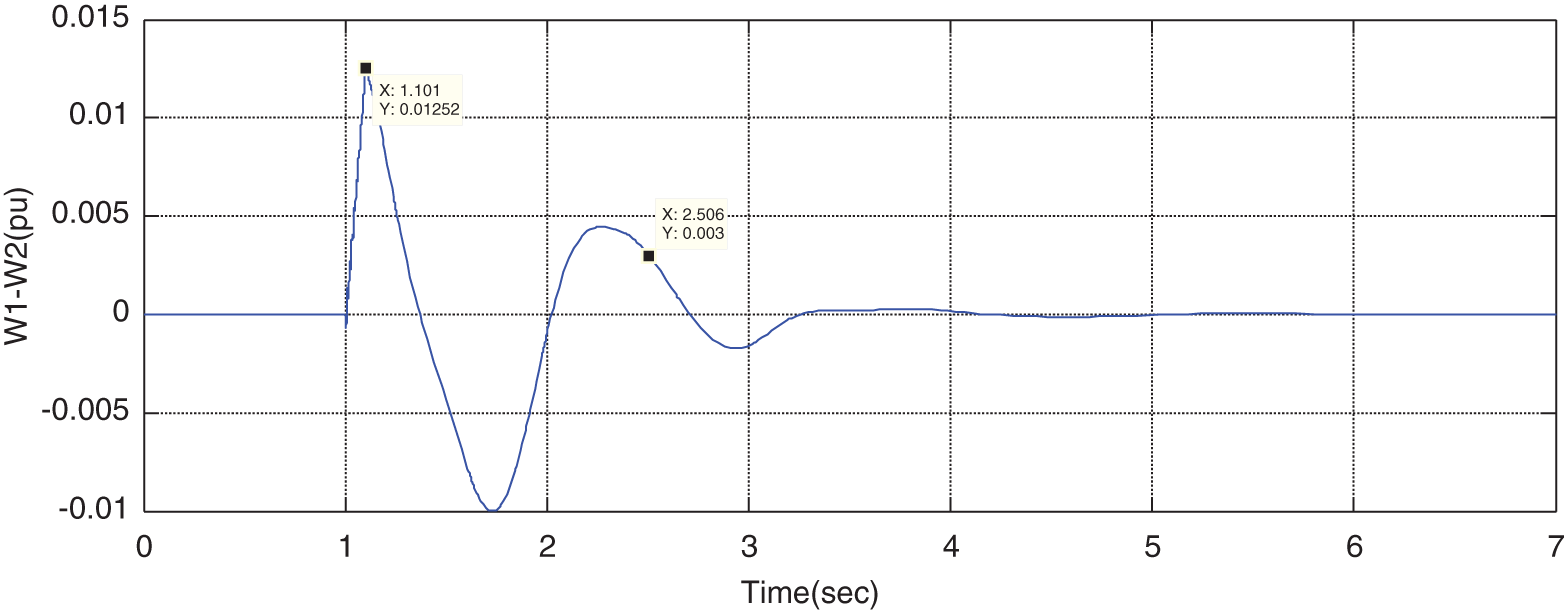
Figure 27: Variations of rotor speed difference for the parameters optimized by ICA
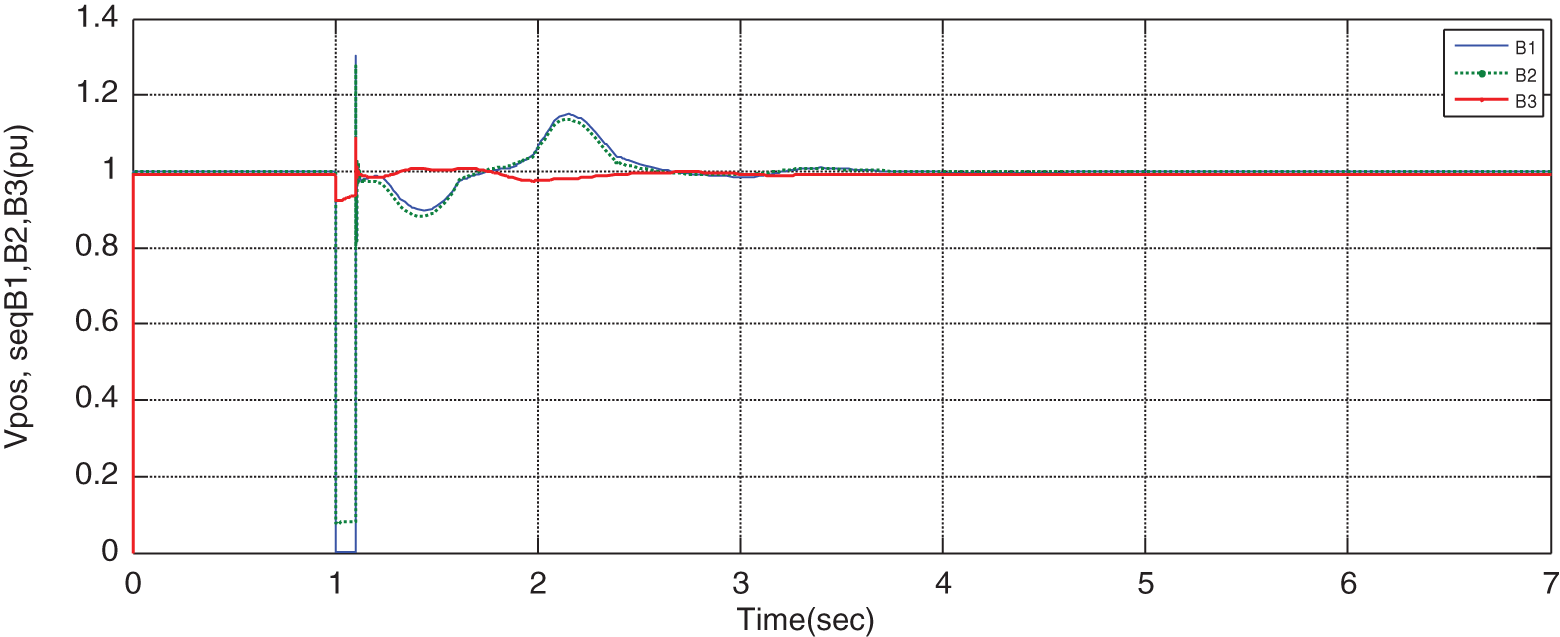
Figure 28: Variations of positive sequence voltage B1, B2, and B3 for the parameters optimized by ICA
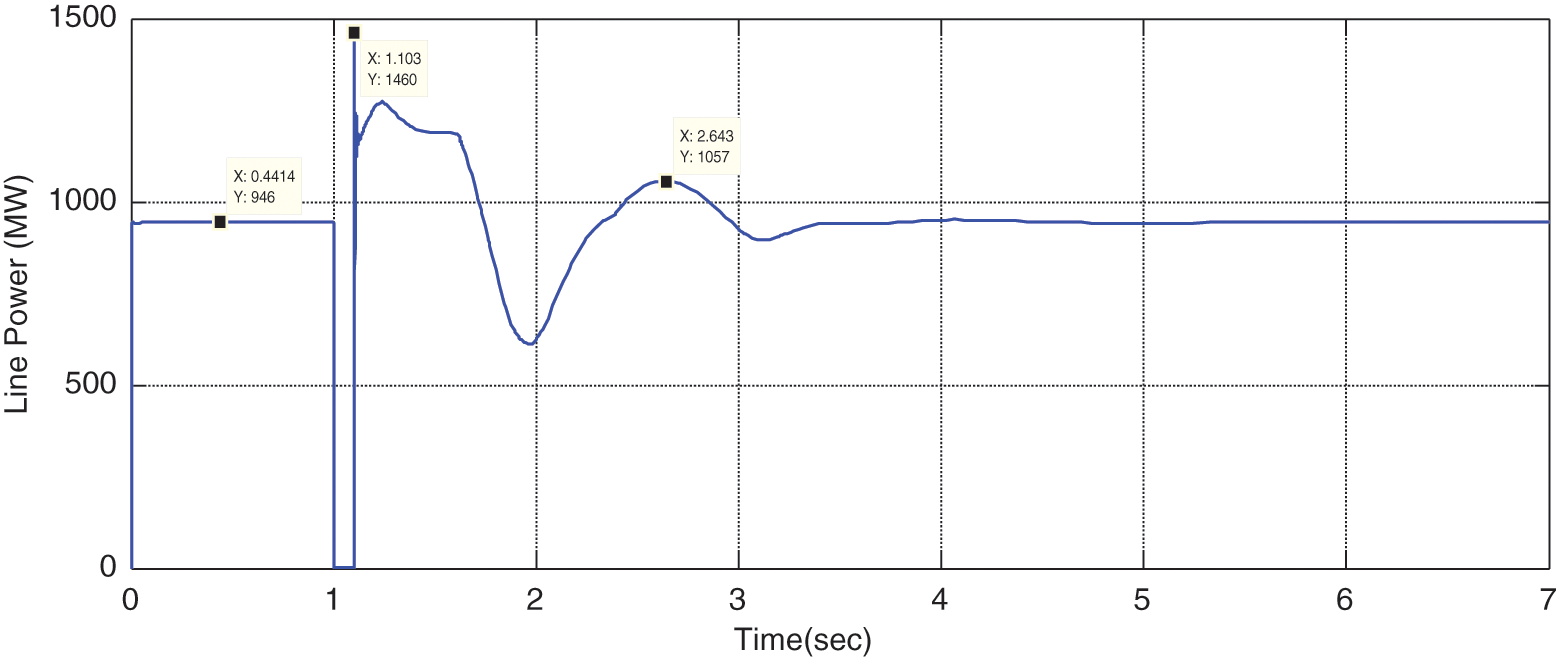
Figure 29: Variations of line power the parameters optimized by ICA
By optimizing the problem with the ICA method, the responses of the grid parameters become stable, which is obvious in the above figures. In this case, it is observed that the stability criteria are improved compare to the case without optimization. In other words. By comparing the rotor angular of the scenario in which the STATCOM is traditionally located on the line, it can be observed that the maximum rotor angular different, i.e., overshoot factor, is considerably reduced in ICA method than the traditional method. Besides, the setting time is also reduced for ICA than the traditional ones. These two factors represent the higher stability of the system in the optimization scenario than the traditional ones.
In this paper, the ICA technique has been used to determine the optimal location and size of STATCOM. Firstly, a systematic procedure has been used to determine the optimal location of STATCOM for enhancing the transient stability after a severe disturbance. Then, the ICA algorithm is used to find the optimal location and size of STATCOM in a two-area system. The nonlinear simulation results show that the STATCOM at the optimal location results in an increased error cleaning time, and as a result, an enhanced system’s transient stability.
Funding Statement: This work was supported in part by an International Research Partnership “Electrical Engineering—Thai French Research Center (EE-TFRC)” under the project framework of the Lorraine Université d’Excellence (LUE) in cooperation between Université de Lorraine and King Mongkut’s University of Technology North Bangkok and in part by the National Research Council of Thailand (NRCT) under Senior Research Scholar Program under Grant No. N42A640328.
Conflicts of Interest: The authors declare that they have no conflicts of interest to report regarding the present study.
References
1. N. Acharya, A. S. Yome and N. Mithulananthan, “Facts about flexible AC transmission systems (FACTS) controllers: Practical installations and benefits,” in Australasian Universities Power Engineering Conf. (AUPEC), Hobart, Australia, pp. 533–538, 2005. [Google Scholar]
2. T. Tjing Lie and W. Deng, “Optimal flexible AC transmission systems (FACTS) devices allocation,” International Journal of Electrical Power & Energy Systems, vol. 19, no. 2, pp. 125–134, 1997. [Google Scholar]
3. N. P. Padhy and S. Pand, “Optimal location and controller design of STATCOM for power system stability improvement using PSO,” Journal of the Franklin Institute, vol. 345, no. 2, pp. 166–181, 2008. [Google Scholar]
4. K. Ravi and M. Rajaram, “Optimal location of FACTS devices using enhanced particle swarm optimization,” in IEEE Int. Conf. on Advanced Communication Control and Computing Technologies (ICACCCT), Ramanathapuram, India, pp. 414–419, 2012. [Google Scholar]
5. L. Srivastava, M. Pandit and S. Varshney, “Optimal location and sizing of STATCOM for voltage security enhancement using PSO-TVAC,” in Int. Conf. on Power and Energy Systems, Chennai, India, pp. 1–6, 2011. [Google Scholar]
6. A. Johar, F. Larki and H. M. Kelk, “Optimal location of STATCOM and SVC based on contingency voltage stability by using continuation power flow: Case studies of khouzestan power networks in Iran,” in Second Int. Conf. on Computer and Electrical Engineering, Dubai, United Arab Emirates, vol. 1, pp. 179–183, 2009. [Google Scholar]
7. B. Sun, F. Liu, Q. Ma, W. Yang and W. Li, “Quantitative assessment and optimization on location and capacity of SVC for improving transient voltage security,” in IEEE Int. Conf. on Power System Technology (POWERCON), Auckland, New Zealand, pp. 1–4, 2012. [Google Scholar]
8. M. T. Ameli and S. Hashemi, “Optimal location of UPFC for enhancing voltage security and relieving congestion using particle swarm optimization,” in Second Pacific-Asia Conf. on Circuits, Communications and System, Beijing, vol. 1, pp. 429–433, 2010. [Google Scholar]
9. L. J. Cai and I. Erlich, “Simultaneous coordinated tuning of PSS and FACTS damping controller in a large power system,” IEEE Transactions on Power Systems, vol. 20, no. 1, pp. 294–300, 2005. [Google Scholar]
10. A. J. Germond, R. Cherkaoui and S. Gerbex, “Optimal location of FACTS devices to enhance power system security,” in IEEE Bologna Power Tech Conf. Proc., Bologna, Italy, vol. 3, pp. 1–7, 2003. [Google Scholar]
11. B. Kim, J. Shin, J. Park and K. Y. Lee, “A new optimal routing algorithm for loss minimization and voltage stability improvement in radial power systems,” IEEE Transactions on Power Systems, vol. 22, no. 2, pp. 648–657, 2007. [Google Scholar]
12. H. Nezamabadi-pour, K. Y. Lee, M. M. Farsangi and Y. H. Song, “Placement of SVCs and selection of stabilizing signals in power systems,” IEEE Transactions on Power Systems, vol. 22, no. 3, pp. 1061–1071, 2007. [Google Scholar]
13. Ch. Rinzin, F. Alvarado, Y. Mansour and W. Xu, “SVC placement using critical modes of voltage instability,” in Conf. Proc. Power Industry Computer Application Conf., Scottsdale, AZ, USA, pp. 131–137, 1993. [Google Scholar]
14. A. H. Gandomi, B. F. Azar, R. Sheikholeslami and S. Talatahari, “Imperialist competitive algorithm combined with chaos for global optimization,” Communications in Nonlinear Science and Numerical Simulation, vol. 13, no. 3, pp. 1312–1319, 2011. [Google Scholar]
15. A. Kaveh and S. Talatahari, “Imperialist competitive algorithm for engineering design problems,” Asian Journal of Civil Engineering (Building and Housing), vol. 11, no. 6, pp. 675–697, 2010. [Google Scholar]
16. N. G. Hingorani and L. Gyugyi, “Understanding FACTS: Concepts and technology of flexible AC transmission systems,” in Wiley-IEEE Press, 1st ed., vol. 1. New York, USA: Institute of Electrical and Electronics Engineers, pp. 1–35, 2000. [Google Scholar]
17. G. Agnihotri, L. Srivastava and Sh Dixit, “Optimal location and sizing of SVC for minimization of power loss and voltage deviation using NSGA II,” in Fourth Int. Conf. on Communication Systems and Network Technologies, Bhopal, India, pp. 975–980, 2014. [Google Scholar]
18. C. H. Huang, K. H. Lu, T. Ch Ou, W. M. Lin and Y. H. Li, “Optimal location and capacity of STATCOM for voltage stability enhancement using ACO plus GA,” in IEEE/ASME Int. Conf. on Advanced Intelligent Mechatronics, Singapore, pp. 1915–1920, 2009. [Google Scholar]
19. M. Saravanan, S. M. R. Slochanal, P. Venkatesh and J. P. S. Abraham, “Application of particle swarm optimization technique for optimal location of FACTS devices considering cost of installation and system loadability,” Electric Power Systems Research, vol. 77, no. 3–4, pp. 276–283, 2007. [Google Scholar]
20. Y. H. Song and A. T. Johns, “Flexible AC transmission systems (FACTS),” in IET, 1st ed., London, United Kingdom: The Institution of Electrical Engineers, pp. 1–72, 1999. [Google Scholar]
21. A. Agha, H. Attar, A. Alfaoury and M. R. Khosravi, “Maximizing electrical power saving using capacitors optimal placement,” Recent Advances in Electrical & Electronic Engineering (Formerly Recent Patents on Electrical and Electronic Engineering), vol. 13, no. 7, pp. 1041–1050, 2020. [Google Scholar]
22. M. T. Lazim and M. Zeidan, “A power frequency changer using biphase integral cycle control technique,” Journal of Electrical Engineering, vol. 13, no. 3, pp. pp 161–169, 2013. [Google Scholar]
23. G. Samara, R. Quaddoura, M. I. Al-Shalout, K. Al-Qawasmi and G. A. Besani, “Internet of things protection and encryption: A survey,” in 22nd Int. Arab Conf. on Information Technology (ACIT), Muscat, Oman, pp. 1–7, 2021. [Google Scholar]
24. M. Al-Hamad, A. Al-Hamad and K. Al-Qawasmi, “Factors affecting the adoption of google translation in higher education through an extended technology acceptance model (TAMJordan as a case study,” Innovative Computing, Information and Control, ICIC Express Letters, vol. 15, no. 11, pp. 1177–1186, 2021. [Google Scholar]
25. A. Agha, H. Attar and A. Kr Luhach, “Optimized economic loading of distribution transformers using minimum energy loss computing,” Mathematical Problems in Engineering, vol. 2021, no. 2, pp. 1–9, 2021. [Google Scholar]
26. A. T. Abu-Jassar, H. Attar, V. Yevsieiev, A. Amer, N. Demska et al., “Electronic user authentication key for access to HMI/SCADA via unsecured internet networks,” Computational Intelligence and Neuroscience, vol. 2022, no. 7, pp. 1–13, 2022. [Google Scholar]
27. E. -S. M. El-Kenawy, S. Mirjalili, S. S. M. Ghoneim, M. M. Eid, M. El-Said et al., “Advanced ensemble model for solar radiation forecasting using sine cosine algorithm and newton’s laws,” IEEE Access, vol. 9, pp. 115750–115765, 2021. [Google Scholar]
28. A. Salamai, E. -S. M. El-kenawy and A. Ibrahim, “Dynamic voting classifier for risk identification in supply Chain 4.0,” Computers, Materials & Continua, vol. 69, no. 3, pp. 3749–3766, 2021. [Google Scholar]
29. A. Ibrahim, S. Mirjalili, M. El-Said, S. S. M. Ghoneim, M. Al-Harthi et al., “Wind speed ensemble forecasting based on deep learning using adaptive dynamic optimization algorithm,” IEEE Access, vol. 9, pp. 125787–125804, 2021. [Google Scholar]
30. E. -S. M. El-kenawy, H. F. Abutarboush, A. W. Mohamed and A. Ibrahim, “Advance artificial intelligence technique for designing double T-shaped monopole antenna,” Computers, Materials & Continua, vol. 69, no. 3, pp. 2983–2995, 2021. [Google Scholar]
31. E. -S. M. El-kenawy, A. Ibrahim, N. Bailek, B. Kada, M. Hassan et al., “Sunshine duration measurements and predictions in Saharan Algeria region: An improved ensemble learning approach,” Theoretical and Applied Climatology, vol. 147, no. 3–4, pp. 1015–1031, 2022. [Google Scholar]
32. E. -S. M. El-Kenawy, S. Mirjalili, F. Alassery, Y. Zhang, M. Eid et al., “Novel meta-heuristic algorithm for feature selection, unconstrained functions and engineering problems,” IEEE Access, vol. 10, pp. 40536–40555, 2022. [Google Scholar]
Cite This Article
 Copyright © 2023 The Author(s). Published by Tech Science Press.
This work is licensed under a Creative Commons Attribution 4.0 International License , which permits unrestricted use, distribution, and reproduction in any medium, provided the original work is properly cited.
 Downloads
 Citation Tools