
 Submit a Paper
 Propose a Special lssue
 Open Access
ARTICLE

Cancer Regions in Mammogram Images Using ANFIS Classifier Based Probability Histogram Segmentation Algorithm
Department of Data Science and Business Systems, School of Computing, SRM Institute of Science and Technology, Kattankulathur Campus, Chennai, 603203, India
* Corresponding Author: V. Swetha. Email:
Intelligent Automation & Soft Computing 2023, 37(1), 707-726. https://doi.org/10.32604/iasc.2023.035483
Received 23 August 2022; Accepted 06 January 2023; Issue published 29 April 2023
 View Full Text
 Download PDF
Abstract
Every year, the number of women affected by breast tumors is increasing worldwide. Hence, detecting and segmenting the cancer regions in mammogram images is important to prevent death in women patients due to breast cancer. The conventional methods obtained low sensitivity and specificity with cancer region segmentation accuracy. The high-resolution standard mammogram images were supported by conventional methods as one of the main drawbacks. The conventional methods mostly segmented the cancer regions in mammogram images concerning their exterior pixel boundaries. These drawbacks are resolved by the proposed cancer region detection methods stated in this paper. The mammogram images are classified into normal, benign, and malignant types using the Adaptive Neuro-Fuzzy Inference System (ANFIS) approach in this paper. This mammogram classification process consists of a noise filtering module, spatial-frequency transformation module, feature computation module, and classification module. The Gaussian Filtering Algorithm (GFA) is used as the pixel smooth filtering method and the Ridgelet transform is used as the spatial-frequency transformation module. The statistical Ridgelet feature metrics are computed from the transformed coefficients and these values are classified by the ANFIS technique in this paper. Finally, Probability Histogram Segmentation Algorithm (PHSA) is proposed in this work to compute and segment the tumor pixels in the abnormal mammogram images. This proposed breast cancer detection approach is evaluated on the mammogram images in MIAS and DDSM datasets. From the extensive analysis of the proposed tumor detection methods stated in this work with other works, the proposed work significantly achieves a higher performance. The methodologies proposed in this paper can be used in breast cancer detection hospitals to assist the breast surgeon to detect and segment the cancer regions.Keywords
Cancer is a crucial disease in women around the world which causes death. Timely and early detection of cancer can save the life of women patients. Most cancer causes deaths in women patients are categorized into breast and cervical. When compared with the death history of women patients due to cervical cancer, breast cancer is the most dangerous and life-threatening disease [1–3]. Breast cancer can be screened by two different methods as Histopathology and mammogram. The histopathology method finds the abnormality of the nucleolus of the breast cells. This method is cost expensive and the breast cancer detection accuracy is low. These limitations are overcome by screening and inspecting the cancer regions in mammogram images. Bypassing the low-intensity and low-profile laser beam through the breast cells in breast, mammogram images are obtained [4]. Breast cancers are categorized into benign and malignant based on the size of the cancer regions. The benign is low-spreading cancer and its spreading ratio is low when compared with other types. Malignant is high-spreading cancer and its spreading ratio is high when compared with the benign type. It is very important to detect both benign and malignant for further breast cancer diagnosis process. Fig. 1a shows the normal mammogram case, in which there are no suspect mass regions. Fig. 1b shows the abnormal mammogram case which is known as benign. In this case, the nerves are starting to damage. Fig. 1c shows the abnormal mammogram case which is known as malignant. In this case, the nerves are starting to damage very fast when compared with benign. Breast cancer diagnosis includes correctly identifying each stage and classifying detected breast tumors and abnormalities into proper categories. To assist radiologists and oncologists in diagnosing breast cancer in a fast and reliable manner, many Computer-Aided Diagnosis (CAD) systems have been developed over the last two decades [2]. Unfortunately, earlier CAD systems did not produce significant improvements in day-to-day breast cancer diagnosis in clinical use [3,4]. After the ‘boom’ of deep learning (DL), DL-based CAD systems and other computer vision and object recognition methods brought success to many areas of medicine, from day-to-day healthcare practices to comprehensive medical applications [5–9]. Currently, many DL-based CAD systems can be used to assist radiologists in breast cancer screening, monitoring, and diagnosis.
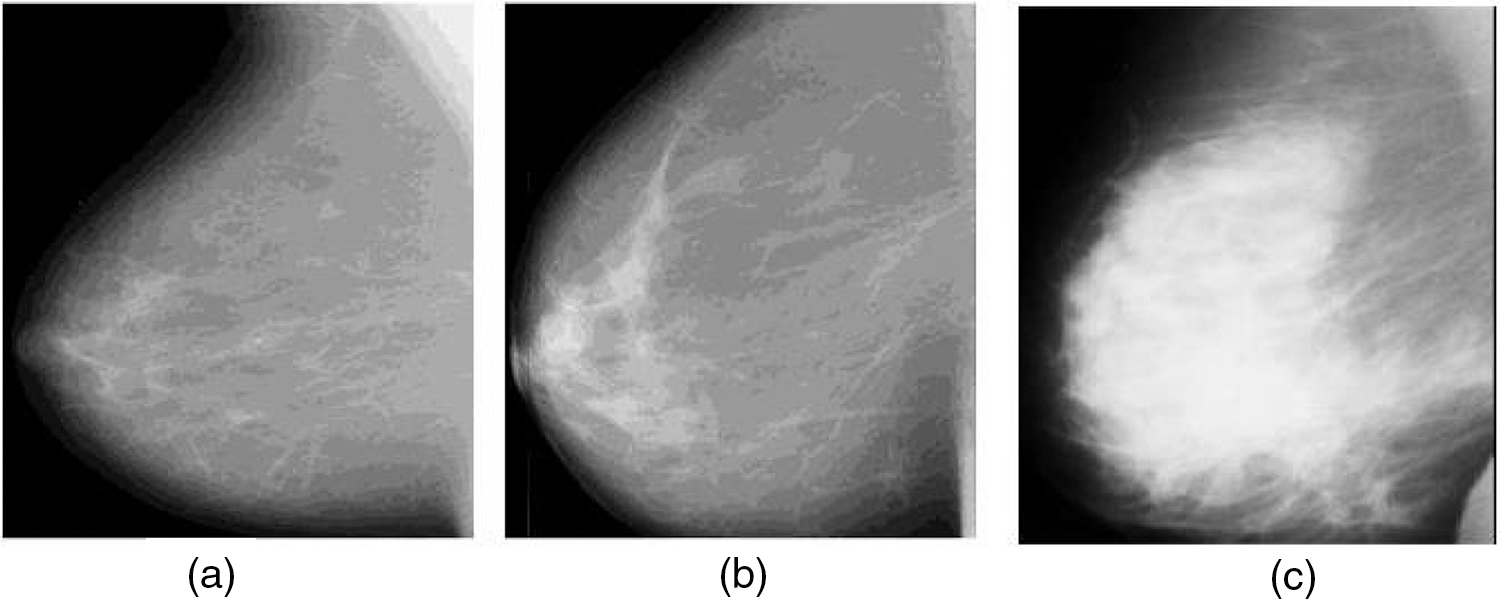
Figure 1: Mammogram images (a) Normal case (b) Benign case (c) Malignant case (Novitasari et al. 2019)
Many researchers used machine learning methods to detect breast cancer in mammogram images over the past two decades. The classification rate was low using the machine learning method and required a large number of dataset images for training the classifier. These conventional methods for breast cancer detection and segmentation consumed more computational time for classifying mammogram images into different classes. Also, these conventional methods segmented the cancer pixels in mammogram images more accurately in high-resolution and high-standard mammogram images. Therefore, these conventional methods are not supported by all healthcare centers. These drawbacks are overcome by developing deep learning methods to classify and segment the cancer regions in mammogram images. At present, many deep learning methods are developed to detect and classify breast cancer into different class patterns. The conventional deep learning methods required more mammogram images in the training category, which also consumed more time. In the view of physicians or radiologists, cancer mammogram image detection time is critical in the case of large population countries with low economical costs. This radiologist’s point of drawbacks will be resolved in this paper by proposing an ANFIS classifier that consumed less computational time and this classifier classifies the mammogram images with low-resolution mode. In this paper, Gabor transform-based deep learning architecture is proposed to detect and segment the cancer regions in mammogram images.
The motivation of this research work is to develop and assist the physician to identify the exact internal and external boundaries of the cancer regions in mammogram images. This will expand the life of the women patient if it is detected on time.
Therefore, the proposed breast cancer detection method plays a vital role in detecting the cancer regions in mammogram images. This paper develops a breast cancer detection approach using an ANFIS classifier. This paper is sectioned into five modules. Module 2 elaborates on the proposed breast cancer detection approach, module 3 proposes an ANFIS-based breast cancer detection approach, the experimental metrics are discussed in module 4 and the module concludes this paper.
Ueda et al. (2022) [10] applied deep learning CNN algorithm for detecting the cancer regions in mammogram images. The kernel rate of the internal Convolutional layer of the developed CNN architecture was designed using the fuzzy-based algorithm. This method was cross-validated by various validation algorithms and obtained a 95% of classification rate. Hassan et al. (2022) [11] developed Computer Aided Detection (CAD) approach for detecting cancer regions in mammogram images. The authors analyzed numerous conventional breast cancer detection methods with their experimental results. Saad Awadh Alanazi et al. (2021) constructed a deep-learning structure for detecting malignant mammogram images from non-malignant mammogram images. The data transformation was performed by the internal layers and the loss function was significantly reduced using the optimizer module in Convolutional Neural Networks (CNN). The authors obtained 95% of classification accuracy for the mammogram images available in Kaggle dataset. Desai et al. (2021) [12] employed two different classifiers for differentiating normal mammogram images from cancer-affected mammogram images in this work. The authors integrated the Multi-layer Perceptron Neural Network (MPNN) classification method with the constructed CNN structure for classifying the mammogram images into a different set of classes. The authors obtained 96.2% of classification accuracy for the mammogram images. Muhammad Tariq Sadiq et al. (2021) [13] applied Empirical Decomposition Mode (EDM) for decomposing the Electroencephalogram (EEG) signals along with different classification algorithms. Abdelhafiz et al. (2020) [14] segmented mass regions in mammogram images and these segmented mass regions were classified by the CNN method. Qian Zhang et al. (2020) [15] applied a maximum response filter bank on the mammogram images and further Rotation-Invariant Features (RIF) were computed from the filtered mammogram images. These RIF features were fused to compute the mixed fused feature image and this image was classified by the CNN classification method. The authors applied and tested the developed method on several mammogram datasets and obtained approximately 94% of the mammogram classification rate. Pacilè et al. (2020) [16] used an artificial intelligence technique to detect breast cancer-affected mammogram images. The authors determined the non-linear features from the source mammogram images to locate the distribution of tumor pixels in breast regions in mammogram images. Sasaki et al. (2020) [17] also applied artificial intelligence methods to determine the tumor regions in mammogram images. Sadhukhan et al. (2020) [18] applied different types of machine-learning algorithms for identifying cancer-affected mammogram images.
Chan et al. (2020) [19] used Artificial Intelligence (AI) methods for the detection and segmentation of abnormal mass regions in mammogram images. The abnormal mass regions were segmented by threshold segmentation approach in this work. The simulation results of this method were significantly compared with other approaches. The authors obtained 95.18% Se, 95.74% Sp, and 95.38% SA for benign case mammogram images and also obtained 94.23% Se, 94.28% Sp, and 95.37% SA for malignant case mammogram images on DDSM dataset images. Zeebaree et al. (2019) [20] utilized distance transform for segmenting the Region of Interest (RoI) in mammogram images. The segmented RoI pixels in mammogram images were classified by Neural Network (NN) method to differentiate the healthy and cancer mammogram images. The authors obtained 94.27% Se, 94.92% Sp, and 94.28% SA for benign case mammogram images and also obtained 94.18% Se, 94.67% Sp, and 95.17% SA for malignant case mammogram images on DDSM dataset images. Vijayarajeswari et al. (2019) [21] proposed a breast cancer segmentation approach using a machine learning classification method. This work used Hough Transform (HT) for performing the pixel resolution for the classification process. The transformed coordinates from the HT approach were classified the using Support Vector Machine (SVM) method. The authors obtained 94.76% Se, 94.98% Sp, and 95.75% SA for benign case mammogram images and also obtained 94.74% Se, 94.38% Sp, and 94.95% SA for malignant case mammogram images on DDSM dataset images. Ribli et al. (2018) [22] used a deep-learning model for identifying the lesions in mammogram images. The authors obtained an 89.7% lesion detection rate using their proposed methods. Sadoughi et al. (2018) [23] reviewed the applications of machine learning algorithms for detecting and classifying abnormal mammogram images from normal mammogram images. The authors compared the experimental results of these conventional methods concerning performance metrics.
From the extensive study of the conventional breast cancer detection methods, the following limitations of the conventional studies are observed as stated below.
• Most of the existing methods used existing machine and deep learning algorithms for mammogram classifications.
• The conventional breast cancer detection methods used morphological and region-growing algorithms for cancer pixel segmentation in mammogram images.
• The conventional methods obtained low sensitivity and specificity with cancer region segmentation accuracy.
• The high-resolution standard mammogram images were supported by conventional methods as one of the main drawbacks.
• The conventional methods mostly segmented the cancer regions in mammogram images concerning their exterior pixel boundaries.
These drawbacks are resolved by the proposed cancer region detection methods stated in this paper.
The above-mentioned research gaps are resolved by the objectives of this paper are stated as follows.
• To develop fully computer-assisted methods for breast cancer detection.
• To propose a novel cancer region segmentation algorithm for segmenting the cancer regions in mammogram images.
• To improve the performance of the cancer region segmentation methods.
The novelties of the work are stated below.
• Novel statistical Ridgelet features are computed for the classification of mammogram images.
• The novel segmentation algorithm is proposed in this paper to detect and segment the tumor pixels from abnormal mammogram images.
The mammogram images are classified into normal, benign, and malignant types using the ANFIS approach in this paper. This mammogram classification process consists of a noise filtering module, spatial-frequency transformation module, feature computation module, and classification module. The Gaussian Filtering Algorithm (GFA) is used as the noise filtering method and the Ridgelet transform is used as the spatial-frequency transformation module. The statistical feature metrics are computed from the transformed coefficients and these values are classified by the ANFIS technique in this paper.
Fig. 2a shows the mammogram images training workflow and Fig. 2b shows the mammogram images testing workflow.
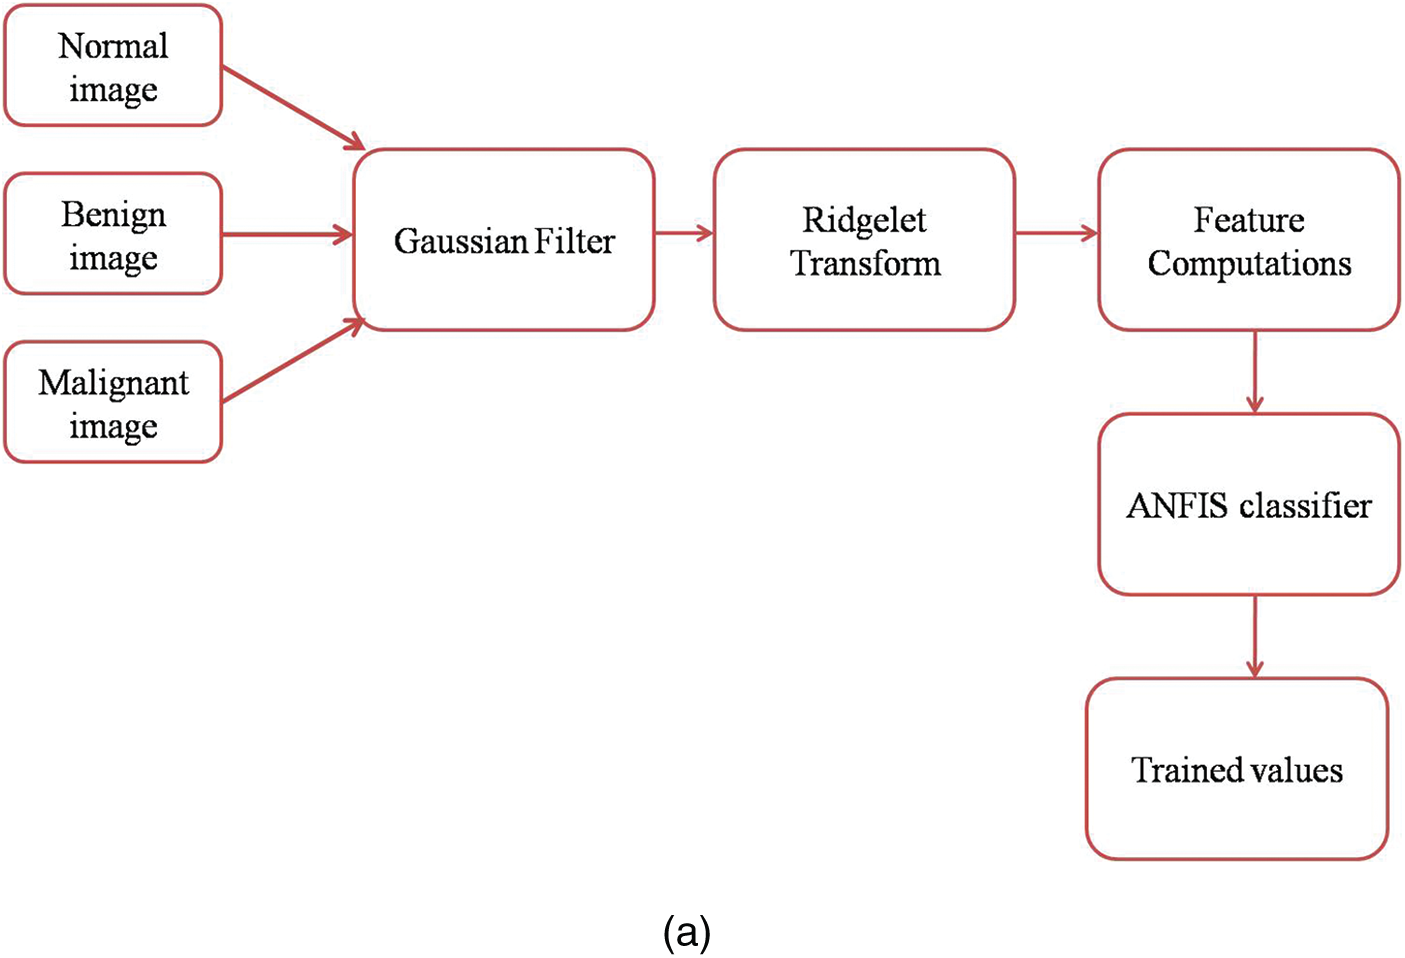
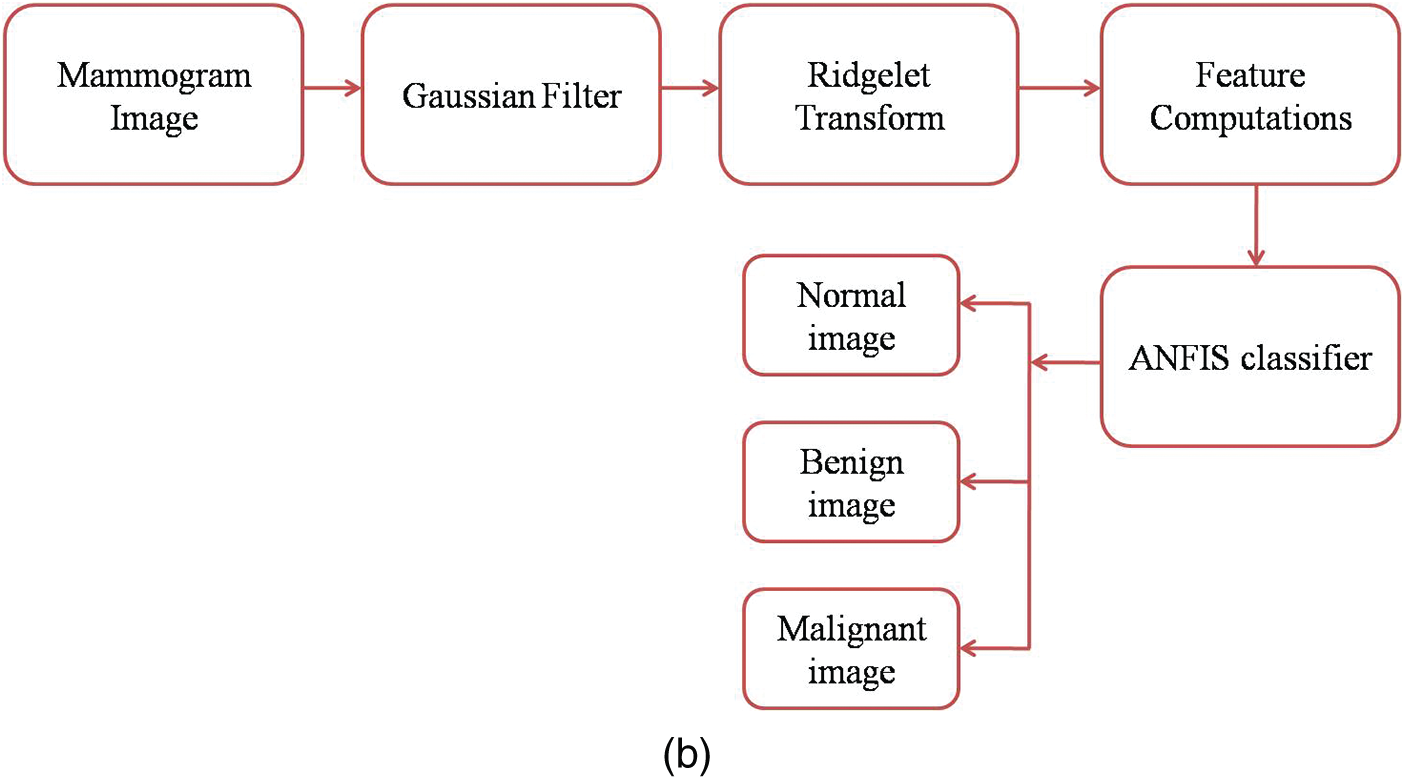
Figure 2: (a) Mammogram images training workflow (b) Mammogram images testing workflow GFA
The nerves are started from the chest region of the body and end at the nipple of the breast region. Therefore, the intensity level of all pixels in a mammogram image is different from others which creates the complexity in breast cancer detection process. To improve the smoothness of the pixels in a mammogram image, GFA is applied to the source mammogram image, which performs both noise filtering and enhancement of pixels in a mammogram image. It is a 2D-smoothing filter that uses a Convolution function for smoothing the pixels in a mammogram image. A bell-shaped Gaussian kernel is used in the Gaussian filter in this work. The Gaussian kernel of the Gaussian filter with the kernel size of 5 * 5 is given in the following equation.
where x and y are the pixel coordinates and the standard deviation is represented by
The source mammogram image is convolved with the Gaussian kernel of the Gaussian filter which produces the smoothed mammogram image. Fig. 3a is the source mammogram image and Fig. 3b is the Gaussian-filtered image.
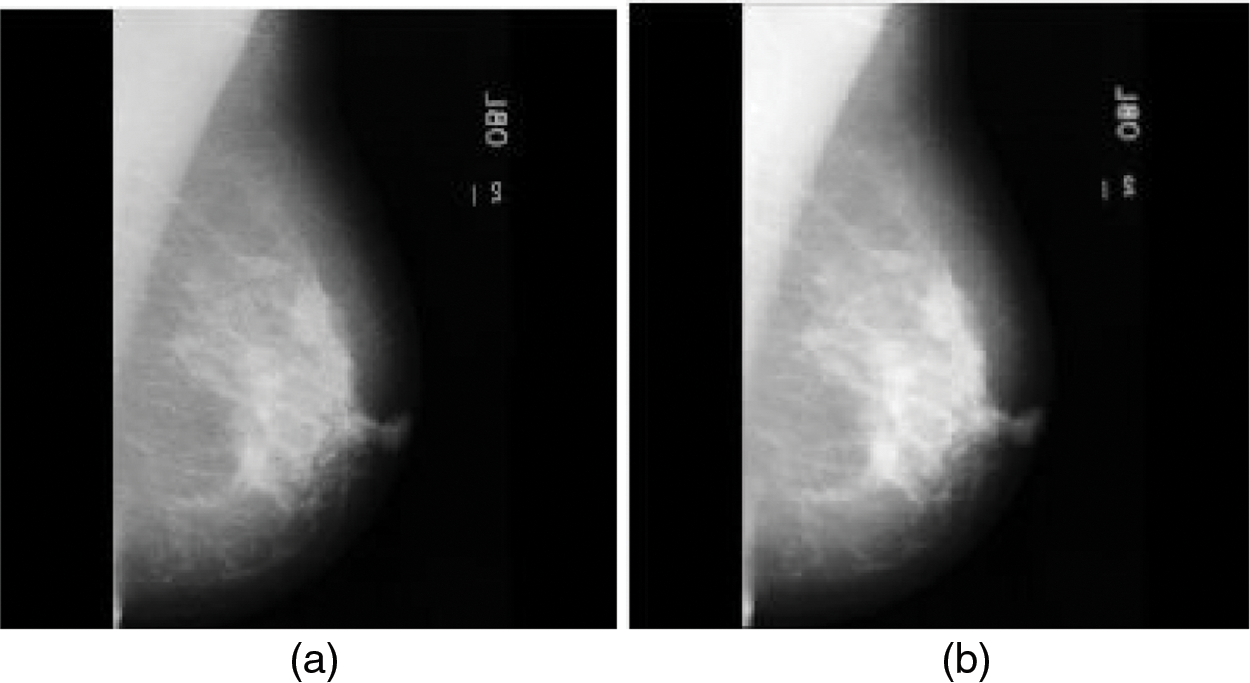
Figure 3: (a) Source mammogram image (b) Gaussian filtered image
The pixel transformation is used to obtain a higher classification accuracy through the feature computation process. Most of the researchers used Discrete Wavelet Transform (DWT) for pixel transformations in mammogram images. The edge smoothness was not achieved by DWT as the main drawback of this transformation during the image transformation process. Hence, the Ridgelet Transform (RT) is used in this work to obtain the edge smoothness of the mammogram image during the transformation process. The extended version of 2D-DWT is called RT. The sparse and linear properties of DWT are improved in RT to obtain the coefficients matrix concerning singularities.
Let ψ be the wavelet function and it should satisfy the following constraints.
The Ridgelet coefficients can be obtained using the wavelet function and the mammogram image which is to be transformed as follows.
where,
The RT produces the coefficient matrix and this matrix is used to compute the Ridgelet features for the classifications of mammogram images. The RT image from the Gaussian-filtered image is depicted in Fig. 4.
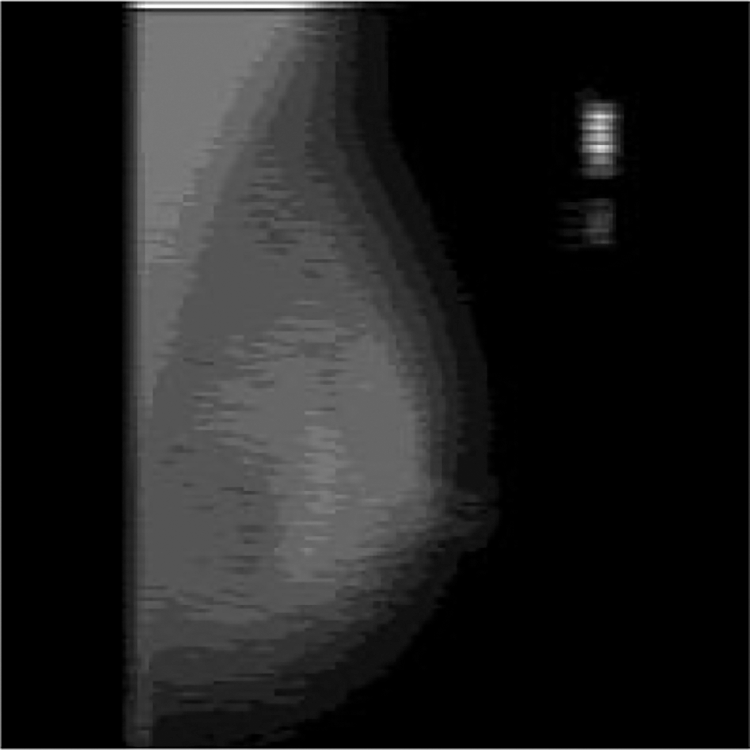
Figure 4: RT image
In this work, the Ridgelet features are determined from the coefficients of the Ridgelet transform, which is computed from the Gaussian-filtered mammogram image. The following Ridgelet features are computed based on the row and column index and they are defined in Eqs. (4)–(8).
Let’s
These Ridgelet features are arranged in a matrix which is called a Ridgelet Matrix (RM) and this RM is used to train the classifier followed by the feature computation process.
The computed and derived quantitative features from the mammogram images are fed into the ANFIS classifier for performing the classification process of the proposed breast cancer detection system (Dutta et al. 2018). This ANFIS classifier works on two different modes of training which are followed by the testing module. The training mode of this classifier obtains the quantitative features from healthy, benign, and malignant case mammogram images. The training mode of the classifier passes these quantitative features on the five internal layers, which finally generates the trained matrix. This trained matrix of the ANFIS classifier is used to perform the classification process during the classification mode of the classifier. During the classification of the ANFIS structure, the quantitative features are computed from the source mammogram image (which is to be tested), and these quantitative features are classified with the trained matrix.
The training of the quantitative features from healthy, benign, and malignant case mammogram images is depicted by the equation.
The testing of the quantitative features from the source mammogram image is depicted by the equation.
Fig. 5 is the ANFIS classifier structure which is used by Mohammed et al. (2019) and this structure is also used in this paper to classify the mammogram images into three different cases. This structure has been designed with 5 numbers of internal layers. The nodes in the first layer obtain the feature patterns from normal and abnormal mammogram images and the intermediate features will be transferred to the subsequent next layer 2. This layer performs a multiplication function of the intermediate features and the results will be transferred to the subsequent next layer 3. This layer performs a normalization function on the intermediate features and the results of this layer will be transferred to the subsequent next layer 4. This layer performs a fuzzification function on the intermediate features and the results will be transferred to the subsequent next layer 5. This layer performs a summation function on the intermediate features and thus produces the final output ‘f’, as depicted in Fig. 5.
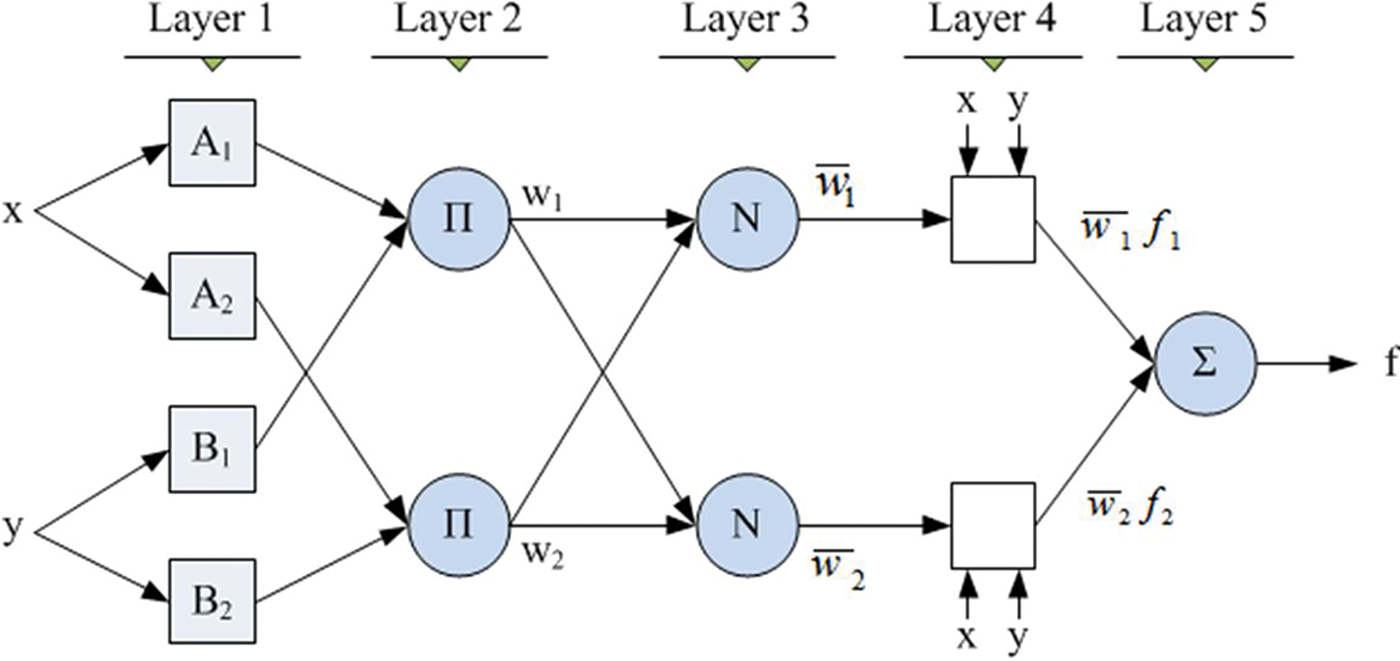
Figure 5: ANFIS classifier structure (Mohammed et al. 2019)
The design equations of each internal layer of the ANFIS classifier are explained as follows.
Layer 1 is designed using the following equation.
where,
Layer 2 computes the weight of the nodes using the following weighting equation.
Layer 3 computes the normalized weight using the following equation.
where R is the number of node counts in layer 3.
Layer 4 computes the fuzzification functional index using the following equation.
Layer 5 produces the summation of the functional index and its normalized weight value using the following equation.
Fig. 6a is the normal mammogram images and Fig. 6b is the abnormal mammogram images.
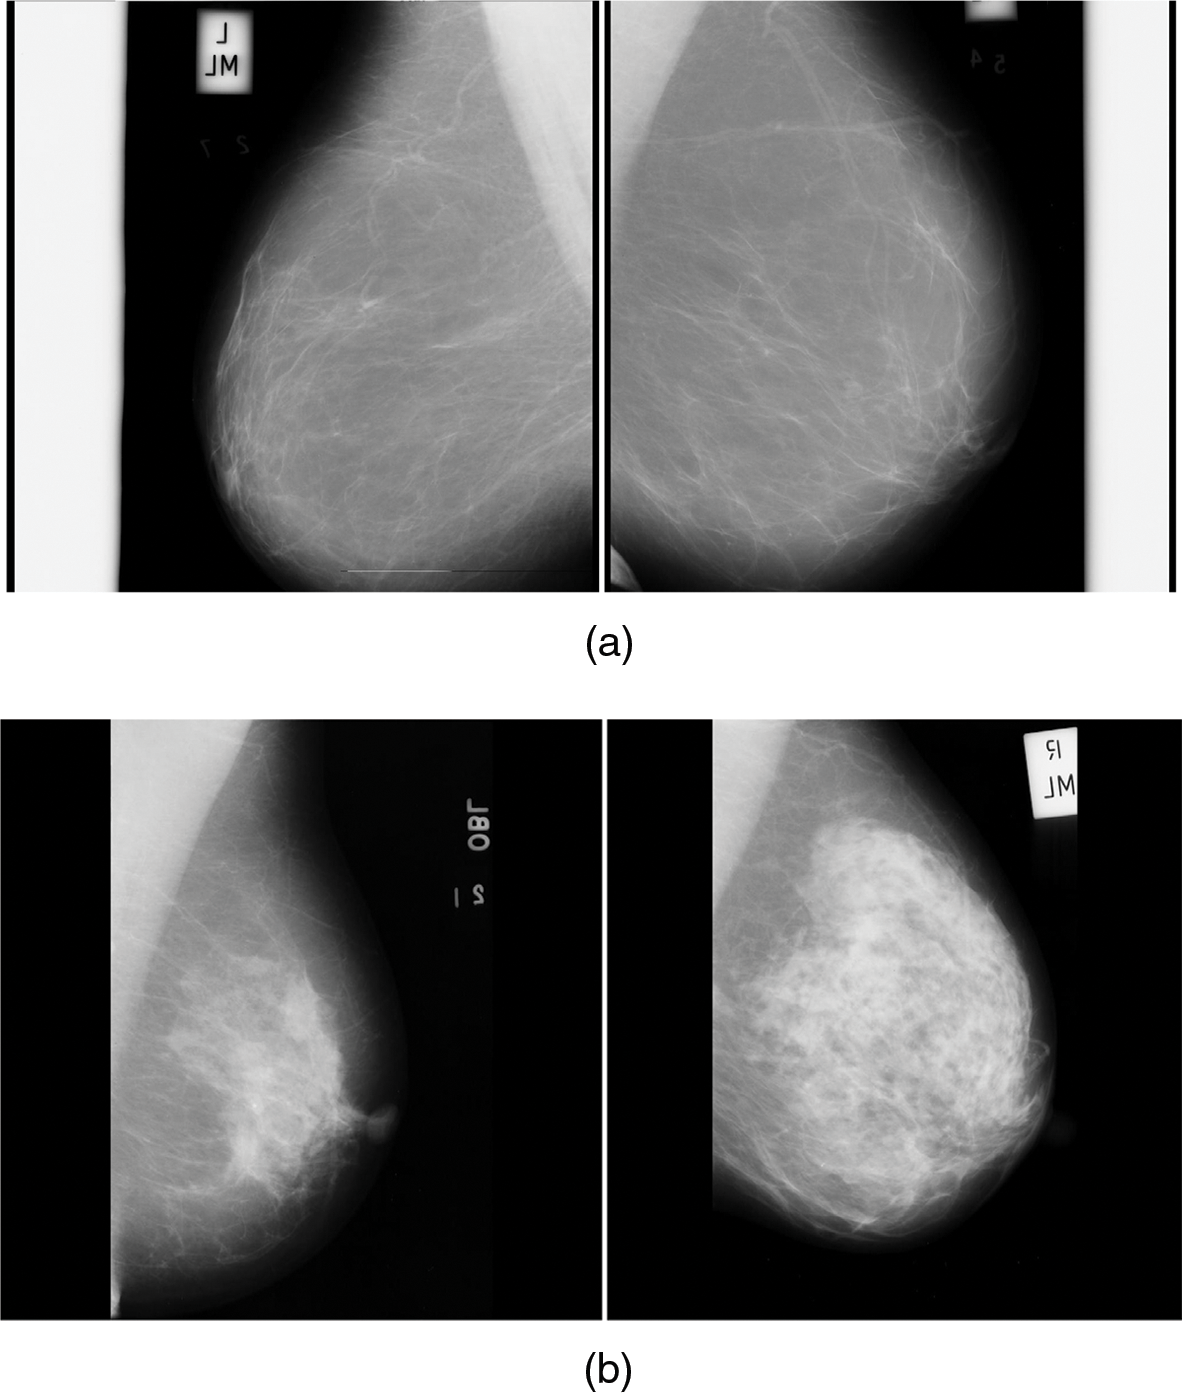
Figure 6: (a) Normal mammogram images (b) Abnormal mammogram images
The tumor regions in the classified abnormal image are detected and segmented in this work using the proposed Probability Histogram Segmentation Algorithm (PHSA). The proposed tumor pixels segmentation approach is explained in the following steps.1.
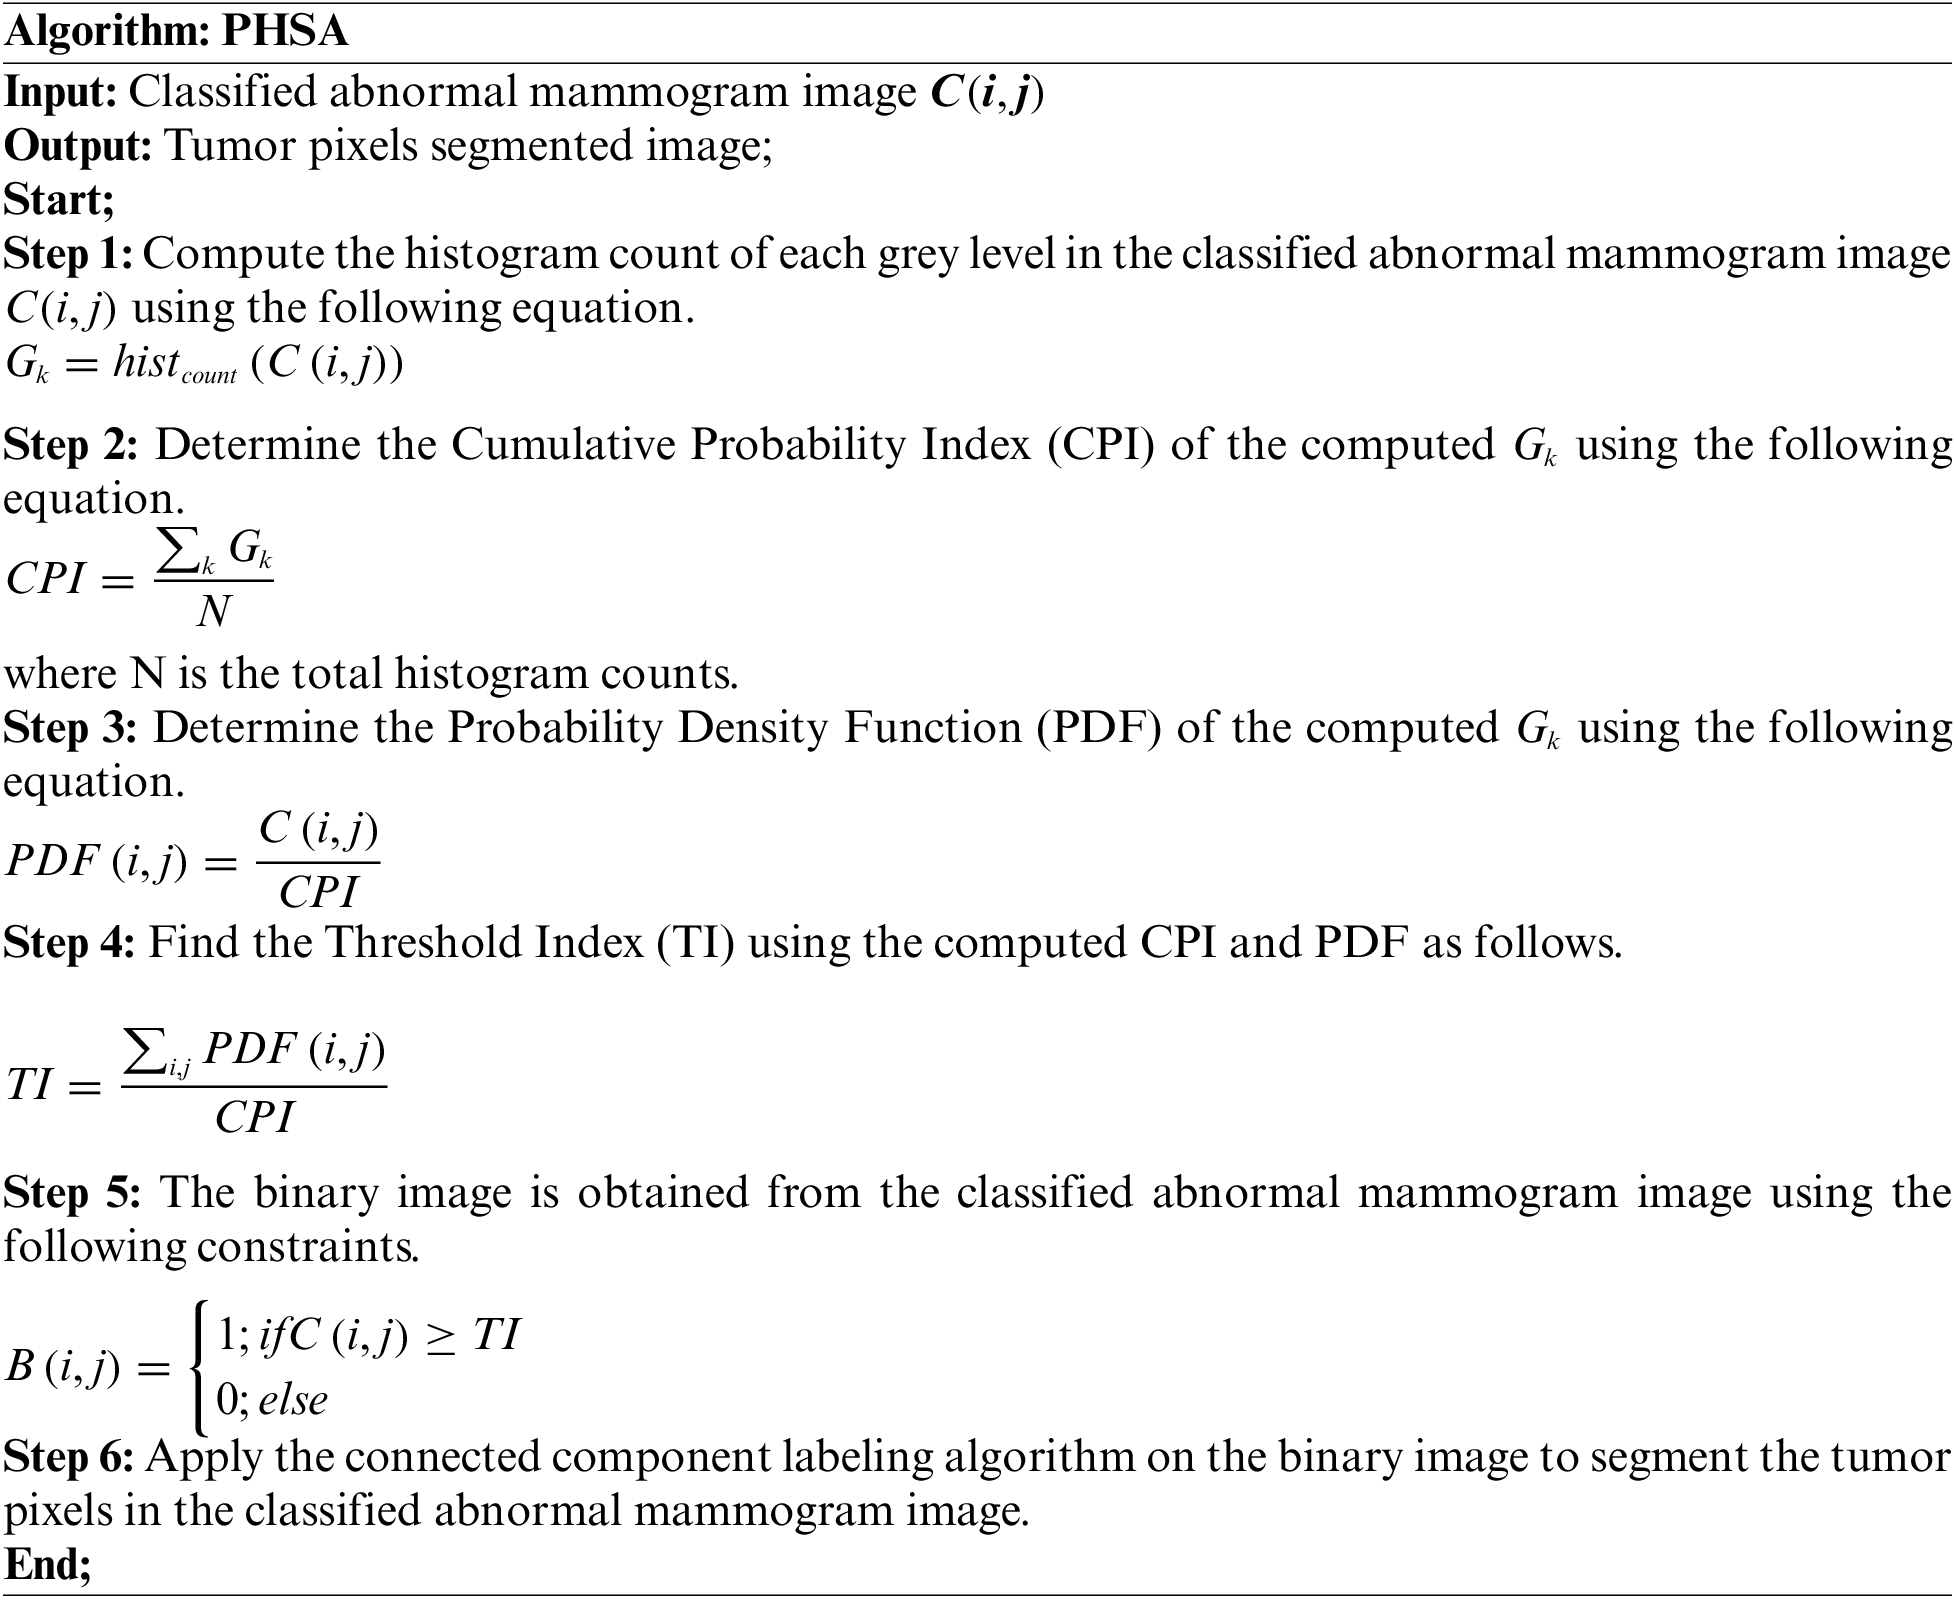
Fig. 7a shows the mammogram image, Fig. 7b shows the tumor segmentation by the PHSA method, and Fig. 7c shows the manual tumor segmented image.
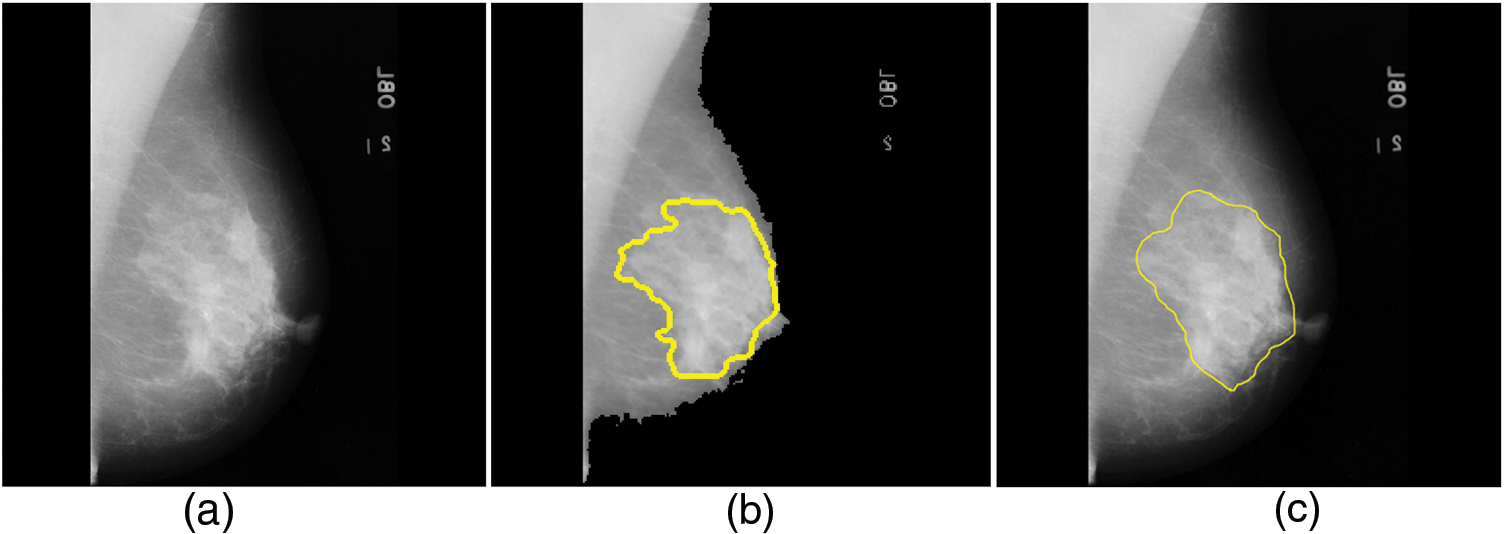
Figure 7: (a) Mammogram image (b) Tumor segmentation by PHSA method (c) Manual tumor segmented image
The MATLAB 2020 version has been used as the simulation tool for the detection of normal mammogram images from abnormal mammogram images [15]. In this paper, two publicly available license-free mammogram datasets have been used and the databases are the Mammographic Image Analysis Society (MIAS) [24] and Digital Database for Screening Mammography DDSM [25]. The MIAS dataset was constructed by a UK research group and the mammogram images were collected through the National Breast Screening Programme (NBSP). This dataset contains 322 mammogram images and they are split into 122 healthy mammogram images, 78 benign mammogram images, and 122 malignant mammogram images. All the mammogram images in this dataset are having an image size of 1024 * 1024 pixels in width and height respectively.
The DDSM dataset was constructed by the mammographic image analysis research community at Massachusetts General Hospital. This dataset contains the study of 2500 women and all the images in this dataset have been collected from different age groups. The mammogram images in this dataset are split into 1500 healthy mammogram images, 650 benign mammogram images, and 350 malignant mammogram images. All the mammogram images in this dataset are having an image size of 227 * 227 pixels in width and height respectively.
Table 1 is the MDI analysis on the MIAS dataset, which obtained 98.3% MDI for healthy cases, 96.1% MDI for benign cases, and 97.5% MDI for malignant cases. Therefore, the average MDI for MIAS dataset mammogram images is about 97.3%.
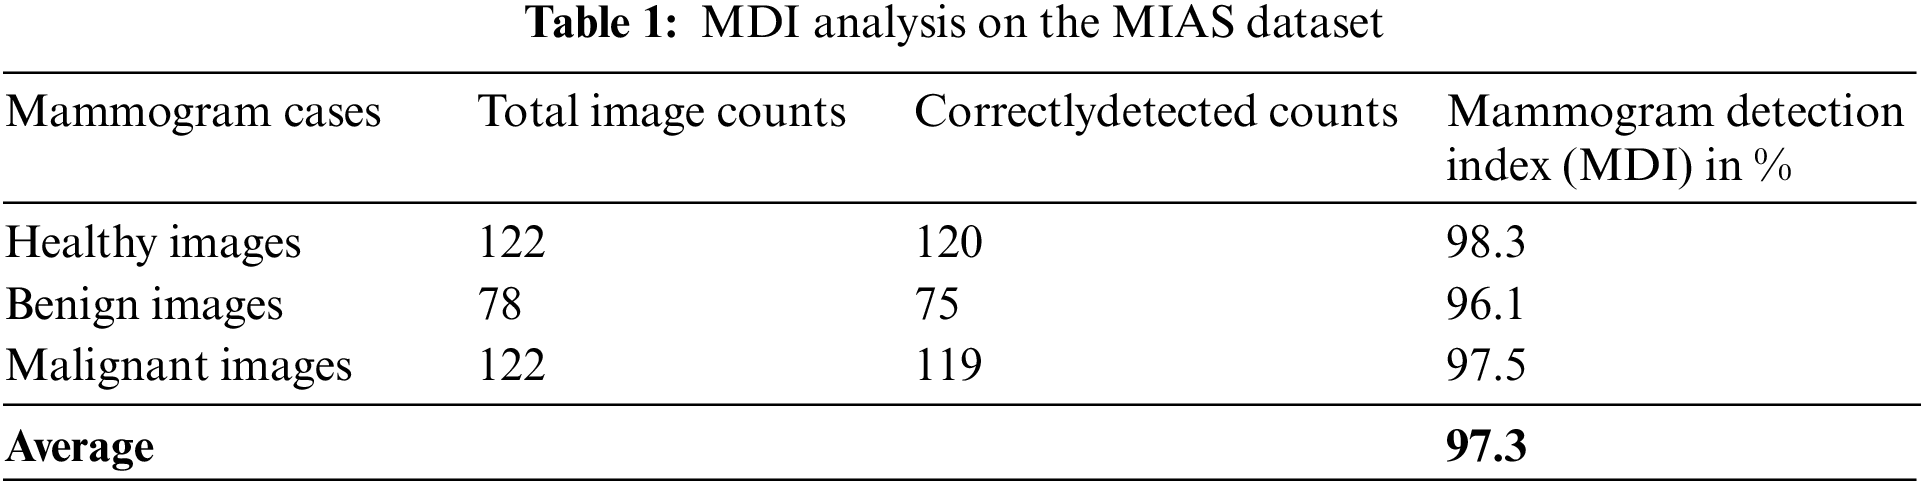
Table 2 is the MDI analysis on the DDSM dataset, which obtained 97.2% MDI for healthy cases, 98.3% MDI for benign cases, and 97.4% MDI for malignant cases. Therefore, the average MDI for DDSM dataset mammogram images is about 97.6%.
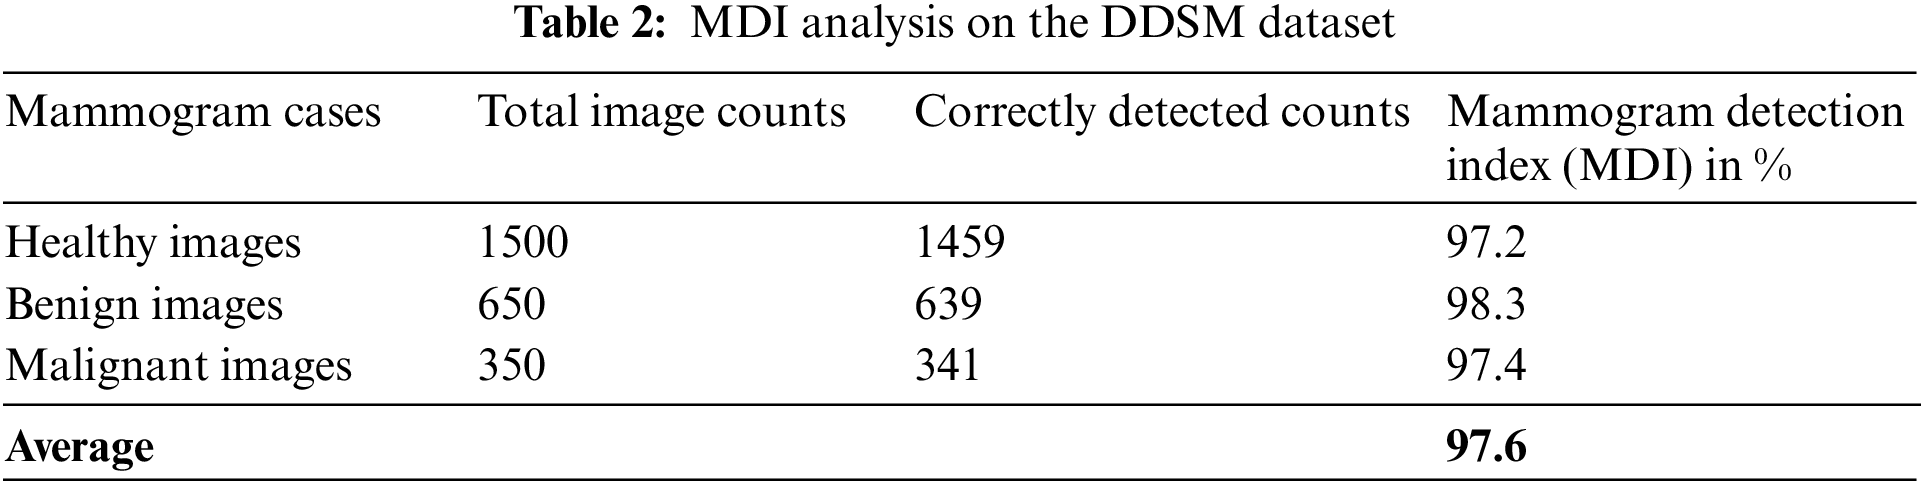
In this paper, the k-fold validation method is used to validate the experimental results which are stated in this work. The 4-fold validation method with 4 sets of iterations is used in this work to test the mammogram images. In the case of the MIAS dataset, the first fold obtains 97.3% of MDI, the second fold obtains 97.2% of MDI, the third fold obtains 97.3% of MDI and the fourth fold obtains 97.2% of MDI. Therefore, the average MDI is about 97.3% which is equal to the obtained experimental results stated in Table 1. In the case of the MDI dataset, the first fold obtains 97.6% of MDI, the second fold obtains 97.5% of MDI, the third fold obtains 97.6% of MDI and the fourth fold obtains 97.5% of MDI. Therefore, the average MDI is about 97.6% which is equal to the obtained experimental results stated in Table 2.
In this work, a Gaussian filter is used to detect and remove the noise contents in the source mammogram images. Based on the Gaussian filter implementation, the performance parameters Peak Signal to Noise Ratio (PSNR) is computed concerning different noise contents. The Gaussian filter obtains 56.78% of PSNR for 10% of the noise contents in the source mammogram image and the Gaussian filter obtains 51.92% of PSNR for 10% of noise the contents in the source mammogram image, which is more than enough for noise detection and removal process.
The proposed work also investigated the following metrics.
The pixels in the category of cancer and non-cancer correctly are known as TP and TN, and the pixels in the category of cancer and non-cancer incorrectly are known as FP and FN.
Table 3 is the quantitative analysis of malignant mammogram images in the MIAS dataset. This paper obtained 97.17% Se, 98.29% Sp and 98.43% SA for the case of benign images and also obtained 98.19% Se, 99.04% Sp and 98.67% SA for the case of malignant images.
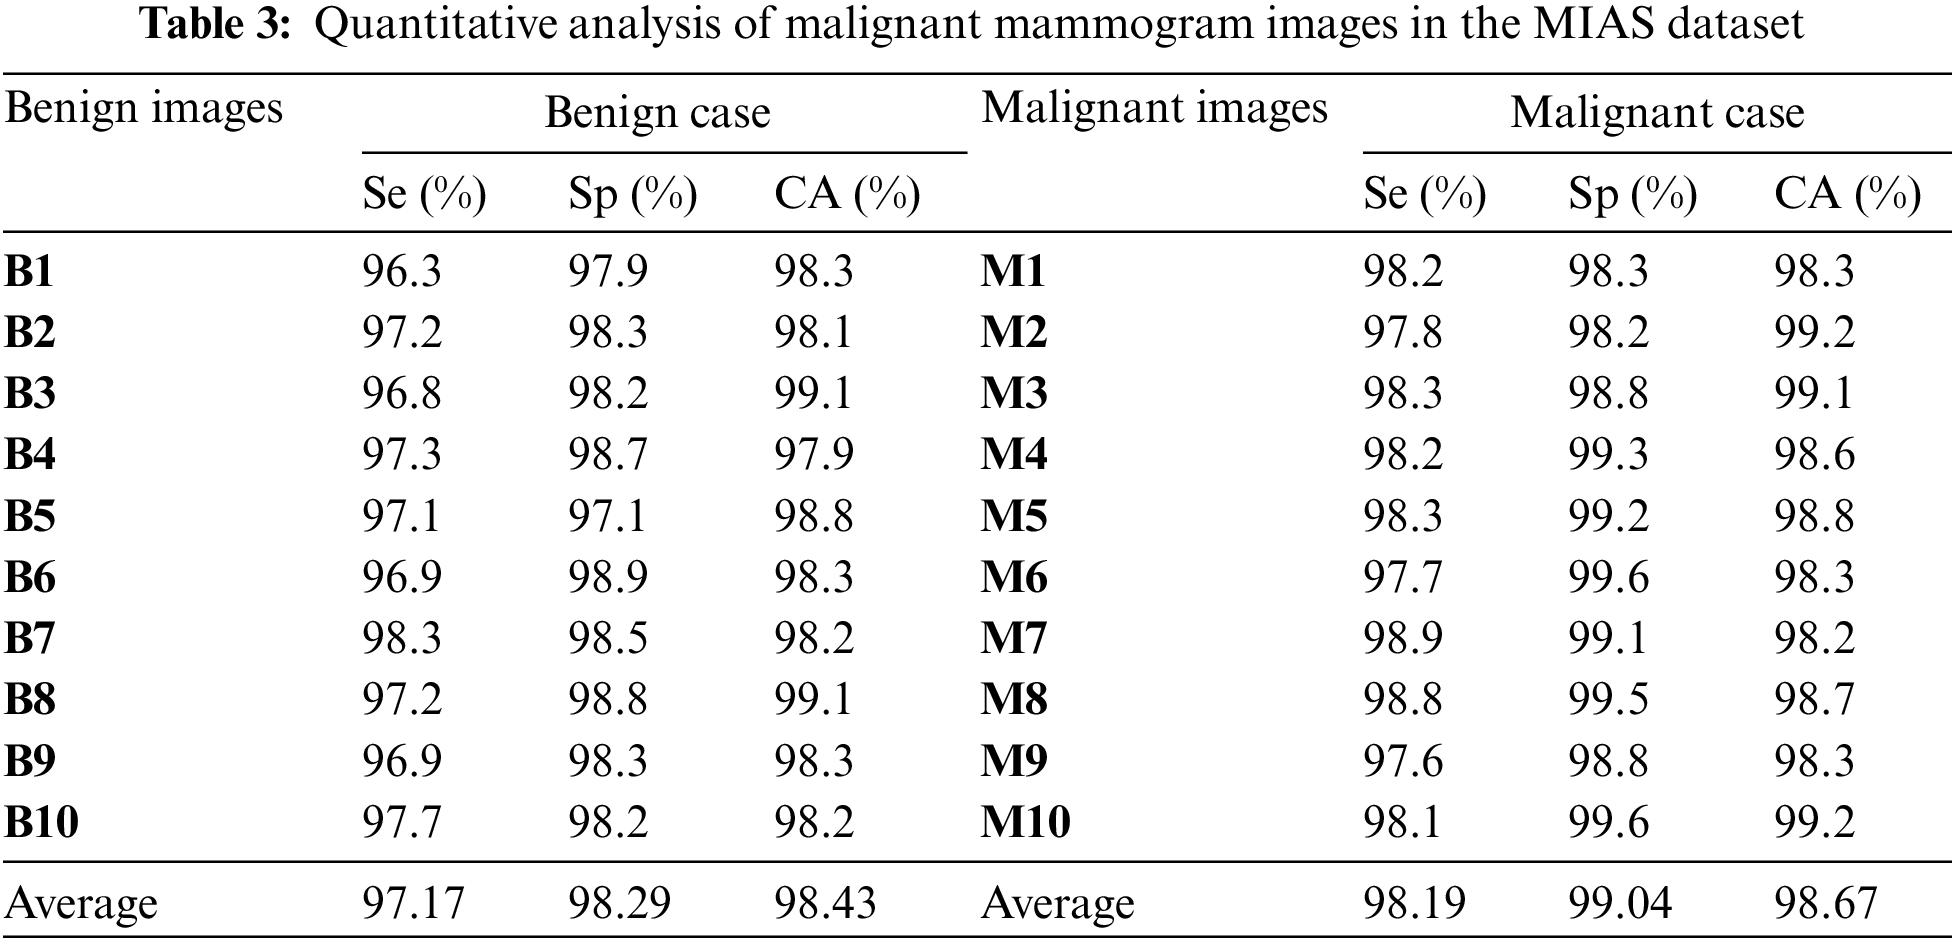
Fig. 8a shows the graphical output for the benign case and Fig. 8b shows the graphical output for the malignant case for MIAS dataset images.
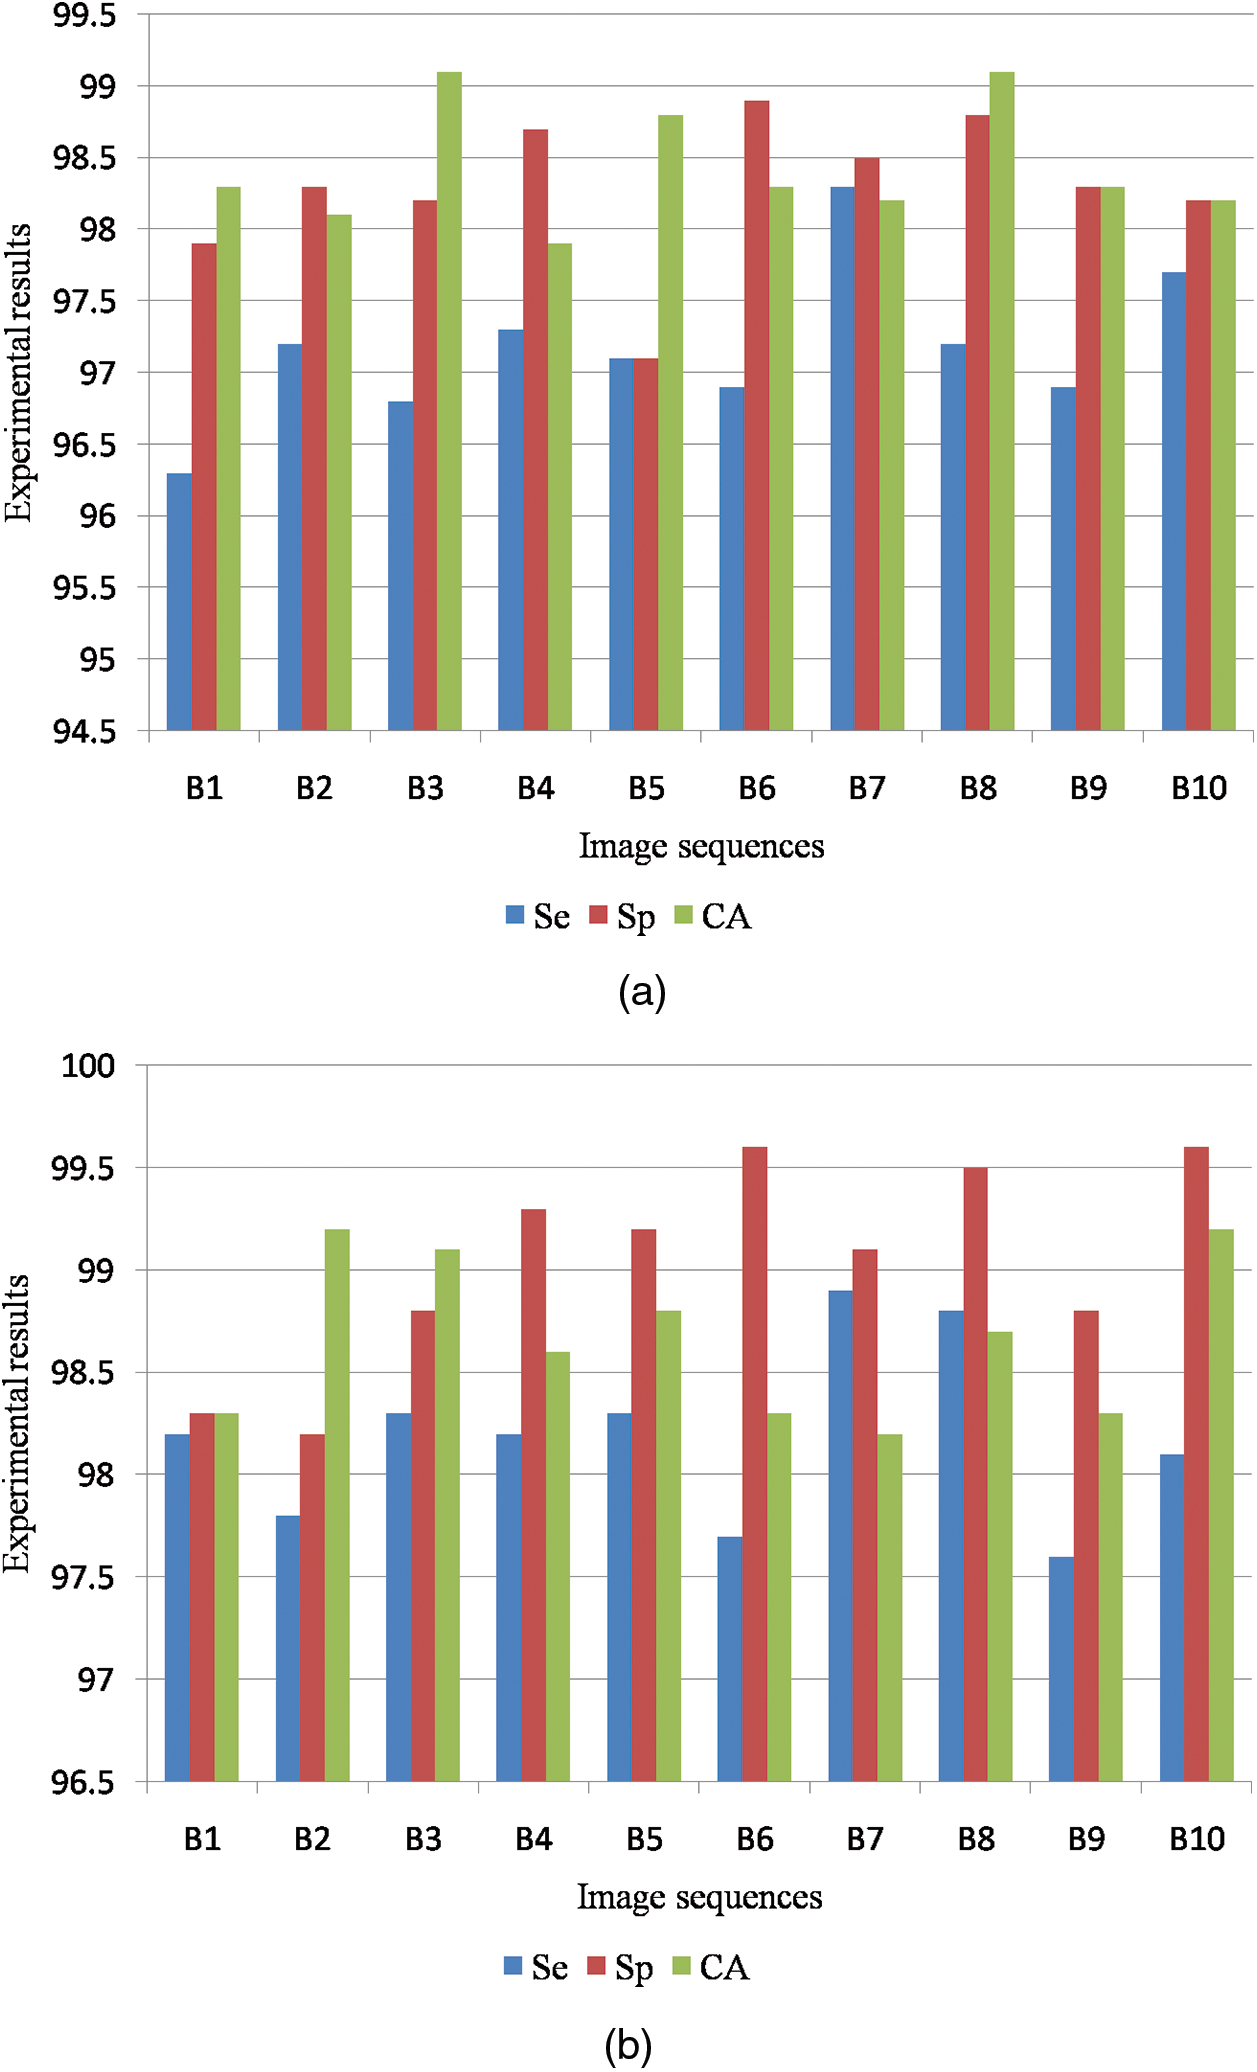
Figure 8: (a) Graphical output for benign case (b) Graphical output for malignant case
Table 4 is the quantitative analysis of malignant mammogram images in the DDSM dataset. This paper obtained 98.19% Se, 98.44% Sp and 98.65% SA for the case of benign images and also obtained 98.83% Se, 98.65% Sp and 98.53% SA for the case of malignant images.
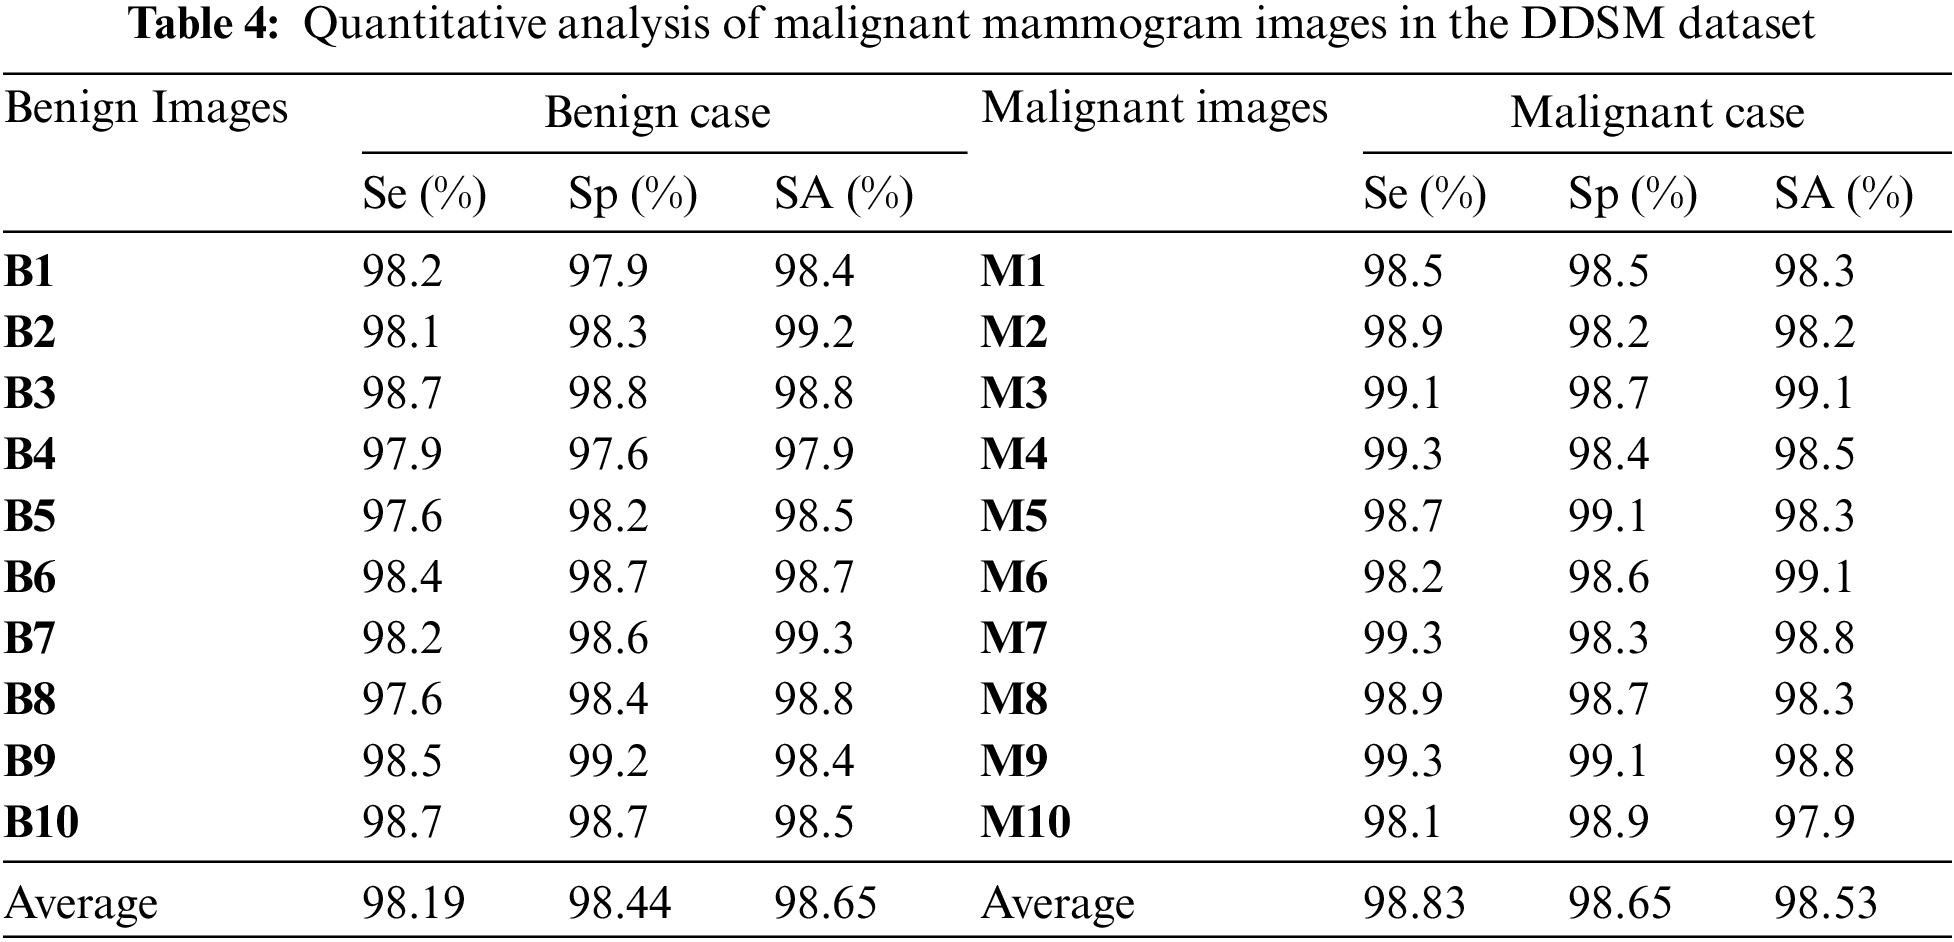
Fig. 9a shows the graphical output for the benign case and Fig. 9b shows the graphical output for the malignant case for DDSM dataset images.
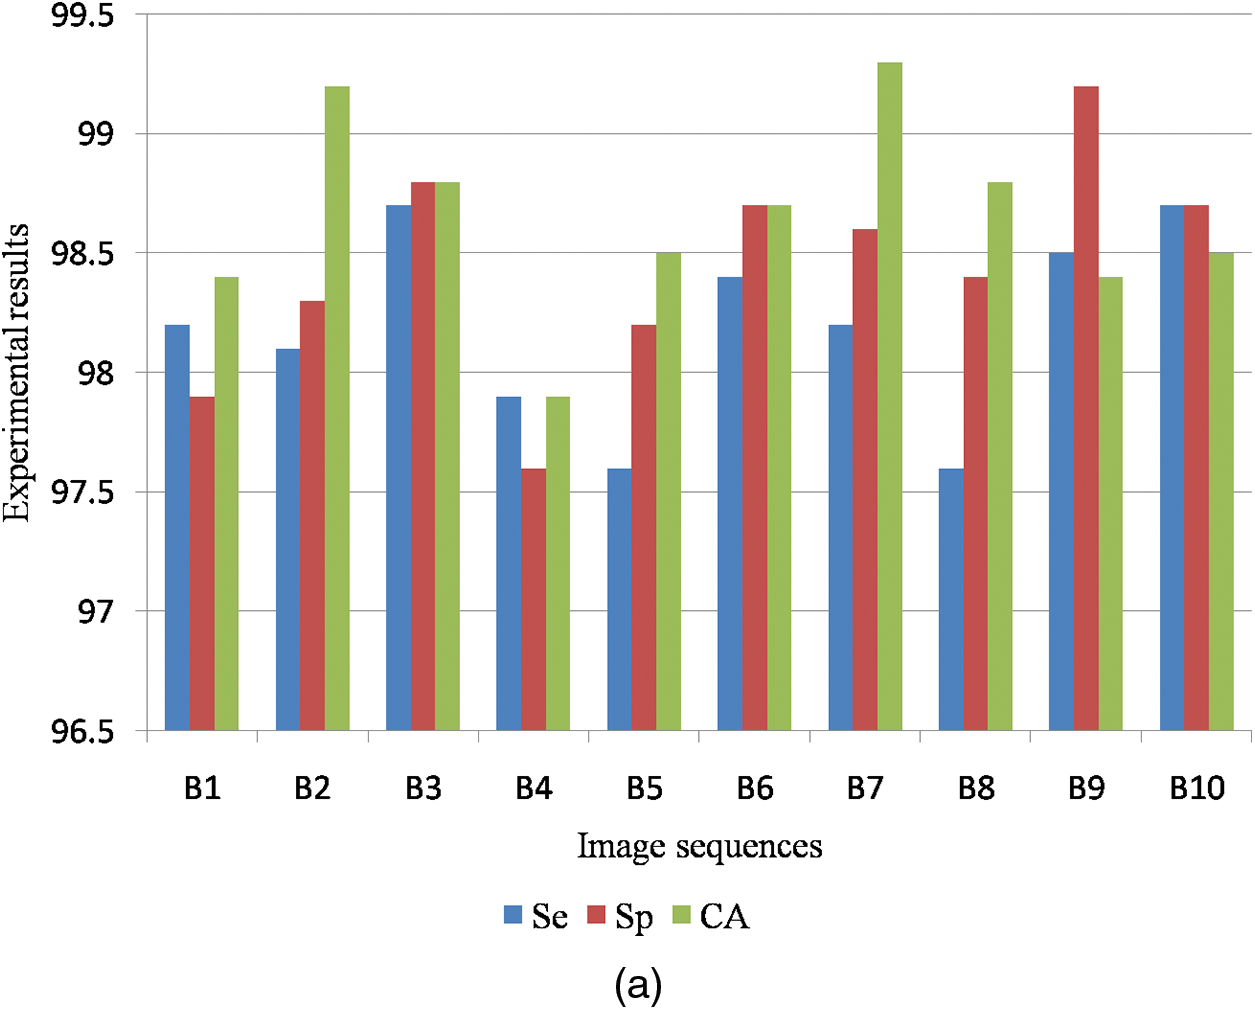
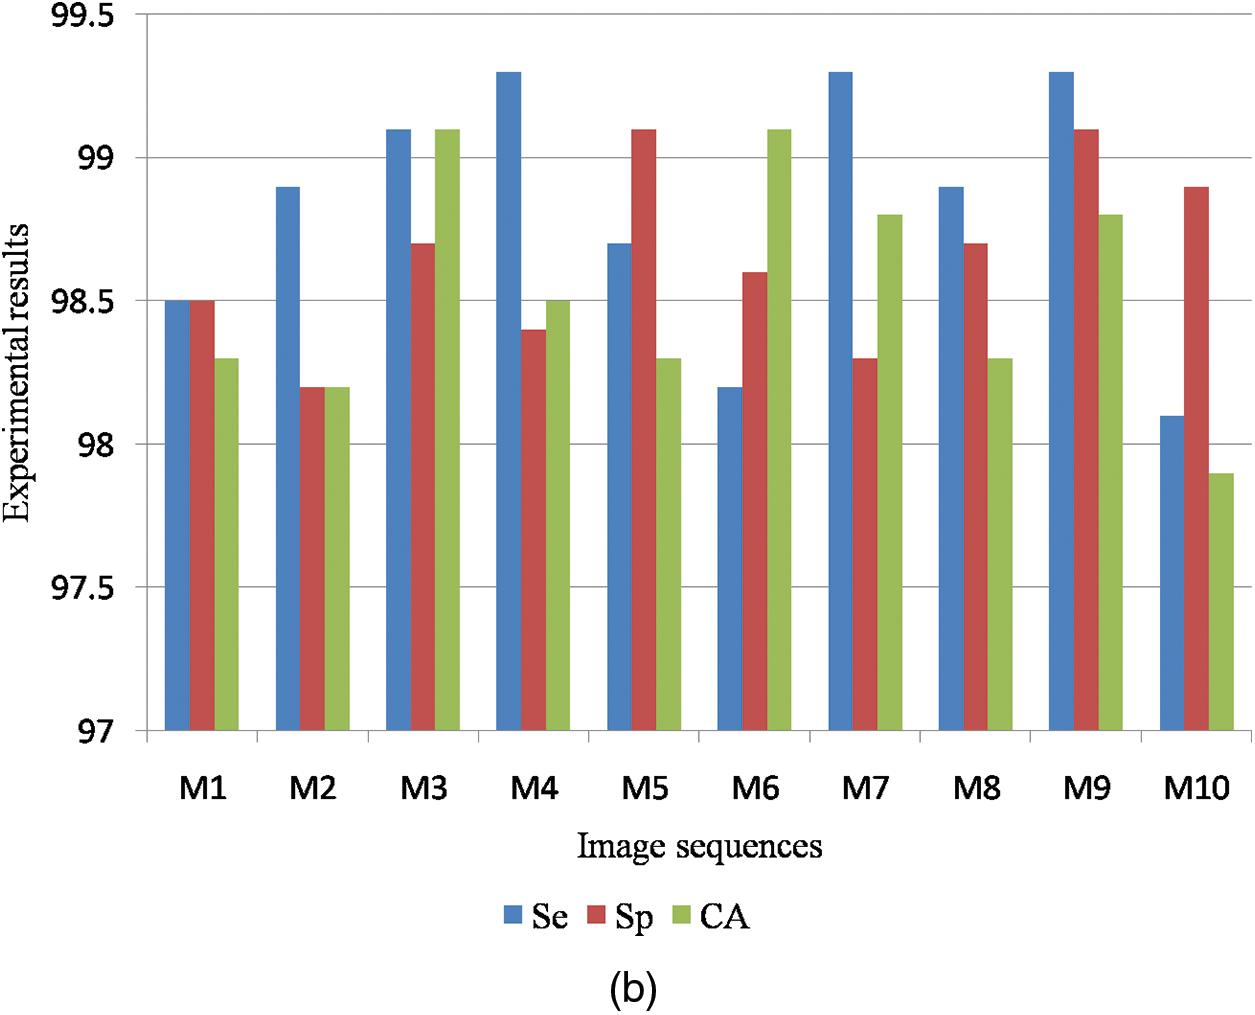
Figure 9: (a) Graphical output for benign case (b) Graphical output for malignant case
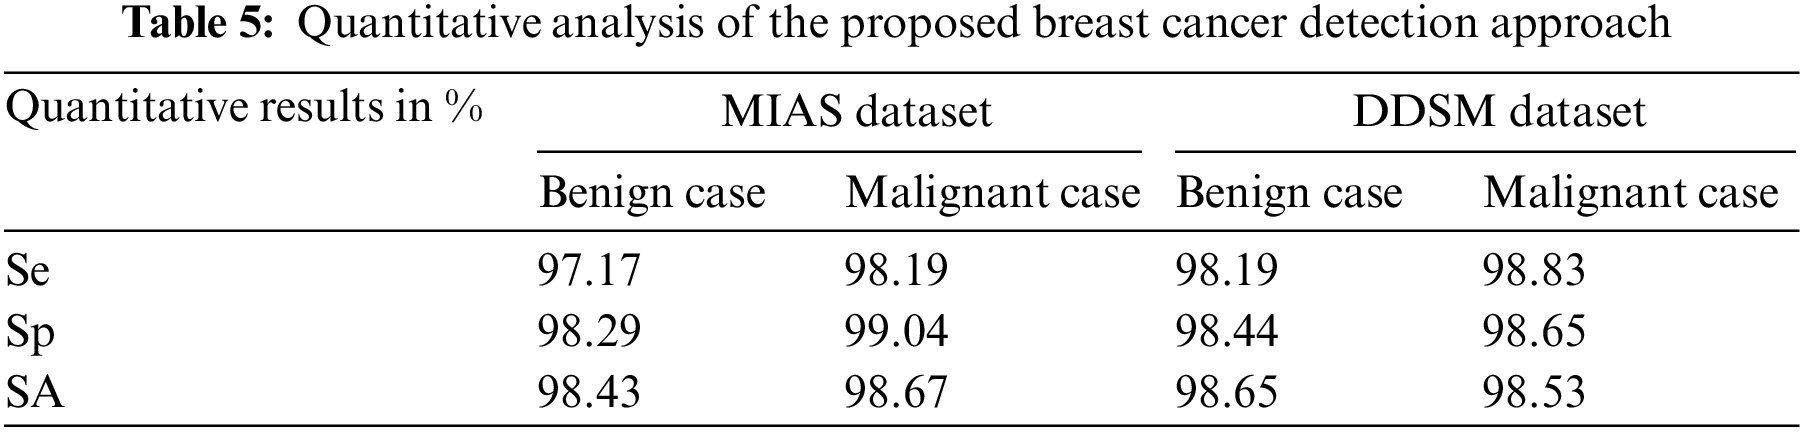
Table 5 is the quantitative analysis of the proposed breast cancer detection approach on both MIAS and DDSM dataset mammogram images. It is observed that the proposed breast cancer detection approach stated in this work produces significant quantitative results in both public dataset mammogram images.
The proposed PHSA segmentation method plays an important role in the tumor pixels segmentation process on the classified abnormal mammogram images. Hence, this is important to analyze the performance of the tumor pixel segmentation using the proposed PHSA method with the conventional morphological segmentation method. Table 6 shows the performance analysis of the proposed PHSA segmentation method with the conventional morphological segmentation method on the MIAS dataset.

Table 7 shows the performance analysis of the proposed PHSA segmentation method with the conventional morphological segmentation method on the DDSM dataset.
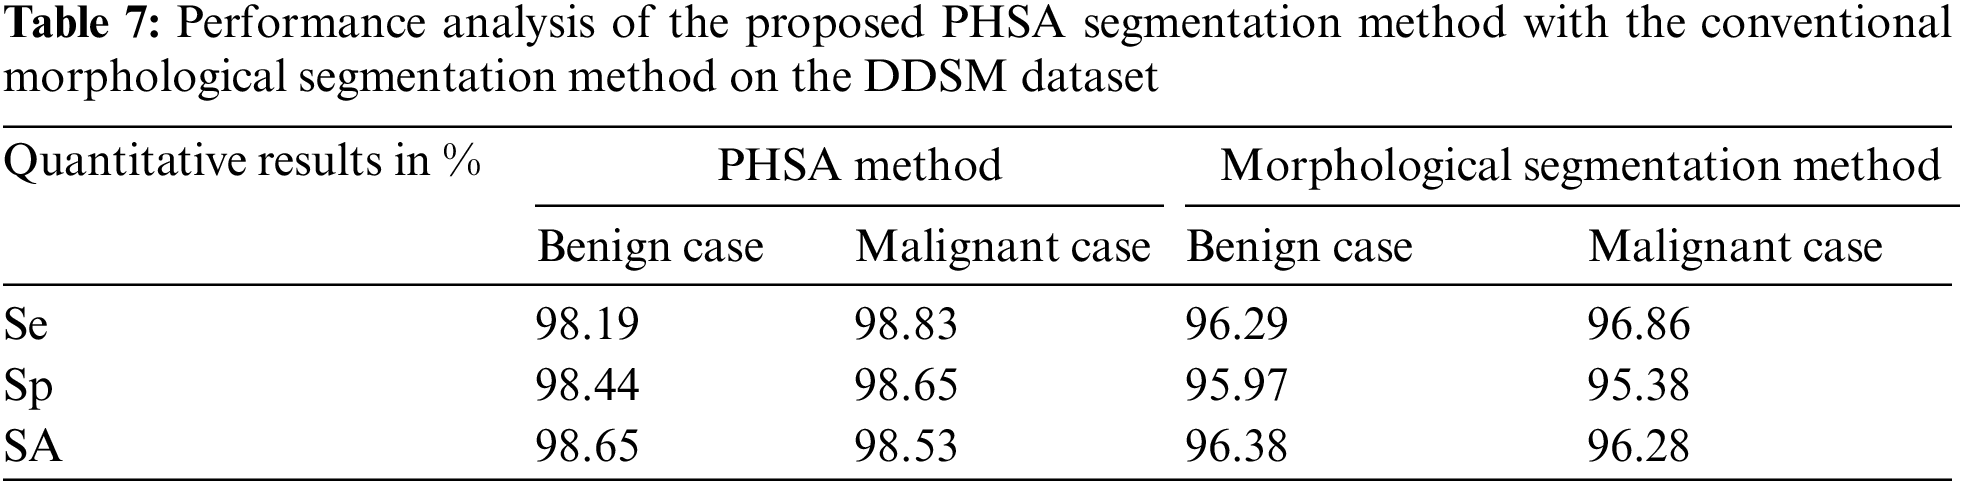
Table 8 is the quantitative comparisons of breast cancer detection approaches on the MIAS dataset with other existing breast cancer detection approaches Saad Awadh Alanazi et al. (2021), Desai et al. (2021) and Abdelhafiz et al. (2020).
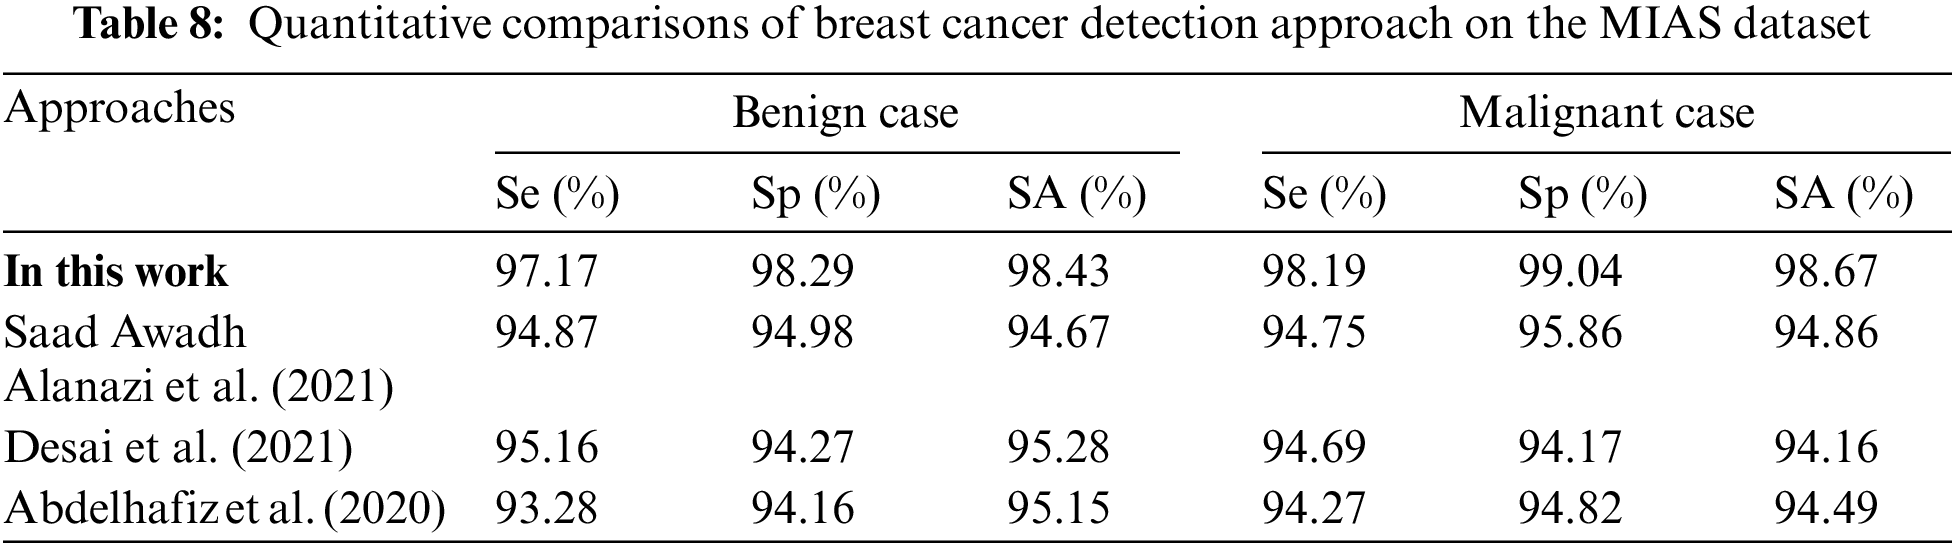
Fig. 10a shows the graphical comparisons of breast cancer detection approaches on the MIAS dataset for benign images and Fig. 10b Graphical comparisons of breast cancer detection approaches on the MIAS dataset for malignant images.
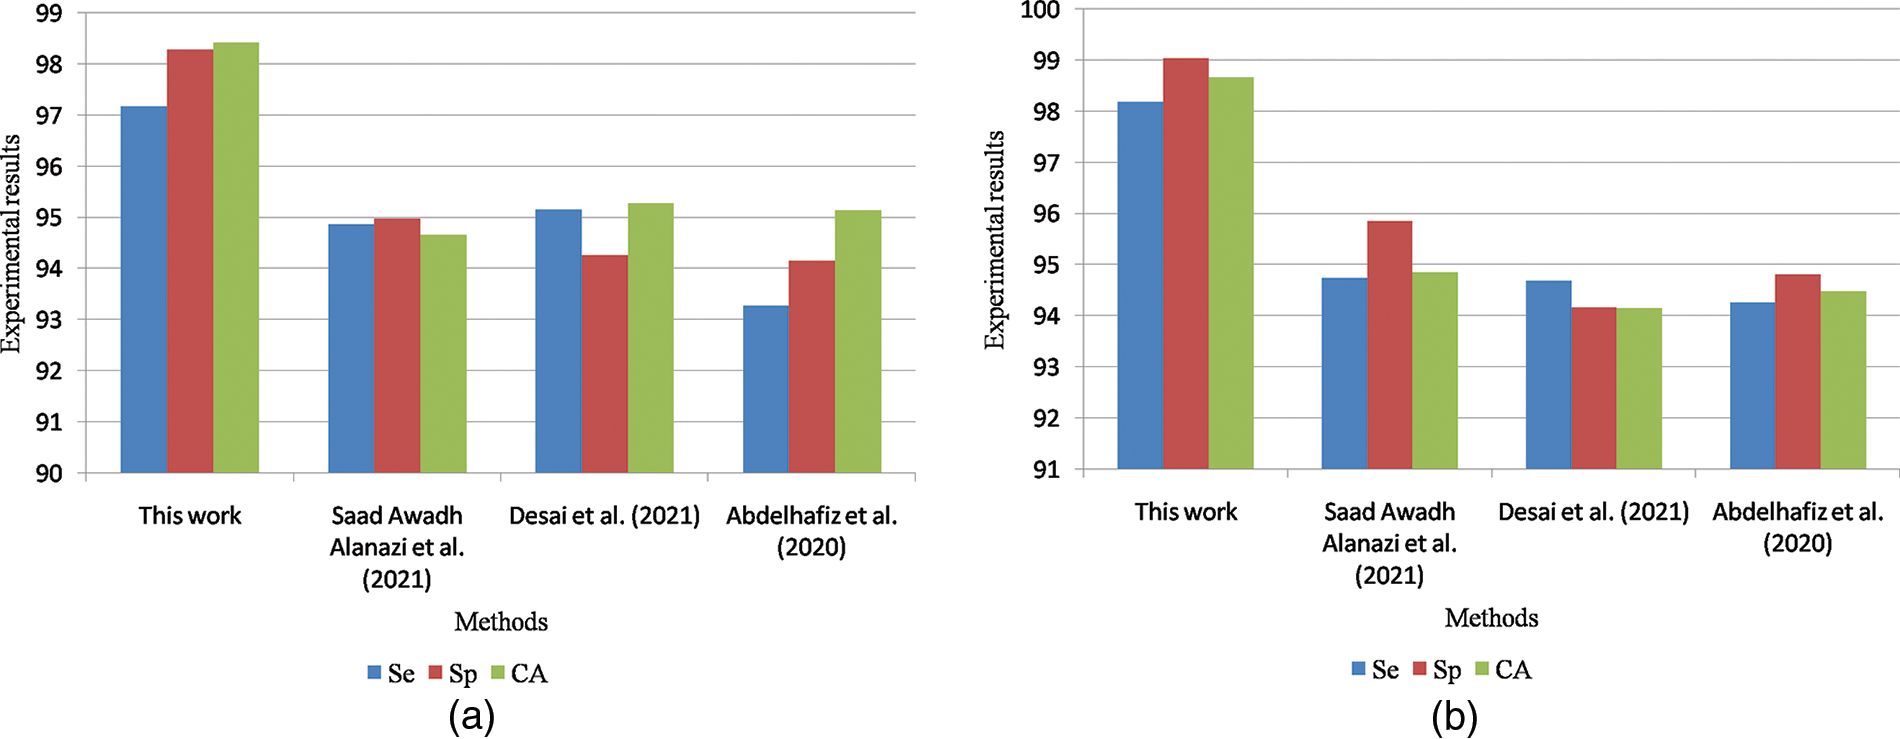
Figure 10: (a) Graphical comparisons of breast cancer detection approaches on MIAS dataset for benign images (b) Graphical comparisons of breast cancer detection approaches on MIAS dataset for malignant images
Table 9 is the quantitative comparisons of breast cancer detection approaches on the DDSM dataset with other existing breast cancer detection approaches Chan et al. (2020), Zeebaree et al. (2019) and Vijayarajeswari et al. (2019).
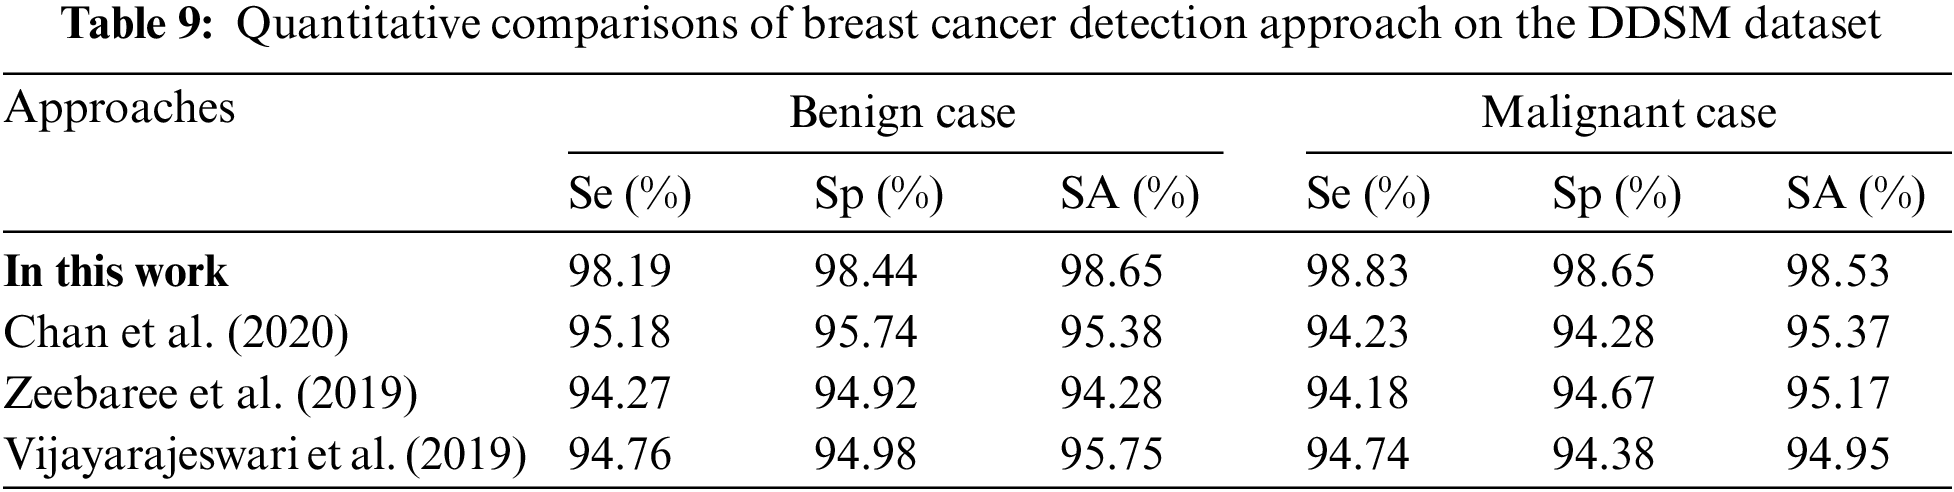
Fig. 11a shows the graphical comparisons of breast cancer detection approaches on the MIAS dataset for benign images and Fig. 11b Graphical comparisons of breast cancer detection approaches on the MIAS dataset for malignant images.
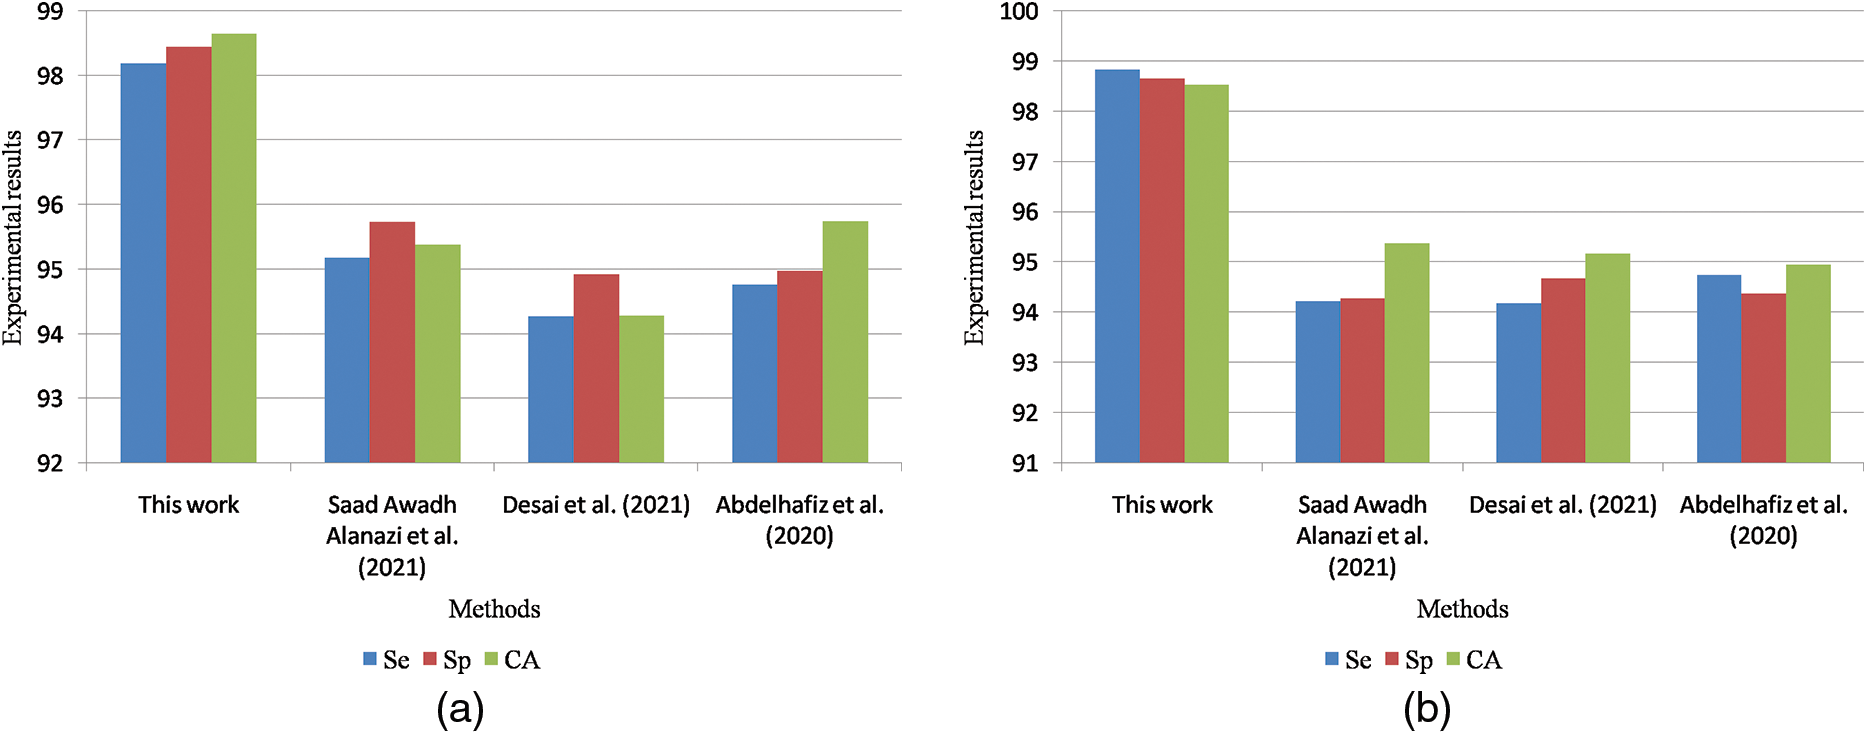
Figure 11: (a) Graphical comparisons of breast cancer detection approaches on the DDSM dataset for benign images (b) Graphical comparisons of breast cancer detection approaches on the DDSM dataset for malignant images
This paper proposes an effective breast cancer detection method using Ridgelet transform and ANFIS classifier. This work is experimentally investigated on MIAS and DDSM dataset mammogram images. The proposed work obtained 98.3% MDI for healthy cases, 96.1% MDI for the benign case, and 97.5% MDI for the malignant case. Therefore, the average MDI for MIAS dataset mammogram images is about 97.3%. The proposed work obtained 97.2% MDI for healthy cases, 98.3% MDI for the benign case, and 97.4% MDI for the malignant case. Therefore, the average MDI for DDSM dataset mammogram images is about 97.6%. This paper obtained 97.17% Se, 98.29% Sp and 98.43% SA for the case of benign images and also obtained 98.19% Se, 99.04% Sp and 98.67% SA for the case of malignant images in the MIAS dataset. This paper obtained 98.19% Se, 98.44% Sp and 98.65% SA for the case of benign images and also obtained 98.83% Se, 98.65% Sp and 98.53% SA for the case of malignant images in the DDSM dataset. The main limitation of this work is that it detects the tumor regions in mammogram images and it does not deal with any diagnosis or severity analysis on the segmented tumor regions. In the future, the methodologies stated in this work are also used to detect the severity levels of the segmented tumor regions in mammogram images.
Funding Statement: The authors received no specific funding for this study.
Conflicts of Interest: The authors declare that they have no conflicts of interest to report regarding the present study.
References
1. R. Roslidar, A. Rahman, R. Muharar, M. R. Syahputra, F. Arnia et al., “A review on recent progress in thermal imaging and deep learning approaches for breast cancer detection,” IEEE Access, vol. 8, pp. 116176–116194, 2020. [Google Scholar]
2. S. T. Mijares, F. Woo and F. Flores, “Breast cancer identification via thermography image segmentation with a gradient vector flow and a convolutional neural network,” Journal of Healthcare Engineering, vol. 60, no. 18, pp. 1–13, 2019. [Google Scholar]
3. T. S. Arulananth, L. Balaji and M. Baskar, “PCA Based Dimensional Data Reduction and Segmentation for DICOM Images,” Neural Processing Letters, 2020. [Google Scholar]
4. R. S. Cauce, J. P. Martín and M. Luque, “Multi-input convolutional neural network for breast cancer detection using thermal images and clinical data,” Computer Methods and Programs in Biomedicine, vol. 204, no. 7, pp. 1–9, 2021. [Google Scholar]
5. S. A. Alanazi, M. M. Kamruzzaman, Md N. I. Sarker, M. Alruwaili, Y. Alhwaiti et al., “Boosting breast cancer detection using convolutional neural network,” Journal of Healthcare Engineering, vol. 2, no. 6, pp. 1–11, 2021. [Google Scholar]
6. R. Sampath and M. Baskar, “3D brain image-based Alzheimer’s disease detection techniques using fish swarm optimizer’s deep convolution Siamese neural network,” Expert Systems, 2022. https://doi.org/10.1111/exsy.12963 [Google Scholar] [CrossRef]
7. N. D. Lubab, A. Sawiji, A. Asyhar and Ahmad, “Application of feature extraction for breast cancer using one order statistic, GLCM, GLRLM, and GLDM, Advances in Science,” Technology and Engineering Systems Journal, vol. 4, no. 4, pp. 115–120, 2019. [Google Scholar]
8. M. A. Nasser, A. Moreno and D. Puig, “Breast cancer detection in thermal infrared images using representation learning and texture analysis methods,” Electronics, vol. 8, no. 1, pp. 1–10, 2019. [Google Scholar]
9. S. Dutta, B. C. Manideep, S. M. Basha, R. D. Caytiles and N. C. S. N. Iyengar, “Classification of diabetic retinopathy images by using deep learning models,” International Journal of Grid and Distributed Computing, vol. 11, no. 1, pp. 89–106, 2018. [Google Scholar]
10. D. Ueda, A. Yamamoto, N. Onoda, T. Takashima, S. Noda et al., “Development and validation of a deep learning model for detection of breast cancers in mammography from multi-institutional datasets,” PLoS One, vol. 17, no. 3, pp. 1–15, 2022. [Google Scholar]
11. N. M. Hassan, S. Hamad and K. Mahar, “Mammogram breast cancer CAD systems for mass detection and classification: A review,” Multimedia Tools and Applications, vol. 81, no. 1, pp. 20043–20075, 2022. [Google Scholar]
12. M. Desai and M. Shah, “An anatomization on breast cancer detection and diagnosis employing multi-layer perceptron neural network (MLP) and Convolutional neural network (CNN),” Clinical eHealth, vol. 4, no. 2, pp. 1–11, 2021. [Google Scholar]
13. M. T. Sadiq, X. Yu and Z. Yuan, “Exploiting dimensionality reduction and neural network techniques for the development of the expert brain-computer interfaces,” Expert Systems with Applications, vol. 164, no. 10, pp. 114031–114039, 2021. [Google Scholar]
14. D. Abdelhafiz, J. Bi, R. Ammar, C. Yang and S. Nabavi, “Convolutional neural network for automated mass segmentation in mammography,” BMC Bioinformatics, vol. 21, no. 1, pp. 1–19, 2020. [Google Scholar]
15. Q. Zhang, Y. Li, G. Zhao, P. Man, Y. Lin et al., “A novel algorithm for breast mass classification in digital mammography based on feature fusion,” Journal of Healthcare Engineering, vol. 1, no. 3, pp. 1–11, 2020. [Google Scholar]
16. S. Pacilè, J. Lopez and P. Chone, “Improving breast cancer detection accuracy of mammography with the concurrent use of an artificial intelligence tool,” Radiol Artif Intell, vol. 2, no. 6, pp. 190208–190312, 2020. [Google Scholar]
17. M. Sasaki, M. Tozaki and A. R. Ruiz, “Artificial intelligence for breast cancer detection in mammography: Experience of use of the ScreenPoint Medical Transpara system in 310 Japanese women,” Breast Cancer, vol. 27, no. 4, pp. 642–651, 2020. [Google Scholar] [PubMed]
18. S. Sadhukhan, N. Upadhyay and P. Chakraborty, “Breast cancer diagnosis using image processing and machine learning,” Adv Intel Sys Comp, vol. 937, no. 85, pp. 113–127, 2020. [Google Scholar]
19. H. P. Chan, R. K. Samala and L. M. Hadjiiski, “CAD and AI for breast cancer—Recent development and challenges,” The British Journal of Radiology, vol. 93, no. 1108, pp. 1–18, 2019. [Google Scholar]
20. D. Q. Zeebaree, H. Haron, A. M. Abdulazeez and D. A. Zebari, “Machine learning and region growing for breast cancer segmentation,” in Proc. Int. Conf. on Advanced Science and Engineering (ICOASE), Zakho-Duhok, Iraq, vol. 2, no. 4, pp. 88–93, 2019. [Google Scholar]
21. R. Vijayarajeswari, P. Parthasarathy, S. Vivekanandan and A. A. Basha, “Classification of mammogram for early detection of breast cancer using SVM classifier and Hough transform,” Measurement, vol. 146, no. 1, pp. 800–805, 2019. [Google Scholar]
22. D. Ribli, A. Horváth and Z. Unger, “Detecting and classifying lesions in mammograms with deep learning,” Sci Rep, vol. 8, no. 1, pp. 4165–4173, 2018. [Google Scholar] [PubMed]
23. F. Sadoughi, Z. Kazemy and F. Hamedan, “Artificial intelligence methods for the diagnosis of breast cancer by image processing: A review, Breast cancer,” Breast Cancer, vol. 10, no. 1, pp. 219–230, 2018. [Google Scholar] [PubMed]
24. MIAS dataset, 2016. https://www.kaggle.com/datasets/kmader/mias-mammography [Google Scholar]
25. DDSM dataset, 2015. https://www.kaggle.com/datasets/awsaf49/cbis-ddsm-breast-cancer-image-dataset [Google Scholar]
Cite This Article
 Copyright © 2023 The Author(s). Published by Tech Science Press.
This work is licensed under a Creative Commons Attribution 4.0 International License , which permits unrestricted use, distribution, and reproduction in any medium, provided the original work is properly cited.
 Downloads
 Citation Tools